Poplarville, MS Map & Demographics
Poplarville Map
Poplarville Overview
$16,868
PER CAPITA INCOME
$62,679
AVG FAMILY INCOME
$51,250
AVG HOUSEHOLD INCOME
35.6%
WAGE / INCOME GAP [ % ]
64.4¢/ $1
WAGE / INCOME GAP [ $ ]
0.42
INEQUALITY / GINI INDEX
2,814
TOTAL POPULATION
1,191
MALE POPULATION
1,623
FEMALE POPULATION
73.38
MALES / 100 FEMALES
136.27
FEMALES / 100 MALES
22.1
MEDIAN AGE
3.6
AVG FAMILY SIZE
3.2
AVG HOUSEHOLD SIZE
1,100
LABOR FORCE [ PEOPLE ]
49.5%
PERCENT IN LABOR FORCE
13.4%
UNEMPLOYMENT RATE
Poplarville Zip Codes
Poplarville Area Codes
Income in Poplarville
Income Overview in Poplarville
Per Capita Income in Poplarville is $16,868, while median incomes of families and households are $62,679 and $51,250 respectively.
| Characteristic | Number | Measure |
| Per Capita Income | 2,814 | $16,868 |
| Median Family Income | 466 | $62,679 |
| Mean Family Income | 466 | $78,136 |
| Median Household Income | 617 | $51,250 |
| Mean Household Income | 617 | $67,510 |
| Income Deficit | 466 | $0 |
| Wage / Income Gap (%) | 2,814 | 35.55% |
| Wage / Income Gap ($) | 2,814 | 64.45¢ per $1 |
| Gini / Inequality Index | 2,814 | 0.42 |
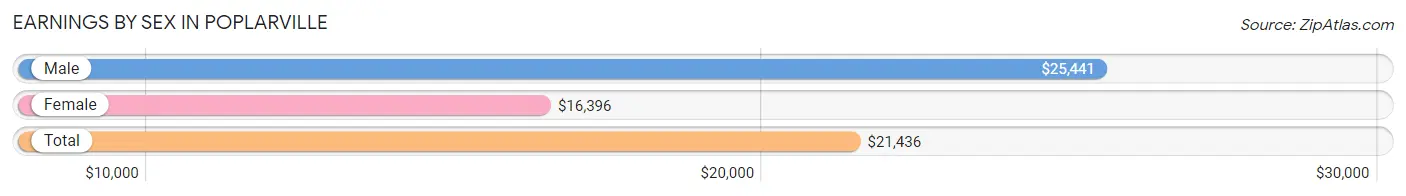
Earnings by Sex in Poplarville
Average Earnings in Poplarville are $21,436, $25,441 for men and $16,396 for women, a difference of 35.5%.
| Sex | Number | Average Earnings |
| Male | 602 (50.1%) | $25,441 |
| Female | 600 (49.9%) | $16,396 |
| Total | 1,202 (100.0%) | $21,436 |
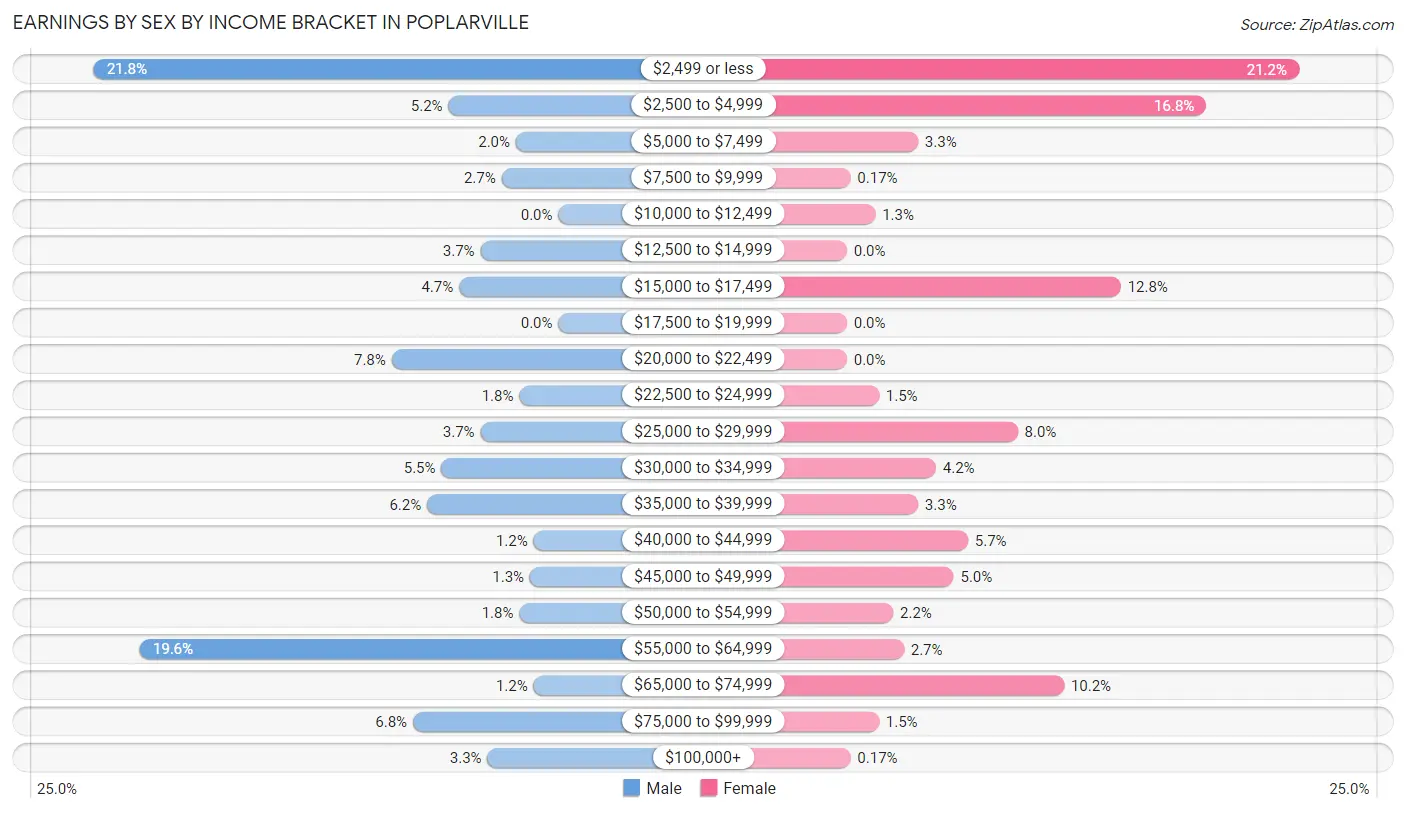
Earnings by Sex by Income Bracket in Poplarville
The most common earnings brackets in Poplarville are $2,499 or less for men (131 | 21.8%) and $2,499 or less for women (127 | 21.2%).
| Income | Male | Female |
| $2,499 or less | 131 (21.8%) | 127 (21.2%) |
| $2,500 to $4,999 | 31 (5.1%) | 101 (16.8%) |
| $5,000 to $7,499 | 12 (2.0%) | 20 (3.3%) |
| $7,500 to $9,999 | 16 (2.7%) | 1 (0.2%) |
| $10,000 to $12,499 | 0 (0.0%) | 8 (1.3%) |
| $12,500 to $14,999 | 22 (3.6%) | 0 (0.0%) |
| $15,000 to $17,499 | 28 (4.6%) | 77 (12.8%) |
| $17,500 to $19,999 | 0 (0.0%) | 0 (0.0%) |
| $20,000 to $22,499 | 47 (7.8%) | 0 (0.0%) |
| $22,500 to $24,999 | 11 (1.8%) | 9 (1.5%) |
| $25,000 to $29,999 | 22 (3.6%) | 48 (8.0%) |
| $30,000 to $34,999 | 33 (5.5%) | 25 (4.2%) |
| $35,000 to $39,999 | 37 (6.1%) | 20 (3.3%) |
| $40,000 to $44,999 | 7 (1.2%) | 34 (5.7%) |
| $45,000 to $49,999 | 8 (1.3%) | 30 (5.0%) |
| $50,000 to $54,999 | 11 (1.8%) | 13 (2.2%) |
| $55,000 to $64,999 | 118 (19.6%) | 16 (2.7%) |
| $65,000 to $74,999 | 7 (1.2%) | 61 (10.2%) |
| $75,000 to $99,999 | 41 (6.8%) | 9 (1.5%) |
| $100,000+ | 20 (3.3%) | 1 (0.2%) |
| Total | 602 (100.0%) | 600 (100.0%) |
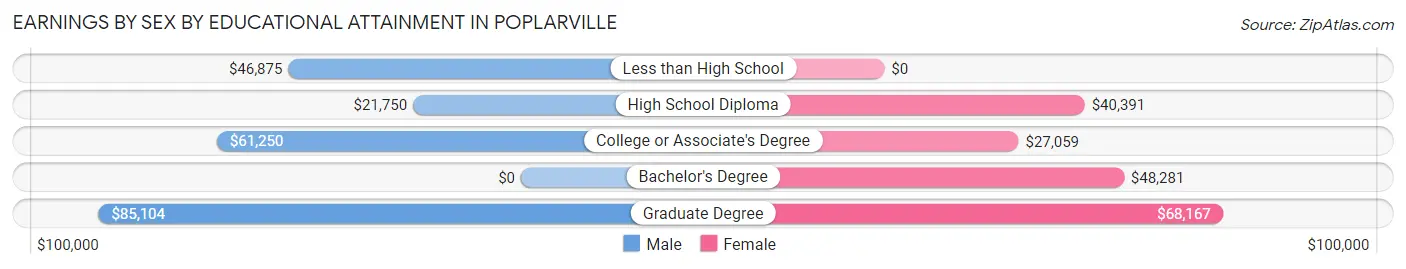
Earnings by Sex by Educational Attainment in Poplarville
Average earnings in Poplarville are $52,222 for men and $40,547 for women, a difference of 22.4%. Men with an educational attainment of graduate degree enjoy the highest average annual earnings of $85,104, while those with high school diploma education earn the least with $21,750. Women with an educational attainment of graduate degree earn the most with the average annual earnings of $68,167, while those with college or associate's degree education have the smallest earnings of $27,059.
| Educational Attainment | Male Income | Female Income |
| Less than High School | $46,875 | $0 |
| High School Diploma | $21,750 | $40,391 |
| College or Associate's Degree | $61,250 | $27,059 |
| Bachelor's Degree | - | - |
| Graduate Degree | $85,104 | $68,167 |
| Total | $52,222 | $40,547 |
Family Income in Poplarville
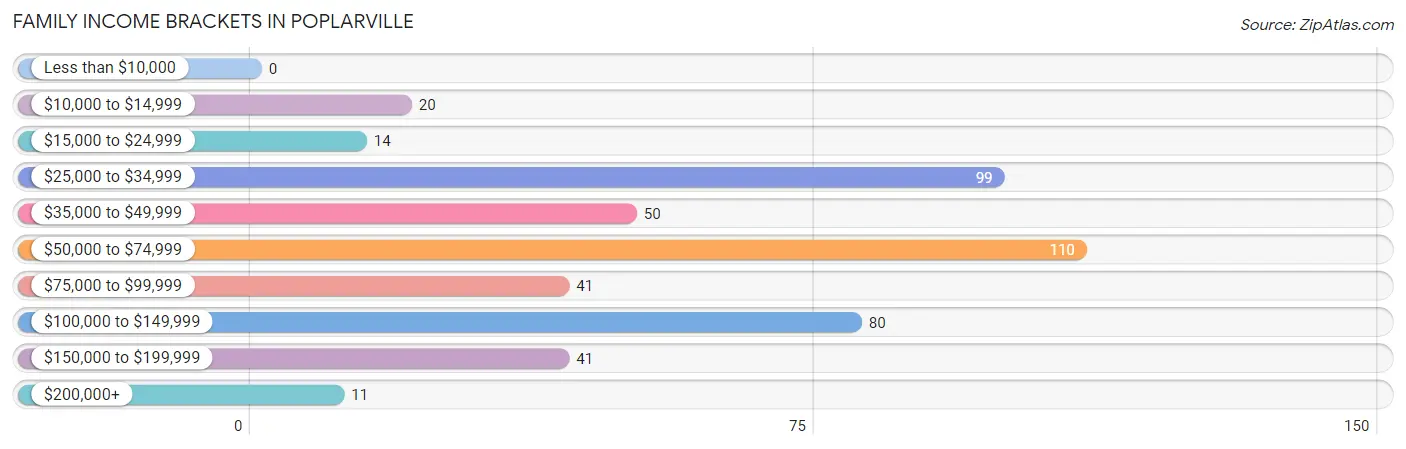
Family Income Brackets in Poplarville
According to the Poplarville family income data, there are 110 families falling into the $50,000 to $74,999 income range, which is the most common income bracket and makes up 23.6% of all families.
| Income Bracket | # Families | % Families |
| Less than $10,000 | 0 | 0.0% |
| $10,000 to $14,999 | 20 | 4.3% |
| $15,000 to $24,999 | 14 | 3.0% |
| $25,000 to $34,999 | 99 | 21.2% |
| $35,000 to $49,999 | 50 | 10.7% |
| $50,000 to $74,999 | 110 | 23.6% |
| $75,000 to $99,999 | 41 | 8.8% |
| $100,000 to $149,999 | 80 | 17.2% |
| $150,000 to $199,999 | 41 | 8.8% |
| $200,000+ | 11 | 2.4% |
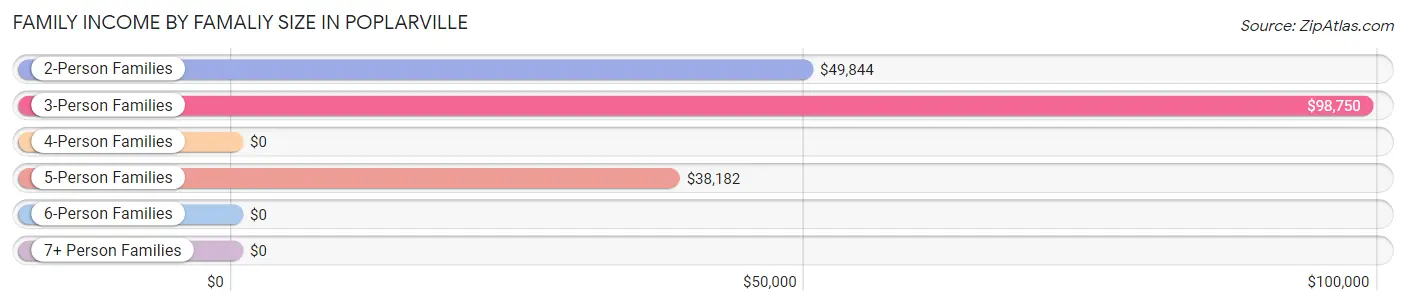
Family Income by Famaliy Size in Poplarville
3-person families (36 | 7.7%) account for the highest median family income in Poplarville with $98,750 per family, while 3-person families (36 | 7.7%) have the highest median income of $32,917 per family member.
| Income Bracket | # Families | Median Income |
| 2-Person Families | 211 (45.3%) | $49,844 |
| 3-Person Families | 36 (7.7%) | $98,750 |
| 4-Person Families | 72 (15.4%) | $0 |
| 5-Person Families | 80 (17.2%) | $38,182 |
| 6-Person Families | 67 (14.4%) | $0 |
| 7+ Person Families | 0 (0.0%) | $0 |
| Total | 466 (100.0%) | $62,679 |
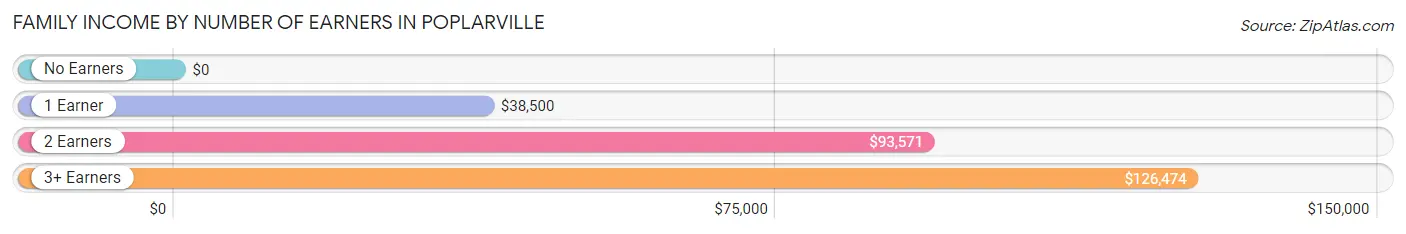
Family Income by Number of Earners in Poplarville
| Number of Earners | # Families | Median Income |
| No Earners | 44 (9.4%) | $0 |
| 1 Earner | 234 (50.2%) | $38,500 |
| 2 Earners | 142 (30.5%) | $93,571 |
| 3+ Earners | 46 (9.9%) | $126,474 |
| Total | 466 (100.0%) | $62,679 |
Household Income in Poplarville
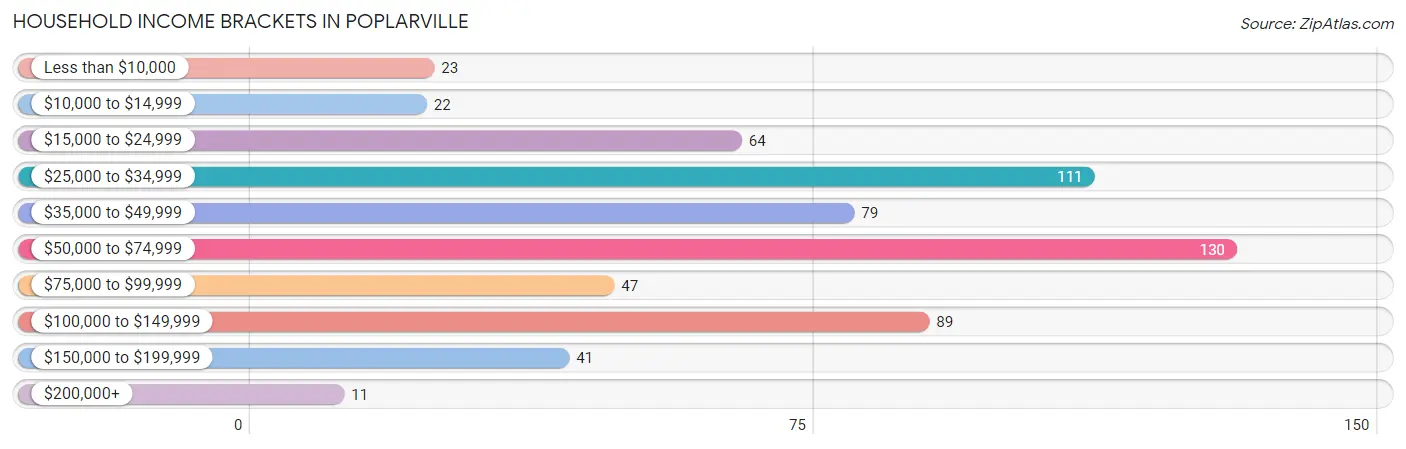
Household Income Brackets in Poplarville
With 130 households falling in the category, the $50,000 to $74,999 income range is the most frequent in Poplarville, accounting for 21.1% of all households. In contrast, only 11 households (1.8%) fall into the $200,000+ income bracket, making it the least populous group.
| Income Bracket | # Households | % Households |
| Less than $10,000 | 23 | 3.7% |
| $10,000 to $14,999 | 22 | 3.6% |
| $15,000 to $24,999 | 64 | 10.4% |
| $25,000 to $34,999 | 111 | 18.0% |
| $35,000 to $49,999 | 79 | 12.8% |
| $50,000 to $74,999 | 130 | 21.1% |
| $75,000 to $99,999 | 47 | 7.6% |
| $100,000 to $149,999 | 89 | 14.4% |
| $150,000 to $199,999 | 41 | 6.6% |
| $200,000+ | 11 | 1.8% |
Household Income by Householder Age in Poplarville
The median household income in Poplarville is $51,250, with the highest median household income of $70,083 found in the 25 to 44 years age bracket for the primary householder. A total of 224 households (36.3%) fall into this category. Meanwhile, the 15 to 24 years age bracket for the primary householder has the lowest median household income of $0, with 5 households (0.8%) in this group.

| Income Bracket | # Households | Median Income |
| 15 to 24 Years | 5 (0.8%) | $0 |
| 25 to 44 Years | 224 (36.3%) | $70,083 |
| 45 to 64 Years | 261 (42.3%) | $37,434 |
| 65+ Years | 127 (20.6%) | $26,806 |
| Total | 617 (100.0%) | $51,250 |
Poverty in Poplarville
Income Below Poverty by Sex and Age in Poplarville
With 22.1% poverty level for males and 22.6% for females among the residents of Poplarville, under 5 year old males and under 5 year old females are the most vulnerable to poverty, with 43 males (51.2%) and 88 females (48.6%) in their respective age groups living below the poverty level.
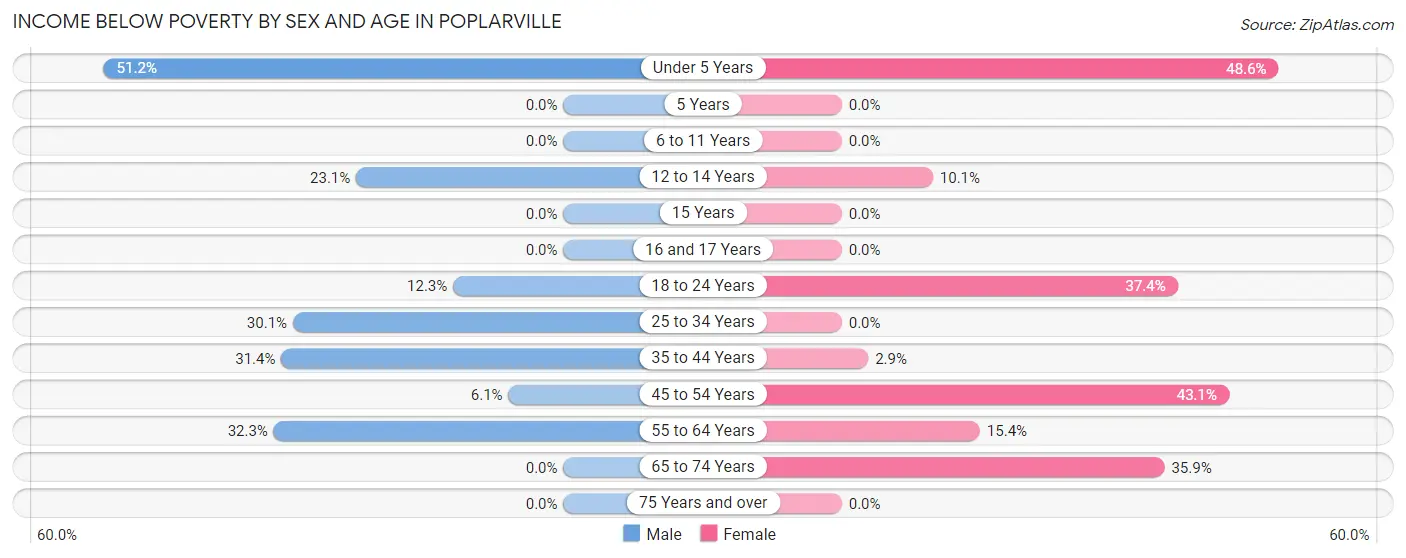
| Age Bracket | Male | Female |
| Under 5 Years | 43 (51.2%) | 88 (48.6%) |
| 5 Years | 0 (0.0%) | 0 (0.0%) |
| 6 to 11 Years | 0 (0.0%) | 0 (0.0%) |
| 12 to 14 Years | 3 (23.1%) | 7 (10.1%) |
| 15 Years | 0 (0.0%) | 0 (0.0%) |
| 16 and 17 Years | 0 (0.0%) | 0 (0.0%) |
| 18 to 24 Years | 14 (12.3%) | 43 (37.4%) |
| 25 to 34 Years | 78 (30.1%) | 0 (0.0%) |
| 35 to 44 Years | 49 (31.4%) | 2 (2.9%) |
| 45 to 54 Years | 3 (6.1%) | 50 (43.1%) |
| 55 to 64 Years | 20 (32.3%) | 20 (15.4%) |
| 65 to 74 Years | 0 (0.0%) | 23 (35.9%) |
| 75 Years and over | 0 (0.0%) | 0 (0.0%) |
| Total | 210 (22.1%) | 233 (22.6%) |
Income Above Poverty by Sex and Age in Poplarville
According to the poverty statistics in Poplarville, males aged 5 years and females aged 5 years are the age groups that are most secure financially, with 100.0% of males and 100.0% of females in these age groups living above the poverty line.
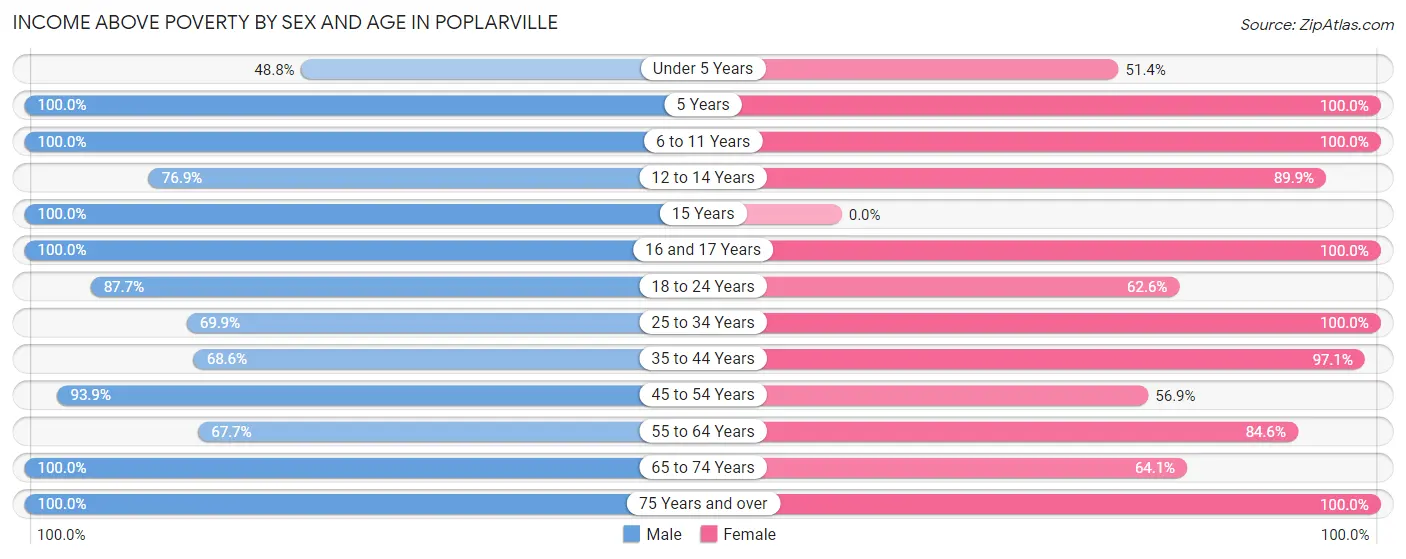
| Age Bracket | Male | Female |
| Under 5 Years | 41 (48.8%) | 93 (51.4%) |
| 5 Years | 26 (100.0%) | 1 (100.0%) |
| 6 to 11 Years | 93 (100.0%) | 108 (100.0%) |
| 12 to 14 Years | 10 (76.9%) | 62 (89.9%) |
| 15 Years | 17 (100.0%) | 0 (0.0%) |
| 16 and 17 Years | 23 (100.0%) | 12 (100.0%) |
| 18 to 24 Years | 100 (87.7%) | 72 (62.6%) |
| 25 to 34 Years | 181 (69.9%) | 125 (100.0%) |
| 35 to 44 Years | 107 (68.6%) | 66 (97.1%) |
| 45 to 54 Years | 46 (93.9%) | 66 (56.9%) |
| 55 to 64 Years | 42 (67.7%) | 110 (84.6%) |
| 65 to 74 Years | 38 (100.0%) | 41 (64.1%) |
| 75 Years and over | 15 (100.0%) | 42 (100.0%) |
| Total | 739 (77.9%) | 798 (77.4%) |
Income Below Poverty Among Married-Couple Families in Poplarville
The poverty statistics for married-couple families in Poplarville show that 0.7% or 2 of the total 277 families live below the poverty line. Families with 3 or 4 children have the highest poverty rate of 2.7%, comprising of 2 families. On the other hand, families with no children have the lowest poverty rate of 0.0%, which includes 0 families.
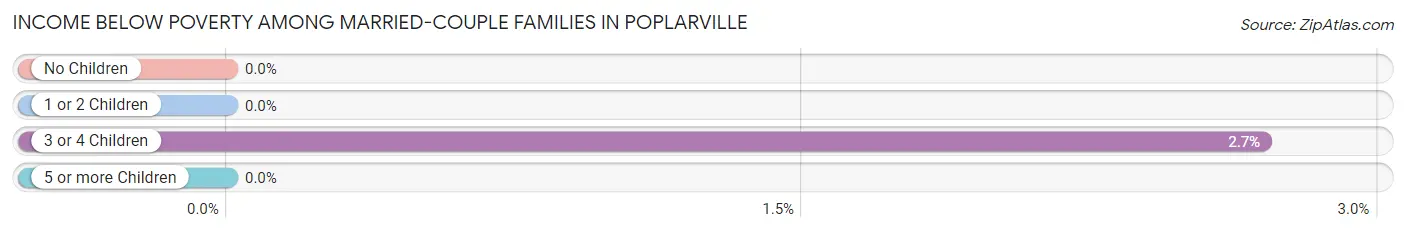
| Children | Above Poverty | Below Poverty |
| No Children | 97 (100.0%) | 0 (0.0%) |
| 1 or 2 Children | 106 (100.0%) | 0 (0.0%) |
| 3 or 4 Children | 72 (97.3%) | 2 (2.7%) |
| 5 or more Children | 0 (0.0%) | 0 (0.0%) |
| Total | 275 (99.3%) | 2 (0.7%) |
Income Below Poverty Among Single-Parent Households in Poplarville
According to the poverty data in Poplarville, 62.5% or 10 single-father households and 26.0% or 45 single-mother households are living below the poverty line. Among single-father households, those with no children have the highest poverty rate, with 10 households (100.0%) experiencing poverty. Likewise, among single-mother households, those with 3 or 4 children have the highest poverty rate, with 35 households (100.0%) falling below the poverty line.
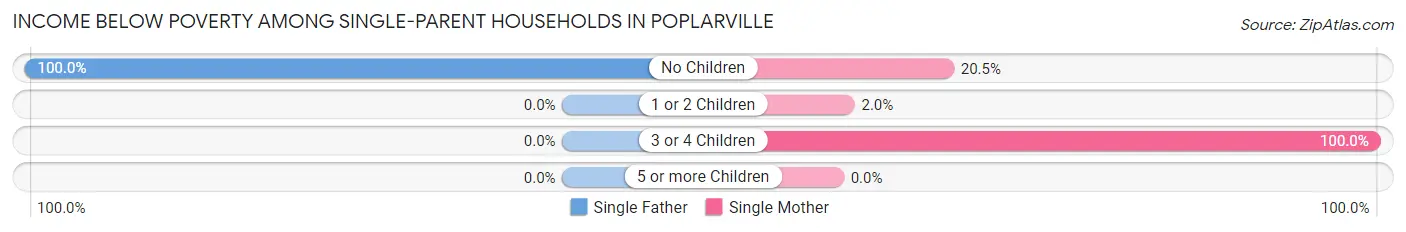
| Children | Single Father | Single Mother |
| No Children | 10 (100.0%) | 8 (20.5%) |
| 1 or 2 Children | 0 (0.0%) | 2 (2.0%) |
| 3 or 4 Children | 0 (0.0%) | 35 (100.0%) |
| 5 or more Children | 0 (0.0%) | 0 (0.0%) |
| Total | 10 (62.5%) | 45 (26.0%) |
Income Below Poverty Among Married-Couple vs Single-Parent Households in Poplarville
The poverty data for Poplarville shows that 2 of the married-couple family households (0.7%) and 55 of the single-parent households (29.1%) are living below the poverty level. Within the married-couple family households, those with 3 or 4 children have the highest poverty rate, with 2 households (2.7%) falling below the poverty line. Among the single-parent households, those with 3 or 4 children have the highest poverty rate, with 35 household (100.0%) living below poverty.
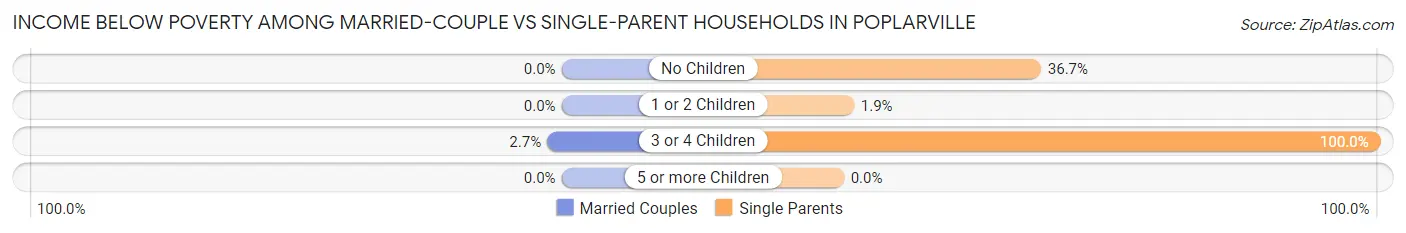
| Children | Married-Couple Families | Single-Parent Households |
| No Children | 0 (0.0%) | 18 (36.7%) |
| 1 or 2 Children | 0 (0.0%) | 2 (1.9%) |
| 3 or 4 Children | 2 (2.7%) | 35 (100.0%) |
| 5 or more Children | 0 (0.0%) | 0 (0.0%) |
| Total | 2 (0.7%) | 55 (29.1%) |
Race in Poplarville
The most populous races in Poplarville are White / Caucasian (1,800 | 64.0%), Black / African American (978 | 34.7%), and Hispanic or Latino (39 | 1.4%).
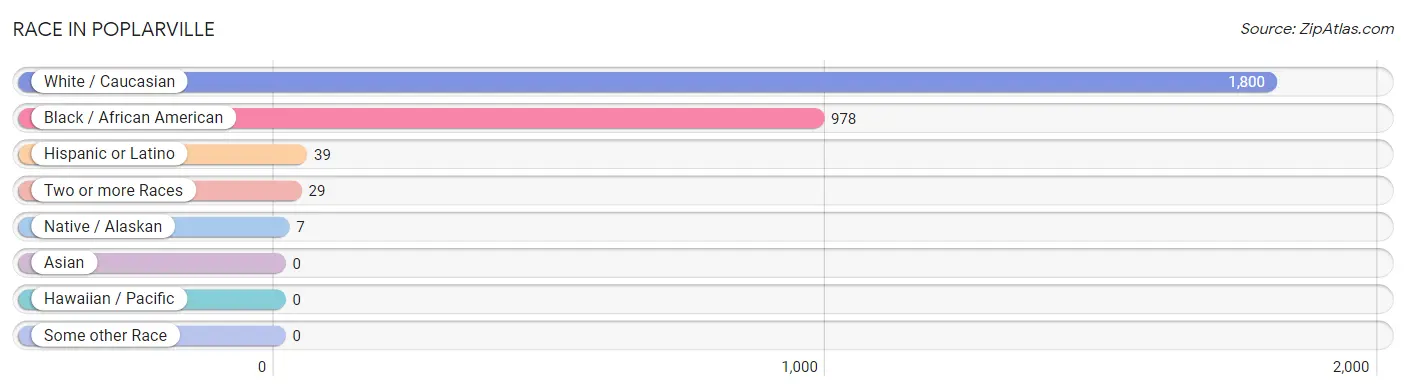
| Race | # Population | % Population |
| Asian | 0 | 0.0% |
| Black / African American | 978 | 34.7% |
| Hawaiian / Pacific | 0 | 0.0% |
| Hispanic or Latino | 39 | 1.4% |
| Native / Alaskan | 7 | 0.3% |
| White / Caucasian | 1,800 | 64.0% |
| Two or more Races | 29 | 1.0% |
| Some other Race | 0 | 0.0% |
| Total | 2,814 | 100.0% |
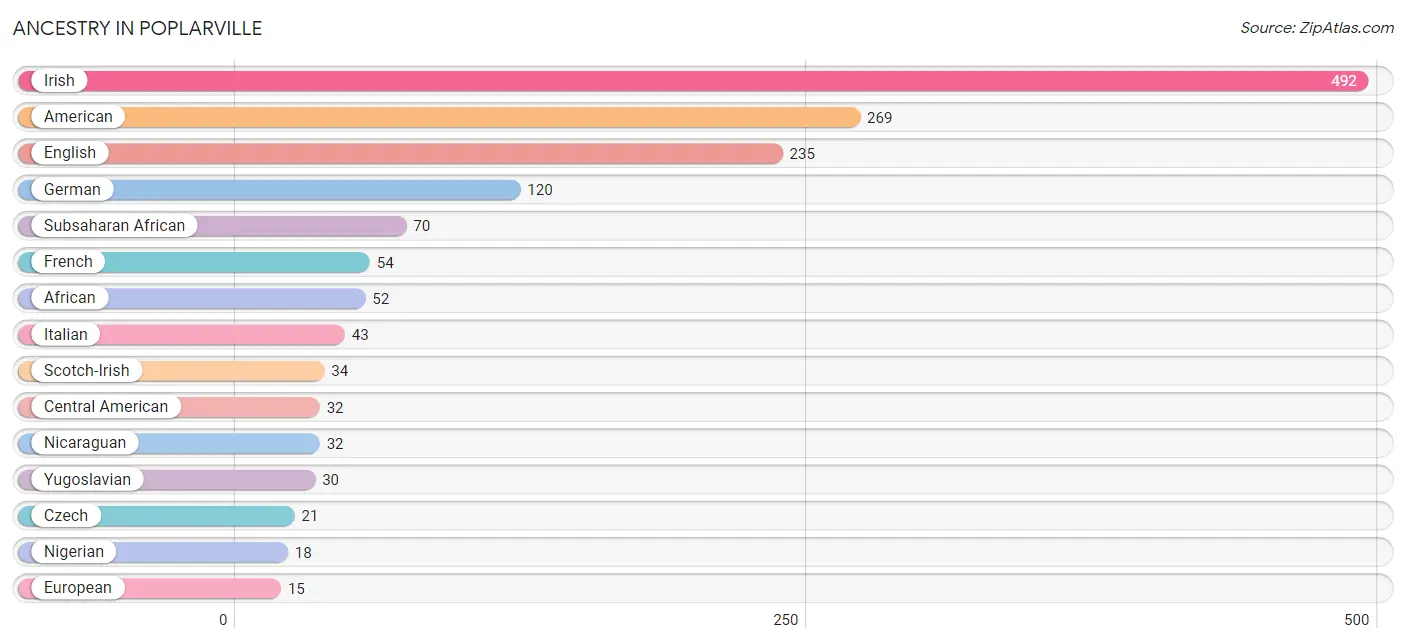
Ancestry in Poplarville
The most populous ancestries reported in Poplarville are Irish (492 | 17.5%), American (269 | 9.6%), English (235 | 8.4%), German (120 | 4.3%), and Subsaharan African (70 | 2.5%), together accounting for 42.1% of all Poplarville residents.
| Ancestry | # Population | % Population |
| African | 52 | 1.8% |
| American | 269 | 9.6% |
| Austrian | 7 | 0.3% |
| British | 3 | 0.1% |
| Central American | 32 | 1.1% |
| Czech | 21 | 0.7% |
| Dutch | 6 | 0.2% |
| English | 235 | 8.4% |
| European | 15 | 0.5% |
| French | 54 | 1.9% |
| French American Indian | 6 | 0.2% |
| German | 120 | 4.3% |
| Irish | 492 | 17.5% |
| Italian | 43 | 1.5% |
| Mexican | 7 | 0.3% |
| Nicaraguan | 32 | 1.1% |
| Nigerian | 18 | 0.6% |
| Polish | 9 | 0.3% |
| Scotch-Irish | 34 | 1.2% |
| Scottish | 8 | 0.3% |
| Subsaharan African | 70 | 2.5% |
| Swiss | 10 | 0.4% |
| Welsh | 11 | 0.4% |
| Yugoslavian | 30 | 1.1% | View All 24 Rows |
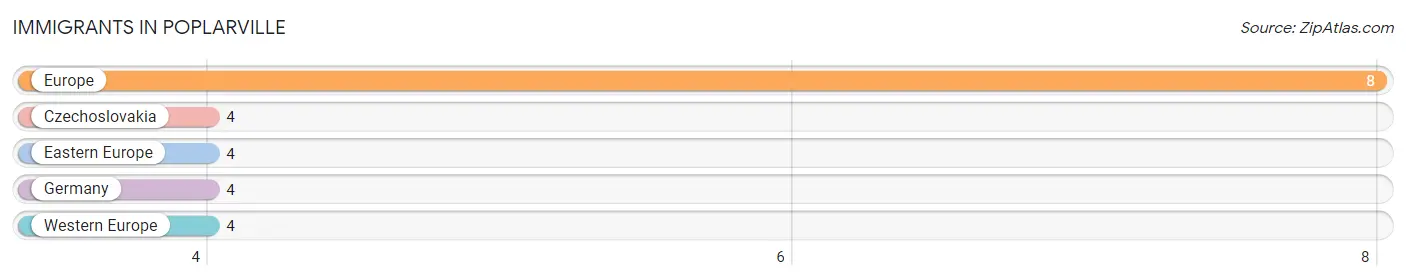
Immigrants in Poplarville
The most numerous immigrant groups reported in Poplarville came from Europe (8 | 0.3%), Czechoslovakia (4 | 0.1%), Eastern Europe (4 | 0.1%), Germany (4 | 0.1%), and Western Europe (4 | 0.1%), together accounting for 0.8% of all Poplarville residents.
| Immigration Origin | # Population | % Population |
| Czechoslovakia | 4 | 0.1% |
| Eastern Europe | 4 | 0.1% |
| Europe | 8 | 0.3% |
| Germany | 4 | 0.1% |
| Western Europe | 4 | 0.1% | View All 5 Rows |
Sex and Age in Poplarville
Sex and Age in Poplarville
The most populous age groups in Poplarville are 20 to 24 Years (276 | 23.2%) for men and 15 to 19 Years (440 | 27.1%) for women.
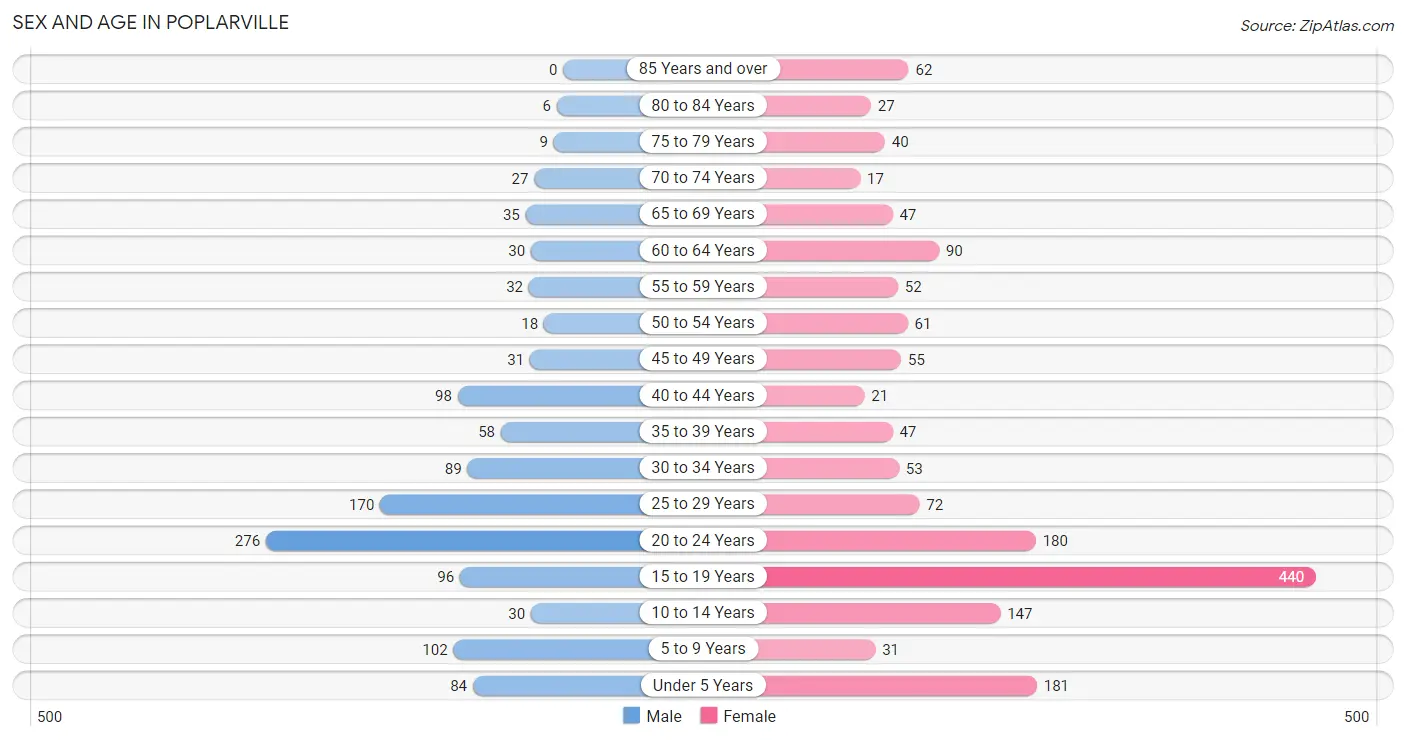
| Age Bracket | Male | Female |
| Under 5 Years | 84 (7.0%) | 181 (11.2%) |
| 5 to 9 Years | 102 (8.6%) | 31 (1.9%) |
| 10 to 14 Years | 30 (2.5%) | 147 (9.1%) |
| 15 to 19 Years | 96 (8.1%) | 440 (27.1%) |
| 20 to 24 Years | 276 (23.2%) | 180 (11.1%) |
| 25 to 29 Years | 170 (14.3%) | 72 (4.4%) |
| 30 to 34 Years | 89 (7.5%) | 53 (3.3%) |
| 35 to 39 Years | 58 (4.9%) | 47 (2.9%) |
| 40 to 44 Years | 98 (8.2%) | 21 (1.3%) |
| 45 to 49 Years | 31 (2.6%) | 55 (3.4%) |
| 50 to 54 Years | 18 (1.5%) | 61 (3.8%) |
| 55 to 59 Years | 32 (2.7%) | 52 (3.2%) |
| 60 to 64 Years | 30 (2.5%) | 90 (5.6%) |
| 65 to 69 Years | 35 (2.9%) | 47 (2.9%) |
| 70 to 74 Years | 27 (2.3%) | 17 (1.1%) |
| 75 to 79 Years | 9 (0.8%) | 40 (2.5%) |
| 80 to 84 Years | 6 (0.5%) | 27 (1.7%) |
| 85 Years and over | 0 (0.0%) | 62 (3.8%) |
| Total | 1,191 (100.0%) | 1,623 (100.0%) |
Families and Households in Poplarville
Median Family Size in Poplarville
The median family size in Poplarville is 3.61 persons per family, with single female/mother families (173 | 37.1%) accounting for the largest median family size of 4.11 persons per family. On the other hand, single male/father families (16 | 3.4%) represent the smallest median family size with 3.19 persons per family.
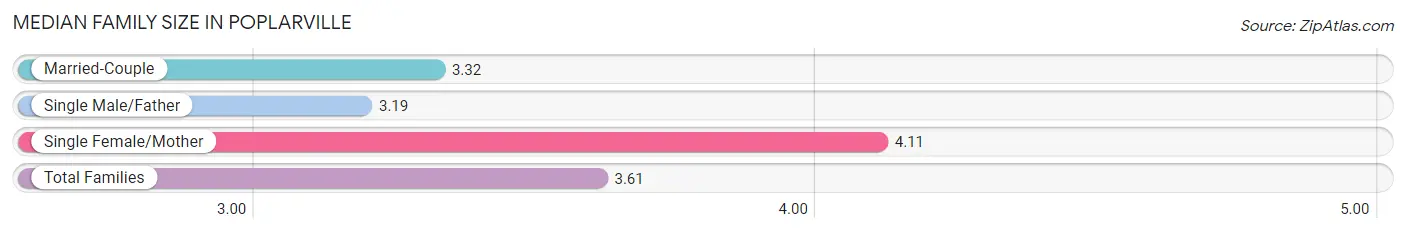
| Family Type | # Families | Family Size |
| Married-Couple | 277 (59.4%) | 3.32 |
| Single Male/Father | 16 (3.4%) | 3.19 |
| Single Female/Mother | 173 (37.1%) | 4.11 |
| Total Families | 466 (100.0%) | 3.61 |
Median Household Size in Poplarville
The median household size in Poplarville is 3.18 persons per household, with single female/mother households (173 | 28.0%) accounting for the largest median household size of 4.75 persons per household. non-family households (151 | 24.5%) represent the smallest median household size with 1.07 persons per household.
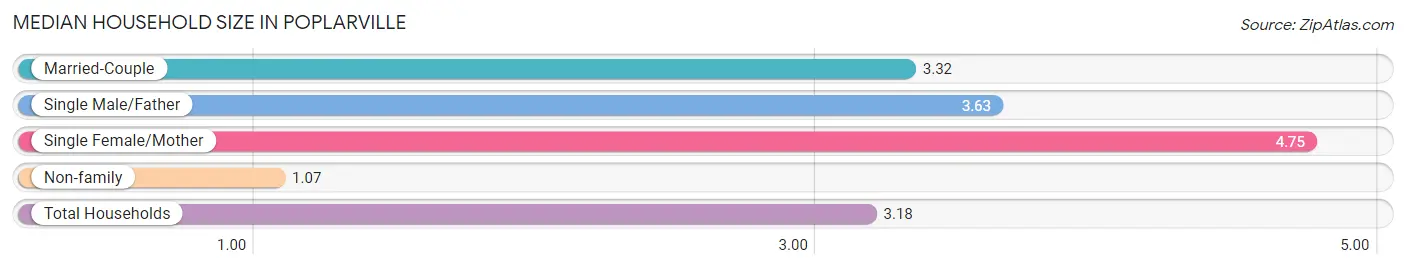
| Household Type | # Households | Household Size |
| Married-Couple | 277 (44.9%) | 3.32 |
| Single Male/Father | 16 (2.6%) | 3.63 |
| Single Female/Mother | 173 (28.0%) | 4.75 |
| Non-family | 151 (24.5%) | 1.07 |
| Total Households | 617 (100.0%) | 3.18 |
Household Size by Marriage Status in Poplarville
Out of a total of 617 households in Poplarville, 466 (75.5%) are family households, while 151 (24.5%) are nonfamily households. The most numerous type of family households are 2-person households, comprising 201, and the most common type of nonfamily households are 1-person households, comprising 140.
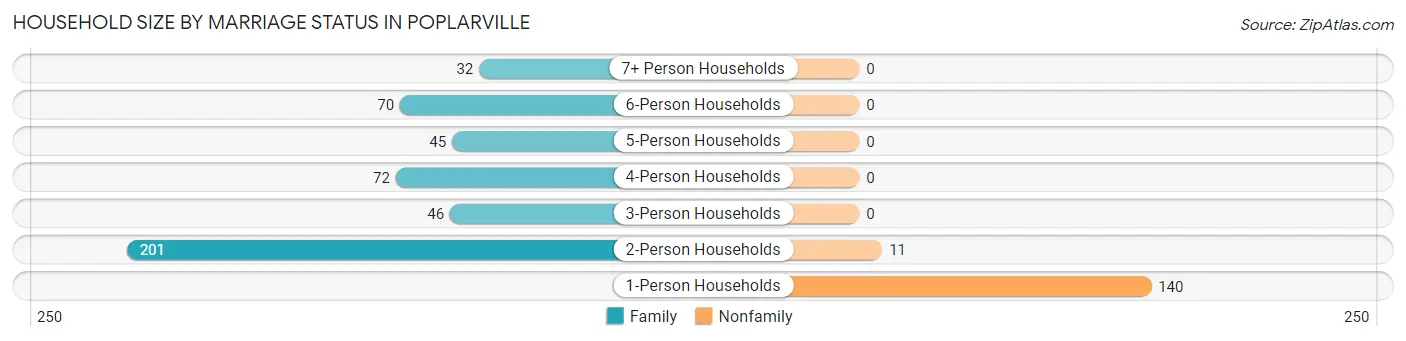
| Household Size | Family Households | Nonfamily Households |
| 1-Person Households | - | 140 (22.7%) |
| 2-Person Households | 201 (32.6%) | 11 (1.8%) |
| 3-Person Households | 46 (7.5%) | 0 (0.0%) |
| 4-Person Households | 72 (11.7%) | 0 (0.0%) |
| 5-Person Households | 45 (7.3%) | 0 (0.0%) |
| 6-Person Households | 70 (11.4%) | 0 (0.0%) |
| 7+ Person Households | 32 (5.2%) | 0 (0.0%) |
| Total | 466 (75.5%) | 151 (24.5%) |
Female Fertility in Poplarville
Fertility by Age in Poplarville
Average fertility rate in Poplarville is 67.0 births per 1,000 women. Women in the age bracket of 20 to 34 years have the highest fertility rate with 193.0 births per 1,000 women. Women in the age bracket of 20 to 34 years acount for 100.0% of all women with births.
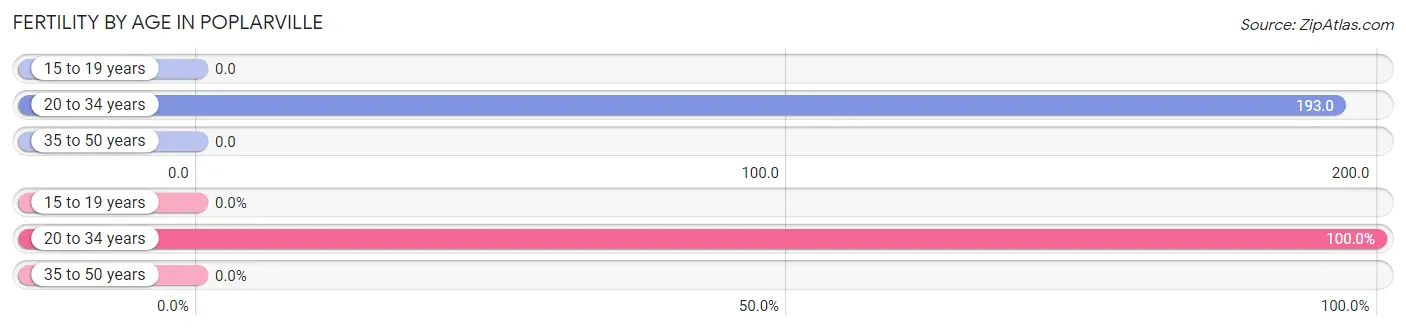
| Age Bracket | Women with Births | Births / 1,000 Women |
| 15 to 19 years | 0 (0.0%) | 0.0 |
| 20 to 34 years | 59 (100.0%) | 193.0 |
| 35 to 50 years | 0 (0.0%) | 0.0 |
| Total | 59 (100.0%) | 67.0 |
Fertility by Age by Marriage Status in Poplarville
27.1% of women with births (59) in Poplarville are married. The highest percentage of unmarried women with births falls into 20 to 34 years age bracket with 72.9% of them unmarried at the time of birth, while the lowest percentage of unmarried women with births belong to 20 to 34 years age bracket with 72.9% of them unmarried.
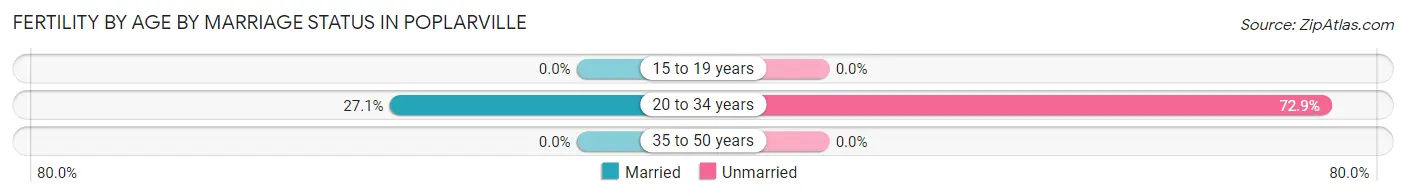
| Age Bracket | Married | Unmarried |
| 15 to 19 years | 0 (0.0%) | 0 (0.0%) |
| 20 to 34 years | 16 (27.1%) | 43 (72.9%) |
| 35 to 50 years | 0 (0.0%) | 0 (0.0%) |
| Total | 16 (27.1%) | 43 (72.9%) |
Fertility by Education in Poplarville
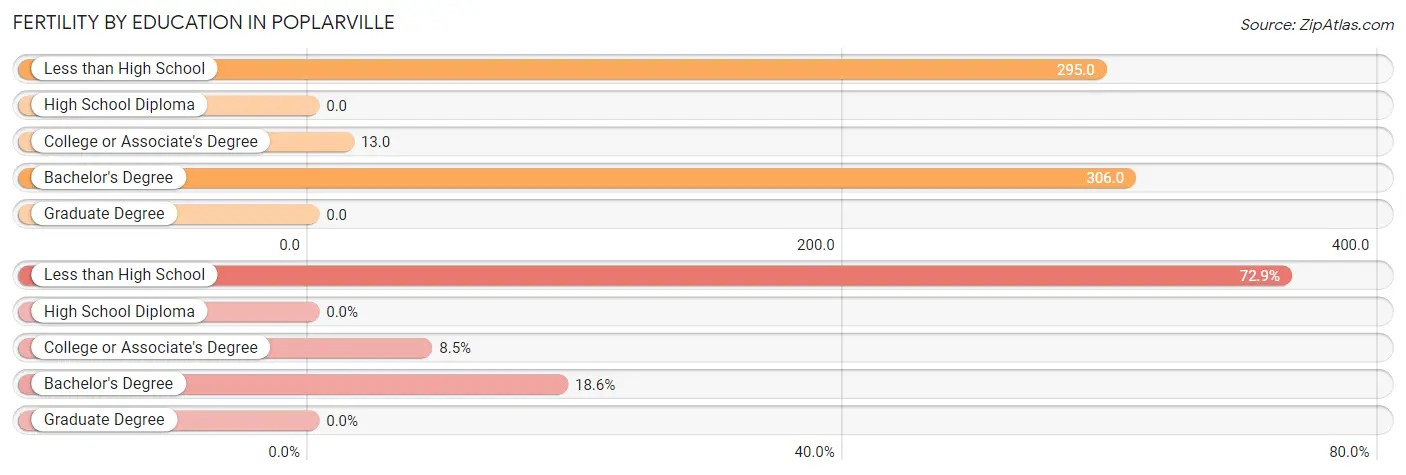
| Educational Attainment | Women with Births | Births / 1,000 Women |
| Less than High School | 43 (72.9%) | 295.0 |
| High School Diploma | 0 (0.0%) | 0.0 |
| College or Associate's Degree | 5 (8.5%) | 13.0 |
| Bachelor's Degree | 11 (18.6%) | 306.0 |
| Graduate Degree | 0 (0.0%) | 0.0 |
| Total | 59 (100.0%) | 67.0 |
Fertility by Education by Marriage Status in Poplarville
72.9% of women with births in Poplarville are unmarried. Women with the educational attainment of college or associate's degree are most likely to be married with 100.0% of them married at childbirth, while women with the educational attainment of less than high school are least likely to be married with 100.0% of them unmarried at childbirth.
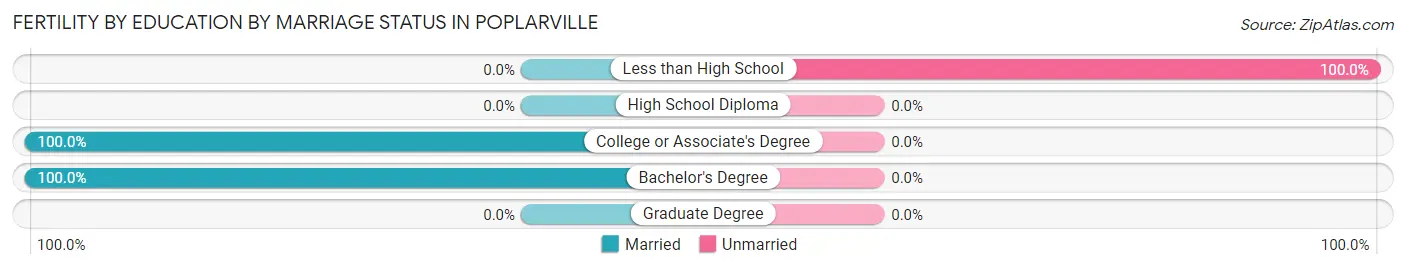
| Educational Attainment | Married | Unmarried |
| Less than High School | 0 (0.0%) | 43 (100.0%) |
| High School Diploma | 0 (0.0%) | 0 (0.0%) |
| College or Associate's Degree | 5 (100.0%) | 0 (0.0%) |
| Bachelor's Degree | 11 (100.0%) | 0 (0.0%) |
| Graduate Degree | 0 (0.0%) | 0 (0.0%) |
| Total | 16 (27.1%) | 43 (72.9%) |
Employment Characteristics in Poplarville
Employment by Class of Employer in Poplarville
Among the 924 employed individuals in Poplarville, private company employees (717 | 77.6%), state government employees (81 | 8.8%), and local government employees (69 | 7.5%) make up the most common classes of employment.
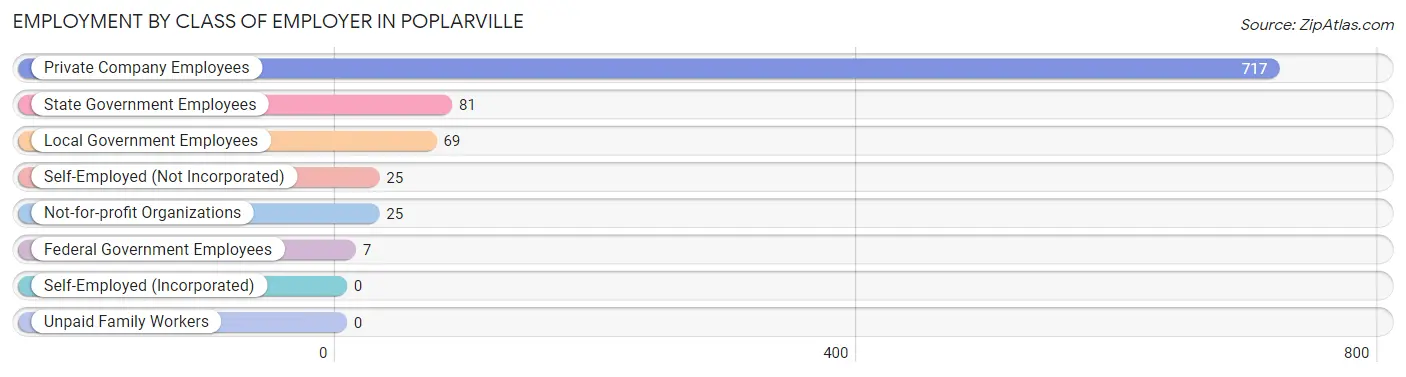
| Employer Class | # Employees | % Employees |
| Private Company Employees | 717 | 77.6% |
| Self-Employed (Incorporated) | 0 | 0.0% |
| Self-Employed (Not Incorporated) | 25 | 2.7% |
| Not-for-profit Organizations | 25 | 2.7% |
| Local Government Employees | 69 | 7.5% |
| State Government Employees | 81 | 8.8% |
| Federal Government Employees | 7 | 0.8% |
| Unpaid Family Workers | 0 | 0.0% |
| Total | 924 | 100.0% |
Employment Status by Age in Poplarville
According to the labor force statistics for Poplarville, out of the total population over 16 years of age (2,222), 49.5% or 1,100 individuals are in the labor force, with 13.4% or 147 of them unemployed. The age group with the highest labor force participation rate is 30 to 34 years, with 84.5% or 120 individuals in the labor force. Within the labor force, the 25 to 29 years age range has the highest percentage of unemployed individuals, with 35.3% or 67 of them being unemployed.
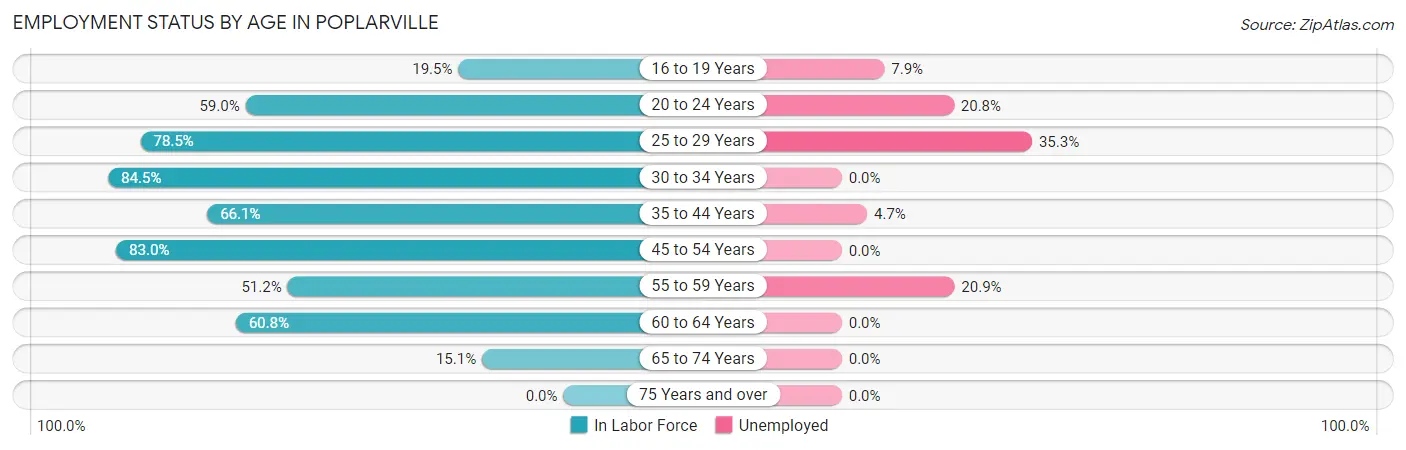
| Age Bracket | In Labor Force | Unemployed |
| 16 to 19 Years | 101 (19.5%) | 8 (7.9%) |
| 20 to 24 Years | 269 (59.0%) | 56 (20.8%) |
| 25 to 29 Years | 190 (78.5%) | 67 (35.3%) |
| 30 to 34 Years | 120 (84.5%) | 0 (0.0%) |
| 35 to 44 Years | 148 (66.1%) | 7 (4.7%) |
| 45 to 54 Years | 137 (83.0%) | 0 (0.0%) |
| 55 to 59 Years | 43 (51.2%) | 9 (20.9%) |
| 60 to 64 Years | 73 (60.8%) | 0 (0.0%) |
| 65 to 74 Years | 19 (15.1%) | 0 (0.0%) |
| 75 Years and over | 0 (0.0%) | 0 (0.0%) |
| Total | 1,100 (49.5%) | 147 (13.4%) |
Employment Status by Educational Attainment in Poplarville
According to labor force statistics for Poplarville, 72.8% of individuals (711) out of the total population between 25 and 64 years of age (977) are in the labor force, with 11.7% or 83 of them being unemployed. The group with the highest labor force participation rate are those with the educational attainment of bachelor's degree or higher, with 88.7% or 228 individuals in the labor force. Within the labor force, individuals with less than high school education have the highest percentage of unemployment, with 75.5% or 74 of them being unemployed.
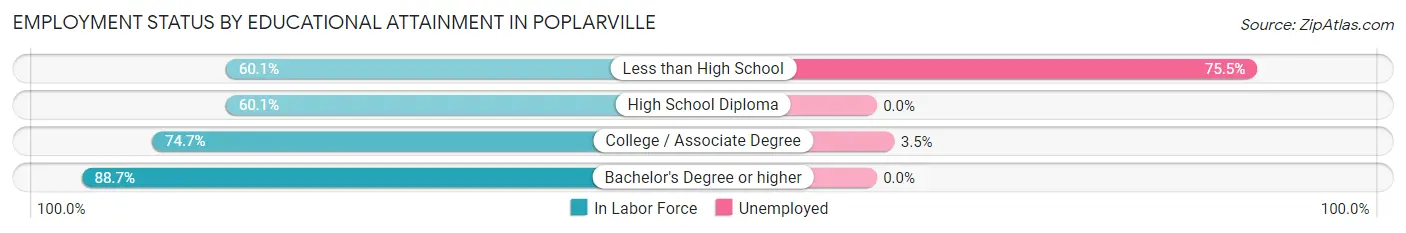
| Educational Attainment | In Labor Force | Unemployed |
| Less than High School | 98 (60.1%) | 123 (75.5%) |
| High School Diploma | 128 (60.1%) | 0 (0.0%) |
| College / Associate Degree | 257 (74.7%) | 12 (3.5%) |
| Bachelor's Degree or higher | 228 (88.7%) | 0 (0.0%) |
| Total | 711 (72.8%) | 114 (11.7%) |
Employment Occupations by Sex in Poplarville
Management, Business, Science and Arts Occupations
The most common Management, Business, Science and Arts occupations in Poplarville are Health Diagnosing & Treating (93 | 9.8%), Community & Social Service (92 | 9.7%), Health Technologists (68 | 7.1%), Education Instruction & Library (58 | 6.1%), and Computers, Engineering & Science (49 | 5.1%).
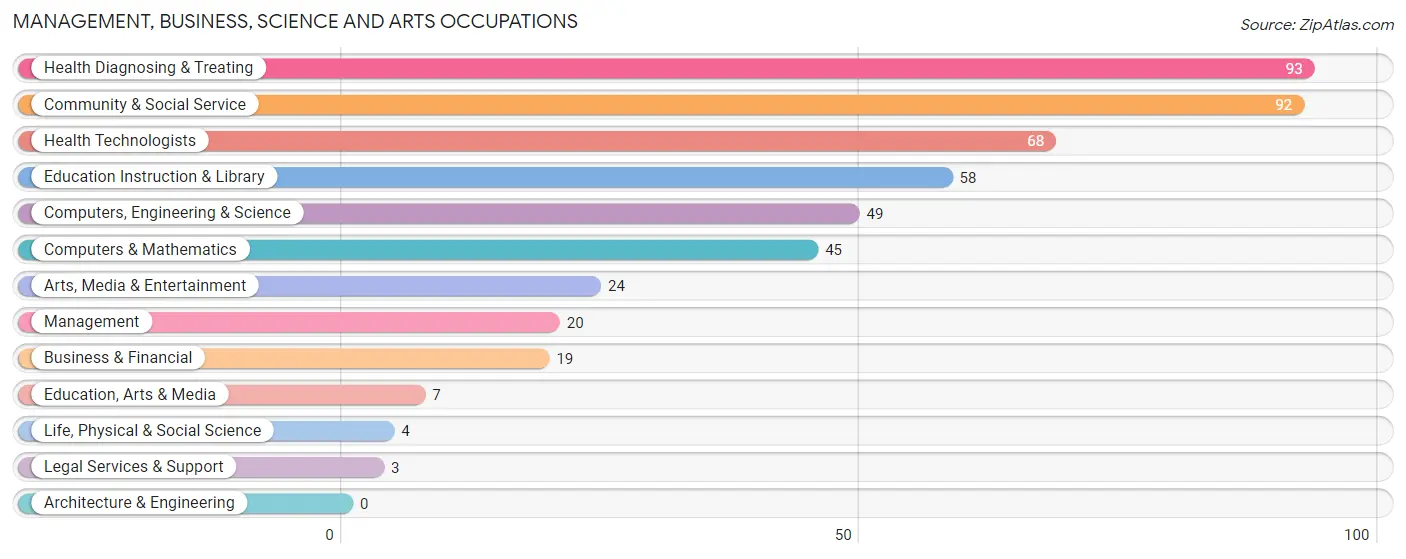
Management, Business, Science and Arts Occupations by Sex
Within the Management, Business, Science and Arts occupations in Poplarville, the most male-oriented occupations are Life, Physical & Social Science (100.0%), Education, Arts & Media (100.0%), and Arts, Media & Entertainment (100.0%), while the most female-oriented occupations are Business & Financial (100.0%), Legal Services & Support (100.0%), and Health Technologists (83.8%).
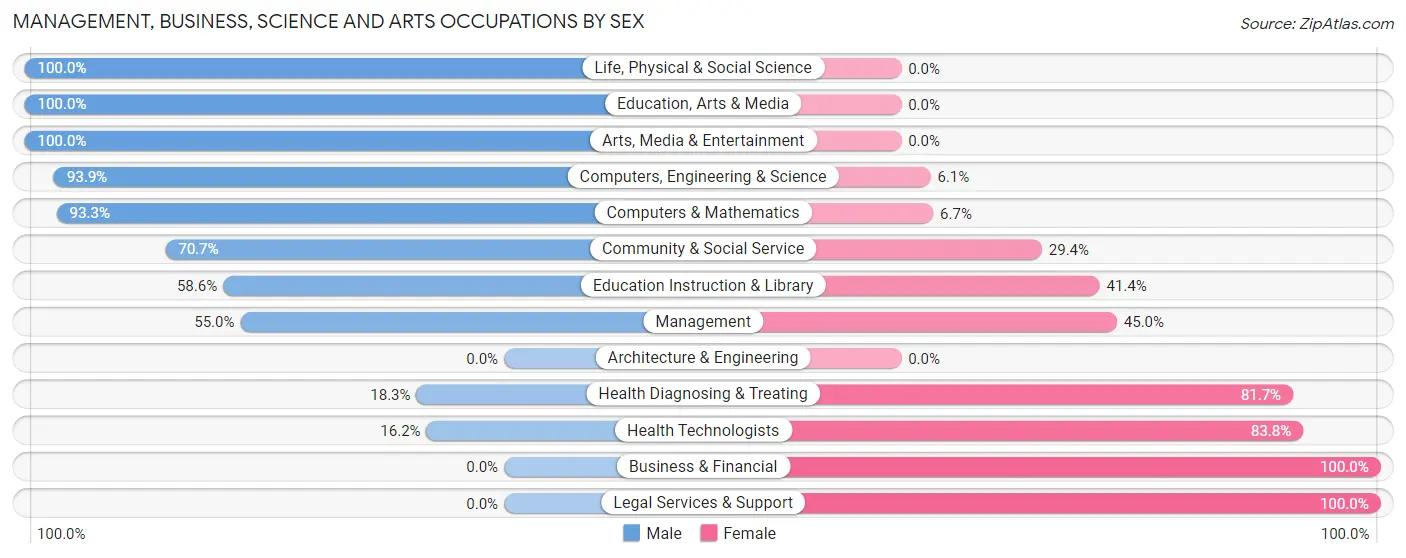
| Occupation | Male | Female |
| Management | 11 (55.0%) | 9 (45.0%) |
| Business & Financial | 0 (0.0%) | 19 (100.0%) |
| Computers, Engineering & Science | 46 (93.9%) | 3 (6.1%) |
| Computers & Mathematics | 42 (93.3%) | 3 (6.7%) |
| Architecture & Engineering | 0 (0.0%) | 0 (0.0%) |
| Life, Physical & Social Science | 4 (100.0%) | 0 (0.0%) |
| Community & Social Service | 65 (70.7%) | 27 (29.3%) |
| Education, Arts & Media | 7 (100.0%) | 0 (0.0%) |
| Legal Services & Support | 0 (0.0%) | 3 (100.0%) |
| Education Instruction & Library | 34 (58.6%) | 24 (41.4%) |
| Arts, Media & Entertainment | 24 (100.0%) | 0 (0.0%) |
| Health Diagnosing & Treating | 17 (18.3%) | 76 (81.7%) |
| Health Technologists | 11 (16.2%) | 57 (83.8%) |
| Total (Category) | 139 (50.9%) | 134 (49.1%) |
| Total (Overall) | 536 (56.2%) | 417 (43.8%) |
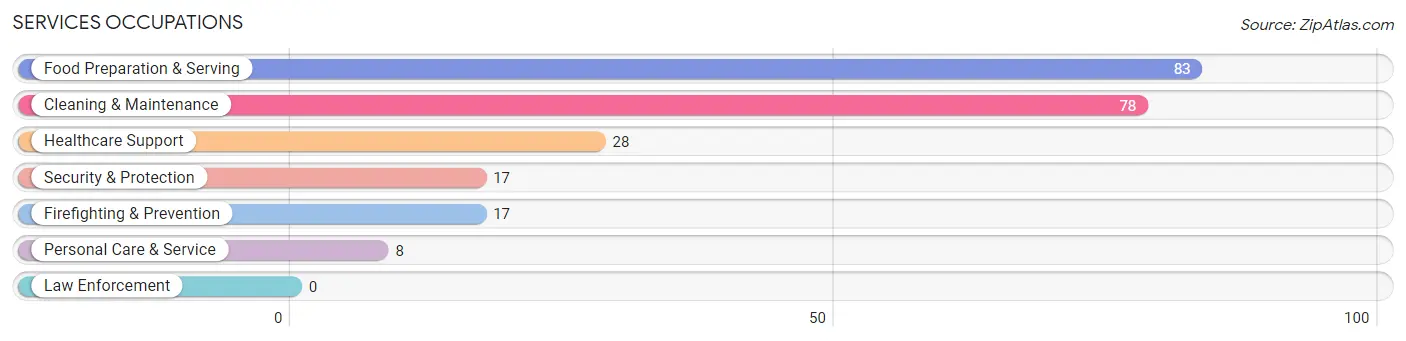
Services Occupations
The most common Services occupations in Poplarville are Food Preparation & Serving (83 | 8.7%), Cleaning & Maintenance (78 | 8.2%), Healthcare Support (28 | 2.9%), Security & Protection (17 | 1.8%), and Firefighting & Prevention (17 | 1.8%).
Services Occupations by Sex
Within the Services occupations in Poplarville, the most male-oriented occupations are Cleaning & Maintenance (100.0%), Personal Care & Service (100.0%), and Food Preparation & Serving (67.5%), while the most female-oriented occupations are Healthcare Support (100.0%), Security & Protection (58.8%), and Firefighting & Prevention (58.8%).
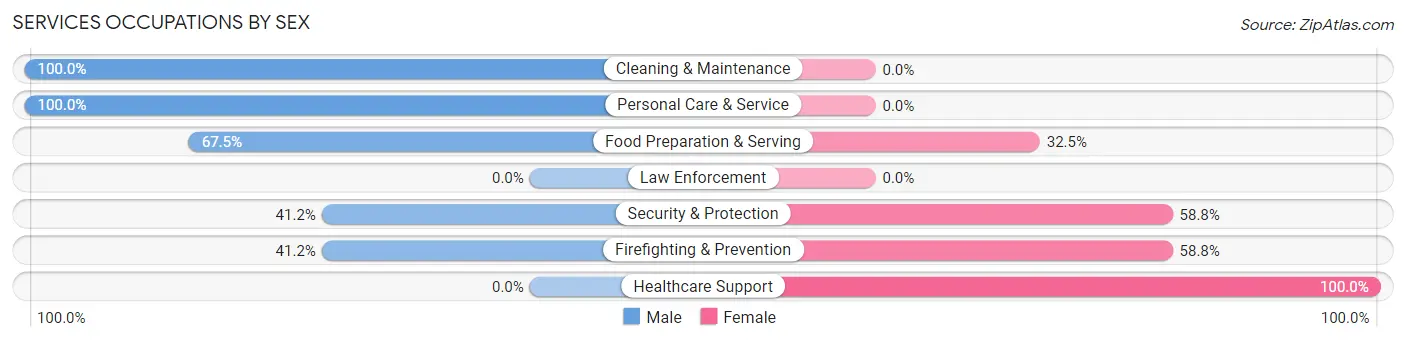
| Occupation | Male | Female |
| Healthcare Support | 0 (0.0%) | 28 (100.0%) |
| Security & Protection | 7 (41.2%) | 10 (58.8%) |
| Firefighting & Prevention | 7 (41.2%) | 10 (58.8%) |
| Law Enforcement | 0 (0.0%) | 0 (0.0%) |
| Food Preparation & Serving | 56 (67.5%) | 27 (32.5%) |
| Cleaning & Maintenance | 78 (100.0%) | 0 (0.0%) |
| Personal Care & Service | 8 (100.0%) | 0 (0.0%) |
| Total (Category) | 149 (69.6%) | 65 (30.4%) |
| Total (Overall) | 536 (56.2%) | 417 (43.8%) |
Sales and Office Occupations
The most common Sales and Office occupations in Poplarville are Sales & Related (214 | 22.5%), and Office & Administration (51 | 5.3%).

Sales and Office Occupations by Sex

| Occupation | Male | Female |
| Sales & Related | 47 (22.0%) | 167 (78.0%) |
| Office & Administration | 0 (0.0%) | 51 (100.0%) |
| Total (Category) | 47 (17.7%) | 218 (82.3%) |
| Total (Overall) | 536 (56.2%) | 417 (43.8%) |
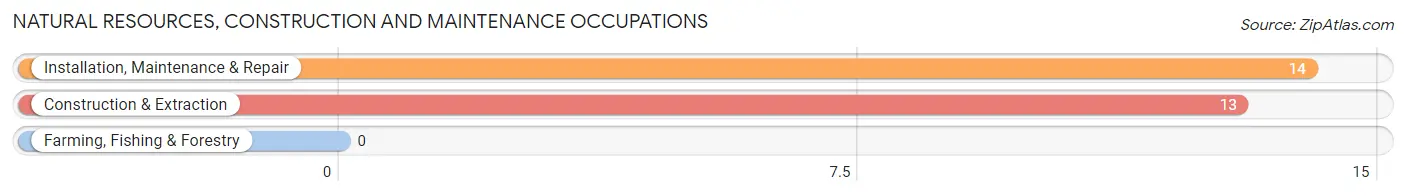
Natural Resources, Construction and Maintenance Occupations
The most common Natural Resources, Construction and Maintenance occupations in Poplarville are Installation, Maintenance & Repair (14 | 1.5%), and Construction & Extraction (13 | 1.4%).
Natural Resources, Construction and Maintenance Occupations by Sex

| Occupation | Male | Female |
| Farming, Fishing & Forestry | 0 (0.0%) | 0 (0.0%) |
| Construction & Extraction | 13 (100.0%) | 0 (0.0%) |
| Installation, Maintenance & Repair | 14 (100.0%) | 0 (0.0%) |
| Total (Category) | 27 (100.0%) | 0 (0.0%) |
| Total (Overall) | 536 (56.2%) | 417 (43.8%) |
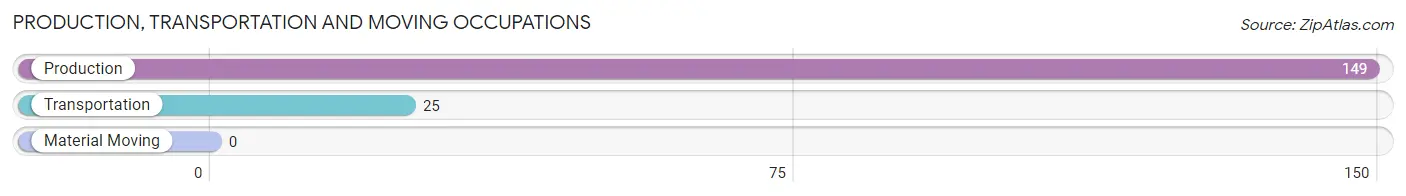
Production, Transportation and Moving Occupations
The most common Production, Transportation and Moving occupations in Poplarville are Production (149 | 15.6%), and Transportation (25 | 2.6%).
Production, Transportation and Moving Occupations by Sex
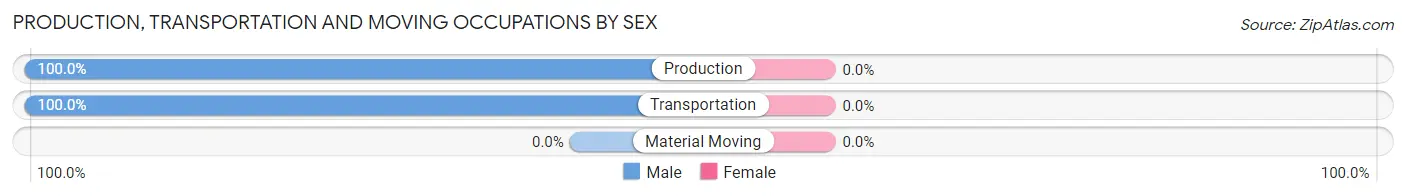
| Occupation | Male | Female |
| Production | 149 (100.0%) | 0 (0.0%) |
| Transportation | 25 (100.0%) | 0 (0.0%) |
| Material Moving | 0 (0.0%) | 0 (0.0%) |
| Total (Category) | 174 (100.0%) | 0 (0.0%) |
| Total (Overall) | 536 (56.2%) | 417 (43.8%) |
Employment Industries by Sex in Poplarville
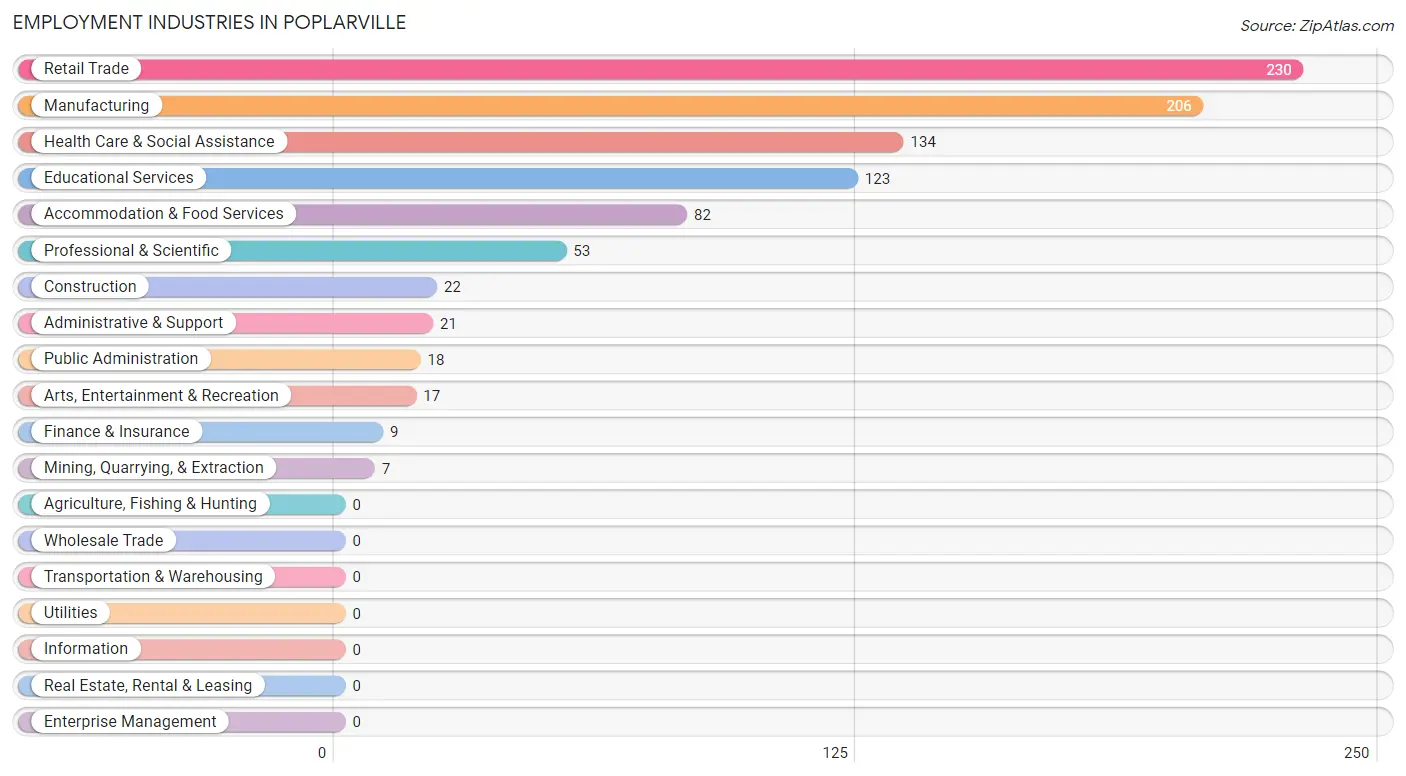
Employment Industries in Poplarville
The major employment industries in Poplarville include Retail Trade (230 | 24.1%), Manufacturing (206 | 21.6%), Health Care & Social Assistance (134 | 14.1%), Educational Services (123 | 12.9%), and Accommodation & Food Services (82 | 8.6%).
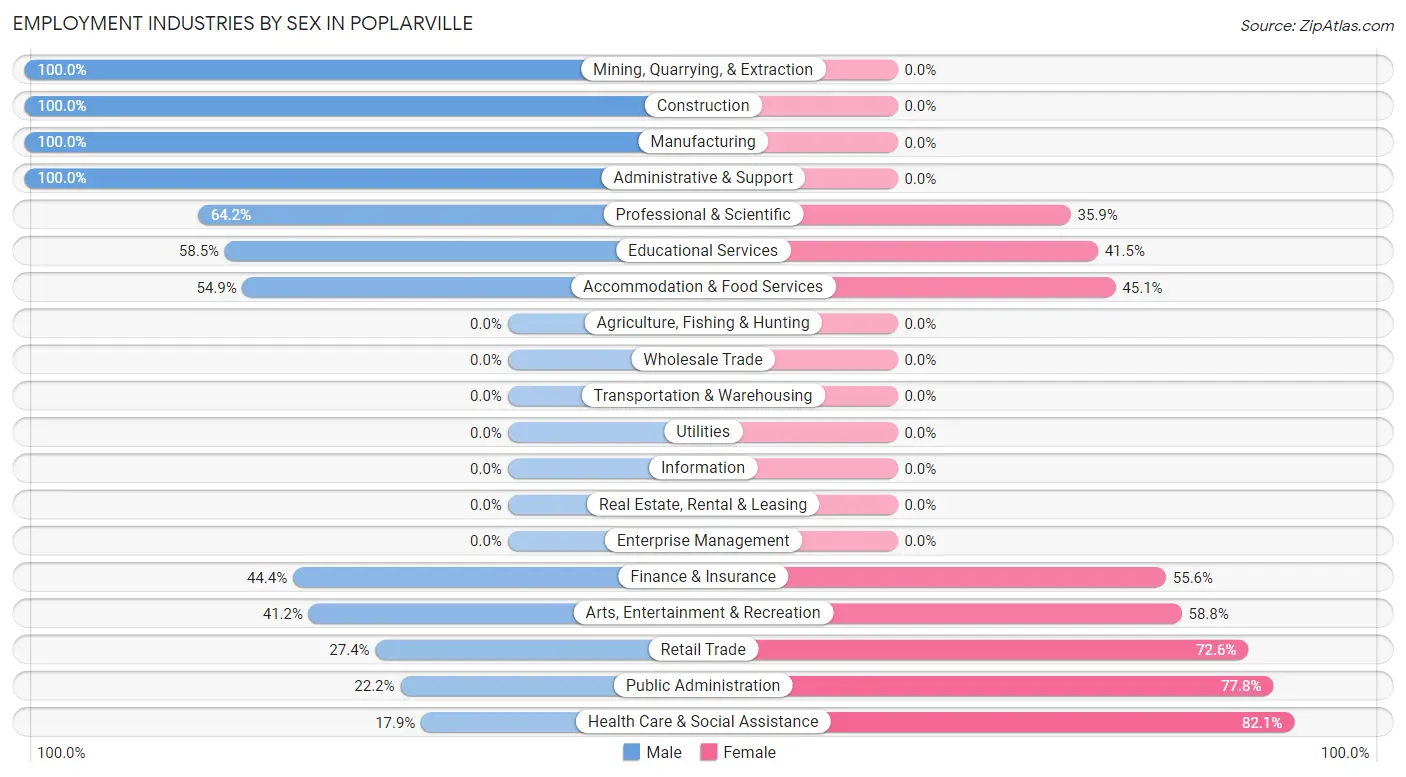
Employment Industries by Sex in Poplarville
The Poplarville industries that see more men than women are Mining, Quarrying, & Extraction (100.0%), Construction (100.0%), and Manufacturing (100.0%), whereas the industries that tend to have a higher number of women are Health Care & Social Assistance (82.1%), Public Administration (77.8%), and Retail Trade (72.6%).
| Industry | Male | Female |
| Agriculture, Fishing & Hunting | 0 (0.0%) | 0 (0.0%) |
| Mining, Quarrying, & Extraction | 7 (100.0%) | 0 (0.0%) |
| Construction | 22 (100.0%) | 0 (0.0%) |
| Manufacturing | 206 (100.0%) | 0 (0.0%) |
| Wholesale Trade | 0 (0.0%) | 0 (0.0%) |
| Retail Trade | 63 (27.4%) | 167 (72.6%) |
| Transportation & Warehousing | 0 (0.0%) | 0 (0.0%) |
| Utilities | 0 (0.0%) | 0 (0.0%) |
| Information | 0 (0.0%) | 0 (0.0%) |
| Finance & Insurance | 4 (44.4%) | 5 (55.6%) |
| Real Estate, Rental & Leasing | 0 (0.0%) | 0 (0.0%) |
| Professional & Scientific | 34 (64.1%) | 19 (35.8%) |
| Enterprise Management | 0 (0.0%) | 0 (0.0%) |
| Administrative & Support | 21 (100.0%) | 0 (0.0%) |
| Educational Services | 72 (58.5%) | 51 (41.5%) |
| Health Care & Social Assistance | 24 (17.9%) | 110 (82.1%) |
| Arts, Entertainment & Recreation | 7 (41.2%) | 10 (58.8%) |
| Accommodation & Food Services | 45 (54.9%) | 37 (45.1%) |
| Public Administration | 4 (22.2%) | 14 (77.8%) |
| Total | 536 (56.2%) | 417 (43.8%) |
Education in Poplarville
School Enrollment in Poplarville
The most common levels of schooling among the 1,232 students in Poplarville are college / undergraduate (749 | 60.8%), middle school (151 | 12.3%), and elementary school (128 | 10.4%).
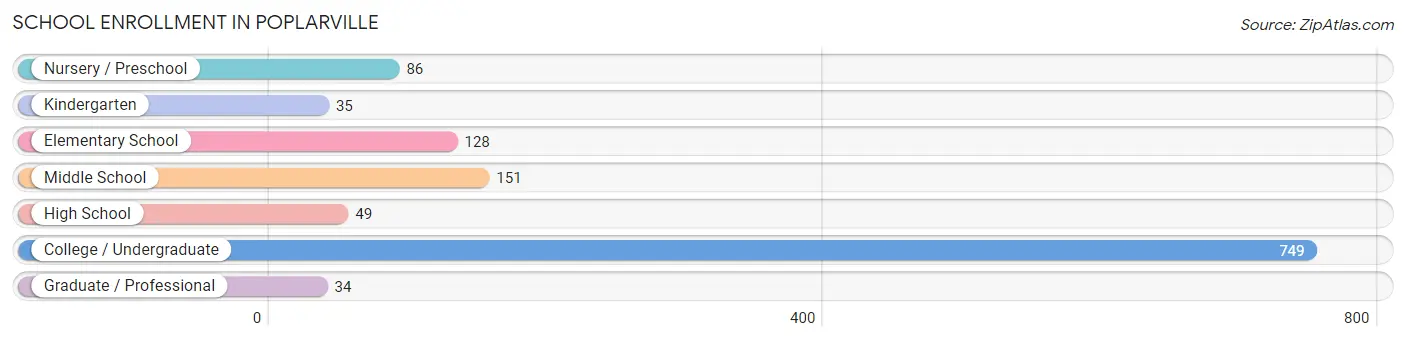
| School Level | # Students | % Students |
| Nursery / Preschool | 86 | 7.0% |
| Kindergarten | 35 | 2.8% |
| Elementary School | 128 | 10.4% |
| Middle School | 151 | 12.3% |
| High School | 49 | 4.0% |
| College / Undergraduate | 749 | 60.8% |
| Graduate / Professional | 34 | 2.8% |
| Total | 1,232 | 100.0% |
School Enrollment by Age by Funding Source in Poplarville
Out of a total of 1,232 students who are enrolled in schools in Poplarville, 138 (11.2%) attend a private institution, while the remaining 1,094 (88.8%) are enrolled in public schools. The age group of 3 to 4 year olds has the highest likelihood of being enrolled in private schools, with 53 (61.6% in the age bracket) enrolled. Conversely, the age group of 20 to 24 year olds has the lowest likelihood of being enrolled in a private school, with 275 (100.0% in the age bracket) attending a public institution.
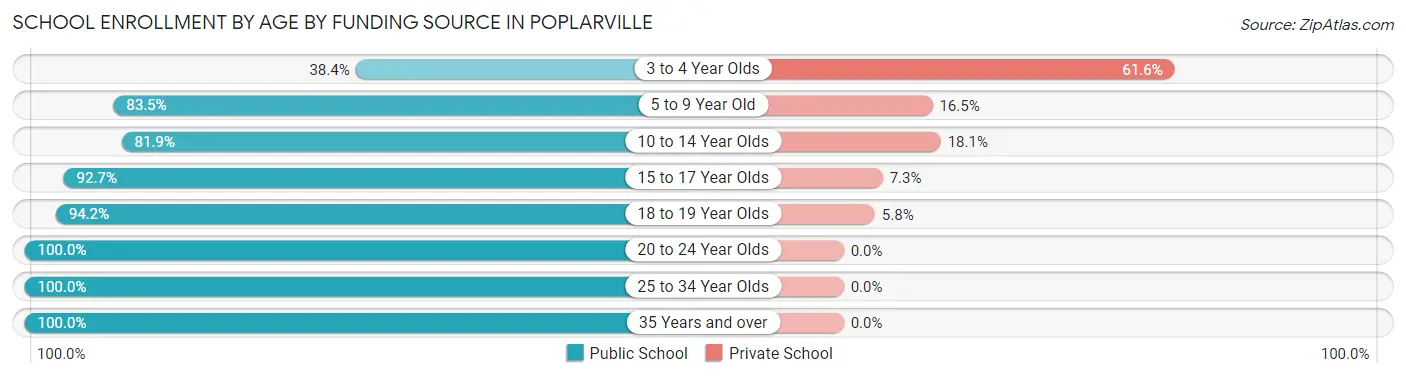
| Age Bracket | Public School | Private School |
| 3 to 4 Year Olds | 33 (38.4%) | 53 (61.6%) |
| 5 to 9 Year Old | 111 (83.5%) | 22 (16.5%) |
| 10 to 14 Year Olds | 145 (81.9%) | 32 (18.1%) |
| 15 to 17 Year Olds | 51 (92.7%) | 4 (7.3%) |
| 18 to 19 Year Olds | 437 (94.2%) | 27 (5.8%) |
| 20 to 24 Year Olds | 275 (100.0%) | 0 (0.0%) |
| 25 to 34 Year Olds | 30 (100.0%) | 0 (0.0%) |
| 35 Years and over | 12 (100.0%) | 0 (0.0%) |
| Total | 1,094 (88.8%) | 138 (11.2%) |
Educational Attainment by Field of Study in Poplarville
Science & technology (82 | 26.0%), psychology (36 | 11.4%), computers & mathematics (33 | 10.4%), education (30 | 9.5%), and bio, nature & agricultural (28 | 8.9%) are the most common fields of study among 316 individuals in Poplarville who have obtained a bachelor's degree or higher.
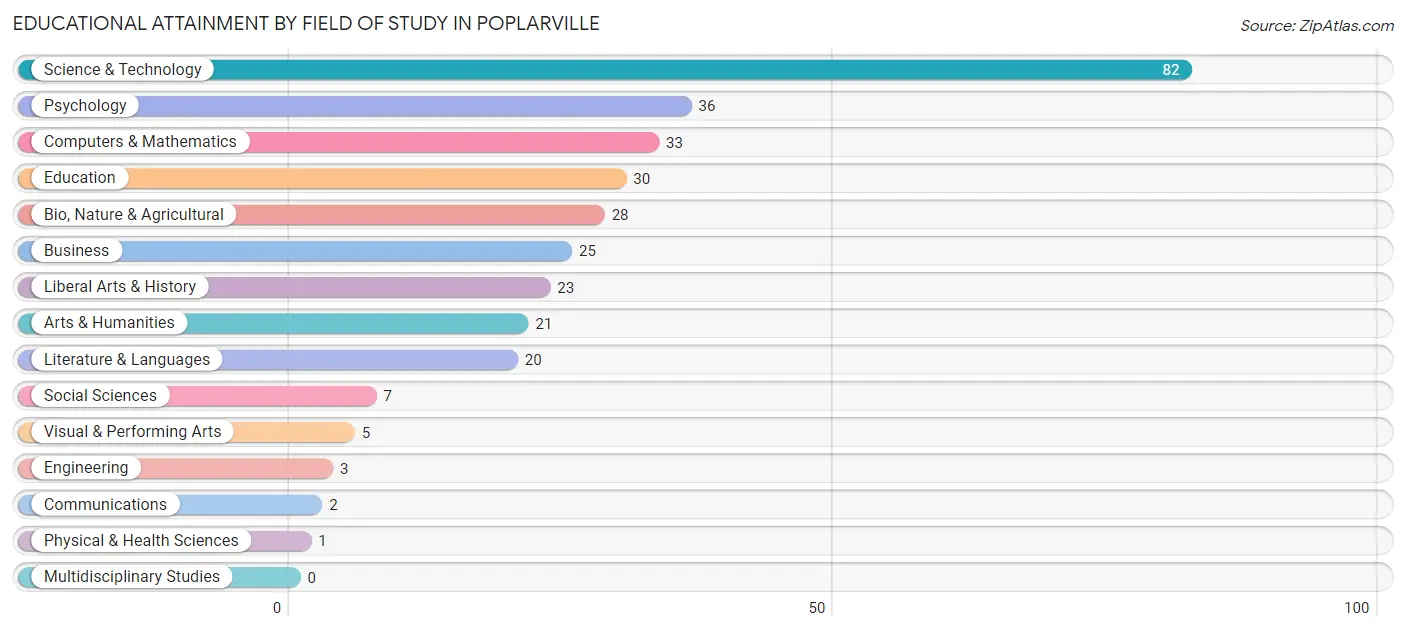
| Field of Study | # Graduates | % Graduates |
| Computers & Mathematics | 33 | 10.4% |
| Bio, Nature & Agricultural | 28 | 8.9% |
| Physical & Health Sciences | 1 | 0.3% |
| Psychology | 36 | 11.4% |
| Social Sciences | 7 | 2.2% |
| Engineering | 3 | 0.9% |
| Multidisciplinary Studies | 0 | 0.0% |
| Science & Technology | 82 | 26.0% |
| Business | 25 | 7.9% |
| Education | 30 | 9.5% |
| Literature & Languages | 20 | 6.3% |
| Liberal Arts & History | 23 | 7.3% |
| Visual & Performing Arts | 5 | 1.6% |
| Communications | 2 | 0.6% |
| Arts & Humanities | 21 | 6.7% |
| Total | 316 | 100.0% |
Transportation & Commute in Poplarville
Vehicle Availability by Sex in Poplarville
The most prevalent vehicle ownership categories in Poplarville are males with 2 vehicles (177, accounting for 39.1%) and females with 2 vehicles (73, making up 62.1%).
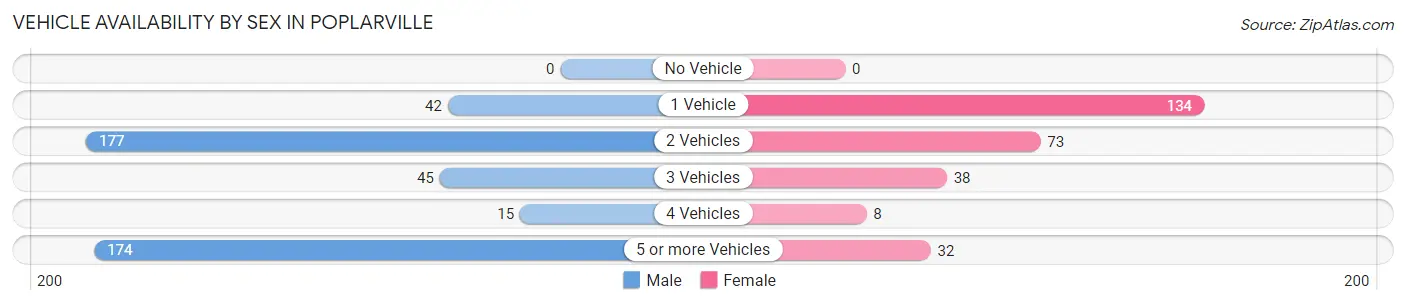
| Vehicles Available | Male | Female |
| No Vehicle | 0 (0.0%) | 0 (0.0%) |
| 1 Vehicle | 42 (9.3%) | 134 (47.0%) |
| 2 Vehicles | 177 (39.1%) | 73 (25.6%) |
| 3 Vehicles | 45 (9.9%) | 38 (13.3%) |
| 4 Vehicles | 15 (3.3%) | 8 (2.8%) |
| 5 or more Vehicles | 174 (38.4%) | 32 (11.2%) |
| Total | 453 (100.0%) | 285 (100.0%) |
Commute Time in Poplarville
The most frequently occuring commute durations in Poplarville are 90 or more minutes (192 commuters, 21.0%), 5 to 9 minutes (147 commuters, 16.1%), and 10 to 14 minutes (114 commuters, 12.4%).
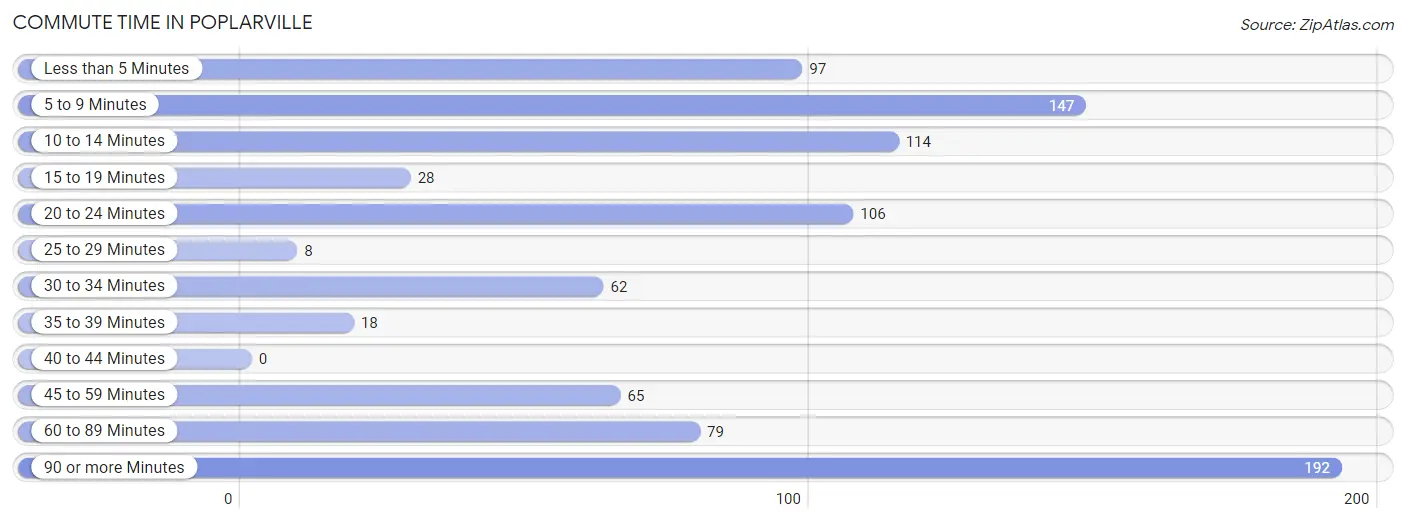
| Commute Time | # Commuters | % Commuters |
| Less than 5 Minutes | 97 | 10.6% |
| 5 to 9 Minutes | 147 | 16.1% |
| 10 to 14 Minutes | 114 | 12.4% |
| 15 to 19 Minutes | 28 | 3.1% |
| 20 to 24 Minutes | 106 | 11.6% |
| 25 to 29 Minutes | 8 | 0.9% |
| 30 to 34 Minutes | 62 | 6.8% |
| 35 to 39 Minutes | 18 | 2.0% |
| 40 to 44 Minutes | 0 | 0.0% |
| 45 to 59 Minutes | 65 | 7.1% |
| 60 to 89 Minutes | 79 | 8.6% |
| 90 or more Minutes | 192 | 21.0% |
Commute Time by Sex in Poplarville
The most common commute times in Poplarville are 90 or more minutes (162 commuters, 30.6%) for males and 5 to 9 minutes (67 commuters, 17.4%) for females.
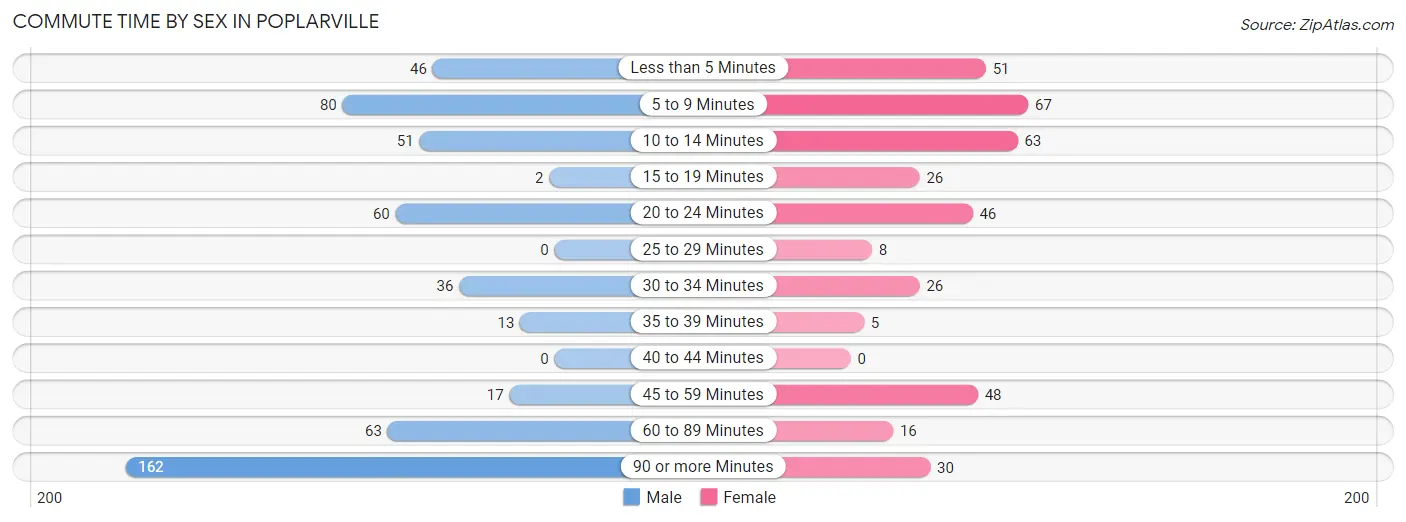
| Commute Time | Male | Female |
| Less than 5 Minutes | 46 (8.7%) | 51 (13.2%) |
| 5 to 9 Minutes | 80 (15.1%) | 67 (17.4%) |
| 10 to 14 Minutes | 51 (9.6%) | 63 (16.3%) |
| 15 to 19 Minutes | 2 (0.4%) | 26 (6.7%) |
| 20 to 24 Minutes | 60 (11.3%) | 46 (11.9%) |
| 25 to 29 Minutes | 0 (0.0%) | 8 (2.1%) |
| 30 to 34 Minutes | 36 (6.8%) | 26 (6.7%) |
| 35 to 39 Minutes | 13 (2.5%) | 5 (1.3%) |
| 40 to 44 Minutes | 0 (0.0%) | 0 (0.0%) |
| 45 to 59 Minutes | 17 (3.2%) | 48 (12.4%) |
| 60 to 89 Minutes | 63 (11.9%) | 16 (4.2%) |
| 90 or more Minutes | 162 (30.6%) | 30 (7.8%) |
Time of Departure to Work by Sex in Poplarville
The most frequent times of departure to work in Poplarville are 12:00 PM to 3:59 PM (156, 29.4%) for males and 9:00 AM to 9:59 AM (58, 15.0%) for females.
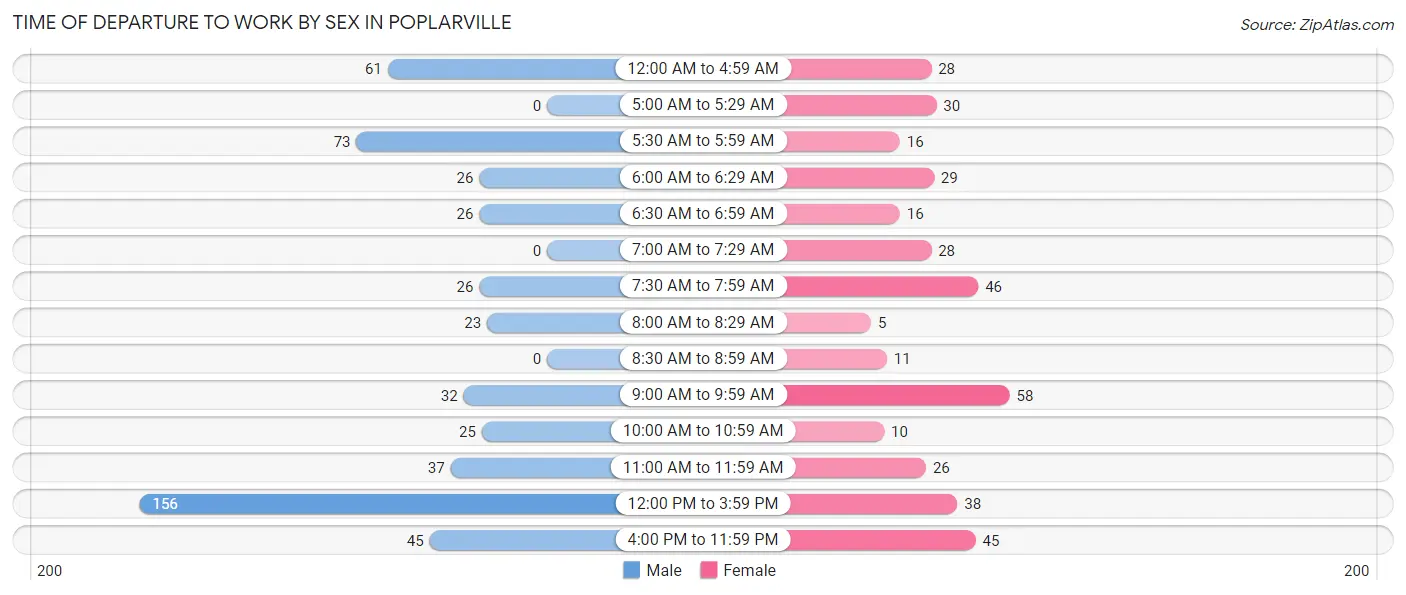
| Time of Departure | Male | Female |
| 12:00 AM to 4:59 AM | 61 (11.5%) | 28 (7.2%) |
| 5:00 AM to 5:29 AM | 0 (0.0%) | 30 (7.8%) |
| 5:30 AM to 5:59 AM | 73 (13.8%) | 16 (4.2%) |
| 6:00 AM to 6:29 AM | 26 (4.9%) | 29 (7.5%) |
| 6:30 AM to 6:59 AM | 26 (4.9%) | 16 (4.2%) |
| 7:00 AM to 7:29 AM | 0 (0.0%) | 28 (7.2%) |
| 7:30 AM to 7:59 AM | 26 (4.9%) | 46 (11.9%) |
| 8:00 AM to 8:29 AM | 23 (4.3%) | 5 (1.3%) |
| 8:30 AM to 8:59 AM | 0 (0.0%) | 11 (2.9%) |
| 9:00 AM to 9:59 AM | 32 (6.0%) | 58 (15.0%) |
| 10:00 AM to 10:59 AM | 25 (4.7%) | 10 (2.6%) |
| 11:00 AM to 11:59 AM | 37 (7.0%) | 26 (6.7%) |
| 12:00 PM to 3:59 PM | 156 (29.4%) | 38 (9.8%) |
| 4:00 PM to 11:59 PM | 45 (8.5%) | 45 (11.7%) |
| Total | 530 (100.0%) | 386 (100.0%) |
Housing Occupancy in Poplarville
Occupancy by Ownership in Poplarville
Of the total 617 dwellings in Poplarville, owner-occupied units account for 322 (52.2%), while renter-occupied units make up 295 (47.8%).
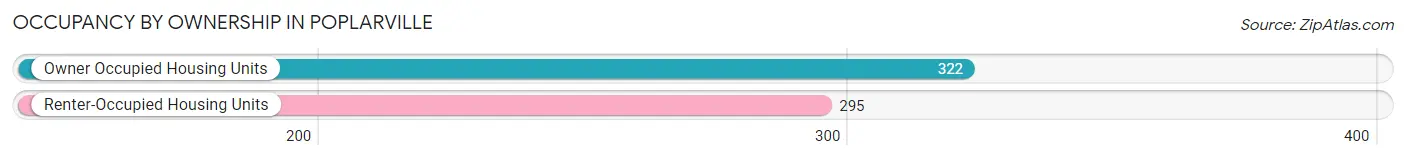
| Occupancy | # Housing Units | % Housing Units |
| Owner Occupied Housing Units | 322 | 52.2% |
| Renter-Occupied Housing Units | 295 | 47.8% |
| Total Occupied Housing Units | 617 | 100.0% |
Occupancy by Household Size in Poplarville
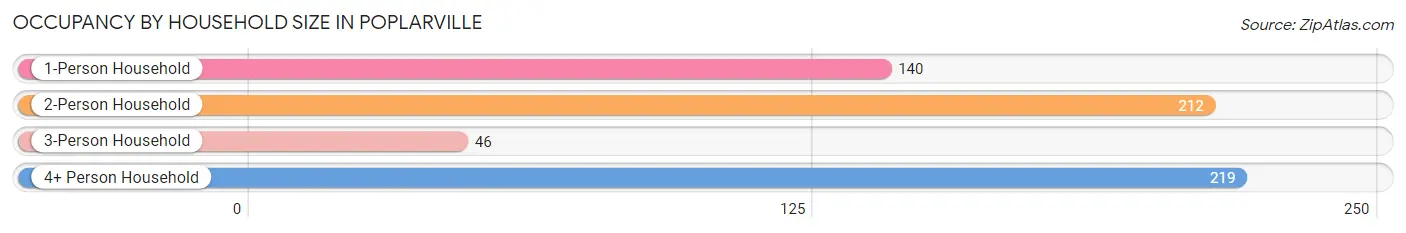
| Household Size | # Housing Units | % Housing Units |
| 1-Person Household | 140 | 22.7% |
| 2-Person Household | 212 | 34.4% |
| 3-Person Household | 46 | 7.5% |
| 4+ Person Household | 219 | 35.5% |
| Total Housing Units | 617 | 100.0% |
Occupancy by Ownership by Household Size in Poplarville
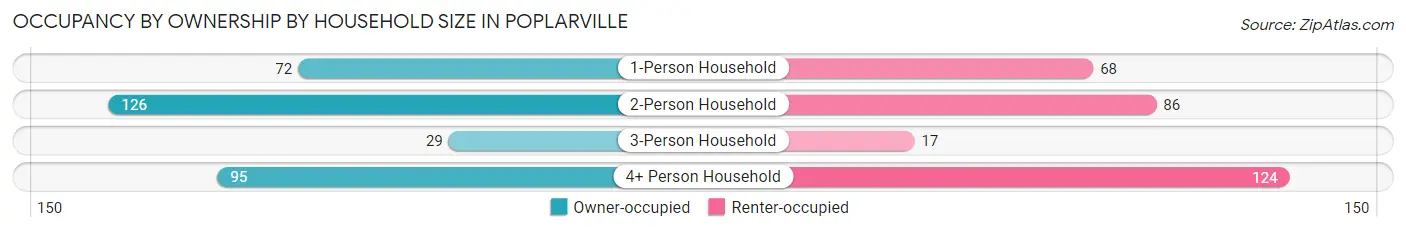
| Household Size | Owner-occupied | Renter-occupied |
| 1-Person Household | 72 (51.4%) | 68 (48.6%) |
| 2-Person Household | 126 (59.4%) | 86 (40.6%) |
| 3-Person Household | 29 (63.0%) | 17 (37.0%) |
| 4+ Person Household | 95 (43.4%) | 124 (56.6%) |
| Total Housing Units | 322 (52.2%) | 295 (47.8%) |
Occupancy by Educational Attainment in Poplarville
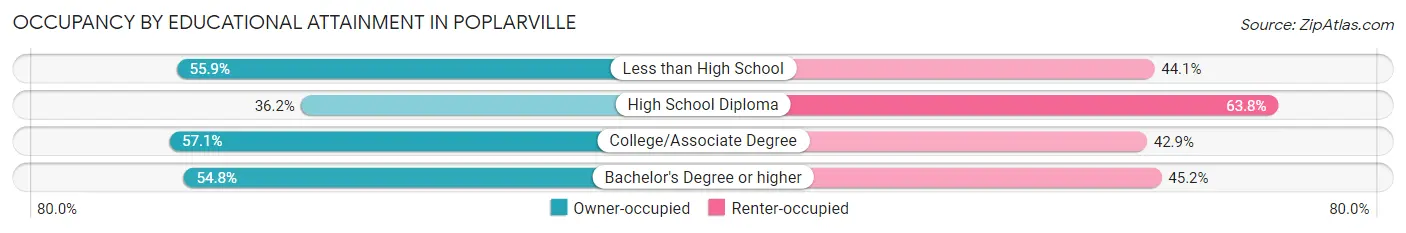
| Household Size | Owner-occupied | Renter-occupied |
| Less than High School | 19 (55.9%) | 15 (44.1%) |
| High School Diploma | 42 (36.2%) | 74 (63.8%) |
| College/Associate Degree | 129 (57.1%) | 97 (42.9%) |
| Bachelor's Degree or higher | 132 (54.8%) | 109 (45.2%) |
Occupancy by Age of Householder in Poplarville
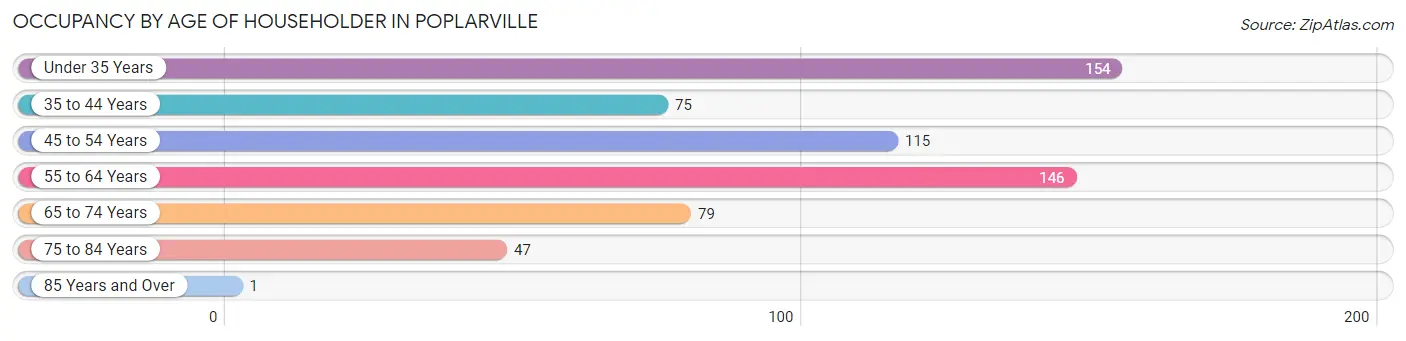
| Age Bracket | # Households | % Households |
| Under 35 Years | 154 | 25.0% |
| 35 to 44 Years | 75 | 12.2% |
| 45 to 54 Years | 115 | 18.6% |
| 55 to 64 Years | 146 | 23.7% |
| 65 to 74 Years | 79 | 12.8% |
| 75 to 84 Years | 47 | 7.6% |
| 85 Years and Over | 1 | 0.2% |
| Total | 617 | 100.0% |
Housing Finances in Poplarville
Median Income by Occupancy in Poplarville
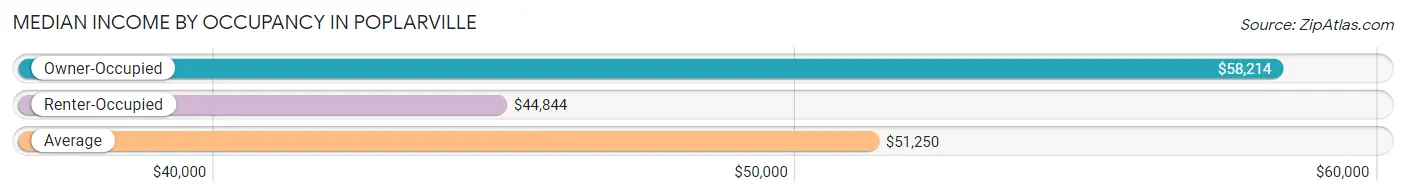
| Occupancy Type | # Households | Median Income |
| Owner-Occupied | 322 (52.2%) | $58,214 |
| Renter-Occupied | 295 (47.8%) | $44,844 |
| Average | 617 (100.0%) | $51,250 |
Occupancy by Householder Income Bracket in Poplarville
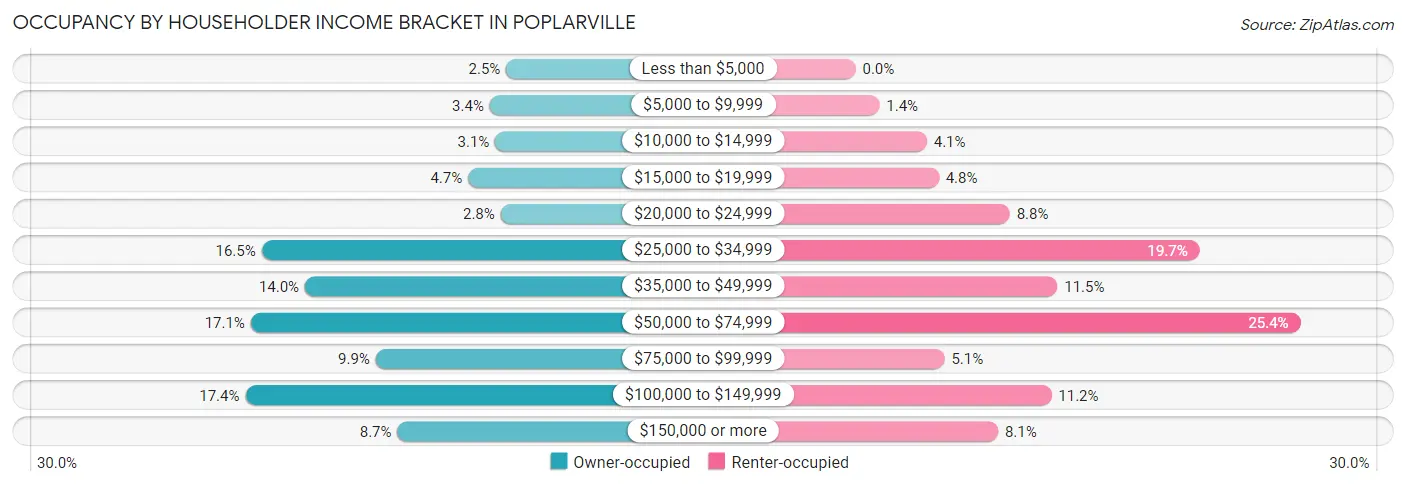
| Income Bracket | Owner-occupied | Renter-occupied |
| Less than $5,000 | 8 (2.5%) | 0 (0.0%) |
| $5,000 to $9,999 | 11 (3.4%) | 4 (1.4%) |
| $10,000 to $14,999 | 10 (3.1%) | 12 (4.1%) |
| $15,000 to $19,999 | 15 (4.7%) | 14 (4.8%) |
| $20,000 to $24,999 | 9 (2.8%) | 26 (8.8%) |
| $25,000 to $34,999 | 53 (16.5%) | 58 (19.7%) |
| $35,000 to $49,999 | 45 (14.0%) | 34 (11.5%) |
| $50,000 to $74,999 | 55 (17.1%) | 75 (25.4%) |
| $75,000 to $99,999 | 32 (9.9%) | 15 (5.1%) |
| $100,000 to $149,999 | 56 (17.4%) | 33 (11.2%) |
| $150,000 or more | 28 (8.7%) | 24 (8.1%) |
| Total | 322 (100.0%) | 295 (100.0%) |
Monthly Housing Cost Tiers in Poplarville
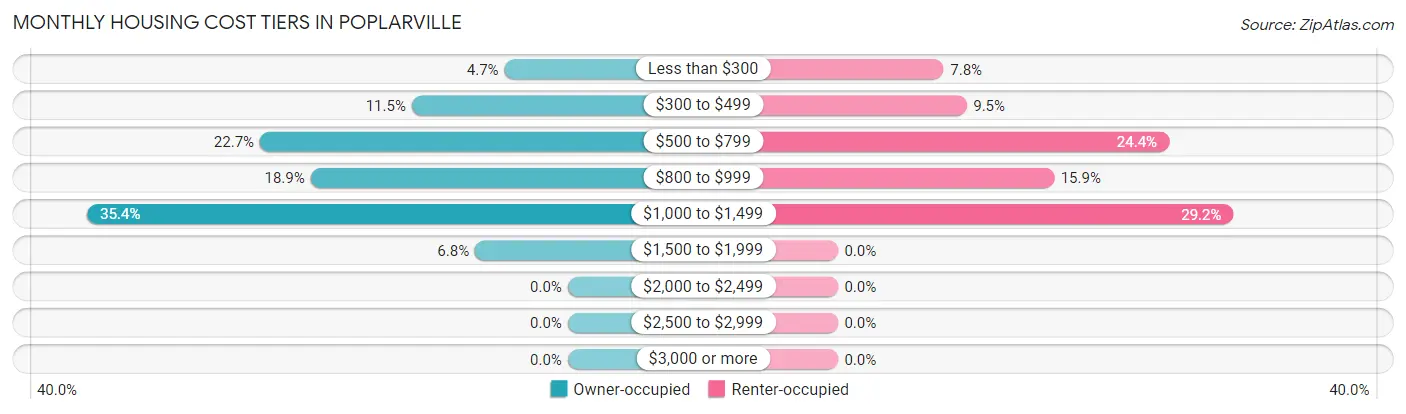
| Monthly Cost | Owner-occupied | Renter-occupied |
| Less than $300 | 15 (4.7%) | 23 (7.8%) |
| $300 to $499 | 37 (11.5%) | 28 (9.5%) |
| $500 to $799 | 73 (22.7%) | 72 (24.4%) |
| $800 to $999 | 61 (18.9%) | 47 (15.9%) |
| $1,000 to $1,499 | 114 (35.4%) | 86 (29.1%) |
| $1,500 to $1,999 | 22 (6.8%) | 0 (0.0%) |
| $2,000 to $2,499 | 0 (0.0%) | 0 (0.0%) |
| $2,500 to $2,999 | 0 (0.0%) | 0 (0.0%) |
| $3,000 or more | 0 (0.0%) | 0 (0.0%) |
| Total | 322 (100.0%) | 295 (100.0%) |
Physical Housing Characteristics in Poplarville
Housing Structures in Poplarville
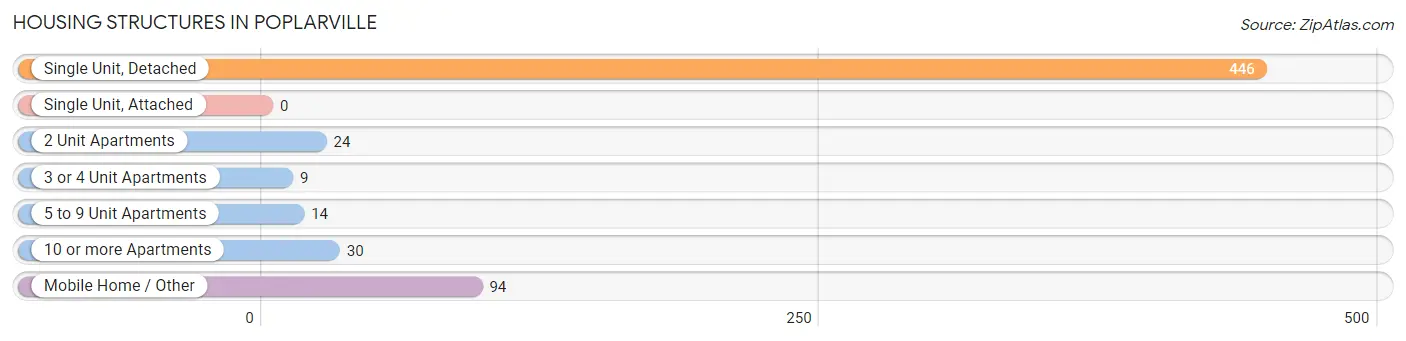
| Structure Type | # Housing Units | % Housing Units |
| Single Unit, Detached | 446 | 72.3% |
| Single Unit, Attached | 0 | 0.0% |
| 2 Unit Apartments | 24 | 3.9% |
| 3 or 4 Unit Apartments | 9 | 1.5% |
| 5 to 9 Unit Apartments | 14 | 2.3% |
| 10 or more Apartments | 30 | 4.9% |
| Mobile Home / Other | 94 | 15.2% |
| Total | 617 | 100.0% |
Housing Structures by Occupancy in Poplarville
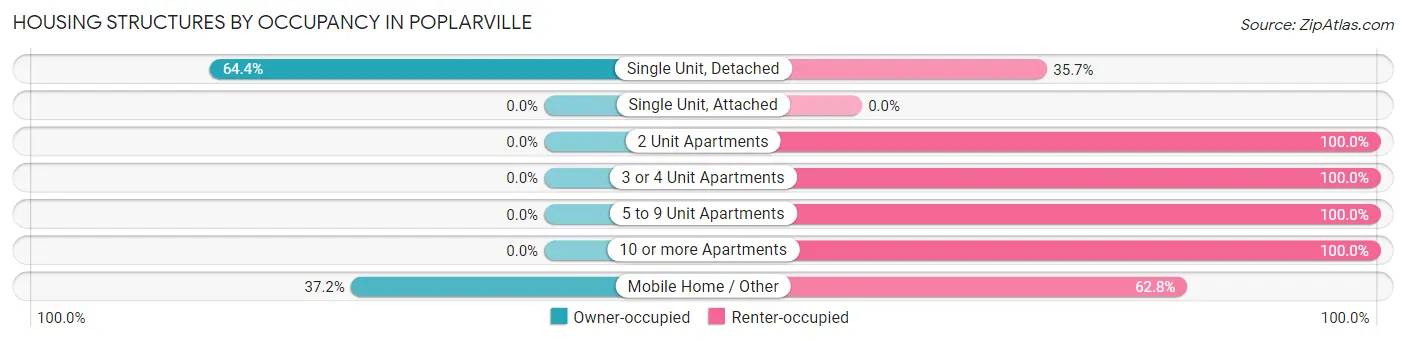
| Structure Type | Owner-occupied | Renter-occupied |
| Single Unit, Detached | 287 (64.3%) | 159 (35.6%) |
| Single Unit, Attached | 0 (0.0%) | 0 (0.0%) |
| 2 Unit Apartments | 0 (0.0%) | 24 (100.0%) |
| 3 or 4 Unit Apartments | 0 (0.0%) | 9 (100.0%) |
| 5 to 9 Unit Apartments | 0 (0.0%) | 14 (100.0%) |
| 10 or more Apartments | 0 (0.0%) | 30 (100.0%) |
| Mobile Home / Other | 35 (37.2%) | 59 (62.8%) |
| Total | 322 (52.2%) | 295 (47.8%) |
Housing Structures by Number of Rooms in Poplarville
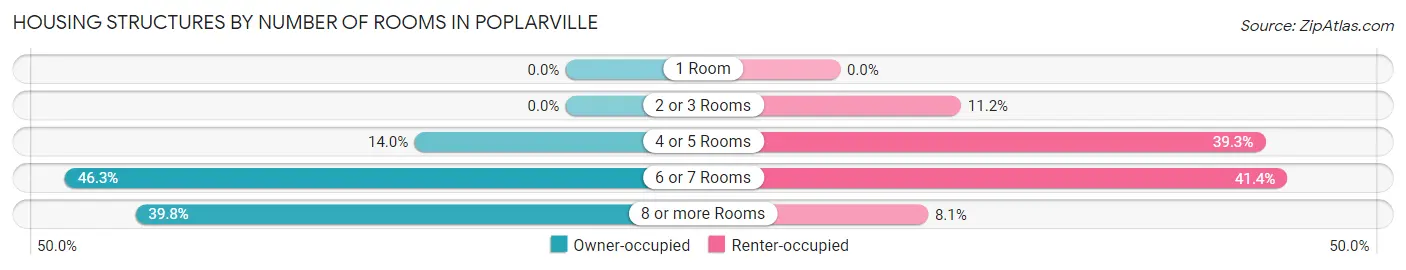
| Number of Rooms | Owner-occupied | Renter-occupied |
| 1 Room | 0 (0.0%) | 0 (0.0%) |
| 2 or 3 Rooms | 0 (0.0%) | 33 (11.2%) |
| 4 or 5 Rooms | 45 (14.0%) | 116 (39.3%) |
| 6 or 7 Rooms | 149 (46.3%) | 122 (41.4%) |
| 8 or more Rooms | 128 (39.8%) | 24 (8.1%) |
| Total | 322 (100.0%) | 295 (100.0%) |
Housing Structure by Heating Type in Poplarville
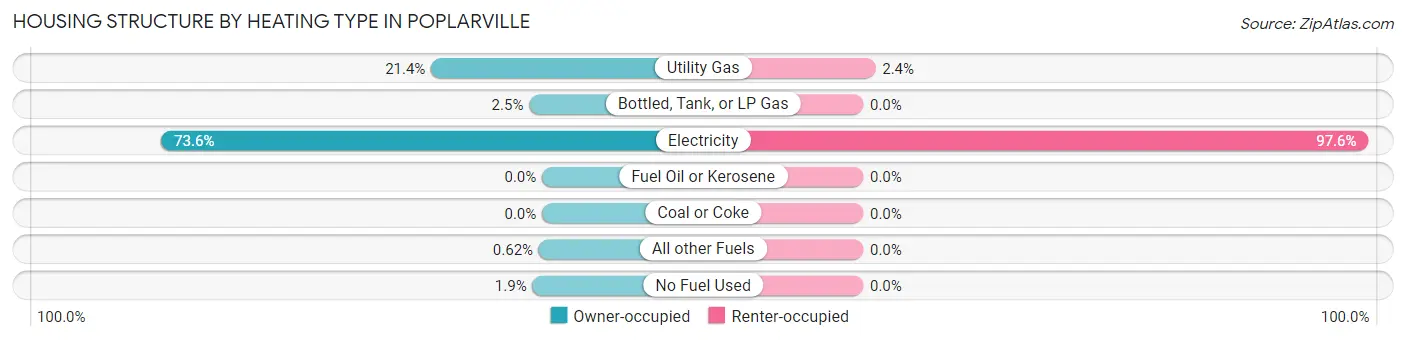
| Heating Type | Owner-occupied | Renter-occupied |
| Utility Gas | 69 (21.4%) | 7 (2.4%) |
| Bottled, Tank, or LP Gas | 8 (2.5%) | 0 (0.0%) |
| Electricity | 237 (73.6%) | 288 (97.6%) |
| Fuel Oil or Kerosene | 0 (0.0%) | 0 (0.0%) |
| Coal or Coke | 0 (0.0%) | 0 (0.0%) |
| All other Fuels | 2 (0.6%) | 0 (0.0%) |
| No Fuel Used | 6 (1.9%) | 0 (0.0%) |
| Total | 322 (100.0%) | 295 (100.0%) |
Household Vehicle Usage in Poplarville
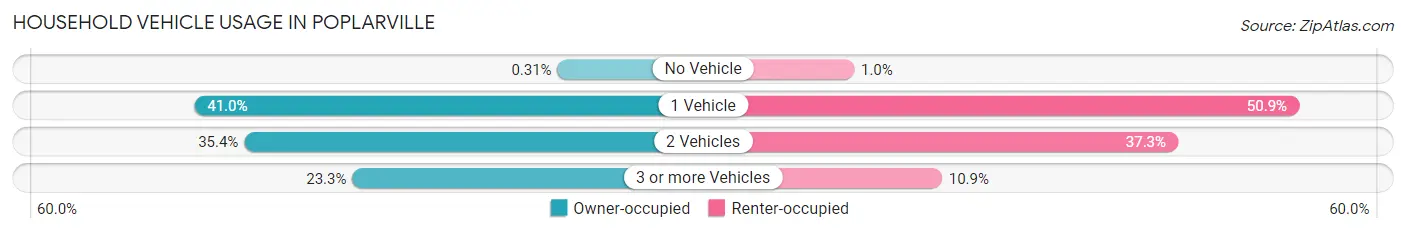
| Vehicles per Household | Owner-occupied | Renter-occupied |
| No Vehicle | 1 (0.3%) | 3 (1.0%) |
| 1 Vehicle | 132 (41.0%) | 150 (50.8%) |
| 2 Vehicles | 114 (35.4%) | 110 (37.3%) |
| 3 or more Vehicles | 75 (23.3%) | 32 (10.8%) |
| Total | 322 (100.0%) | 295 (100.0%) |
Real Estate & Mortgages in Poplarville
Real Estate and Mortgage Overview in Poplarville
| Characteristic | Without Mortgage | With Mortgage |
| Housing Units | 115 | 207 |
| Median Property Value | $175,400 | $137,800 |
| Median Household Income | $50,313 | $13 |
| Monthly Housing Costs | $528 | $0 |
| Real Estate Taxes | $1,188 | $18 |
Property Value by Mortgage Status in Poplarville
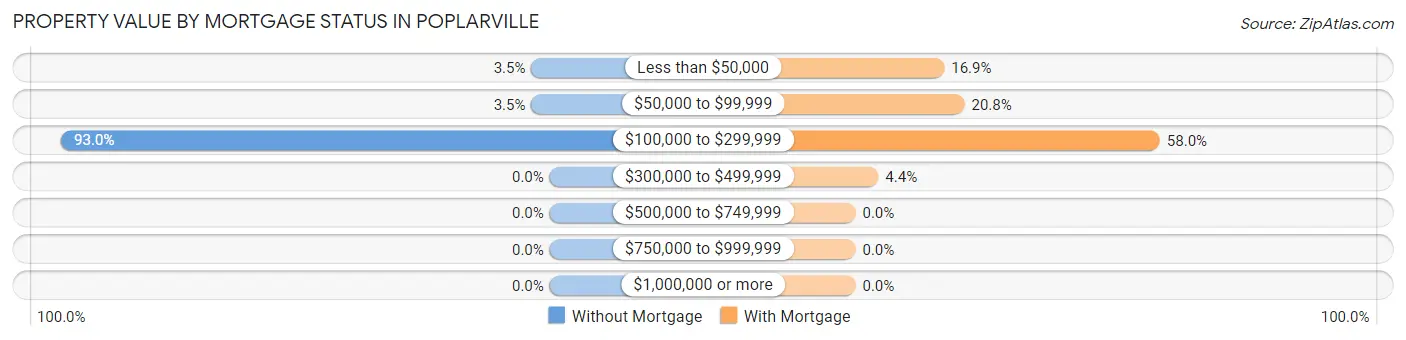
| Property Value | Without Mortgage | With Mortgage |
| Less than $50,000 | 4 (3.5%) | 35 (16.9%) |
| $50,000 to $99,999 | 4 (3.5%) | 43 (20.8%) |
| $100,000 to $299,999 | 107 (93.0%) | 120 (58.0%) |
| $300,000 to $499,999 | 0 (0.0%) | 9 (4.3%) |
| $500,000 to $749,999 | 0 (0.0%) | 0 (0.0%) |
| $750,000 to $999,999 | 0 (0.0%) | 0 (0.0%) |
| $1,000,000 or more | 0 (0.0%) | 0 (0.0%) |
| Total | 115 (100.0%) | 207 (100.0%) |
Household Income by Mortgage Status in Poplarville
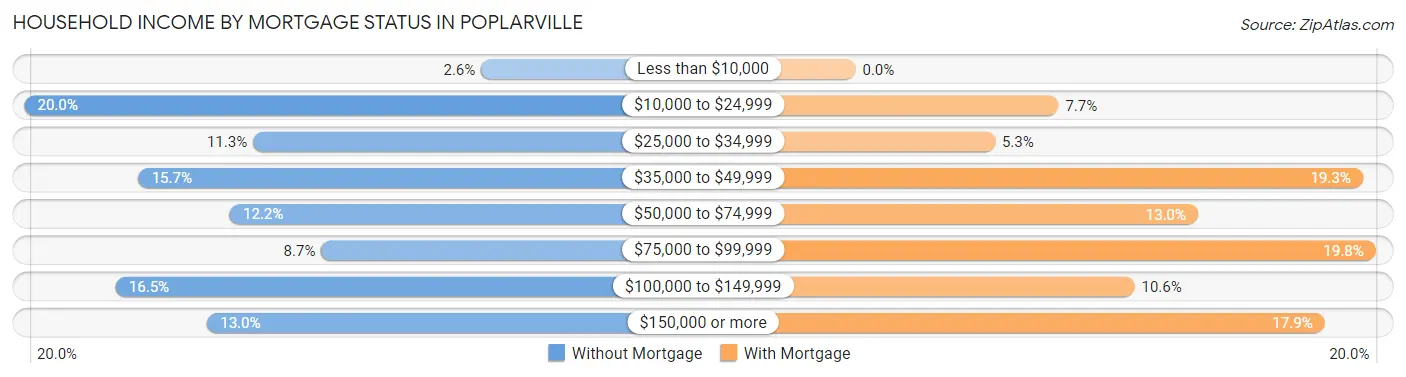
| Household Income | Without Mortgage | With Mortgage |
| Less than $10,000 | 3 (2.6%) | 0 (0.0%) |
| $10,000 to $24,999 | 23 (20.0%) | 16 (7.7%) |
| $25,000 to $34,999 | 13 (11.3%) | 11 (5.3%) |
| $35,000 to $49,999 | 18 (15.7%) | 40 (19.3%) |
| $50,000 to $74,999 | 14 (12.2%) | 27 (13.0%) |
| $75,000 to $99,999 | 10 (8.7%) | 41 (19.8%) |
| $100,000 to $149,999 | 19 (16.5%) | 22 (10.6%) |
| $150,000 or more | 15 (13.0%) | 37 (17.9%) |
| Total | 115 (100.0%) | 207 (100.0%) |
Property Value to Household Income Ratio in Poplarville
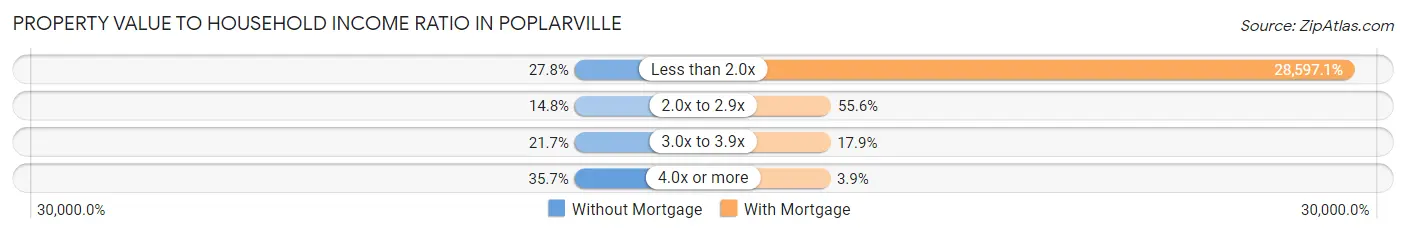
| Value-to-Income Ratio | Without Mortgage | With Mortgage |
| Less than 2.0x | 32 (27.8%) | 59,196 (28,597.1%) |
| 2.0x to 2.9x | 17 (14.8%) | 115 (55.6%) |
| 3.0x to 3.9x | 25 (21.7%) | 37 (17.9%) |
| 4.0x or more | 41 (35.6%) | 8 (3.9%) |
| Total | 115 (100.0%) | 207 (100.0%) |
Real Estate Taxes by Mortgage Status in Poplarville
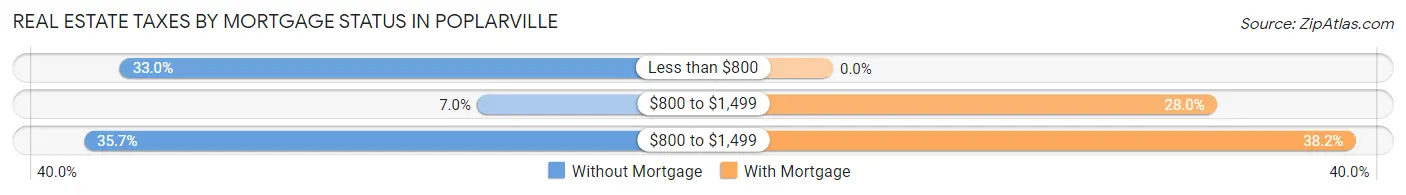
| Property Taxes | Without Mortgage | With Mortgage |
| Less than $800 | 38 (33.0%) | 0 (0.0%) |
| $800 to $1,499 | 8 (7.0%) | 58 (28.0%) |
| $800 to $1,499 | 41 (35.6%) | 79 (38.2%) |
| Total | 115 (100.0%) | 207 (100.0%) |
Health & Disability in Poplarville
Health Insurance Coverage by Age in Poplarville
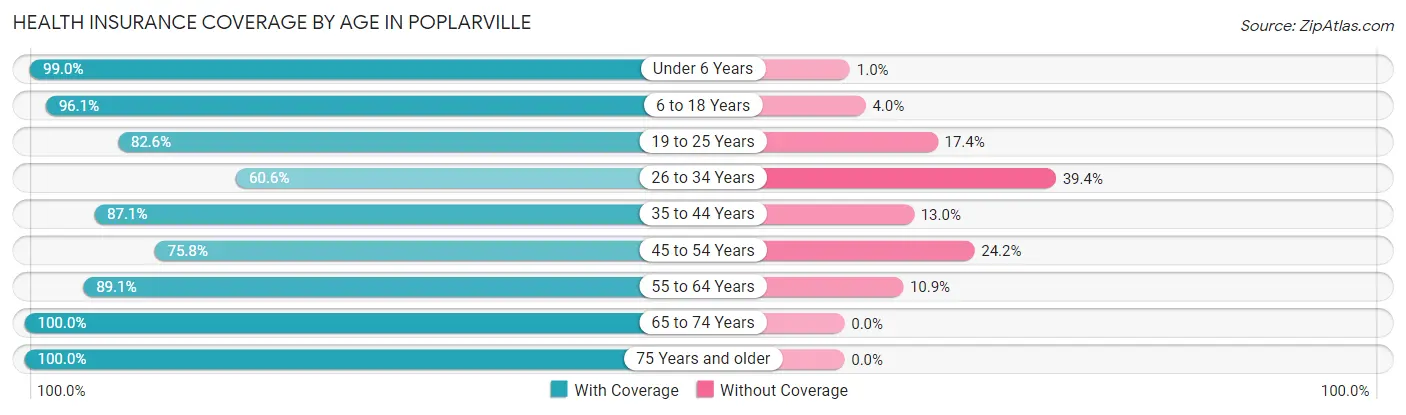
| Age Bracket | With Coverage | Without Coverage |
| Under 6 Years | 289 (99.0%) | 3 (1.0%) |
| 6 to 18 Years | 560 (96.1%) | 23 (4.0%) |
| 19 to 25 Years | 627 (82.6%) | 132 (17.4%) |
| 26 to 34 Years | 192 (60.6%) | 125 (39.4%) |
| 35 to 44 Years | 195 (87.1%) | 29 (13.0%) |
| 45 to 54 Years | 125 (75.8%) | 40 (24.2%) |
| 55 to 64 Years | 171 (89.1%) | 21 (10.9%) |
| 65 to 74 Years | 102 (100.0%) | 0 (0.0%) |
| 75 Years and older | 57 (100.0%) | 0 (0.0%) |
| Total | 2,318 (86.1%) | 373 (13.9%) |
Health Insurance Coverage by Citizenship Status in Poplarville

| Citizenship Status | With Coverage | Without Coverage |
| Native Born | 289 (99.0%) | 3 (1.0%) |
| Foreign Born, Citizen | 560 (96.1%) | 23 (4.0%) |
| Foreign Born, not a Citizen | 627 (82.6%) | 132 (17.4%) |
Health Insurance Coverage by Household Income in Poplarville
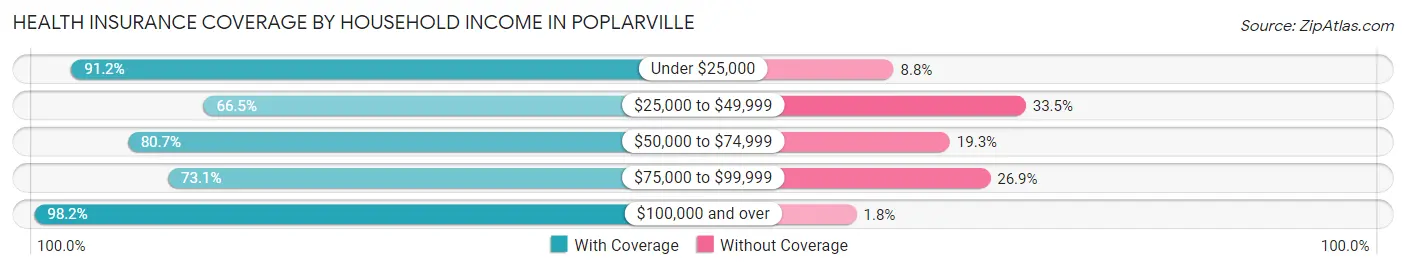
| Household Income | With Coverage | Without Coverage |
| Under $25,000 | 156 (91.2%) | 15 (8.8%) |
| $25,000 to $49,999 | 420 (66.5%) | 212 (33.5%) |
| $50,000 to $74,999 | 309 (80.7%) | 74 (19.3%) |
| $75,000 to $99,999 | 87 (73.1%) | 32 (26.9%) |
| $100,000 and over | 644 (98.2%) | 12 (1.8%) |
Public vs Private Health Insurance Coverage by Age in Poplarville
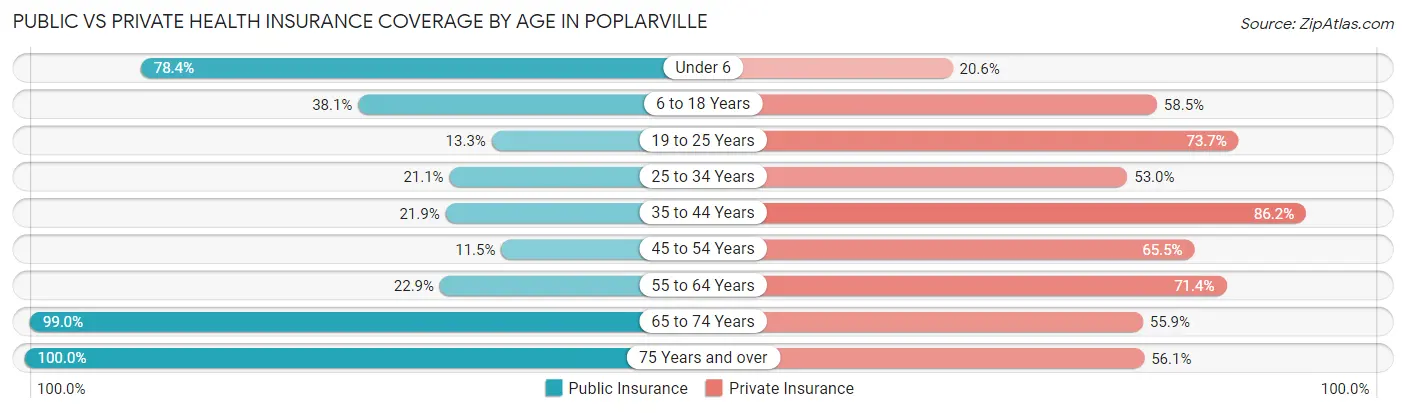
| Age Bracket | Public Insurance | Private Insurance |
| Under 6 | 229 (78.4%) | 60 (20.5%) |
| 6 to 18 Years | 222 (38.1%) | 341 (58.5%) |
| 19 to 25 Years | 101 (13.3%) | 559 (73.7%) |
| 25 to 34 Years | 67 (21.1%) | 168 (53.0%) |
| 35 to 44 Years | 49 (21.9%) | 193 (86.2%) |
| 45 to 54 Years | 19 (11.5%) | 108 (65.4%) |
| 55 to 64 Years | 44 (22.9%) | 137 (71.4%) |
| 65 to 74 Years | 101 (99.0%) | 57 (55.9%) |
| 75 Years and over | 57 (100.0%) | 32 (56.1%) |
| Total | 889 (33.0%) | 1,655 (61.5%) |
Disability Status by Sex by Age in Poplarville
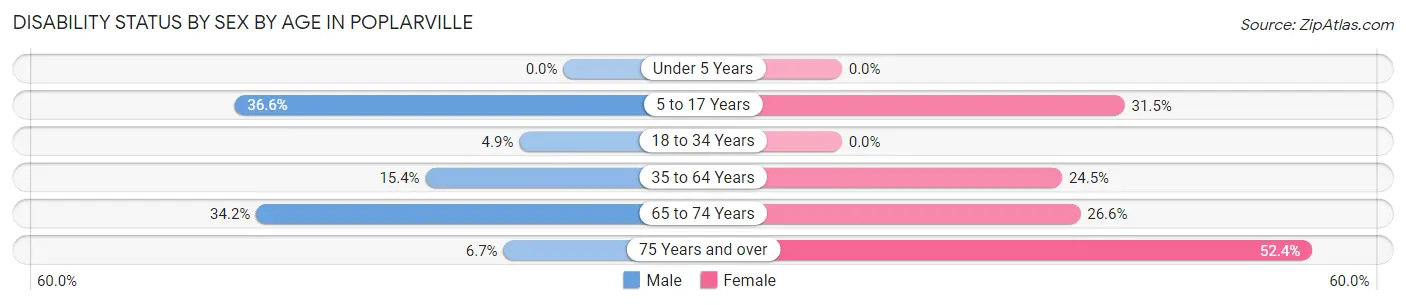
| Age Bracket | Male | Female |
| Under 5 Years | 0 (0.0%) | 0 (0.0%) |
| 5 to 17 Years | 63 (36.6%) | 63 (31.5%) |
| 18 to 34 Years | 29 (4.9%) | 0 (0.0%) |
| 35 to 64 Years | 41 (15.4%) | 77 (24.5%) |
| 65 to 74 Years | 13 (34.2%) | 17 (26.6%) |
| 75 Years and over | 1 (6.7%) | 22 (52.4%) |
Disability Class by Sex by Age in Poplarville
Disability Class: Hearing Difficulty
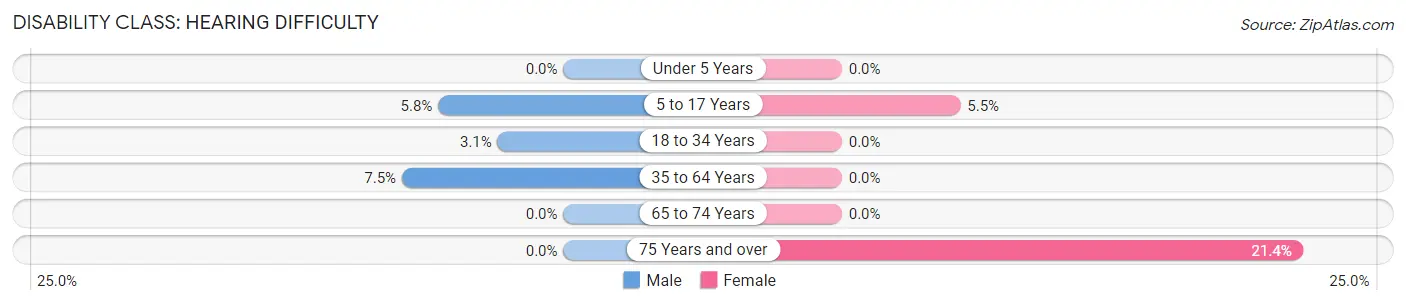
| Age Bracket | Male | Female |
| Under 5 Years | 0 (0.0%) | 0 (0.0%) |
| 5 to 17 Years | 10 (5.8%) | 11 (5.5%) |
| 18 to 34 Years | 18 (3.0%) | 0 (0.0%) |
| 35 to 64 Years | 20 (7.5%) | 0 (0.0%) |
| 65 to 74 Years | 0 (0.0%) | 0 (0.0%) |
| 75 Years and over | 0 (0.0%) | 9 (21.4%) |
Disability Class: Vision Difficulty
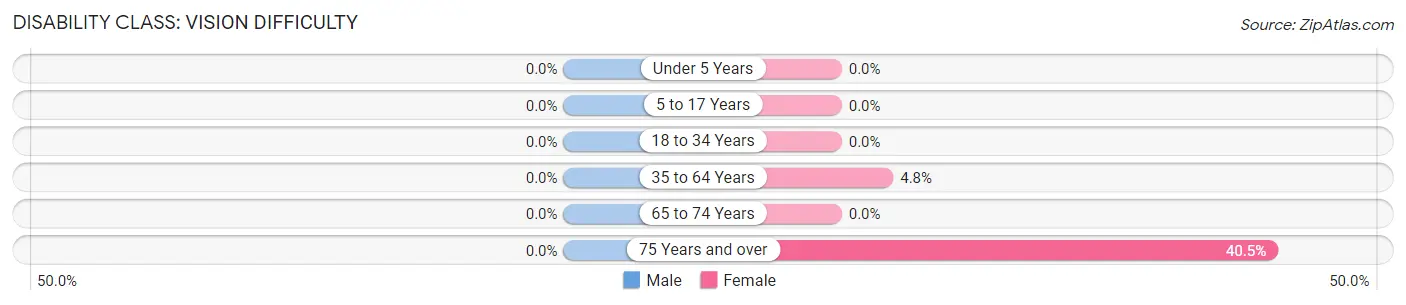
| Age Bracket | Male | Female |
| Under 5 Years | 0 (0.0%) | 0 (0.0%) |
| 5 to 17 Years | 0 (0.0%) | 0 (0.0%) |
| 18 to 34 Years | 0 (0.0%) | 0 (0.0%) |
| 35 to 64 Years | 0 (0.0%) | 15 (4.8%) |
| 65 to 74 Years | 0 (0.0%) | 0 (0.0%) |
| 75 Years and over | 0 (0.0%) | 17 (40.5%) |
Disability Class: Cognitive Difficulty
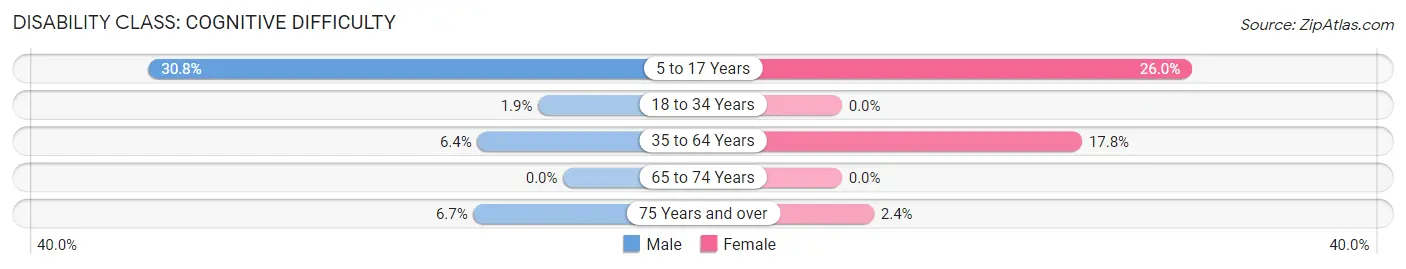
| Age Bracket | Male | Female |
| 5 to 17 Years | 53 (30.8%) | 52 (26.0%) |
| 18 to 34 Years | 11 (1.9%) | 0 (0.0%) |
| 35 to 64 Years | 17 (6.4%) | 56 (17.8%) |
| 65 to 74 Years | 0 (0.0%) | 0 (0.0%) |
| 75 Years and over | 1 (6.7%) | 1 (2.4%) |
Disability Class: Ambulatory Difficulty
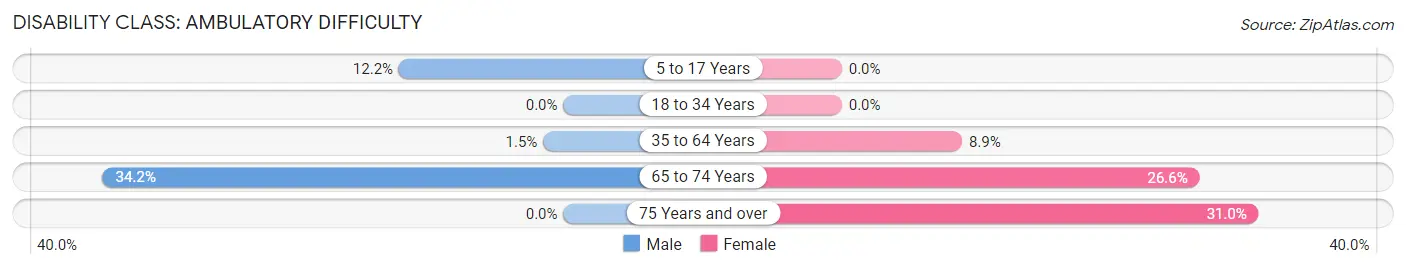
| Age Bracket | Male | Female |
| 5 to 17 Years | 21 (12.2%) | 0 (0.0%) |
| 18 to 34 Years | 0 (0.0%) | 0 (0.0%) |
| 35 to 64 Years | 4 (1.5%) | 28 (8.9%) |
| 65 to 74 Years | 13 (34.2%) | 17 (26.6%) |
| 75 Years and over | 0 (0.0%) | 13 (30.9%) |
Disability Class: Self-Care Difficulty
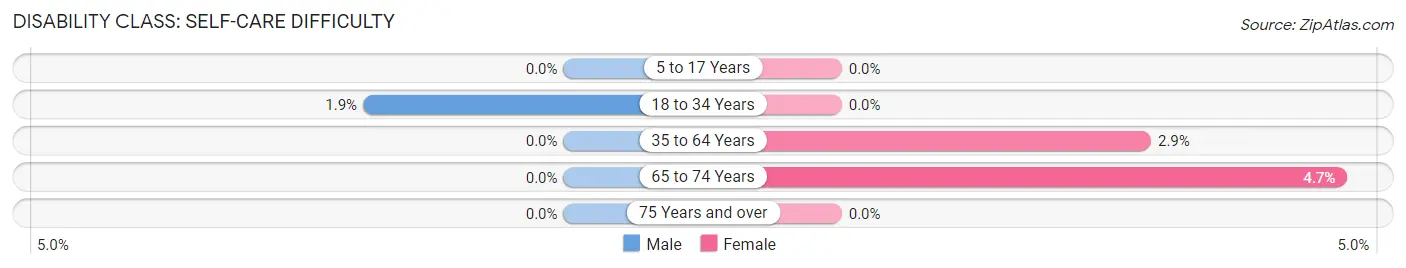
| Age Bracket | Male | Female |
| 5 to 17 Years | 0 (0.0%) | 0 (0.0%) |
| 18 to 34 Years | 11 (1.9%) | 0 (0.0%) |
| 35 to 64 Years | 0 (0.0%) | 9 (2.9%) |
| 65 to 74 Years | 0 (0.0%) | 3 (4.7%) |
| 75 Years and over | 0 (0.0%) | 0 (0.0%) |
Technology Access in Poplarville
Computing Device Access in Poplarville
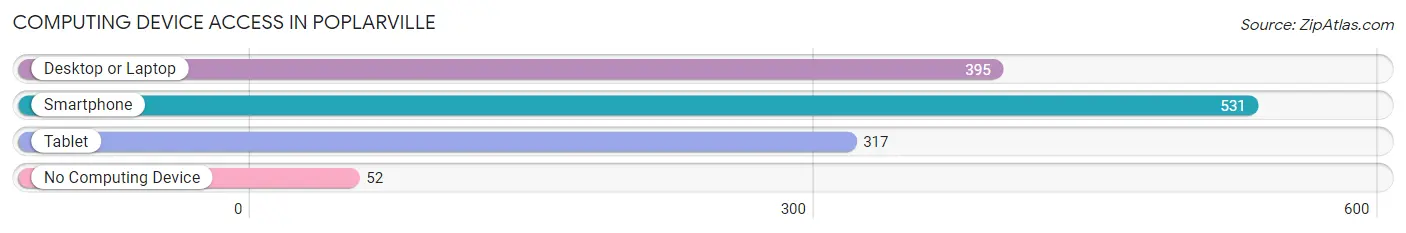
| Device Type | # Households | % Households |
| Desktop or Laptop | 395 | 64.0% |
| Smartphone | 531 | 86.1% |
| Tablet | 317 | 51.4% |
| No Computing Device | 52 | 8.4% |
| Total | 617 | 100.0% |
Internet Access in Poplarville
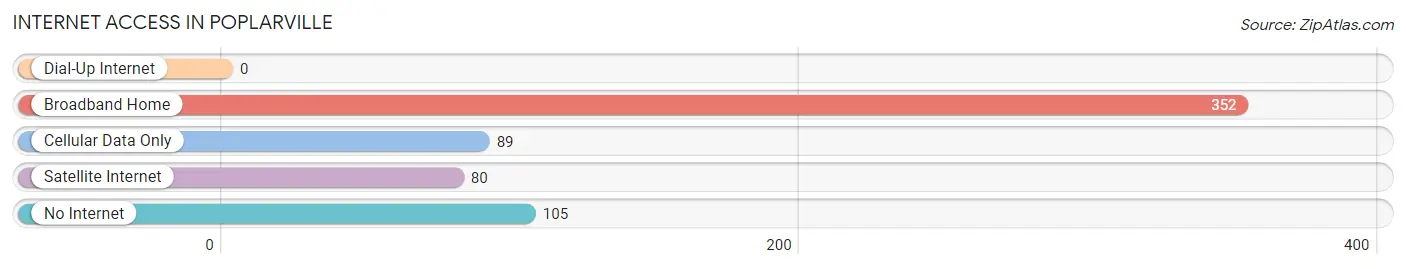
| Internet Type | # Households | % Households |
| Dial-Up Internet | 0 | 0.0% |
| Broadband Home | 352 | 57.1% |
| Cellular Data Only | 89 | 14.4% |
| Satellite Internet | 80 | 13.0% |
| No Internet | 105 | 17.0% |
| Total | 617 | 100.0% |
Poplarville Summary
Poplarville, Mississippi is a small town located in Pearl River County, Mississippi. It is situated in the southeastern corner of the state, approximately 50 miles north of the Gulf of Mexico. The town is located on the banks of the Pearl River, and is home to a population of approximately 4,000 people.
History
Poplarville was founded in 1820 by a group of settlers from North Carolina. The town was named after the abundance of poplar trees in the area. The town was incorporated in 1858 and quickly became a thriving agricultural center. Cotton was the primary crop grown in the area, and the town was home to several cotton gins and warehouses.
In the late 19th century, Poplarville was a major stop on the Mobile and Ohio Railroad. The railroad brought new economic opportunities to the town, and it soon became a hub for commerce and industry. The town was also home to several sawmills, gristmills, and other businesses.
Geography
Poplarville is located in the southeastern corner of Pearl River County, Mississippi. The town is situated on the banks of the Pearl River, and is surrounded by rolling hills and forests. The town is located approximately 50 miles north of the Gulf of Mexico.
The climate in Poplarville is humid subtropical, with hot, humid summers and mild winters. The average annual temperature is 68 degrees Fahrenheit, and the average annual precipitation is 56 inches.
Economy
The economy of Poplarville is largely based on agriculture. Cotton is the primary crop grown in the area, and the town is home to several cotton gins and warehouses. The town is also home to several sawmills, gristmills, and other businesses.
Poplarville is also home to several manufacturing companies, including a furniture factory, a paper mill, and a plastics factory. The town is also home to several retail stores, restaurants, and other businesses.
Demographics
As of the 2010 census, Poplarville had a population of 4,000 people. The racial makeup of the town was 79.3% White, 17.7% African American, 0.3% Native American, 0.7% Asian, 0.1% Pacific Islander, and 1.9% from other races. Hispanic or Latino of any race were 2.3% of the population.
The median household income in Poplarville was $30,000, and the median family income was $37,000. The per capita income was $15,000. Approximately 17.5% of the population was below the poverty line.
Common Questions
What is Per Capita Income in Poplarville?
Per Capita income in Poplarville is $16,868.
What is the Median Family Income in Poplarville?
Median Family Income in Poplarville is $62,679.
What is the Median Household income in Poplarville?
Median Household Income in Poplarville is $51,250.
What is Income or Wage Gap in Poplarville?
Income or Wage Gap in Poplarville is 35.6%.
Women in Poplarville earn 64.4 cents for every dollar earned by a man.
What is Inequality or Gini Index in Poplarville?
Inequality or Gini Index in Poplarville is 0.42.
What is the Total Population of Poplarville?
Total Population of Poplarville is 2,814.
What is the Total Male Population of Poplarville?
Total Male Population of Poplarville is 1,191.
What is the Total Female Population of Poplarville?
Total Female Population of Poplarville is 1,623.
What is the Ratio of Males per 100 Females in Poplarville?
There are 73.38 Males per 100 Females in Poplarville.
What is the Ratio of Females per 100 Males in Poplarville?
There are 136.27 Females per 100 Males in Poplarville.
What is the Median Population Age in Poplarville?
Median Population Age in Poplarville is 22.1 Years.
What is the Average Family Size in Poplarville
Average Family Size in Poplarville is 3.6 People.
What is the Average Household Size in Poplarville
Average Household Size in Poplarville is 3.2 People.
How Large is the Labor Force in Poplarville?
There are 1,100 People in the Labor Forcein in Poplarville.
What is the Percentage of People in the Labor Force in Poplarville?
49.5% of People are in the Labor Force in Poplarville.
What is the Unemployment Rate in Poplarville?
Unemployment Rate in Poplarville is 13.4%.