Laurel, MS Map & Demographics
Laurel Map
Laurel Overview
$25,148
PER CAPITA INCOME
$44,458
AVG FAMILY INCOME
$36,336
AVG HOUSEHOLD INCOME
19.4%
WAGE / INCOME GAP [ % ]
80.6¢/ $1
WAGE / INCOME GAP [ $ ]
0.56
INEQUALITY / GINI INDEX
17,241
TOTAL POPULATION
8,337
MALE POPULATION
8,904
FEMALE POPULATION
93.63
MALES / 100 FEMALES
106.80
FEMALES / 100 MALES
37.6
MEDIAN AGE
3.3
AVG FAMILY SIZE
2.6
AVG HOUSEHOLD SIZE
7,111
LABOR FORCE [ PEOPLE ]
52.7%
PERCENT IN LABOR FORCE
6.3%
UNEMPLOYMENT RATE
Laurel Area Codes
Income in Laurel
Income Overview in Laurel
Per Capita Income in Laurel is $25,148, while median incomes of families and households are $44,458 and $36,336 respectively.
| Characteristic | Number | Measure |
| Per Capita Income | 17,241 | $25,148 |
| Median Family Income | 4,030 | $44,458 |
| Mean Family Income | 4,030 | $81,542 |
| Median Household Income | 6,443 | $36,336 |
| Mean Household Income | 6,443 | $63,597 |
| Income Deficit | 4,030 | $0 |
| Wage / Income Gap (%) | 17,241 | 19.37% |
| Wage / Income Gap ($) | 17,241 | 80.63¢ per $1 |
| Gini / Inequality Index | 17,241 | 0.56 |
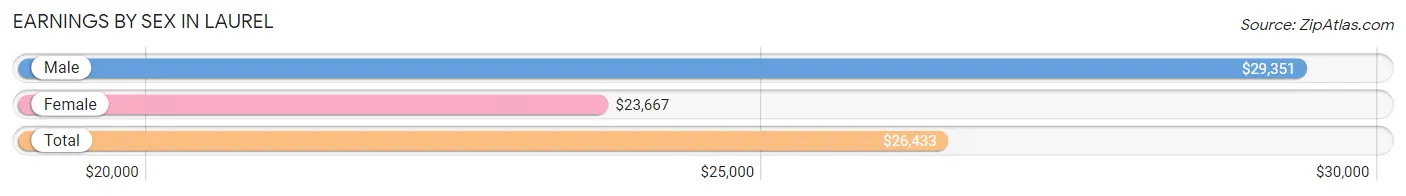
Earnings by Sex in Laurel
Average Earnings in Laurel are $26,433, $29,351 for men and $23,667 for women, a difference of 19.4%.
| Sex | Number | Average Earnings |
| Male | 3,892 (52.9%) | $29,351 |
| Female | 3,459 (47.0%) | $23,667 |
| Total | 7,351 (100.0%) | $26,433 |
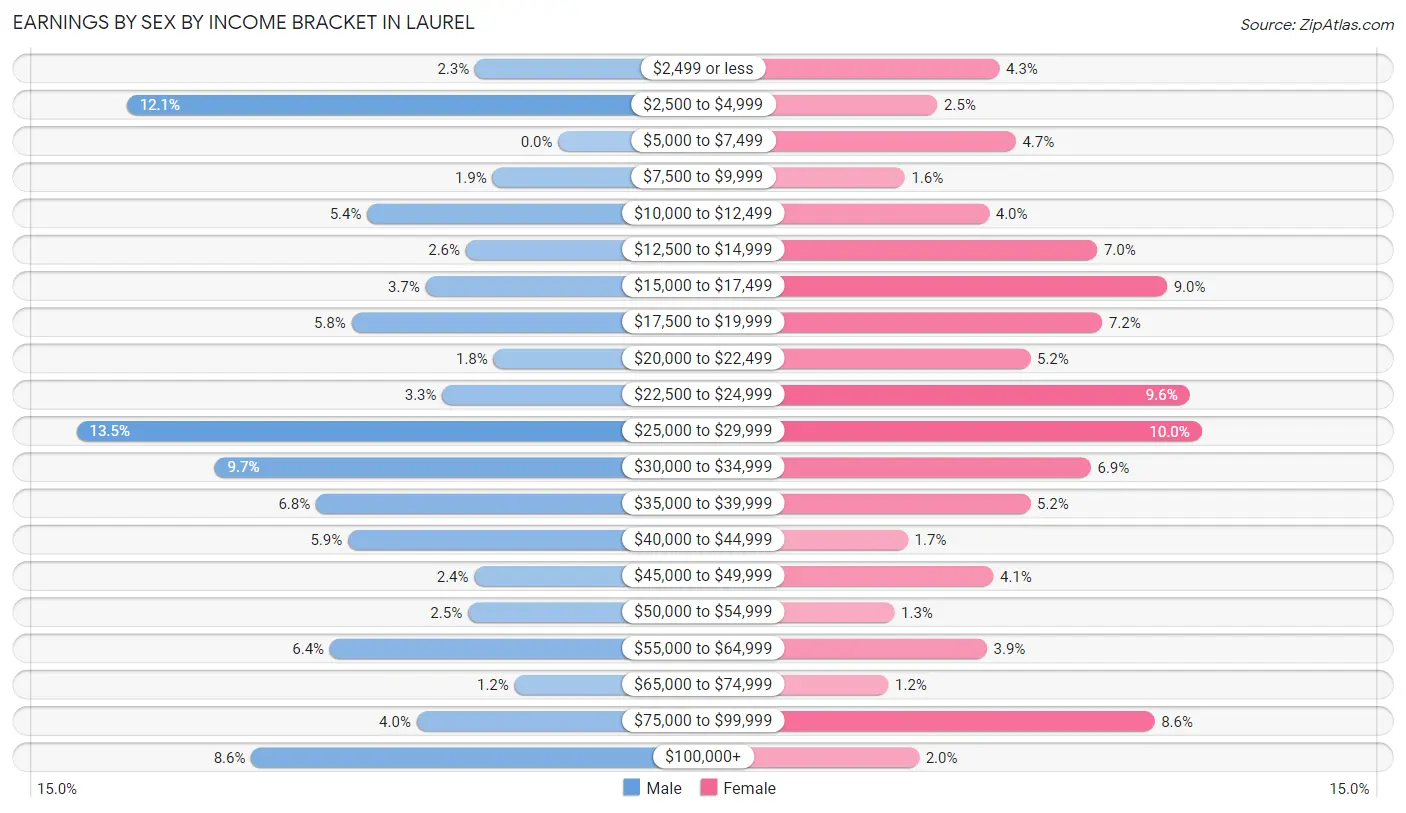
Earnings by Sex by Income Bracket in Laurel
The most common earnings brackets in Laurel are $25,000 to $29,999 for men (527 | 13.5%) and $25,000 to $29,999 for women (345 | 10.0%).
| Income | Male | Female |
| $2,499 or less | 91 (2.3%) | 148 (4.3%) |
| $2,500 to $4,999 | 472 (12.1%) | 88 (2.5%) |
| $5,000 to $7,499 | 0 (0.0%) | 164 (4.7%) |
| $7,500 to $9,999 | 72 (1.8%) | 56 (1.6%) |
| $10,000 to $12,499 | 209 (5.4%) | 138 (4.0%) |
| $12,500 to $14,999 | 101 (2.6%) | 243 (7.0%) |
| $15,000 to $17,499 | 145 (3.7%) | 311 (9.0%) |
| $17,500 to $19,999 | 226 (5.8%) | 248 (7.2%) |
| $20,000 to $22,499 | 71 (1.8%) | 178 (5.1%) |
| $22,500 to $24,999 | 127 (3.3%) | 333 (9.6%) |
| $25,000 to $29,999 | 527 (13.5%) | 345 (10.0%) |
| $30,000 to $34,999 | 376 (9.7%) | 237 (6.9%) |
| $35,000 to $39,999 | 265 (6.8%) | 178 (5.1%) |
| $40,000 to $44,999 | 230 (5.9%) | 59 (1.7%) |
| $45,000 to $49,999 | 92 (2.4%) | 142 (4.1%) |
| $50,000 to $54,999 | 99 (2.5%) | 46 (1.3%) |
| $55,000 to $64,999 | 250 (6.4%) | 136 (3.9%) |
| $65,000 to $74,999 | 48 (1.2%) | 40 (1.2%) |
| $75,000 to $99,999 | 155 (4.0%) | 299 (8.6%) |
| $100,000+ | 336 (8.6%) | 70 (2.0%) |
| Total | 3,892 (100.0%) | 3,459 (100.0%) |
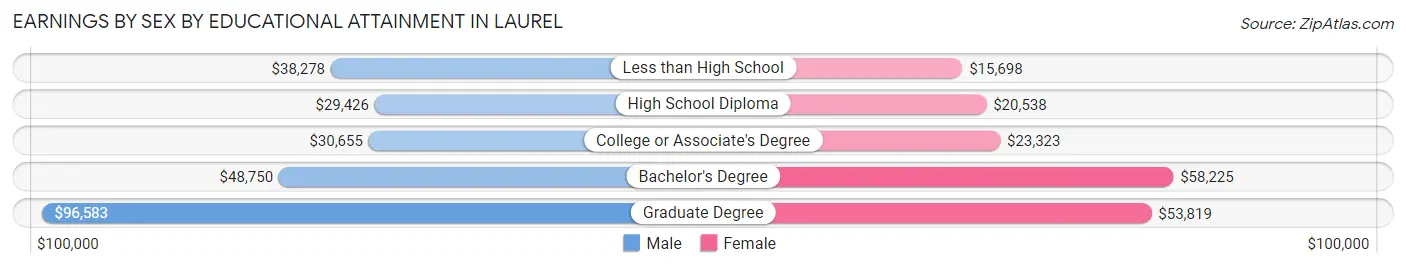
Earnings by Sex by Educational Attainment in Laurel
Average earnings in Laurel are $33,490 for men and $24,878 for women, a difference of 25.7%. Men with an educational attainment of graduate degree enjoy the highest average annual earnings of $96,583, while those with high school diploma education earn the least with $29,426. Women with an educational attainment of bachelor's degree earn the most with the average annual earnings of $58,225, while those with less than high school education have the smallest earnings of $15,698.
| Educational Attainment | Male Income | Female Income |
| Less than High School | $38,278 | $15,698 |
| High School Diploma | $29,426 | $20,538 |
| College or Associate's Degree | $30,655 | $23,323 |
| Bachelor's Degree | $48,750 | $58,225 |
| Graduate Degree | $96,583 | $53,819 |
| Total | $33,490 | $24,878 |
Family Income in Laurel
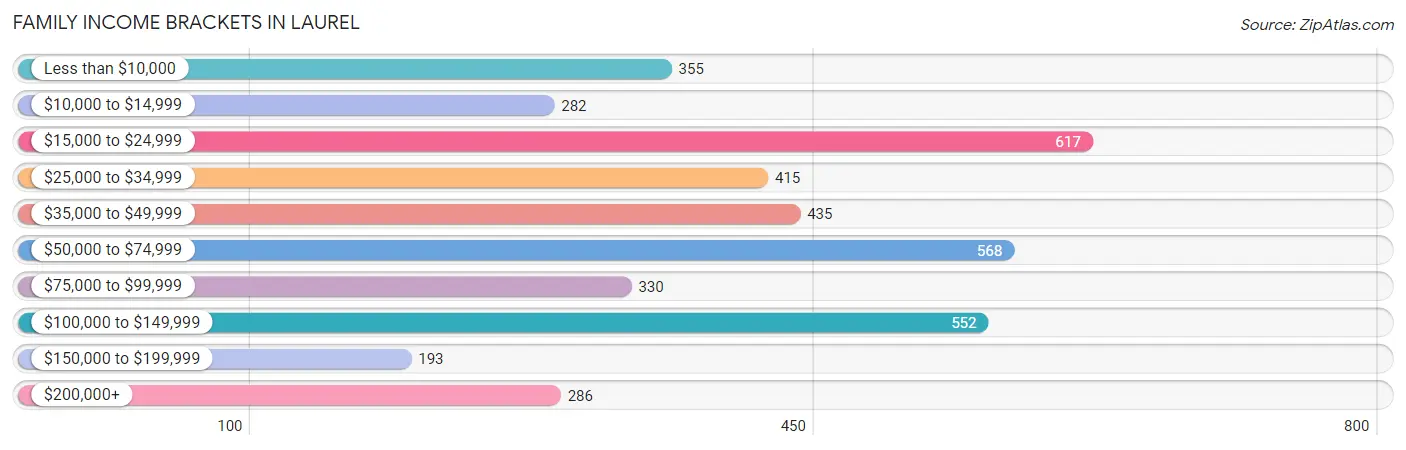
Family Income Brackets in Laurel
According to the Laurel family income data, there are 617 families falling into the $15,000 to $24,999 income range, which is the most common income bracket and makes up 15.3% of all families. Conversely, the $150,000 to $199,999 income bracket is the least frequent group with only 193 families (4.8%) belonging to this category.
| Income Bracket | # Families | % Families |
| Less than $10,000 | 355 | 8.8% |
| $10,000 to $14,999 | 282 | 7.0% |
| $15,000 to $24,999 | 617 | 15.3% |
| $25,000 to $34,999 | 415 | 10.3% |
| $35,000 to $49,999 | 435 | 10.8% |
| $50,000 to $74,999 | 568 | 14.1% |
| $75,000 to $99,999 | 330 | 8.2% |
| $100,000 to $149,999 | 552 | 13.7% |
| $150,000 to $199,999 | 193 | 4.8% |
| $200,000+ | 286 | 7.1% |
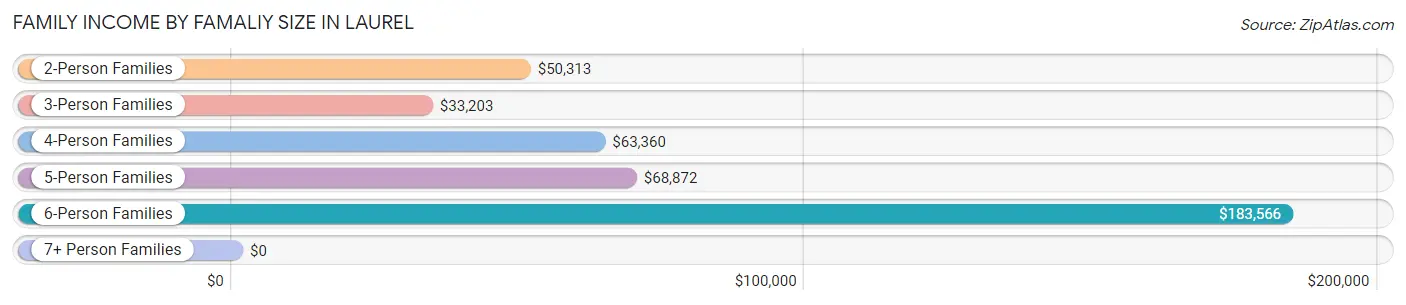
Family Income by Famaliy Size in Laurel
6-person families (115 | 2.9%) account for the highest median family income in Laurel with $183,566 per family, while 6-person families (115 | 2.9%) have the highest median income of $30,594 per family member.
| Income Bracket | # Families | Median Income |
| 2-Person Families | 1,946 (48.3%) | $50,313 |
| 3-Person Families | 1,233 (30.6%) | $33,203 |
| 4-Person Families | 451 (11.2%) | $63,360 |
| 5-Person Families | 269 (6.7%) | $68,872 |
| 6-Person Families | 115 (2.9%) | $183,566 |
| 7+ Person Families | 16 (0.4%) | $0 |
| Total | 4,030 (100.0%) | $44,458 |
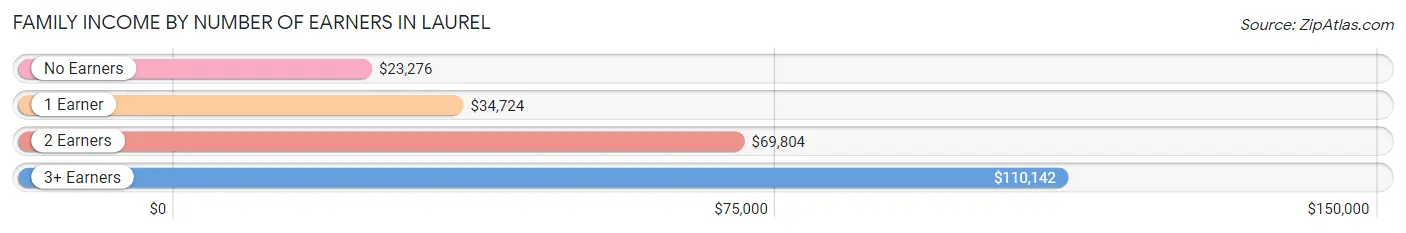
Family Income by Number of Earners in Laurel
The median family income in Laurel is $44,458, with families comprising 3+ earners (301) having the highest median family income of $110,142, while families with no earners (980) have the lowest median family income of $23,276, accounting for 7.5% and 24.3% of families, respectively.
| Number of Earners | # Families | Median Income |
| No Earners | 980 (24.3%) | $23,276 |
| 1 Earner | 1,580 (39.2%) | $34,724 |
| 2 Earners | 1,169 (29.0%) | $69,804 |
| 3+ Earners | 301 (7.5%) | $110,142 |
| Total | 4,030 (100.0%) | $44,458 |
Household Income in Laurel
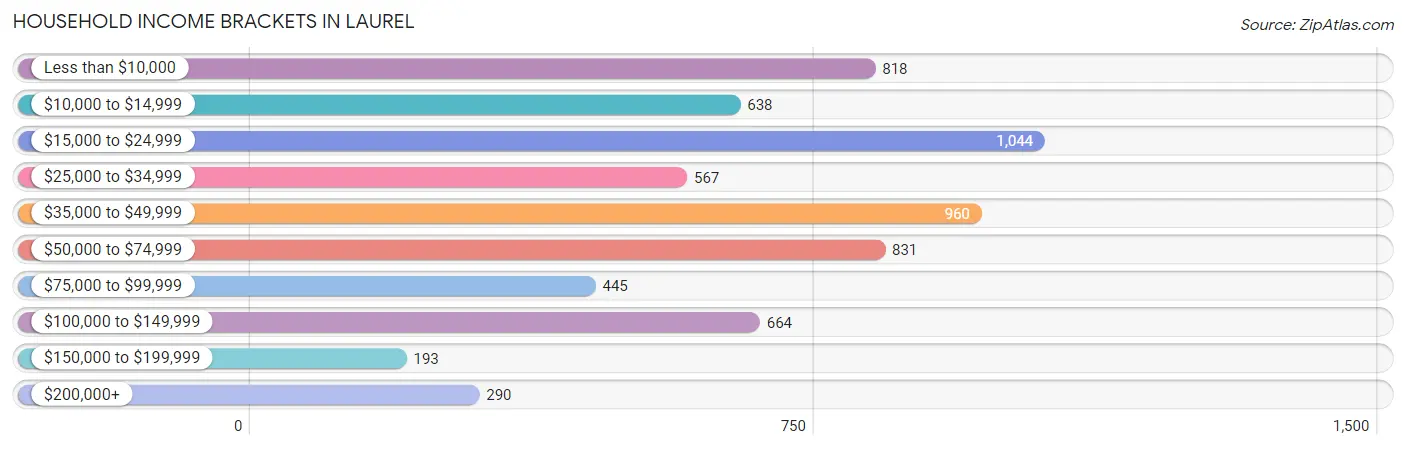
Household Income Brackets in Laurel
With 1,044 households falling in the category, the $15,000 to $24,999 income range is the most frequent in Laurel, accounting for 16.2% of all households. In contrast, only 193 households (3.0%) fall into the $150,000 to $199,999 income bracket, making it the least populous group.
| Income Bracket | # Households | % Households |
| Less than $10,000 | 818 | 12.7% |
| $10,000 to $14,999 | 638 | 9.9% |
| $15,000 to $24,999 | 1,044 | 16.2% |
| $25,000 to $34,999 | 567 | 8.8% |
| $35,000 to $49,999 | 960 | 14.9% |
| $50,000 to $74,999 | 831 | 12.9% |
| $75,000 to $99,999 | 445 | 6.9% |
| $100,000 to $149,999 | 664 | 10.3% |
| $150,000 to $199,999 | 193 | 3.0% |
| $200,000+ | 290 | 4.5% |
Household Income by Householder Age in Laurel
The median household income in Laurel is $36,336, with the highest median household income of $48,480 found in the 15 to 24 years age bracket for the primary householder. A total of 199 households (3.1%) fall into this category. Meanwhile, the 65+ years age bracket for the primary householder has the lowest median household income of $29,143, with 2,128 households (33.0%) in this group.
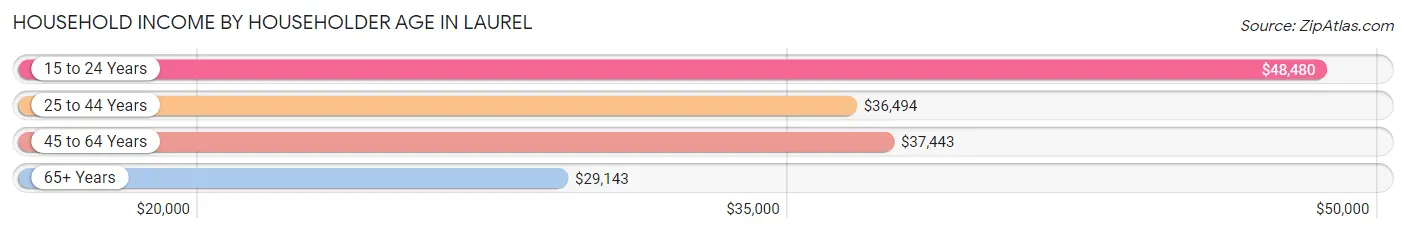
| Income Bracket | # Households | Median Income |
| 15 to 24 Years | 199 (3.1%) | $48,480 |
| 25 to 44 Years | 1,909 (29.6%) | $36,494 |
| 45 to 64 Years | 2,207 (34.3%) | $37,443 |
| 65+ Years | 2,128 (33.0%) | $29,143 |
| Total | 6,443 (100.0%) | $36,336 |
Poverty in Laurel
Income Below Poverty by Sex and Age in Laurel
With 31.3% poverty level for males and 33.8% for females among the residents of Laurel, 15 year old males and 12 to 14 year old females are the most vulnerable to poverty, with 26 males (100.0%) and 179 females (68.6%) in their respective age groups living below the poverty level.
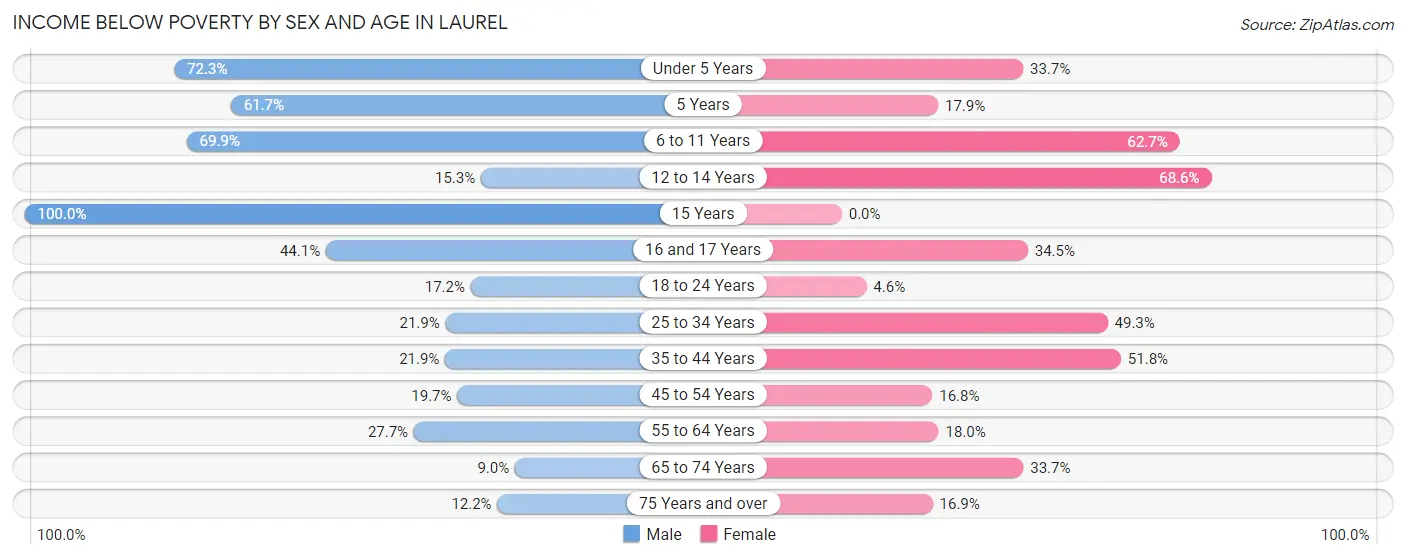
| Age Bracket | Male | Female |
| Under 5 Years | 482 (72.3%) | 104 (33.7%) |
| 5 Years | 187 (61.7%) | 25 (17.9%) |
| 6 to 11 Years | 558 (69.9%) | 556 (62.7%) |
| 12 to 14 Years | 51 (15.3%) | 179 (68.6%) |
| 15 Years | 26 (100.0%) | 0 (0.0%) |
| 16 and 17 Years | 126 (44.1%) | 68 (34.5%) |
| 18 to 24 Years | 134 (17.2%) | 40 (4.6%) |
| 25 to 34 Years | 218 (21.9%) | 633 (49.3%) |
| 35 to 44 Years | 214 (21.9%) | 529 (51.8%) |
| 45 to 54 Years | 154 (19.7%) | 148 (16.8%) |
| 55 to 64 Years | 312 (27.7%) | 208 (18.0%) |
| 65 to 74 Years | 61 (9.0%) | 285 (33.7%) |
| 75 Years and over | 62 (12.2%) | 119 (16.9%) |
| Total | 2,585 (31.3%) | 2,894 (33.8%) |
Income Above Poverty by Sex and Age in Laurel
According to the poverty statistics in Laurel, males aged 65 to 74 years and females aged 18 to 24 years are the age groups that are most secure financially, with 91.0% of males and 95.4% of females in these age groups living above the poverty line.
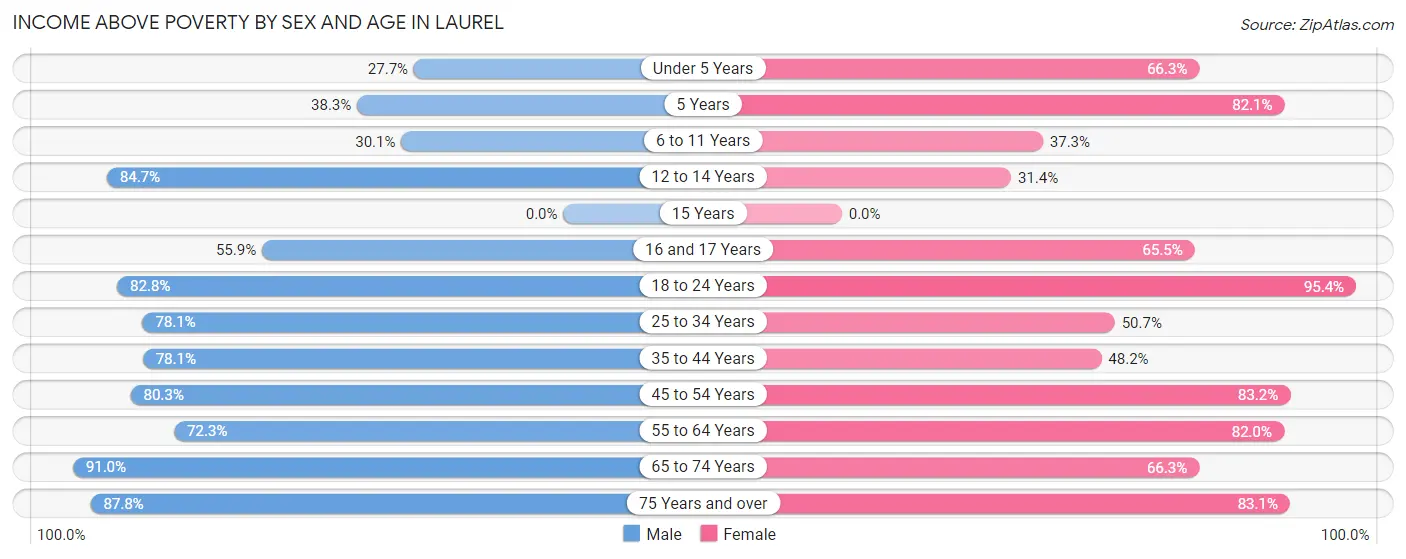
| Age Bracket | Male | Female |
| Under 5 Years | 185 (27.7%) | 205 (66.3%) |
| 5 Years | 116 (38.3%) | 115 (82.1%) |
| 6 to 11 Years | 240 (30.1%) | 331 (37.3%) |
| 12 to 14 Years | 283 (84.7%) | 82 (31.4%) |
| 15 Years | 0 (0.0%) | 0 (0.0%) |
| 16 and 17 Years | 160 (55.9%) | 129 (65.5%) |
| 18 to 24 Years | 646 (82.8%) | 835 (95.4%) |
| 25 to 34 Years | 779 (78.1%) | 650 (50.7%) |
| 35 to 44 Years | 762 (78.1%) | 492 (48.2%) |
| 45 to 54 Years | 629 (80.3%) | 733 (83.2%) |
| 55 to 64 Years | 813 (72.3%) | 950 (82.0%) |
| 65 to 74 Years | 620 (91.0%) | 561 (66.3%) |
| 75 Years and over | 445 (87.8%) | 587 (83.1%) |
| Total | 5,678 (68.7%) | 5,670 (66.2%) |
Income Below Poverty Among Married-Couple Families in Laurel
The poverty statistics for married-couple families in Laurel show that 5.9% or 125 of the total 2,105 families live below the poverty line. Families with 3 or 4 children have the highest poverty rate of 12.2%, comprising of 32 families. On the other hand, families with 5 or more children have the lowest poverty rate of 0.0%, which includes 0 families.
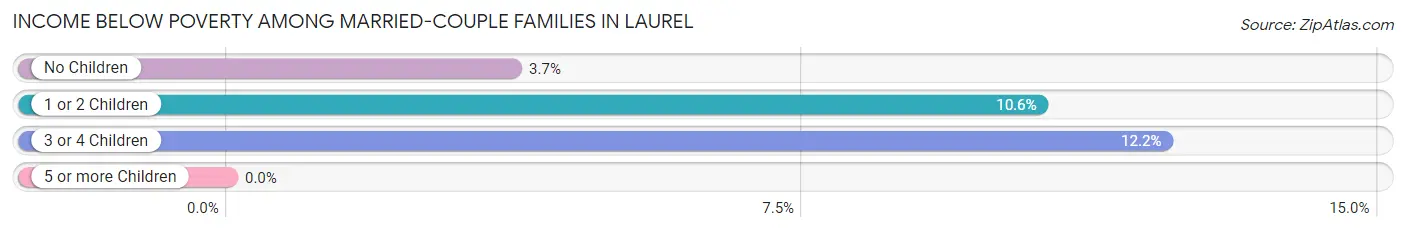
| Children | Above Poverty | Below Poverty |
| No Children | 1,426 (96.3%) | 55 (3.7%) |
| 1 or 2 Children | 321 (89.4%) | 38 (10.6%) |
| 3 or 4 Children | 230 (87.8%) | 32 (12.2%) |
| 5 or more Children | 3 (100.0%) | 0 (0.0%) |
| Total | 1,980 (94.1%) | 125 (5.9%) |
Income Below Poverty Among Single-Parent Households in Laurel
According to the poverty data in Laurel, 8.3% or 30 single-father households and 56.4% or 882 single-mother households are living below the poverty line. Among single-father households, those with no children have the highest poverty rate, with 30 households (10.0%) experiencing poverty. Likewise, among single-mother households, those with 3 or 4 children have the highest poverty rate, with 95 households (100.0%) falling below the poverty line.
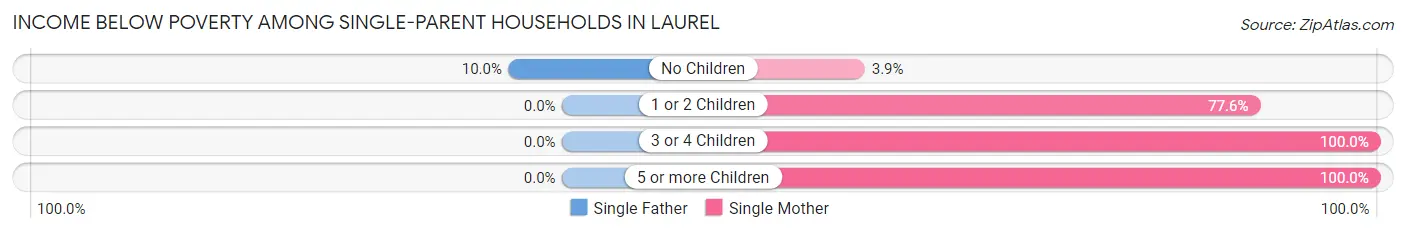
| Children | Single Father | Single Mother |
| No Children | 30 (10.0%) | 19 (3.9%) |
| 1 or 2 Children | 0 (0.0%) | 755 (77.6%) |
| 3 or 4 Children | 0 (0.0%) | 95 (100.0%) |
| 5 or more Children | 0 (0.0%) | 13 (100.0%) |
| Total | 30 (8.3%) | 882 (56.4%) |
Income Below Poverty Among Married-Couple vs Single-Parent Households in Laurel
The poverty data for Laurel shows that 125 of the married-couple family households (5.9%) and 912 of the single-parent households (47.4%) are living below the poverty level. Within the married-couple family households, those with 3 or 4 children have the highest poverty rate, with 32 households (12.2%) falling below the poverty line. Among the single-parent households, those with 3 or 4 children have the highest poverty rate, with 95 household (100.0%) living below poverty.
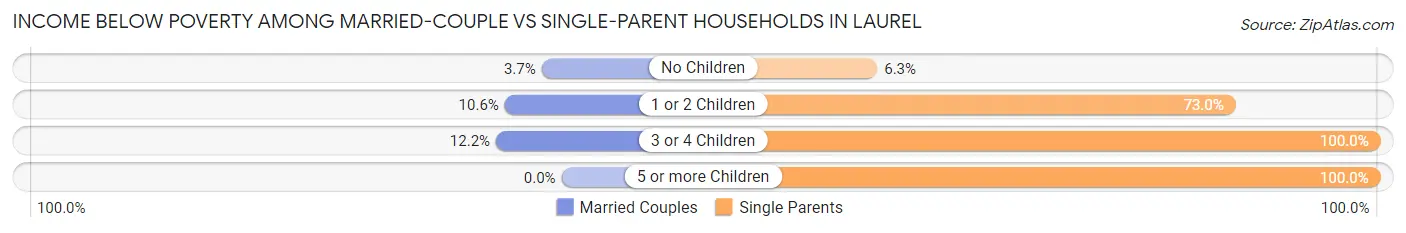
| Children | Married-Couple Families | Single-Parent Households |
| No Children | 55 (3.7%) | 49 (6.3%) |
| 1 or 2 Children | 38 (10.6%) | 755 (73.0%) |
| 3 or 4 Children | 32 (12.2%) | 95 (100.0%) |
| 5 or more Children | 0 (0.0%) | 13 (100.0%) |
| Total | 125 (5.9%) | 912 (47.4%) |
Race in Laurel
The most populous races in Laurel are Black / African American (11,297 | 65.5%), White / Caucasian (5,391 | 31.3%), and Hispanic or Latino (653 | 3.8%).
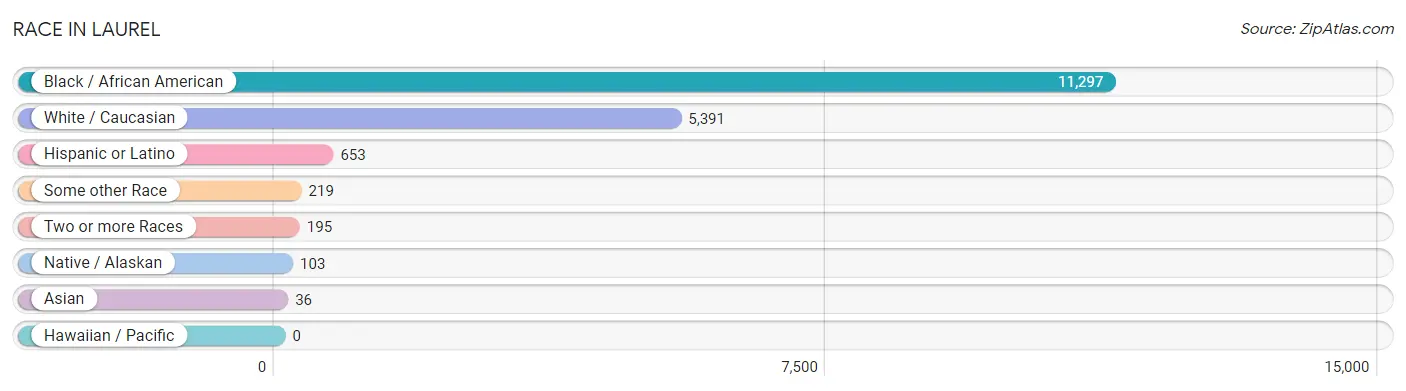
| Race | # Population | % Population |
| Asian | 36 | 0.2% |
| Black / African American | 11,297 | 65.5% |
| Hawaiian / Pacific | 0 | 0.0% |
| Hispanic or Latino | 653 | 3.8% |
| Native / Alaskan | 103 | 0.6% |
| White / Caucasian | 5,391 | 31.3% |
| Two or more Races | 195 | 1.1% |
| Some other Race | 219 | 1.3% |
| Total | 17,241 | 100.0% |
Ancestry in Laurel
The most populous ancestries reported in Laurel are American (2,015 | 11.7%), English (827 | 4.8%), Irish (768 | 4.4%), Mexican (532 | 3.1%), and German (396 | 2.3%), together accounting for 26.3% of all Laurel residents.
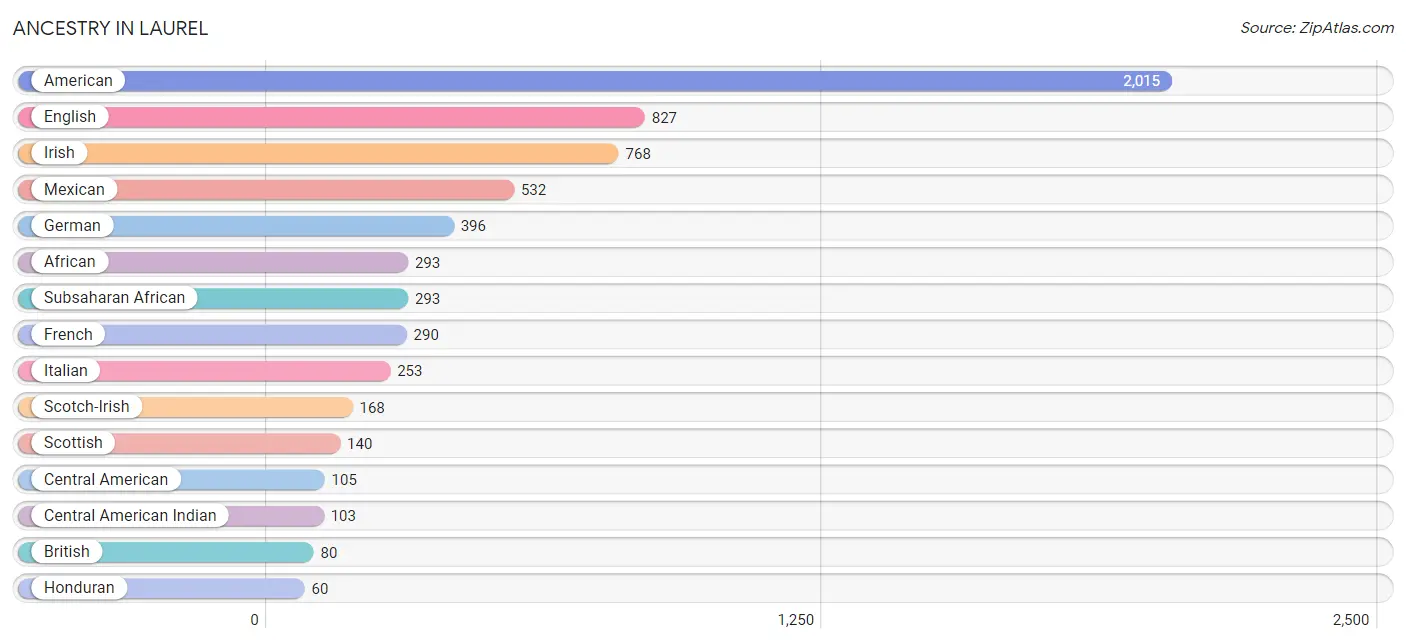
| Ancestry | # Population | % Population |
| African | 293 | 1.7% |
| American | 2,015 | 11.7% |
| Arab | 30 | 0.2% |
| Belgian | 4 | 0.0% |
| British | 80 | 0.5% |
| Central American | 105 | 0.6% |
| Central American Indian | 103 | 0.6% |
| Cherokee | 15 | 0.1% |
| Danish | 3 | 0.0% |
| Dutch | 5 | 0.0% |
| Egyptian | 30 | 0.2% |
| English | 827 | 4.8% |
| European | 16 | 0.1% |
| French | 290 | 1.7% |
| French Canadian | 27 | 0.2% |
| German | 396 | 2.3% |
| Guatemalan | 36 | 0.2% |
| Honduran | 60 | 0.4% |
| Hungarian | 7 | 0.0% |
| Indian (Asian) | 14 | 0.1% |
| Irish | 768 | 4.4% |
| Italian | 253 | 1.5% |
| Korean | 9 | 0.1% |
| Mexican | 532 | 3.1% |
| Panamanian | 9 | 0.1% |
| Pennsylvania German | 12 | 0.1% |
| Scotch-Irish | 168 | 1.0% |
| Scottish | 140 | 0.8% |
| Spanish | 16 | 0.1% |
| Subsaharan African | 293 | 1.7% |
| Thai | 13 | 0.1% |
| Welsh | 37 | 0.2% | View All 32 Rows |
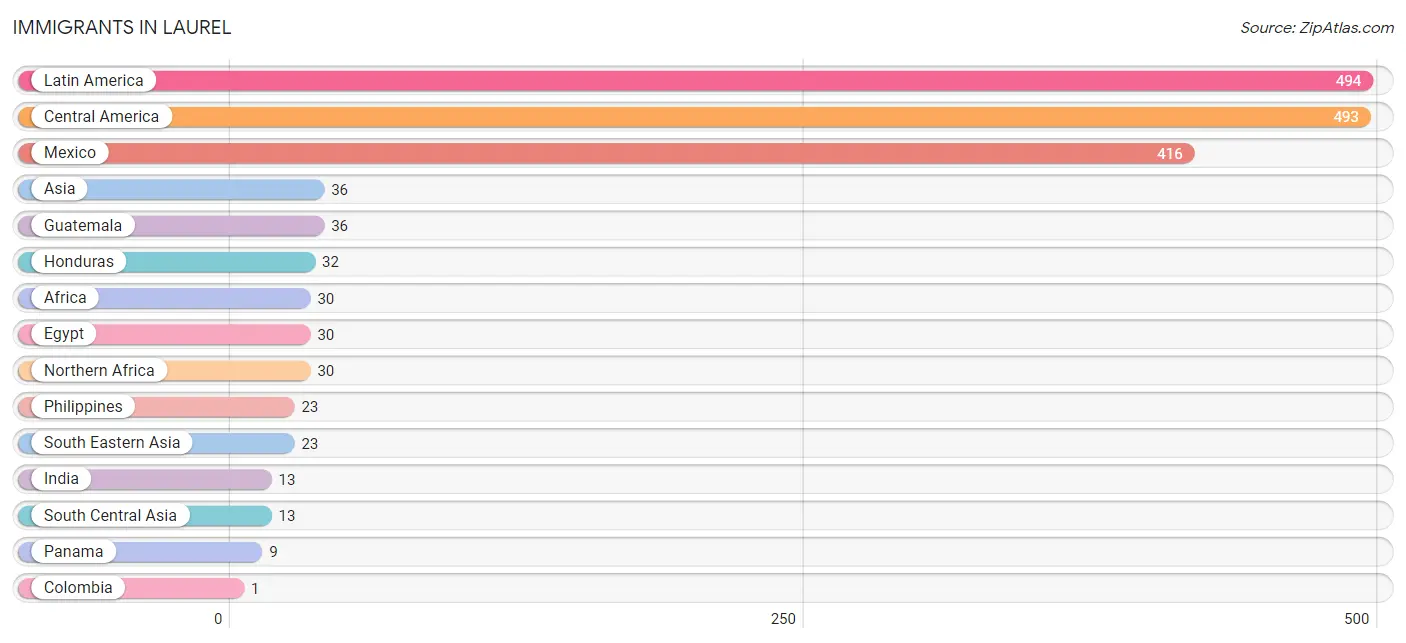
Immigrants in Laurel
The most numerous immigrant groups reported in Laurel came from Latin America (494 | 2.9%), Central America (493 | 2.9%), Mexico (416 | 2.4%), Asia (36 | 0.2%), and Guatemala (36 | 0.2%), together accounting for 8.6% of all Laurel residents.
| Immigration Origin | # Population | % Population |
| Africa | 30 | 0.2% |
| Asia | 36 | 0.2% |
| Central America | 493 | 2.9% |
| Colombia | 1 | 0.0% |
| Egypt | 30 | 0.2% |
| Guatemala | 36 | 0.2% |
| Honduras | 32 | 0.2% |
| India | 13 | 0.1% |
| Latin America | 494 | 2.9% |
| Mexico | 416 | 2.4% |
| Northern Africa | 30 | 0.2% |
| Panama | 9 | 0.1% |
| Philippines | 23 | 0.1% |
| South America | 1 | 0.0% |
| South Central Asia | 13 | 0.1% |
| South Eastern Asia | 23 | 0.1% | View All 16 Rows |
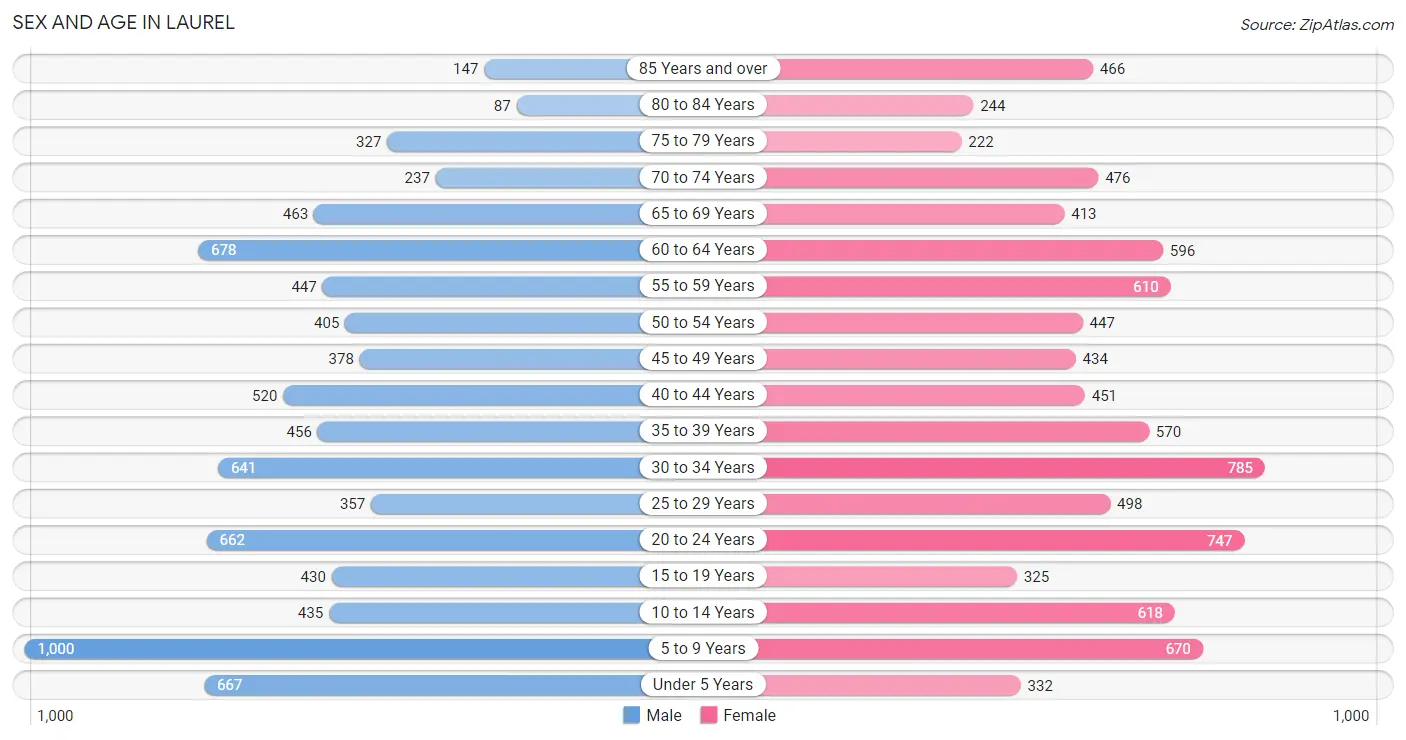
Sex and Age in Laurel
Sex and Age in Laurel
The most populous age groups in Laurel are 5 to 9 Years (1,000 | 12.0%) for men and 30 to 34 Years (785 | 8.8%) for women.
| Age Bracket | Male | Female |
| Under 5 Years | 667 (8.0%) | 332 (3.7%) |
| 5 to 9 Years | 1,000 (12.0%) | 670 (7.5%) |
| 10 to 14 Years | 435 (5.2%) | 618 (6.9%) |
| 15 to 19 Years | 430 (5.2%) | 325 (3.6%) |
| 20 to 24 Years | 662 (7.9%) | 747 (8.4%) |
| 25 to 29 Years | 357 (4.3%) | 498 (5.6%) |
| 30 to 34 Years | 641 (7.7%) | 785 (8.8%) |
| 35 to 39 Years | 456 (5.5%) | 570 (6.4%) |
| 40 to 44 Years | 520 (6.2%) | 451 (5.1%) |
| 45 to 49 Years | 378 (4.5%) | 434 (4.9%) |
| 50 to 54 Years | 405 (4.9%) | 447 (5.0%) |
| 55 to 59 Years | 447 (5.4%) | 610 (6.9%) |
| 60 to 64 Years | 678 (8.1%) | 596 (6.7%) |
| 65 to 69 Years | 463 (5.6%) | 413 (4.6%) |
| 70 to 74 Years | 237 (2.8%) | 476 (5.3%) |
| 75 to 79 Years | 327 (3.9%) | 222 (2.5%) |
| 80 to 84 Years | 87 (1.0%) | 244 (2.7%) |
| 85 Years and over | 147 (1.8%) | 466 (5.2%) |
| Total | 8,337 (100.0%) | 8,904 (100.0%) |
Families and Households in Laurel
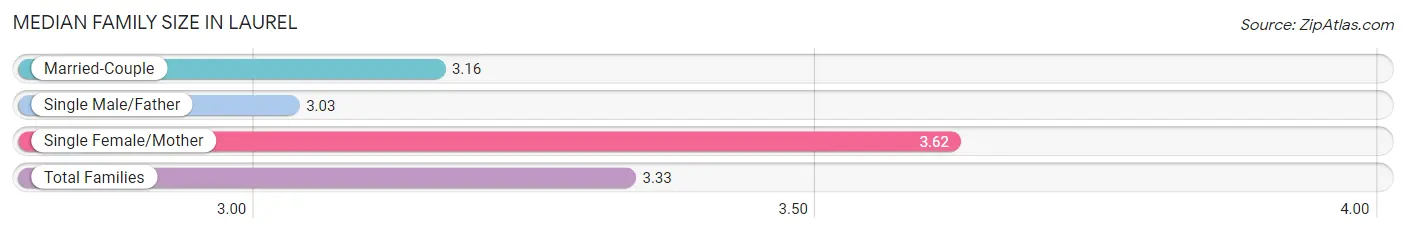
Median Family Size in Laurel
The median family size in Laurel is 3.33 persons per family, with single female/mother families (1,564 | 38.8%) accounting for the largest median family size of 3.62 persons per family. On the other hand, single male/father families (361 | 9.0%) represent the smallest median family size with 3.03 persons per family.
| Family Type | # Families | Family Size |
| Married-Couple | 2,105 (52.2%) | 3.16 |
| Single Male/Father | 361 (9.0%) | 3.03 |
| Single Female/Mother | 1,564 (38.8%) | 3.62 |
| Total Families | 4,030 (100.0%) | 3.33 |
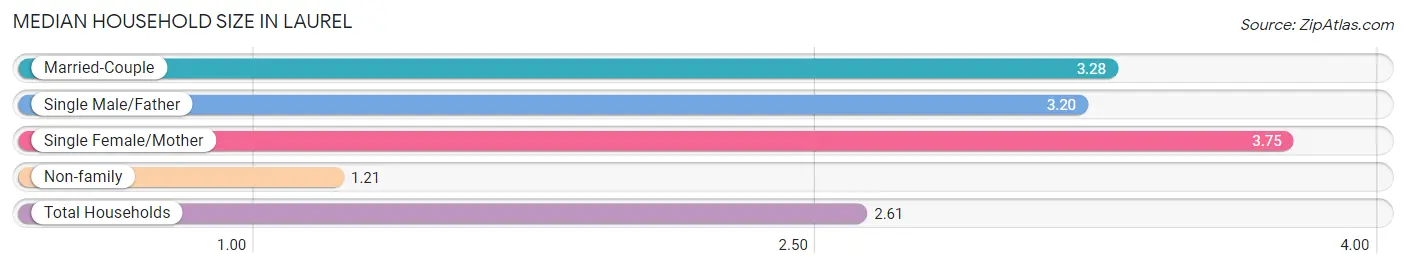
Median Household Size in Laurel
The median household size in Laurel is 2.61 persons per household, with single female/mother households (1,564 | 24.3%) accounting for the largest median household size of 3.75 persons per household. non-family households (2,413 | 37.4%) represent the smallest median household size with 1.21 persons per household.
| Household Type | # Households | Household Size |
| Married-Couple | 2,105 (32.7%) | 3.28 |
| Single Male/Father | 361 (5.6%) | 3.20 |
| Single Female/Mother | 1,564 (24.3%) | 3.75 |
| Non-family | 2,413 (37.4%) | 1.21 |
| Total Households | 6,443 (100.0%) | 2.61 |
Household Size by Marriage Status in Laurel
Out of a total of 6,443 households in Laurel, 4,030 (62.5%) are family households, while 2,413 (37.4%) are nonfamily households. The most numerous type of family households are 2-person households, comprising 1,849, and the most common type of nonfamily households are 1-person households, comprising 2,086.
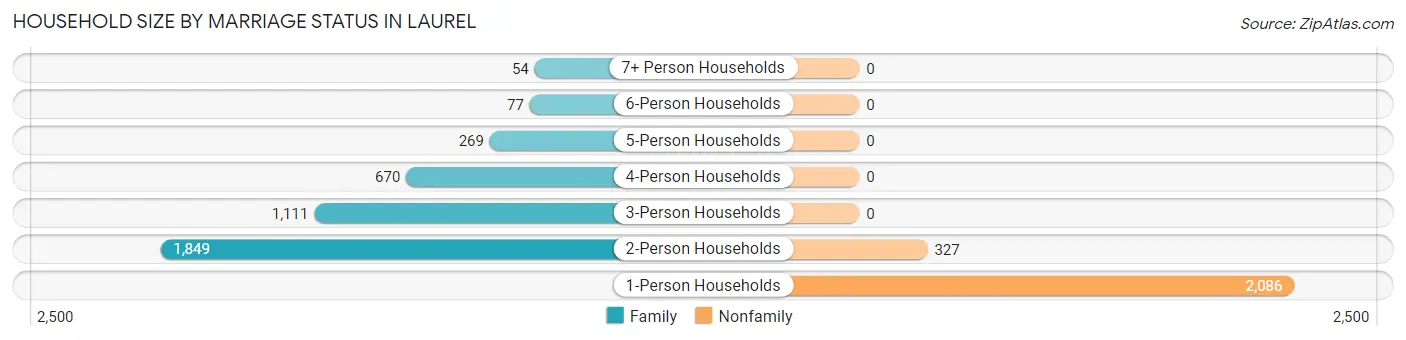
| Household Size | Family Households | Nonfamily Households |
| 1-Person Households | - | 2,086 (32.4%) |
| 2-Person Households | 1,849 (28.7%) | 327 (5.1%) |
| 3-Person Households | 1,111 (17.2%) | 0 (0.0%) |
| 4-Person Households | 670 (10.4%) | 0 (0.0%) |
| 5-Person Households | 269 (4.2%) | 0 (0.0%) |
| 6-Person Households | 77 (1.2%) | 0 (0.0%) |
| 7+ Person Households | 54 (0.8%) | 0 (0.0%) |
| Total | 4,030 (62.5%) | 2,413 (37.4%) |
Female Fertility in Laurel
Fertility by Age in Laurel
Average fertility rate in Laurel is 81.0 births per 1,000 women. Women in the age bracket of 20 to 34 years have the highest fertility rate with 140.0 births per 1,000 women. Women in the age bracket of 20 to 34 years acount for 91.0% of all women with births.
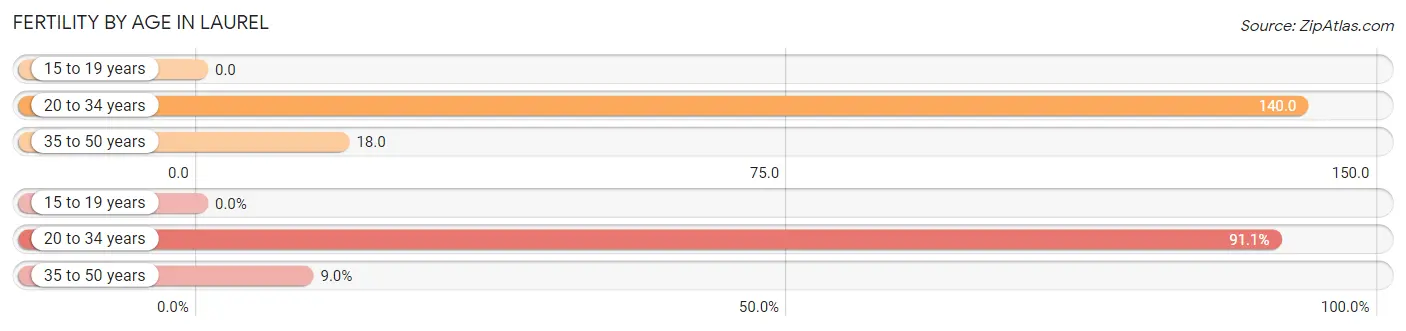
| Age Bracket | Women with Births | Births / 1,000 Women |
| 15 to 19 years | 0 (0.0%) | 0.0 |
| 20 to 34 years | 285 (91.0%) | 140.0 |
| 35 to 50 years | 28 (8.9%) | 18.0 |
| Total | 313 (100.0%) | 81.0 |
Fertility by Age by Marriage Status in Laurel
31.9% of women with births (313) in Laurel are married. The highest percentage of unmarried women with births falls into 20 to 34 years age bracket with 74.7% of them unmarried at the time of birth, while the lowest percentage of unmarried women with births belong to 35 to 50 years age bracket with 0.0% of them unmarried.
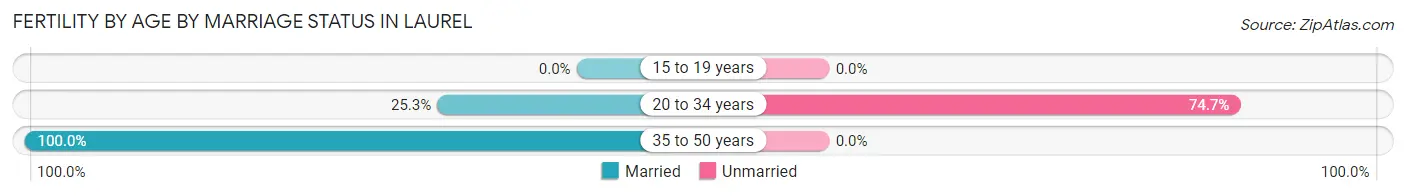
| Age Bracket | Married | Unmarried |
| 15 to 19 years | 0 (0.0%) | 0 (0.0%) |
| 20 to 34 years | 72 (25.3%) | 213 (74.7%) |
| 35 to 50 years | 28 (100.0%) | 0 (0.0%) |
| Total | 100 (32.0%) | 213 (68.0%) |
Fertility by Education in Laurel
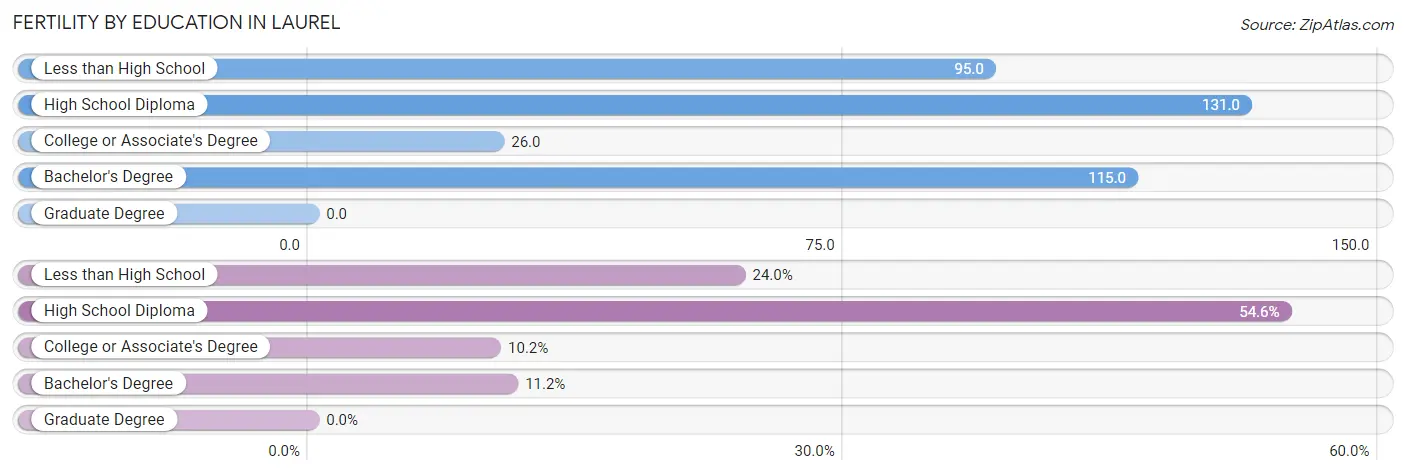
| Educational Attainment | Women with Births | Births / 1,000 Women |
| Less than High School | 75 (24.0%) | 95.0 |
| High School Diploma | 171 (54.6%) | 131.0 |
| College or Associate's Degree | 32 (10.2%) | 26.0 |
| Bachelor's Degree | 35 (11.2%) | 115.0 |
| Graduate Degree | 0 (0.0%) | 0.0 |
| Total | 313 (100.0%) | 81.0 |
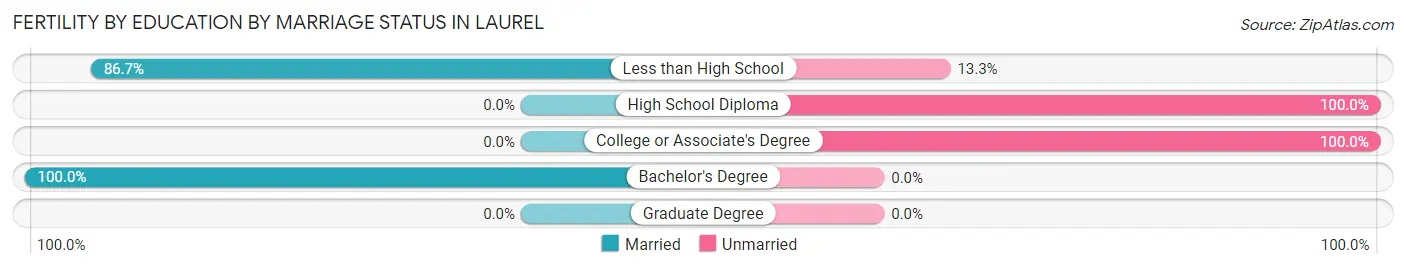
Fertility by Education by Marriage Status in Laurel
68.0% of women with births in Laurel are unmarried. Women with the educational attainment of bachelor's degree are most likely to be married with 100.0% of them married at childbirth, while women with the educational attainment of high school diploma are least likely to be married with 100.0% of them unmarried at childbirth.
| Educational Attainment | Married | Unmarried |
| Less than High School | 65 (86.7%) | 10 (13.3%) |
| High School Diploma | 0 (0.0%) | 171 (100.0%) |
| College or Associate's Degree | 0 (0.0%) | 32 (100.0%) |
| Bachelor's Degree | 35 (100.0%) | 0 (0.0%) |
| Graduate Degree | 0 (0.0%) | 0 (0.0%) |
| Total | 100 (32.0%) | 213 (68.0%) |
Employment Characteristics in Laurel
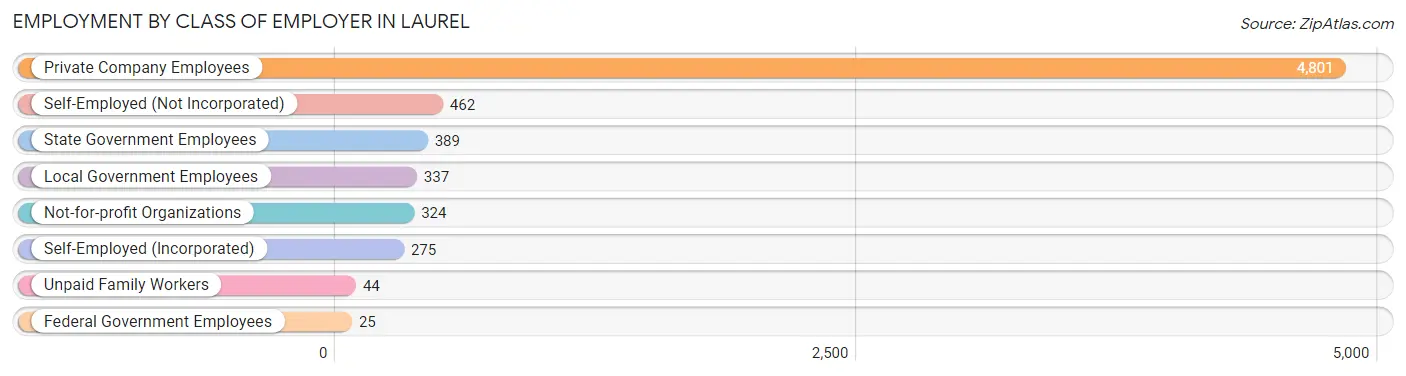
Employment by Class of Employer in Laurel
Among the 6,657 employed individuals in Laurel, private company employees (4,801 | 72.1%), self-employed (not incorporated) (462 | 6.9%), and state government employees (389 | 5.8%) make up the most common classes of employment.
| Employer Class | # Employees | % Employees |
| Private Company Employees | 4,801 | 72.1% |
| Self-Employed (Incorporated) | 275 | 4.1% |
| Self-Employed (Not Incorporated) | 462 | 6.9% |
| Not-for-profit Organizations | 324 | 4.9% |
| Local Government Employees | 337 | 5.1% |
| State Government Employees | 389 | 5.8% |
| Federal Government Employees | 25 | 0.4% |
| Unpaid Family Workers | 44 | 0.7% |
| Total | 6,657 | 100.0% |
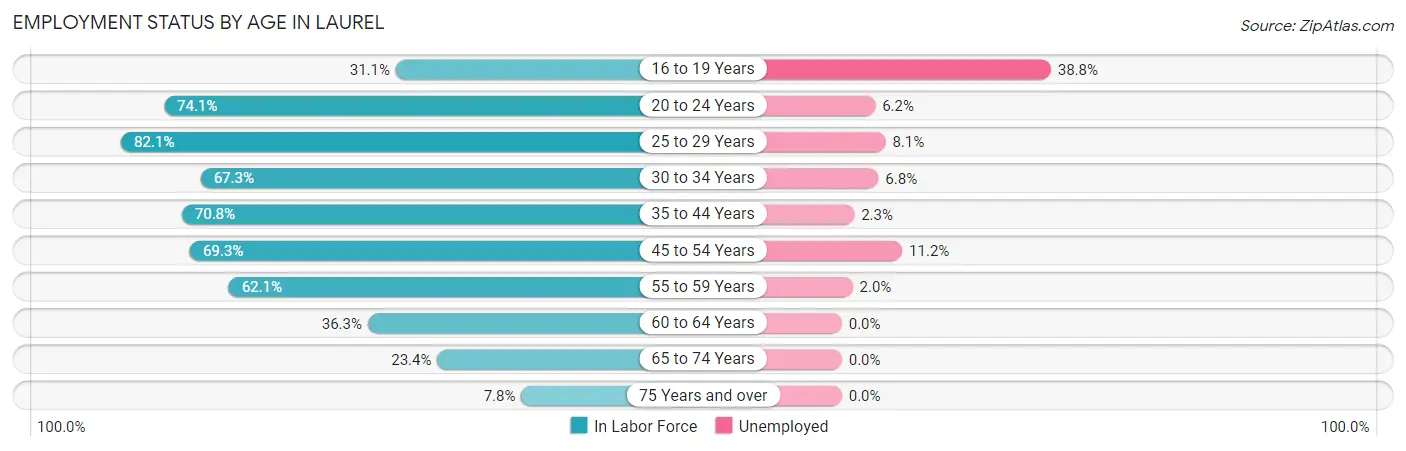
Employment Status by Age in Laurel
According to the labor force statistics for Laurel, out of the total population over 16 years of age (13,493), 52.7% or 7,111 individuals are in the labor force, with 6.3% or 448 of them unemployed. The age group with the highest labor force participation rate is 25 to 29 years, with 82.1% or 702 individuals in the labor force. Within the labor force, the 16 to 19 years age range has the highest percentage of unemployed individuals, with 38.8% or 88 of them being unemployed.
| Age Bracket | In Labor Force | Unemployed |
| 16 to 19 Years | 227 (31.1%) | 88 (38.8%) |
| 20 to 24 Years | 1,044 (74.1%) | 65 (6.2%) |
| 25 to 29 Years | 702 (82.1%) | 57 (8.1%) |
| 30 to 34 Years | 960 (67.3%) | 65 (6.8%) |
| 35 to 44 Years | 1,414 (70.8%) | 33 (2.3%) |
| 45 to 54 Years | 1,153 (69.3%) | 129 (11.2%) |
| 55 to 59 Years | 656 (62.1%) | 13 (2.0%) |
| 60 to 64 Years | 462 (36.3%) | 0 (0.0%) |
| 65 to 74 Years | 372 (23.4%) | 0 (0.0%) |
| 75 Years and over | 116 (7.8%) | 0 (0.0%) |
| Total | 7,111 (52.7%) | 448 (6.3%) |
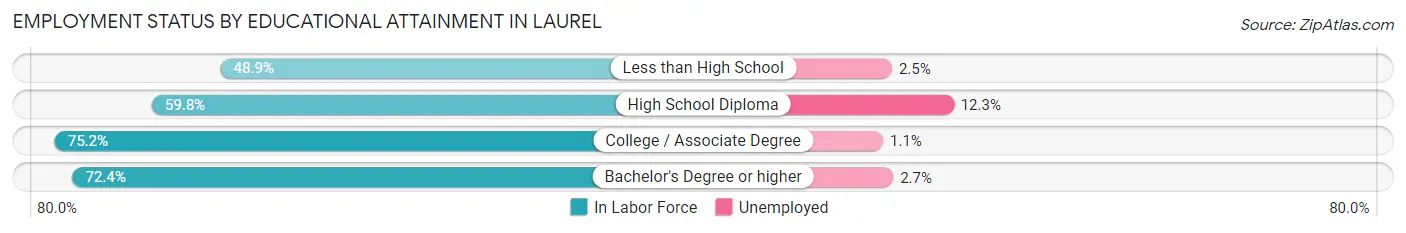
Employment Status by Educational Attainment in Laurel
According to labor force statistics for Laurel, 64.6% of individuals (5,344) out of the total population between 25 and 64 years of age (8,273) are in the labor force, with 5.5% or 294 of them being unemployed. The group with the highest labor force participation rate are those with the educational attainment of college / associate degree, with 75.2% or 1,654 individuals in the labor force. Within the labor force, individuals with high school diploma education have the highest percentage of unemployment, with 12.3% or 230 of them being unemployed.
| Educational Attainment | In Labor Force | Unemployed |
| Less than High School | 647 (48.9%) | 33 (2.5%) |
| High School Diploma | 1,866 (59.8%) | 384 (12.3%) |
| College / Associate Degree | 1,654 (75.2%) | 24 (1.1%) |
| Bachelor's Degree or higher | 1,179 (72.4%) | 44 (2.7%) |
| Total | 5,344 (64.6%) | 455 (5.5%) |
Employment Occupations by Sex in Laurel
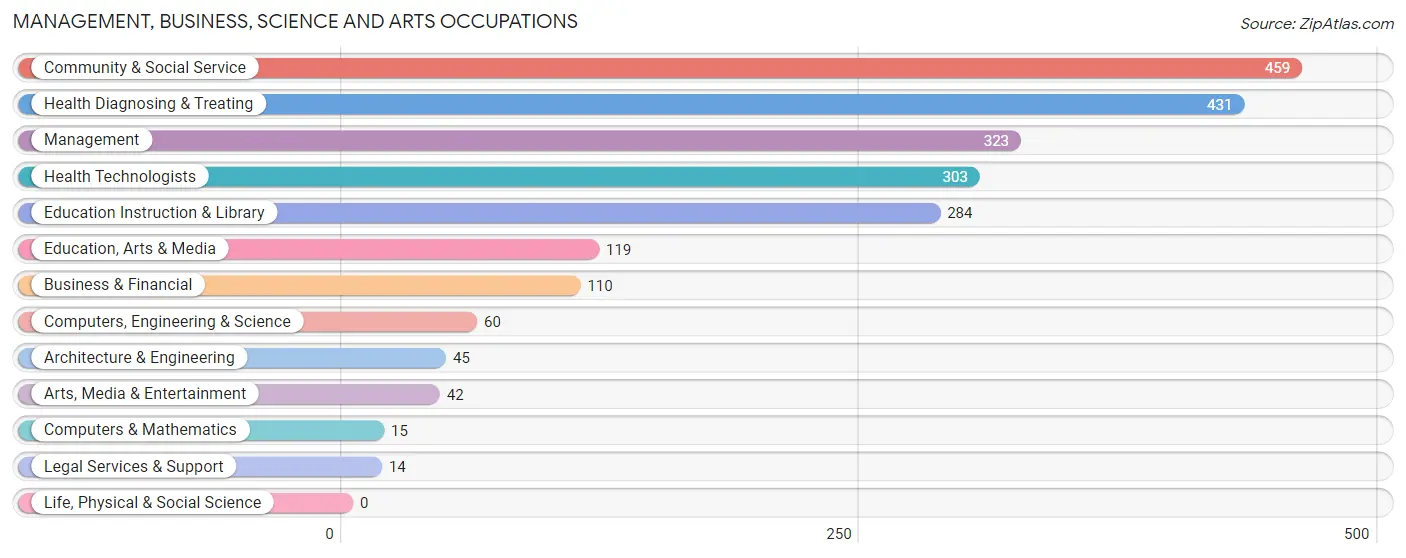
Management, Business, Science and Arts Occupations
The most common Management, Business, Science and Arts occupations in Laurel are Community & Social Service (459 | 6.9%), Health Diagnosing & Treating (431 | 6.5%), Management (323 | 4.9%), Health Technologists (303 | 4.5%), and Education Instruction & Library (284 | 4.3%).
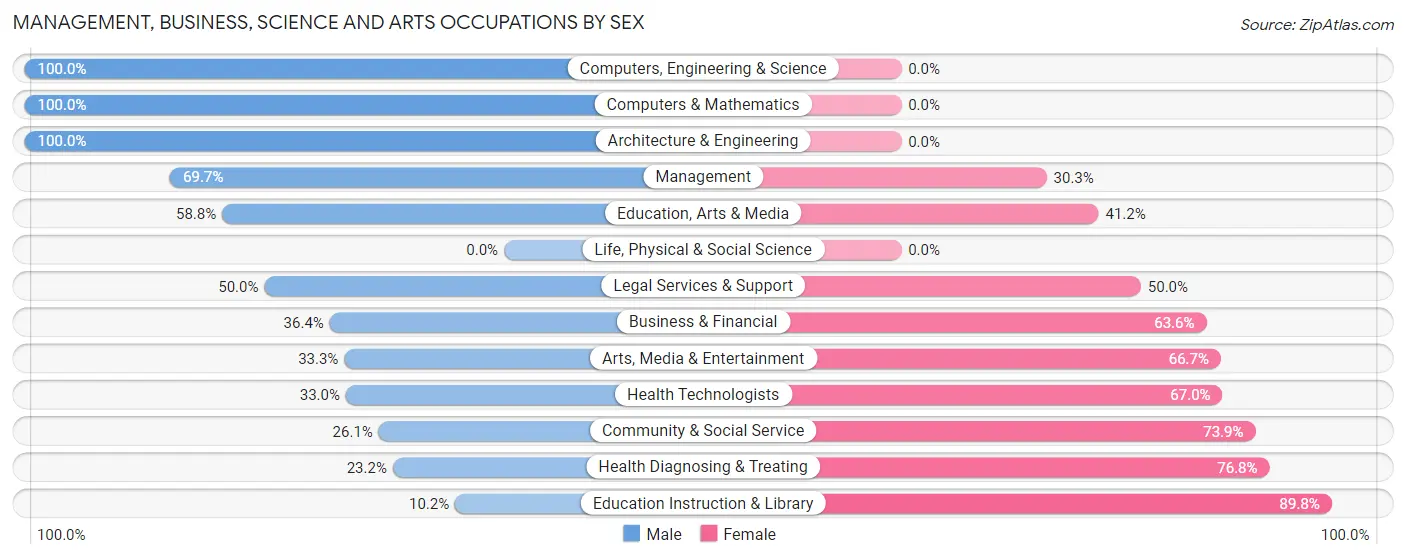
Management, Business, Science and Arts Occupations by Sex
Within the Management, Business, Science and Arts occupations in Laurel, the most male-oriented occupations are Computers, Engineering & Science (100.0%), Computers & Mathematics (100.0%), and Architecture & Engineering (100.0%), while the most female-oriented occupations are Education Instruction & Library (89.8%), Health Diagnosing & Treating (76.8%), and Community & Social Service (73.9%).
| Occupation | Male | Female |
| Management | 225 (69.7%) | 98 (30.3%) |
| Business & Financial | 40 (36.4%) | 70 (63.6%) |
| Computers, Engineering & Science | 60 (100.0%) | 0 (0.0%) |
| Computers & Mathematics | 15 (100.0%) | 0 (0.0%) |
| Architecture & Engineering | 45 (100.0%) | 0 (0.0%) |
| Life, Physical & Social Science | 0 (0.0%) | 0 (0.0%) |
| Community & Social Service | 120 (26.1%) | 339 (73.9%) |
| Education, Arts & Media | 70 (58.8%) | 49 (41.2%) |
| Legal Services & Support | 7 (50.0%) | 7 (50.0%) |
| Education Instruction & Library | 29 (10.2%) | 255 (89.8%) |
| Arts, Media & Entertainment | 14 (33.3%) | 28 (66.7%) |
| Health Diagnosing & Treating | 100 (23.2%) | 331 (76.8%) |
| Health Technologists | 100 (33.0%) | 203 (67.0%) |
| Total (Category) | 545 (39.4%) | 838 (60.6%) |
| Total (Overall) | 3,495 (52.5%) | 3,162 (47.5%) |
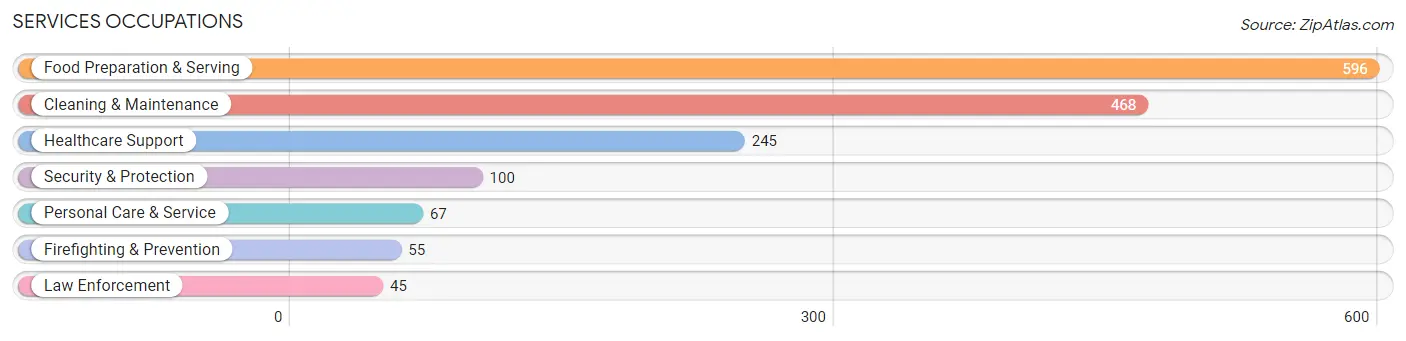
Services Occupations
The most common Services occupations in Laurel are Food Preparation & Serving (596 | 8.9%), Cleaning & Maintenance (468 | 7.0%), Healthcare Support (245 | 3.7%), Security & Protection (100 | 1.5%), and Personal Care & Service (67 | 1.0%).
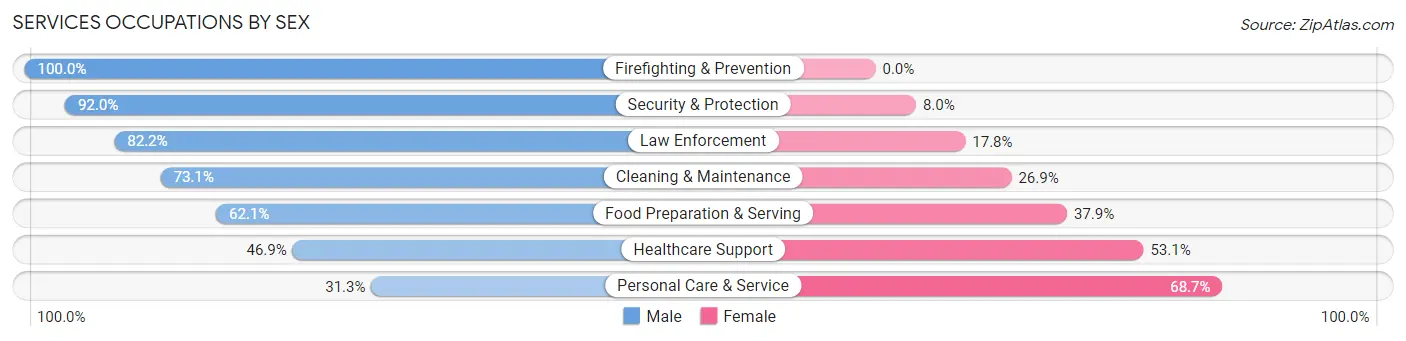
Services Occupations by Sex
Within the Services occupations in Laurel, the most male-oriented occupations are Firefighting & Prevention (100.0%), Security & Protection (92.0%), and Law Enforcement (82.2%), while the most female-oriented occupations are Personal Care & Service (68.7%), Healthcare Support (53.1%), and Food Preparation & Serving (37.9%).
| Occupation | Male | Female |
| Healthcare Support | 115 (46.9%) | 130 (53.1%) |
| Security & Protection | 92 (92.0%) | 8 (8.0%) |
| Firefighting & Prevention | 55 (100.0%) | 0 (0.0%) |
| Law Enforcement | 37 (82.2%) | 8 (17.8%) |
| Food Preparation & Serving | 370 (62.1%) | 226 (37.9%) |
| Cleaning & Maintenance | 342 (73.1%) | 126 (26.9%) |
| Personal Care & Service | 21 (31.3%) | 46 (68.7%) |
| Total (Category) | 940 (63.7%) | 536 (36.3%) |
| Total (Overall) | 3,495 (52.5%) | 3,162 (47.5%) |
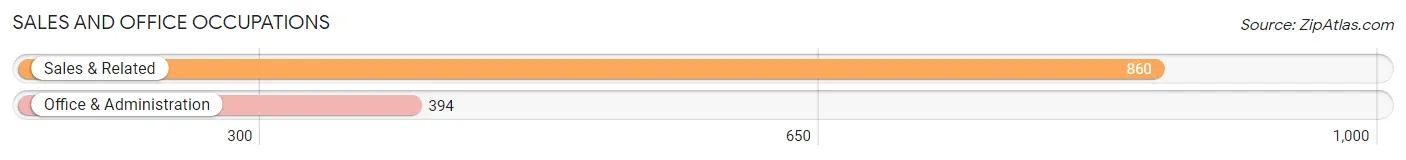
Sales and Office Occupations
The most common Sales and Office occupations in Laurel are Sales & Related (860 | 12.9%), and Office & Administration (394 | 5.9%).
Sales and Office Occupations by Sex
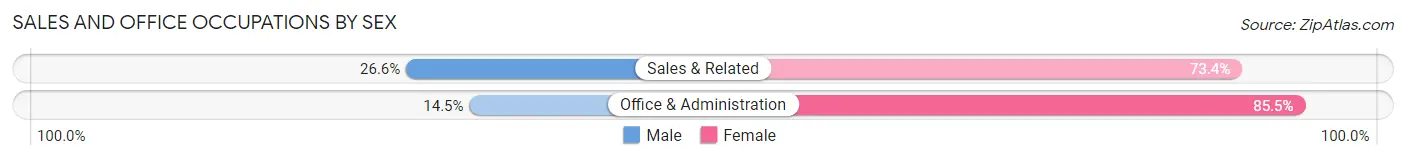
| Occupation | Male | Female |
| Sales & Related | 229 (26.6%) | 631 (73.4%) |
| Office & Administration | 57 (14.5%) | 337 (85.5%) |
| Total (Category) | 286 (22.8%) | 968 (77.2%) |
| Total (Overall) | 3,495 (52.5%) | 3,162 (47.5%) |
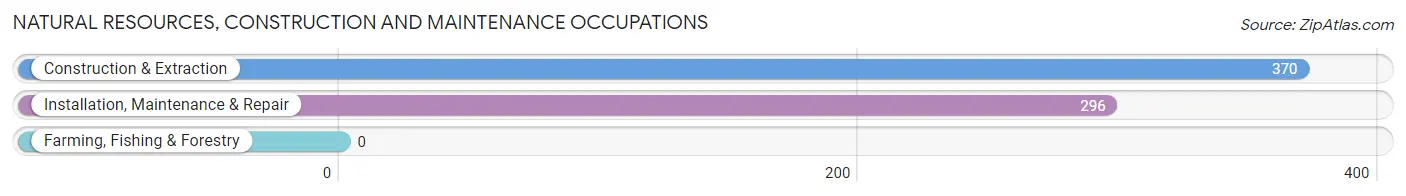
Natural Resources, Construction and Maintenance Occupations
The most common Natural Resources, Construction and Maintenance occupations in Laurel are Construction & Extraction (370 | 5.6%), and Installation, Maintenance & Repair (296 | 4.4%).
Natural Resources, Construction and Maintenance Occupations by Sex
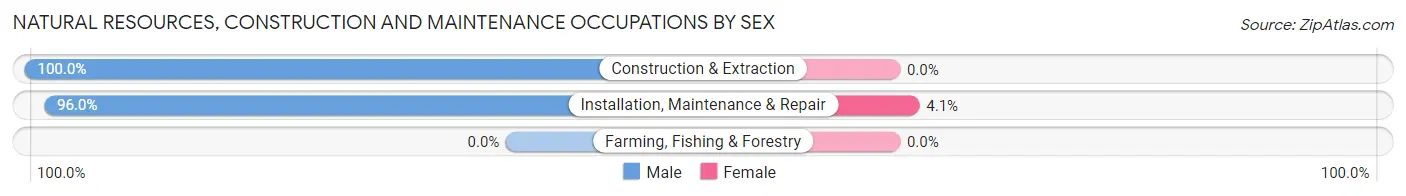
| Occupation | Male | Female |
| Farming, Fishing & Forestry | 0 (0.0%) | 0 (0.0%) |
| Construction & Extraction | 370 (100.0%) | 0 (0.0%) |
| Installation, Maintenance & Repair | 284 (96.0%) | 12 (4.1%) |
| Total (Category) | 654 (98.2%) | 12 (1.8%) |
| Total (Overall) | 3,495 (52.5%) | 3,162 (47.5%) |
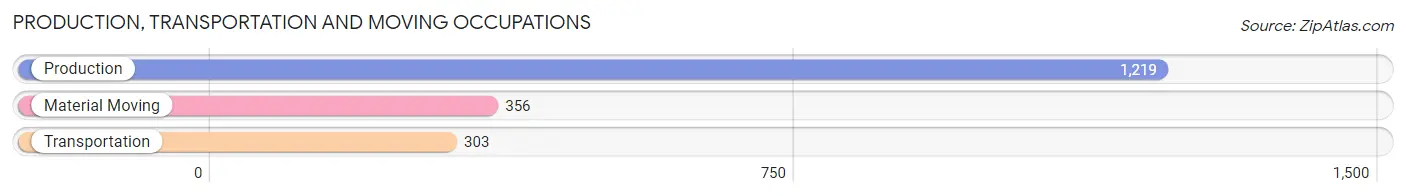
Production, Transportation and Moving Occupations
The most common Production, Transportation and Moving occupations in Laurel are Production (1,219 | 18.3%), Material Moving (356 | 5.3%), and Transportation (303 | 4.5%).
Production, Transportation and Moving Occupations by Sex
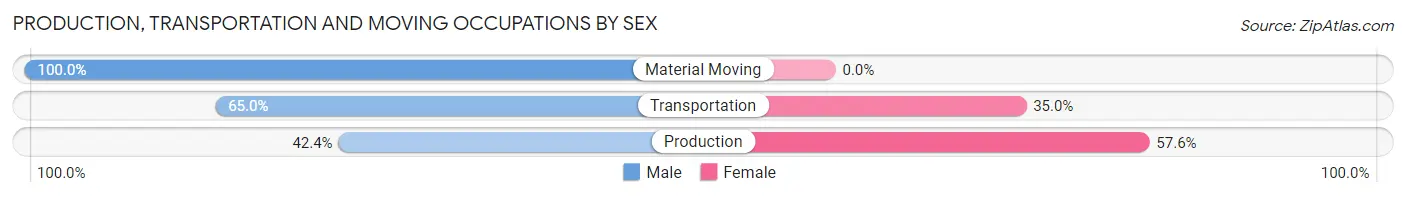
| Occupation | Male | Female |
| Production | 517 (42.4%) | 702 (57.6%) |
| Transportation | 197 (65.0%) | 106 (35.0%) |
| Material Moving | 356 (100.0%) | 0 (0.0%) |
| Total (Category) | 1,070 (57.0%) | 808 (43.0%) |
| Total (Overall) | 3,495 (52.5%) | 3,162 (47.5%) |
Employment Industries by Sex in Laurel
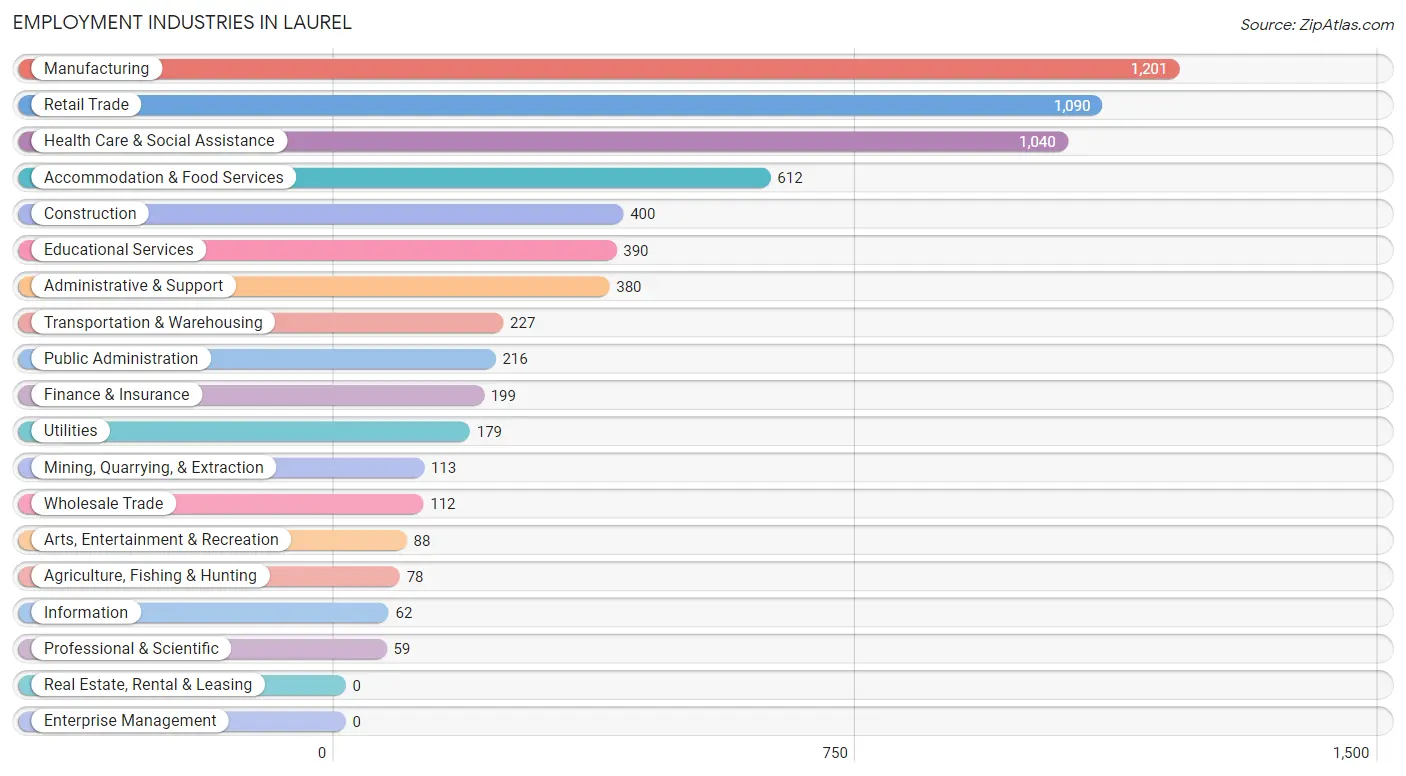
Employment Industries in Laurel
The major employment industries in Laurel include Manufacturing (1,201 | 18.0%), Retail Trade (1,090 | 16.4%), Health Care & Social Assistance (1,040 | 15.6%), Accommodation & Food Services (612 | 9.2%), and Construction (400 | 6.0%).
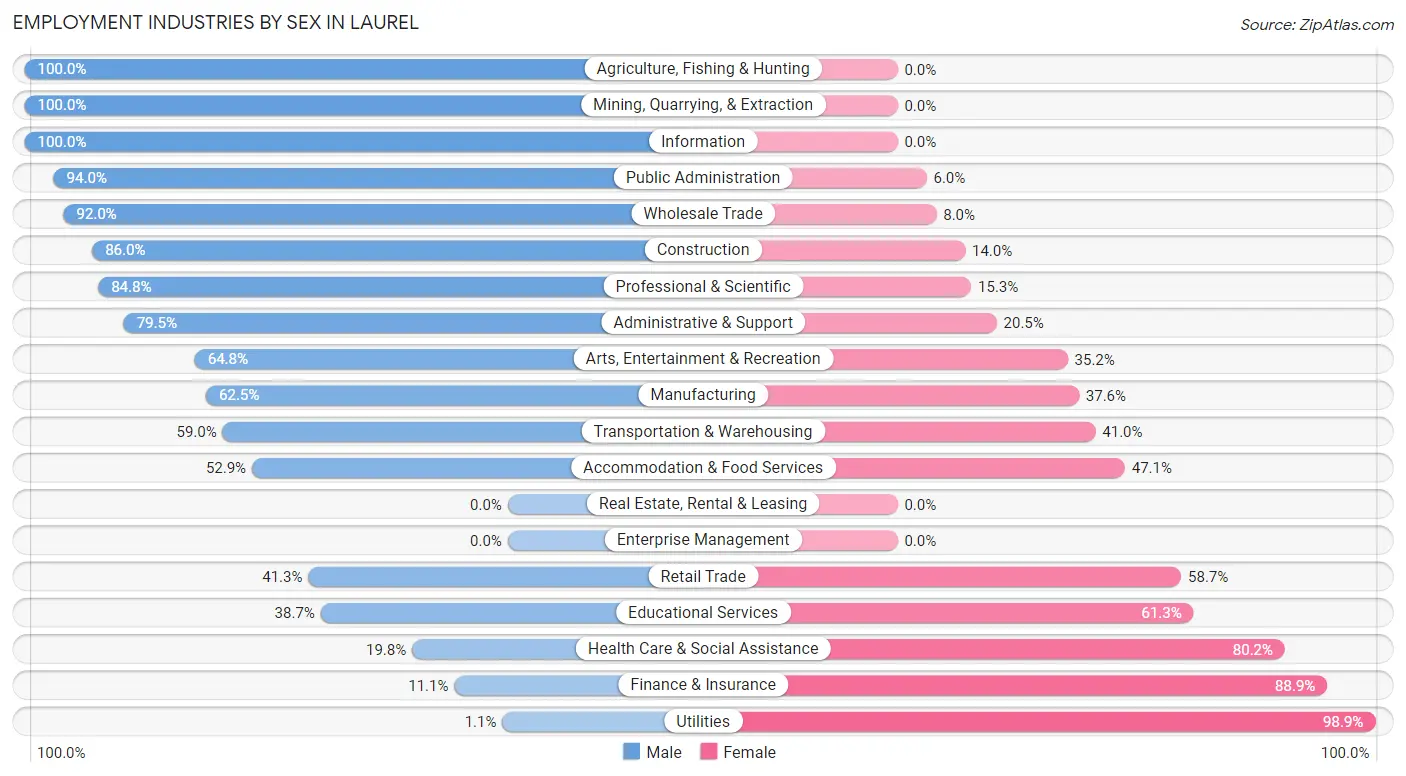
Employment Industries by Sex in Laurel
The Laurel industries that see more men than women are Agriculture, Fishing & Hunting (100.0%), Mining, Quarrying, & Extraction (100.0%), and Information (100.0%), whereas the industries that tend to have a higher number of women are Utilities (98.9%), Finance & Insurance (88.9%), and Health Care & Social Assistance (80.2%).
| Industry | Male | Female |
| Agriculture, Fishing & Hunting | 78 (100.0%) | 0 (0.0%) |
| Mining, Quarrying, & Extraction | 113 (100.0%) | 0 (0.0%) |
| Construction | 344 (86.0%) | 56 (14.0%) |
| Manufacturing | 750 (62.5%) | 451 (37.6%) |
| Wholesale Trade | 103 (92.0%) | 9 (8.0%) |
| Retail Trade | 450 (41.3%) | 640 (58.7%) |
| Transportation & Warehousing | 134 (59.0%) | 93 (41.0%) |
| Utilities | 2 (1.1%) | 177 (98.9%) |
| Information | 62 (100.0%) | 0 (0.0%) |
| Finance & Insurance | 22 (11.1%) | 177 (88.9%) |
| Real Estate, Rental & Leasing | 0 (0.0%) | 0 (0.0%) |
| Professional & Scientific | 50 (84.8%) | 9 (15.2%) |
| Enterprise Management | 0 (0.0%) | 0 (0.0%) |
| Administrative & Support | 302 (79.5%) | 78 (20.5%) |
| Educational Services | 151 (38.7%) | 239 (61.3%) |
| Health Care & Social Assistance | 206 (19.8%) | 834 (80.2%) |
| Arts, Entertainment & Recreation | 57 (64.8%) | 31 (35.2%) |
| Accommodation & Food Services | 324 (52.9%) | 288 (47.1%) |
| Public Administration | 203 (94.0%) | 13 (6.0%) |
| Total | 3,495 (52.5%) | 3,162 (47.5%) |
Education in Laurel
School Enrollment in Laurel
The most common levels of schooling among the 3,285 students in Laurel are elementary school (868 | 26.4%), middle school (698 | 21.2%), and high school (582 | 17.7%).
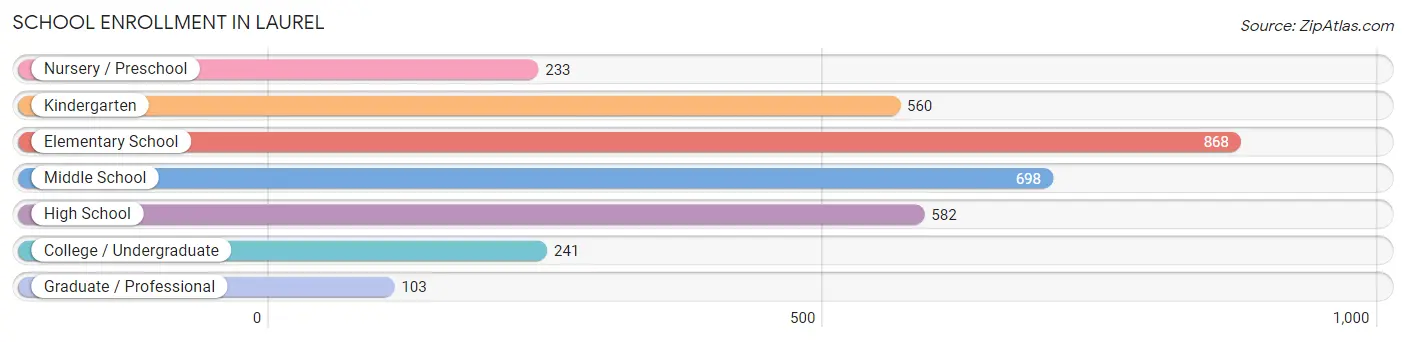
| School Level | # Students | % Students |
| Nursery / Preschool | 233 | 7.1% |
| Kindergarten | 560 | 17.1% |
| Elementary School | 868 | 26.4% |
| Middle School | 698 | 21.2% |
| High School | 582 | 17.7% |
| College / Undergraduate | 241 | 7.3% |
| Graduate / Professional | 103 | 3.1% |
| Total | 3,285 | 100.0% |
School Enrollment by Age by Funding Source in Laurel
Out of a total of 3,285 students who are enrolled in schools in Laurel, 683 (20.8%) attend a private institution, while the remaining 2,602 (79.2%) are enrolled in public schools. The age group of 20 to 24 year olds has the highest likelihood of being enrolled in private schools, with 135 (78.0% in the age bracket) enrolled. Conversely, the age group of 18 to 19 year olds has the lowest likelihood of being enrolled in a private school, with 60 (100.0% in the age bracket) attending a public institution.
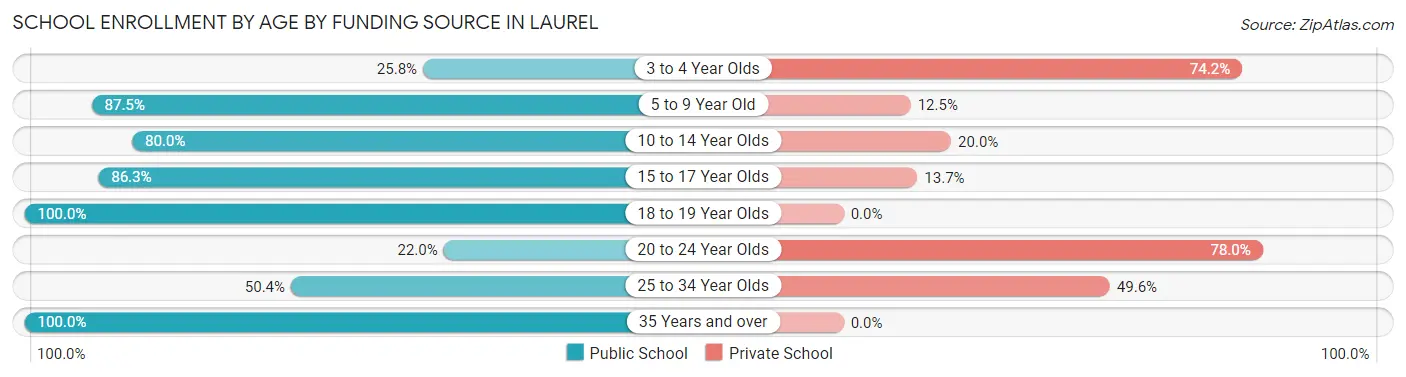
| Age Bracket | Public School | Private School |
| 3 to 4 Year Olds | 24 (25.8%) | 69 (74.2%) |
| 5 to 9 Year Old | 1,324 (87.5%) | 189 (12.5%) |
| 10 to 14 Year Olds | 679 (80.0%) | 170 (20.0%) |
| 15 to 17 Year Olds | 377 (86.3%) | 60 (13.7%) |
| 18 to 19 Year Olds | 60 (100.0%) | 0 (0.0%) |
| 20 to 24 Year Olds | 38 (22.0%) | 135 (78.0%) |
| 25 to 34 Year Olds | 62 (50.4%) | 61 (49.6%) |
| 35 Years and over | 37 (100.0%) | 0 (0.0%) |
| Total | 2,602 (79.2%) | 683 (20.8%) |
Educational Attainment by Field of Study in Laurel
Education (820 | 31.9%), business (490 | 19.1%), science & technology (287 | 11.2%), psychology (217 | 8.4%), and physical & health sciences (151 | 5.9%) are the most common fields of study among 2,570 individuals in Laurel who have obtained a bachelor's degree or higher.
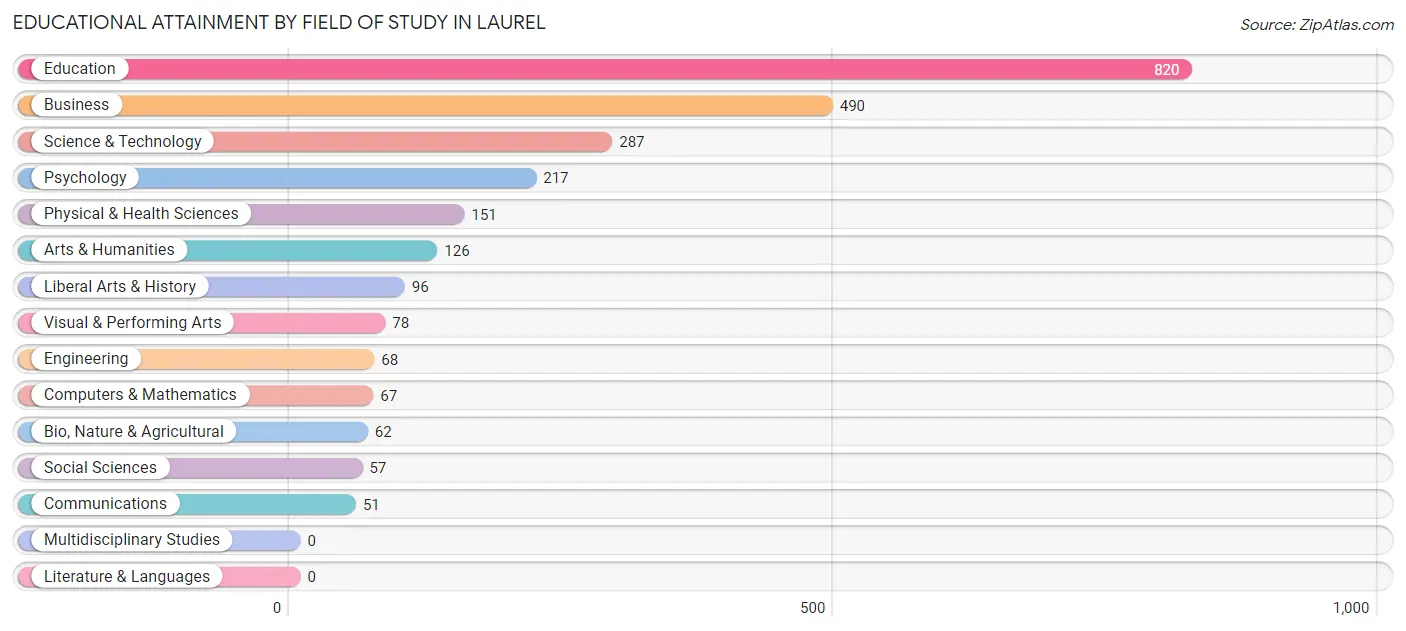
| Field of Study | # Graduates | % Graduates |
| Computers & Mathematics | 67 | 2.6% |
| Bio, Nature & Agricultural | 62 | 2.4% |
| Physical & Health Sciences | 151 | 5.9% |
| Psychology | 217 | 8.4% |
| Social Sciences | 57 | 2.2% |
| Engineering | 68 | 2.6% |
| Multidisciplinary Studies | 0 | 0.0% |
| Science & Technology | 287 | 11.2% |
| Business | 490 | 19.1% |
| Education | 820 | 31.9% |
| Literature & Languages | 0 | 0.0% |
| Liberal Arts & History | 96 | 3.7% |
| Visual & Performing Arts | 78 | 3.0% |
| Communications | 51 | 2.0% |
| Arts & Humanities | 126 | 4.9% |
| Total | 2,570 | 100.0% |
Transportation & Commute in Laurel
Vehicle Availability by Sex in Laurel
The most prevalent vehicle ownership categories in Laurel are males with 2 vehicles (1,414, accounting for 40.5%) and females with 2 vehicles (1,197, making up 44.8%).
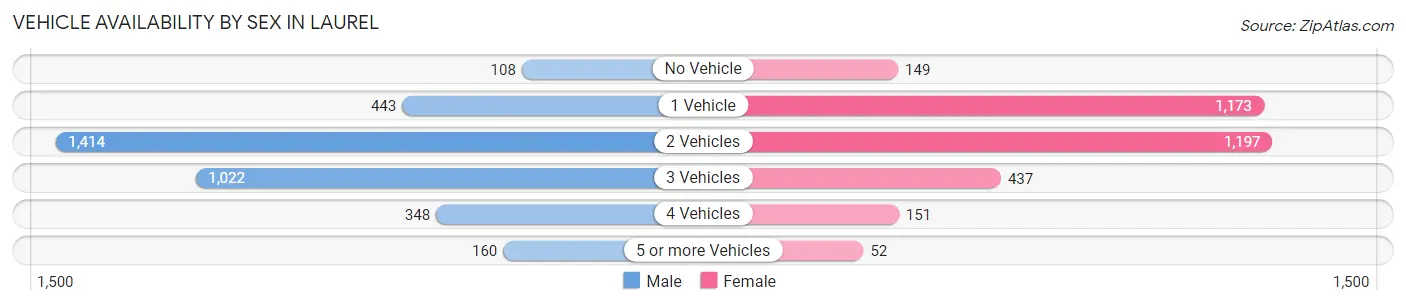
| Vehicles Available | Male | Female |
| No Vehicle | 108 (3.1%) | 149 (4.7%) |
| 1 Vehicle | 443 (12.7%) | 1,173 (37.1%) |
| 2 Vehicles | 1,414 (40.5%) | 1,197 (37.9%) |
| 3 Vehicles | 1,022 (29.2%) | 437 (13.8%) |
| 4 Vehicles | 348 (10.0%) | 151 (4.8%) |
| 5 or more Vehicles | 160 (4.6%) | 52 (1.7%) |
| Total | 3,495 (100.0%) | 3,159 (100.0%) |
Commute Time in Laurel
The most frequently occuring commute durations in Laurel are 15 to 19 minutes (2,215 commuters, 34.3%), 10 to 14 minutes (1,107 commuters, 17.1%), and 5 to 9 minutes (1,029 commuters, 15.9%).
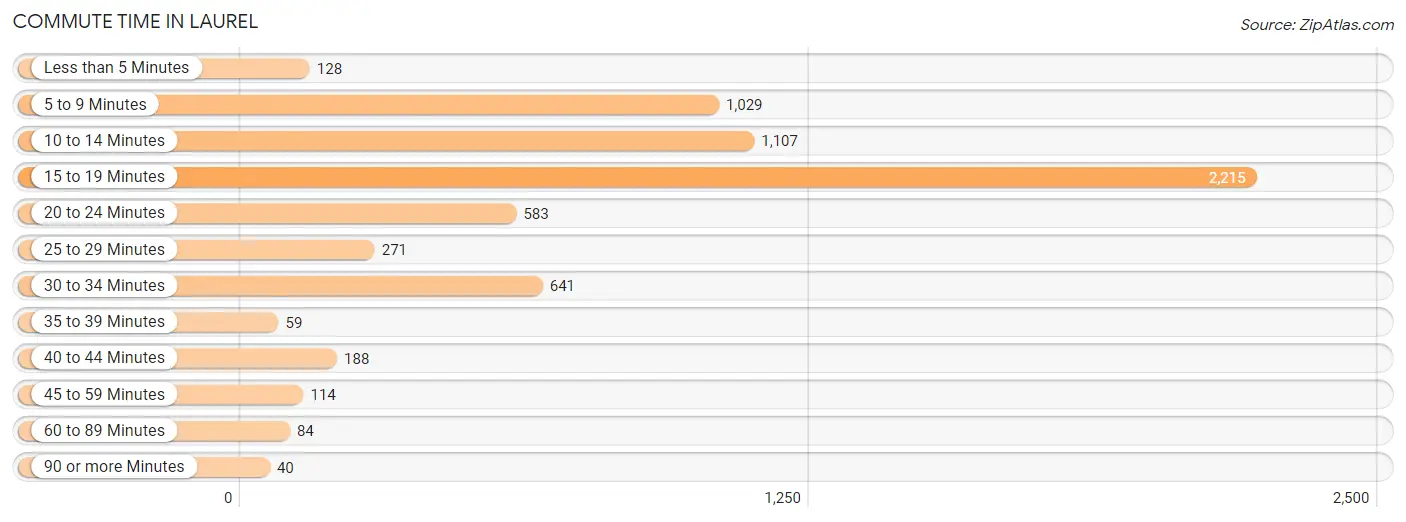
| Commute Time | # Commuters | % Commuters |
| Less than 5 Minutes | 128 | 2.0% |
| 5 to 9 Minutes | 1,029 | 15.9% |
| 10 to 14 Minutes | 1,107 | 17.1% |
| 15 to 19 Minutes | 2,215 | 34.3% |
| 20 to 24 Minutes | 583 | 9.0% |
| 25 to 29 Minutes | 271 | 4.2% |
| 30 to 34 Minutes | 641 | 9.9% |
| 35 to 39 Minutes | 59 | 0.9% |
| 40 to 44 Minutes | 188 | 2.9% |
| 45 to 59 Minutes | 114 | 1.8% |
| 60 to 89 Minutes | 84 | 1.3% |
| 90 or more Minutes | 40 | 0.6% |
Commute Time by Sex in Laurel
The most common commute times in Laurel are 15 to 19 minutes (1,179 commuters, 35.1%) for males and 15 to 19 minutes (1,036 commuters, 33.4%) for females.
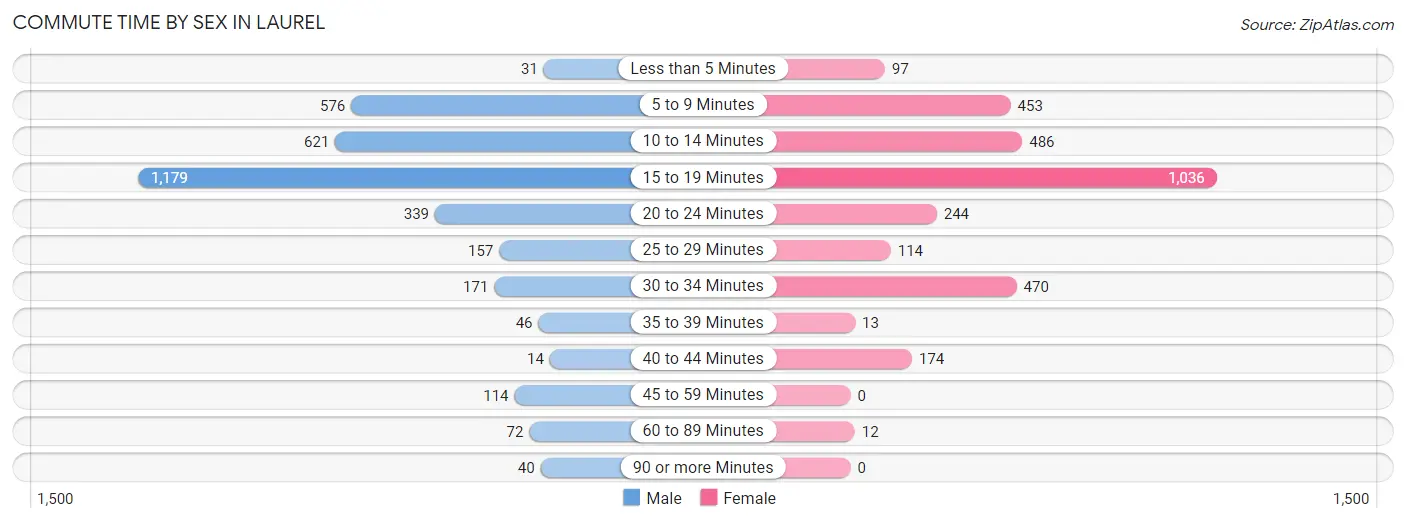
| Commute Time | Male | Female |
| Less than 5 Minutes | 31 (0.9%) | 97 (3.1%) |
| 5 to 9 Minutes | 576 (17.1%) | 453 (14.6%) |
| 10 to 14 Minutes | 621 (18.5%) | 486 (15.7%) |
| 15 to 19 Minutes | 1,179 (35.1%) | 1,036 (33.4%) |
| 20 to 24 Minutes | 339 (10.1%) | 244 (7.9%) |
| 25 to 29 Minutes | 157 (4.7%) | 114 (3.7%) |
| 30 to 34 Minutes | 171 (5.1%) | 470 (15.2%) |
| 35 to 39 Minutes | 46 (1.4%) | 13 (0.4%) |
| 40 to 44 Minutes | 14 (0.4%) | 174 (5.6%) |
| 45 to 59 Minutes | 114 (3.4%) | 0 (0.0%) |
| 60 to 89 Minutes | 72 (2.1%) | 12 (0.4%) |
| 90 or more Minutes | 40 (1.2%) | 0 (0.0%) |
Time of Departure to Work by Sex in Laurel
The most frequent times of departure to work in Laurel are 6:00 AM to 6:29 AM (619, 18.4%) for males and 7:00 AM to 7:29 AM (687, 22.2%) for females.
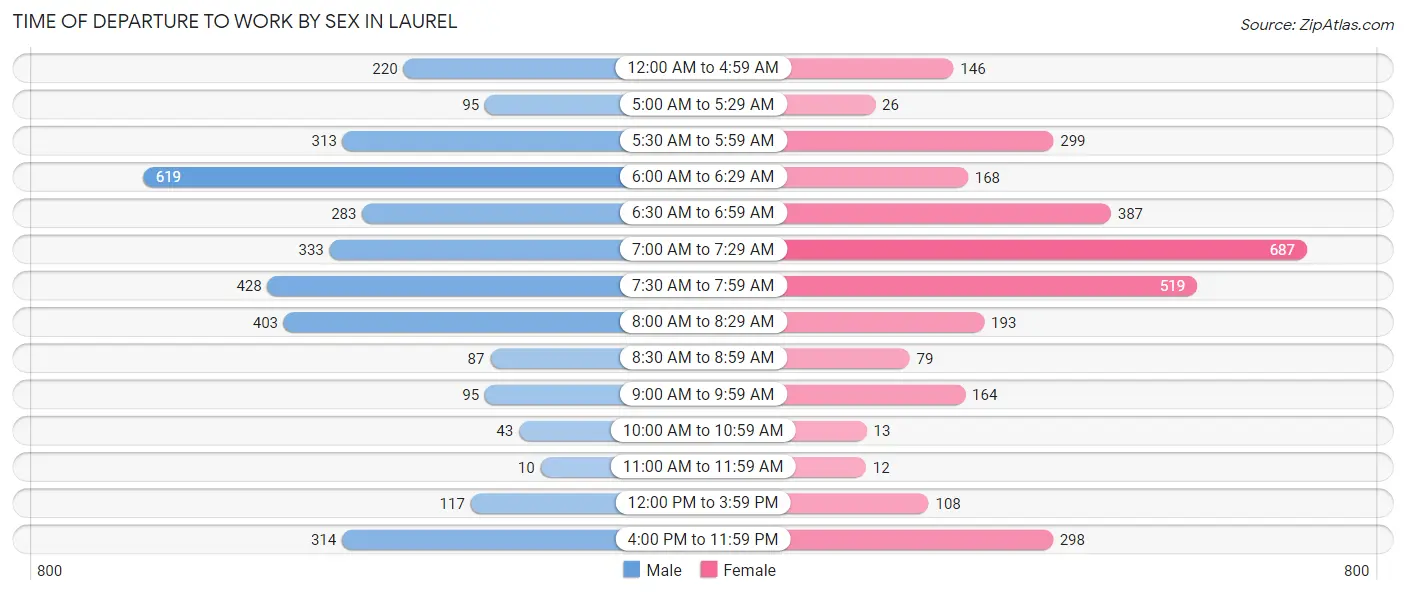
| Time of Departure | Male | Female |
| 12:00 AM to 4:59 AM | 220 (6.6%) | 146 (4.7%) |
| 5:00 AM to 5:29 AM | 95 (2.8%) | 26 (0.8%) |
| 5:30 AM to 5:59 AM | 313 (9.3%) | 299 (9.7%) |
| 6:00 AM to 6:29 AM | 619 (18.4%) | 168 (5.4%) |
| 6:30 AM to 6:59 AM | 283 (8.4%) | 387 (12.5%) |
| 7:00 AM to 7:29 AM | 333 (9.9%) | 687 (22.2%) |
| 7:30 AM to 7:59 AM | 428 (12.7%) | 519 (16.8%) |
| 8:00 AM to 8:29 AM | 403 (12.0%) | 193 (6.2%) |
| 8:30 AM to 8:59 AM | 87 (2.6%) | 79 (2.5%) |
| 9:00 AM to 9:59 AM | 95 (2.8%) | 164 (5.3%) |
| 10:00 AM to 10:59 AM | 43 (1.3%) | 13 (0.4%) |
| 11:00 AM to 11:59 AM | 10 (0.3%) | 12 (0.4%) |
| 12:00 PM to 3:59 PM | 117 (3.5%) | 108 (3.5%) |
| 4:00 PM to 11:59 PM | 314 (9.3%) | 298 (9.6%) |
| Total | 3,360 (100.0%) | 3,099 (100.0%) |
Housing Occupancy in Laurel
Occupancy by Ownership in Laurel
Of the total 6,443 dwellings in Laurel, owner-occupied units account for 4,093 (63.5%), while renter-occupied units make up 2,350 (36.5%).
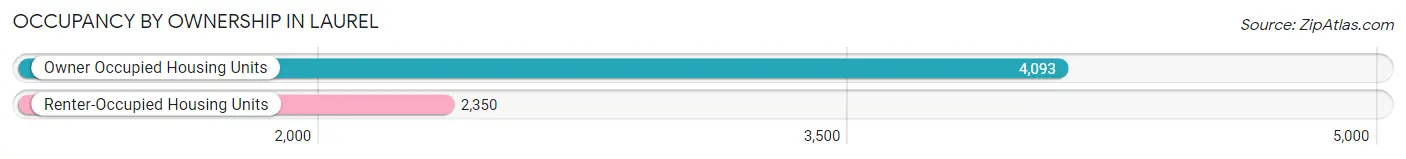
| Occupancy | # Housing Units | % Housing Units |
| Owner Occupied Housing Units | 4,093 | 63.5% |
| Renter-Occupied Housing Units | 2,350 | 36.5% |
| Total Occupied Housing Units | 6,443 | 100.0% |
Occupancy by Household Size in Laurel
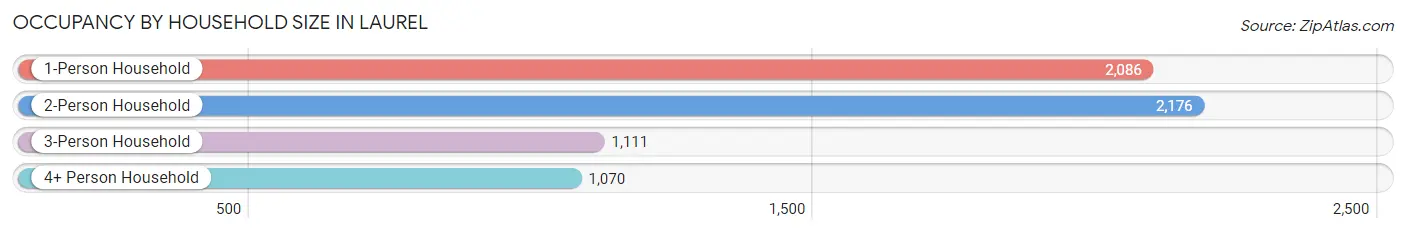
| Household Size | # Housing Units | % Housing Units |
| 1-Person Household | 2,086 | 32.4% |
| 2-Person Household | 2,176 | 33.8% |
| 3-Person Household | 1,111 | 17.2% |
| 4+ Person Household | 1,070 | 16.6% |
| Total Housing Units | 6,443 | 100.0% |
Occupancy by Ownership by Household Size in Laurel
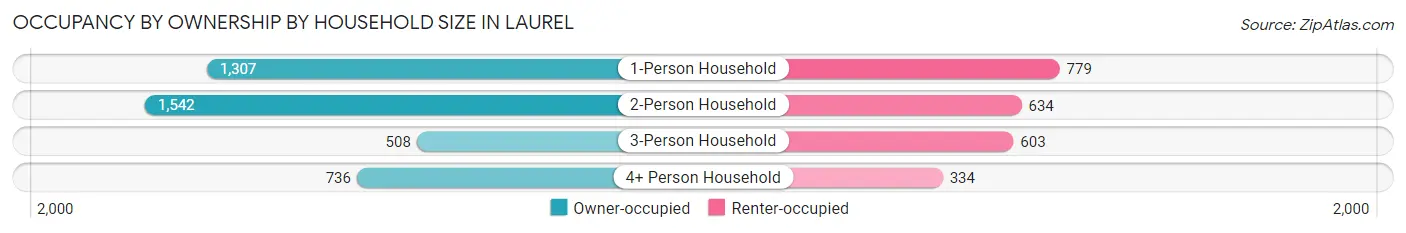
| Household Size | Owner-occupied | Renter-occupied |
| 1-Person Household | 1,307 (62.7%) | 779 (37.3%) |
| 2-Person Household | 1,542 (70.9%) | 634 (29.1%) |
| 3-Person Household | 508 (45.7%) | 603 (54.3%) |
| 4+ Person Household | 736 (68.8%) | 334 (31.2%) |
| Total Housing Units | 4,093 (63.5%) | 2,350 (36.5%) |
Occupancy by Educational Attainment in Laurel
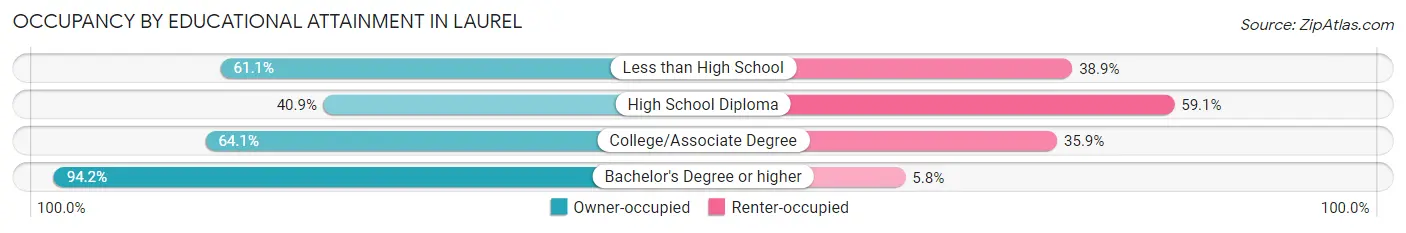
| Household Size | Owner-occupied | Renter-occupied |
| Less than High School | 835 (61.1%) | 531 (38.9%) |
| High School Diploma | 763 (40.9%) | 1,103 (59.1%) |
| College/Associate Degree | 1,130 (64.1%) | 632 (35.9%) |
| Bachelor's Degree or higher | 1,365 (94.2%) | 84 (5.8%) |
Occupancy by Age of Householder in Laurel
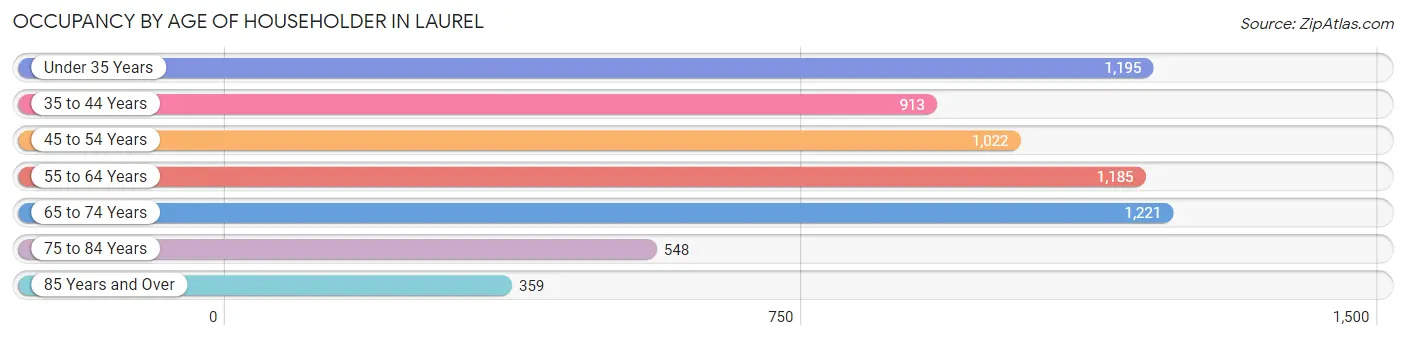
| Age Bracket | # Households | % Households |
| Under 35 Years | 1,195 | 18.5% |
| 35 to 44 Years | 913 | 14.2% |
| 45 to 54 Years | 1,022 | 15.9% |
| 55 to 64 Years | 1,185 | 18.4% |
| 65 to 74 Years | 1,221 | 19.0% |
| 75 to 84 Years | 548 | 8.5% |
| 85 Years and Over | 359 | 5.6% |
| Total | 6,443 | 100.0% |
Housing Finances in Laurel
Median Income by Occupancy in Laurel
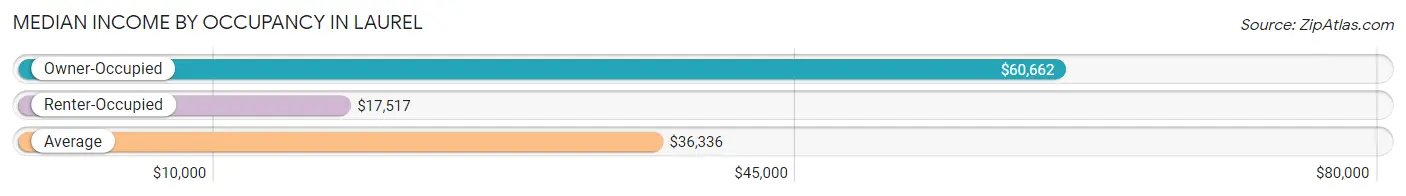
| Occupancy Type | # Households | Median Income |
| Owner-Occupied | 4,093 (63.5%) | $60,662 |
| Renter-Occupied | 2,350 (36.5%) | $17,517 |
| Average | 6,443 (100.0%) | $36,336 |
Occupancy by Householder Income Bracket in Laurel
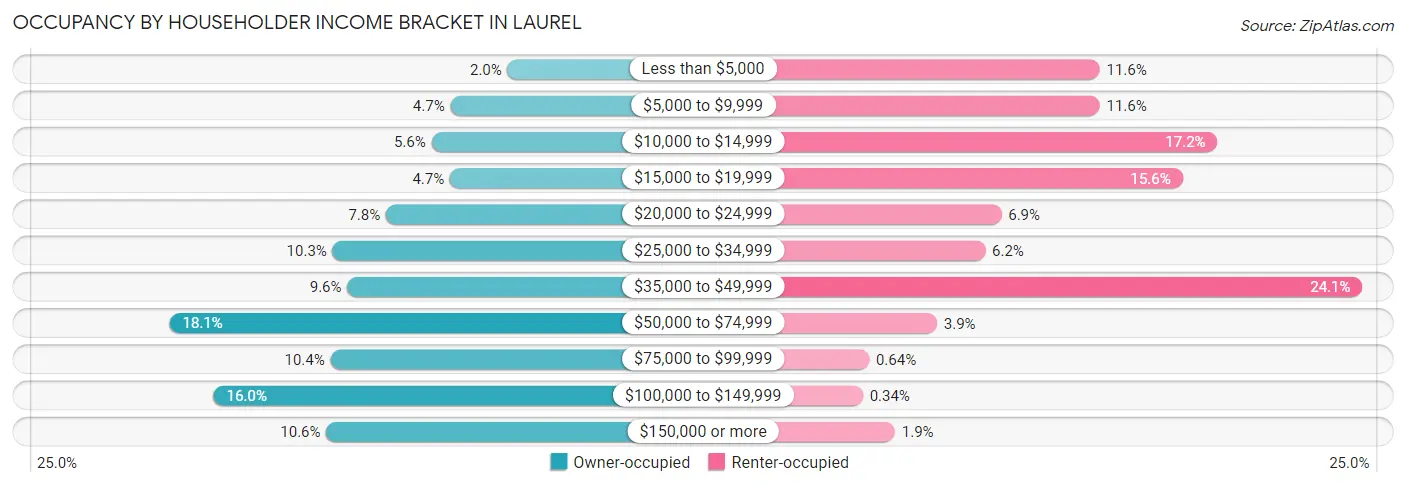
| Income Bracket | Owner-occupied | Renter-occupied |
| Less than $5,000 | 82 (2.0%) | 273 (11.6%) |
| $5,000 to $9,999 | 193 (4.7%) | 273 (11.6%) |
| $10,000 to $14,999 | 230 (5.6%) | 405 (17.2%) |
| $15,000 to $19,999 | 194 (4.7%) | 366 (15.6%) |
| $20,000 to $24,999 | 319 (7.8%) | 163 (6.9%) |
| $25,000 to $34,999 | 423 (10.3%) | 145 (6.2%) |
| $35,000 to $49,999 | 394 (9.6%) | 567 (24.1%) |
| $50,000 to $74,999 | 741 (18.1%) | 91 (3.9%) |
| $75,000 to $99,999 | 427 (10.4%) | 15 (0.6%) |
| $100,000 to $149,999 | 655 (16.0%) | 8 (0.3%) |
| $150,000 or more | 435 (10.6%) | 44 (1.9%) |
| Total | 4,093 (100.0%) | 2,350 (100.0%) |
Monthly Housing Cost Tiers in Laurel
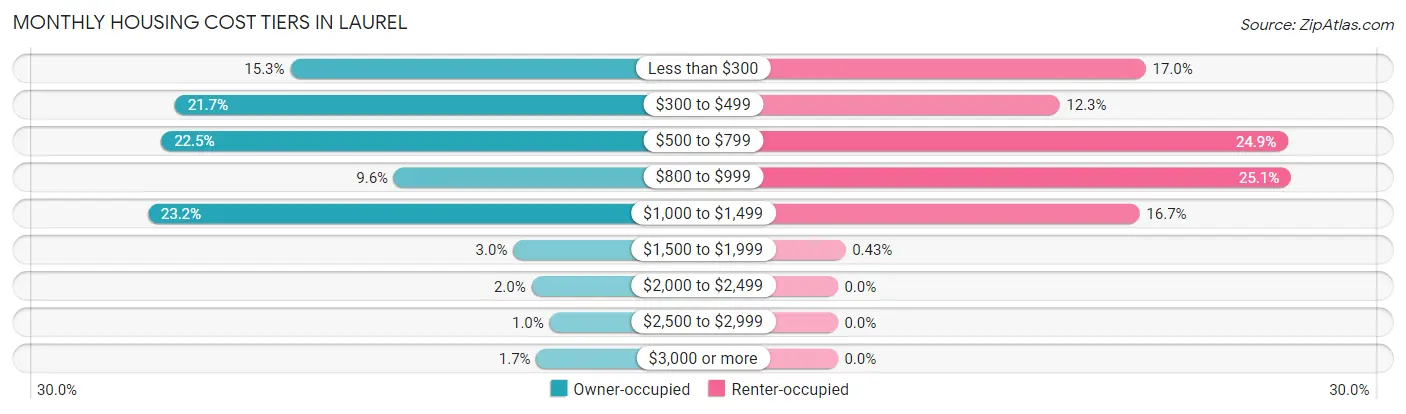
| Monthly Cost | Owner-occupied | Renter-occupied |
| Less than $300 | 627 (15.3%) | 400 (17.0%) |
| $300 to $499 | 888 (21.7%) | 288 (12.3%) |
| $500 to $799 | 919 (22.5%) | 585 (24.9%) |
| $800 to $999 | 393 (9.6%) | 589 (25.1%) |
| $1,000 to $1,499 | 949 (23.2%) | 392 (16.7%) |
| $1,500 to $1,999 | 123 (3.0%) | 10 (0.4%) |
| $2,000 to $2,499 | 82 (2.0%) | 0 (0.0%) |
| $2,500 to $2,999 | 41 (1.0%) | 0 (0.0%) |
| $3,000 or more | 71 (1.7%) | 0 (0.0%) |
| Total | 4,093 (100.0%) | 2,350 (100.0%) |
Physical Housing Characteristics in Laurel
Housing Structures in Laurel
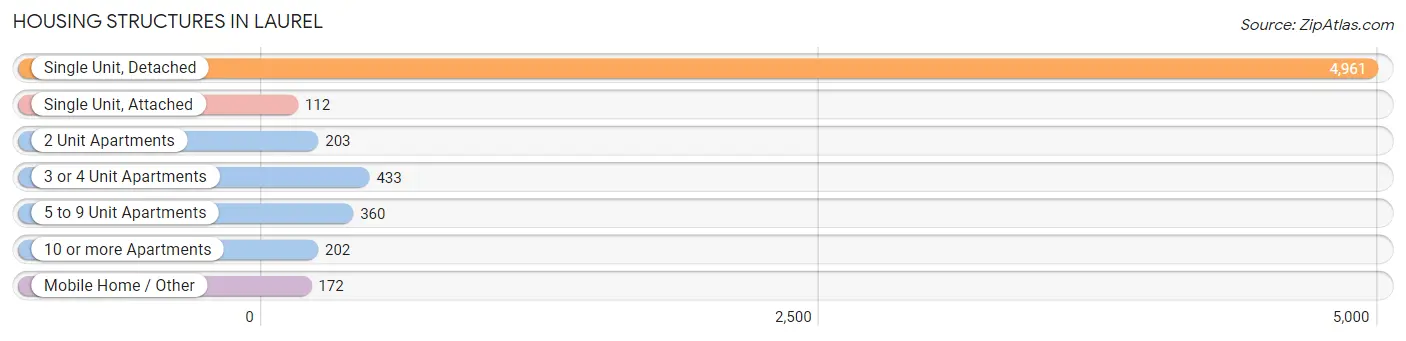
| Structure Type | # Housing Units | % Housing Units |
| Single Unit, Detached | 4,961 | 77.0% |
| Single Unit, Attached | 112 | 1.7% |
| 2 Unit Apartments | 203 | 3.2% |
| 3 or 4 Unit Apartments | 433 | 6.7% |
| 5 to 9 Unit Apartments | 360 | 5.6% |
| 10 or more Apartments | 202 | 3.1% |
| Mobile Home / Other | 172 | 2.7% |
| Total | 6,443 | 100.0% |
Housing Structures by Occupancy in Laurel
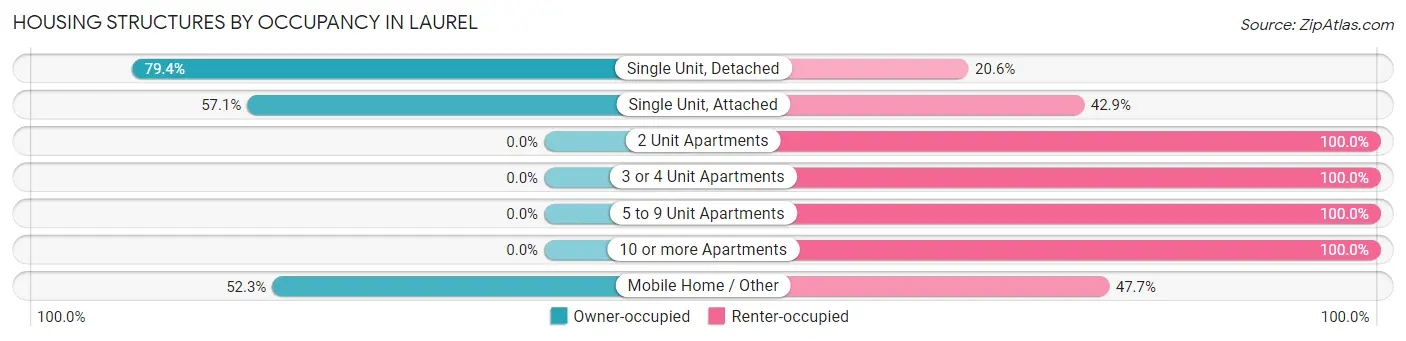
| Structure Type | Owner-occupied | Renter-occupied |
| Single Unit, Detached | 3,939 (79.4%) | 1,022 (20.6%) |
| Single Unit, Attached | 64 (57.1%) | 48 (42.9%) |
| 2 Unit Apartments | 0 (0.0%) | 203 (100.0%) |
| 3 or 4 Unit Apartments | 0 (0.0%) | 433 (100.0%) |
| 5 to 9 Unit Apartments | 0 (0.0%) | 360 (100.0%) |
| 10 or more Apartments | 0 (0.0%) | 202 (100.0%) |
| Mobile Home / Other | 90 (52.3%) | 82 (47.7%) |
| Total | 4,093 (63.5%) | 2,350 (36.5%) |
Housing Structures by Number of Rooms in Laurel
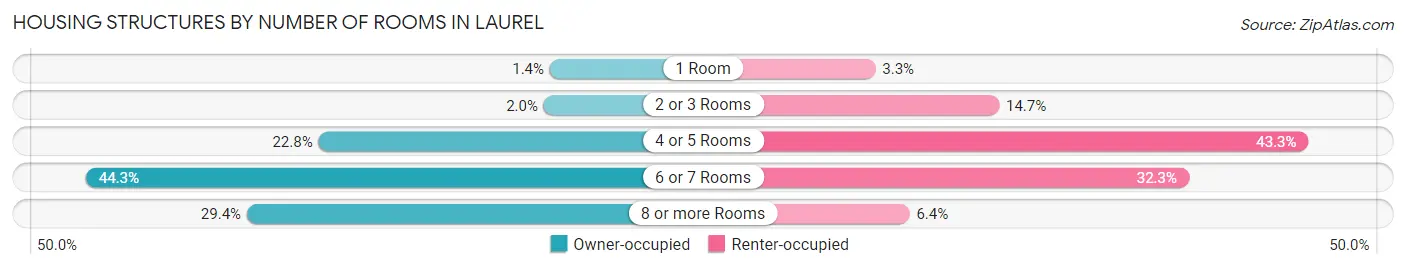
| Number of Rooms | Owner-occupied | Renter-occupied |
| 1 Room | 58 (1.4%) | 77 (3.3%) |
| 2 or 3 Rooms | 81 (2.0%) | 346 (14.7%) |
| 4 or 5 Rooms | 934 (22.8%) | 1,018 (43.3%) |
| 6 or 7 Rooms | 1,815 (44.3%) | 758 (32.3%) |
| 8 or more Rooms | 1,205 (29.4%) | 151 (6.4%) |
| Total | 4,093 (100.0%) | 2,350 (100.0%) |
Housing Structure by Heating Type in Laurel
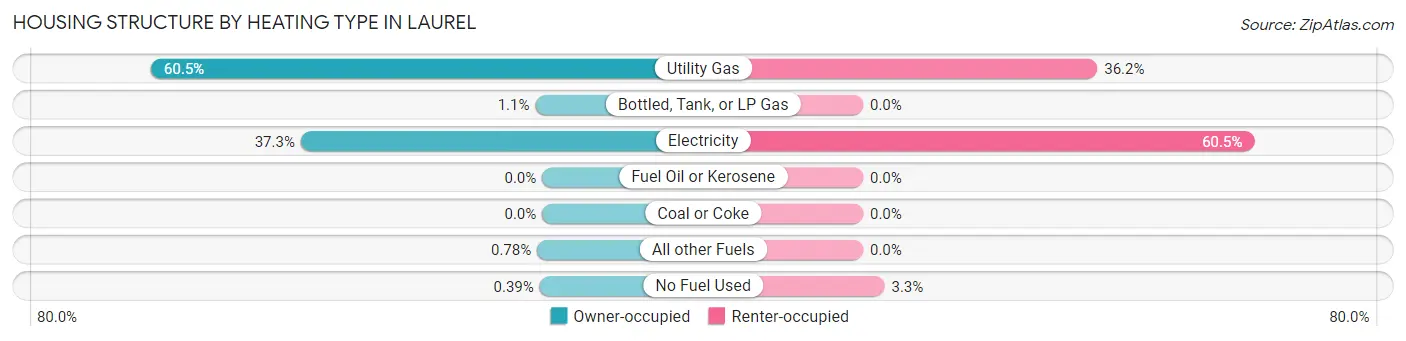
| Heating Type | Owner-occupied | Renter-occupied |
| Utility Gas | 2,475 (60.5%) | 851 (36.2%) |
| Bottled, Tank, or LP Gas | 43 (1.1%) | 0 (0.0%) |
| Electricity | 1,527 (37.3%) | 1,421 (60.5%) |
| Fuel Oil or Kerosene | 0 (0.0%) | 0 (0.0%) |
| Coal or Coke | 0 (0.0%) | 0 (0.0%) |
| All other Fuels | 32 (0.8%) | 0 (0.0%) |
| No Fuel Used | 16 (0.4%) | 78 (3.3%) |
| Total | 4,093 (100.0%) | 2,350 (100.0%) |
Household Vehicle Usage in Laurel
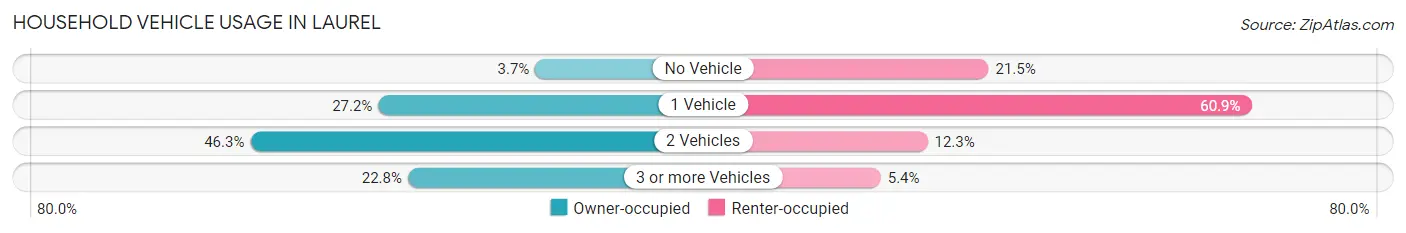
| Vehicles per Household | Owner-occupied | Renter-occupied |
| No Vehicle | 153 (3.7%) | 504 (21.4%) |
| 1 Vehicle | 1,113 (27.2%) | 1,430 (60.9%) |
| 2 Vehicles | 1,895 (46.3%) | 290 (12.3%) |
| 3 or more Vehicles | 932 (22.8%) | 126 (5.4%) |
| Total | 4,093 (100.0%) | 2,350 (100.0%) |
Real Estate & Mortgages in Laurel
Real Estate and Mortgage Overview in Laurel
| Characteristic | Without Mortgage | With Mortgage |
| Housing Units | 2,333 | 1,760 |
| Median Property Value | $113,400 | $109,700 |
| Median Household Income | $43,505 | $340 |
| Monthly Housing Costs | $412 | $60 |
| Real Estate Taxes | $1,247 | $652 |
Property Value by Mortgage Status in Laurel
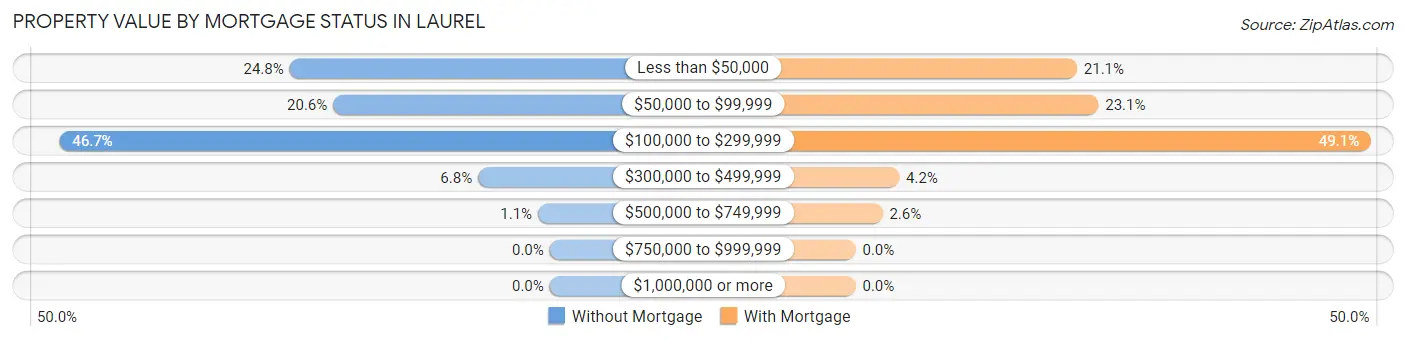
| Property Value | Without Mortgage | With Mortgage |
| Less than $50,000 | 578 (24.8%) | 371 (21.1%) |
| $50,000 to $99,999 | 481 (20.6%) | 407 (23.1%) |
| $100,000 to $299,999 | 1,089 (46.7%) | 864 (49.1%) |
| $300,000 to $499,999 | 159 (6.8%) | 73 (4.2%) |
| $500,000 to $749,999 | 26 (1.1%) | 45 (2.6%) |
| $750,000 to $999,999 | 0 (0.0%) | 0 (0.0%) |
| $1,000,000 or more | 0 (0.0%) | 0 (0.0%) |
| Total | 2,333 (100.0%) | 1,760 (100.0%) |
Household Income by Mortgage Status in Laurel
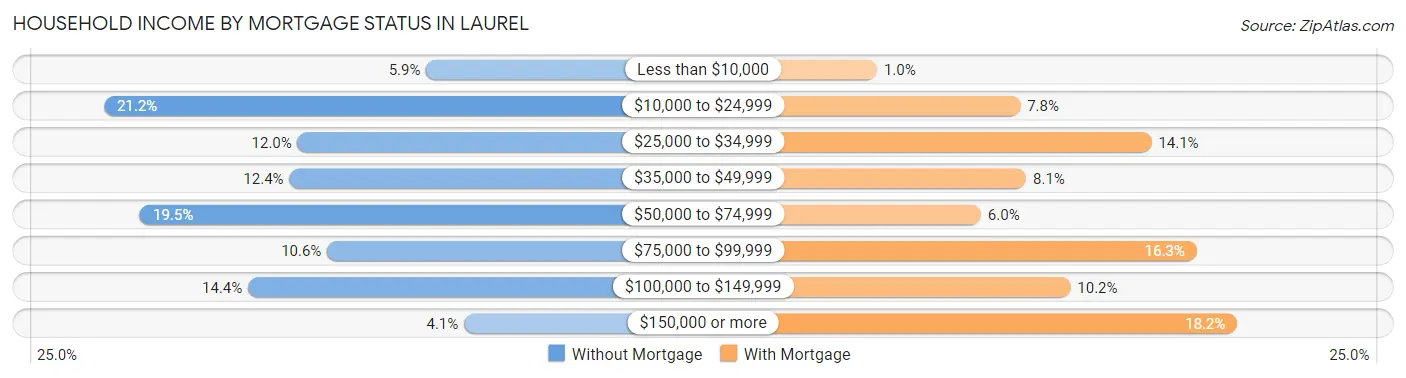
| Household Income | Without Mortgage | With Mortgage |
| Less than $10,000 | 137 (5.9%) | 18 (1.0%) |
| $10,000 to $24,999 | 495 (21.2%) | 138 (7.8%) |
| $25,000 to $34,999 | 280 (12.0%) | 248 (14.1%) |
| $35,000 to $49,999 | 289 (12.4%) | 143 (8.1%) |
| $50,000 to $74,999 | 455 (19.5%) | 105 (6.0%) |
| $75,000 to $99,999 | 247 (10.6%) | 286 (16.3%) |
| $100,000 to $149,999 | 335 (14.4%) | 180 (10.2%) |
| $150,000 or more | 95 (4.1%) | 320 (18.2%) |
| Total | 2,333 (100.0%) | 1,760 (100.0%) |
Property Value to Household Income Ratio in Laurel
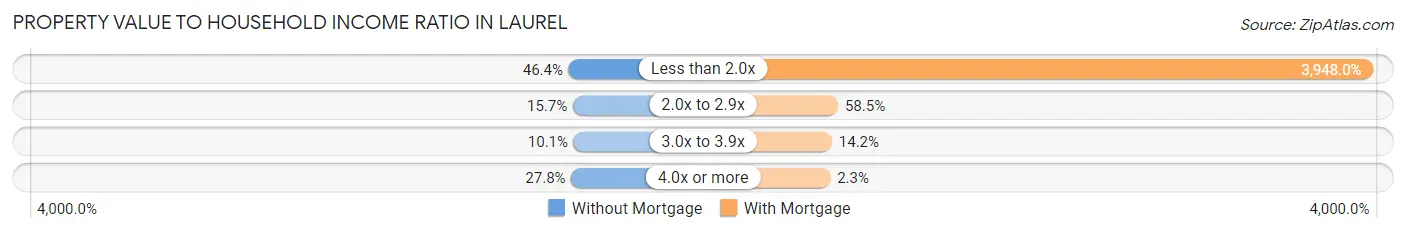
| Value-to-Income Ratio | Without Mortgage | With Mortgage |
| Less than 2.0x | 1,083 (46.4%) | 69,485 (3,948.0%) |
| 2.0x to 2.9x | 366 (15.7%) | 1,029 (58.5%) |
| 3.0x to 3.9x | 235 (10.1%) | 250 (14.2%) |
| 4.0x or more | 649 (27.8%) | 40 (2.3%) |
| Total | 2,333 (100.0%) | 1,760 (100.0%) |
Real Estate Taxes by Mortgage Status in Laurel
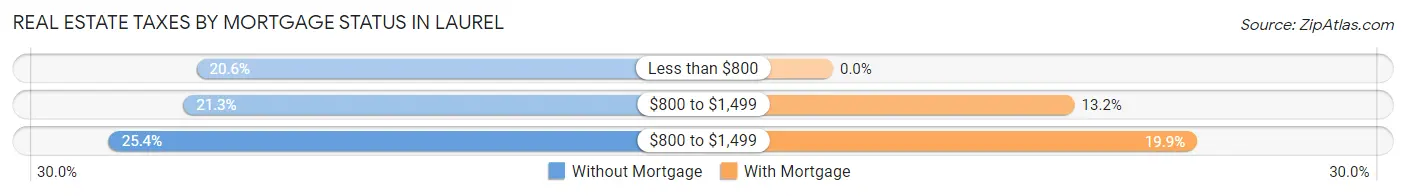
| Property Taxes | Without Mortgage | With Mortgage |
| Less than $800 | 480 (20.6%) | 0 (0.0%) |
| $800 to $1,499 | 497 (21.3%) | 233 (13.2%) |
| $800 to $1,499 | 592 (25.4%) | 351 (19.9%) |
| Total | 2,333 (100.0%) | 1,760 (100.0%) |
Health & Disability in Laurel
Health Insurance Coverage by Age in Laurel
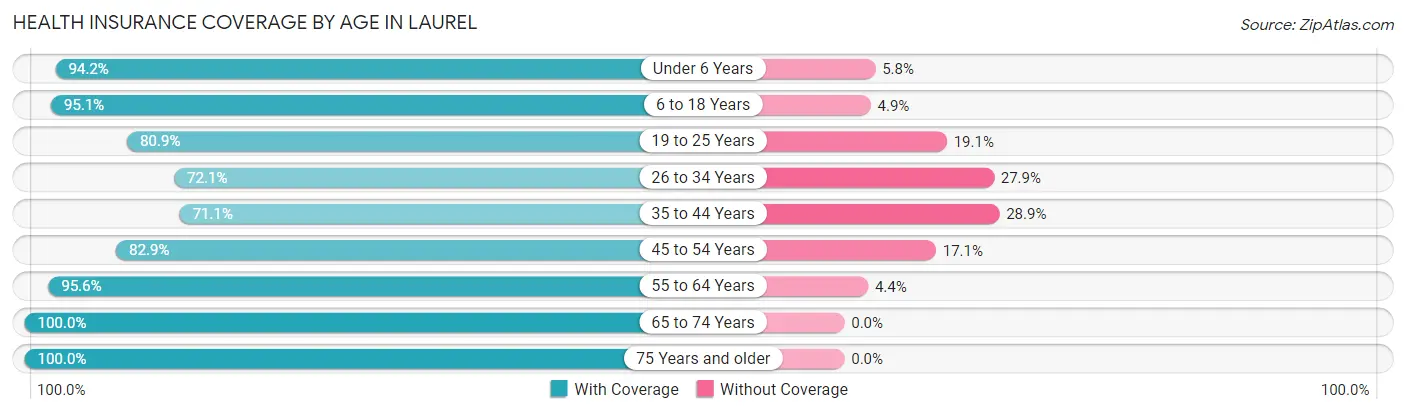
| Age Bracket | With Coverage | Without Coverage |
| Under 6 Years | 1,359 (94.2%) | 83 (5.8%) |
| 6 to 18 Years | 2,788 (95.1%) | 144 (4.9%) |
| 19 to 25 Years | 1,292 (80.9%) | 305 (19.1%) |
| 26 to 34 Years | 1,583 (72.1%) | 612 (27.9%) |
| 35 to 44 Years | 1,420 (71.1%) | 577 (28.9%) |
| 45 to 54 Years | 1,380 (82.9%) | 284 (17.1%) |
| 55 to 64 Years | 2,182 (95.6%) | 101 (4.4%) |
| 65 to 74 Years | 1,527 (100.0%) | 0 (0.0%) |
| 75 Years and older | 1,213 (100.0%) | 0 (0.0%) |
| Total | 14,744 (87.5%) | 2,106 (12.5%) |
Health Insurance Coverage by Citizenship Status in Laurel
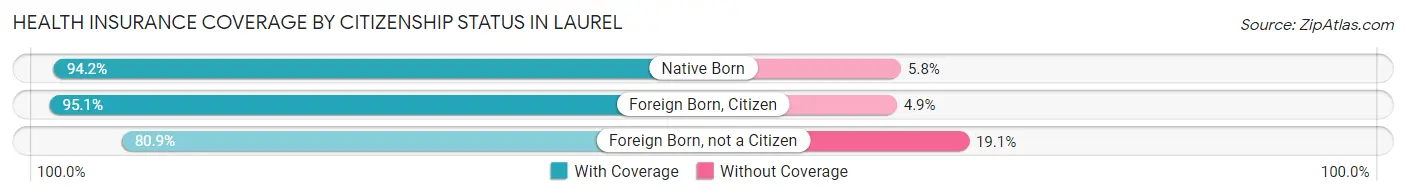
| Citizenship Status | With Coverage | Without Coverage |
| Native Born | 1,359 (94.2%) | 83 (5.8%) |
| Foreign Born, Citizen | 2,788 (95.1%) | 144 (4.9%) |
| Foreign Born, not a Citizen | 1,292 (80.9%) | 305 (19.1%) |
Health Insurance Coverage by Household Income in Laurel
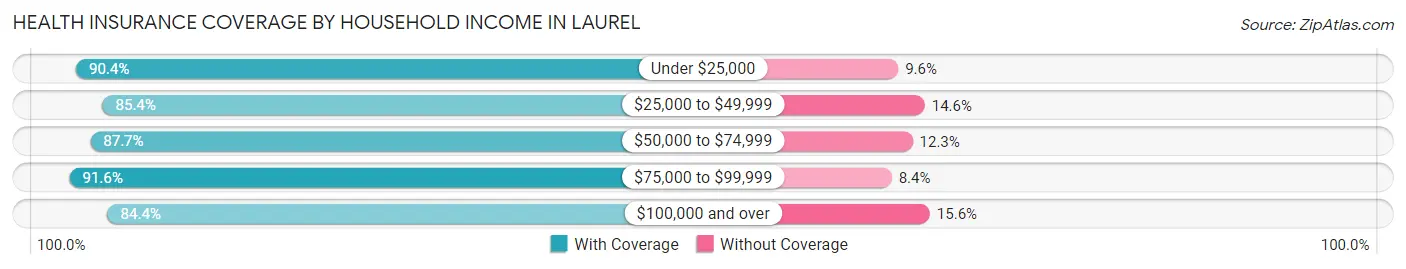
| Household Income | With Coverage | Without Coverage |
| Under $25,000 | 4,722 (90.4%) | 504 (9.6%) |
| $25,000 to $49,999 | 3,544 (85.4%) | 607 (14.6%) |
| $50,000 to $74,999 | 2,205 (87.7%) | 310 (12.3%) |
| $75,000 to $99,999 | 1,099 (91.6%) | 101 (8.4%) |
| $100,000 and over | 3,161 (84.4%) | 583 (15.6%) |
Public vs Private Health Insurance Coverage by Age in Laurel
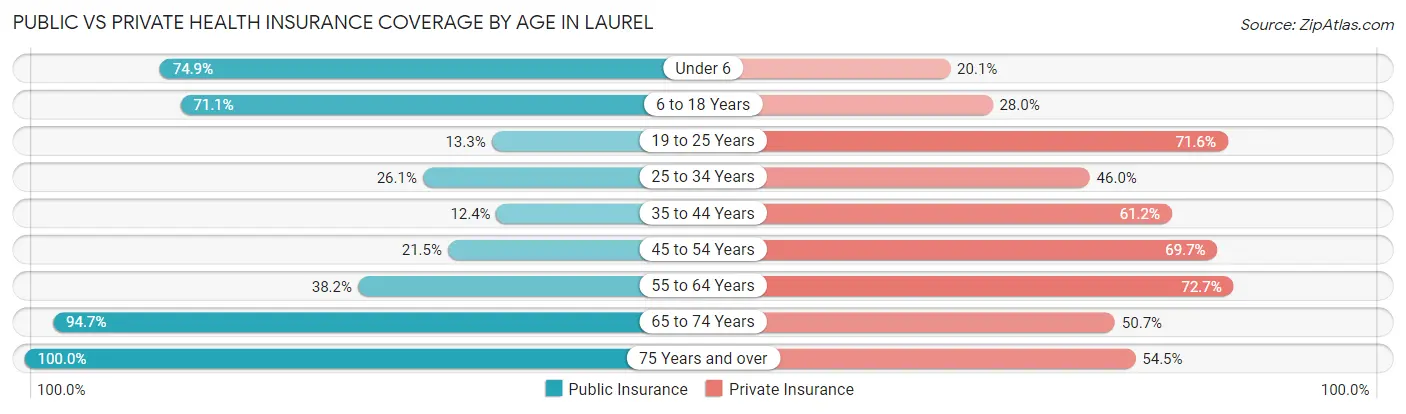
| Age Bracket | Public Insurance | Private Insurance |
| Under 6 | 1,080 (74.9%) | 290 (20.1%) |
| 6 to 18 Years | 2,084 (71.1%) | 820 (28.0%) |
| 19 to 25 Years | 213 (13.3%) | 1,144 (71.6%) |
| 25 to 34 Years | 573 (26.1%) | 1,010 (46.0%) |
| 35 to 44 Years | 248 (12.4%) | 1,223 (61.2%) |
| 45 to 54 Years | 357 (21.4%) | 1,160 (69.7%) |
| 55 to 64 Years | 871 (38.2%) | 1,660 (72.7%) |
| 65 to 74 Years | 1,446 (94.7%) | 774 (50.7%) |
| 75 Years and over | 1,213 (100.0%) | 661 (54.5%) |
| Total | 8,085 (48.0%) | 8,742 (51.9%) |
Disability Status by Sex by Age in Laurel
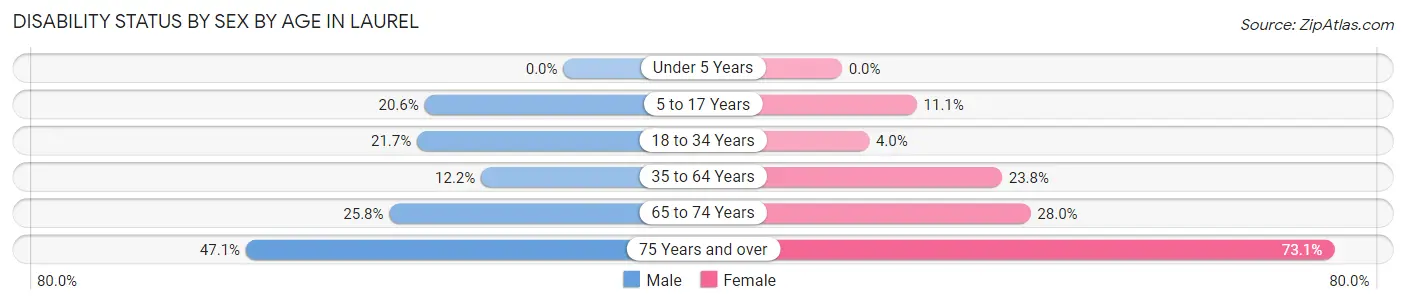
| Age Bracket | Male | Female |
| Under 5 Years | 0 (0.0%) | 0 (0.0%) |
| 5 to 17 Years | 360 (20.6%) | 165 (11.1%) |
| 18 to 34 Years | 386 (21.7%) | 87 (4.0%) |
| 35 to 64 Years | 352 (12.2%) | 727 (23.8%) |
| 65 to 74 Years | 176 (25.8%) | 237 (28.0%) |
| 75 Years and over | 239 (47.1%) | 516 (73.1%) |
Disability Class by Sex by Age in Laurel
Disability Class: Hearing Difficulty
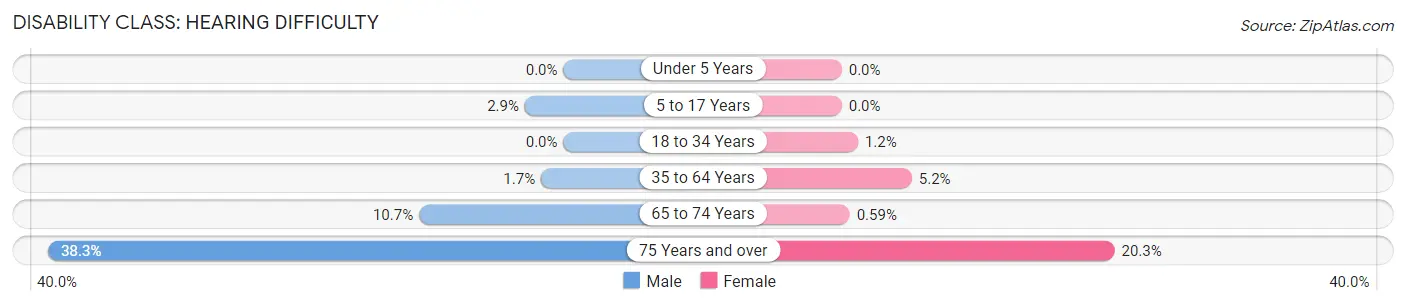
| Age Bracket | Male | Female |
| Under 5 Years | 0 (0.0%) | 0 (0.0%) |
| 5 to 17 Years | 50 (2.9%) | 0 (0.0%) |
| 18 to 34 Years | 0 (0.0%) | 26 (1.2%) |
| 35 to 64 Years | 48 (1.7%) | 159 (5.2%) |
| 65 to 74 Years | 73 (10.7%) | 5 (0.6%) |
| 75 Years and over | 194 (38.3%) | 143 (20.3%) |
Disability Class: Vision Difficulty
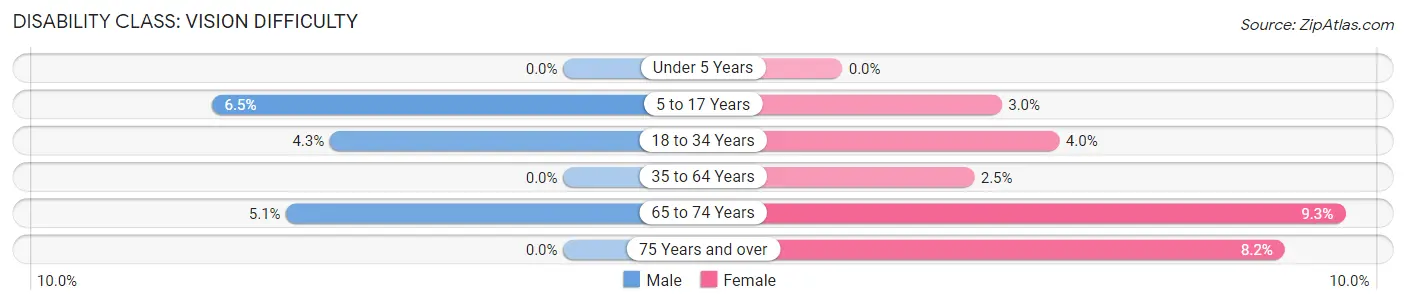
| Age Bracket | Male | Female |
| Under 5 Years | 0 (0.0%) | 0 (0.0%) |
| 5 to 17 Years | 114 (6.5%) | 44 (3.0%) |
| 18 to 34 Years | 77 (4.3%) | 87 (4.0%) |
| 35 to 64 Years | 0 (0.0%) | 75 (2.5%) |
| 65 to 74 Years | 35 (5.1%) | 79 (9.3%) |
| 75 Years and over | 0 (0.0%) | 58 (8.2%) |
Disability Class: Cognitive Difficulty
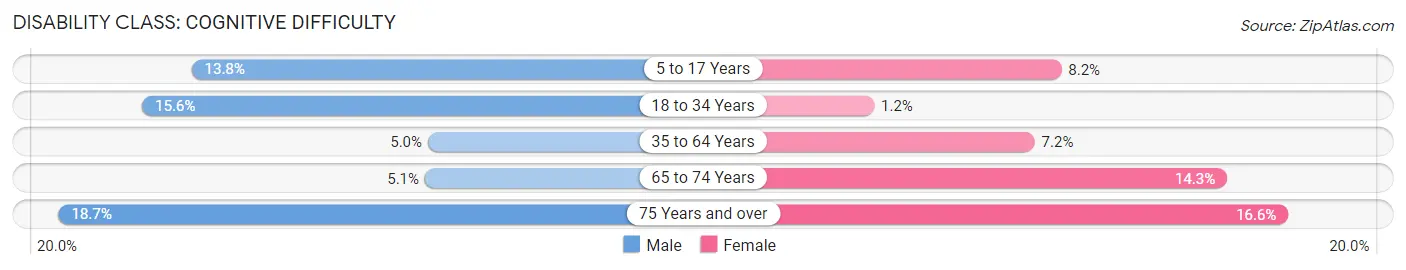
| Age Bracket | Male | Female |
| 5 to 17 Years | 241 (13.8%) | 121 (8.2%) |
| 18 to 34 Years | 278 (15.6%) | 26 (1.2%) |
| 35 to 64 Years | 145 (5.0%) | 219 (7.2%) |
| 65 to 74 Years | 35 (5.1%) | 121 (14.3%) |
| 75 Years and over | 95 (18.7%) | 117 (16.6%) |
Disability Class: Ambulatory Difficulty
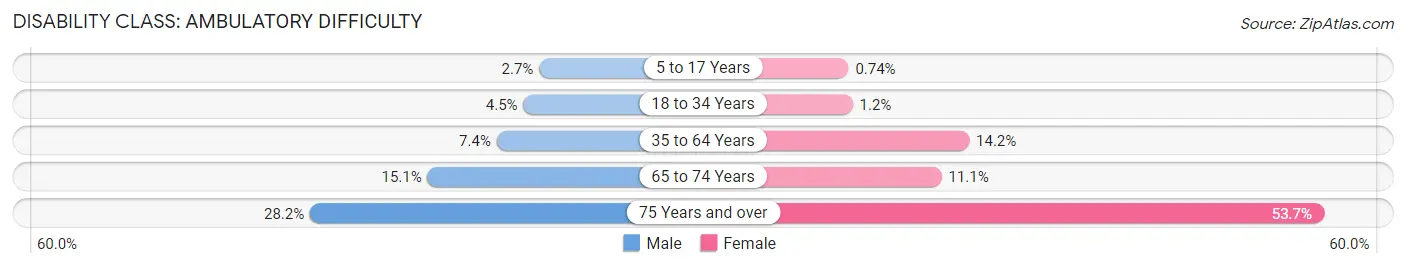
| Age Bracket | Male | Female |
| 5 to 17 Years | 47 (2.7%) | 11 (0.7%) |
| 18 to 34 Years | 79 (4.4%) | 26 (1.2%) |
| 35 to 64 Years | 214 (7.4%) | 434 (14.2%) |
| 65 to 74 Years | 103 (15.1%) | 94 (11.1%) |
| 75 Years and over | 143 (28.2%) | 379 (53.7%) |
Disability Class: Self-Care Difficulty
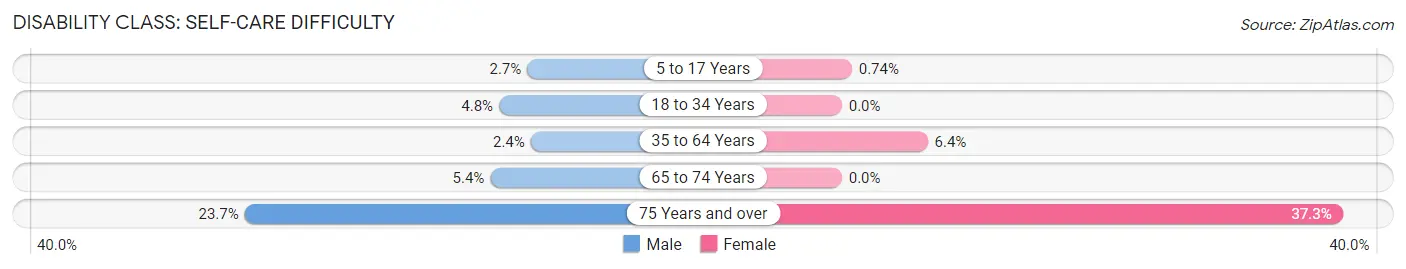
| Age Bracket | Male | Female |
| 5 to 17 Years | 47 (2.7%) | 11 (0.7%) |
| 18 to 34 Years | 85 (4.8%) | 0 (0.0%) |
| 35 to 64 Years | 70 (2.4%) | 195 (6.4%) |
| 65 to 74 Years | 37 (5.4%) | 0 (0.0%) |
| 75 Years and over | 120 (23.7%) | 263 (37.2%) |
Technology Access in Laurel
Computing Device Access in Laurel
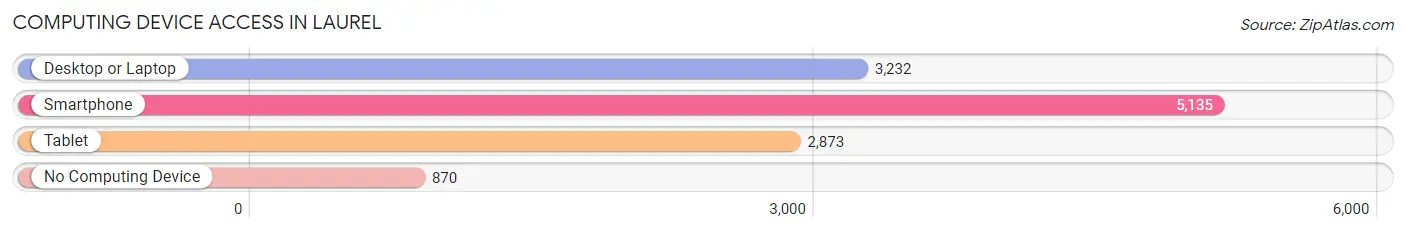
| Device Type | # Households | % Households |
| Desktop or Laptop | 3,232 | 50.2% |
| Smartphone | 5,135 | 79.7% |
| Tablet | 2,873 | 44.6% |
| No Computing Device | 870 | 13.5% |
| Total | 6,443 | 100.0% |
Internet Access in Laurel
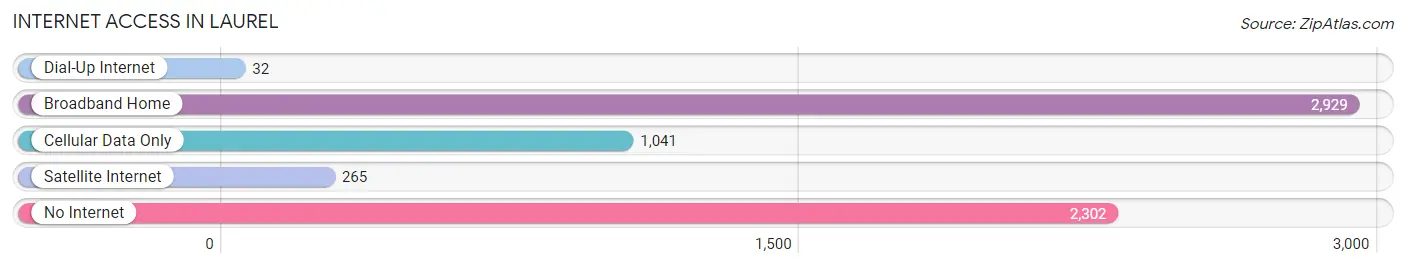
| Internet Type | # Households | % Households |
| Dial-Up Internet | 32 | 0.5% |
| Broadband Home | 2,929 | 45.5% |
| Cellular Data Only | 1,041 | 16.2% |
| Satellite Internet | 265 | 4.1% |
| No Internet | 2,302 | 35.7% |
| Total | 6,443 | 100.0% |
Laurel Summary
Laurel is a city located in Jones County, Mississippi, United States. It is the county seat of Jones County and is located in the Pine Belt region of the state. The population was estimated to be 18,540 in 2019.
History
Laurel was founded in 1882 by railroad magnate Asa Tift. The city was named after the laurel shrubs that grew in abundance in the area. The city was incorporated in 1882 and was the first city in Jones County.
In the late 19th century, Laurel was a major lumber center and was home to several large sawmills. The city was also home to a large cotton mill, which was the largest employer in the city. The city was also home to a large railroad yard, which was the largest in the state.
In the early 20th century, Laurel was a major center for the manufacture of furniture and other wood products. The city was also home to several large textile mills.
In the late 20th century, Laurel was a major center for the manufacture of automotive parts and other industrial products. The city was also home to several large manufacturing plants.
Geography
Laurel is located in the Pine Belt region of Mississippi, in the southeastern part of the state. The city is situated in the Jones County, near the Pearl River. The city is located about 60 miles southeast of Jackson, the state capital.
The city has a total area of 16.2 square miles, of which 16.1 square miles is land and 0.1 square miles is water. The city is located at an elevation of about 300 feet above sea level.
Economy
Laurel is a major center for manufacturing and industry in Mississippi. The city is home to several large manufacturing plants, including a large automotive parts plant and a large furniture plant. The city is also home to several large industrial parks.
The city is also home to several large retail stores, including Walmart, Target, and Lowe's. The city is also home to several restaurants and other businesses.
Demographics
As of the 2010 census, the population of Laurel was 18,540. The racial makeup of the city was 57.3% White, 37.7% African American, 0.3% Native American, 0.7% Asian, 0.1% Pacific Islander, 1.7% from other races, and 2.1% from two or more races. Hispanic or Latino of any race were 4.2% of the population.
The median income for a household in the city was $30,945, and the median income for a family was $37,945. The per capita income for the city was $17,845. About 19.3% of families and 22.7% of the population were below the poverty line, including 33.3% of those under age 18 and 16.2% of those age 65 or over.
Common Questions
What is Per Capita Income in Laurel?
Per Capita income in Laurel is $25,148.
What is the Median Family Income in Laurel?
Median Family Income in Laurel is $44,458.
What is the Median Household income in Laurel?
Median Household Income in Laurel is $36,336.
What is Income or Wage Gap in Laurel?
Income or Wage Gap in Laurel is 19.4%.
Women in Laurel earn 80.6 cents for every dollar earned by a man.
What is Inequality or Gini Index in Laurel?
Inequality or Gini Index in Laurel is 0.56.
What is the Total Population of Laurel?
Total Population of Laurel is 17,241.
What is the Total Male Population of Laurel?
Total Male Population of Laurel is 8,337.
What is the Total Female Population of Laurel?
Total Female Population of Laurel is 8,904.
What is the Ratio of Males per 100 Females in Laurel?
There are 93.63 Males per 100 Females in Laurel.
What is the Ratio of Females per 100 Males in Laurel?
There are 106.80 Females per 100 Males in Laurel.
What is the Median Population Age in Laurel?
Median Population Age in Laurel is 37.6 Years.
What is the Average Family Size in Laurel
Average Family Size in Laurel is 3.3 People.
What is the Average Household Size in Laurel
Average Household Size in Laurel is 2.6 People.
How Large is the Labor Force in Laurel?
There are 7,111 People in the Labor Forcein in Laurel.
What is the Percentage of People in the Labor Force in Laurel?
52.7% of People are in the Labor Force in Laurel.
What is the Unemployment Rate in Laurel?
Unemployment Rate in Laurel is 6.3%.