Madison, MS Map & Demographics
Madison Map
Madison Overview
$56,957
PER CAPITA INCOME
$143,924
AVG FAMILY INCOME
$124,575
AVG HOUSEHOLD INCOME
33.8%
WAGE / INCOME GAP [ % ]
66.2¢/ $1
WAGE / INCOME GAP [ $ ]
$13,240
FAMILY INCOME DEFICIT
0.43
INEQUALITY / GINI INDEX
27,595
TOTAL POPULATION
13,435
MALE POPULATION
14,160
FEMALE POPULATION
94.88
MALES / 100 FEMALES
105.40
FEMALES / 100 MALES
40.6
MEDIAN AGE
3.4
AVG FAMILY SIZE
2.9
AVG HOUSEHOLD SIZE
13,674
LABOR FORCE [ PEOPLE ]
65.6%
PERCENT IN LABOR FORCE
2.7%
UNEMPLOYMENT RATE
Madison Zip Codes
Income in Madison
Income Overview in Madison
Per Capita Income in Madison is $56,957, while median incomes of families and households are $143,924 and $124,575 respectively.
| Characteristic | Number | Measure |
| Per Capita Income | 27,595 | $56,957 |
| Median Family Income | 7,376 | $143,924 |
| Mean Family Income | 7,376 | $189,979 |
| Median Household Income | 9,381 | $124,575 |
| Mean Household Income | 9,381 | $170,446 |
| Income Deficit | 7,376 | $13,240 |
| Wage / Income Gap (%) | 27,595 | 33.78% |
| Wage / Income Gap ($) | 27,595 | 66.22¢ per $1 |
| Gini / Inequality Index | 27,595 | 0.43 |
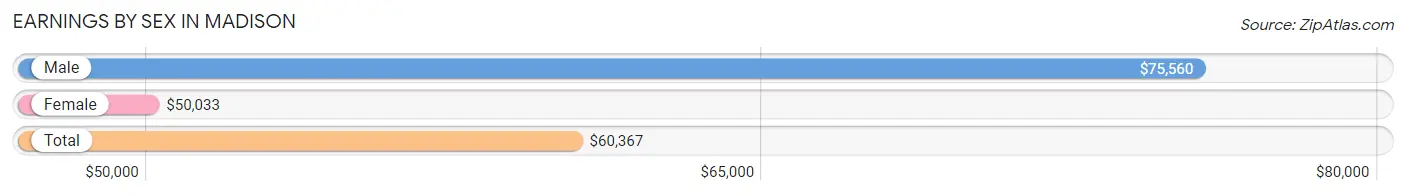
Earnings by Sex in Madison
Average Earnings in Madison are $60,367, $75,560 for men and $50,033 for women, a difference of 33.8%.
| Sex | Number | Average Earnings |
| Male | 7,369 (51.3%) | $75,560 |
| Female | 7,002 (48.7%) | $50,033 |
| Total | 14,371 (100.0%) | $60,367 |
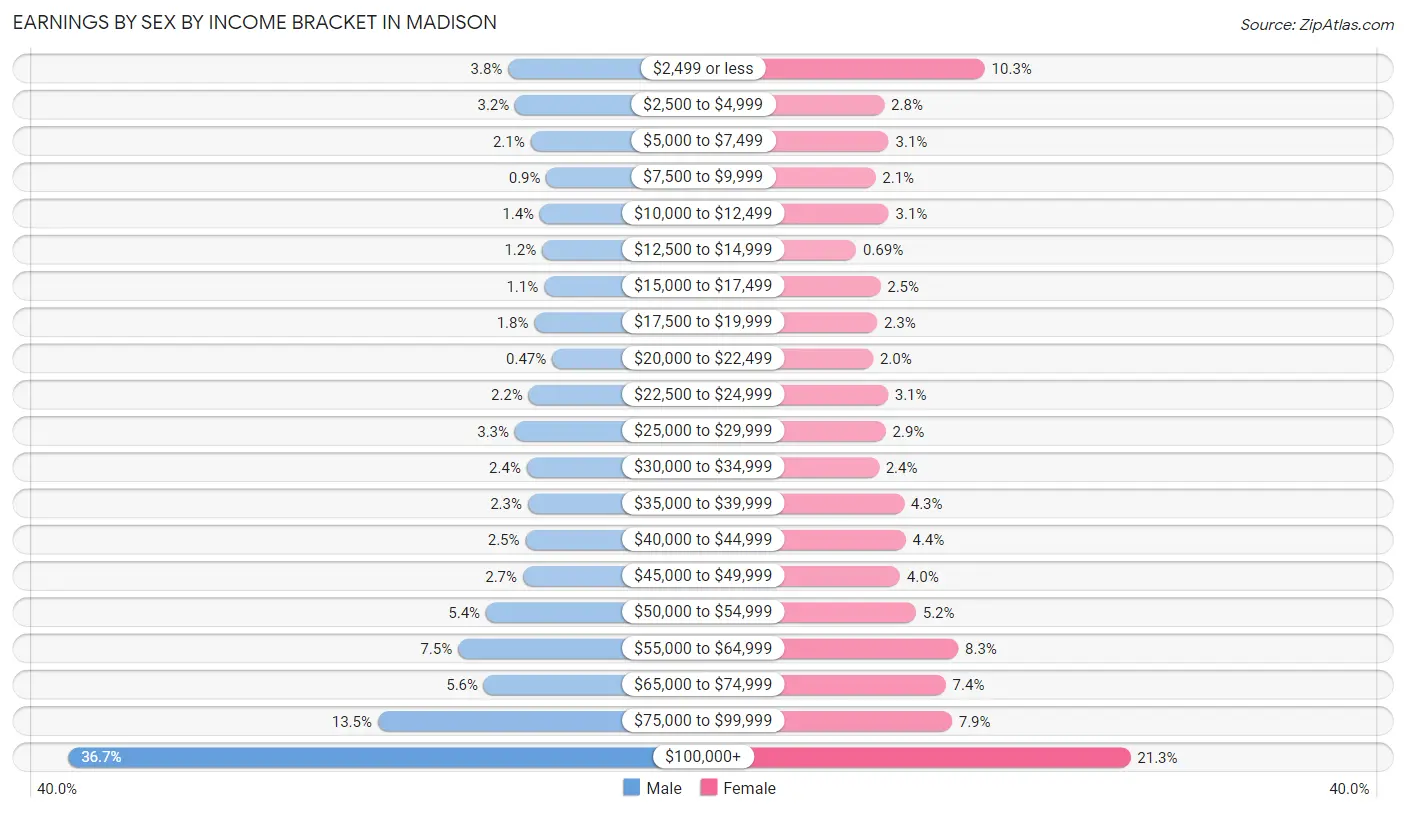
Earnings by Sex by Income Bracket in Madison
The most common earnings brackets in Madison are $100,000+ for men (2,707 | 36.7%) and $100,000+ for women (1,488 | 21.2%).
| Income | Male | Female |
| $2,499 or less | 277 (3.8%) | 723 (10.3%) |
| $2,500 to $4,999 | 239 (3.2%) | 196 (2.8%) |
| $5,000 to $7,499 | 153 (2.1%) | 219 (3.1%) |
| $7,500 to $9,999 | 66 (0.9%) | 150 (2.1%) |
| $10,000 to $12,499 | 102 (1.4%) | 219 (3.1%) |
| $12,500 to $14,999 | 90 (1.2%) | 48 (0.7%) |
| $15,000 to $17,499 | 79 (1.1%) | 176 (2.5%) |
| $17,500 to $19,999 | 133 (1.8%) | 158 (2.3%) |
| $20,000 to $22,499 | 35 (0.5%) | 137 (2.0%) |
| $22,500 to $24,999 | 164 (2.2%) | 215 (3.1%) |
| $25,000 to $29,999 | 240 (3.3%) | 204 (2.9%) |
| $30,000 to $34,999 | 175 (2.4%) | 167 (2.4%) |
| $35,000 to $39,999 | 169 (2.3%) | 299 (4.3%) |
| $40,000 to $44,999 | 182 (2.5%) | 308 (4.4%) |
| $45,000 to $49,999 | 196 (2.7%) | 279 (4.0%) |
| $50,000 to $54,999 | 400 (5.4%) | 362 (5.2%) |
| $55,000 to $64,999 | 554 (7.5%) | 584 (8.3%) |
| $65,000 to $74,999 | 411 (5.6%) | 519 (7.4%) |
| $75,000 to $99,999 | 997 (13.5%) | 551 (7.9%) |
| $100,000+ | 2,707 (36.7%) | 1,488 (21.2%) |
| Total | 7,369 (100.0%) | 7,002 (100.0%) |
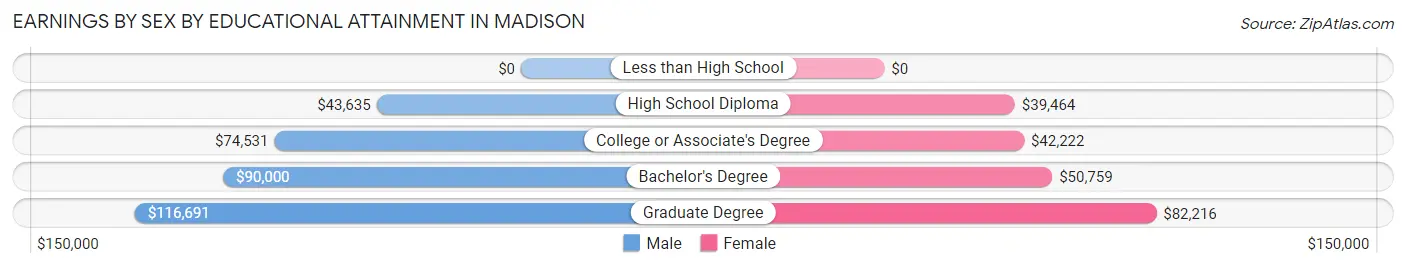
Earnings by Sex by Educational Attainment in Madison
Average earnings in Madison are $85,380 for men and $56,721 for women, a difference of 33.6%. Men with an educational attainment of graduate degree enjoy the highest average annual earnings of $116,691, while those with high school diploma education earn the least with $43,635. Women with an educational attainment of graduate degree earn the most with the average annual earnings of $82,216, while those with high school diploma education have the smallest earnings of $39,464.
| Educational Attainment | Male Income | Female Income |
| Less than High School | - | - |
| High School Diploma | $43,635 | $39,464 |
| College or Associate's Degree | $74,531 | $42,222 |
| Bachelor's Degree | $90,000 | $50,759 |
| Graduate Degree | $116,691 | $82,216 |
| Total | $85,380 | $56,721 |
Family Income in Madison
Family Income Brackets in Madison
According to the Madison family income data, there are 2,360 families falling into the $200,000+ income range, which is the most common income bracket and makes up 32.0% of all families.
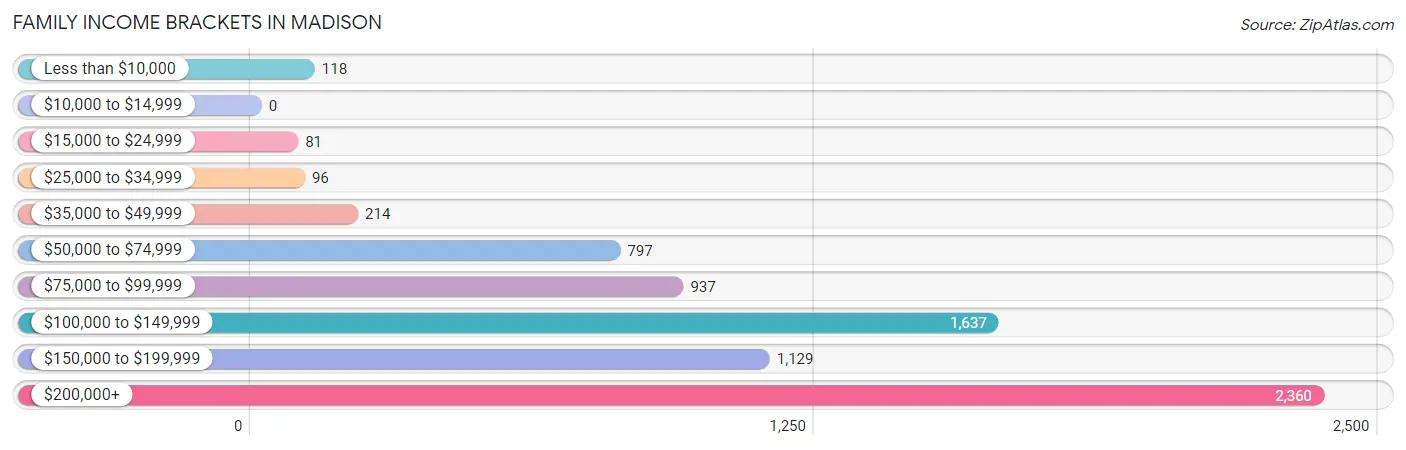
| Income Bracket | # Families | % Families |
| Less than $10,000 | 118 | 1.6% |
| $10,000 to $14,999 | 0 | 0.0% |
| $15,000 to $24,999 | 81 | 1.1% |
| $25,000 to $34,999 | 96 | 1.3% |
| $35,000 to $49,999 | 214 | 2.9% |
| $50,000 to $74,999 | 797 | 10.8% |
| $75,000 to $99,999 | 937 | 12.7% |
| $100,000 to $149,999 | 1,637 | 22.2% |
| $150,000 to $199,999 | 1,129 | 15.3% |
| $200,000+ | 2,360 | 32.0% |
Family Income by Famaliy Size in Madison
6-person families (406 | 5.5%) account for the highest median family income in Madison with $250,001 per family, while 2-person families (2,994 | 40.6%) have the highest median income of $60,938 per family member.
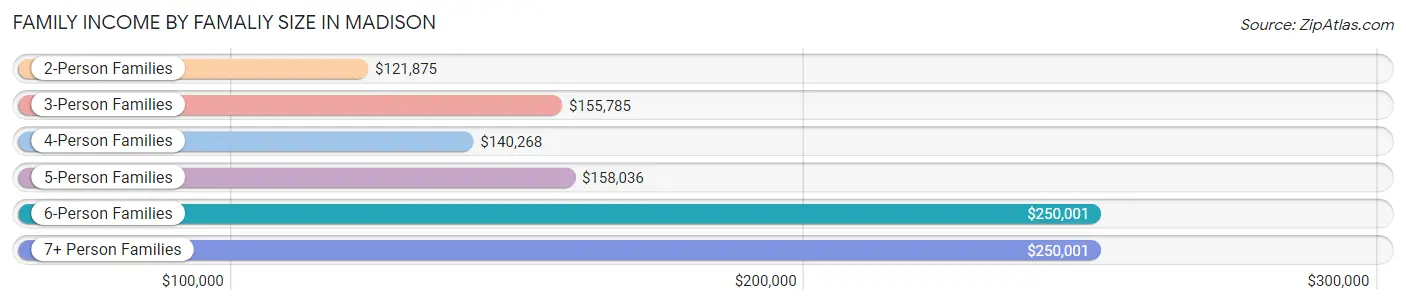
| Income Bracket | # Families | Median Income |
| 2-Person Families | 2,994 (40.6%) | $121,875 |
| 3-Person Families | 1,431 (19.4%) | $155,785 |
| 4-Person Families | 1,720 (23.3%) | $140,268 |
| 5-Person Families | 765 (10.4%) | $158,036 |
| 6-Person Families | 406 (5.5%) | $250,001 |
| 7+ Person Families | 60 (0.8%) | $250,001 |
| Total | 7,376 (100.0%) | $143,924 |
Family Income by Number of Earners in Madison
The median family income in Madison is $143,924, with families comprising 3+ earners (812) having the highest median family income of $163,125, while families with no earners (672) have the lowest median family income of $93,981, accounting for 11.0% and 9.1% of families, respectively.
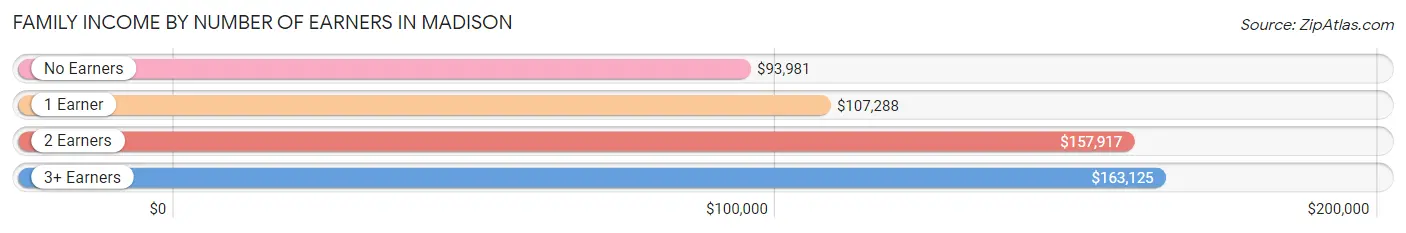
| Number of Earners | # Families | Median Income |
| No Earners | 672 (9.1%) | $93,981 |
| 1 Earner | 1,828 (24.8%) | $107,288 |
| 2 Earners | 4,064 (55.1%) | $157,917 |
| 3+ Earners | 812 (11.0%) | $163,125 |
| Total | 7,376 (100.0%) | $143,924 |
Household Income in Madison
Household Income Brackets in Madison
With 2,448 households falling in the category, the $200,000+ income range is the most frequent in Madison, accounting for 26.1% of all households. In contrast, only 19 households (0.2%) fall into the $10,000 to $14,999 income bracket, making it the least populous group.
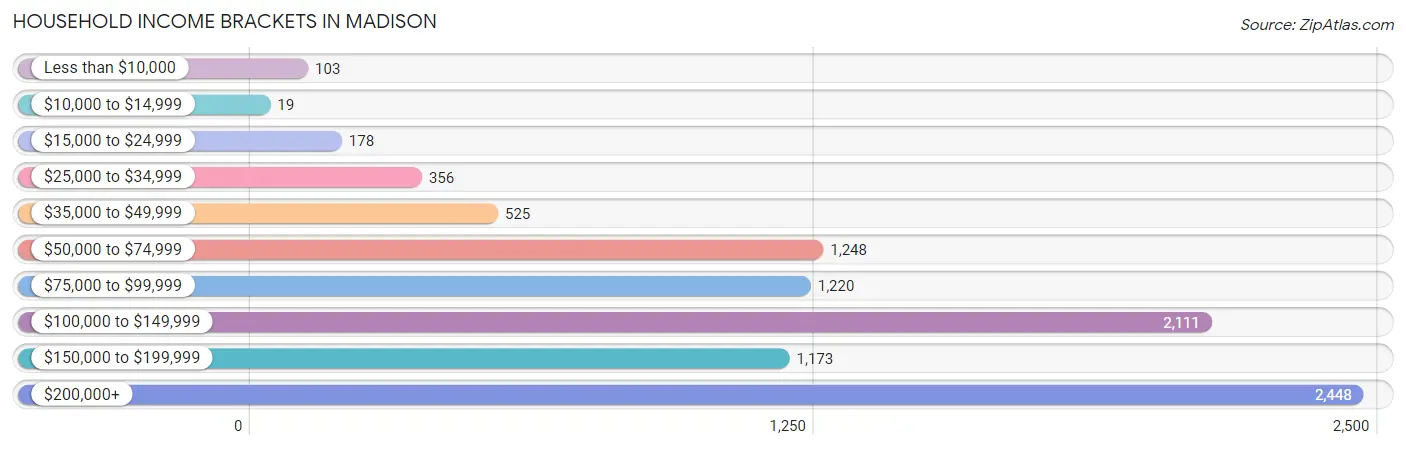
| Income Bracket | # Households | % Households |
| Less than $10,000 | 103 | 1.1% |
| $10,000 to $14,999 | 19 | 0.2% |
| $15,000 to $24,999 | 178 | 1.9% |
| $25,000 to $34,999 | 356 | 3.8% |
| $35,000 to $49,999 | 525 | 5.6% |
| $50,000 to $74,999 | 1,248 | 13.3% |
| $75,000 to $99,999 | 1,220 | 13.0% |
| $100,000 to $149,999 | 2,111 | 22.5% |
| $150,000 to $199,999 | 1,173 | 12.5% |
| $200,000+ | 2,448 | 26.1% |
Household Income by Householder Age in Madison
The median household income in Madison is $124,575, with the highest median household income of $146,172 found in the 45 to 64 years age bracket for the primary householder. A total of 4,182 households (44.6%) fall into this category. Meanwhile, the 15 to 24 years age bracket for the primary householder has the lowest median household income of $79,531, with 191 households (2.0%) in this group.
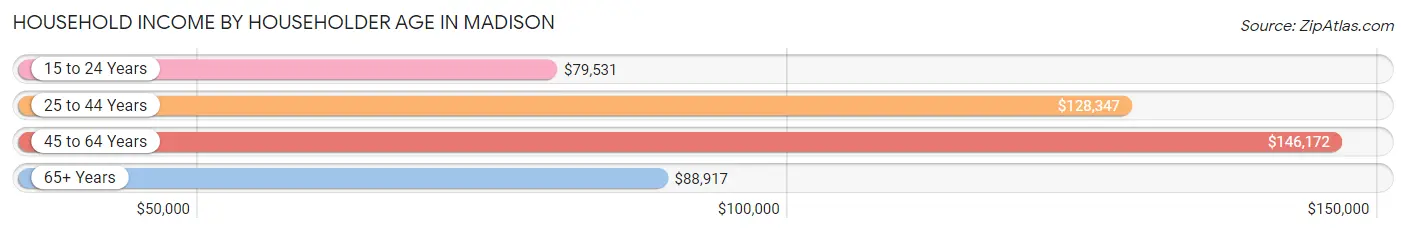
| Income Bracket | # Households | Median Income |
| 15 to 24 Years | 191 (2.0%) | $79,531 |
| 25 to 44 Years | 2,603 (27.8%) | $128,347 |
| 45 to 64 Years | 4,182 (44.6%) | $146,172 |
| 65+ Years | 2,405 (25.6%) | $88,917 |
| Total | 9,381 (100.0%) | $124,575 |
Poverty in Madison
Income Below Poverty by Sex and Age in Madison
With 4.4% poverty level for males and 5.0% for females among the residents of Madison, under 5 year old males and 75 year old and over females are the most vulnerable to poverty, with 143 males (15.9%) and 193 females (18.4%) in their respective age groups living below the poverty level.
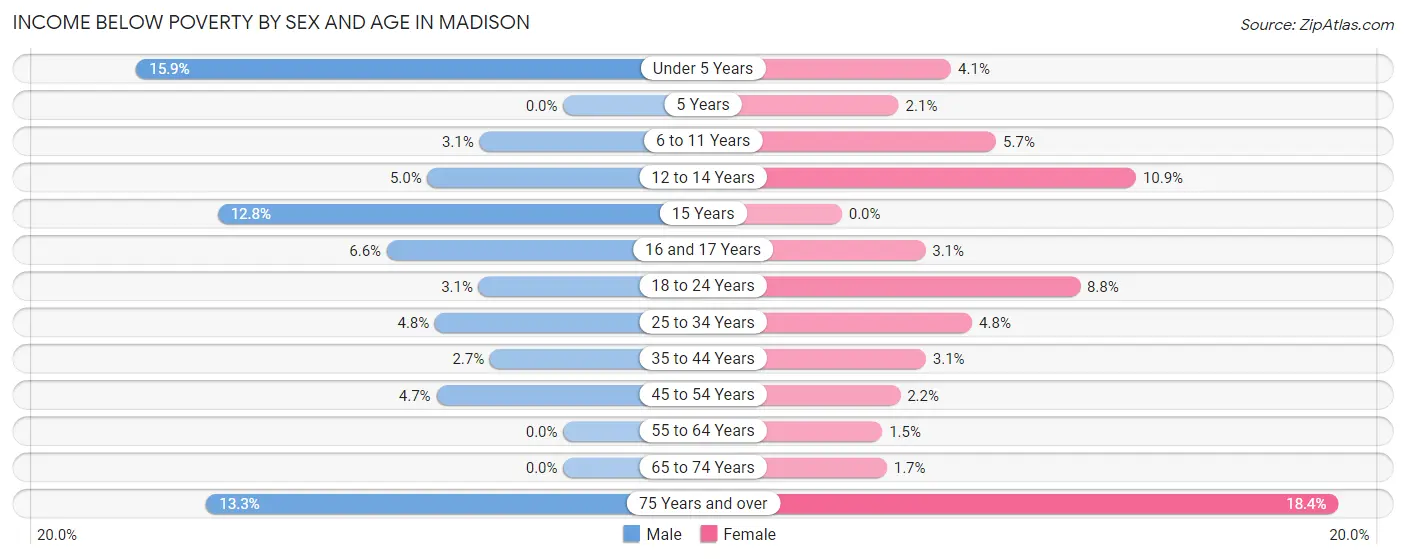
| Age Bracket | Male | Female |
| Under 5 Years | 143 (15.9%) | 34 (4.1%) |
| 5 Years | 0 (0.0%) | 4 (2.1%) |
| 6 to 11 Years | 38 (3.1%) | 62 (5.7%) |
| 12 to 14 Years | 46 (5.0%) | 88 (10.9%) |
| 15 Years | 49 (12.8%) | 0 (0.0%) |
| 16 and 17 Years | 19 (6.6%) | 18 (3.1%) |
| 18 to 24 Years | 36 (3.1%) | 81 (8.8%) |
| 25 to 34 Years | 47 (4.8%) | 57 (4.8%) |
| 35 to 44 Years | 48 (2.7%) | 68 (3.1%) |
| 45 to 54 Years | 91 (4.7%) | 38 (2.2%) |
| 55 to 64 Years | 0 (0.0%) | 30 (1.5%) |
| 65 to 74 Years | 0 (0.0%) | 22 (1.7%) |
| 75 Years and over | 75 (13.3%) | 193 (18.4%) |
| Total | 592 (4.4%) | 695 (5.0%) |
Income Above Poverty by Sex and Age in Madison
According to the poverty statistics in Madison, males aged 5 years and females aged 15 years are the age groups that are most secure financially, with 100.0% of males and 100.0% of females in these age groups living above the poverty line.
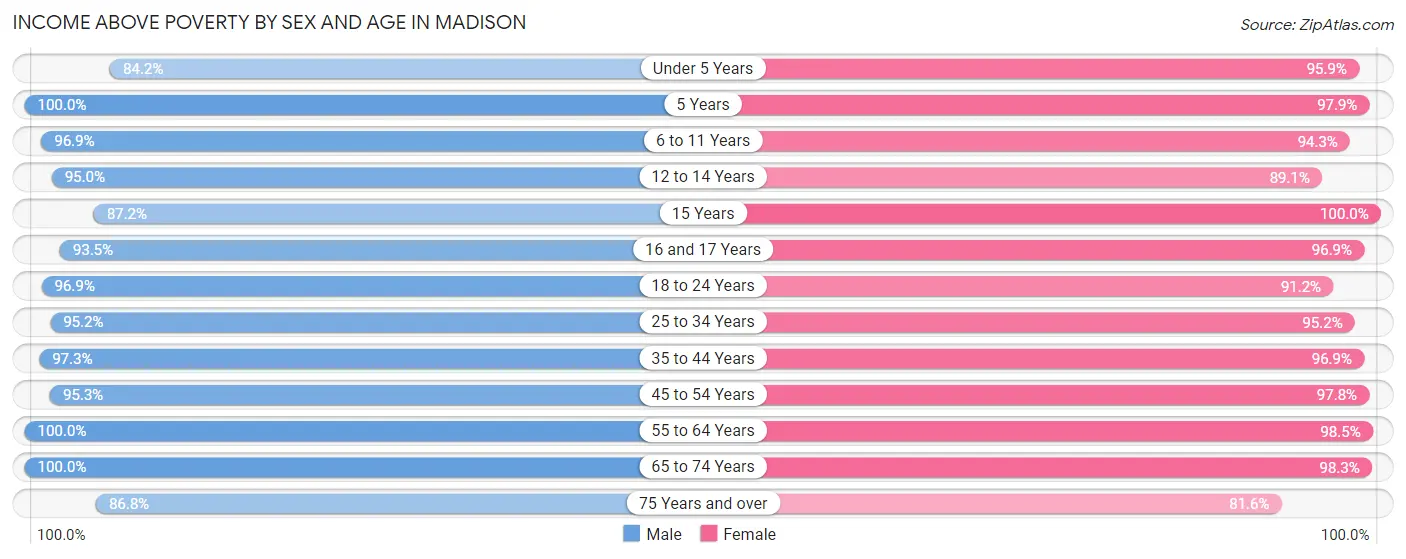
| Age Bracket | Male | Female |
| Under 5 Years | 759 (84.2%) | 803 (95.9%) |
| 5 Years | 156 (100.0%) | 186 (97.9%) |
| 6 to 11 Years | 1,183 (96.9%) | 1,020 (94.3%) |
| 12 to 14 Years | 867 (95.0%) | 718 (89.1%) |
| 15 Years | 333 (87.2%) | 166 (100.0%) |
| 16 and 17 Years | 271 (93.4%) | 562 (96.9%) |
| 18 to 24 Years | 1,110 (96.9%) | 835 (91.2%) |
| 25 to 34 Years | 941 (95.2%) | 1,120 (95.2%) |
| 35 to 44 Years | 1,715 (97.3%) | 2,112 (96.9%) |
| 45 to 54 Years | 1,840 (95.3%) | 1,711 (97.8%) |
| 55 to 64 Years | 1,779 (100.0%) | 1,964 (98.5%) |
| 65 to 74 Years | 1,397 (100.0%) | 1,299 (98.3%) |
| 75 Years and over | 491 (86.8%) | 854 (81.6%) |
| Total | 12,842 (95.6%) | 13,350 (95.1%) |
Income Below Poverty Among Married-Couple Families in Madison
The poverty statistics for married-couple families in Madison show that 1.3% or 84 of the total 6,685 families live below the poverty line. Families with 1 or 2 children have the highest poverty rate of 2.7%, comprising of 66 families. On the other hand, families with 5 or more children have the lowest poverty rate of 0.0%, which includes 0 families.
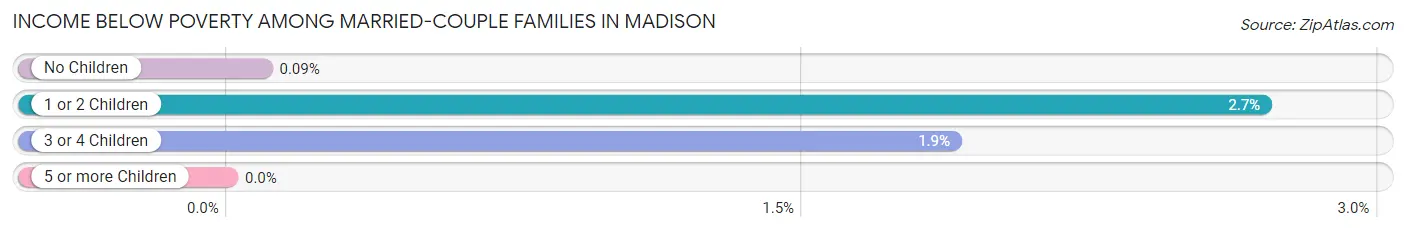
| Children | Above Poverty | Below Poverty |
| No Children | 3,412 (99.9%) | 3 (0.1%) |
| 1 or 2 Children | 2,380 (97.3%) | 66 (2.7%) |
| 3 or 4 Children | 778 (98.1%) | 15 (1.9%) |
| 5 or more Children | 31 (100.0%) | 0 (0.0%) |
| Total | 6,601 (98.7%) | 84 (1.3%) |
Income Below Poverty Among Single-Parent Households in Madison
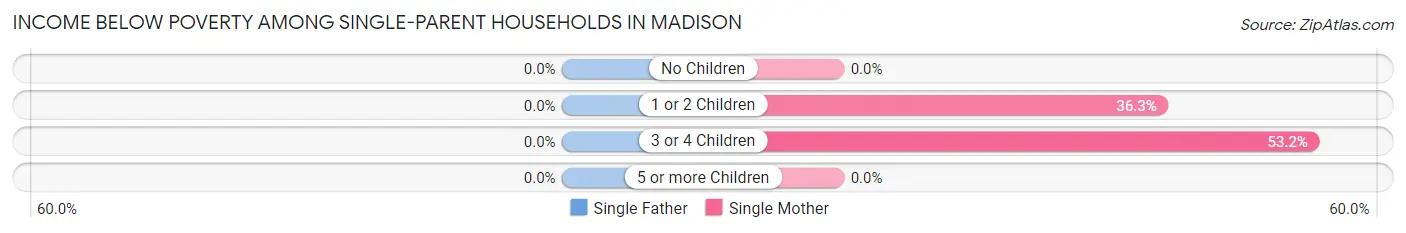
| Children | Single Father | Single Mother |
| No Children | 0 (0.0%) | 0 (0.0%) |
| 1 or 2 Children | 0 (0.0%) | 98 (36.3%) |
| 3 or 4 Children | 0 (0.0%) | 50 (53.2%) |
| 5 or more Children | 0 (0.0%) | 0 (0.0%) |
| Total | 0 (0.0%) | 148 (29.0%) |
Income Below Poverty Among Married-Couple vs Single-Parent Households in Madison
The poverty data for Madison shows that 84 of the married-couple family households (1.3%) and 148 of the single-parent households (21.4%) are living below the poverty level. Within the married-couple family households, those with 1 or 2 children have the highest poverty rate, with 66 households (2.7%) falling below the poverty line. Among the single-parent households, those with 3 or 4 children have the highest poverty rate, with 50 household (49.0%) living below poverty.
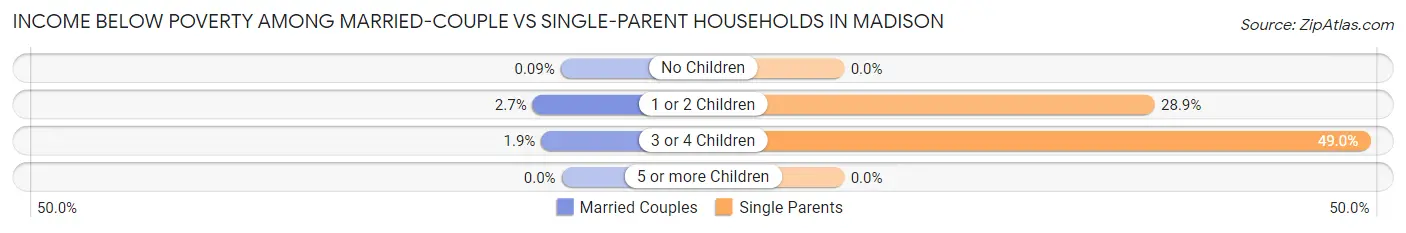
| Children | Married-Couple Families | Single-Parent Households |
| No Children | 3 (0.1%) | 0 (0.0%) |
| 1 or 2 Children | 66 (2.7%) | 98 (28.9%) |
| 3 or 4 Children | 15 (1.9%) | 50 (49.0%) |
| 5 or more Children | 0 (0.0%) | 0 (0.0%) |
| Total | 84 (1.3%) | 148 (21.4%) |
Race in Madison
The most populous races in Madison are White / Caucasian (21,402 | 77.6%), Black / African American (3,633 | 13.2%), and Asian (1,661 | 6.0%).
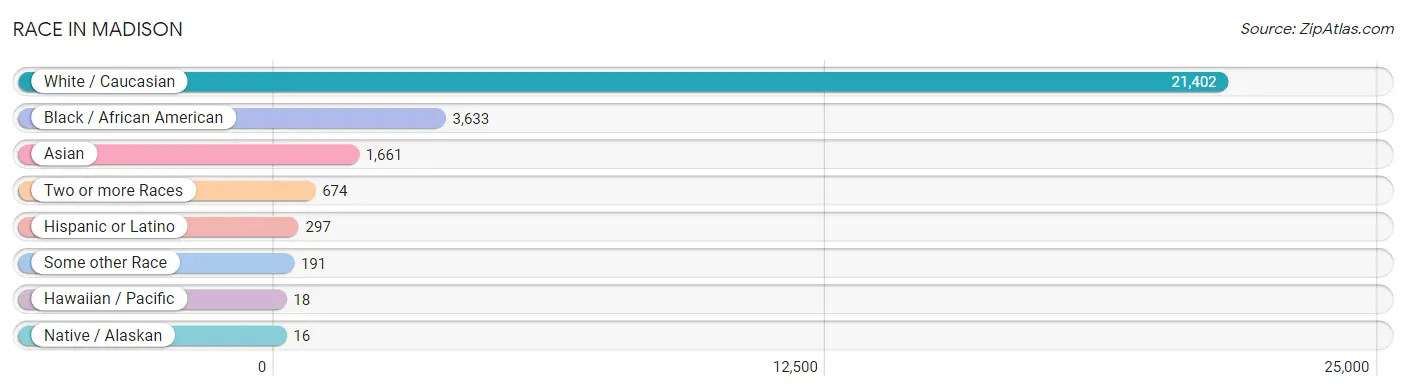
| Race | # Population | % Population |
| Asian | 1,661 | 6.0% |
| Black / African American | 3,633 | 13.2% |
| Hawaiian / Pacific | 18 | 0.1% |
| Hispanic or Latino | 297 | 1.1% |
| Native / Alaskan | 16 | 0.1% |
| White / Caucasian | 21,402 | 77.6% |
| Two or more Races | 674 | 2.4% |
| Some other Race | 191 | 0.7% |
| Total | 27,595 | 100.0% |
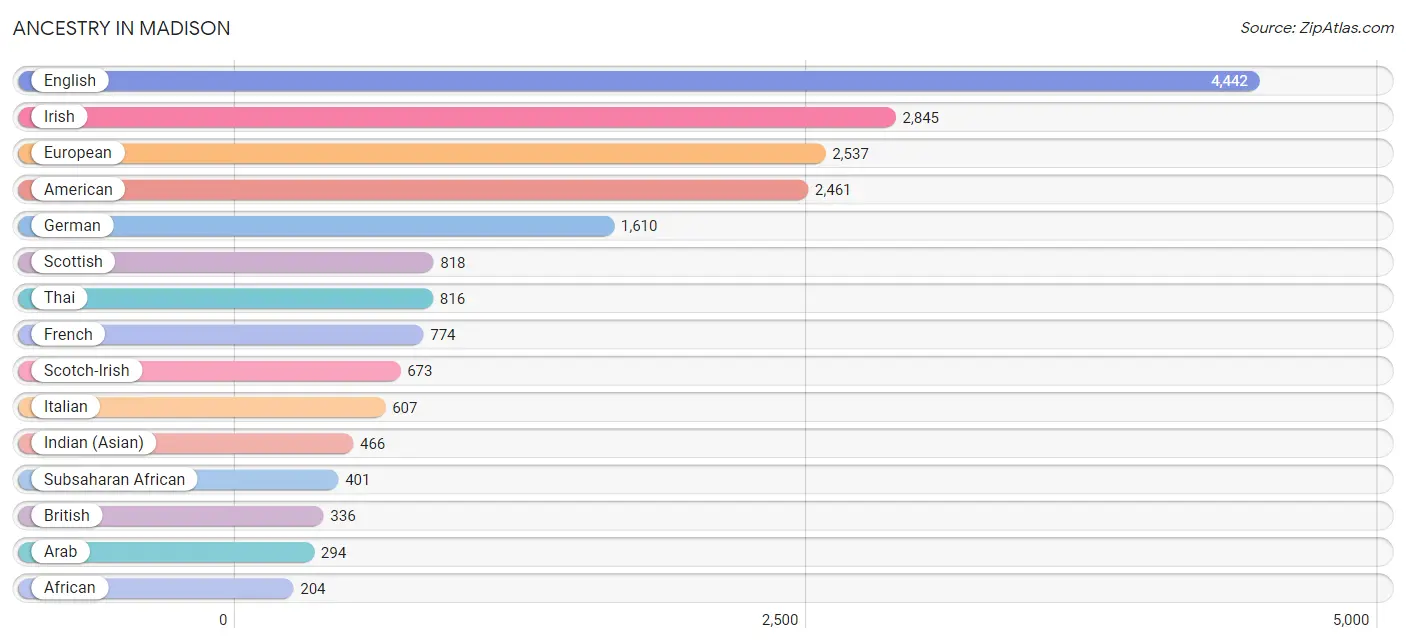
Ancestry in Madison
The most populous ancestries reported in Madison are English (4,442 | 16.1%), Irish (2,845 | 10.3%), European (2,537 | 9.2%), American (2,461 | 8.9%), and German (1,610 | 5.8%), together accounting for 50.3% of all Madison residents.
| Ancestry | # Population | % Population |
| African | 204 | 0.7% |
| American | 2,461 | 8.9% |
| Arab | 294 | 1.1% |
| Argentinean | 8 | 0.0% |
| Austrian | 9 | 0.0% |
| Basque | 21 | 0.1% |
| Brazilian | 31 | 0.1% |
| British | 336 | 1.2% |
| Burmese | 70 | 0.3% |
| Cajun | 29 | 0.1% |
| Canadian | 21 | 0.1% |
| Celtic | 17 | 0.1% |
| Central American | 37 | 0.1% |
| Cherokee | 31 | 0.1% |
| Choctaw | 23 | 0.1% |
| Colombian | 11 | 0.0% |
| Croatian | 13 | 0.1% |
| Cuban | 5 | 0.0% |
| Danish | 43 | 0.2% |
| Dutch | 102 | 0.4% |
| Eastern European | 11 | 0.0% |
| Ecuadorian | 7 | 0.0% |
| English | 4,442 | 16.1% |
| European | 2,537 | 9.2% |
| Filipino | 10 | 0.0% |
| French | 774 | 2.8% |
| French Canadian | 24 | 0.1% |
| German | 1,610 | 5.8% |
| Ghanaian | 33 | 0.1% |
| Greek | 10 | 0.0% |
| Guatemalan | 37 | 0.1% |
| Haitian | 10 | 0.0% |
| Houma | 13 | 0.1% |
| Indian (Asian) | 466 | 1.7% |
| Iranian | 113 | 0.4% |
| Irish | 2,845 | 10.3% |
| Italian | 607 | 2.2% |
| Jordanian | 26 | 0.1% |
| Korean | 158 | 0.6% |
| Lebanese | 128 | 0.5% |
| Mexican | 144 | 0.5% |
| Nigerian | 168 | 0.6% |
| Northern European | 59 | 0.2% |
| Norwegian | 48 | 0.2% |
| Palestinian | 15 | 0.1% |
| Peruvian | 85 | 0.3% |
| Polish | 87 | 0.3% |
| Portuguese | 7 | 0.0% |
| Russian | 52 | 0.2% |
| Scandinavian | 31 | 0.1% |
| Scotch-Irish | 673 | 2.4% |
| Scottish | 818 | 3.0% |
| Slovene | 13 | 0.1% |
| South African | 8 | 0.0% |
| South American | 111 | 0.4% |
| Sri Lankan | 84 | 0.3% |
| Subsaharan African | 401 | 1.5% |
| Swedish | 33 | 0.1% |
| Swiss | 14 | 0.1% |
| Thai | 816 | 3.0% |
| Ukrainian | 61 | 0.2% |
| Welsh | 123 | 0.4% |
| West Indian | 3 | 0.0% | View All 63 Rows |
Immigrants in Madison
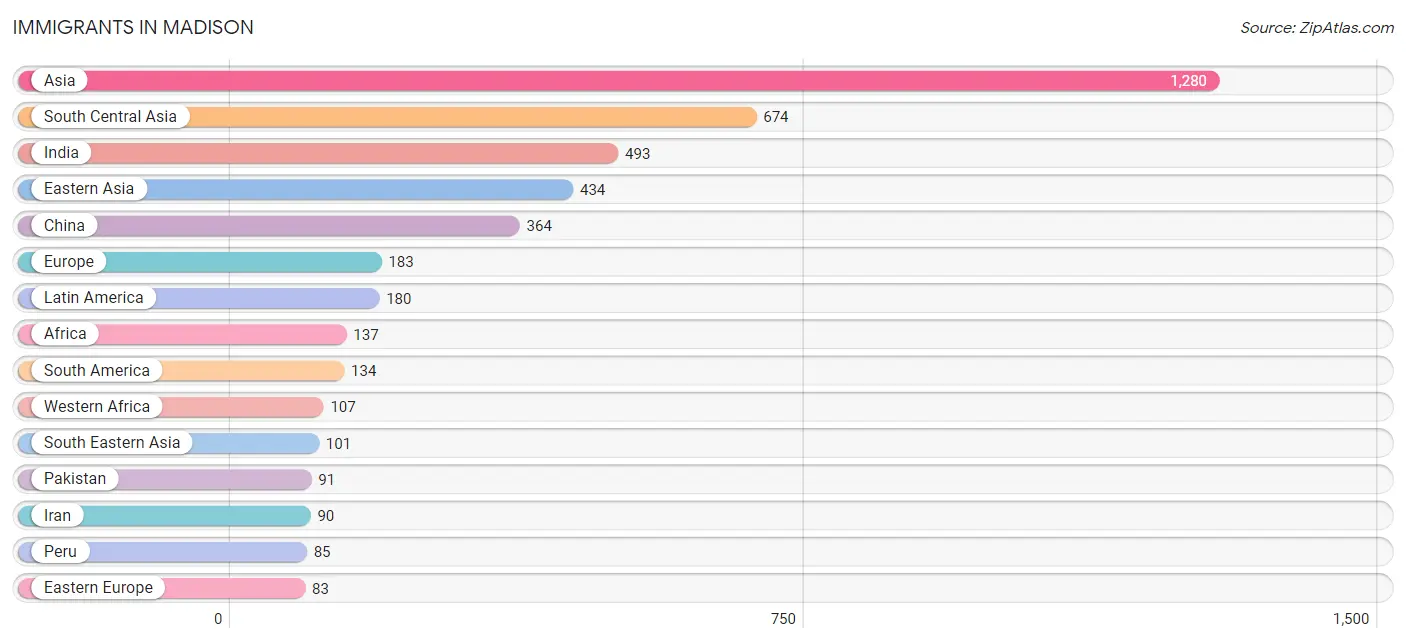
The most numerous immigrant groups reported in Madison came from Asia (1,280 | 4.6%), South Central Asia (674 | 2.4%), India (493 | 1.8%), Eastern Asia (434 | 1.6%), and China (364 | 1.3%), together accounting for 11.8% of all Madison residents.
| Immigration Origin | # Population | % Population |
| Africa | 137 | 0.5% |
| Asia | 1,280 | 4.6% |
| Austria | 9 | 0.0% |
| Brazil | 31 | 0.1% |
| Caribbean | 3 | 0.0% |
| Central America | 43 | 0.2% |
| China | 364 | 1.3% |
| Colombia | 11 | 0.0% |
| Eastern Asia | 434 | 1.6% |
| Eastern Europe | 83 | 0.3% |
| Ecuador | 7 | 0.0% |
| Europe | 183 | 0.7% |
| Germany | 44 | 0.2% |
| Ghana | 21 | 0.1% |
| Guatemala | 13 | 0.1% |
| India | 493 | 1.8% |
| Iran | 90 | 0.3% |
| Ireland | 27 | 0.1% |
| Israel | 13 | 0.1% |
| Jordan | 12 | 0.0% |
| Korea | 70 | 0.3% |
| Kuwait | 15 | 0.1% |
| Latin America | 180 | 0.6% |
| Liberia | 17 | 0.1% |
| Mexico | 30 | 0.1% |
| Nigeria | 69 | 0.3% |
| Northern Africa | 22 | 0.1% |
| Northern Europe | 47 | 0.2% |
| Pakistan | 91 | 0.3% |
| Peru | 85 | 0.3% |
| Philippines | 63 | 0.2% |
| Poland | 47 | 0.2% |
| Russia | 18 | 0.1% |
| South Africa | 8 | 0.0% |
| South America | 134 | 0.5% |
| South Central Asia | 674 | 2.4% |
| South Eastern Asia | 101 | 0.4% |
| Taiwan | 10 | 0.0% |
| Ukraine | 18 | 0.1% |
| Vietnam | 38 | 0.1% |
| Western Africa | 107 | 0.4% |
| Western Asia | 40 | 0.1% |
| Western Europe | 53 | 0.2% | View All 43 Rows |
Sex and Age in Madison
Sex and Age in Madison
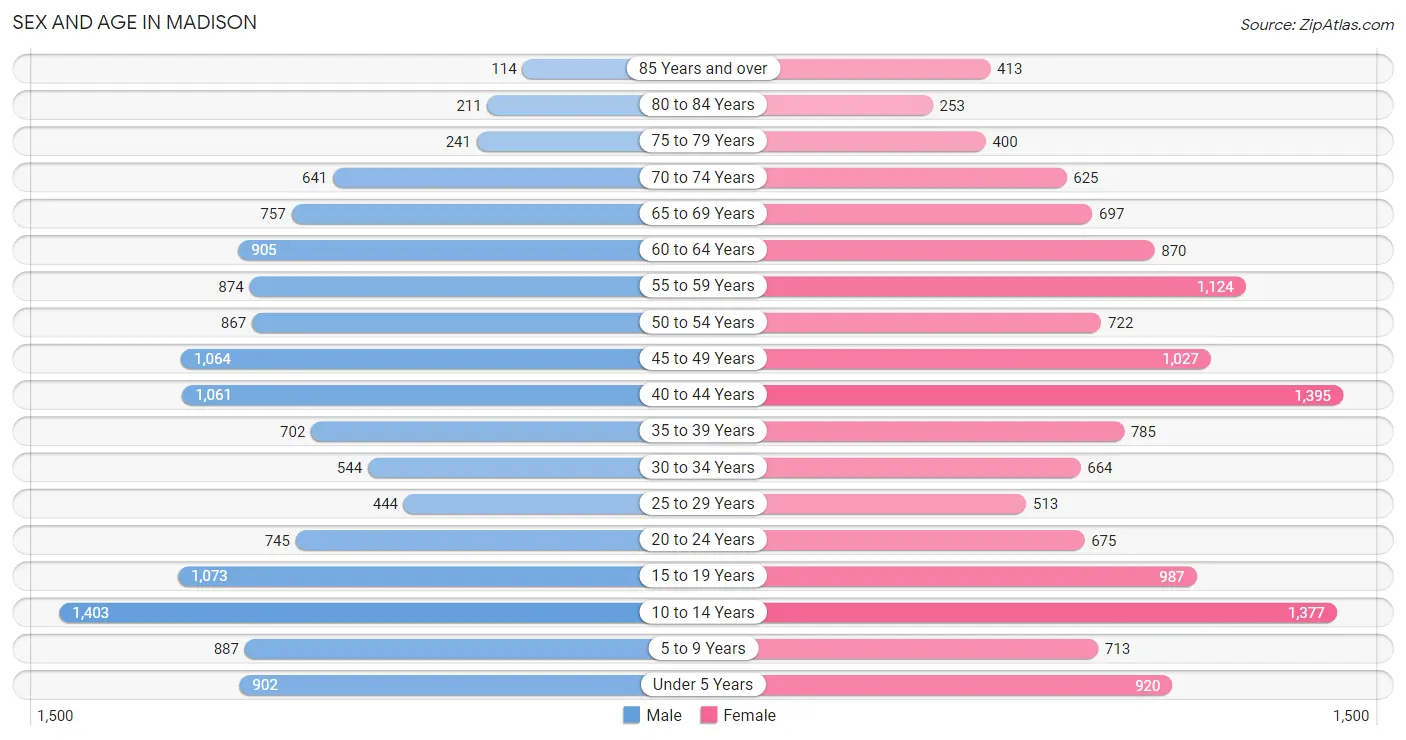
The most populous age groups in Madison are 10 to 14 Years (1,403 | 10.4%) for men and 40 to 44 Years (1,395 | 9.9%) for women.
| Age Bracket | Male | Female |
| Under 5 Years | 902 (6.7%) | 920 (6.5%) |
| 5 to 9 Years | 887 (6.6%) | 713 (5.0%) |
| 10 to 14 Years | 1,403 (10.4%) | 1,377 (9.7%) |
| 15 to 19 Years | 1,073 (8.0%) | 987 (7.0%) |
| 20 to 24 Years | 745 (5.6%) | 675 (4.8%) |
| 25 to 29 Years | 444 (3.3%) | 513 (3.6%) |
| 30 to 34 Years | 544 (4.1%) | 664 (4.7%) |
| 35 to 39 Years | 702 (5.2%) | 785 (5.5%) |
| 40 to 44 Years | 1,061 (7.9%) | 1,395 (9.9%) |
| 45 to 49 Years | 1,064 (7.9%) | 1,027 (7.2%) |
| 50 to 54 Years | 867 (6.5%) | 722 (5.1%) |
| 55 to 59 Years | 874 (6.5%) | 1,124 (7.9%) |
| 60 to 64 Years | 905 (6.7%) | 870 (6.1%) |
| 65 to 69 Years | 757 (5.6%) | 697 (4.9%) |
| 70 to 74 Years | 641 (4.8%) | 625 (4.4%) |
| 75 to 79 Years | 241 (1.8%) | 400 (2.8%) |
| 80 to 84 Years | 211 (1.6%) | 253 (1.8%) |
| 85 Years and over | 114 (0.9%) | 413 (2.9%) |
| Total | 13,435 (100.0%) | 14,160 (100.0%) |
Families and Households in Madison
Median Family Size in Madison
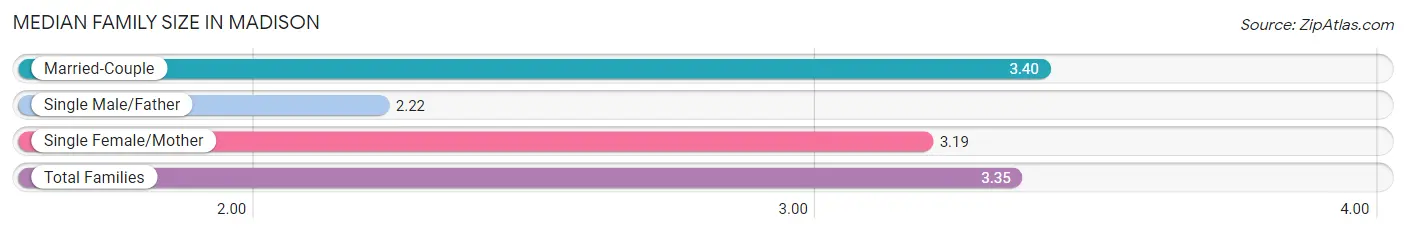
The median family size in Madison is 3.35 persons per family, with married-couple families (6,685 | 90.6%) accounting for the largest median family size of 3.4 persons per family. On the other hand, single male/father families (181 | 2.5%) represent the smallest median family size with 2.22 persons per family.
| Family Type | # Families | Family Size |
| Married-Couple | 6,685 (90.6%) | 3.40 |
| Single Male/Father | 181 (2.5%) | 2.22 |
| Single Female/Mother | 510 (6.9%) | 3.19 |
| Total Families | 7,376 (100.0%) | 3.35 |
Median Household Size in Madison
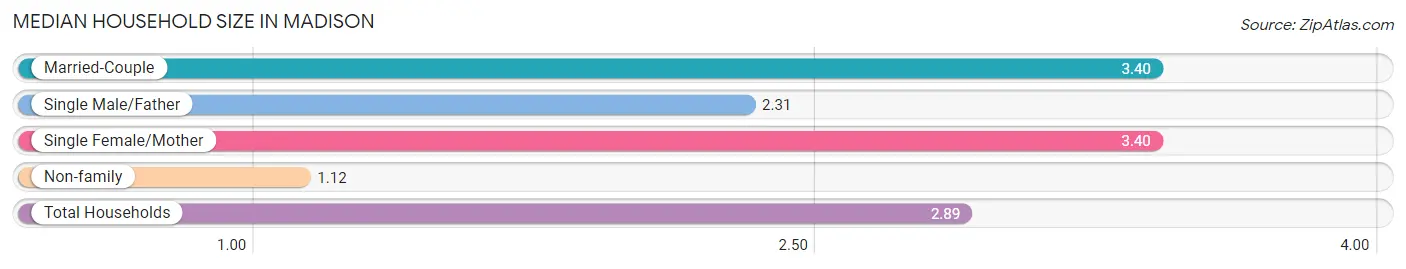
The median household size in Madison is 2.89 persons per household, with married-couple households (6,685 | 71.3%) accounting for the largest median household size of 3.4 persons per household. non-family households (2,005 | 21.4%) represent the smallest median household size with 1.12 persons per household.
| Household Type | # Households | Household Size |
| Married-Couple | 6,685 (71.3%) | 3.40 |
| Single Male/Father | 181 (1.9%) | 2.31 |
| Single Female/Mother | 510 (5.4%) | 3.40 |
| Non-family | 2,005 (21.4%) | 1.12 |
| Total Households | 9,381 (100.0%) | 2.89 |
Household Size by Marriage Status in Madison
Out of a total of 9,381 households in Madison, 7,376 (78.6%) are family households, while 2,005 (21.4%) are nonfamily households. The most numerous type of family households are 2-person households, comprising 2,906, and the most common type of nonfamily households are 1-person households, comprising 1,860.
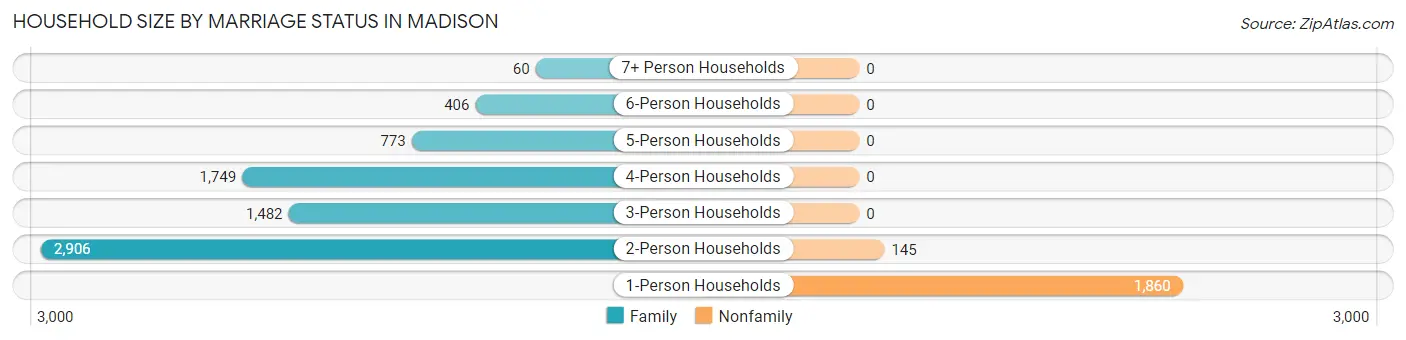
| Household Size | Family Households | Nonfamily Households |
| 1-Person Households | - | 1,860 (19.8%) |
| 2-Person Households | 2,906 (31.0%) | 145 (1.5%) |
| 3-Person Households | 1,482 (15.8%) | 0 (0.0%) |
| 4-Person Households | 1,749 (18.6%) | 0 (0.0%) |
| 5-Person Households | 773 (8.2%) | 0 (0.0%) |
| 6-Person Households | 406 (4.3%) | 0 (0.0%) |
| 7+ Person Households | 60 (0.6%) | 0 (0.0%) |
| Total | 7,376 (78.6%) | 2,005 (21.4%) |
Female Fertility in Madison
Fertility by Age in Madison
Average fertility rate in Madison is 64.0 births per 1,000 women. Women in the age bracket of 20 to 34 years have the highest fertility rate with 172.0 births per 1,000 women. Women in the age bracket of 20 to 34 years acount for 80.8% of all women with births.
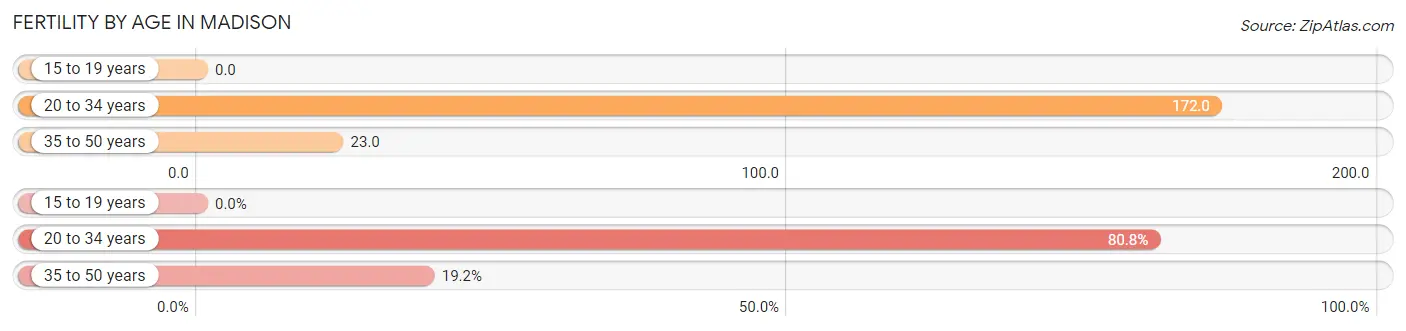
| Age Bracket | Women with Births | Births / 1,000 Women |
| 15 to 19 years | 0 (0.0%) | 0.0 |
| 20 to 34 years | 319 (80.8%) | 172.0 |
| 35 to 50 years | 76 (19.2%) | 23.0 |
| Total | 395 (100.0%) | 64.0 |
Fertility by Age by Marriage Status in Madison
84.1% of women with births (395) in Madison are married. The highest percentage of unmarried women with births falls into 20 to 34 years age bracket with 19.8% of them unmarried at the time of birth, while the lowest percentage of unmarried women with births belong to 35 to 50 years age bracket with 0.0% of them unmarried.
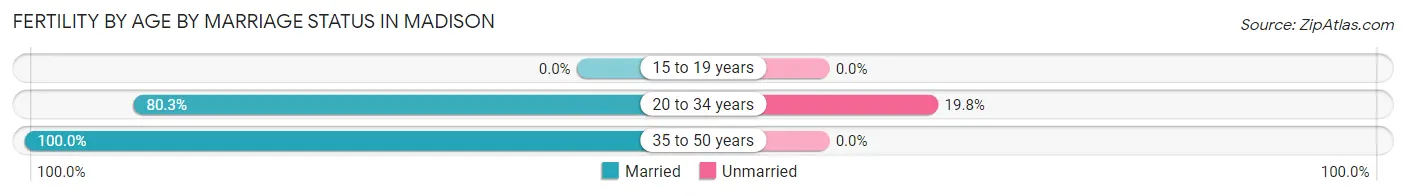
| Age Bracket | Married | Unmarried |
| 15 to 19 years | 0 (0.0%) | 0 (0.0%) |
| 20 to 34 years | 256 (80.2%) | 63 (19.8%) |
| 35 to 50 years | 76 (100.0%) | 0 (0.0%) |
| Total | 332 (84.1%) | 63 (16.0%) |
Fertility by Education in Madison
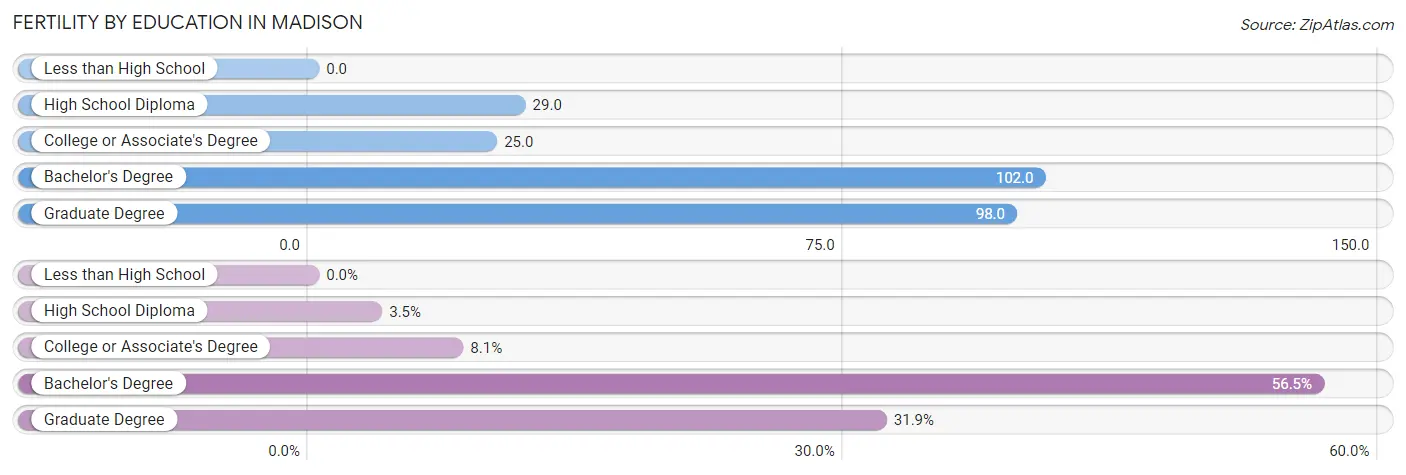
| Educational Attainment | Women with Births | Births / 1,000 Women |
| Less than High School | 0 (0.0%) | 0.0 |
| High School Diploma | 14 (3.5%) | 29.0 |
| College or Associate's Degree | 32 (8.1%) | 25.0 |
| Bachelor's Degree | 223 (56.5%) | 102.0 |
| Graduate Degree | 126 (31.9%) | 98.0 |
| Total | 395 (100.0%) | 64.0 |
Fertility by Education by Marriage Status in Madison
16.0% of women with births in Madison are unmarried. Women with the educational attainment of high school diploma are most likely to be married with 100.0% of them married at childbirth, while women with the educational attainment of college or associate's degree are least likely to be married with 25.0% of them unmarried at childbirth.
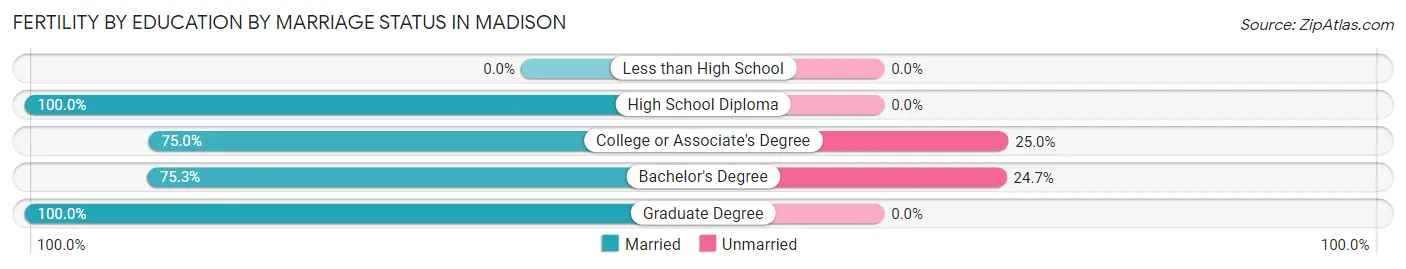
| Educational Attainment | Married | Unmarried |
| Less than High School | 0 (0.0%) | 0 (0.0%) |
| High School Diploma | 14 (100.0%) | 0 (0.0%) |
| College or Associate's Degree | 24 (75.0%) | 8 (25.0%) |
| Bachelor's Degree | 168 (75.3%) | 55 (24.7%) |
| Graduate Degree | 126 (100.0%) | 0 (0.0%) |
| Total | 332 (84.1%) | 63 (16.0%) |
Employment Characteristics in Madison
Employment by Class of Employer in Madison
Among the 13,116 employed individuals in Madison, private company employees (7,183 | 54.8%), state government employees (1,378 | 10.5%), and not-for-profit organizations (1,291 | 9.8%) make up the most common classes of employment.
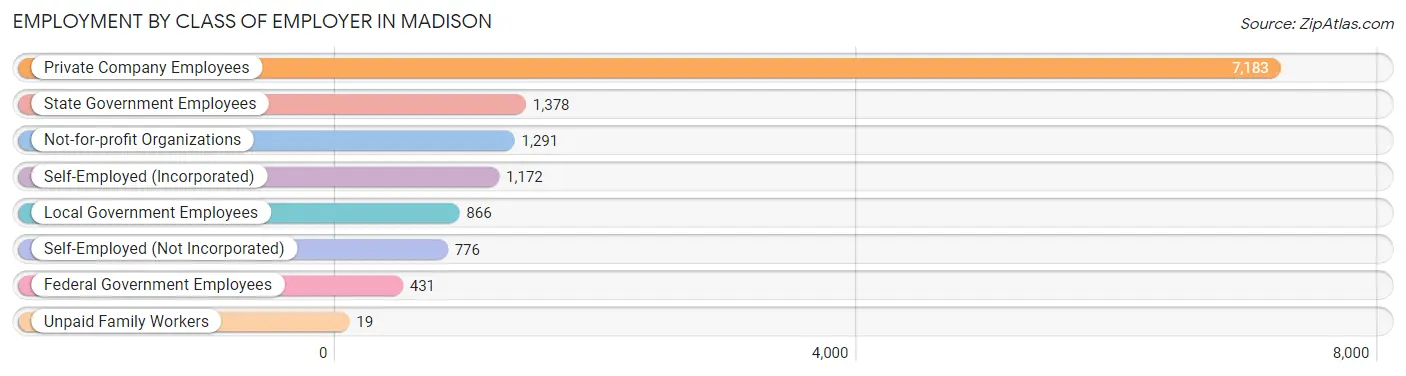
| Employer Class | # Employees | % Employees |
| Private Company Employees | 7,183 | 54.8% |
| Self-Employed (Incorporated) | 1,172 | 8.9% |
| Self-Employed (Not Incorporated) | 776 | 5.9% |
| Not-for-profit Organizations | 1,291 | 9.8% |
| Local Government Employees | 866 | 6.6% |
| State Government Employees | 1,378 | 10.5% |
| Federal Government Employees | 431 | 3.3% |
| Unpaid Family Workers | 19 | 0.1% |
| Total | 13,116 | 100.0% |
Employment Status by Age in Madison
According to the labor force statistics for Madison, out of the total population over 16 years of age (20,845), 65.6% or 13,674 individuals are in the labor force, with 2.7% or 369 of them unemployed. The age group with the highest labor force participation rate is 55 to 59 years, with 92.4% or 1,846 individuals in the labor force. Within the labor force, the 16 to 19 years age range has the highest percentage of unemployed individuals, with 8.5% or 41 of them being unemployed.
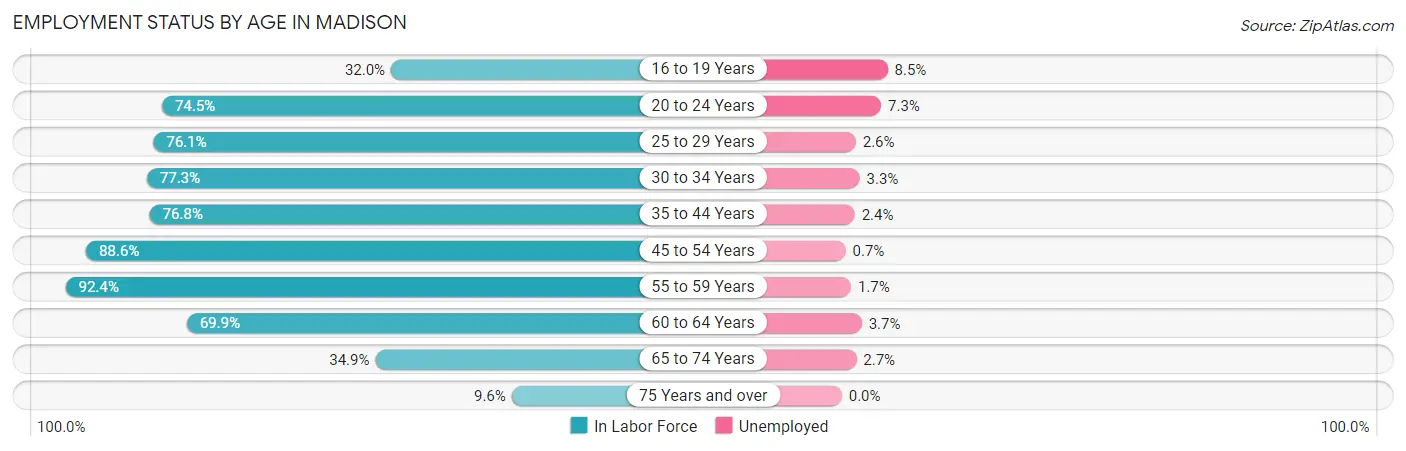
| Age Bracket | In Labor Force | Unemployed |
| 16 to 19 Years | 484 (32.0%) | 41 (8.5%) |
| 20 to 24 Years | 1,058 (74.5%) | 77 (7.3%) |
| 25 to 29 Years | 728 (76.1%) | 19 (2.6%) |
| 30 to 34 Years | 934 (77.3%) | 31 (3.3%) |
| 35 to 44 Years | 3,028 (76.8%) | 73 (2.4%) |
| 45 to 54 Years | 3,260 (88.6%) | 23 (0.7%) |
| 55 to 59 Years | 1,846 (92.4%) | 31 (1.7%) |
| 60 to 64 Years | 1,241 (69.9%) | 46 (3.7%) |
| 65 to 74 Years | 949 (34.9%) | 26 (2.7%) |
| 75 Years and over | 157 (9.6%) | 0 (0.0%) |
| Total | 13,674 (65.6%) | 369 (2.7%) |
Employment Status by Educational Attainment in Madison
According to labor force statistics for Madison, 81.4% of individuals (11,039) out of the total population between 25 and 64 years of age (13,561) are in the labor force, with 2.0% or 221 of them being unemployed. The group with the highest labor force participation rate are those with the educational attainment of bachelor's degree or higher, with 89.3% or 8,475 individuals in the labor force. Within the labor force, individuals with less than high school education have the highest percentage of unemployment, with 12.2% or 17 of them being unemployed.
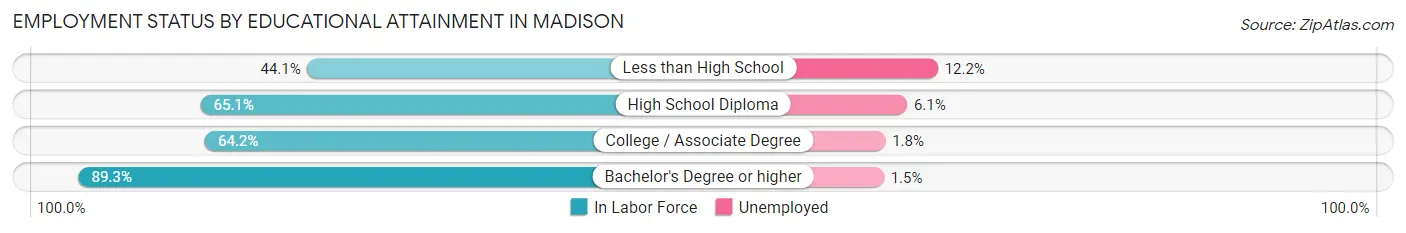
| Educational Attainment | In Labor Force | Unemployed |
| Less than High School | 139 (44.1%) | 38 (12.2%) |
| High School Diploma | 833 (65.1%) | 78 (6.1%) |
| College / Associate Degree | 1,590 (64.2%) | 45 (1.8%) |
| Bachelor's Degree or higher | 8,475 (89.3%) | 142 (1.5%) |
| Total | 11,039 (81.4%) | 271 (2.0%) |
Employment Occupations by Sex in Madison
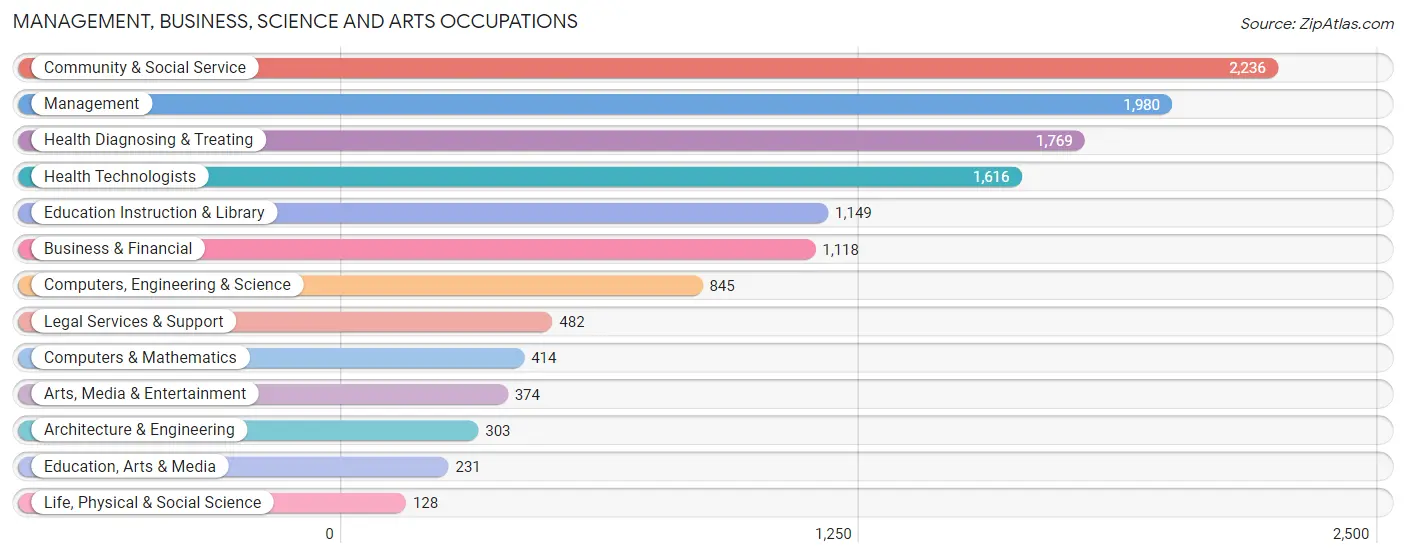
Management, Business, Science and Arts Occupations
The most common Management, Business, Science and Arts occupations in Madison are Community & Social Service (2,236 | 16.8%), Management (1,980 | 14.9%), Health Diagnosing & Treating (1,769 | 13.3%), Health Technologists (1,616 | 12.1%), and Education Instruction & Library (1,149 | 8.6%).
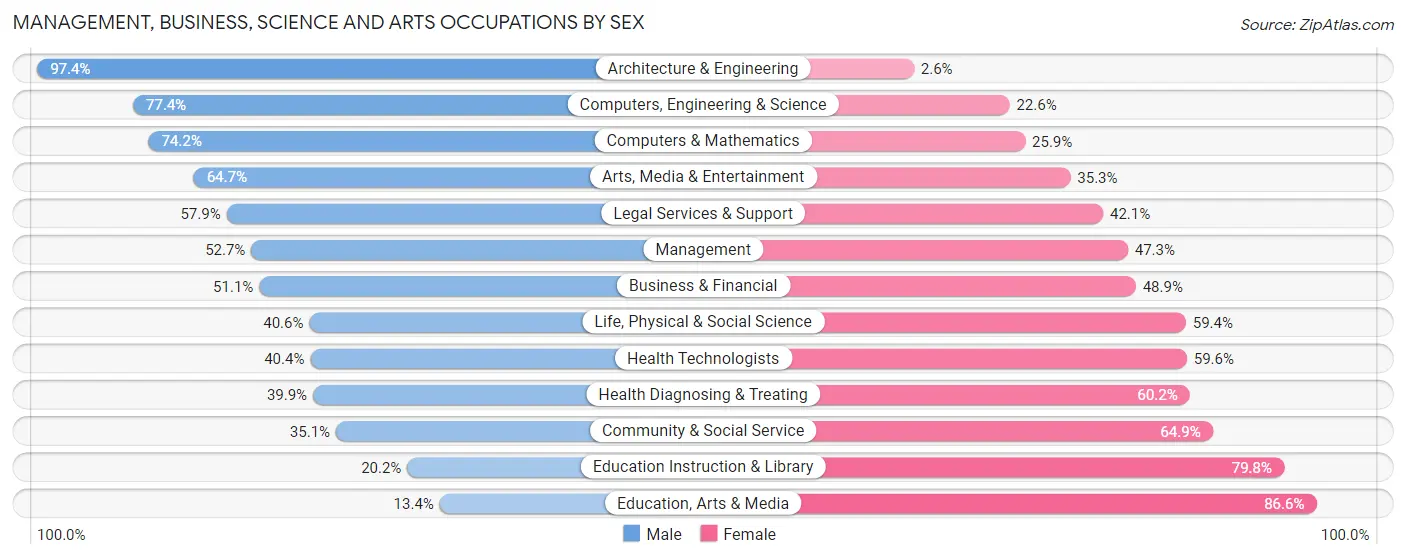
Management, Business, Science and Arts Occupations by Sex
Within the Management, Business, Science and Arts occupations in Madison, the most male-oriented occupations are Architecture & Engineering (97.4%), Computers, Engineering & Science (77.4%), and Computers & Mathematics (74.2%), while the most female-oriented occupations are Education, Arts & Media (86.6%), Education Instruction & Library (79.8%), and Community & Social Service (64.9%).
| Occupation | Male | Female |
| Management | 1,044 (52.7%) | 936 (47.3%) |
| Business & Financial | 571 (51.1%) | 547 (48.9%) |
| Computers, Engineering & Science | 654 (77.4%) | 191 (22.6%) |
| Computers & Mathematics | 307 (74.2%) | 107 (25.9%) |
| Architecture & Engineering | 295 (97.4%) | 8 (2.6%) |
| Life, Physical & Social Science | 52 (40.6%) | 76 (59.4%) |
| Community & Social Service | 784 (35.1%) | 1,452 (64.9%) |
| Education, Arts & Media | 31 (13.4%) | 200 (86.6%) |
| Legal Services & Support | 279 (57.9%) | 203 (42.1%) |
| Education Instruction & Library | 232 (20.2%) | 917 (79.8%) |
| Arts, Media & Entertainment | 242 (64.7%) | 132 (35.3%) |
| Health Diagnosing & Treating | 705 (39.9%) | 1,064 (60.2%) |
| Health Technologists | 653 (40.4%) | 963 (59.6%) |
| Total (Category) | 3,758 (47.3%) | 4,190 (52.7%) |
| Total (Overall) | 6,823 (51.3%) | 6,477 (48.7%) |
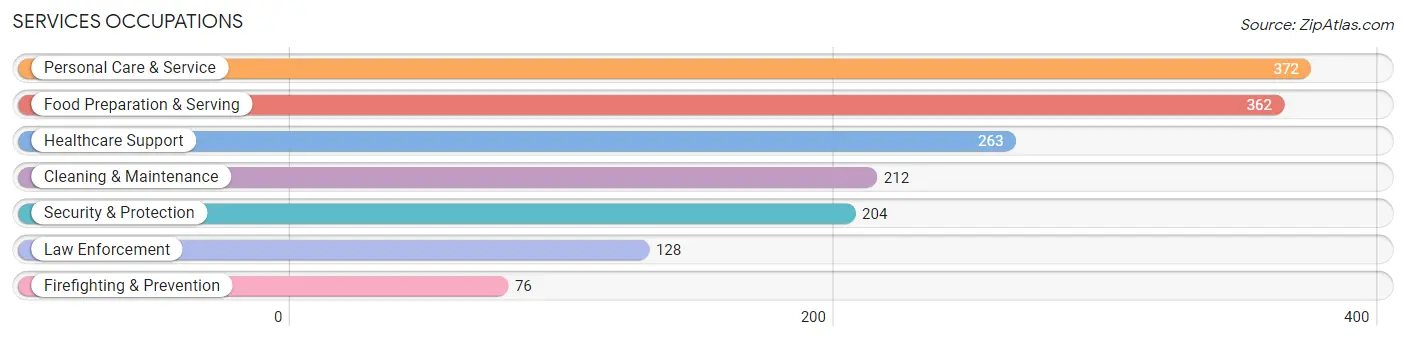
Services Occupations
The most common Services occupations in Madison are Personal Care & Service (372 | 2.8%), Food Preparation & Serving (362 | 2.7%), Healthcare Support (263 | 2.0%), Cleaning & Maintenance (212 | 1.6%), and Security & Protection (204 | 1.5%).
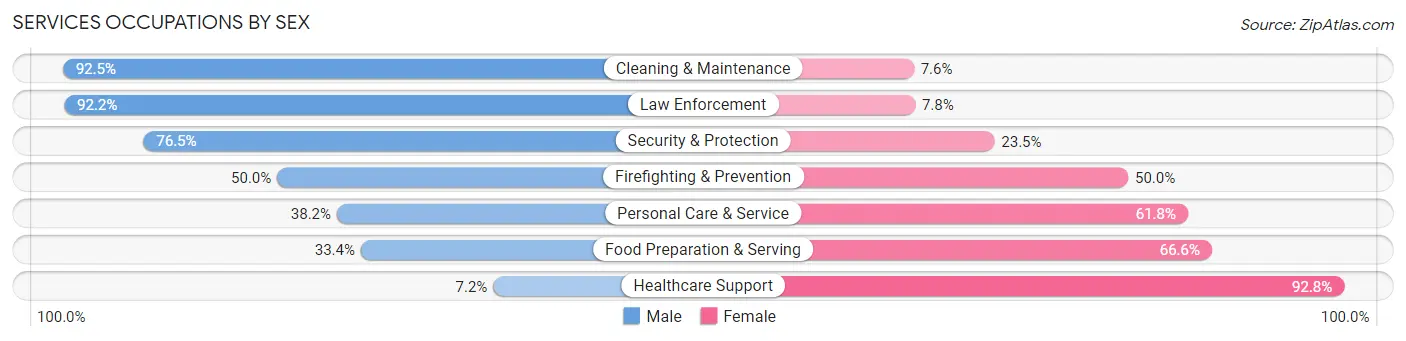
Services Occupations by Sex
Within the Services occupations in Madison, the most male-oriented occupations are Cleaning & Maintenance (92.4%), Law Enforcement (92.2%), and Security & Protection (76.5%), while the most female-oriented occupations are Healthcare Support (92.8%), Food Preparation & Serving (66.6%), and Personal Care & Service (61.8%).
| Occupation | Male | Female |
| Healthcare Support | 19 (7.2%) | 244 (92.8%) |
| Security & Protection | 156 (76.5%) | 48 (23.5%) |
| Firefighting & Prevention | 38 (50.0%) | 38 (50.0%) |
| Law Enforcement | 118 (92.2%) | 10 (7.8%) |
| Food Preparation & Serving | 121 (33.4%) | 241 (66.6%) |
| Cleaning & Maintenance | 196 (92.4%) | 16 (7.5%) |
| Personal Care & Service | 142 (38.2%) | 230 (61.8%) |
| Total (Category) | 634 (44.9%) | 779 (55.1%) |
| Total (Overall) | 6,823 (51.3%) | 6,477 (48.7%) |
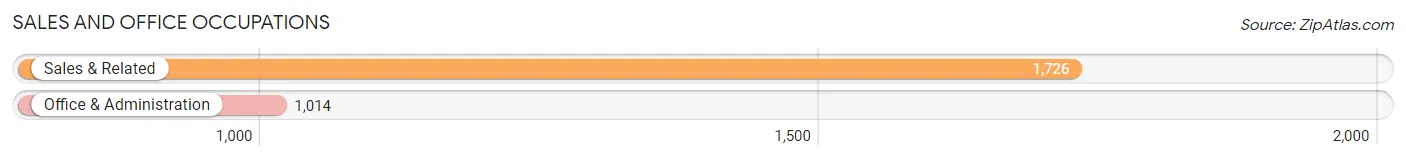
Sales and Office Occupations
The most common Sales and Office occupations in Madison are Sales & Related (1,726 | 13.0%), and Office & Administration (1,014 | 7.6%).
Sales and Office Occupations by Sex
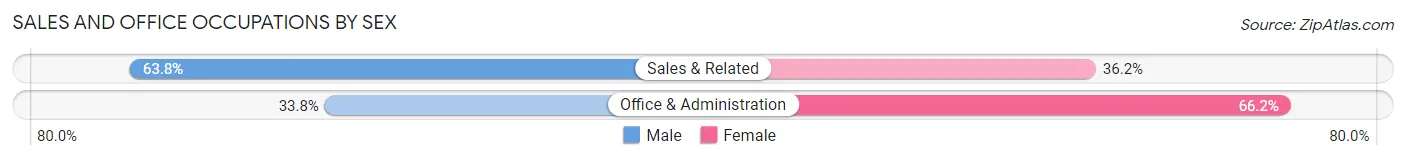
| Occupation | Male | Female |
| Sales & Related | 1,101 (63.8%) | 625 (36.2%) |
| Office & Administration | 343 (33.8%) | 671 (66.2%) |
| Total (Category) | 1,444 (52.7%) | 1,296 (47.3%) |
| Total (Overall) | 6,823 (51.3%) | 6,477 (48.7%) |
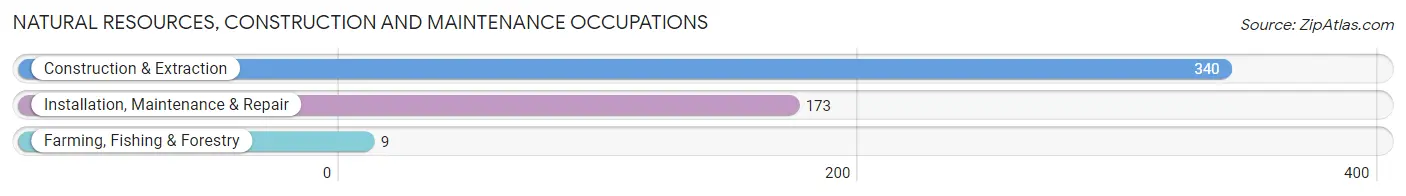
Natural Resources, Construction and Maintenance Occupations
The most common Natural Resources, Construction and Maintenance occupations in Madison are Construction & Extraction (340 | 2.6%), Installation, Maintenance & Repair (173 | 1.3%), and Farming, Fishing & Forestry (9 | 0.1%).
Natural Resources, Construction and Maintenance Occupations by Sex
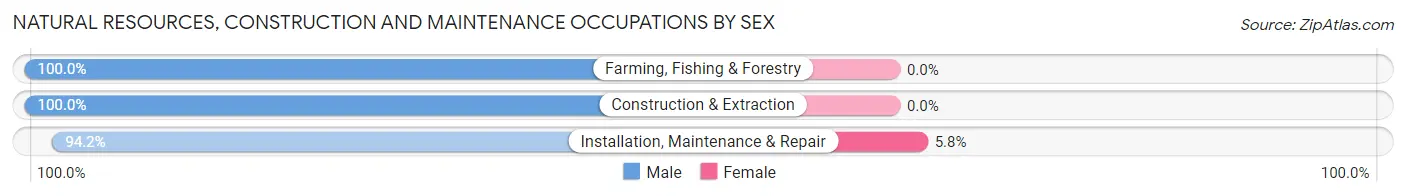
| Occupation | Male | Female |
| Farming, Fishing & Forestry | 9 (100.0%) | 0 (0.0%) |
| Construction & Extraction | 340 (100.0%) | 0 (0.0%) |
| Installation, Maintenance & Repair | 163 (94.2%) | 10 (5.8%) |
| Total (Category) | 512 (98.1%) | 10 (1.9%) |
| Total (Overall) | 6,823 (51.3%) | 6,477 (48.7%) |
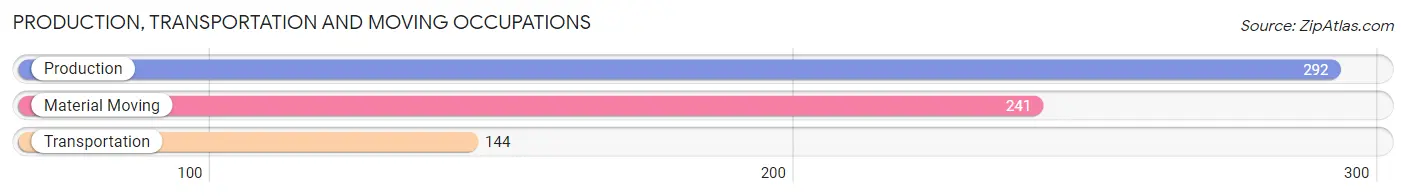
Production, Transportation and Moving Occupations
The most common Production, Transportation and Moving occupations in Madison are Production (292 | 2.2%), Material Moving (241 | 1.8%), and Transportation (144 | 1.1%).
Production, Transportation and Moving Occupations by Sex
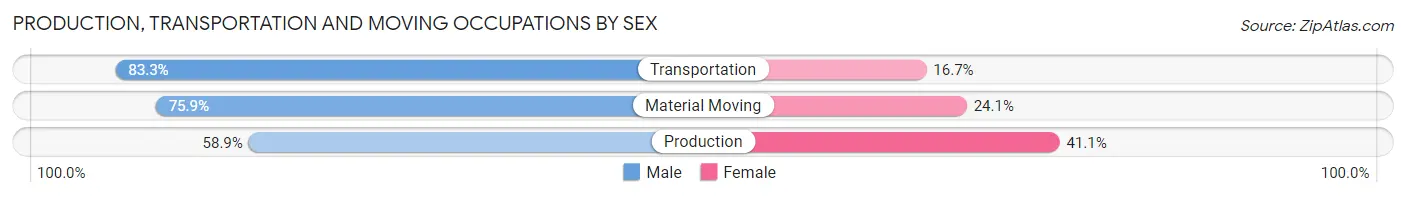
| Occupation | Male | Female |
| Production | 172 (58.9%) | 120 (41.1%) |
| Transportation | 120 (83.3%) | 24 (16.7%) |
| Material Moving | 183 (75.9%) | 58 (24.1%) |
| Total (Category) | 475 (70.2%) | 202 (29.8%) |
| Total (Overall) | 6,823 (51.3%) | 6,477 (48.7%) |
Employment Industries by Sex in Madison
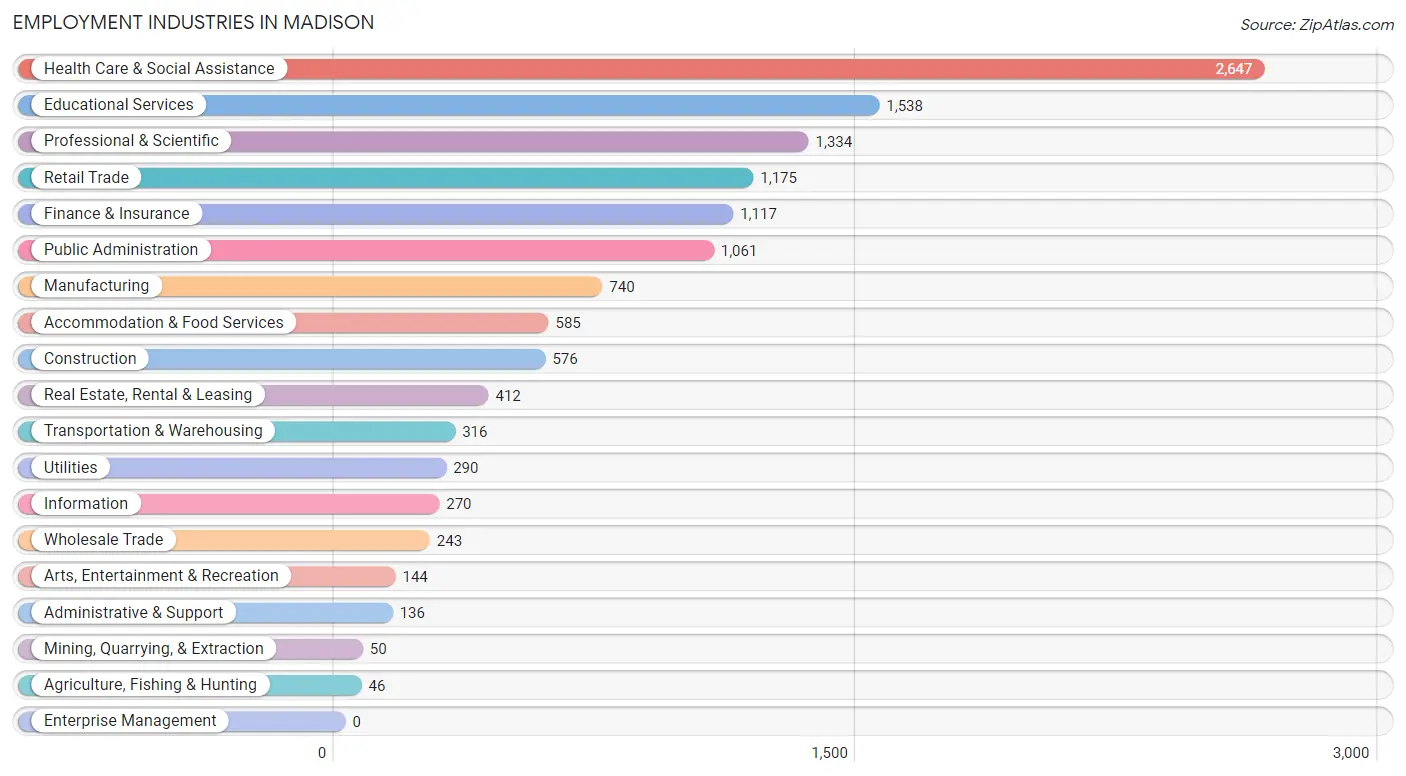
Employment Industries in Madison
The major employment industries in Madison include Health Care & Social Assistance (2,647 | 19.9%), Educational Services (1,538 | 11.6%), Professional & Scientific (1,334 | 10.0%), Retail Trade (1,175 | 8.8%), and Finance & Insurance (1,117 | 8.4%).
Employment Industries by Sex in Madison
The Madison industries that see more men than women are Construction (94.1%), Manufacturing (86.6%), and Utilities (85.5%), whereas the industries that tend to have a higher number of women are Educational Services (77.2%), Information (74.4%), and Administrative & Support (71.3%).
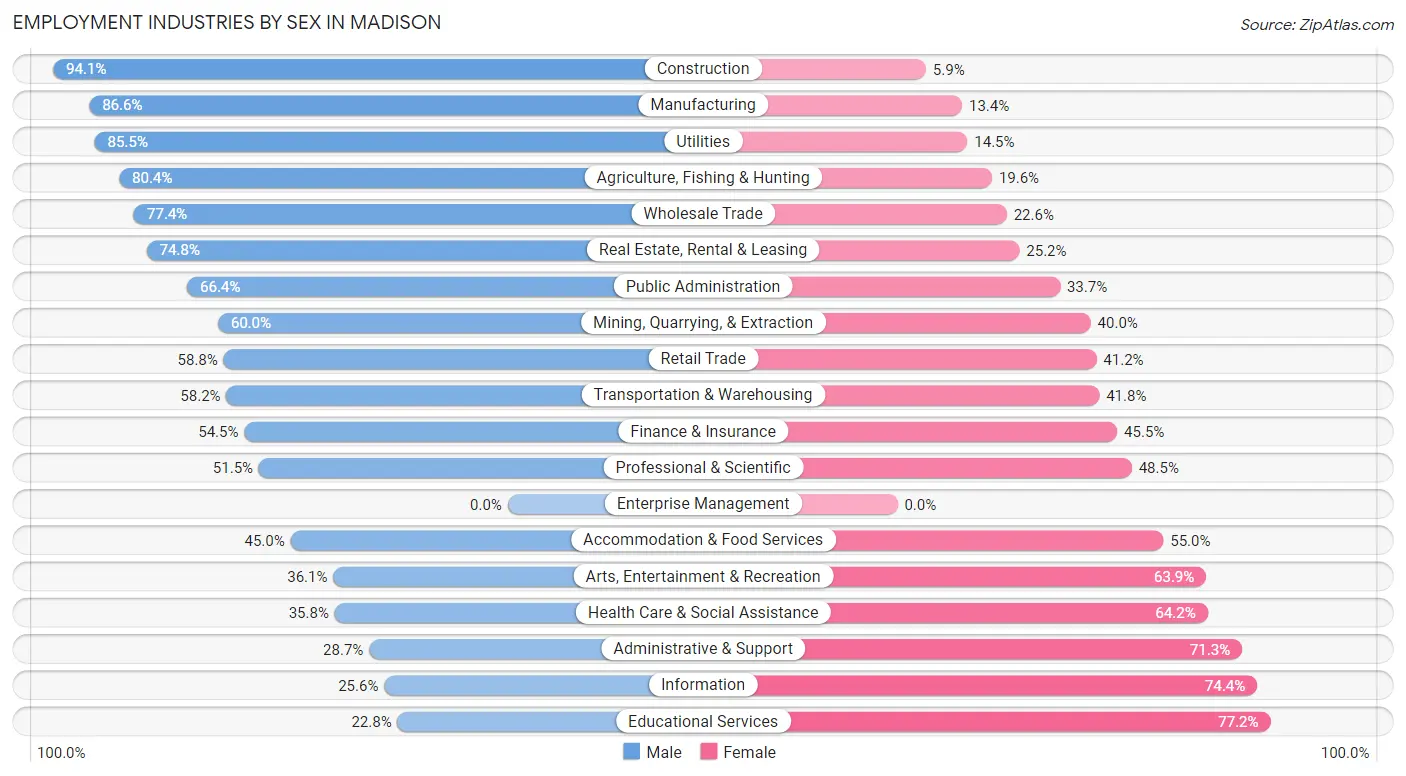
| Industry | Male | Female |
| Agriculture, Fishing & Hunting | 37 (80.4%) | 9 (19.6%) |
| Mining, Quarrying, & Extraction | 30 (60.0%) | 20 (40.0%) |
| Construction | 542 (94.1%) | 34 (5.9%) |
| Manufacturing | 641 (86.6%) | 99 (13.4%) |
| Wholesale Trade | 188 (77.4%) | 55 (22.6%) |
| Retail Trade | 691 (58.8%) | 484 (41.2%) |
| Transportation & Warehousing | 184 (58.2%) | 132 (41.8%) |
| Utilities | 248 (85.5%) | 42 (14.5%) |
| Information | 69 (25.6%) | 201 (74.4%) |
| Finance & Insurance | 609 (54.5%) | 508 (45.5%) |
| Real Estate, Rental & Leasing | 308 (74.8%) | 104 (25.2%) |
| Professional & Scientific | 687 (51.5%) | 647 (48.5%) |
| Enterprise Management | 0 (0.0%) | 0 (0.0%) |
| Administrative & Support | 39 (28.7%) | 97 (71.3%) |
| Educational Services | 351 (22.8%) | 1,187 (77.2%) |
| Health Care & Social Assistance | 948 (35.8%) | 1,699 (64.2%) |
| Arts, Entertainment & Recreation | 52 (36.1%) | 92 (63.9%) |
| Accommodation & Food Services | 263 (45.0%) | 322 (55.0%) |
| Public Administration | 704 (66.3%) | 357 (33.7%) |
| Total | 6,823 (51.3%) | 6,477 (48.7%) |
Education in Madison
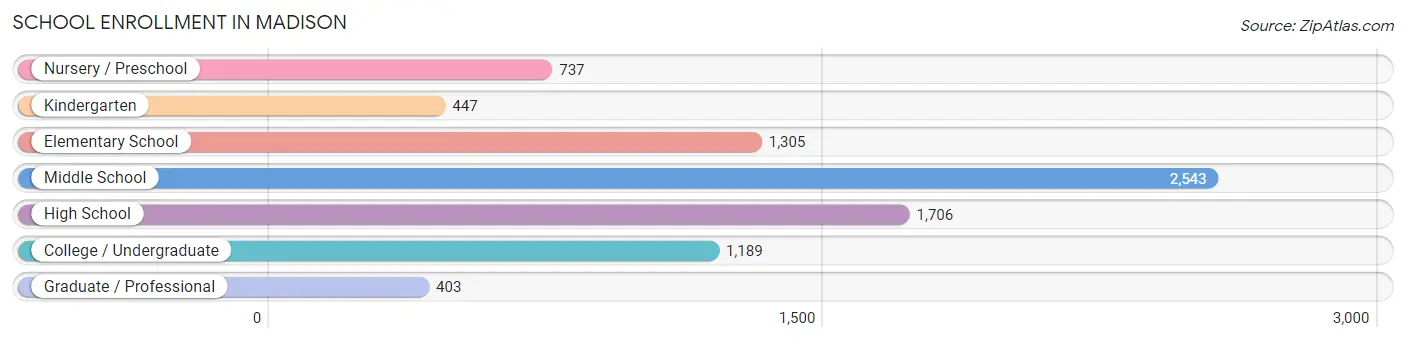
School Enrollment in Madison
The most common levels of schooling among the 8,330 students in Madison are middle school (2,543 | 30.5%), high school (1,706 | 20.5%), and elementary school (1,305 | 15.7%).
| School Level | # Students | % Students |
| Nursery / Preschool | 737 | 8.8% |
| Kindergarten | 447 | 5.4% |
| Elementary School | 1,305 | 15.7% |
| Middle School | 2,543 | 30.5% |
| High School | 1,706 | 20.5% |
| College / Undergraduate | 1,189 | 14.3% |
| Graduate / Professional | 403 | 4.8% |
| Total | 8,330 | 100.0% |
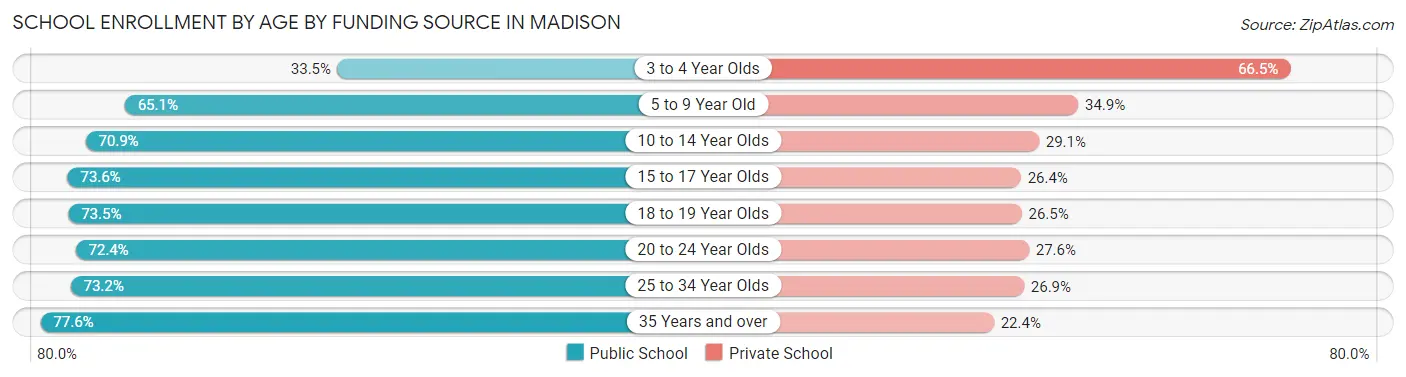
School Enrollment by Age by Funding Source in Madison
Out of a total of 8,330 students who are enrolled in schools in Madison, 2,682 (32.2%) attend a private institution, while the remaining 5,648 (67.8%) are enrolled in public schools. The age group of 3 to 4 year olds has the highest likelihood of being enrolled in private schools, with 479 (66.5% in the age bracket) enrolled. Conversely, the age group of 35 years and over has the lowest likelihood of being enrolled in a private school, with 316 (77.6% in the age bracket) attending a public institution.
| Age Bracket | Public School | Private School |
| 3 to 4 Year Olds | 241 (33.5%) | 479 (66.5%) |
| 5 to 9 Year Old | 1,006 (65.1%) | 540 (34.9%) |
| 10 to 14 Year Olds | 1,935 (70.9%) | 793 (29.1%) |
| 15 to 17 Year Olds | 1,038 (73.6%) | 372 (26.4%) |
| 18 to 19 Year Olds | 438 (73.5%) | 158 (26.5%) |
| 20 to 24 Year Olds | 512 (72.4%) | 195 (27.6%) |
| 25 to 34 Year Olds | 158 (73.2%) | 58 (26.9%) |
| 35 Years and over | 316 (77.6%) | 91 (22.4%) |
| Total | 5,648 (67.8%) | 2,682 (32.2%) |
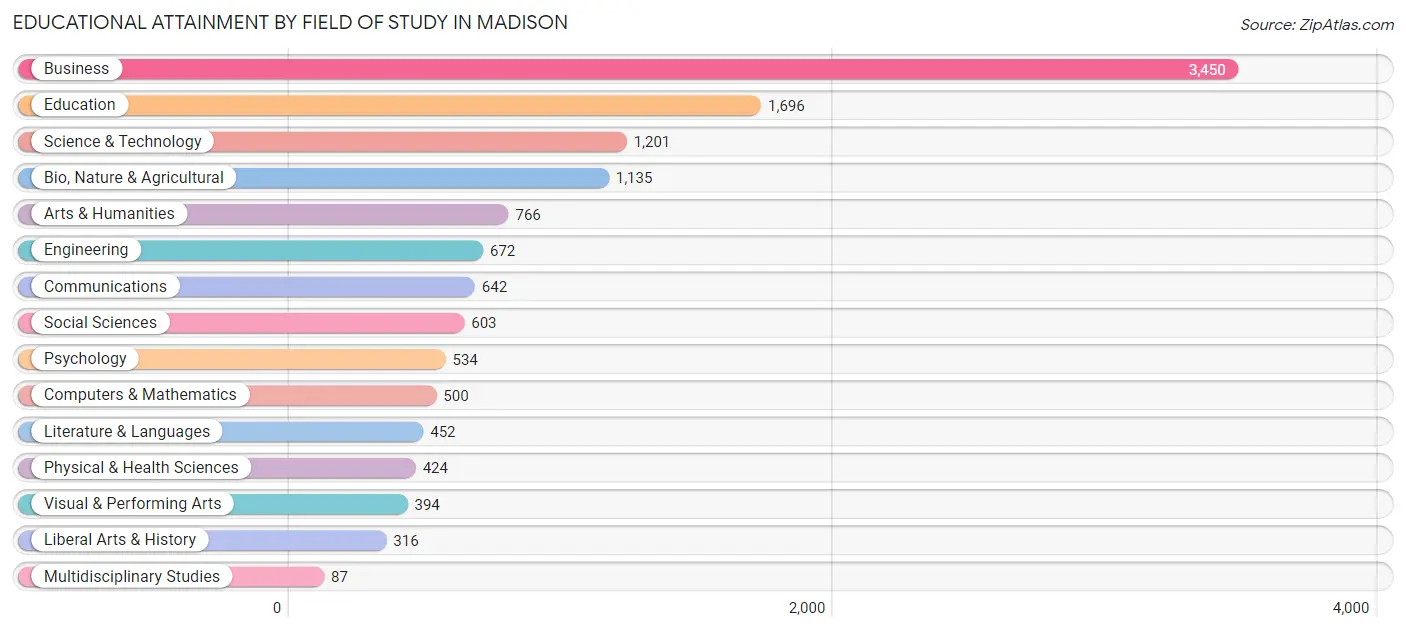
Educational Attainment by Field of Study in Madison
Business (3,450 | 26.8%), education (1,696 | 13.2%), science & technology (1,201 | 9.3%), bio, nature & agricultural (1,135 | 8.8%), and arts & humanities (766 | 5.9%) are the most common fields of study among 12,872 individuals in Madison who have obtained a bachelor's degree or higher.
| Field of Study | # Graduates | % Graduates |
| Computers & Mathematics | 500 | 3.9% |
| Bio, Nature & Agricultural | 1,135 | 8.8% |
| Physical & Health Sciences | 424 | 3.3% |
| Psychology | 534 | 4.2% |
| Social Sciences | 603 | 4.7% |
| Engineering | 672 | 5.2% |
| Multidisciplinary Studies | 87 | 0.7% |
| Science & Technology | 1,201 | 9.3% |
| Business | 3,450 | 26.8% |
| Education | 1,696 | 13.2% |
| Literature & Languages | 452 | 3.5% |
| Liberal Arts & History | 316 | 2.5% |
| Visual & Performing Arts | 394 | 3.1% |
| Communications | 642 | 5.0% |
| Arts & Humanities | 766 | 5.9% |
| Total | 12,872 | 100.0% |
Transportation & Commute in Madison
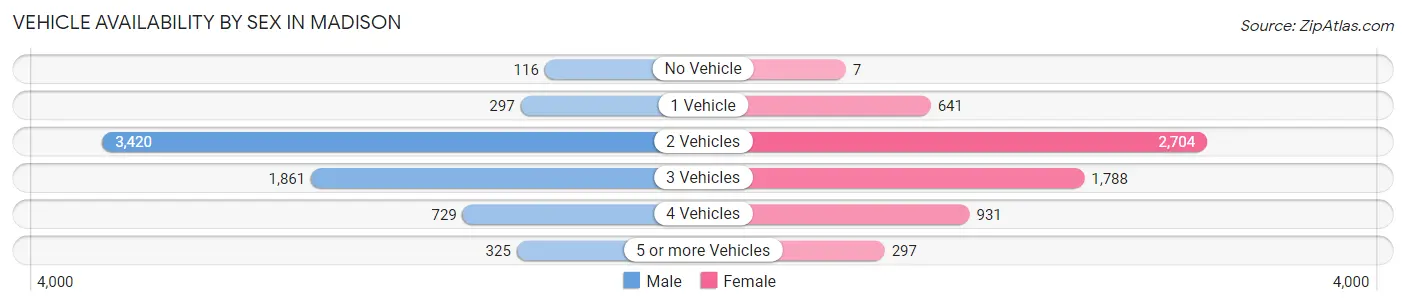
Vehicle Availability by Sex in Madison
The most prevalent vehicle ownership categories in Madison are males with 2 vehicles (3,420, accounting for 50.7%) and females with 2 vehicles (2,704, making up 53.7%).
| Vehicles Available | Male | Female |
| No Vehicle | 116 (1.7%) | 7 (0.1%) |
| 1 Vehicle | 297 (4.4%) | 641 (10.1%) |
| 2 Vehicles | 3,420 (50.7%) | 2,704 (42.5%) |
| 3 Vehicles | 1,861 (27.6%) | 1,788 (28.1%) |
| 4 Vehicles | 729 (10.8%) | 931 (14.6%) |
| 5 or more Vehicles | 325 (4.8%) | 297 (4.7%) |
| Total | 6,748 (100.0%) | 6,368 (100.0%) |
Commute Time in Madison
The most frequently occuring commute durations in Madison are 15 to 19 minutes (2,396 commuters, 20.4%), 20 to 24 minutes (2,342 commuters, 19.9%), and 30 to 34 minutes (1,895 commuters, 16.1%).
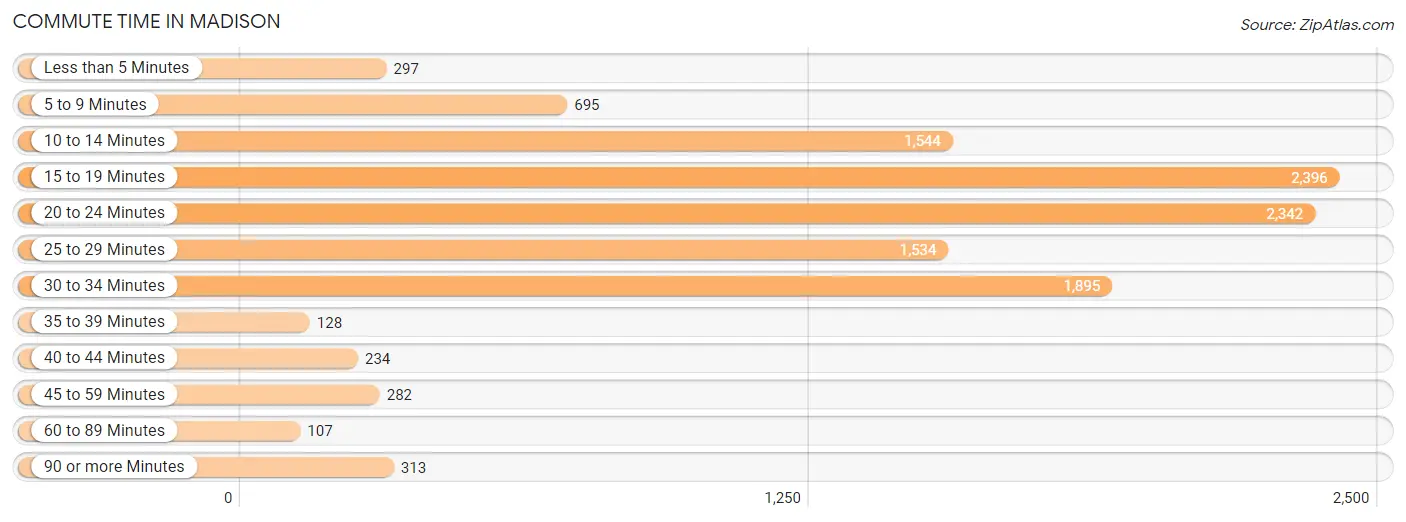
| Commute Time | # Commuters | % Commuters |
| Less than 5 Minutes | 297 | 2.5% |
| 5 to 9 Minutes | 695 | 5.9% |
| 10 to 14 Minutes | 1,544 | 13.1% |
| 15 to 19 Minutes | 2,396 | 20.4% |
| 20 to 24 Minutes | 2,342 | 19.9% |
| 25 to 29 Minutes | 1,534 | 13.0% |
| 30 to 34 Minutes | 1,895 | 16.1% |
| 35 to 39 Minutes | 128 | 1.1% |
| 40 to 44 Minutes | 234 | 2.0% |
| 45 to 59 Minutes | 282 | 2.4% |
| 60 to 89 Minutes | 107 | 0.9% |
| 90 or more Minutes | 313 | 2.7% |
Commute Time by Sex in Madison
The most common commute times in Madison are 20 to 24 minutes (1,261 commuters, 20.6%) for males and 15 to 19 minutes (1,180 commuters, 20.9%) for females.
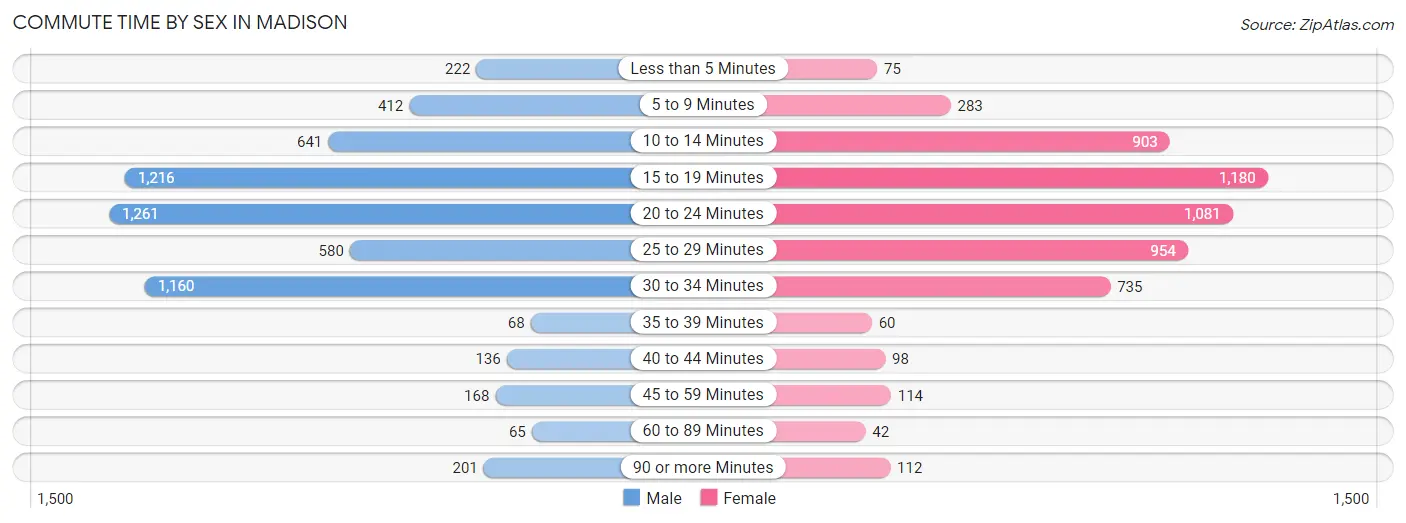
| Commute Time | Male | Female |
| Less than 5 Minutes | 222 (3.6%) | 75 (1.3%) |
| 5 to 9 Minutes | 412 (6.7%) | 283 (5.0%) |
| 10 to 14 Minutes | 641 (10.5%) | 903 (16.0%) |
| 15 to 19 Minutes | 1,216 (19.8%) | 1,180 (20.9%) |
| 20 to 24 Minutes | 1,261 (20.6%) | 1,081 (19.2%) |
| 25 to 29 Minutes | 580 (9.5%) | 954 (16.9%) |
| 30 to 34 Minutes | 1,160 (18.9%) | 735 (13.0%) |
| 35 to 39 Minutes | 68 (1.1%) | 60 (1.1%) |
| 40 to 44 Minutes | 136 (2.2%) | 98 (1.7%) |
| 45 to 59 Minutes | 168 (2.7%) | 114 (2.0%) |
| 60 to 89 Minutes | 65 (1.1%) | 42 (0.7%) |
| 90 or more Minutes | 201 (3.3%) | 112 (2.0%) |
Time of Departure to Work by Sex in Madison
The most frequent times of departure to work in Madison are 7:30 AM to 7:59 AM (1,322, 21.6%) for males and 7:30 AM to 7:59 AM (1,445, 25.6%) for females.
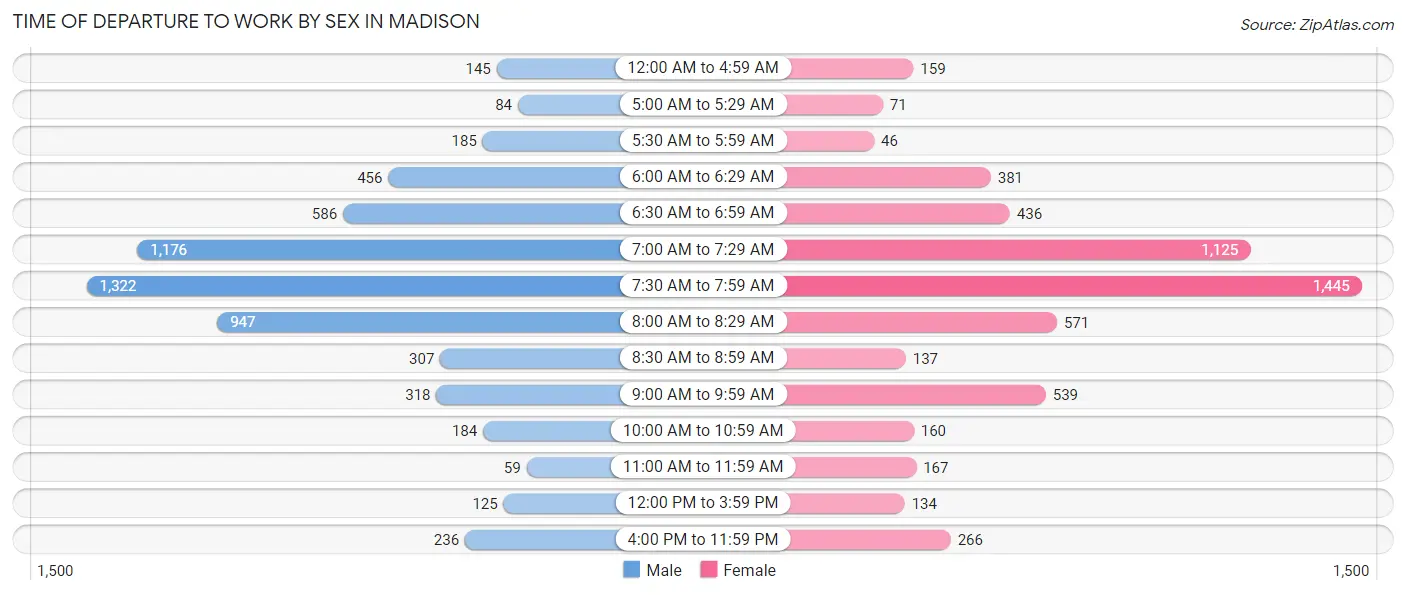
| Time of Departure | Male | Female |
| 12:00 AM to 4:59 AM | 145 (2.4%) | 159 (2.8%) |
| 5:00 AM to 5:29 AM | 84 (1.4%) | 71 (1.3%) |
| 5:30 AM to 5:59 AM | 185 (3.0%) | 46 (0.8%) |
| 6:00 AM to 6:29 AM | 456 (7.4%) | 381 (6.8%) |
| 6:30 AM to 6:59 AM | 586 (9.6%) | 436 (7.7%) |
| 7:00 AM to 7:29 AM | 1,176 (19.2%) | 1,125 (20.0%) |
| 7:30 AM to 7:59 AM | 1,322 (21.6%) | 1,445 (25.6%) |
| 8:00 AM to 8:29 AM | 947 (15.4%) | 571 (10.1%) |
| 8:30 AM to 8:59 AM | 307 (5.0%) | 137 (2.4%) |
| 9:00 AM to 9:59 AM | 318 (5.2%) | 539 (9.6%) |
| 10:00 AM to 10:59 AM | 184 (3.0%) | 160 (2.8%) |
| 11:00 AM to 11:59 AM | 59 (1.0%) | 167 (3.0%) |
| 12:00 PM to 3:59 PM | 125 (2.0%) | 134 (2.4%) |
| 4:00 PM to 11:59 PM | 236 (3.8%) | 266 (4.7%) |
| Total | 6,130 (100.0%) | 5,637 (100.0%) |
Housing Occupancy in Madison
Occupancy by Ownership in Madison
Of the total 9,381 dwellings in Madison, owner-occupied units account for 8,746 (93.2%), while renter-occupied units make up 635 (6.8%).
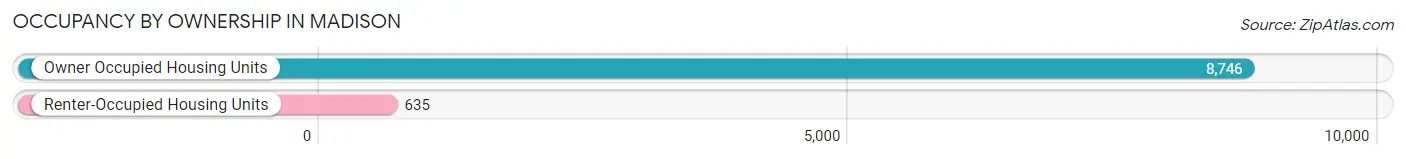
| Occupancy | # Housing Units | % Housing Units |
| Owner Occupied Housing Units | 8,746 | 93.2% |
| Renter-Occupied Housing Units | 635 | 6.8% |
| Total Occupied Housing Units | 9,381 | 100.0% |
Occupancy by Household Size in Madison
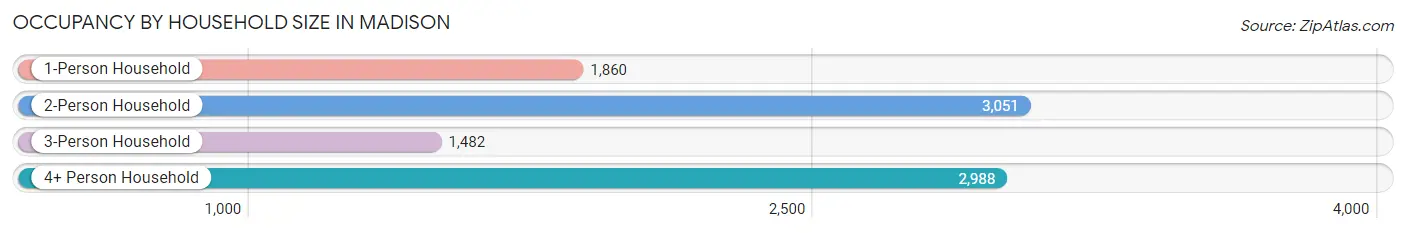
| Household Size | # Housing Units | % Housing Units |
| 1-Person Household | 1,860 | 19.8% |
| 2-Person Household | 3,051 | 32.5% |
| 3-Person Household | 1,482 | 15.8% |
| 4+ Person Household | 2,988 | 31.9% |
| Total Housing Units | 9,381 | 100.0% |
Occupancy by Ownership by Household Size in Madison
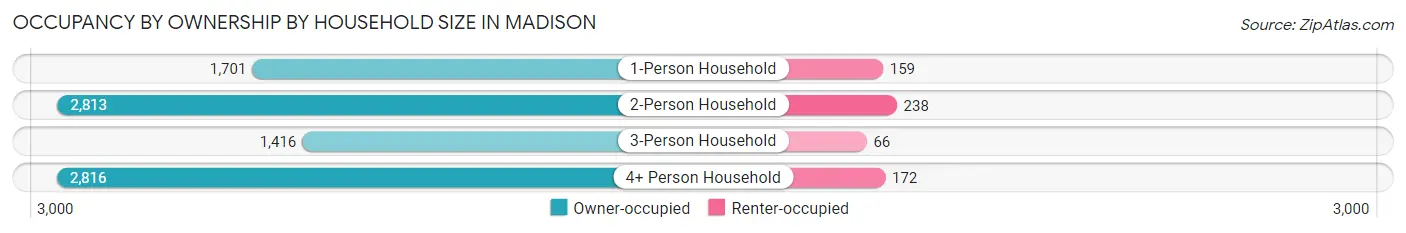
| Household Size | Owner-occupied | Renter-occupied |
| 1-Person Household | 1,701 (91.4%) | 159 (8.6%) |
| 2-Person Household | 2,813 (92.2%) | 238 (7.8%) |
| 3-Person Household | 1,416 (95.6%) | 66 (4.4%) |
| 4+ Person Household | 2,816 (94.2%) | 172 (5.8%) |
| Total Housing Units | 8,746 (93.2%) | 635 (6.8%) |
Occupancy by Educational Attainment in Madison
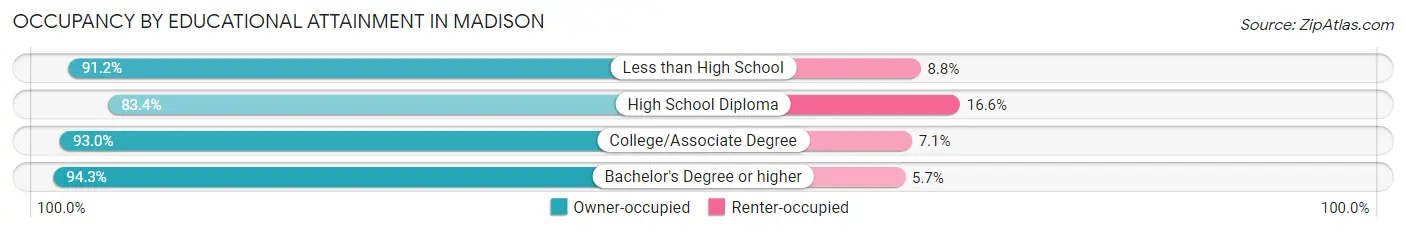
| Household Size | Owner-occupied | Renter-occupied |
| Less than High School | 135 (91.2%) | 13 (8.8%) |
| High School Diploma | 553 (83.4%) | 110 (16.6%) |
| College/Associate Degree | 1,543 (92.9%) | 117 (7.0%) |
| Bachelor's Degree or higher | 6,515 (94.3%) | 395 (5.7%) |
Occupancy by Age of Householder in Madison
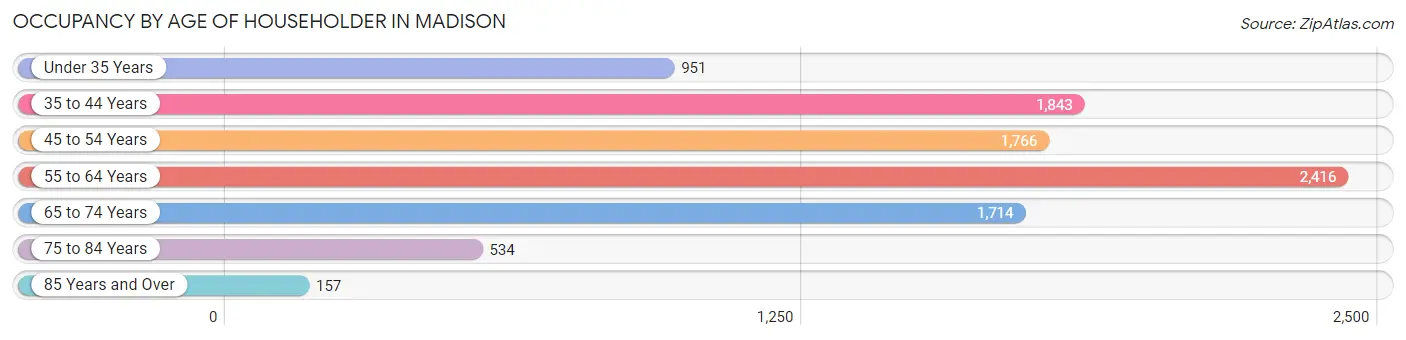
| Age Bracket | # Households | % Households |
| Under 35 Years | 951 | 10.1% |
| 35 to 44 Years | 1,843 | 19.7% |
| 45 to 54 Years | 1,766 | 18.8% |
| 55 to 64 Years | 2,416 | 25.8% |
| 65 to 74 Years | 1,714 | 18.3% |
| 75 to 84 Years | 534 | 5.7% |
| 85 Years and Over | 157 | 1.7% |
| Total | 9,381 | 100.0% |
Housing Finances in Madison
Median Income by Occupancy in Madison
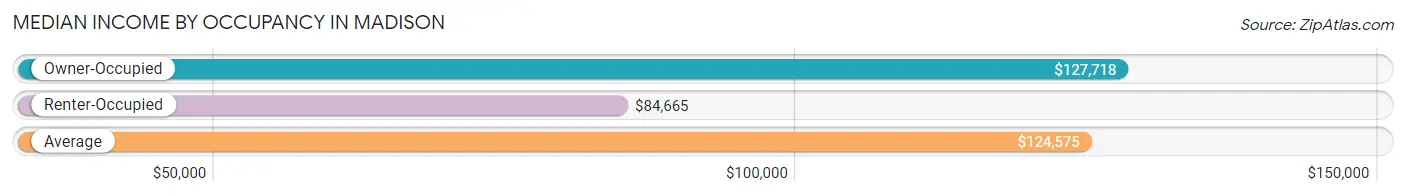
| Occupancy Type | # Households | Median Income |
| Owner-Occupied | 8,746 (93.2%) | $127,718 |
| Renter-Occupied | 635 (6.8%) | $84,665 |
| Average | 9,381 (100.0%) | $124,575 |
Occupancy by Householder Income Bracket in Madison
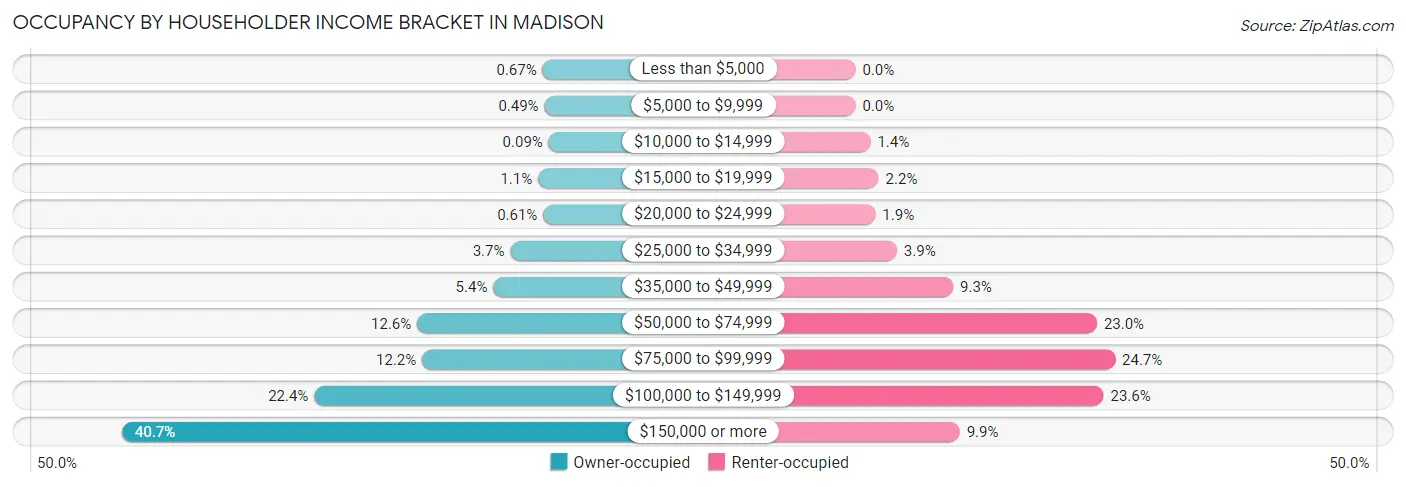
| Income Bracket | Owner-occupied | Renter-occupied |
| Less than $5,000 | 59 (0.7%) | 0 (0.0%) |
| $5,000 to $9,999 | 43 (0.5%) | 0 (0.0%) |
| $10,000 to $14,999 | 8 (0.1%) | 9 (1.4%) |
| $15,000 to $19,999 | 96 (1.1%) | 14 (2.2%) |
| $20,000 to $24,999 | 53 (0.6%) | 12 (1.9%) |
| $25,000 to $34,999 | 327 (3.7%) | 25 (3.9%) |
| $35,000 to $49,999 | 470 (5.4%) | 59 (9.3%) |
| $50,000 to $74,999 | 1,104 (12.6%) | 146 (23.0%) |
| $75,000 to $99,999 | 1,063 (12.1%) | 157 (24.7%) |
| $100,000 to $149,999 | 1,961 (22.4%) | 150 (23.6%) |
| $150,000 or more | 3,562 (40.7%) | 63 (9.9%) |
| Total | 8,746 (100.0%) | 635 (100.0%) |
Monthly Housing Cost Tiers in Madison
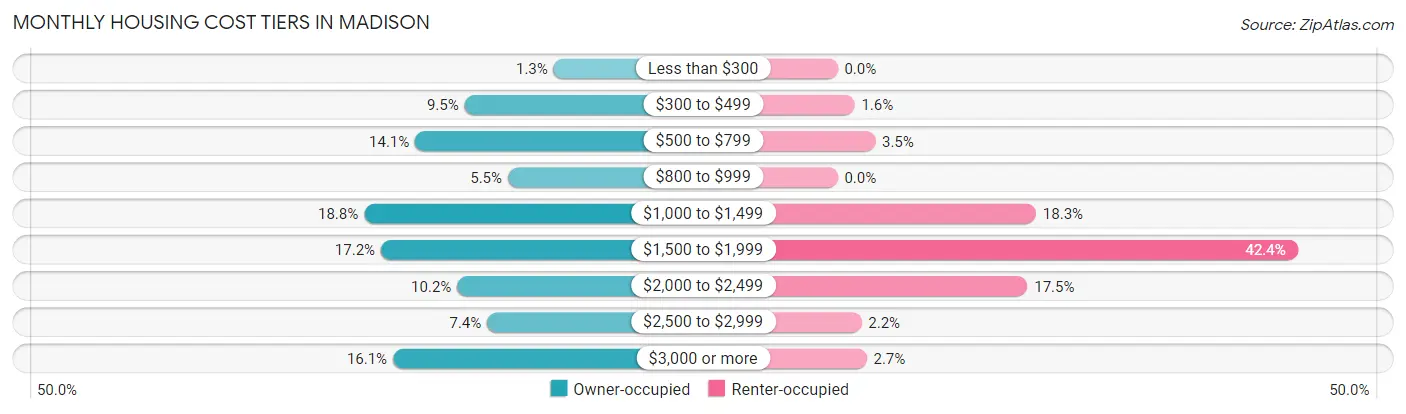
| Monthly Cost | Owner-occupied | Renter-occupied |
| Less than $300 | 114 (1.3%) | 0 (0.0%) |
| $300 to $499 | 831 (9.5%) | 10 (1.6%) |
| $500 to $799 | 1,229 (14.1%) | 22 (3.5%) |
| $800 to $999 | 482 (5.5%) | 0 (0.0%) |
| $1,000 to $1,499 | 1,640 (18.8%) | 116 (18.3%) |
| $1,500 to $1,999 | 1,504 (17.2%) | 269 (42.4%) |
| $2,000 to $2,499 | 890 (10.2%) | 111 (17.5%) |
| $2,500 to $2,999 | 649 (7.4%) | 14 (2.2%) |
| $3,000 or more | 1,407 (16.1%) | 17 (2.7%) |
| Total | 8,746 (100.0%) | 635 (100.0%) |
Physical Housing Characteristics in Madison
Housing Structures in Madison
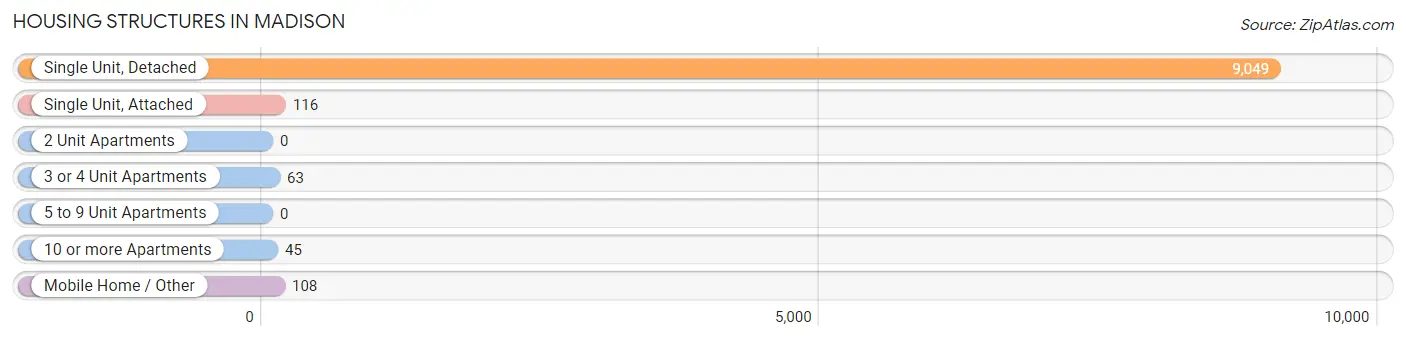
| Structure Type | # Housing Units | % Housing Units |
| Single Unit, Detached | 9,049 | 96.5% |
| Single Unit, Attached | 116 | 1.2% |
| 2 Unit Apartments | 0 | 0.0% |
| 3 or 4 Unit Apartments | 63 | 0.7% |
| 5 to 9 Unit Apartments | 0 | 0.0% |
| 10 or more Apartments | 45 | 0.5% |
| Mobile Home / Other | 108 | 1.1% |
| Total | 9,381 | 100.0% |
Housing Structures by Occupancy in Madison
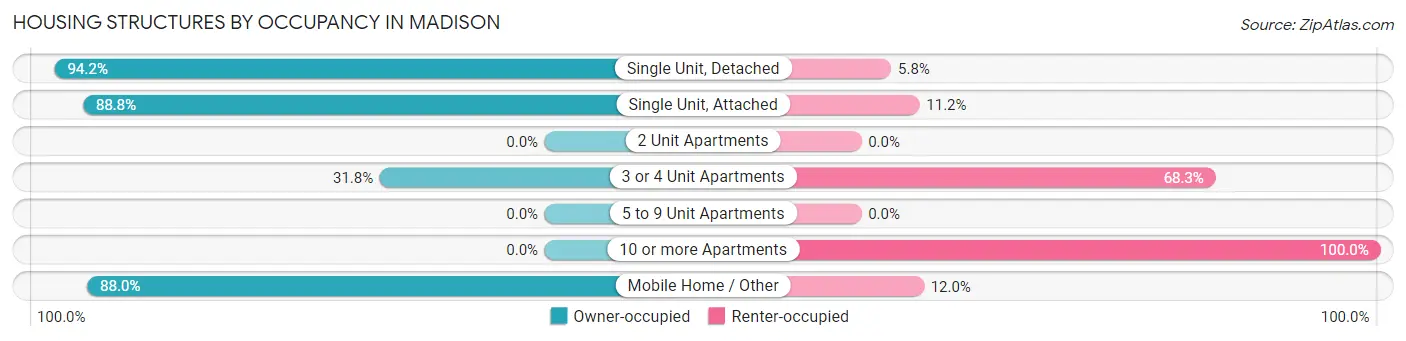
| Structure Type | Owner-occupied | Renter-occupied |
| Single Unit, Detached | 8,528 (94.2%) | 521 (5.8%) |
| Single Unit, Attached | 103 (88.8%) | 13 (11.2%) |
| 2 Unit Apartments | 0 (0.0%) | 0 (0.0%) |
| 3 or 4 Unit Apartments | 20 (31.8%) | 43 (68.2%) |
| 5 to 9 Unit Apartments | 0 (0.0%) | 0 (0.0%) |
| 10 or more Apartments | 0 (0.0%) | 45 (100.0%) |
| Mobile Home / Other | 95 (88.0%) | 13 (12.0%) |
| Total | 8,746 (93.2%) | 635 (6.8%) |
Housing Structures by Number of Rooms in Madison
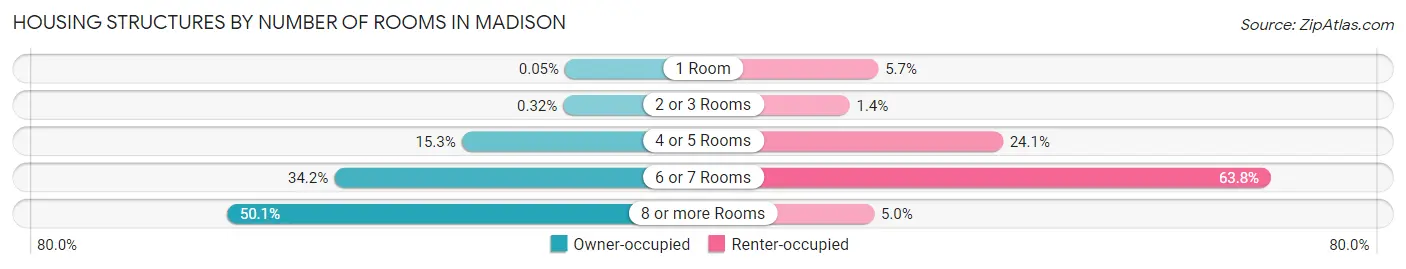
| Number of Rooms | Owner-occupied | Renter-occupied |
| 1 Room | 4 (0.1%) | 36 (5.7%) |
| 2 or 3 Rooms | 28 (0.3%) | 9 (1.4%) |
| 4 or 5 Rooms | 1,342 (15.3%) | 153 (24.1%) |
| 6 or 7 Rooms | 2,992 (34.2%) | 405 (63.8%) |
| 8 or more Rooms | 4,380 (50.1%) | 32 (5.0%) |
| Total | 8,746 (100.0%) | 635 (100.0%) |
Housing Structure by Heating Type in Madison
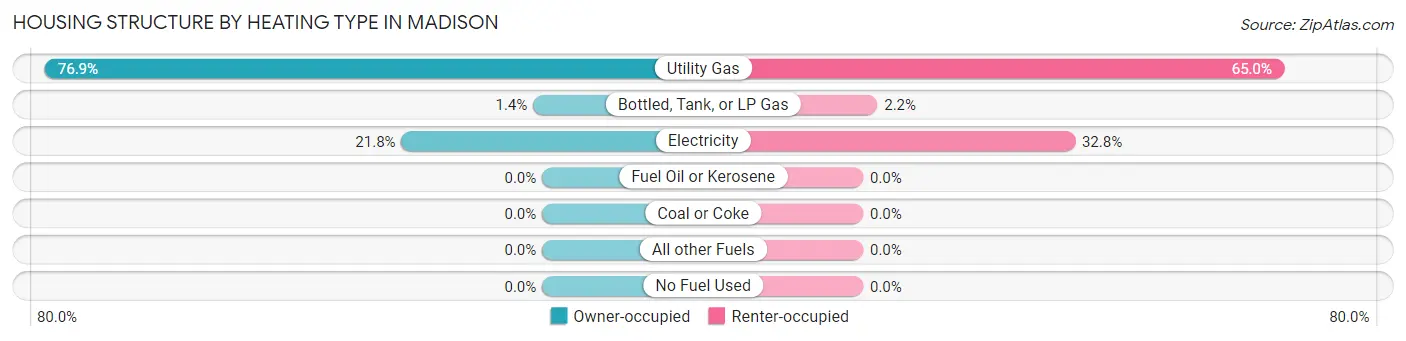
| Heating Type | Owner-occupied | Renter-occupied |
| Utility Gas | 6,722 (76.9%) | 413 (65.0%) |
| Bottled, Tank, or LP Gas | 122 (1.4%) | 14 (2.2%) |
| Electricity | 1,902 (21.7%) | 208 (32.8%) |
| Fuel Oil or Kerosene | 0 (0.0%) | 0 (0.0%) |
| Coal or Coke | 0 (0.0%) | 0 (0.0%) |
| All other Fuels | 0 (0.0%) | 0 (0.0%) |
| No Fuel Used | 0 (0.0%) | 0 (0.0%) |
| Total | 8,746 (100.0%) | 635 (100.0%) |
Household Vehicle Usage in Madison
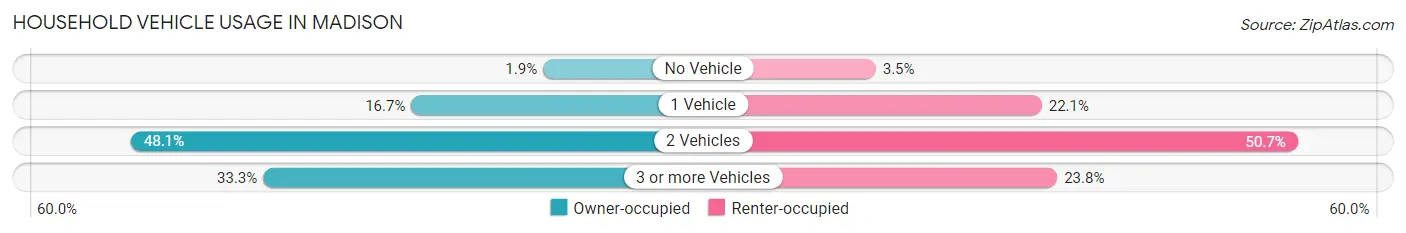
| Vehicles per Household | Owner-occupied | Renter-occupied |
| No Vehicle | 169 (1.9%) | 22 (3.5%) |
| 1 Vehicle | 1,460 (16.7%) | 140 (22.1%) |
| 2 Vehicles | 4,206 (48.1%) | 322 (50.7%) |
| 3 or more Vehicles | 2,911 (33.3%) | 151 (23.8%) |
| Total | 8,746 (100.0%) | 635 (100.0%) |
Real Estate & Mortgages in Madison
Real Estate and Mortgage Overview in Madison
| Characteristic | Without Mortgage | With Mortgage |
| Housing Units | 2,303 | 6,443 |
| Median Property Value | $292,500 | $323,500 |
| Median Household Income | $106,058 | $2,875 |
| Monthly Housing Costs | $568 | $1,392 |
| Real Estate Taxes | $2,045 | $72 |
Property Value by Mortgage Status in Madison
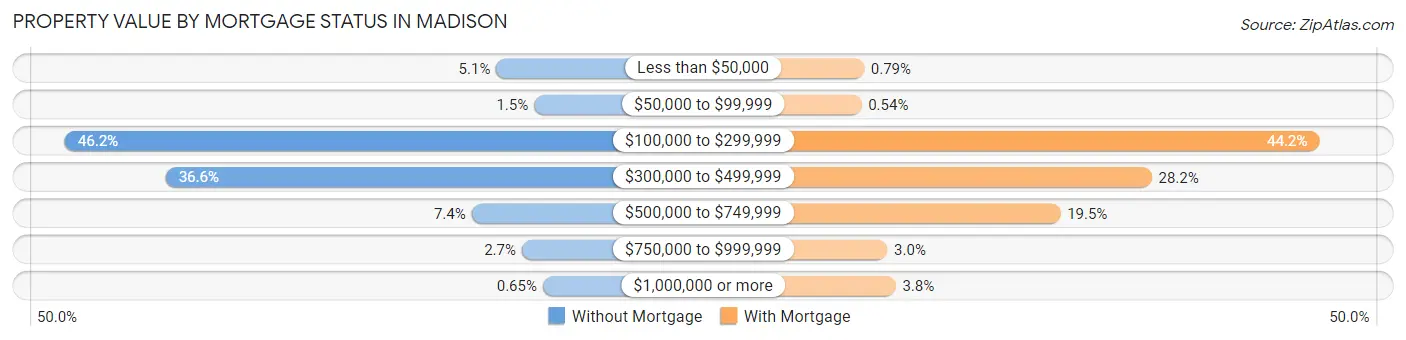
| Property Value | Without Mortgage | With Mortgage |
| Less than $50,000 | 117 (5.1%) | 51 (0.8%) |
| $50,000 to $99,999 | 34 (1.5%) | 35 (0.5%) |
| $100,000 to $299,999 | 1,063 (46.2%) | 2,846 (44.2%) |
| $300,000 to $499,999 | 842 (36.6%) | 1,816 (28.2%) |
| $500,000 to $749,999 | 171 (7.4%) | 1,256 (19.5%) |
| $750,000 to $999,999 | 61 (2.6%) | 194 (3.0%) |
| $1,000,000 or more | 15 (0.6%) | 245 (3.8%) |
| Total | 2,303 (100.0%) | 6,443 (100.0%) |
Household Income by Mortgage Status in Madison
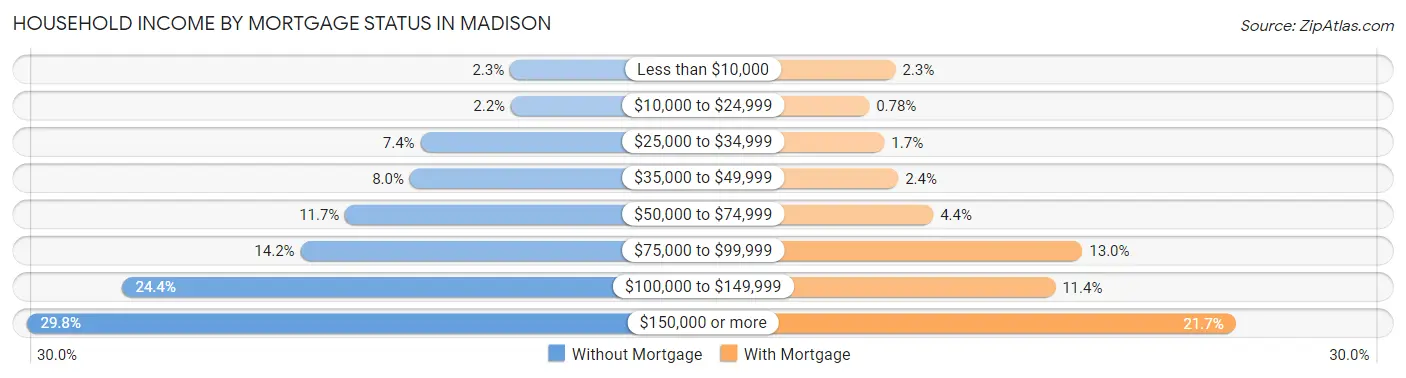
| Household Income | Without Mortgage | With Mortgage |
| Less than $10,000 | 52 (2.3%) | 147 (2.3%) |
| $10,000 to $24,999 | 51 (2.2%) | 50 (0.8%) |
| $25,000 to $34,999 | 170 (7.4%) | 106 (1.7%) |
| $35,000 to $49,999 | 184 (8.0%) | 157 (2.4%) |
| $50,000 to $74,999 | 269 (11.7%) | 286 (4.4%) |
| $75,000 to $99,999 | 328 (14.2%) | 835 (13.0%) |
| $100,000 to $149,999 | 562 (24.4%) | 735 (11.4%) |
| $150,000 or more | 687 (29.8%) | 1,399 (21.7%) |
| Total | 2,303 (100.0%) | 6,443 (100.0%) |
Property Value to Household Income Ratio in Madison
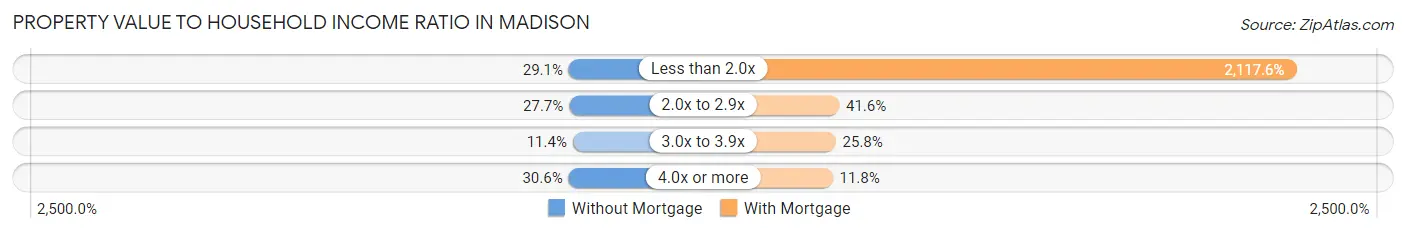
| Value-to-Income Ratio | Without Mortgage | With Mortgage |
| Less than 2.0x | 671 (29.1%) | 136,435 (2,117.6%) |
| 2.0x to 2.9x | 638 (27.7%) | 2,678 (41.6%) |
| 3.0x to 3.9x | 263 (11.4%) | 1,660 (25.8%) |
| 4.0x or more | 705 (30.6%) | 760 (11.8%) |
| Total | 2,303 (100.0%) | 6,443 (100.0%) |
Real Estate Taxes by Mortgage Status in Madison
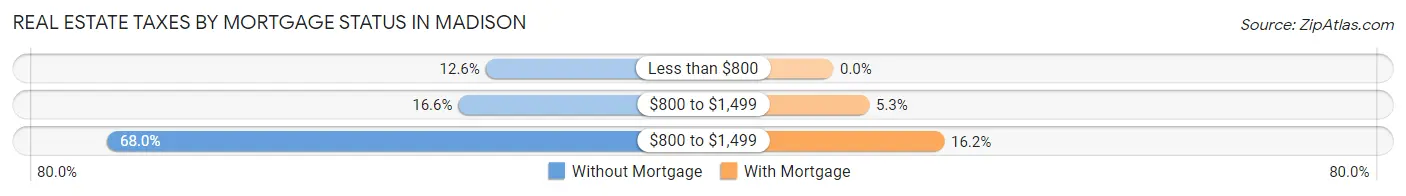
| Property Taxes | Without Mortgage | With Mortgage |
| Less than $800 | 291 (12.6%) | 0 (0.0%) |
| $800 to $1,499 | 383 (16.6%) | 339 (5.3%) |
| $800 to $1,499 | 1,565 (67.9%) | 1,045 (16.2%) |
| Total | 2,303 (100.0%) | 6,443 (100.0%) |
Health & Disability in Madison
Health Insurance Coverage by Age in Madison
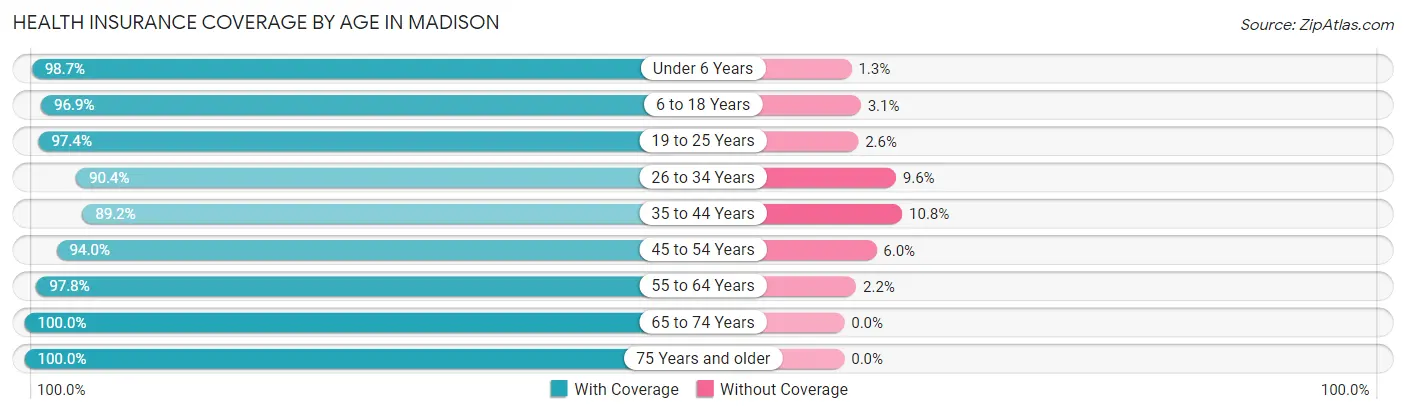
| Age Bracket | With Coverage | Without Coverage |
| Under 6 Years | 2,151 (98.7%) | 29 (1.3%) |
| 6 to 18 Years | 5,620 (96.9%) | 178 (3.1%) |
| 19 to 25 Years | 1,873 (97.4%) | 50 (2.6%) |
| 26 to 34 Years | 1,759 (90.4%) | 187 (9.6%) |
| 35 to 44 Years | 3,518 (89.2%) | 425 (10.8%) |
| 45 to 54 Years | 3,445 (94.0%) | 219 (6.0%) |
| 55 to 64 Years | 3,690 (97.8%) | 83 (2.2%) |
| 65 to 74 Years | 2,718 (100.0%) | 0 (0.0%) |
| 75 Years and older | 1,613 (100.0%) | 0 (0.0%) |
| Total | 26,387 (95.8%) | 1,171 (4.3%) |
Health Insurance Coverage by Citizenship Status in Madison
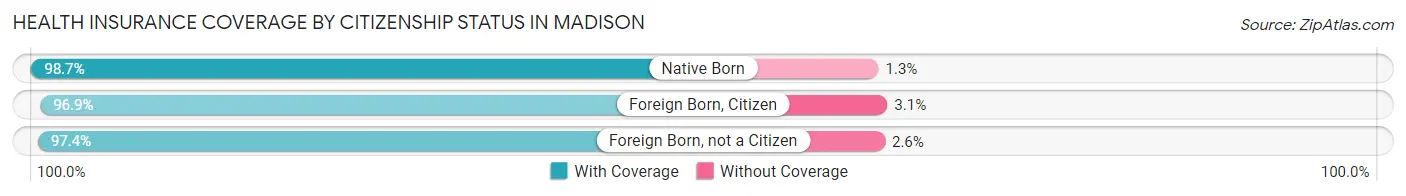
| Citizenship Status | With Coverage | Without Coverage |
| Native Born | 2,151 (98.7%) | 29 (1.3%) |
| Foreign Born, Citizen | 5,620 (96.9%) | 178 (3.1%) |
| Foreign Born, not a Citizen | 1,873 (97.4%) | 50 (2.6%) |
Health Insurance Coverage by Household Income in Madison
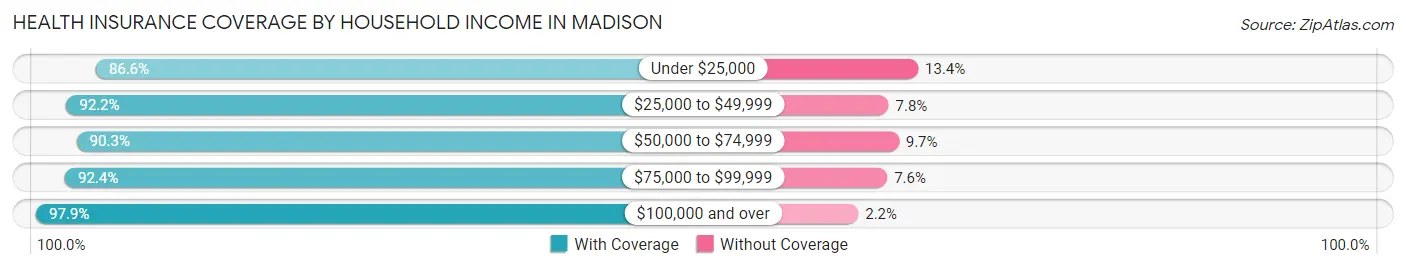
| Household Income | With Coverage | Without Coverage |
| Under $25,000 | 694 (86.6%) | 107 (13.4%) |
| $25,000 to $49,999 | 1,531 (92.2%) | 130 (7.8%) |
| $50,000 to $74,999 | 2,725 (90.3%) | 294 (9.7%) |
| $75,000 to $99,999 | 2,973 (92.4%) | 244 (7.6%) |
| $100,000 and over | 17,996 (97.9%) | 396 (2.1%) |
Public vs Private Health Insurance Coverage by Age in Madison
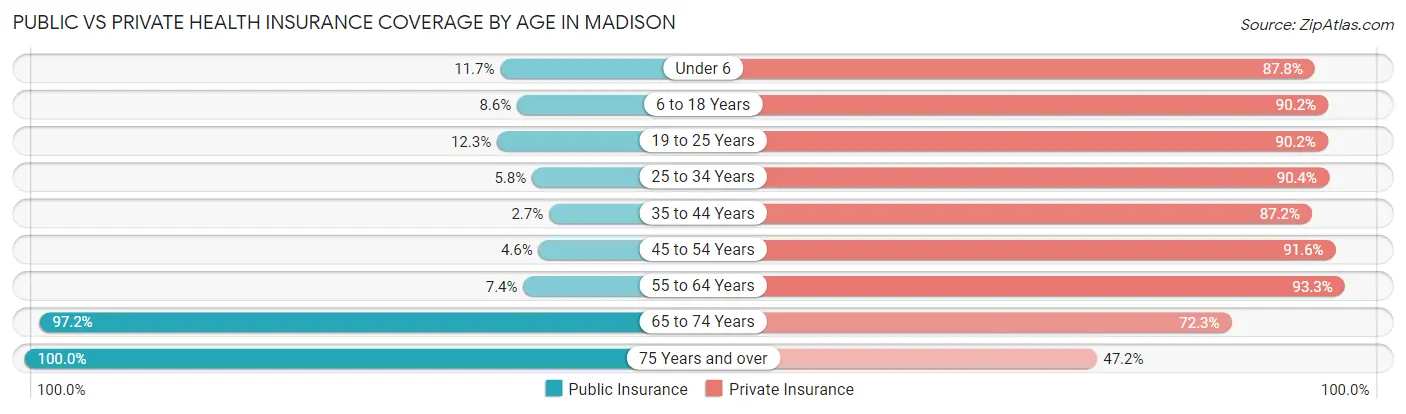
| Age Bracket | Public Insurance | Private Insurance |
| Under 6 | 255 (11.7%) | 1,914 (87.8%) |
| 6 to 18 Years | 498 (8.6%) | 5,231 (90.2%) |
| 19 to 25 Years | 237 (12.3%) | 1,734 (90.2%) |
| 25 to 34 Years | 113 (5.8%) | 1,759 (90.4%) |
| 35 to 44 Years | 105 (2.7%) | 3,440 (87.2%) |
| 45 to 54 Years | 169 (4.6%) | 3,357 (91.6%) |
| 55 to 64 Years | 280 (7.4%) | 3,521 (93.3%) |
| 65 to 74 Years | 2,643 (97.2%) | 1,965 (72.3%) |
| 75 Years and over | 1,613 (100.0%) | 762 (47.2%) |
| Total | 5,913 (21.5%) | 23,683 (85.9%) |
Disability Status by Sex by Age in Madison
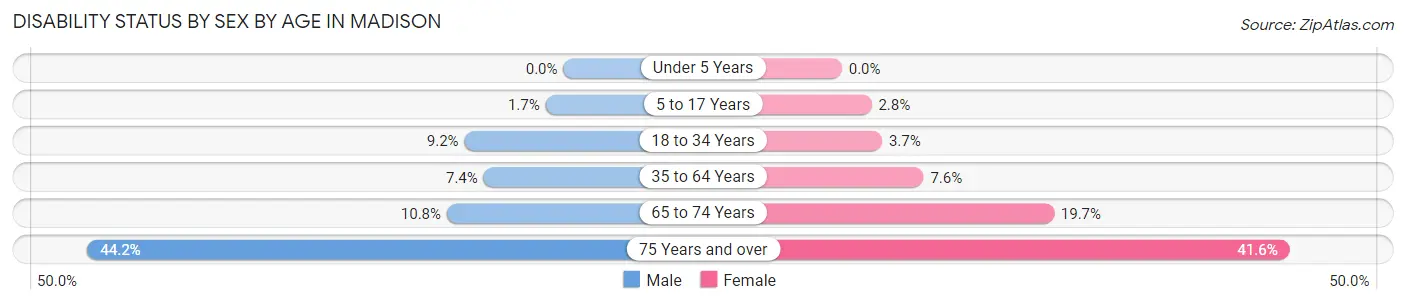
| Age Bracket | Male | Female |
| Under 5 Years | 0 (0.0%) | 0 (0.0%) |
| 5 to 17 Years | 49 (1.7%) | 78 (2.8%) |
| 18 to 34 Years | 196 (9.2%) | 78 (3.7%) |
| 35 to 64 Years | 404 (7.4%) | 449 (7.6%) |
| 65 to 74 Years | 151 (10.8%) | 260 (19.7%) |
| 75 Years and over | 250 (44.2%) | 435 (41.5%) |
Disability Class by Sex by Age in Madison
Disability Class: Hearing Difficulty
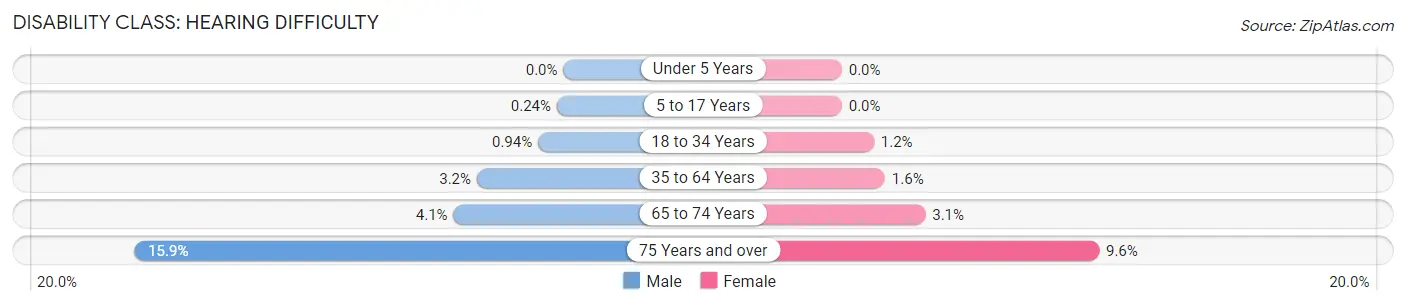
| Age Bracket | Male | Female |
| Under 5 Years | 0 (0.0%) | 0 (0.0%) |
| 5 to 17 Years | 7 (0.2%) | 0 (0.0%) |
| 18 to 34 Years | 20 (0.9%) | 25 (1.2%) |
| 35 to 64 Years | 175 (3.2%) | 95 (1.6%) |
| 65 to 74 Years | 57 (4.1%) | 41 (3.1%) |
| 75 Years and over | 90 (15.9%) | 100 (9.6%) |
Disability Class: Vision Difficulty
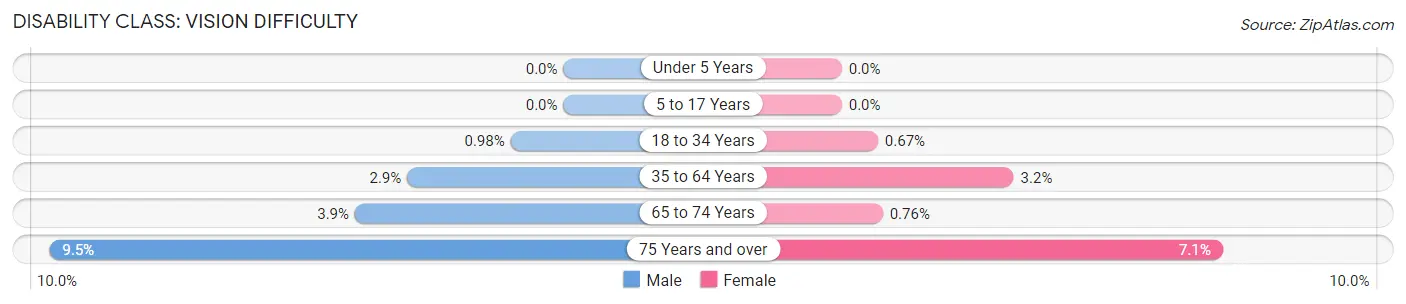
| Age Bracket | Male | Female |
| Under 5 Years | 0 (0.0%) | 0 (0.0%) |
| 5 to 17 Years | 0 (0.0%) | 0 (0.0%) |
| 18 to 34 Years | 21 (1.0%) | 14 (0.7%) |
| 35 to 64 Years | 158 (2.9%) | 189 (3.2%) |
| 65 to 74 Years | 54 (3.9%) | 10 (0.8%) |
| 75 Years and over | 54 (9.5%) | 74 (7.1%) |
Disability Class: Cognitive Difficulty
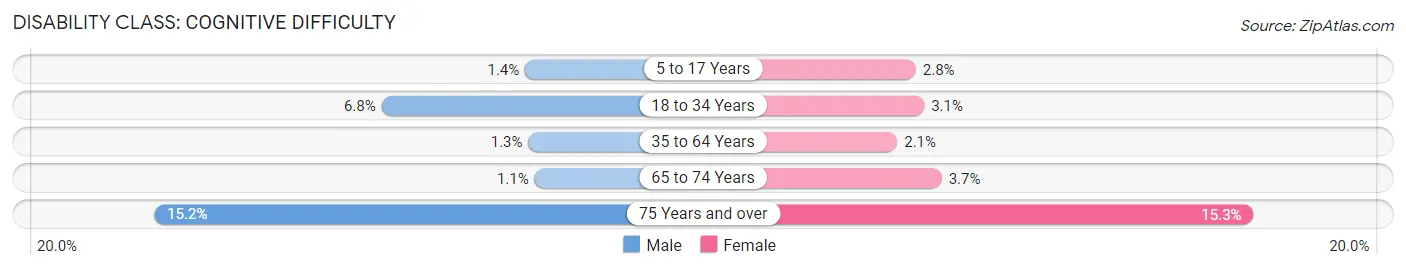
| Age Bracket | Male | Female |
| 5 to 17 Years | 42 (1.4%) | 78 (2.8%) |
| 18 to 34 Years | 144 (6.8%) | 64 (3.1%) |
| 35 to 64 Years | 71 (1.3%) | 122 (2.1%) |
| 65 to 74 Years | 15 (1.1%) | 49 (3.7%) |
| 75 Years and over | 86 (15.2%) | 160 (15.3%) |
Disability Class: Ambulatory Difficulty
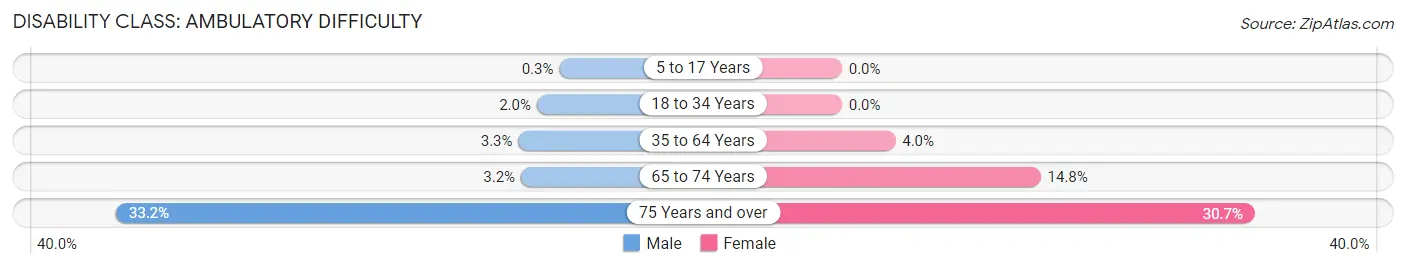
| Age Bracket | Male | Female |
| 5 to 17 Years | 9 (0.3%) | 0 (0.0%) |
| 18 to 34 Years | 42 (2.0%) | 0 (0.0%) |
| 35 to 64 Years | 182 (3.3%) | 235 (4.0%) |
| 65 to 74 Years | 44 (3.2%) | 195 (14.8%) |
| 75 Years and over | 188 (33.2%) | 321 (30.7%) |
Disability Class: Self-Care Difficulty
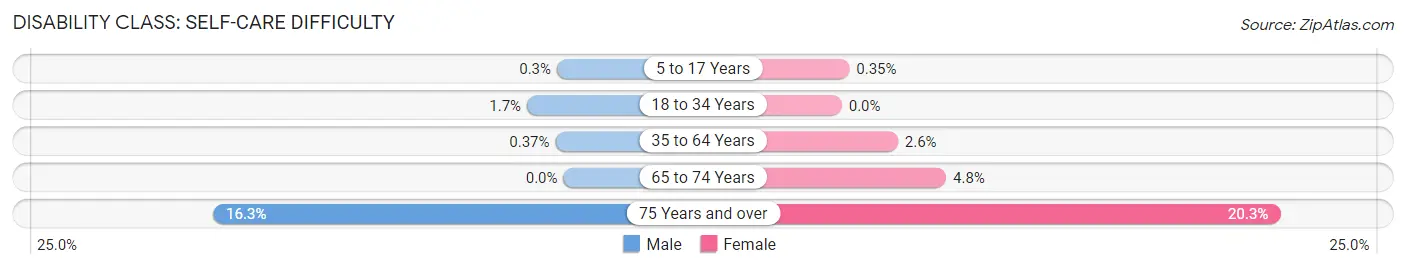
| Age Bracket | Male | Female |
| 5 to 17 Years | 9 (0.3%) | 10 (0.4%) |
| 18 to 34 Years | 36 (1.7%) | 0 (0.0%) |
| 35 to 64 Years | 20 (0.4%) | 154 (2.6%) |
| 65 to 74 Years | 0 (0.0%) | 64 (4.8%) |
| 75 Years and over | 92 (16.3%) | 213 (20.3%) |
Technology Access in Madison
Computing Device Access in Madison
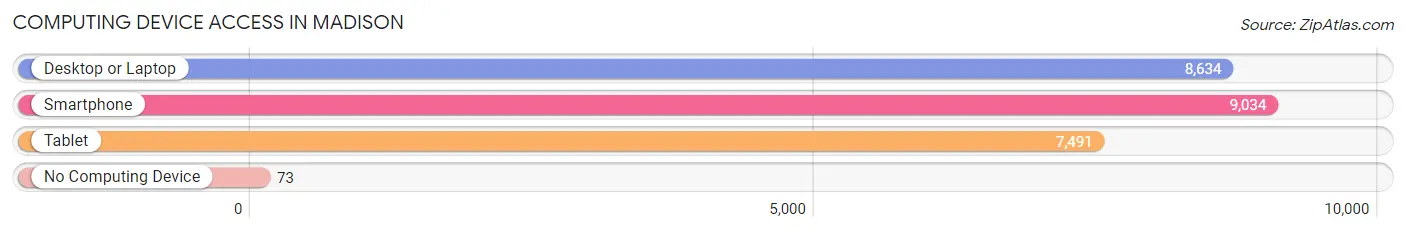
| Device Type | # Households | % Households |
| Desktop or Laptop | 8,634 | 92.0% |
| Smartphone | 9,034 | 96.3% |
| Tablet | 7,491 | 79.8% |
| No Computing Device | 73 | 0.8% |
| Total | 9,381 | 100.0% |
Internet Access in Madison
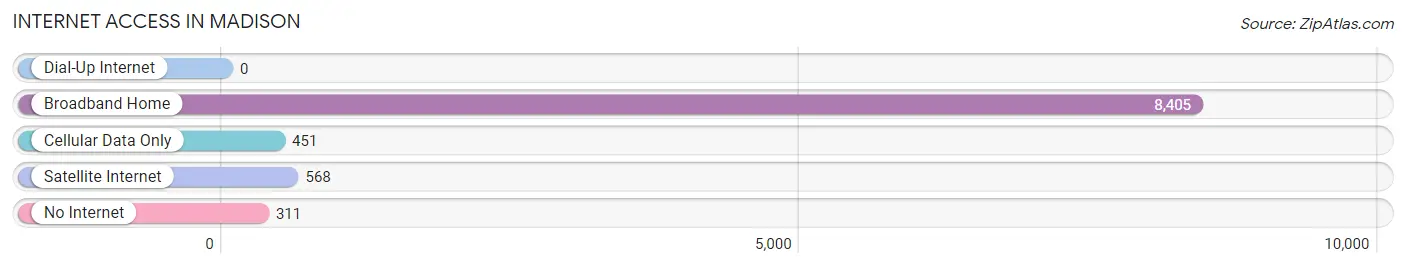
| Internet Type | # Households | % Households |
| Dial-Up Internet | 0 | 0.0% |
| Broadband Home | 8,405 | 89.6% |
| Cellular Data Only | 451 | 4.8% |
| Satellite Internet | 568 | 6.0% |
| No Internet | 311 | 3.3% |
| Total | 9,381 | 100.0% |
Madison Summary
Madison, Mississippi is a city located in Madison County, Mississippi, United States. It is part of the Jackson Metropolitan Statistical Area. The population was 24,841 at the 2010 census, up from 19,841 at the 2000 census. Madison is the largest city in Madison County and the second largest in the Jackson metropolitan area.
History
The area that is now Madison was first settled in the early 1800s by settlers from the Natchez area. The town was originally known as Mico, after the Choctaw word for "bear". The town was renamed Madison in 1839, after President James Madison.
In 1856, the town was incorporated and the first mayor was elected. The town grew rapidly in the late 19th century, and by the early 20th century, Madison had become a thriving agricultural center.
In the 1950s, Madison began to experience a population boom as people moved from rural areas to the city. This growth continued into the 1960s and 1970s, and by the 1980s, Madison had become a major suburb of Jackson.
Geography
Madison is located in central Madison County, at 32°27'N 90°7'W (32.45, -90.12). It is bordered to the north by Ridgeland, to the east by Canton, to the south by Flora, and to the west by Gluckstadt.
The city is located in the Jackson metropolitan area, which is the largest metropolitan area in Mississippi. The city is located approximately 20 miles (32 km) north of downtown Jackson.
Economy
Madison's economy is largely based on the service industry, with many businesses providing services to the surrounding area. The city is home to several large employers, including Nissan North America, which has a manufacturing plant in the city. Other major employers include the Madison County School District, Madison County Hospital, and the University of Mississippi Medical Center.
The city also has a thriving retail sector, with several shopping centers and malls located in the city.
Demographics
As of the 2010 census, there were 24,841 people, 9,841 households, and 6,845 families residing in the city. The population density was 1,092.3 people per square mile (421.7/km2). There were 10,841 housing units at an average density of 472.3 per square mile (182.3/km2). The racial makeup of the city was 73.2% White, 22.2% African American, 0.3% Native American, 1.7% Asian, 0.1% Pacific Islander, 0.9% from other races, and 1.6% from two or more races. Hispanic or Latino of any race were 2.7% of the population.
There were 9,841 households, out of which 33.2% had children under the age of 18 living with them, 51.2% were married couples living together, 13.7% had a female householder with no husband present, and 30.7% were non-families. 25.2% of all households were made up of individuals, and 8.2% had someone living alone who was 65 years of age or older. The average household size was 2.50 and the average family size was 3.00.
In the city, the population was spread out, with 25.7% under the age of 18, 8.2% from 18 to 24, 30.2% from 25 to 44, 24.2% from 45 to 64, and 11.7% who were 65 years of age or older. The median age was 36 years. For every 100 females, there were 93.2 males. For every 100 females age 18 and over, there were 89.7 males.
The median income for a household in the city was $50,945, and the median income for a family was $60,945. Males had a median income of $41,945 versus $30,945 for females. The per capita income for the city was $24,945. About 6.2% of families and 8.2% of the population were below the poverty line, including 10.2% of those under age 18 and 8.2% of those age 65 or over.
Common Questions
What is Per Capita Income in Madison?
Per Capita income in Madison is $56,957.
What is the Median Family Income in Madison?
Median Family Income in Madison is $143,924.
What is the Median Household income in Madison?
Median Household Income in Madison is $124,575.
What is Income or Wage Gap in Madison?
Income or Wage Gap in Madison is 33.8%.
Women in Madison earn 66.2 cents for every dollar earned by a man.
What is Family Income Deficit in Madison?
Family Income Deficit in Madison is $13,240.
Families that are below poverty line in Madison earn $13,240 less on average than the poverty threshold level.
What is Inequality or Gini Index in Madison?
Inequality or Gini Index in Madison is 0.43.
What is the Total Population of Madison?
Total Population of Madison is 27,595.
What is the Total Male Population of Madison?
Total Male Population of Madison is 13,435.
What is the Total Female Population of Madison?
Total Female Population of Madison is 14,160.
What is the Ratio of Males per 100 Females in Madison?
There are 94.88 Males per 100 Females in Madison.
What is the Ratio of Females per 100 Males in Madison?
There are 105.40 Females per 100 Males in Madison.
What is the Median Population Age in Madison?
Median Population Age in Madison is 40.6 Years.
What is the Average Family Size in Madison
Average Family Size in Madison is 3.4 People.
What is the Average Household Size in Madison
Average Household Size in Madison is 2.9 People.
How Large is the Labor Force in Madison?
There are 13,674 People in the Labor Forcein in Madison.
What is the Percentage of People in the Labor Force in Madison?
65.6% of People are in the Labor Force in Madison.
What is the Unemployment Rate in Madison?
Unemployment Rate in Madison is 2.7%.