Biloxi, MS Map & Demographics
Biloxi Map
Biloxi Overview
$32,679
PER CAPITA INCOME
$70,425
AVG FAMILY INCOME
$55,775
AVG HOUSEHOLD INCOME
15.6%
WAGE / INCOME GAP [ % ]
84.4¢/ $1
WAGE / INCOME GAP [ $ ]
$10,208
FAMILY INCOME DEFICIT
0.46
INEQUALITY / GINI INDEX
49,141
TOTAL POPULATION
24,216
MALE POPULATION
24,925
FEMALE POPULATION
97.16
MALES / 100 FEMALES
102.93
FEMALES / 100 MALES
36.7
MEDIAN AGE
3.1
AVG FAMILY SIZE
2.4
AVG HOUSEHOLD SIZE
25,939
LABOR FORCE [ PEOPLE ]
66.5%
PERCENT IN LABOR FORCE
8.1%
UNEMPLOYMENT RATE
Biloxi Area Codes
Income in Biloxi
Income Overview in Biloxi
Per Capita Income in Biloxi is $32,679, while median incomes of families and households are $70,425 and $55,775 respectively.
| Characteristic | Number | Measure |
| Per Capita Income | 49,141 | $32,679 |
| Median Family Income | 12,104 | $70,425 |
| Mean Family Income | 12,104 | $93,211 |
| Median Household Income | 19,666 | $55,775 |
| Mean Household Income | 19,666 | $76,636 |
| Income Deficit | 12,104 | $10,208 |
| Wage / Income Gap (%) | 49,141 | 15.58% |
| Wage / Income Gap ($) | 49,141 | 84.42¢ per $1 |
| Gini / Inequality Index | 49,141 | 0.46 |
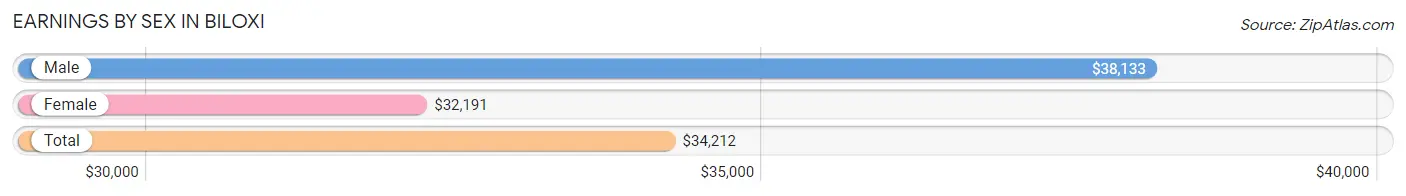
Earnings by Sex in Biloxi
Average Earnings in Biloxi are $34,212, $38,133 for men and $32,191 for women, a difference of 15.6%.
| Sex | Number | Average Earnings |
| Male | 14,166 (53.9%) | $38,133 |
| Female | 12,108 (46.1%) | $32,191 |
| Total | 26,274 (100.0%) | $34,212 |
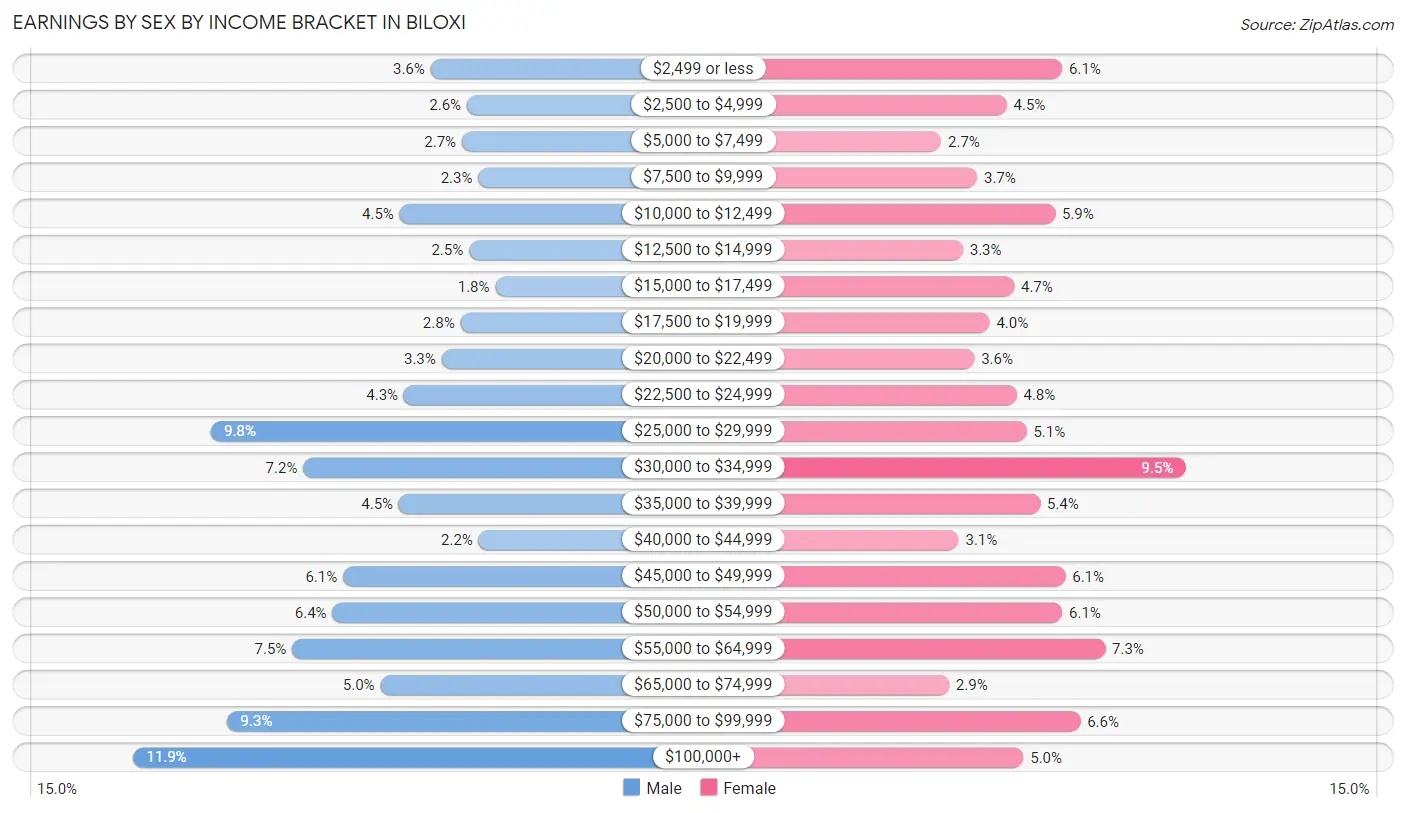
Earnings by Sex by Income Bracket in Biloxi
The most common earnings brackets in Biloxi are $100,000+ for men (1,691 | 11.9%) and $30,000 to $34,999 for women (1,152 | 9.5%).
| Income | Male | Female |
| $2,499 or less | 508 (3.6%) | 732 (6.0%) |
| $2,500 to $4,999 | 364 (2.6%) | 544 (4.5%) |
| $5,000 to $7,499 | 384 (2.7%) | 321 (2.6%) |
| $7,500 to $9,999 | 319 (2.2%) | 443 (3.7%) |
| $10,000 to $12,499 | 632 (4.5%) | 708 (5.9%) |
| $12,500 to $14,999 | 356 (2.5%) | 395 (3.3%) |
| $15,000 to $17,499 | 251 (1.8%) | 569 (4.7%) |
| $17,500 to $19,999 | 389 (2.8%) | 486 (4.0%) |
| $20,000 to $22,499 | 465 (3.3%) | 434 (3.6%) |
| $22,500 to $24,999 | 615 (4.3%) | 577 (4.8%) |
| $25,000 to $29,999 | 1,383 (9.8%) | 611 (5.1%) |
| $30,000 to $34,999 | 1,015 (7.2%) | 1,152 (9.5%) |
| $35,000 to $39,999 | 635 (4.5%) | 658 (5.4%) |
| $40,000 to $44,999 | 317 (2.2%) | 380 (3.1%) |
| $45,000 to $49,999 | 857 (6.0%) | 743 (6.1%) |
| $50,000 to $54,999 | 900 (6.4%) | 733 (6.0%) |
| $55,000 to $64,999 | 1,059 (7.5%) | 879 (7.3%) |
| $65,000 to $74,999 | 709 (5.0%) | 348 (2.9%) |
| $75,000 to $99,999 | 1,317 (9.3%) | 794 (6.6%) |
| $100,000+ | 1,691 (11.9%) | 601 (5.0%) |
| Total | 14,166 (100.0%) | 12,108 (100.0%) |
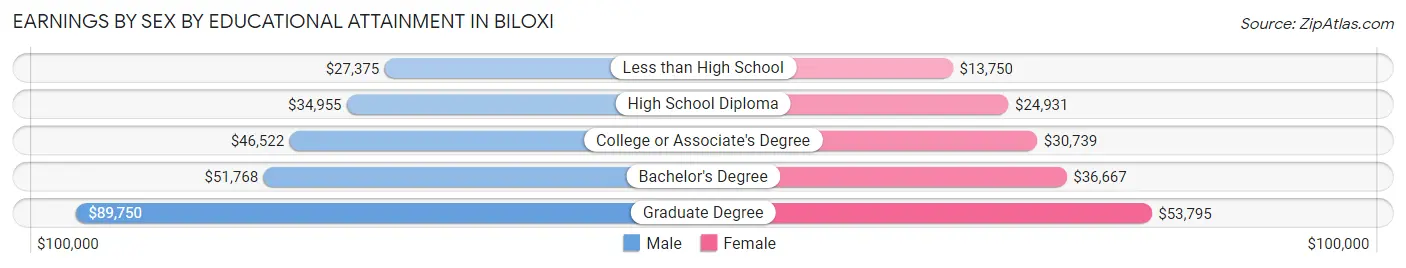
Earnings by Sex by Educational Attainment in Biloxi
Average earnings in Biloxi are $46,522 for men and $34,302 for women, a difference of 26.3%. Men with an educational attainment of graduate degree enjoy the highest average annual earnings of $89,750, while those with less than high school education earn the least with $27,375. Women with an educational attainment of graduate degree earn the most with the average annual earnings of $53,795, while those with less than high school education have the smallest earnings of $13,750.
| Educational Attainment | Male Income | Female Income |
| Less than High School | $27,375 | $13,750 |
| High School Diploma | $34,955 | $24,931 |
| College or Associate's Degree | $46,522 | $30,739 |
| Bachelor's Degree | $51,768 | $36,667 |
| Graduate Degree | $89,750 | $53,795 |
| Total | $46,522 | $34,302 |
Family Income in Biloxi
Family Income Brackets in Biloxi
According to the Biloxi family income data, there are 2,409 families falling into the $100,000 to $149,999 income range, which is the most common income bracket and makes up 19.9% of all families. Conversely, the $10,000 to $14,999 income bracket is the least frequent group with only 266 families (2.2%) belonging to this category.
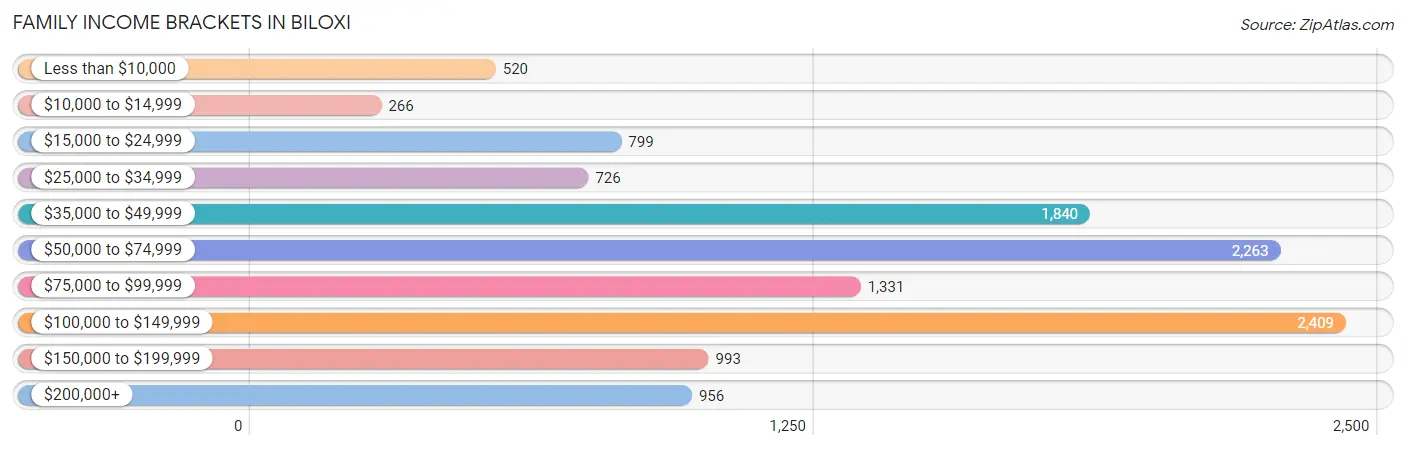
| Income Bracket | # Families | % Families |
| Less than $10,000 | 520 | 4.3% |
| $10,000 to $14,999 | 266 | 2.2% |
| $15,000 to $24,999 | 799 | 6.6% |
| $25,000 to $34,999 | 726 | 6.0% |
| $35,000 to $49,999 | 1,840 | 15.2% |
| $50,000 to $74,999 | 2,263 | 18.7% |
| $75,000 to $99,999 | 1,331 | 11.0% |
| $100,000 to $149,999 | 2,409 | 19.9% |
| $150,000 to $199,999 | 993 | 8.2% |
| $200,000+ | 956 | 7.9% |
Family Income by Famaliy Size in Biloxi
7+ person families (199 | 1.6%) account for the highest median family income in Biloxi with $124,405 per family, while 2-person families (5,912 | 48.8%) have the highest median income of $33,130 per family member.
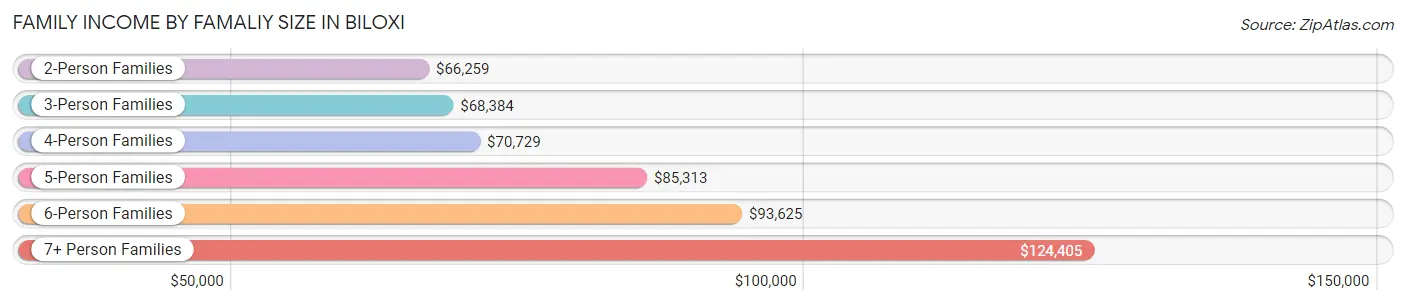
| Income Bracket | # Families | Median Income |
| 2-Person Families | 5,912 (48.8%) | $66,259 |
| 3-Person Families | 3,115 (25.7%) | $68,384 |
| 4-Person Families | 1,890 (15.6%) | $70,729 |
| 5-Person Families | 703 (5.8%) | $85,313 |
| 6-Person Families | 285 (2.4%) | $93,625 |
| 7+ Person Families | 199 (1.6%) | $124,405 |
| Total | 12,104 (100.0%) | $70,425 |
Family Income by Number of Earners in Biloxi
The median family income in Biloxi is $70,425, with families comprising 3+ earners (911) having the highest median family income of $140,559, while families with no earners (1,660) have the lowest median family income of $47,439, accounting for 7.5% and 13.7% of families, respectively.
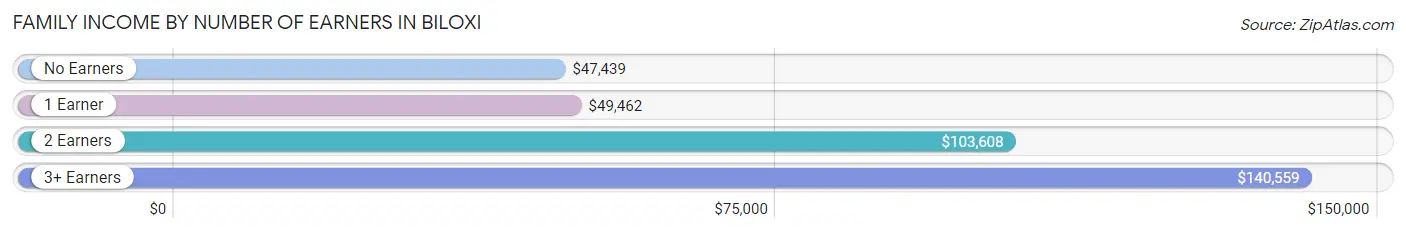
| Number of Earners | # Families | Median Income |
| No Earners | 1,660 (13.7%) | $47,439 |
| 1 Earner | 4,728 (39.1%) | $49,462 |
| 2 Earners | 4,805 (39.7%) | $103,608 |
| 3+ Earners | 911 (7.5%) | $140,559 |
| Total | 12,104 (100.0%) | $70,425 |
Household Income in Biloxi
Household Income Brackets in Biloxi
With 3,442 households falling in the category, the $50,000 to $74,999 income range is the most frequent in Biloxi, accounting for 17.5% of all households. In contrast, only 964 households (4.9%) fall into the $10,000 to $14,999 income bracket, making it the least populous group.
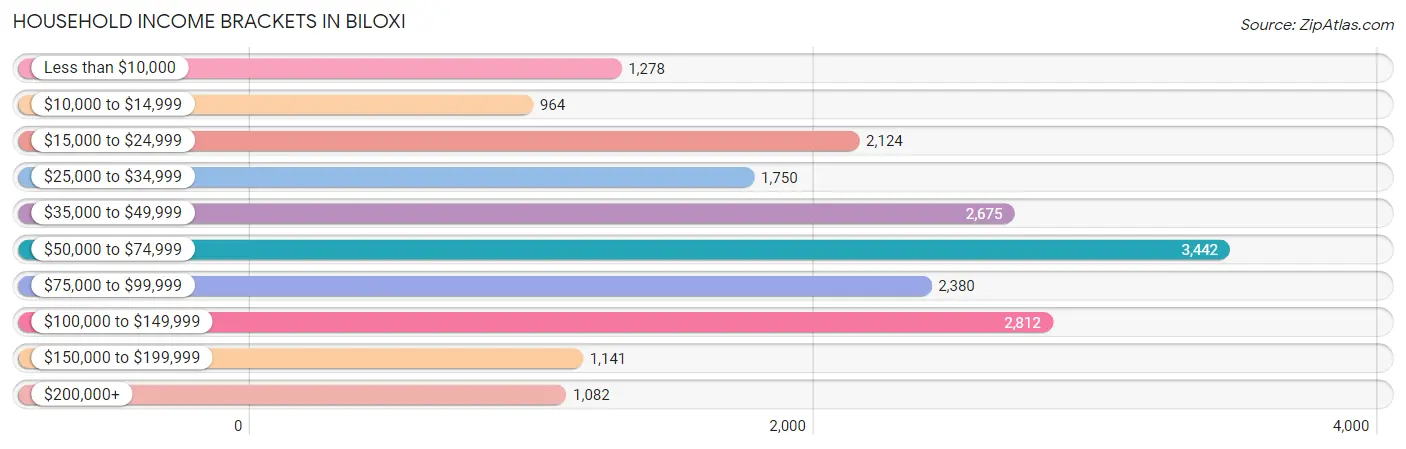
| Income Bracket | # Households | % Households |
| Less than $10,000 | 1,278 | 6.5% |
| $10,000 to $14,999 | 964 | 4.9% |
| $15,000 to $24,999 | 2,124 | 10.8% |
| $25,000 to $34,999 | 1,750 | 8.9% |
| $35,000 to $49,999 | 2,675 | 13.6% |
| $50,000 to $74,999 | 3,442 | 17.5% |
| $75,000 to $99,999 | 2,380 | 12.1% |
| $100,000 to $149,999 | 2,812 | 14.3% |
| $150,000 to $199,999 | 1,141 | 5.8% |
| $200,000+ | 1,082 | 5.5% |
Household Income by Householder Age in Biloxi
The median household income in Biloxi is $55,775, with the highest median household income of $66,361 found in the 45 to 64 years age bracket for the primary householder. A total of 7,177 households (36.5%) fall into this category. Meanwhile, the 15 to 24 years age bracket for the primary householder has the lowest median household income of $47,529, with 1,003 households (5.1%) in this group.
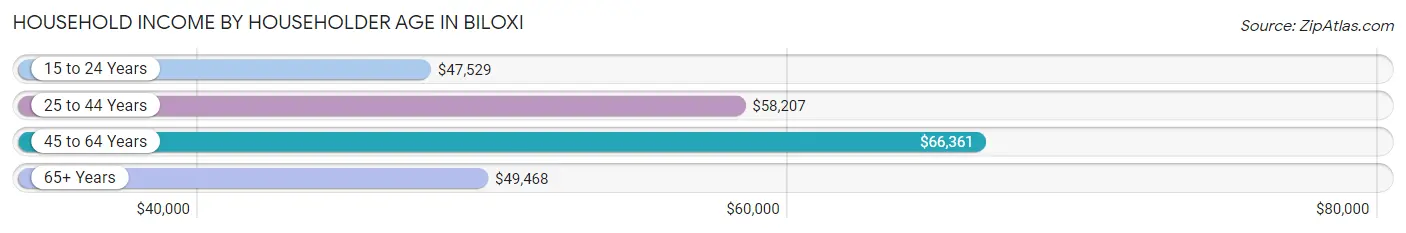
| Income Bracket | # Households | Median Income |
| 15 to 24 Years | 1,003 (5.1%) | $47,529 |
| 25 to 44 Years | 6,668 (33.9%) | $58,207 |
| 45 to 64 Years | 7,177 (36.5%) | $66,361 |
| 65+ Years | 4,818 (24.5%) | $49,468 |
| Total | 19,666 (100.0%) | $55,775 |
Poverty in Biloxi
Income Below Poverty by Sex and Age in Biloxi
With 13.1% poverty level for males and 15.6% for females among the residents of Biloxi, under 5 year old males and 75 year old and over females are the most vulnerable to poverty, with 354 males (26.1%) and 371 females (23.3%) in their respective age groups living below the poverty level.
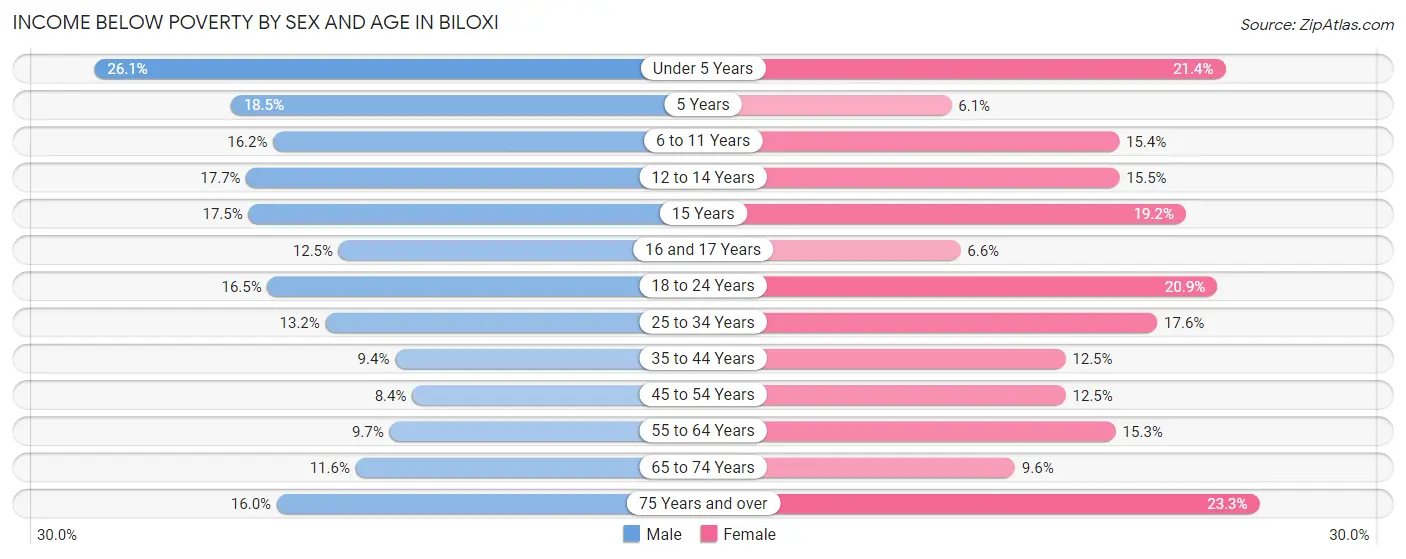
| Age Bracket | Male | Female |
| Under 5 Years | 354 (26.1%) | 377 (21.3%) |
| 5 Years | 40 (18.5%) | 21 (6.1%) |
| 6 to 11 Years | 281 (16.2%) | 305 (15.4%) |
| 12 to 14 Years | 191 (17.6%) | 134 (15.5%) |
| 15 Years | 44 (17.5%) | 72 (19.2%) |
| 16 and 17 Years | 56 (12.5%) | 38 (6.6%) |
| 18 to 24 Years | 296 (16.5%) | 381 (20.9%) |
| 25 to 34 Years | 392 (13.2%) | 650 (17.6%) |
| 35 to 44 Years | 276 (9.4%) | 343 (12.4%) |
| 45 to 54 Years | 251 (8.4%) | 362 (12.5%) |
| 55 to 64 Years | 330 (9.7%) | 499 (15.2%) |
| 65 to 74 Years | 257 (11.6%) | 220 (9.6%) |
| 75 Years and over | 178 (16.0%) | 371 (23.3%) |
| Total | 2,946 (13.1%) | 3,773 (15.6%) |
Income Above Poverty by Sex and Age in Biloxi
According to the poverty statistics in Biloxi, males aged 45 to 54 years and females aged 5 years are the age groups that are most secure financially, with 91.6% of males and 93.9% of females in these age groups living above the poverty line.
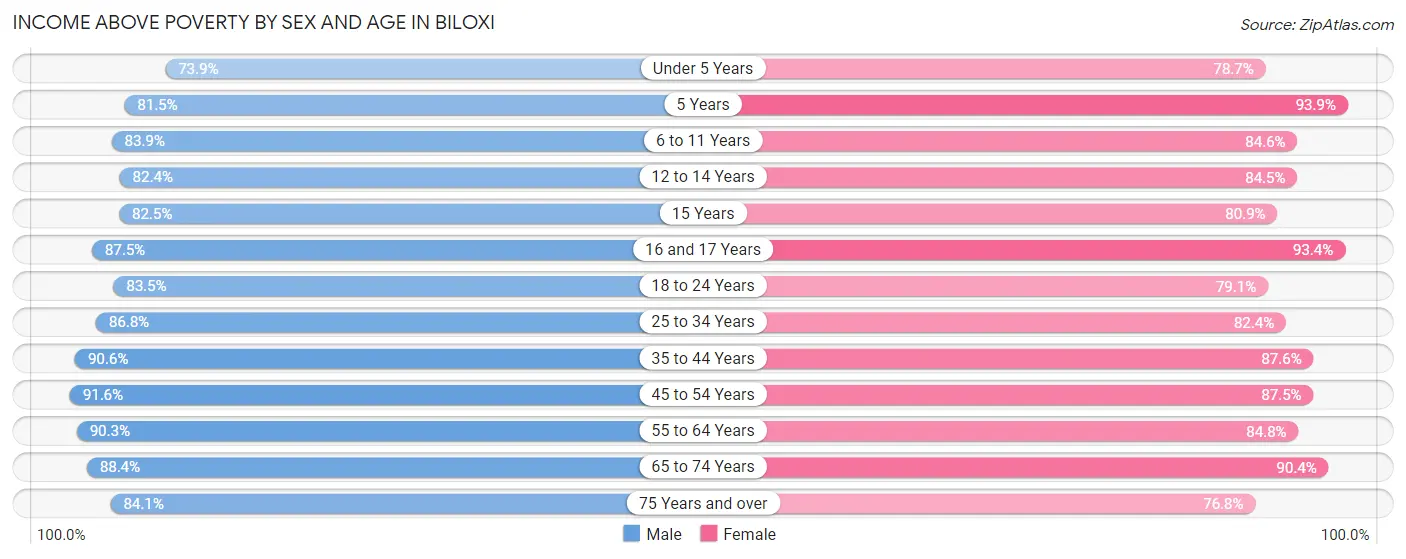
| Age Bracket | Male | Female |
| Under 5 Years | 1,002 (73.9%) | 1,389 (78.6%) |
| 5 Years | 176 (81.5%) | 323 (93.9%) |
| 6 to 11 Years | 1,459 (83.9%) | 1,670 (84.6%) |
| 12 to 14 Years | 891 (82.4%) | 733 (84.5%) |
| 15 Years | 207 (82.5%) | 304 (80.8%) |
| 16 and 17 Years | 392 (87.5%) | 538 (93.4%) |
| 18 to 24 Years | 1,501 (83.5%) | 1,442 (79.1%) |
| 25 to 34 Years | 2,568 (86.8%) | 3,052 (82.4%) |
| 35 to 44 Years | 2,672 (90.6%) | 2,412 (87.5%) |
| 45 to 54 Years | 2,734 (91.6%) | 2,544 (87.5%) |
| 55 to 64 Years | 3,079 (90.3%) | 2,773 (84.8%) |
| 65 to 74 Years | 1,966 (88.4%) | 2,061 (90.4%) |
| 75 Years and over | 938 (84.1%) | 1,225 (76.7%) |
| Total | 19,585 (86.9%) | 20,466 (84.4%) |
Income Below Poverty Among Married-Couple Families in Biloxi
The poverty statistics for married-couple families in Biloxi show that 4.9% or 422 of the total 8,696 families live below the poverty line. Families with 5 or more children have the highest poverty rate of 50.0%, comprising of 7 families. On the other hand, families with 1 or 2 children have the lowest poverty rate of 3.8%, which includes 114 families.
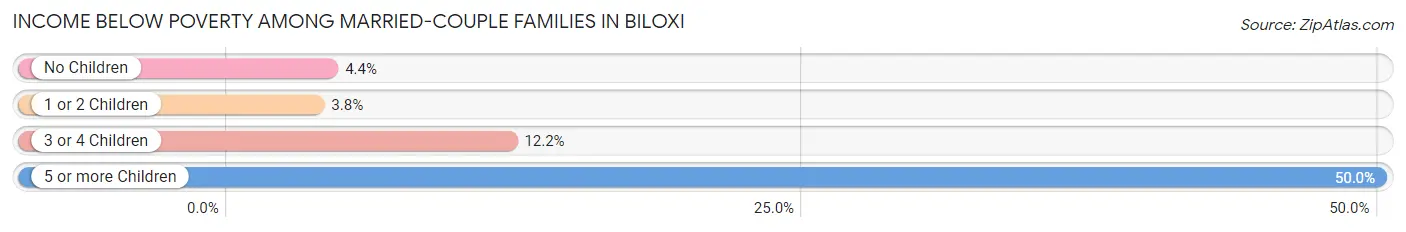
| Children | Above Poverty | Below Poverty |
| No Children | 4,739 (95.6%) | 216 (4.4%) |
| 1 or 2 Children | 2,914 (96.2%) | 114 (3.8%) |
| 3 or 4 Children | 614 (87.8%) | 85 (12.2%) |
| 5 or more Children | 7 (50.0%) | 7 (50.0%) |
| Total | 8,274 (95.2%) | 422 (4.9%) |
Income Below Poverty Among Single-Parent Households in Biloxi
According to the poverty data in Biloxi, 13.1% or 86 single-father households and 30.8% or 849 single-mother households are living below the poverty line. Among single-father households, those with 1 or 2 children have the highest poverty rate, with 69 households (26.5%) experiencing poverty. Likewise, among single-mother households, those with 1 or 2 children have the highest poverty rate, with 691 households (37.4%) falling below the poverty line.
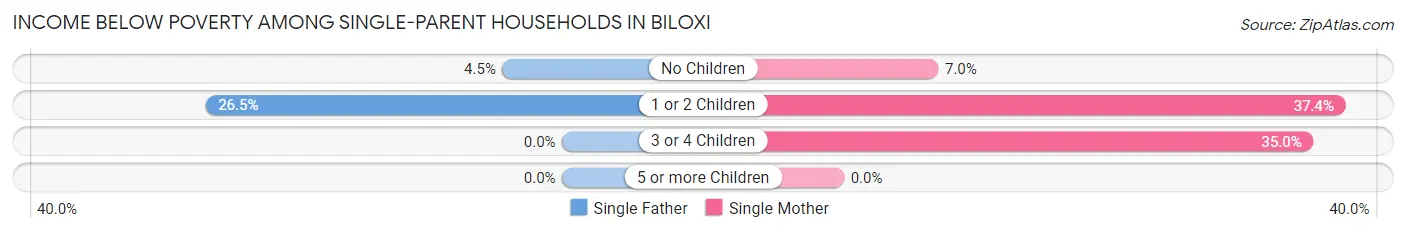
| Children | Single Father | Single Mother |
| No Children | 17 (4.4%) | 40 (7.0%) |
| 1 or 2 Children | 69 (26.5%) | 691 (37.4%) |
| 3 or 4 Children | 0 (0.0%) | 118 (35.0%) |
| 5 or more Children | 0 (0.0%) | 0 (0.0%) |
| Total | 86 (13.1%) | 849 (30.8%) |
Income Below Poverty Among Married-Couple vs Single-Parent Households in Biloxi
The poverty data for Biloxi shows that 422 of the married-couple family households (4.9%) and 935 of the single-parent households (27.4%) are living below the poverty level. Within the married-couple family households, those with 5 or more children have the highest poverty rate, with 7 households (50.0%) falling below the poverty line. Among the single-parent households, those with 1 or 2 children have the highest poverty rate, with 760 household (36.1%) living below poverty.
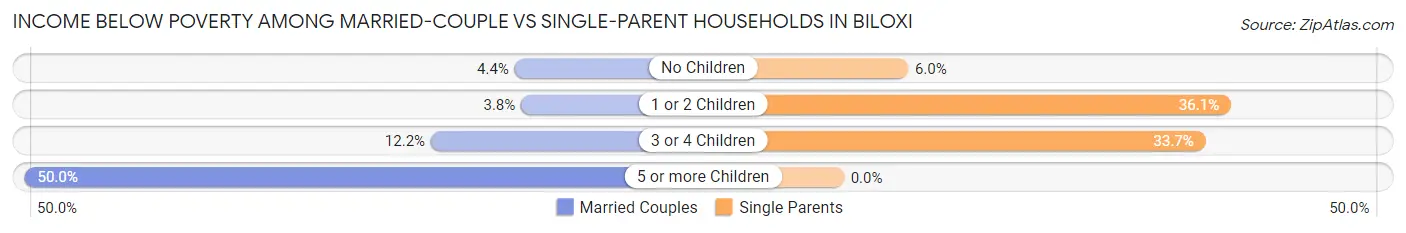
| Children | Married-Couple Families | Single-Parent Households |
| No Children | 216 (4.4%) | 57 (6.0%) |
| 1 or 2 Children | 114 (3.8%) | 760 (36.1%) |
| 3 or 4 Children | 85 (12.2%) | 118 (33.7%) |
| 5 or more Children | 7 (50.0%) | 0 (0.0%) |
| Total | 422 (4.9%) | 935 (27.4%) |
Race in Biloxi
The most populous races in Biloxi are White / Caucasian (31,960 | 65.0%), Black / African American (10,164 | 20.7%), and Hispanic or Latino (4,405 | 9.0%).
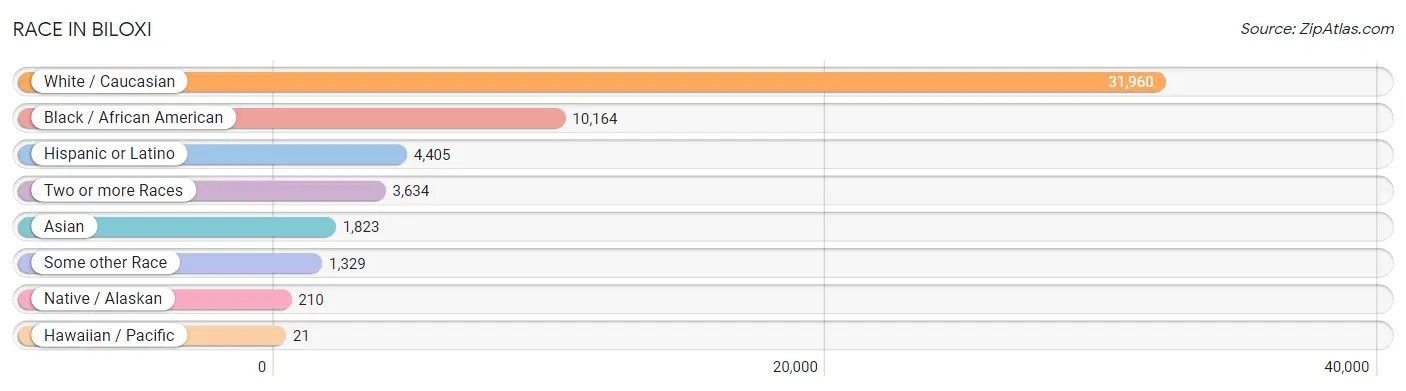
| Race | # Population | % Population |
| Asian | 1,823 | 3.7% |
| Black / African American | 10,164 | 20.7% |
| Hawaiian / Pacific | 21 | 0.0% |
| Hispanic or Latino | 4,405 | 9.0% |
| Native / Alaskan | 210 | 0.4% |
| White / Caucasian | 31,960 | 65.0% |
| Two or more Races | 3,634 | 7.4% |
| Some other Race | 1,329 | 2.7% |
| Total | 49,141 | 100.0% |
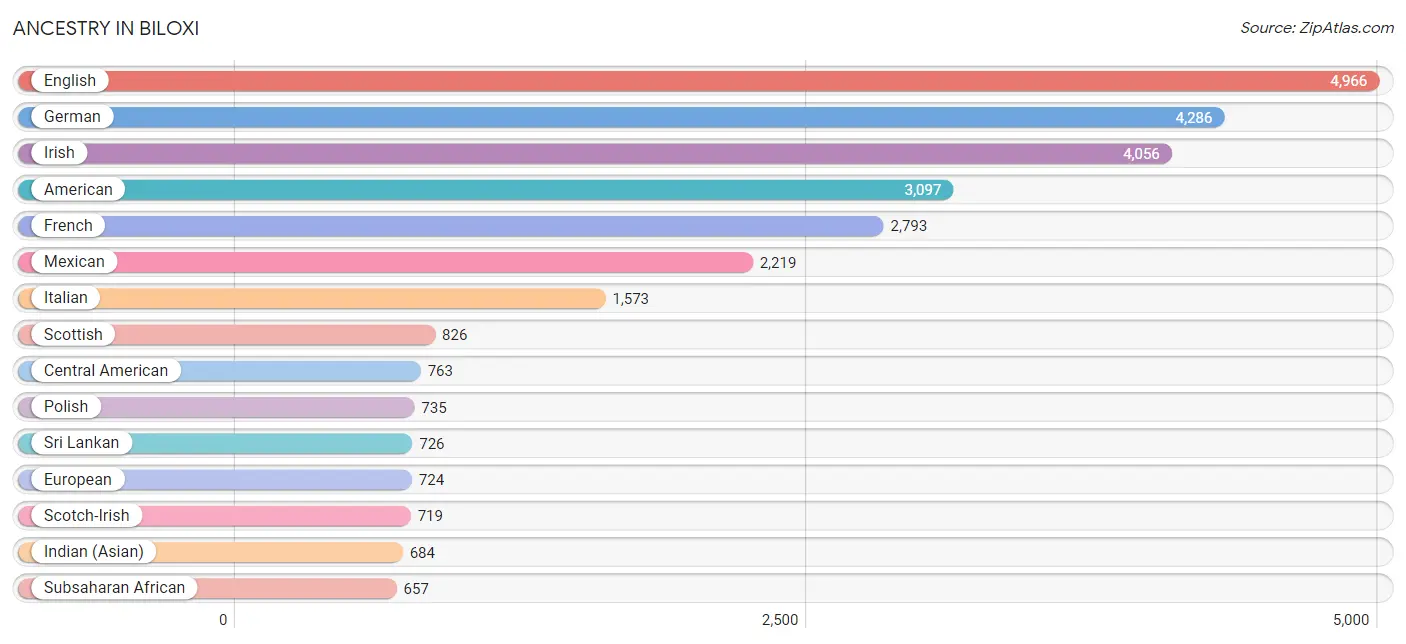
Ancestry in Biloxi
The most populous ancestries reported in Biloxi are English (4,966 | 10.1%), German (4,286 | 8.7%), Irish (4,056 | 8.3%), American (3,097 | 6.3%), and French (2,793 | 5.7%), together accounting for 39.1% of all Biloxi residents.
| Ancestry | # Population | % Population |
| African | 404 | 0.8% |
| American | 3,097 | 6.3% |
| Arab | 269 | 0.5% |
| Armenian | 15 | 0.0% |
| Australian | 100 | 0.2% |
| Austrian | 39 | 0.1% |
| Bangladeshi | 12 | 0.0% |
| Barbadian | 35 | 0.1% |
| Basque | 7 | 0.0% |
| Belgian | 14 | 0.0% |
| Belizean | 4 | 0.0% |
| Bhutanese | 168 | 0.3% |
| Blackfeet | 1 | 0.0% |
| Brazilian | 1 | 0.0% |
| British | 292 | 0.6% |
| Burmese | 287 | 0.6% |
| Cajun | 71 | 0.1% |
| Canadian | 7 | 0.0% |
| Central American | 763 | 1.5% |
| Central American Indian | 12 | 0.0% |
| Cherokee | 197 | 0.4% |
| Chickasaw | 8 | 0.0% |
| Chinese | 82 | 0.2% |
| Chippewa | 6 | 0.0% |
| Choctaw | 81 | 0.2% |
| Colombian | 137 | 0.3% |
| Costa Rican | 13 | 0.0% |
| Creek | 7 | 0.0% |
| Croatian | 358 | 0.7% |
| Cuban | 81 | 0.2% |
| Czech | 68 | 0.1% |
| Czechoslovakian | 51 | 0.1% |
| Danish | 71 | 0.1% |
| Dominican | 117 | 0.2% |
| Dutch | 373 | 0.8% |
| Eastern European | 52 | 0.1% |
| English | 4,966 | 10.1% |
| European | 724 | 1.5% |
| Filipino | 5 | 0.0% |
| Finnish | 15 | 0.0% |
| French | 2,793 | 5.7% |
| French American Indian | 1 | 0.0% |
| French Canadian | 407 | 0.8% |
| German | 4,286 | 8.7% |
| Greek | 191 | 0.4% |
| Guamanian / Chamorro | 10 | 0.0% |
| Guatemalan | 142 | 0.3% |
| Guyanese | 5 | 0.0% |
| Haitian | 56 | 0.1% |
| Honduran | 472 | 1.0% |
| Hungarian | 37 | 0.1% |
| Indian (Asian) | 684 | 1.4% |
| Irish | 4,056 | 8.3% |
| Italian | 1,573 | 3.2% |
| Jamaican | 385 | 0.8% |
| Korean | 614 | 1.3% |
| Lebanese | 125 | 0.3% |
| Lithuanian | 21 | 0.0% |
| Malaysian | 12 | 0.0% |
| Mexican | 2,219 | 4.5% |
| Mexican American Indian | 10 | 0.0% |
| Native Hawaiian | 89 | 0.2% |
| Nicaraguan | 10 | 0.0% |
| Nigerian | 177 | 0.4% |
| Norwegian | 265 | 0.5% |
| Pakistani | 154 | 0.3% |
| Palestinian | 5 | 0.0% |
| Panamanian | 61 | 0.1% |
| Peruvian | 135 | 0.3% |
| Polish | 735 | 1.5% |
| Portuguese | 115 | 0.2% |
| Puerto Rican | 363 | 0.7% |
| Russian | 62 | 0.1% |
| Salvadoran | 65 | 0.1% |
| Scandinavian | 57 | 0.1% |
| Scotch-Irish | 719 | 1.5% |
| Scottish | 826 | 1.7% |
| Serbian | 6 | 0.0% |
| Sioux | 14 | 0.0% |
| Slavic | 31 | 0.1% |
| Slovak | 59 | 0.1% |
| Slovene | 12 | 0.0% |
| South African | 60 | 0.1% |
| South American | 280 | 0.6% |
| Spaniard | 46 | 0.1% |
| Spanish | 338 | 0.7% |
| Spanish American | 16 | 0.0% |
| Sri Lankan | 726 | 1.5% |
| Subsaharan African | 657 | 1.3% |
| Swedish | 299 | 0.6% |
| Swiss | 5 | 0.0% |
| Thai | 78 | 0.2% |
| Trinidadian and Tobagonian | 18 | 0.0% |
| Ukrainian | 21 | 0.0% |
| Venezuelan | 8 | 0.0% |
| Welsh | 304 | 0.6% |
| West Indian | 68 | 0.1% |
| Yugoslavian | 29 | 0.1% |
| Zimbabwean | 5 | 0.0% | View All 99 Rows |
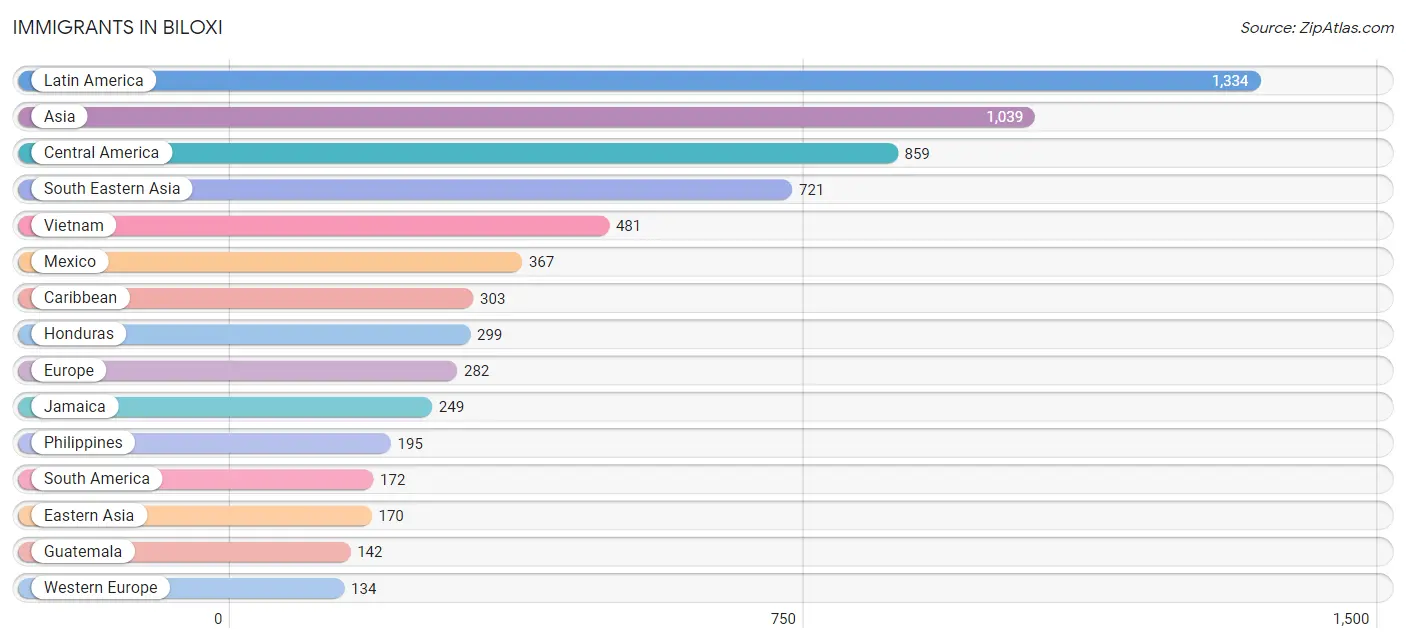
Immigrants in Biloxi
The most numerous immigrant groups reported in Biloxi came from Latin America (1,334 | 2.7%), Asia (1,039 | 2.1%), Central America (859 | 1.8%), South Eastern Asia (721 | 1.5%), and Vietnam (481 | 1.0%), together accounting for 9.0% of all Biloxi residents.
| Immigration Origin | # Population | % Population |
| Africa | 115 | 0.2% |
| Asia | 1,039 | 2.1% |
| Austria | 5 | 0.0% |
| Brazil | 1 | 0.0% |
| Canada | 24 | 0.1% |
| Caribbean | 303 | 0.6% |
| Central America | 859 | 1.8% |
| China | 70 | 0.1% |
| Colombia | 35 | 0.1% |
| Costa Rica | 13 | 0.0% |
| Cuba | 8 | 0.0% |
| Dominican Republic | 26 | 0.1% |
| Eastern Africa | 73 | 0.2% |
| Eastern Asia | 170 | 0.4% |
| Eastern Europe | 17 | 0.0% |
| El Salvador | 13 | 0.0% |
| England | 69 | 0.1% |
| Ethiopia | 64 | 0.1% |
| Europe | 282 | 0.6% |
| Germany | 113 | 0.2% |
| Ghana | 4 | 0.0% |
| Guatemala | 142 | 0.3% |
| Guyana | 7 | 0.0% |
| Haiti | 20 | 0.0% |
| Honduras | 299 | 0.6% |
| Hong Kong | 5 | 0.0% |
| India | 19 | 0.0% |
| Jamaica | 249 | 0.5% |
| Japan | 11 | 0.0% |
| Korea | 89 | 0.2% |
| Latin America | 1,334 | 2.7% |
| Liberia | 11 | 0.0% |
| Mexico | 367 | 0.7% |
| Morocco | 6 | 0.0% |
| Netherlands | 16 | 0.0% |
| Northern Africa | 6 | 0.0% |
| Northern Europe | 107 | 0.2% |
| Pakistan | 8 | 0.0% |
| Panama | 25 | 0.1% |
| Peru | 118 | 0.2% |
| Philippines | 195 | 0.4% |
| Poland | 5 | 0.0% |
| Portugal | 8 | 0.0% |
| Saudi Arabia | 121 | 0.3% |
| Scotland | 27 | 0.1% |
| South Africa | 21 | 0.0% |
| South America | 172 | 0.4% |
| South Central Asia | 27 | 0.1% |
| South Eastern Asia | 721 | 1.5% |
| Southern Europe | 16 | 0.0% |
| Spain | 8 | 0.0% |
| Taiwan | 5 | 0.0% |
| Thailand | 37 | 0.1% |
| Ukraine | 12 | 0.0% |
| Vietnam | 481 | 1.0% |
| Western Africa | 15 | 0.0% |
| Western Asia | 121 | 0.3% |
| Western Europe | 134 | 0.3% |
| Zimbabwe | 8 | 0.0% | View All 59 Rows |
Sex and Age in Biloxi
Sex and Age in Biloxi
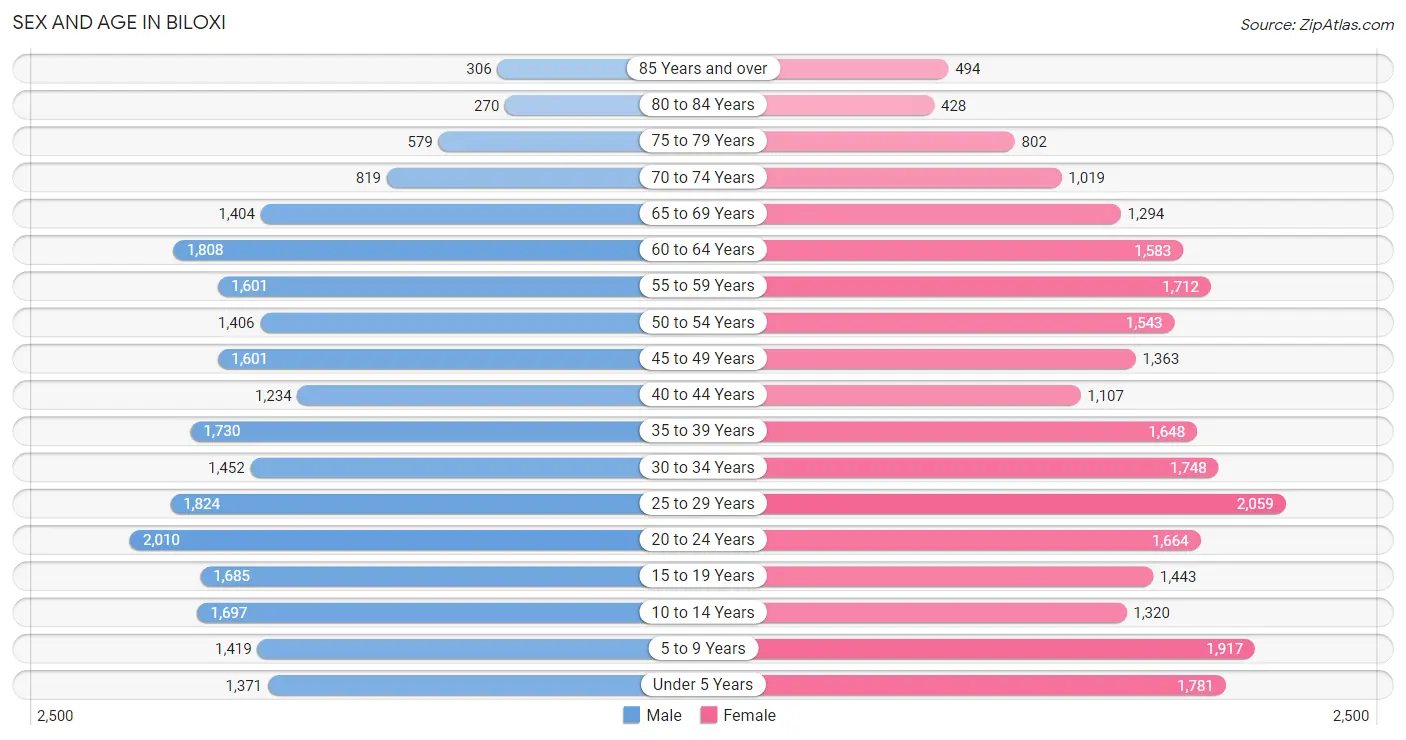
The most populous age groups in Biloxi are 20 to 24 Years (2,010 | 8.3%) for men and 25 to 29 Years (2,059 | 8.3%) for women.
| Age Bracket | Male | Female |
| Under 5 Years | 1,371 (5.7%) | 1,781 (7.1%) |
| 5 to 9 Years | 1,419 (5.9%) | 1,917 (7.7%) |
| 10 to 14 Years | 1,697 (7.0%) | 1,320 (5.3%) |
| 15 to 19 Years | 1,685 (7.0%) | 1,443 (5.8%) |
| 20 to 24 Years | 2,010 (8.3%) | 1,664 (6.7%) |
| 25 to 29 Years | 1,824 (7.5%) | 2,059 (8.3%) |
| 30 to 34 Years | 1,452 (6.0%) | 1,748 (7.0%) |
| 35 to 39 Years | 1,730 (7.1%) | 1,648 (6.6%) |
| 40 to 44 Years | 1,234 (5.1%) | 1,107 (4.4%) |
| 45 to 49 Years | 1,601 (6.6%) | 1,363 (5.5%) |
| 50 to 54 Years | 1,406 (5.8%) | 1,543 (6.2%) |
| 55 to 59 Years | 1,601 (6.6%) | 1,712 (6.9%) |
| 60 to 64 Years | 1,808 (7.5%) | 1,583 (6.4%) |
| 65 to 69 Years | 1,404 (5.8%) | 1,294 (5.2%) |
| 70 to 74 Years | 819 (3.4%) | 1,019 (4.1%) |
| 75 to 79 Years | 579 (2.4%) | 802 (3.2%) |
| 80 to 84 Years | 270 (1.1%) | 428 (1.7%) |
| 85 Years and over | 306 (1.3%) | 494 (2.0%) |
| Total | 24,216 (100.0%) | 24,925 (100.0%) |
Families and Households in Biloxi
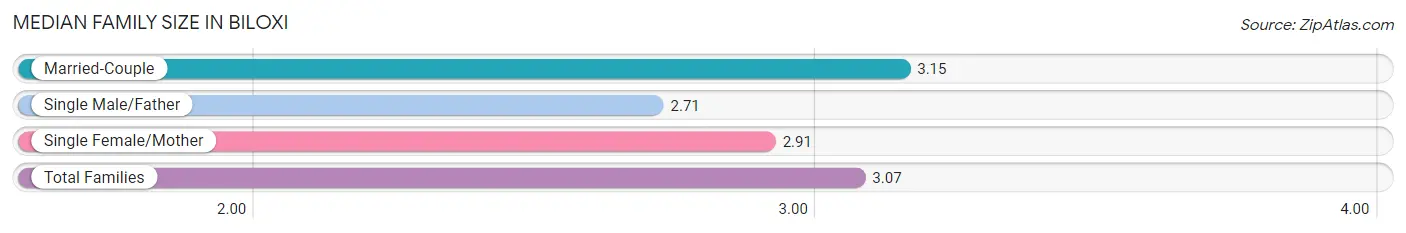
Median Family Size in Biloxi
The median family size in Biloxi is 3.07 persons per family, with married-couple families (8,696 | 71.8%) accounting for the largest median family size of 3.15 persons per family. On the other hand, single male/father families (655 | 5.4%) represent the smallest median family size with 2.71 persons per family.
| Family Type | # Families | Family Size |
| Married-Couple | 8,696 (71.8%) | 3.15 |
| Single Male/Father | 655 (5.4%) | 2.71 |
| Single Female/Mother | 2,753 (22.7%) | 2.91 |
| Total Families | 12,104 (100.0%) | 3.07 |
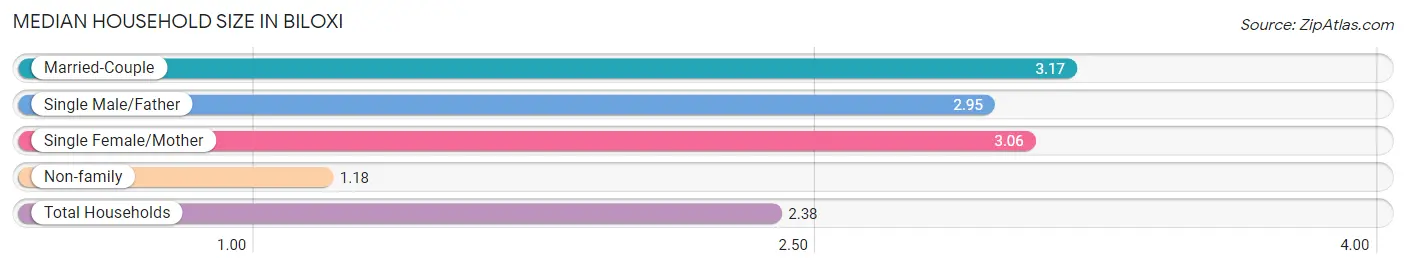
Median Household Size in Biloxi
The median household size in Biloxi is 2.38 persons per household, with married-couple households (8,696 | 44.2%) accounting for the largest median household size of 3.17 persons per household. non-family households (7,562 | 38.5%) represent the smallest median household size with 1.18 persons per household.
| Household Type | # Households | Household Size |
| Married-Couple | 8,696 (44.2%) | 3.17 |
| Single Male/Father | 655 (3.3%) | 2.95 |
| Single Female/Mother | 2,753 (14.0%) | 3.06 |
| Non-family | 7,562 (38.5%) | 1.18 |
| Total Households | 19,666 (100.0%) | 2.38 |
Household Size by Marriage Status in Biloxi
Out of a total of 19,666 households in Biloxi, 12,104 (61.6%) are family households, while 7,562 (38.5%) are nonfamily households. The most numerous type of family households are 2-person households, comprising 5,636, and the most common type of nonfamily households are 1-person households, comprising 6,469.
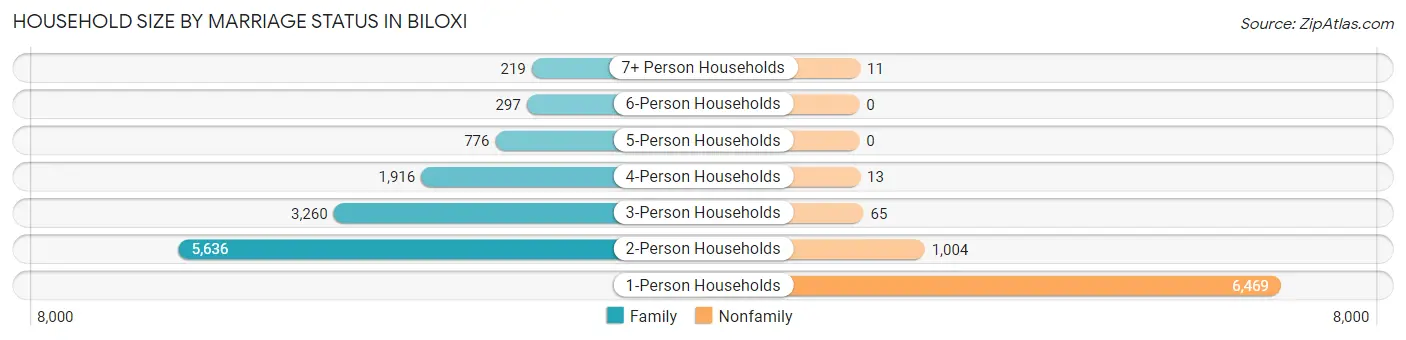
| Household Size | Family Households | Nonfamily Households |
| 1-Person Households | - | 6,469 (32.9%) |
| 2-Person Households | 5,636 (28.7%) | 1,004 (5.1%) |
| 3-Person Households | 3,260 (16.6%) | 65 (0.3%) |
| 4-Person Households | 1,916 (9.7%) | 13 (0.1%) |
| 5-Person Households | 776 (4.0%) | 0 (0.0%) |
| 6-Person Households | 297 (1.5%) | 0 (0.0%) |
| 7+ Person Households | 219 (1.1%) | 11 (0.1%) |
| Total | 12,104 (61.6%) | 7,562 (38.5%) |
Female Fertility in Biloxi
Fertility by Age in Biloxi
Average fertility rate in Biloxi is 66.0 births per 1,000 women. Women in the age bracket of 20 to 34 years have the highest fertility rate with 109.0 births per 1,000 women. Women in the age bracket of 20 to 34 years acount for 80.7% of all women with births.
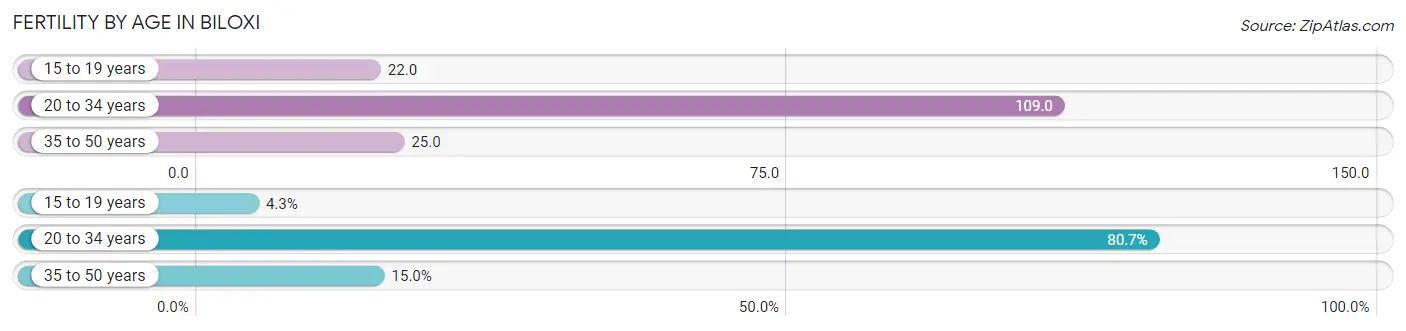
| Age Bracket | Women with Births | Births / 1,000 Women |
| 15 to 19 years | 32 (4.3%) | 22.0 |
| 20 to 34 years | 598 (80.7%) | 109.0 |
| 35 to 50 years | 111 (15.0%) | 25.0 |
| Total | 741 (100.0%) | 66.0 |
Fertility by Age by Marriage Status in Biloxi
69.4% of women with births (741) in Biloxi are married. The highest percentage of unmarried women with births falls into 15 to 19 years age bracket with 100.0% of them unmarried at the time of birth, while the lowest percentage of unmarried women with births belong to 20 to 34 years age bracket with 22.2% of them unmarried.
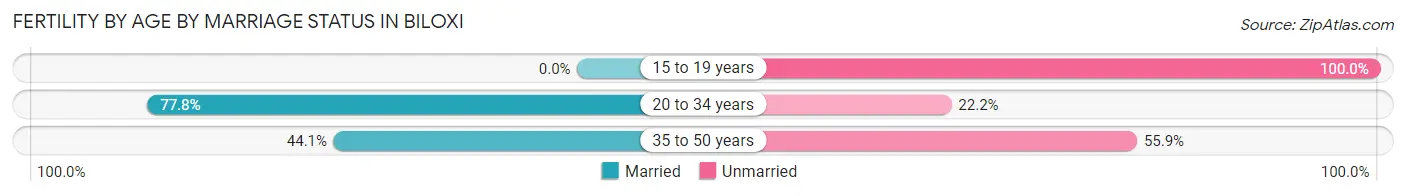
| Age Bracket | Married | Unmarried |
| 15 to 19 years | 0 (0.0%) | 32 (100.0%) |
| 20 to 34 years | 465 (77.8%) | 133 (22.2%) |
| 35 to 50 years | 49 (44.1%) | 62 (55.9%) |
| Total | 514 (69.4%) | 227 (30.6%) |
Fertility by Education in Biloxi
Average fertility rate in Biloxi is 66.0 births per 1,000 women. Women with the education attainment of graduate degree have the highest fertility rate of 201.0 births per 1,000 women, while women with the education attainment of college or associate's degree have the lowest fertility at 23.0 births per 1,000 women. Women with the education attainment of graduate degree represent 37.2% of all women with births.
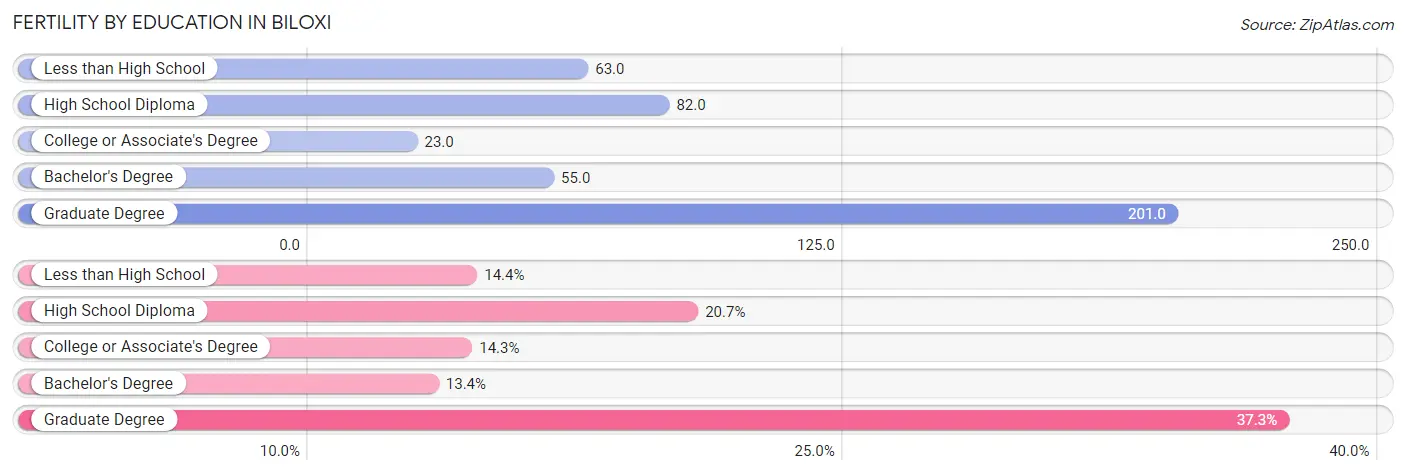
| Educational Attainment | Women with Births | Births / 1,000 Women |
| Less than High School | 107 (14.4%) | 63.0 |
| High School Diploma | 153 (20.6%) | 82.0 |
| College or Associate's Degree | 106 (14.3%) | 23.0 |
| Bachelor's Degree | 99 (13.4%) | 55.0 |
| Graduate Degree | 276 (37.2%) | 201.0 |
| Total | 741 (100.0%) | 66.0 |
Fertility by Education by Marriage Status in Biloxi
30.6% of women with births in Biloxi are unmarried. Women with the educational attainment of bachelor's degree are most likely to be married with 100.0% of them married at childbirth, while women with the educational attainment of high school diploma are least likely to be married with 96.7% of them unmarried at childbirth.
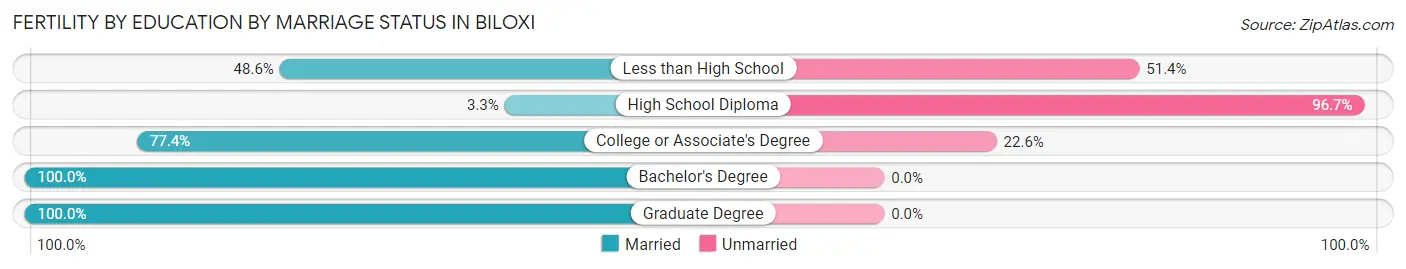
| Educational Attainment | Married | Unmarried |
| Less than High School | 52 (48.6%) | 55 (51.4%) |
| High School Diploma | 5 (3.3%) | 148 (96.7%) |
| College or Associate's Degree | 82 (77.4%) | 24 (22.6%) |
| Bachelor's Degree | 99 (100.0%) | 0 (0.0%) |
| Graduate Degree | 276 (100.0%) | 0 (0.0%) |
| Total | 514 (69.4%) | 227 (30.6%) |
Employment Characteristics in Biloxi
Employment by Class of Employer in Biloxi
Among the 23,486 employed individuals in Biloxi, private company employees (12,366 | 52.6%), federal government employees (5,262 | 22.4%), and local government employees (1,491 | 6.4%) make up the most common classes of employment.
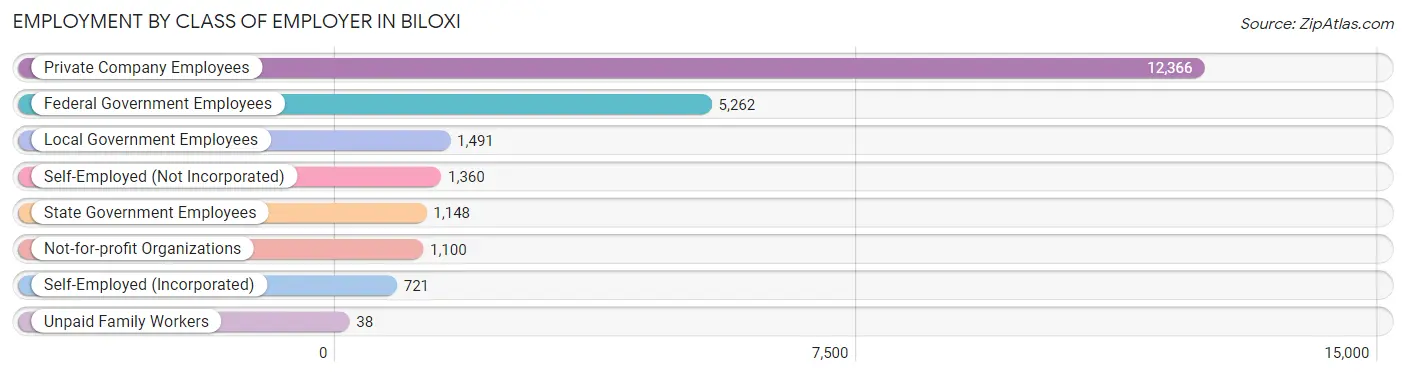
| Employer Class | # Employees | % Employees |
| Private Company Employees | 12,366 | 52.6% |
| Self-Employed (Incorporated) | 721 | 3.1% |
| Self-Employed (Not Incorporated) | 1,360 | 5.8% |
| Not-for-profit Organizations | 1,100 | 4.7% |
| Local Government Employees | 1,491 | 6.4% |
| State Government Employees | 1,148 | 4.9% |
| Federal Government Employees | 5,262 | 22.4% |
| Unpaid Family Workers | 38 | 0.2% |
| Total | 23,486 | 100.0% |
Employment Status by Age in Biloxi
According to the labor force statistics for Biloxi, out of the total population over 16 years of age (39,006), 66.5% or 25,939 individuals are in the labor force, with 8.1% or 2,101 of them unemployed. The age group with the highest labor force participation rate is 25 to 29 years, with 90.1% or 3,499 individuals in the labor force. Within the labor force, the 16 to 19 years age range has the highest percentage of unemployed individuals, with 30.2% or 430 of them being unemployed.
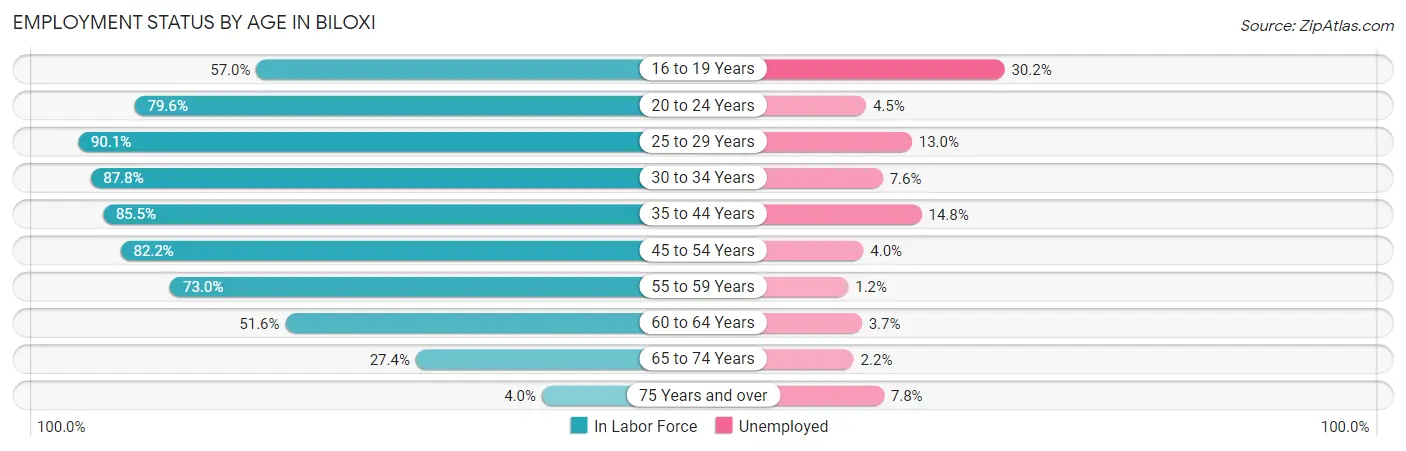
| Age Bracket | In Labor Force | Unemployed |
| 16 to 19 Years | 1,424 (57.0%) | 430 (30.2%) |
| 20 to 24 Years | 2,925 (79.6%) | 132 (4.5%) |
| 25 to 29 Years | 3,499 (90.1%) | 455 (13.0%) |
| 30 to 34 Years | 2,810 (87.8%) | 214 (7.6%) |
| 35 to 44 Years | 4,890 (85.5%) | 724 (14.8%) |
| 45 to 54 Years | 4,860 (82.2%) | 194 (4.0%) |
| 55 to 59 Years | 2,418 (73.0%) | 29 (1.2%) |
| 60 to 64 Years | 1,750 (51.6%) | 65 (3.7%) |
| 65 to 74 Years | 1,243 (27.4%) | 27 (2.2%) |
| 75 Years and over | 115 (4.0%) | 9 (7.8%) |
| Total | 25,939 (66.5%) | 2,101 (8.1%) |
Employment Status by Educational Attainment in Biloxi
According to labor force statistics for Biloxi, 79.6% of individuals (20,234) out of the total population between 25 and 64 years of age (25,419) are in the labor force, with 7.9% or 1,598 of them being unemployed. The group with the highest labor force participation rate are those with the educational attainment of bachelor's degree or higher, with 86.1% or 6,703 individuals in the labor force. Within the labor force, individuals with less than high school education have the highest percentage of unemployment, with 24.1% or 388 of them being unemployed.
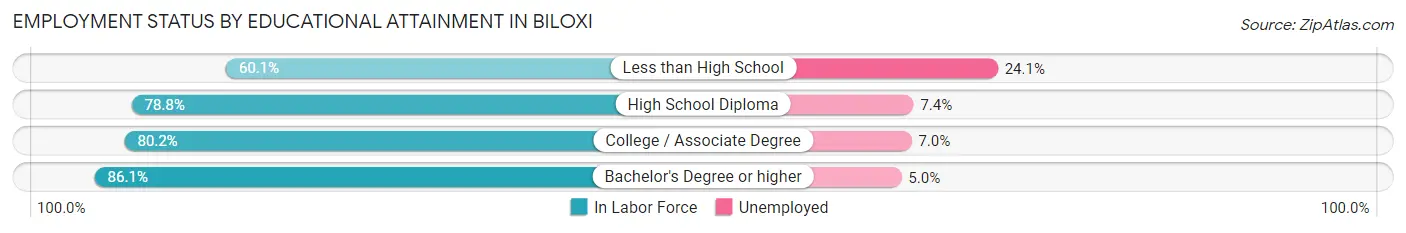
| Educational Attainment | In Labor Force | Unemployed |
| Less than High School | 1,611 (60.1%) | 646 (24.1%) |
| High School Diploma | 4,553 (78.8%) | 428 (7.4%) |
| College / Associate Degree | 7,358 (80.2%) | 642 (7.0%) |
| Bachelor's Degree or higher | 6,703 (86.1%) | 389 (5.0%) |
| Total | 20,234 (79.6%) | 2,008 (7.9%) |
Employment Occupations by Sex in Biloxi
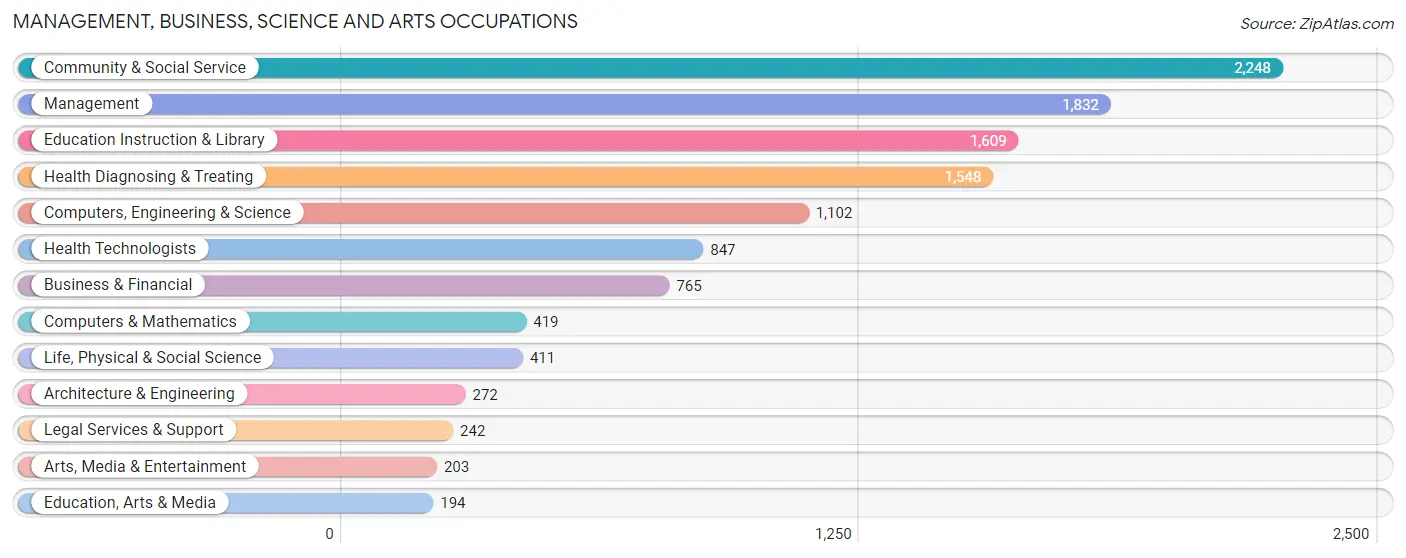
Management, Business, Science and Arts Occupations
The most common Management, Business, Science and Arts occupations in Biloxi are Community & Social Service (2,248 | 10.8%), Management (1,832 | 8.8%), Education Instruction & Library (1,609 | 7.7%), Health Diagnosing & Treating (1,548 | 7.4%), and Computers, Engineering & Science (1,102 | 5.3%).
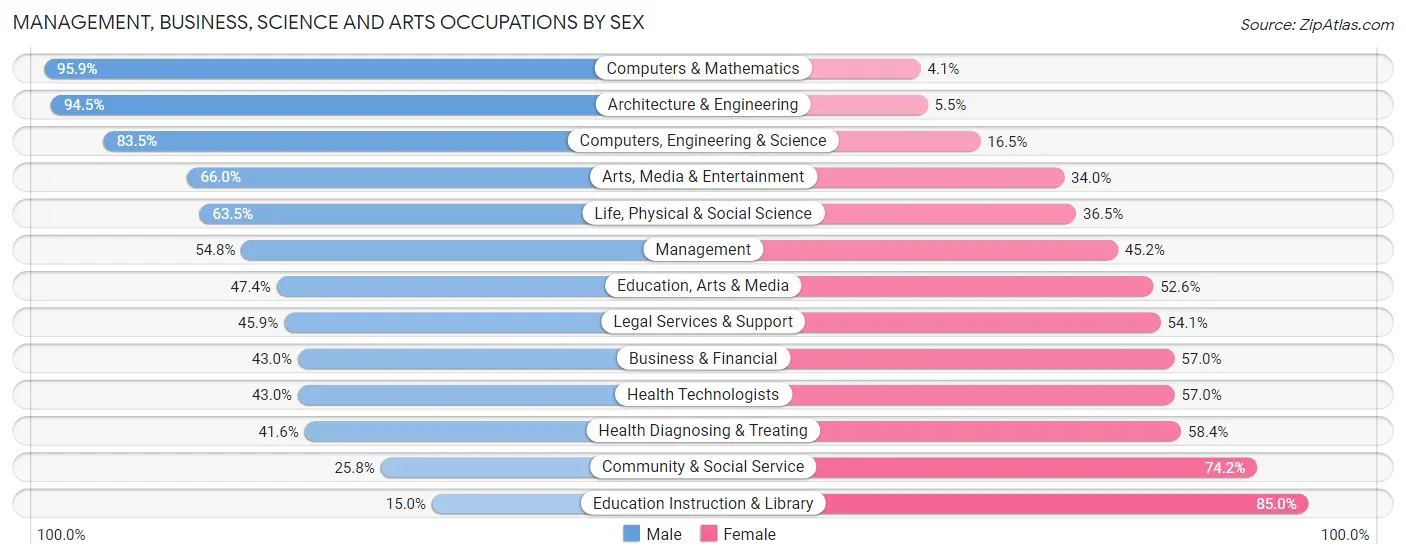
Management, Business, Science and Arts Occupations by Sex
Within the Management, Business, Science and Arts occupations in Biloxi, the most male-oriented occupations are Computers & Mathematics (95.9%), Architecture & Engineering (94.5%), and Computers, Engineering & Science (83.5%), while the most female-oriented occupations are Education Instruction & Library (85.0%), Community & Social Service (74.2%), and Health Diagnosing & Treating (58.4%).
| Occupation | Male | Female |
| Management | 1,004 (54.8%) | 828 (45.2%) |
| Business & Financial | 329 (43.0%) | 436 (57.0%) |
| Computers, Engineering & Science | 920 (83.5%) | 182 (16.5%) |
| Computers & Mathematics | 402 (95.9%) | 17 (4.1%) |
| Architecture & Engineering | 257 (94.5%) | 15 (5.5%) |
| Life, Physical & Social Science | 261 (63.5%) | 150 (36.5%) |
| Community & Social Service | 579 (25.8%) | 1,669 (74.2%) |
| Education, Arts & Media | 92 (47.4%) | 102 (52.6%) |
| Legal Services & Support | 111 (45.9%) | 131 (54.1%) |
| Education Instruction & Library | 242 (15.0%) | 1,367 (85.0%) |
| Arts, Media & Entertainment | 134 (66.0%) | 69 (34.0%) |
| Health Diagnosing & Treating | 644 (41.6%) | 904 (58.4%) |
| Health Technologists | 364 (43.0%) | 483 (57.0%) |
| Total (Category) | 3,476 (46.4%) | 4,019 (53.6%) |
| Total (Overall) | 10,642 (51.1%) | 10,190 (48.9%) |
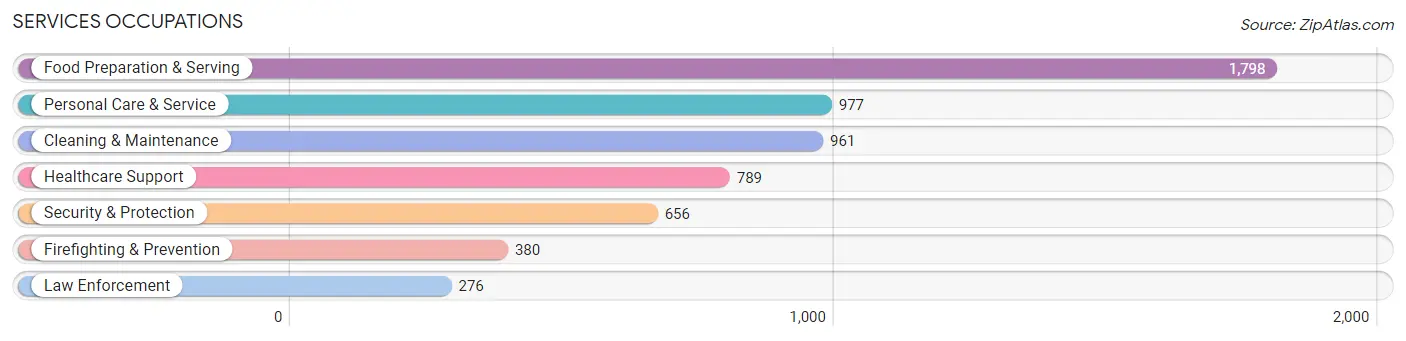
Services Occupations
The most common Services occupations in Biloxi are Food Preparation & Serving (1,798 | 8.6%), Personal Care & Service (977 | 4.7%), Cleaning & Maintenance (961 | 4.6%), Healthcare Support (789 | 3.8%), and Security & Protection (656 | 3.2%).
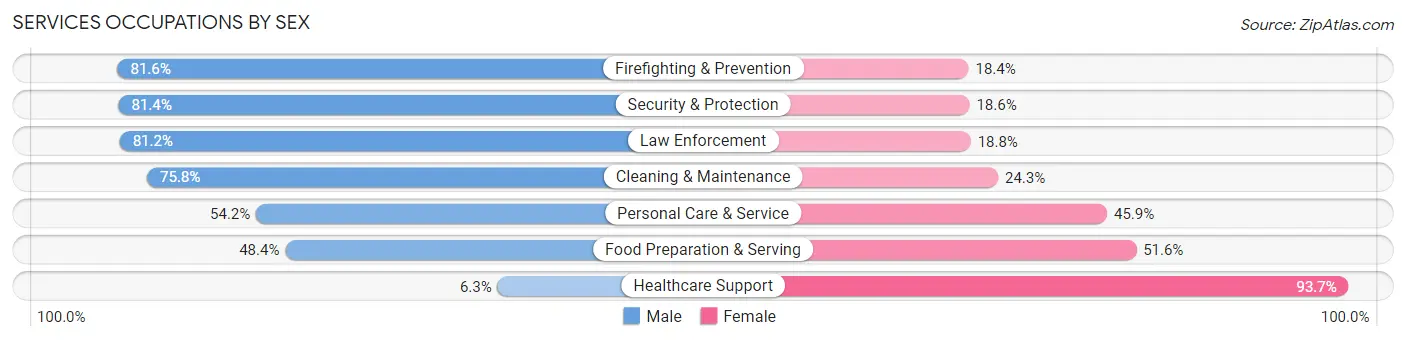
Services Occupations by Sex
Within the Services occupations in Biloxi, the most male-oriented occupations are Firefighting & Prevention (81.6%), Security & Protection (81.4%), and Law Enforcement (81.2%), while the most female-oriented occupations are Healthcare Support (93.7%), Food Preparation & Serving (51.6%), and Personal Care & Service (45.9%).
| Occupation | Male | Female |
| Healthcare Support | 50 (6.3%) | 739 (93.7%) |
| Security & Protection | 534 (81.4%) | 122 (18.6%) |
| Firefighting & Prevention | 310 (81.6%) | 70 (18.4%) |
| Law Enforcement | 224 (81.2%) | 52 (18.8%) |
| Food Preparation & Serving | 870 (48.4%) | 928 (51.6%) |
| Cleaning & Maintenance | 728 (75.7%) | 233 (24.2%) |
| Personal Care & Service | 529 (54.1%) | 448 (45.9%) |
| Total (Category) | 2,711 (52.3%) | 2,470 (47.7%) |
| Total (Overall) | 10,642 (51.1%) | 10,190 (48.9%) |
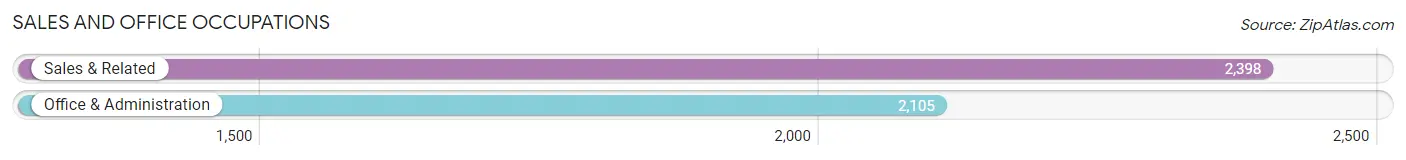
Sales and Office Occupations
The most common Sales and Office occupations in Biloxi are Sales & Related (2,398 | 11.5%), and Office & Administration (2,105 | 10.1%).
Sales and Office Occupations by Sex
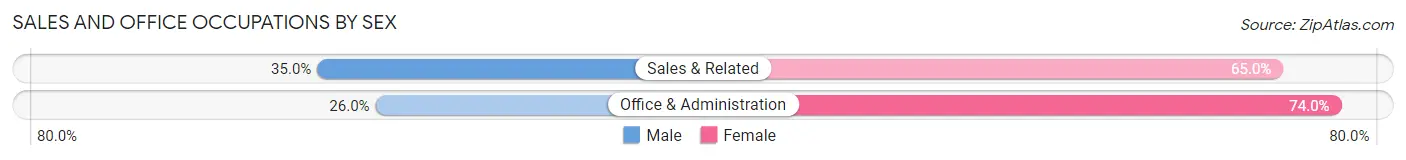
| Occupation | Male | Female |
| Sales & Related | 839 (35.0%) | 1,559 (65.0%) |
| Office & Administration | 548 (26.0%) | 1,557 (74.0%) |
| Total (Category) | 1,387 (30.8%) | 3,116 (69.2%) |
| Total (Overall) | 10,642 (51.1%) | 10,190 (48.9%) |
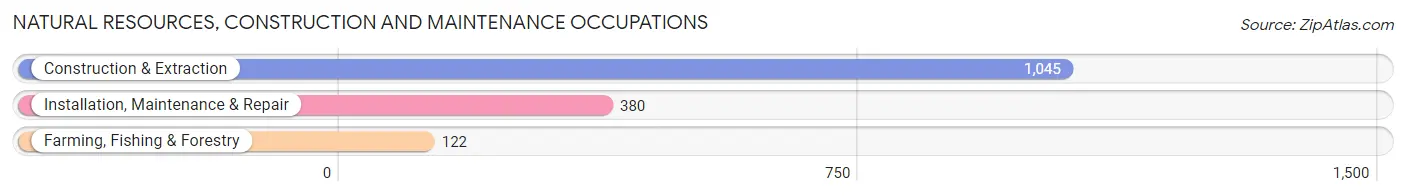
Natural Resources, Construction and Maintenance Occupations
The most common Natural Resources, Construction and Maintenance occupations in Biloxi are Construction & Extraction (1,045 | 5.0%), Installation, Maintenance & Repair (380 | 1.8%), and Farming, Fishing & Forestry (122 | 0.6%).
Natural Resources, Construction and Maintenance Occupations by Sex
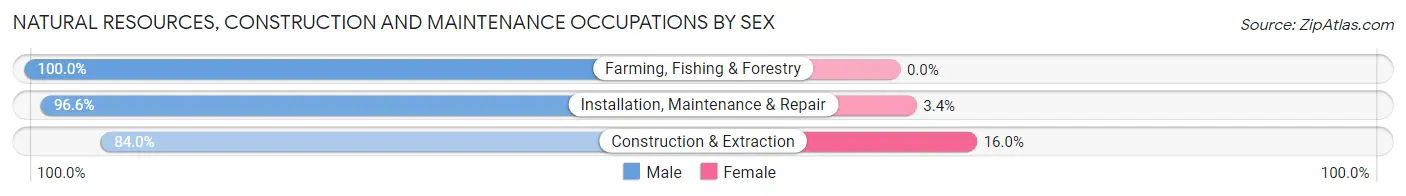
| Occupation | Male | Female |
| Farming, Fishing & Forestry | 122 (100.0%) | 0 (0.0%) |
| Construction & Extraction | 878 (84.0%) | 167 (16.0%) |
| Installation, Maintenance & Repair | 367 (96.6%) | 13 (3.4%) |
| Total (Category) | 1,367 (88.4%) | 180 (11.6%) |
| Total (Overall) | 10,642 (51.1%) | 10,190 (48.9%) |
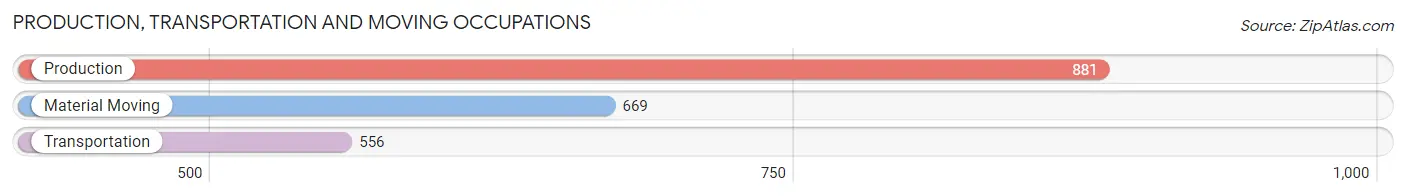
Production, Transportation and Moving Occupations
The most common Production, Transportation and Moving occupations in Biloxi are Production (881 | 4.2%), Material Moving (669 | 3.2%), and Transportation (556 | 2.7%).
Production, Transportation and Moving Occupations by Sex
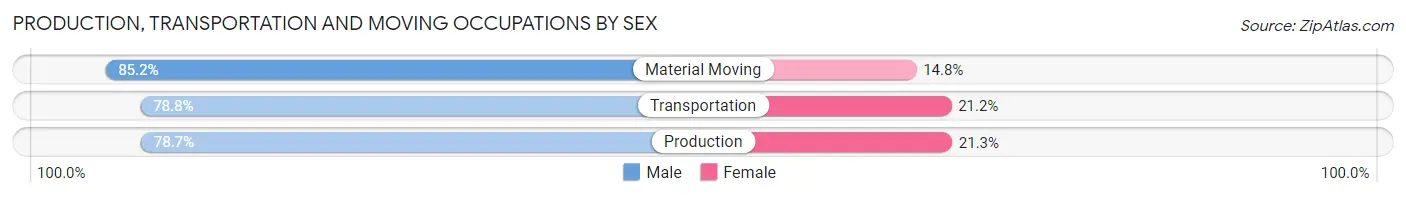
| Occupation | Male | Female |
| Production | 693 (78.7%) | 188 (21.3%) |
| Transportation | 438 (78.8%) | 118 (21.2%) |
| Material Moving | 570 (85.2%) | 99 (14.8%) |
| Total (Category) | 1,701 (80.8%) | 405 (19.2%) |
| Total (Overall) | 10,642 (51.1%) | 10,190 (48.9%) |
Employment Industries by Sex in Biloxi
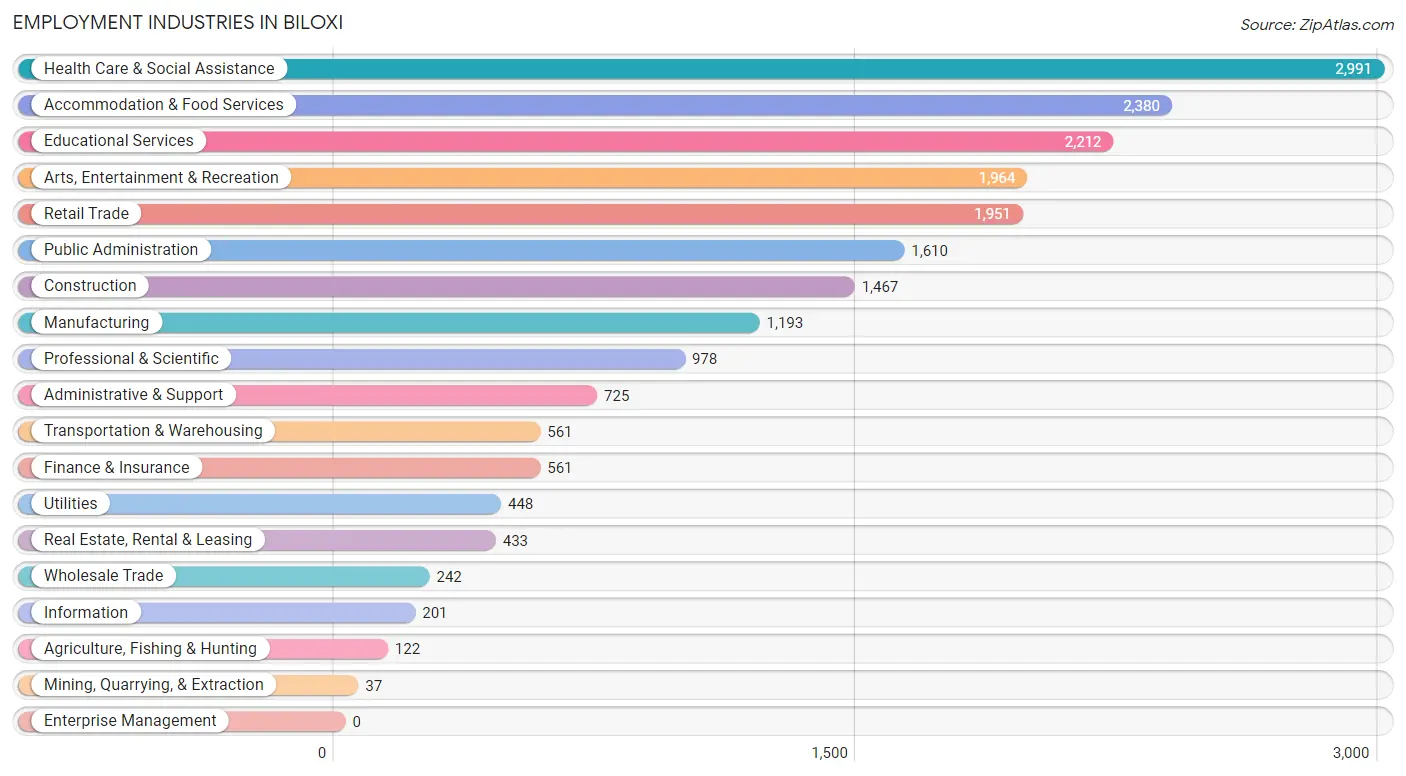
Employment Industries in Biloxi
The major employment industries in Biloxi include Health Care & Social Assistance (2,991 | 14.4%), Accommodation & Food Services (2,380 | 11.4%), Educational Services (2,212 | 10.6%), Arts, Entertainment & Recreation (1,964 | 9.4%), and Retail Trade (1,951 | 9.4%).
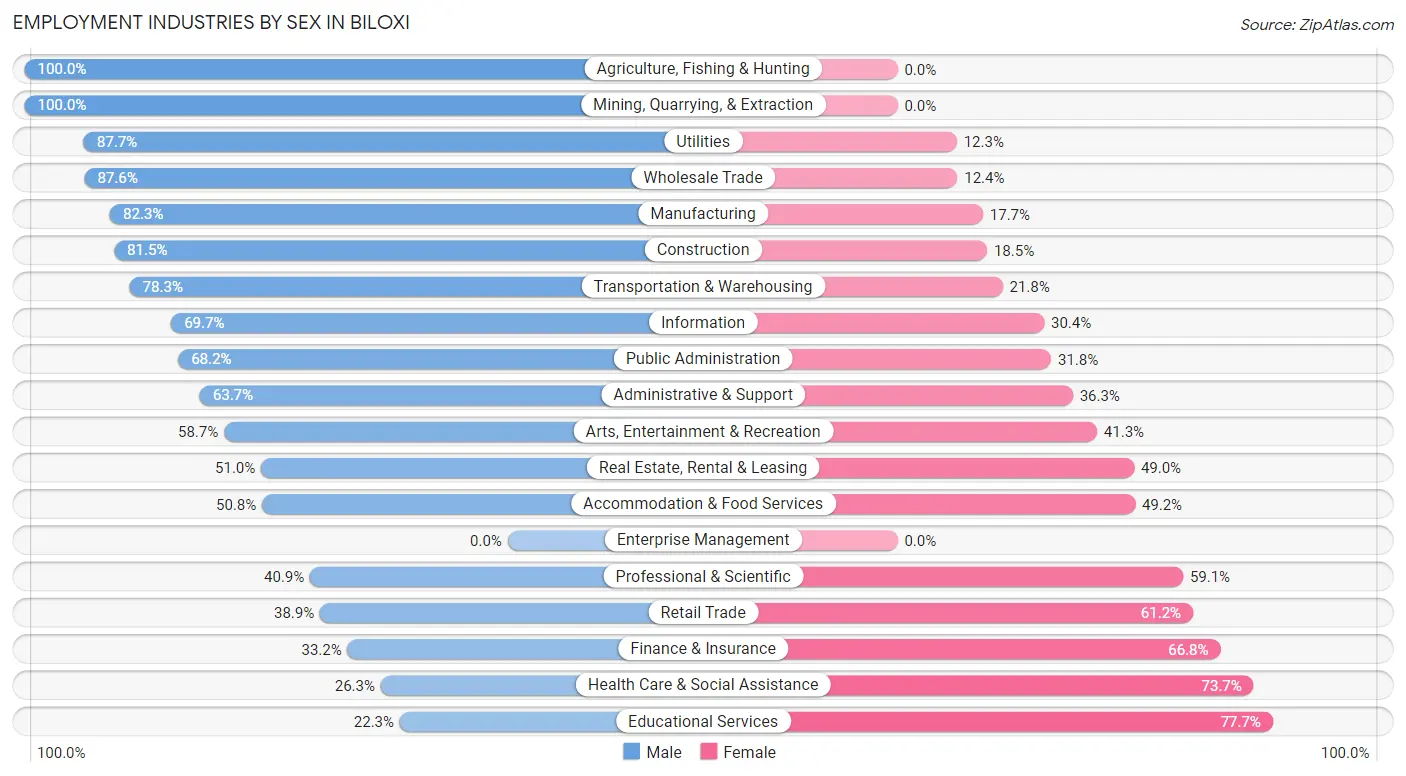
Employment Industries by Sex in Biloxi
The Biloxi industries that see more men than women are Agriculture, Fishing & Hunting (100.0%), Mining, Quarrying, & Extraction (100.0%), and Utilities (87.7%), whereas the industries that tend to have a higher number of women are Educational Services (77.7%), Health Care & Social Assistance (73.7%), and Finance & Insurance (66.8%).
| Industry | Male | Female |
| Agriculture, Fishing & Hunting | 122 (100.0%) | 0 (0.0%) |
| Mining, Quarrying, & Extraction | 37 (100.0%) | 0 (0.0%) |
| Construction | 1,195 (81.5%) | 272 (18.5%) |
| Manufacturing | 982 (82.3%) | 211 (17.7%) |
| Wholesale Trade | 212 (87.6%) | 30 (12.4%) |
| Retail Trade | 758 (38.9%) | 1,193 (61.2%) |
| Transportation & Warehousing | 439 (78.2%) | 122 (21.7%) |
| Utilities | 393 (87.7%) | 55 (12.3%) |
| Information | 140 (69.7%) | 61 (30.3%) |
| Finance & Insurance | 186 (33.2%) | 375 (66.8%) |
| Real Estate, Rental & Leasing | 221 (51.0%) | 212 (49.0%) |
| Professional & Scientific | 400 (40.9%) | 578 (59.1%) |
| Enterprise Management | 0 (0.0%) | 0 (0.0%) |
| Administrative & Support | 462 (63.7%) | 263 (36.3%) |
| Educational Services | 494 (22.3%) | 1,718 (77.7%) |
| Health Care & Social Assistance | 786 (26.3%) | 2,205 (73.7%) |
| Arts, Entertainment & Recreation | 1,153 (58.7%) | 811 (41.3%) |
| Accommodation & Food Services | 1,210 (50.8%) | 1,170 (49.2%) |
| Public Administration | 1,098 (68.2%) | 512 (31.8%) |
| Total | 10,642 (51.1%) | 10,190 (48.9%) |
Education in Biloxi
School Enrollment in Biloxi
The most common levels of schooling among the 11,489 students in Biloxi are elementary school (2,852 | 24.8%), college / undergraduate (2,573 | 22.4%), and middle school (2,290 | 19.9%).
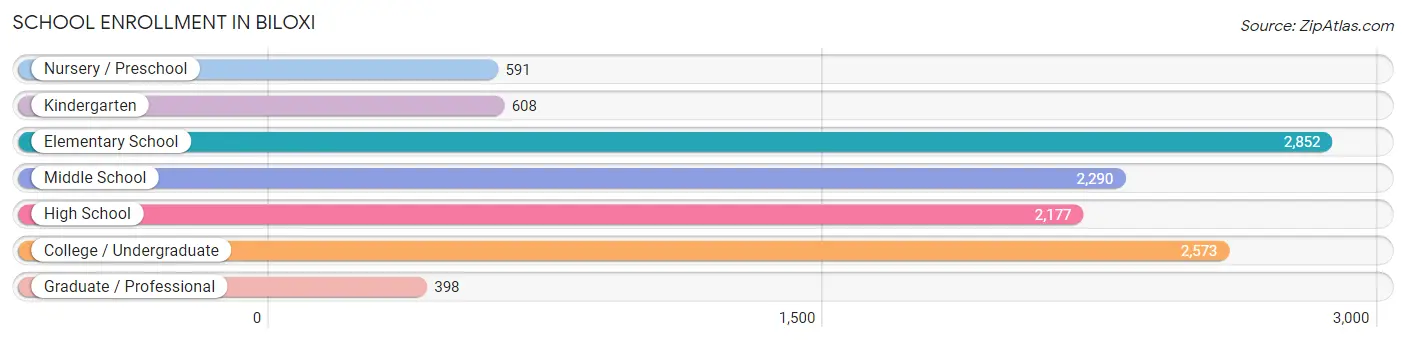
| School Level | # Students | % Students |
| Nursery / Preschool | 591 | 5.1% |
| Kindergarten | 608 | 5.3% |
| Elementary School | 2,852 | 24.8% |
| Middle School | 2,290 | 19.9% |
| High School | 2,177 | 19.0% |
| College / Undergraduate | 2,573 | 22.4% |
| Graduate / Professional | 398 | 3.5% |
| Total | 11,489 | 100.0% |
School Enrollment by Age by Funding Source in Biloxi
Out of a total of 11,489 students who are enrolled in schools in Biloxi, 1,666 (14.5%) attend a private institution, while the remaining 9,823 (85.5%) are enrolled in public schools. The age group of 3 to 4 year olds has the highest likelihood of being enrolled in private schools, with 244 (51.8% in the age bracket) enrolled. Conversely, the age group of 18 to 19 year olds has the lowest likelihood of being enrolled in a private school, with 731 (98.7% in the age bracket) attending a public institution.
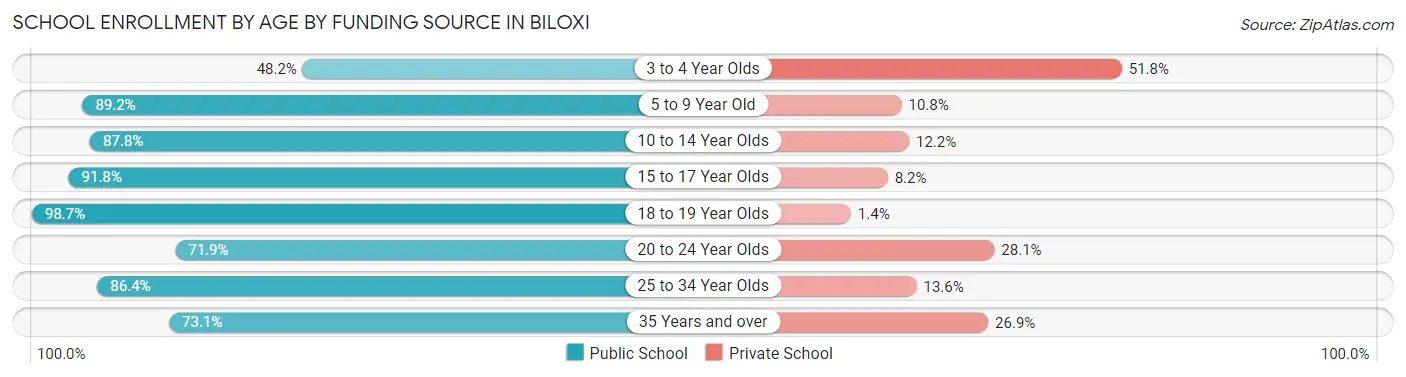
| Age Bracket | Public School | Private School |
| 3 to 4 Year Olds | 227 (48.2%) | 244 (51.8%) |
| 5 to 9 Year Old | 2,813 (89.2%) | 340 (10.8%) |
| 10 to 14 Year Olds | 2,624 (87.8%) | 364 (12.2%) |
| 15 to 17 Year Olds | 1,523 (91.8%) | 136 (8.2%) |
| 18 to 19 Year Olds | 731 (98.7%) | 10 (1.3%) |
| 20 to 24 Year Olds | 648 (71.9%) | 253 (28.1%) |
| 25 to 34 Year Olds | 694 (86.4%) | 109 (13.6%) |
| 35 Years and over | 565 (73.1%) | 208 (26.9%) |
| Total | 9,823 (85.5%) | 1,666 (14.5%) |
Educational Attainment by Field of Study in Biloxi
Business (2,272 | 22.0%), education (1,680 | 16.2%), science & technology (1,077 | 10.4%), bio, nature & agricultural (737 | 7.1%), and arts & humanities (724 | 7.0%) are the most common fields of study among 10,348 individuals in Biloxi who have obtained a bachelor's degree or higher.
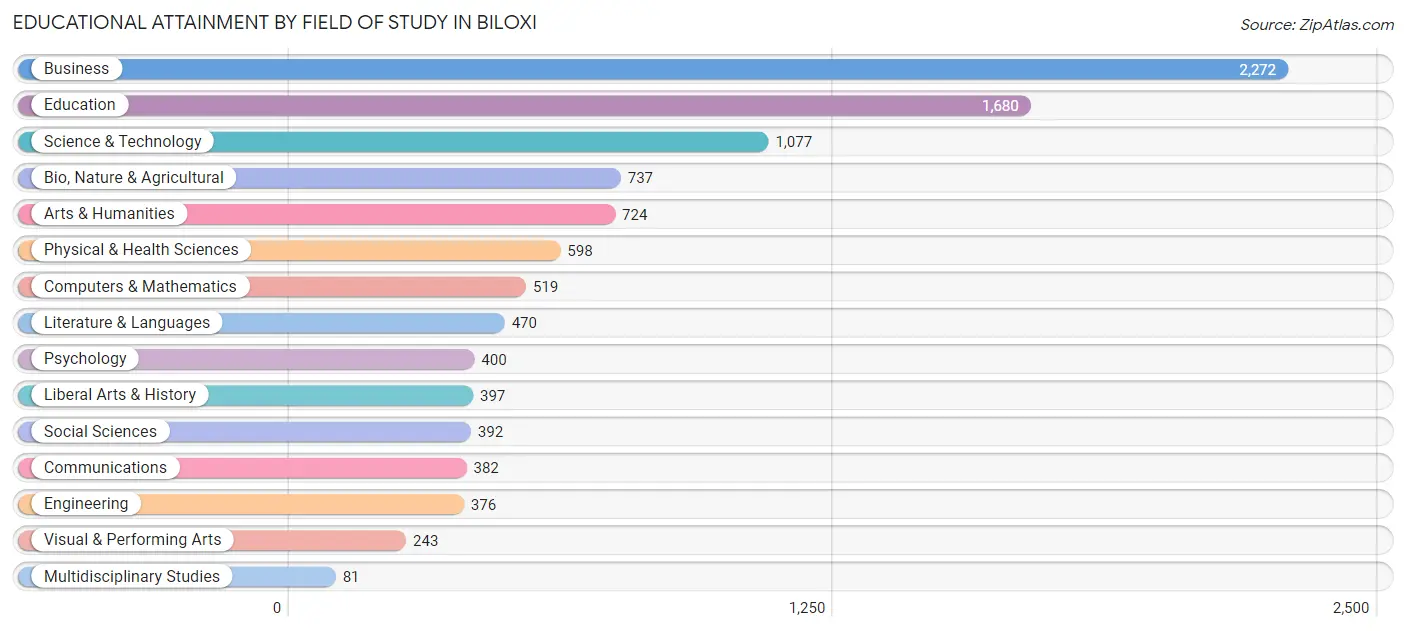
| Field of Study | # Graduates | % Graduates |
| Computers & Mathematics | 519 | 5.0% |
| Bio, Nature & Agricultural | 737 | 7.1% |
| Physical & Health Sciences | 598 | 5.8% |
| Psychology | 400 | 3.9% |
| Social Sciences | 392 | 3.8% |
| Engineering | 376 | 3.6% |
| Multidisciplinary Studies | 81 | 0.8% |
| Science & Technology | 1,077 | 10.4% |
| Business | 2,272 | 22.0% |
| Education | 1,680 | 16.2% |
| Literature & Languages | 470 | 4.5% |
| Liberal Arts & History | 397 | 3.8% |
| Visual & Performing Arts | 243 | 2.4% |
| Communications | 382 | 3.7% |
| Arts & Humanities | 724 | 7.0% |
| Total | 10,348 | 100.0% |
Transportation & Commute in Biloxi
Vehicle Availability by Sex in Biloxi
The most prevalent vehicle ownership categories in Biloxi are males with 2 vehicles (4,659, accounting for 41.1%) and females with 2 vehicles (3,943, making up 45.6%).
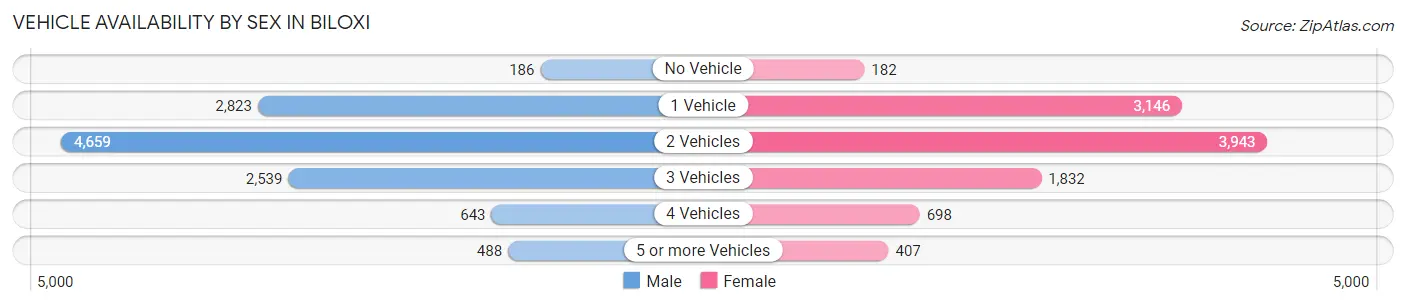
| Vehicles Available | Male | Female |
| No Vehicle | 186 (1.6%) | 182 (1.8%) |
| 1 Vehicle | 2,823 (24.9%) | 3,146 (30.8%) |
| 2 Vehicles | 4,659 (41.1%) | 3,943 (38.6%) |
| 3 Vehicles | 2,539 (22.4%) | 1,832 (17.9%) |
| 4 Vehicles | 643 (5.7%) | 698 (6.8%) |
| 5 or more Vehicles | 488 (4.3%) | 407 (4.0%) |
| Total | 11,338 (100.0%) | 10,208 (100.0%) |
Commute Time in Biloxi
The most frequently occuring commute durations in Biloxi are 15 to 19 minutes (4,824 commuters, 21.7%), 20 to 24 minutes (4,316 commuters, 19.4%), and 10 to 14 minutes (3,301 commuters, 14.8%).
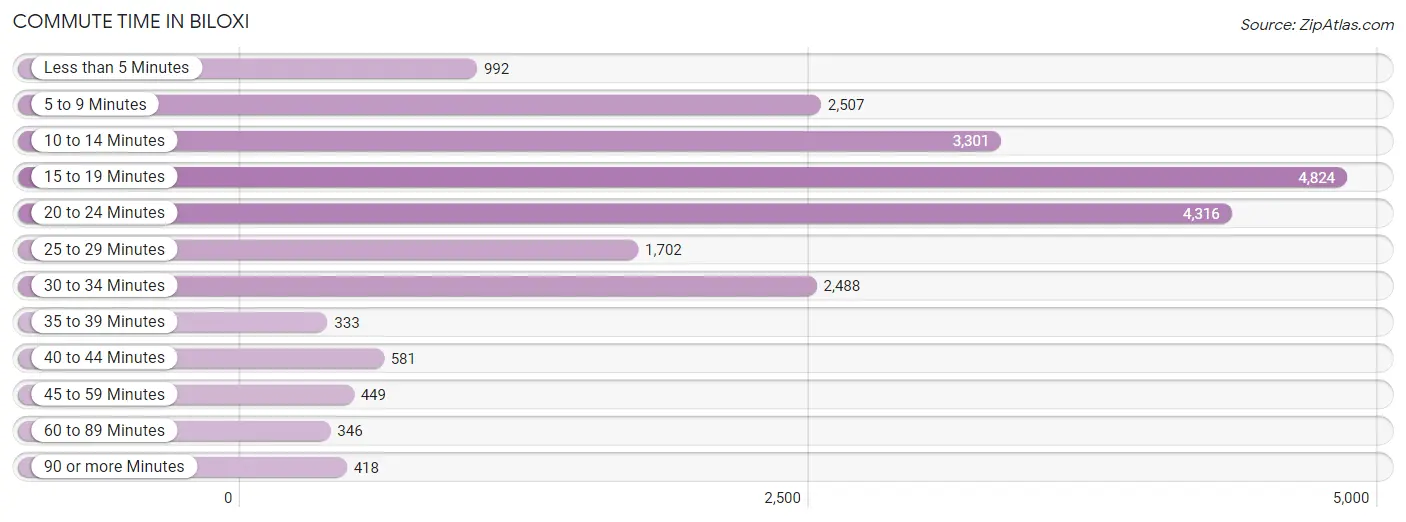
| Commute Time | # Commuters | % Commuters |
| Less than 5 Minutes | 992 | 4.5% |
| 5 to 9 Minutes | 2,507 | 11.3% |
| 10 to 14 Minutes | 3,301 | 14.8% |
| 15 to 19 Minutes | 4,824 | 21.7% |
| 20 to 24 Minutes | 4,316 | 19.4% |
| 25 to 29 Minutes | 1,702 | 7.6% |
| 30 to 34 Minutes | 2,488 | 11.2% |
| 35 to 39 Minutes | 333 | 1.5% |
| 40 to 44 Minutes | 581 | 2.6% |
| 45 to 59 Minutes | 449 | 2.0% |
| 60 to 89 Minutes | 346 | 1.5% |
| 90 or more Minutes | 418 | 1.9% |
Commute Time by Sex in Biloxi
The most common commute times in Biloxi are 15 to 19 minutes (2,670 commuters, 21.8%) for males and 20 to 24 minutes (2,187 commuters, 21.8%) for females.
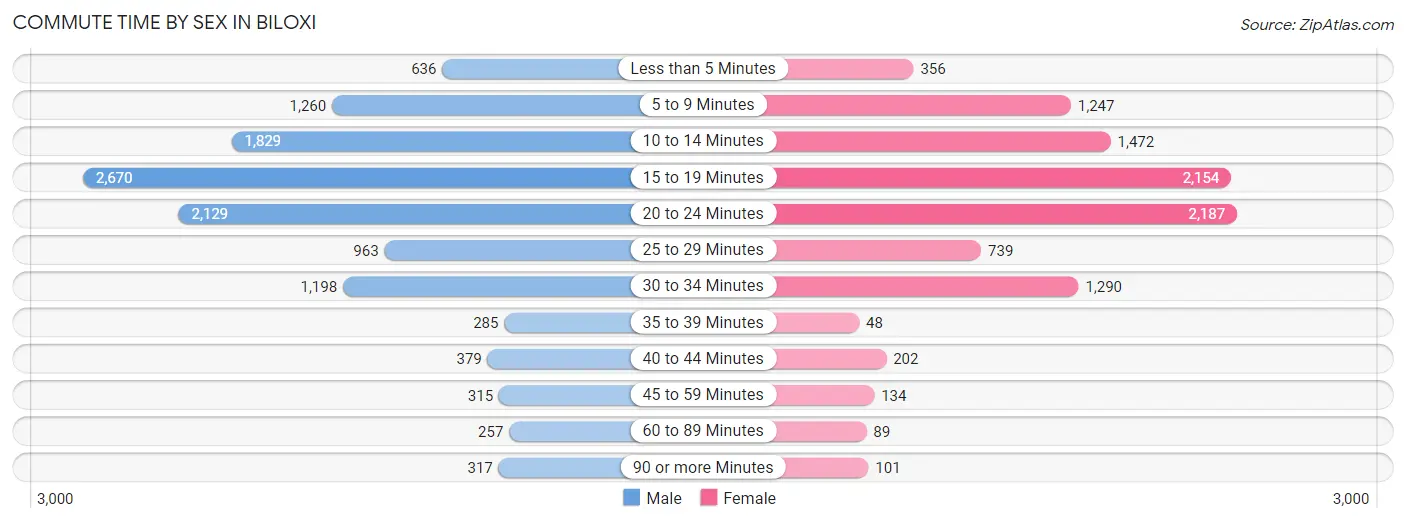
| Commute Time | Male | Female |
| Less than 5 Minutes | 636 (5.2%) | 356 (3.5%) |
| 5 to 9 Minutes | 1,260 (10.3%) | 1,247 (12.4%) |
| 10 to 14 Minutes | 1,829 (14.9%) | 1,472 (14.7%) |
| 15 to 19 Minutes | 2,670 (21.8%) | 2,154 (21.5%) |
| 20 to 24 Minutes | 2,129 (17.4%) | 2,187 (21.8%) |
| 25 to 29 Minutes | 963 (7.9%) | 739 (7.4%) |
| 30 to 34 Minutes | 1,198 (9.8%) | 1,290 (12.9%) |
| 35 to 39 Minutes | 285 (2.3%) | 48 (0.5%) |
| 40 to 44 Minutes | 379 (3.1%) | 202 (2.0%) |
| 45 to 59 Minutes | 315 (2.6%) | 134 (1.3%) |
| 60 to 89 Minutes | 257 (2.1%) | 89 (0.9%) |
| 90 or more Minutes | 317 (2.6%) | 101 (1.0%) |
Time of Departure to Work by Sex in Biloxi
The most frequent times of departure to work in Biloxi are 6:00 AM to 6:29 AM (1,707, 14.0%) for males and 7:30 AM to 7:59 AM (1,664, 16.6%) for females.
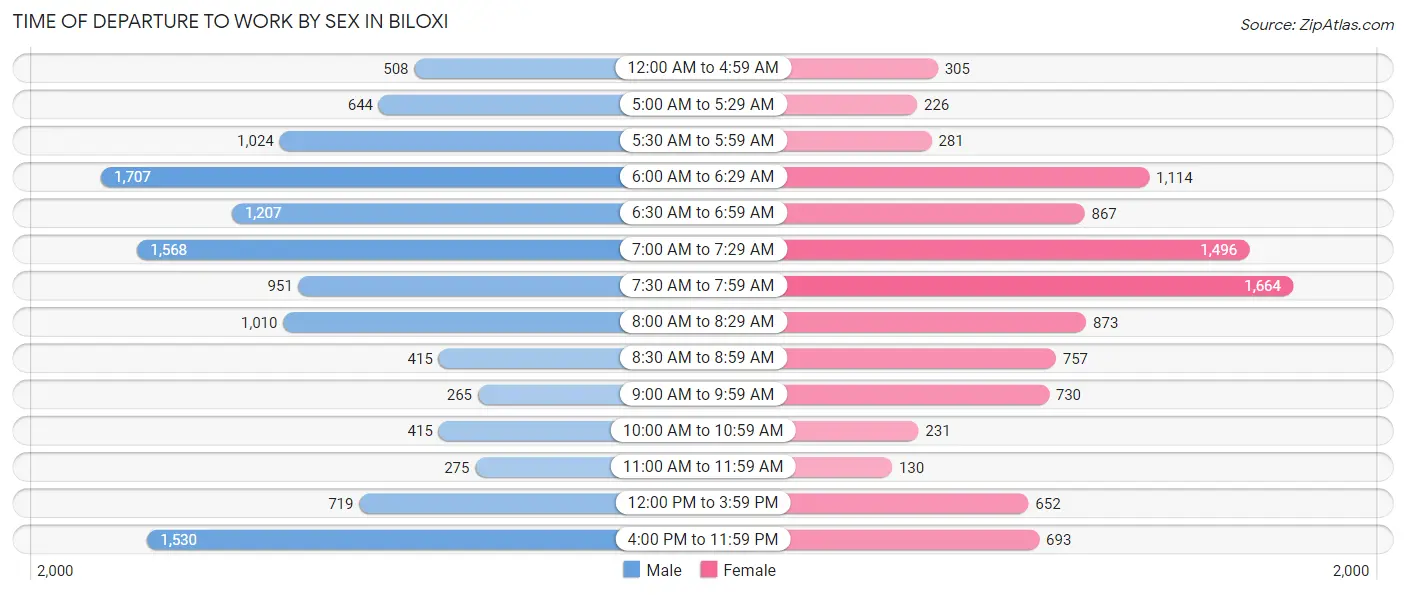
| Time of Departure | Male | Female |
| 12:00 AM to 4:59 AM | 508 (4.2%) | 305 (3.0%) |
| 5:00 AM to 5:29 AM | 644 (5.3%) | 226 (2.3%) |
| 5:30 AM to 5:59 AM | 1,024 (8.4%) | 281 (2.8%) |
| 6:00 AM to 6:29 AM | 1,707 (14.0%) | 1,114 (11.1%) |
| 6:30 AM to 6:59 AM | 1,207 (9.9%) | 867 (8.6%) |
| 7:00 AM to 7:29 AM | 1,568 (12.8%) | 1,496 (14.9%) |
| 7:30 AM to 7:59 AM | 951 (7.8%) | 1,664 (16.6%) |
| 8:00 AM to 8:29 AM | 1,010 (8.3%) | 873 (8.7%) |
| 8:30 AM to 8:59 AM | 415 (3.4%) | 757 (7.6%) |
| 9:00 AM to 9:59 AM | 265 (2.2%) | 730 (7.3%) |
| 10:00 AM to 10:59 AM | 415 (3.4%) | 231 (2.3%) |
| 11:00 AM to 11:59 AM | 275 (2.2%) | 130 (1.3%) |
| 12:00 PM to 3:59 PM | 719 (5.9%) | 652 (6.5%) |
| 4:00 PM to 11:59 PM | 1,530 (12.5%) | 693 (6.9%) |
| Total | 12,238 (100.0%) | 10,019 (100.0%) |
Housing Occupancy in Biloxi
Occupancy by Ownership in Biloxi
Of the total 19,666 dwellings in Biloxi, owner-occupied units account for 9,656 (49.1%), while renter-occupied units make up 10,010 (50.9%).
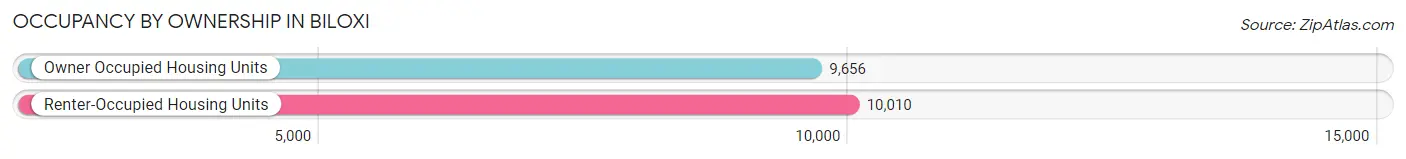
| Occupancy | # Housing Units | % Housing Units |
| Owner Occupied Housing Units | 9,656 | 49.1% |
| Renter-Occupied Housing Units | 10,010 | 50.9% |
| Total Occupied Housing Units | 19,666 | 100.0% |
Occupancy by Household Size in Biloxi
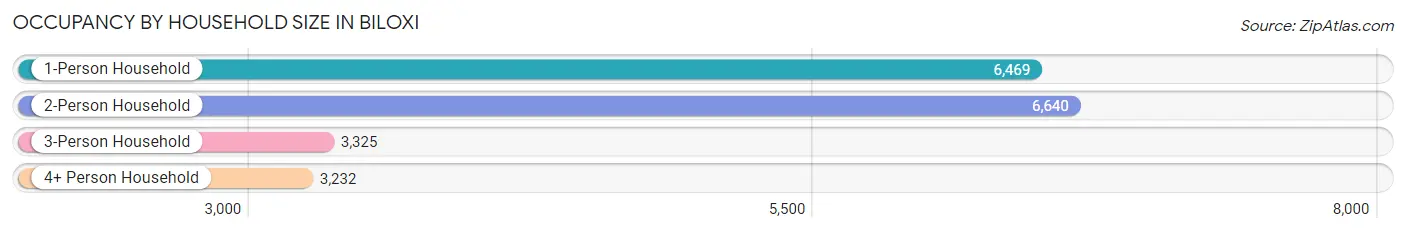
| Household Size | # Housing Units | % Housing Units |
| 1-Person Household | 6,469 | 32.9% |
| 2-Person Household | 6,640 | 33.8% |
| 3-Person Household | 3,325 | 16.9% |
| 4+ Person Household | 3,232 | 16.4% |
| Total Housing Units | 19,666 | 100.0% |
Occupancy by Ownership by Household Size in Biloxi
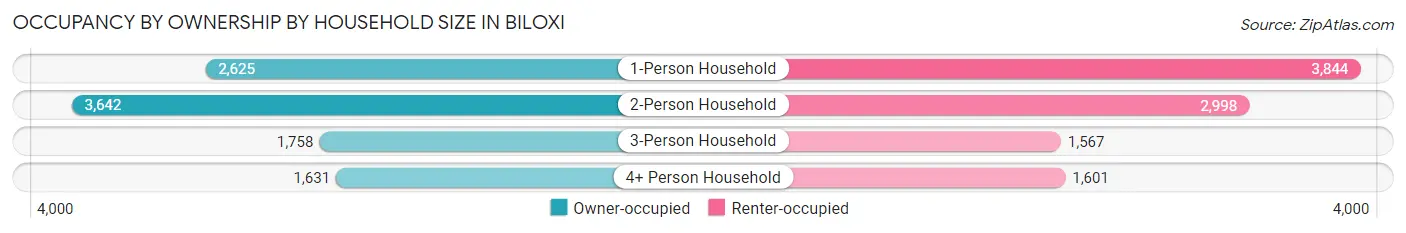
| Household Size | Owner-occupied | Renter-occupied |
| 1-Person Household | 2,625 (40.6%) | 3,844 (59.4%) |
| 2-Person Household | 3,642 (54.8%) | 2,998 (45.2%) |
| 3-Person Household | 1,758 (52.9%) | 1,567 (47.1%) |
| 4+ Person Household | 1,631 (50.5%) | 1,601 (49.5%) |
| Total Housing Units | 9,656 (49.1%) | 10,010 (50.9%) |
Occupancy by Educational Attainment in Biloxi
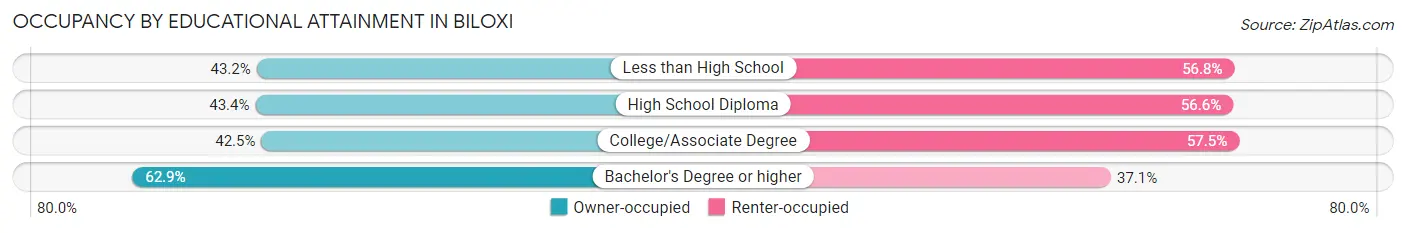
| Household Size | Owner-occupied | Renter-occupied |
| Less than High School | 961 (43.2%) | 1,263 (56.8%) |
| High School Diploma | 1,611 (43.4%) | 2,100 (56.6%) |
| College/Associate Degree | 3,227 (42.5%) | 4,373 (57.5%) |
| Bachelor's Degree or higher | 3,857 (62.9%) | 2,274 (37.1%) |
Occupancy by Age of Householder in Biloxi
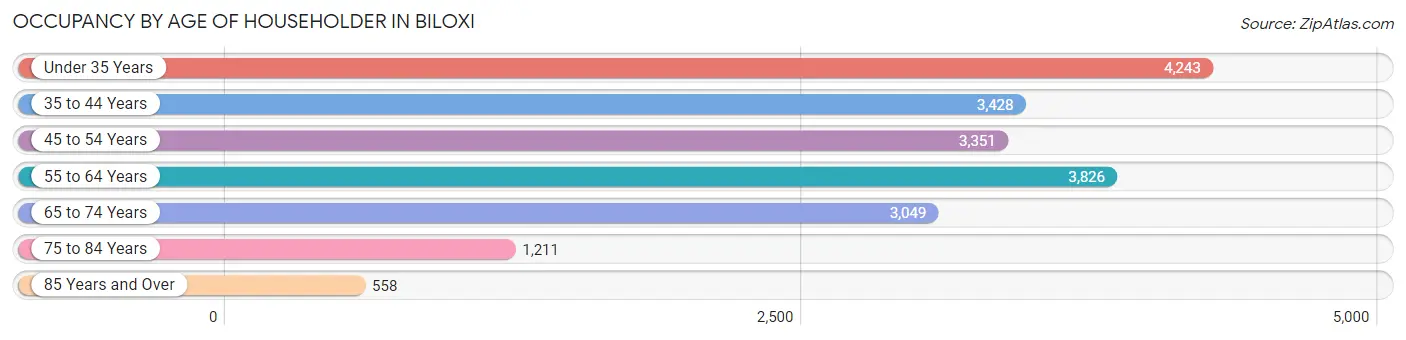
| Age Bracket | # Households | % Households |
| Under 35 Years | 4,243 | 21.6% |
| 35 to 44 Years | 3,428 | 17.4% |
| 45 to 54 Years | 3,351 | 17.0% |
| 55 to 64 Years | 3,826 | 19.5% |
| 65 to 74 Years | 3,049 | 15.5% |
| 75 to 84 Years | 1,211 | 6.2% |
| 85 Years and Over | 558 | 2.8% |
| Total | 19,666 | 100.0% |
Housing Finances in Biloxi
Median Income by Occupancy in Biloxi
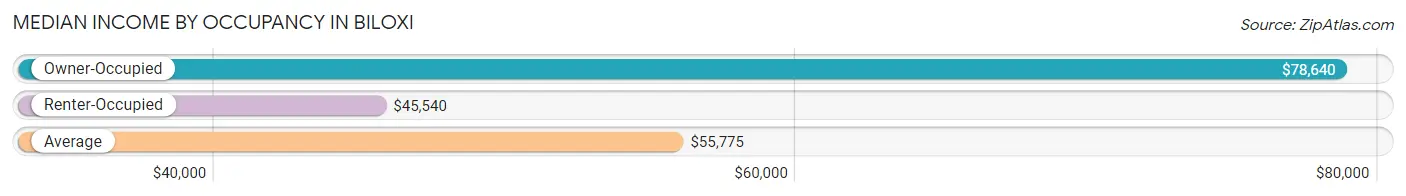
| Occupancy Type | # Households | Median Income |
| Owner-Occupied | 9,656 (49.1%) | $78,640 |
| Renter-Occupied | 10,010 (50.9%) | $45,540 |
| Average | 19,666 (100.0%) | $55,775 |
Occupancy by Householder Income Bracket in Biloxi
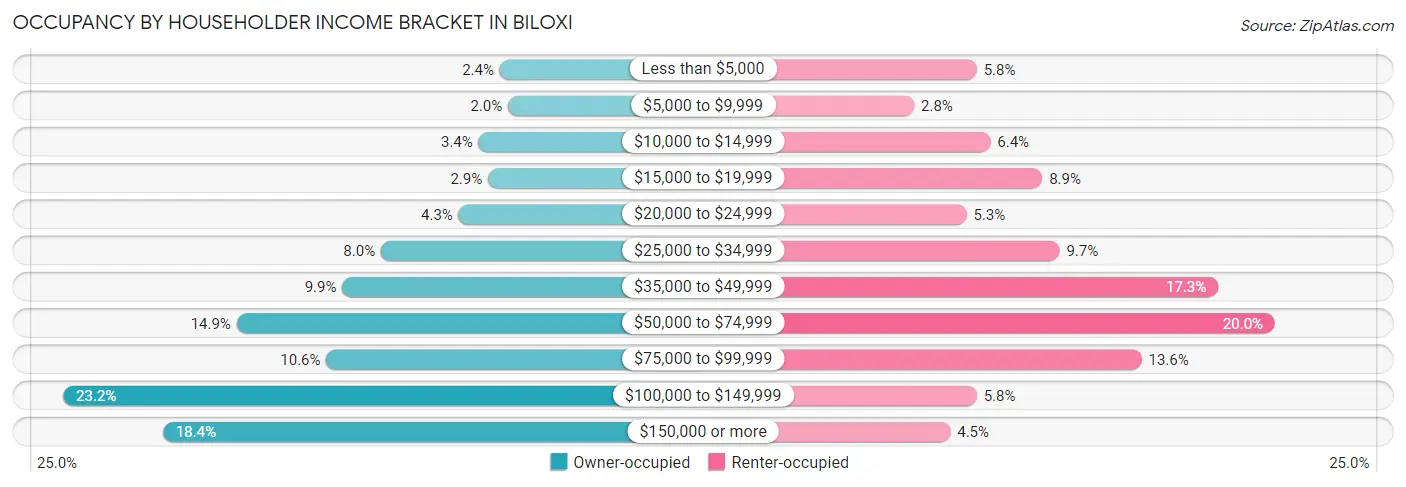
| Income Bracket | Owner-occupied | Renter-occupied |
| Less than $5,000 | 229 (2.4%) | 578 (5.8%) |
| $5,000 to $9,999 | 191 (2.0%) | 279 (2.8%) |
| $10,000 to $14,999 | 326 (3.4%) | 643 (6.4%) |
| $15,000 to $19,999 | 283 (2.9%) | 890 (8.9%) |
| $20,000 to $24,999 | 418 (4.3%) | 529 (5.3%) |
| $25,000 to $34,999 | 775 (8.0%) | 972 (9.7%) |
| $35,000 to $49,999 | 953 (9.9%) | 1,728 (17.3%) |
| $50,000 to $74,999 | 1,439 (14.9%) | 1,999 (20.0%) |
| $75,000 to $99,999 | 1,026 (10.6%) | 1,363 (13.6%) |
| $100,000 to $149,999 | 2,237 (23.2%) | 578 (5.8%) |
| $150,000 or more | 1,779 (18.4%) | 451 (4.5%) |
| Total | 9,656 (100.0%) | 10,010 (100.0%) |
Monthly Housing Cost Tiers in Biloxi
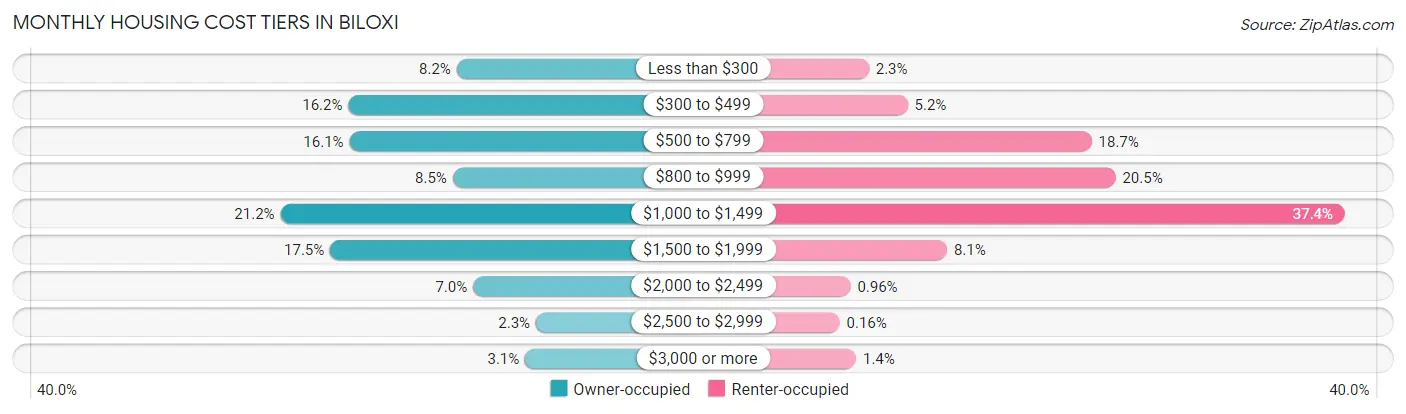
| Monthly Cost | Owner-occupied | Renter-occupied |
| Less than $300 | 790 (8.2%) | 231 (2.3%) |
| $300 to $499 | 1,560 (16.2%) | 518 (5.2%) |
| $500 to $799 | 1,553 (16.1%) | 1,874 (18.7%) |
| $800 to $999 | 818 (8.5%) | 2,050 (20.5%) |
| $1,000 to $1,499 | 2,043 (21.2%) | 3,741 (37.4%) |
| $1,500 to $1,999 | 1,690 (17.5%) | 808 (8.1%) |
| $2,000 to $2,499 | 673 (7.0%) | 96 (1.0%) |
| $2,500 to $2,999 | 226 (2.3%) | 16 (0.2%) |
| $3,000 or more | 303 (3.1%) | 137 (1.4%) |
| Total | 9,656 (100.0%) | 10,010 (100.0%) |
Physical Housing Characteristics in Biloxi
Housing Structures in Biloxi
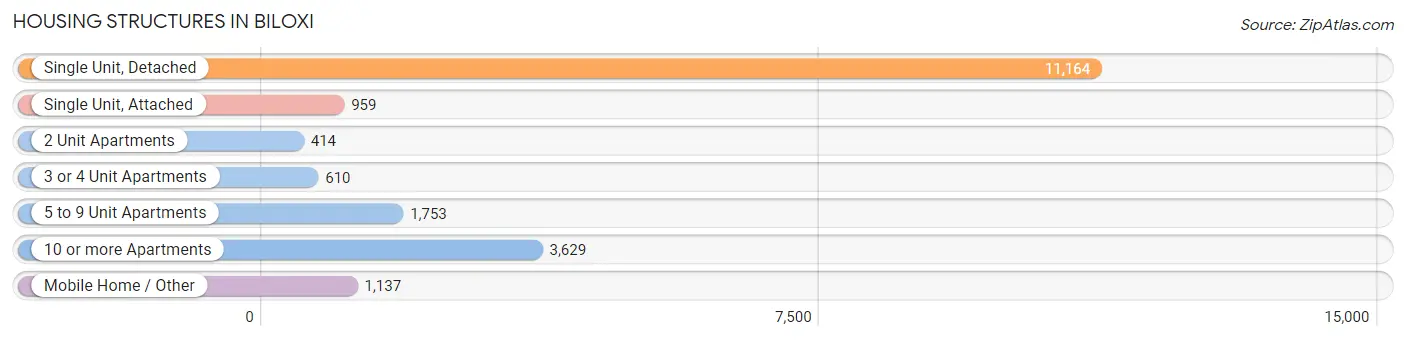
| Structure Type | # Housing Units | % Housing Units |
| Single Unit, Detached | 11,164 | 56.8% |
| Single Unit, Attached | 959 | 4.9% |
| 2 Unit Apartments | 414 | 2.1% |
| 3 or 4 Unit Apartments | 610 | 3.1% |
| 5 to 9 Unit Apartments | 1,753 | 8.9% |
| 10 or more Apartments | 3,629 | 18.4% |
| Mobile Home / Other | 1,137 | 5.8% |
| Total | 19,666 | 100.0% |
Housing Structures by Occupancy in Biloxi
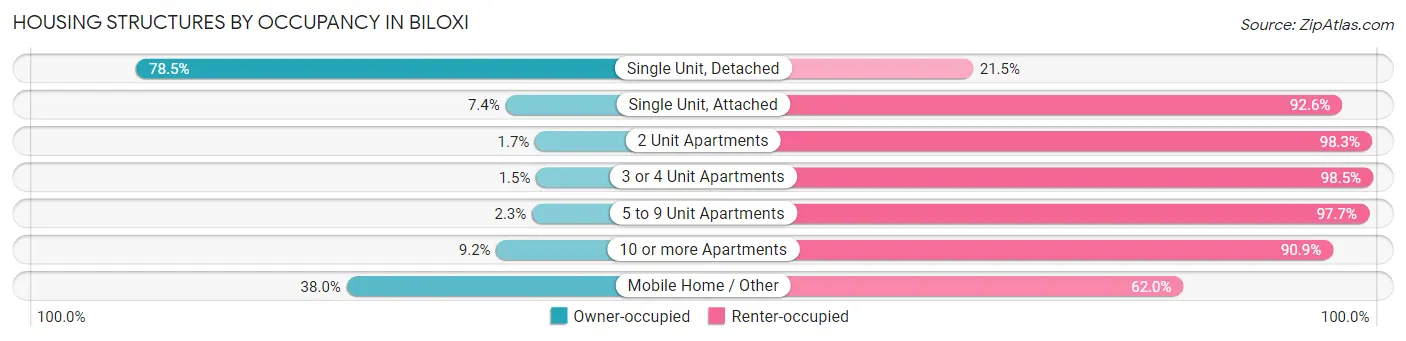
| Structure Type | Owner-occupied | Renter-occupied |
| Single Unit, Detached | 8,765 (78.5%) | 2,399 (21.5%) |
| Single Unit, Attached | 71 (7.4%) | 888 (92.6%) |
| 2 Unit Apartments | 7 (1.7%) | 407 (98.3%) |
| 3 or 4 Unit Apartments | 9 (1.5%) | 601 (98.5%) |
| 5 to 9 Unit Apartments | 40 (2.3%) | 1,713 (97.7%) |
| 10 or more Apartments | 332 (9.1%) | 3,297 (90.8%) |
| Mobile Home / Other | 432 (38.0%) | 705 (62.0%) |
| Total | 9,656 (49.1%) | 10,010 (50.9%) |
Housing Structures by Number of Rooms in Biloxi
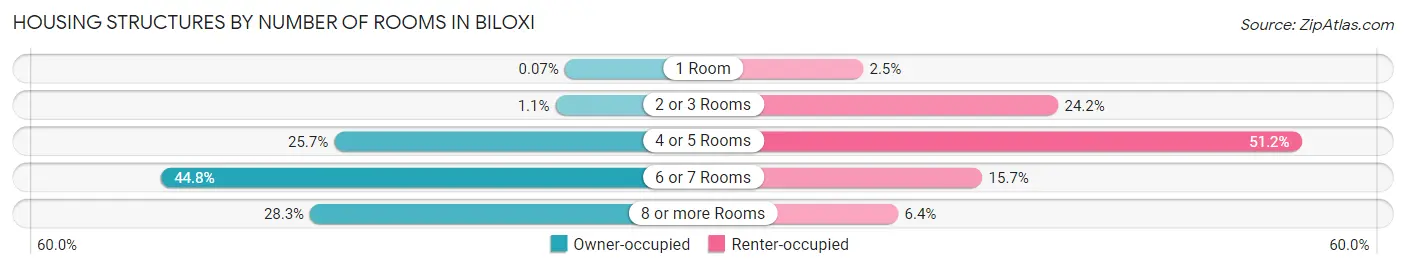
| Number of Rooms | Owner-occupied | Renter-occupied |
| 1 Room | 7 (0.1%) | 251 (2.5%) |
| 2 or 3 Rooms | 106 (1.1%) | 2,417 (24.1%) |
| 4 or 5 Rooms | 2,478 (25.7%) | 5,126 (51.2%) |
| 6 or 7 Rooms | 4,329 (44.8%) | 1,575 (15.7%) |
| 8 or more Rooms | 2,736 (28.3%) | 641 (6.4%) |
| Total | 9,656 (100.0%) | 10,010 (100.0%) |
Housing Structure by Heating Type in Biloxi
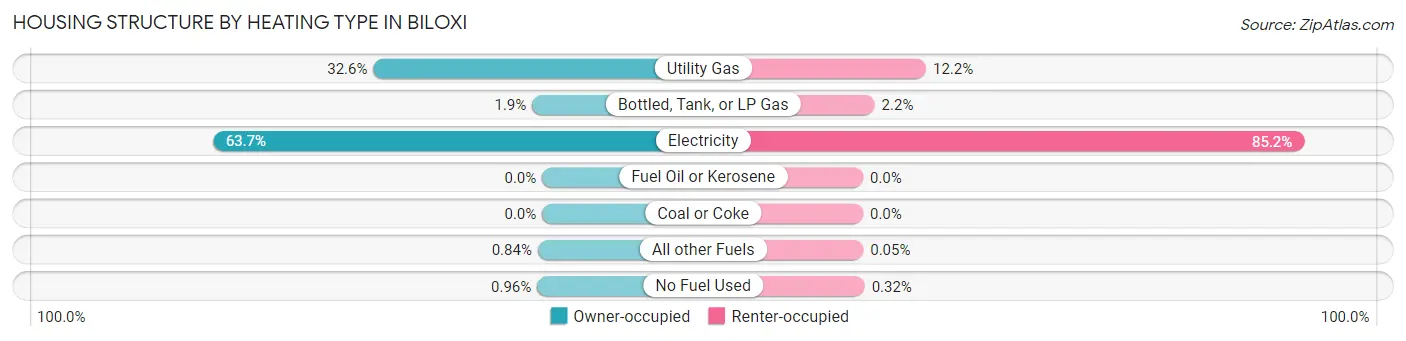
| Heating Type | Owner-occupied | Renter-occupied |
| Utility Gas | 3,150 (32.6%) | 1,218 (12.2%) |
| Bottled, Tank, or LP Gas | 186 (1.9%) | 224 (2.2%) |
| Electricity | 6,146 (63.6%) | 8,531 (85.2%) |
| Fuel Oil or Kerosene | 0 (0.0%) | 0 (0.0%) |
| Coal or Coke | 0 (0.0%) | 0 (0.0%) |
| All other Fuels | 81 (0.8%) | 5 (0.1%) |
| No Fuel Used | 93 (1.0%) | 32 (0.3%) |
| Total | 9,656 (100.0%) | 10,010 (100.0%) |
Household Vehicle Usage in Biloxi
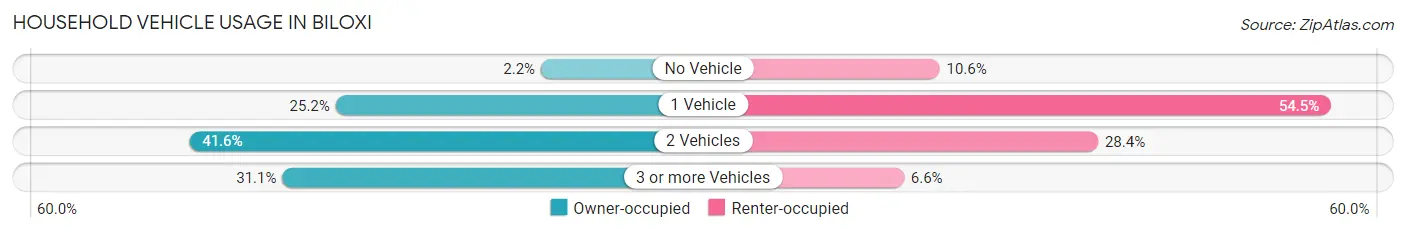
| Vehicles per Household | Owner-occupied | Renter-occupied |
| No Vehicle | 209 (2.2%) | 1,061 (10.6%) |
| 1 Vehicle | 2,429 (25.2%) | 5,450 (54.4%) |
| 2 Vehicles | 4,012 (41.5%) | 2,838 (28.3%) |
| 3 or more Vehicles | 3,006 (31.1%) | 661 (6.6%) |
| Total | 9,656 (100.0%) | 10,010 (100.0%) |
Real Estate & Mortgages in Biloxi
Real Estate and Mortgage Overview in Biloxi
| Characteristic | Without Mortgage | With Mortgage |
| Housing Units | 3,887 | 5,769 |
| Median Property Value | $169,100 | $214,000 |
| Median Household Income | $58,477 | $1,252 |
| Monthly Housing Costs | $445 | $303 |
| Real Estate Taxes | $897 | $606 |
Property Value by Mortgage Status in Biloxi
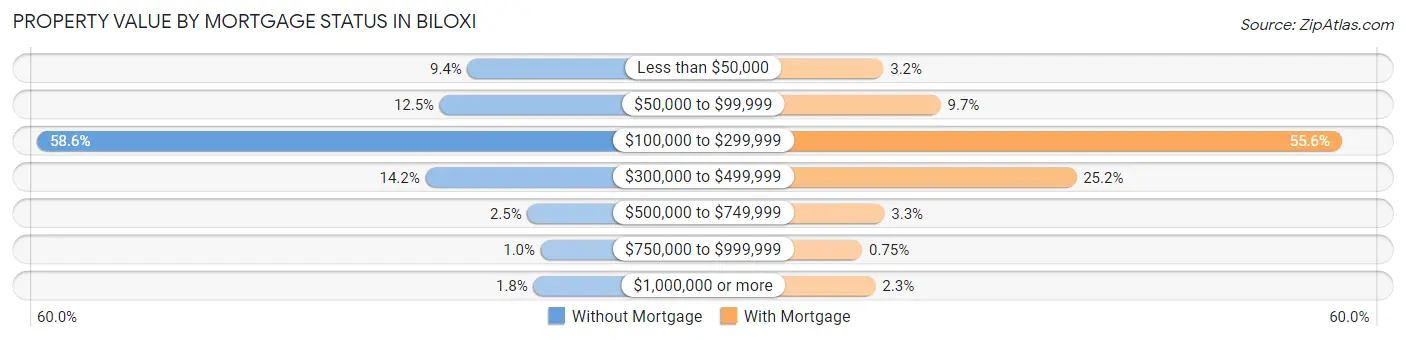
| Property Value | Without Mortgage | With Mortgage |
| Less than $50,000 | 364 (9.4%) | 183 (3.2%) |
| $50,000 to $99,999 | 487 (12.5%) | 561 (9.7%) |
| $100,000 to $299,999 | 2,277 (58.6%) | 3,206 (55.6%) |
| $300,000 to $499,999 | 551 (14.2%) | 1,455 (25.2%) |
| $500,000 to $749,999 | 98 (2.5%) | 190 (3.3%) |
| $750,000 to $999,999 | 39 (1.0%) | 43 (0.7%) |
| $1,000,000 or more | 71 (1.8%) | 131 (2.3%) |
| Total | 3,887 (100.0%) | 5,769 (100.0%) |
Household Income by Mortgage Status in Biloxi
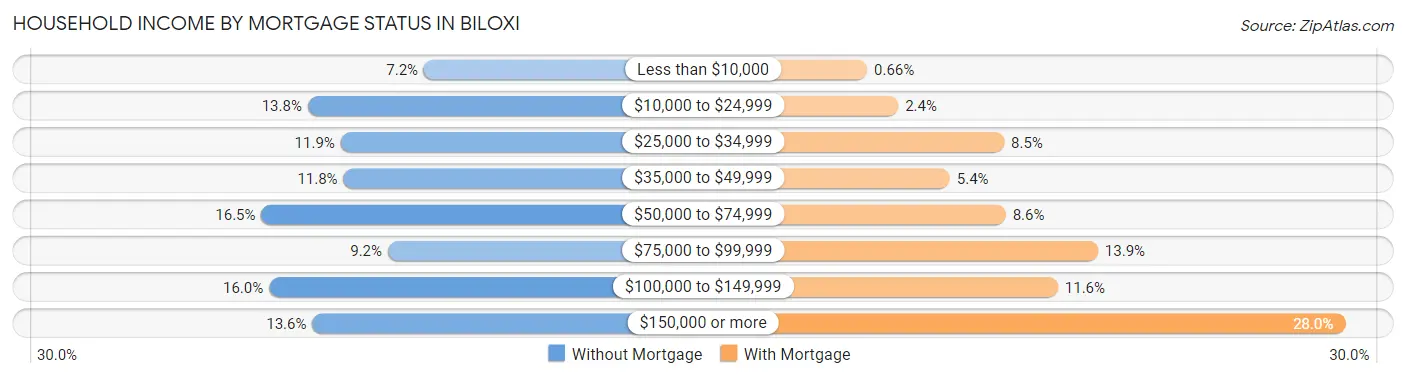
| Household Income | Without Mortgage | With Mortgage |
| Less than $10,000 | 279 (7.2%) | 38 (0.7%) |
| $10,000 to $24,999 | 537 (13.8%) | 141 (2.4%) |
| $25,000 to $34,999 | 464 (11.9%) | 490 (8.5%) |
| $35,000 to $49,999 | 458 (11.8%) | 311 (5.4%) |
| $50,000 to $74,999 | 640 (16.5%) | 495 (8.6%) |
| $75,000 to $99,999 | 359 (9.2%) | 799 (13.9%) |
| $100,000 to $149,999 | 623 (16.0%) | 667 (11.6%) |
| $150,000 or more | 527 (13.6%) | 1,614 (28.0%) |
| Total | 3,887 (100.0%) | 5,769 (100.0%) |
Property Value to Household Income Ratio in Biloxi
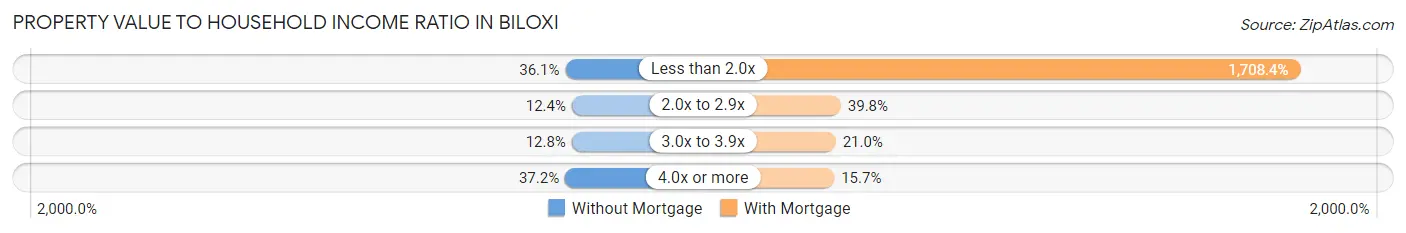
| Value-to-Income Ratio | Without Mortgage | With Mortgage |
| Less than 2.0x | 1,404 (36.1%) | 98,555 (1,708.4%) |
| 2.0x to 2.9x | 480 (12.3%) | 2,294 (39.8%) |
| 3.0x to 3.9x | 497 (12.8%) | 1,209 (21.0%) |
| 4.0x or more | 1,446 (37.2%) | 904 (15.7%) |
| Total | 3,887 (100.0%) | 5,769 (100.0%) |
Real Estate Taxes by Mortgage Status in Biloxi
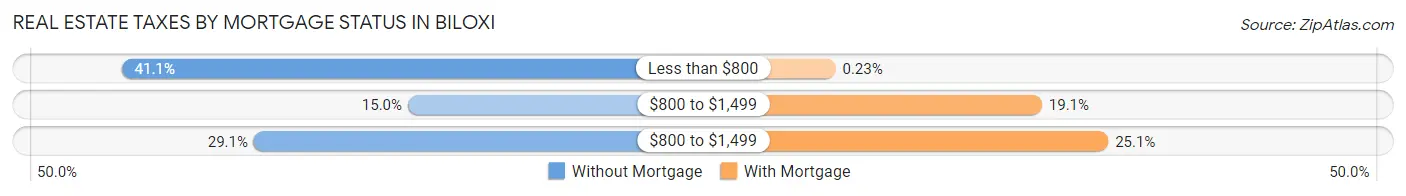
| Property Taxes | Without Mortgage | With Mortgage |
| Less than $800 | 1,599 (41.1%) | 13 (0.2%) |
| $800 to $1,499 | 583 (15.0%) | 1,100 (19.1%) |
| $800 to $1,499 | 1,130 (29.1%) | 1,450 (25.1%) |
| Total | 3,887 (100.0%) | 5,769 (100.0%) |
Health & Disability in Biloxi
Health Insurance Coverage by Age in Biloxi
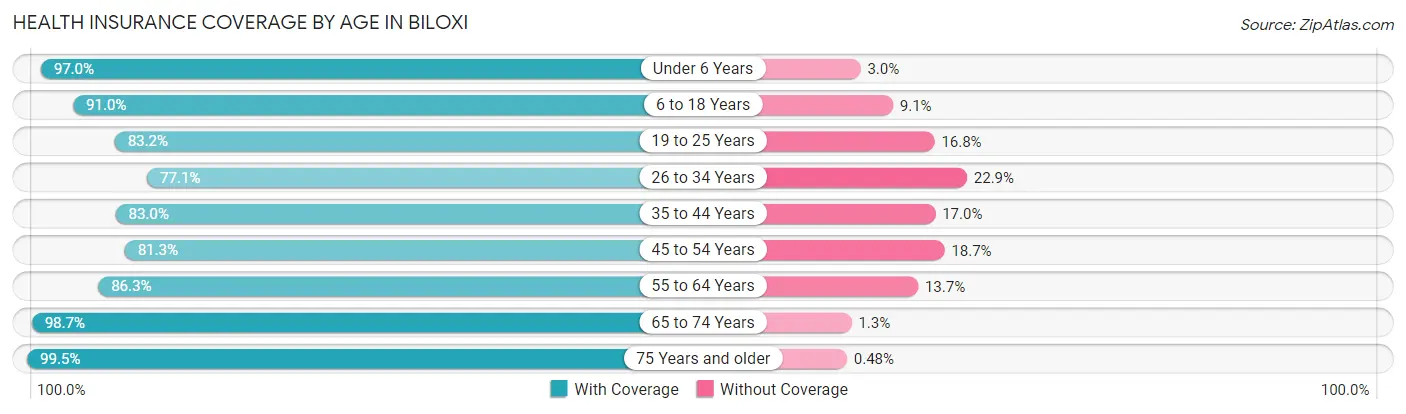
| Age Bracket | With Coverage | Without Coverage |
| Under 6 Years | 3,600 (97.0%) | 112 (3.0%) |
| 6 to 18 Years | 7,089 (90.9%) | 705 (9.0%) |
| 19 to 25 Years | 3,181 (83.2%) | 643 (16.8%) |
| 26 to 34 Years | 4,167 (77.1%) | 1,235 (22.9%) |
| 35 to 44 Years | 4,207 (83.0%) | 859 (17.0%) |
| 45 to 54 Years | 4,779 (81.3%) | 1,098 (18.7%) |
| 55 to 64 Years | 5,737 (86.3%) | 914 (13.7%) |
| 65 to 74 Years | 4,444 (98.7%) | 60 (1.3%) |
| 75 Years and older | 2,699 (99.5%) | 13 (0.5%) |
| Total | 39,903 (87.6%) | 5,639 (12.4%) |
Health Insurance Coverage by Citizenship Status in Biloxi
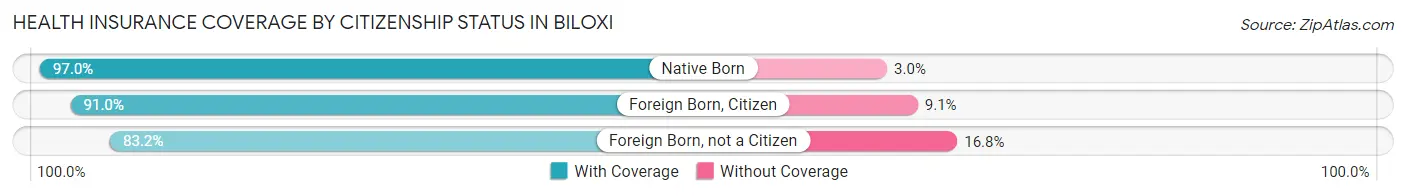
| Citizenship Status | With Coverage | Without Coverage |
| Native Born | 3,600 (97.0%) | 112 (3.0%) |
| Foreign Born, Citizen | 7,089 (90.9%) | 705 (9.0%) |
| Foreign Born, not a Citizen | 3,181 (83.2%) | 643 (16.8%) |
Health Insurance Coverage by Household Income in Biloxi
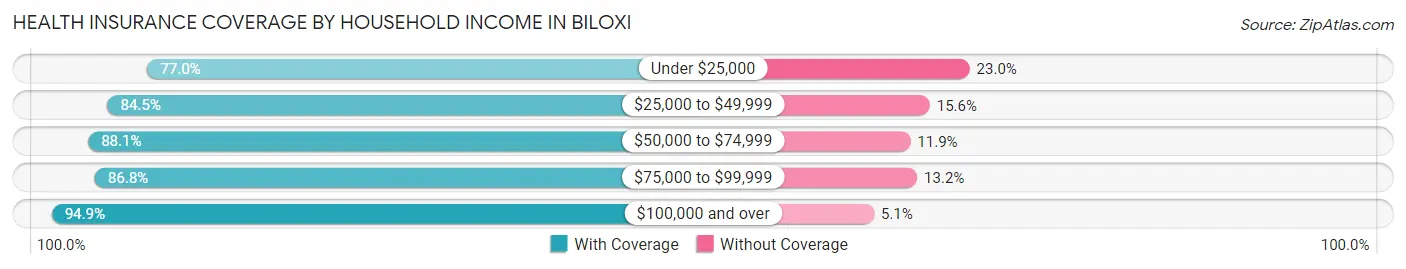
| Household Income | With Coverage | Without Coverage |
| Under $25,000 | 5,680 (77.0%) | 1,699 (23.0%) |
| $25,000 to $49,999 | 7,610 (84.5%) | 1,401 (15.5%) |
| $50,000 to $74,999 | 7,256 (88.1%) | 982 (11.9%) |
| $75,000 to $99,999 | 5,060 (86.8%) | 768 (13.2%) |
| $100,000 and over | 14,252 (94.9%) | 765 (5.1%) |
Public vs Private Health Insurance Coverage by Age in Biloxi
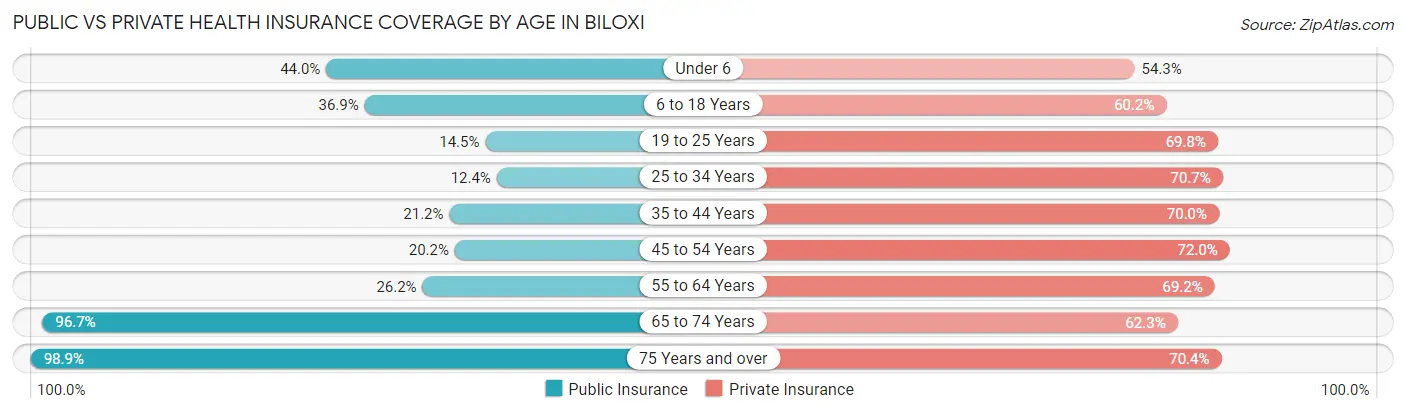
| Age Bracket | Public Insurance | Private Insurance |
| Under 6 | 1,634 (44.0%) | 2,017 (54.3%) |
| 6 to 18 Years | 2,876 (36.9%) | 4,693 (60.2%) |
| 19 to 25 Years | 554 (14.5%) | 2,668 (69.8%) |
| 25 to 34 Years | 668 (12.4%) | 3,818 (70.7%) |
| 35 to 44 Years | 1,072 (21.2%) | 3,545 (70.0%) |
| 45 to 54 Years | 1,184 (20.2%) | 4,231 (72.0%) |
| 55 to 64 Years | 1,739 (26.2%) | 4,601 (69.2%) |
| 65 to 74 Years | 4,355 (96.7%) | 2,806 (62.3%) |
| 75 Years and over | 2,681 (98.9%) | 1,910 (70.4%) |
| Total | 16,763 (36.8%) | 30,289 (66.5%) |
Disability Status by Sex by Age in Biloxi
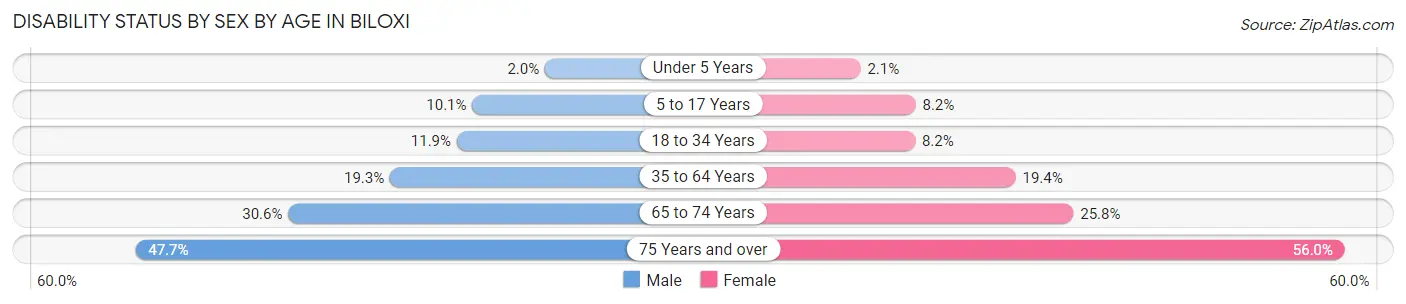
| Age Bracket | Male | Female |
| Under 5 Years | 28 (2.0%) | 37 (2.1%) |
| 5 to 17 Years | 386 (10.1%) | 344 (8.2%) |
| 18 to 34 Years | 499 (11.9%) | 438 (8.2%) |
| 35 to 64 Years | 1,724 (19.3%) | 1,676 (19.4%) |
| 65 to 74 Years | 681 (30.6%) | 588 (25.8%) |
| 75 Years and over | 532 (47.7%) | 894 (56.0%) |
Disability Class by Sex by Age in Biloxi
Disability Class: Hearing Difficulty
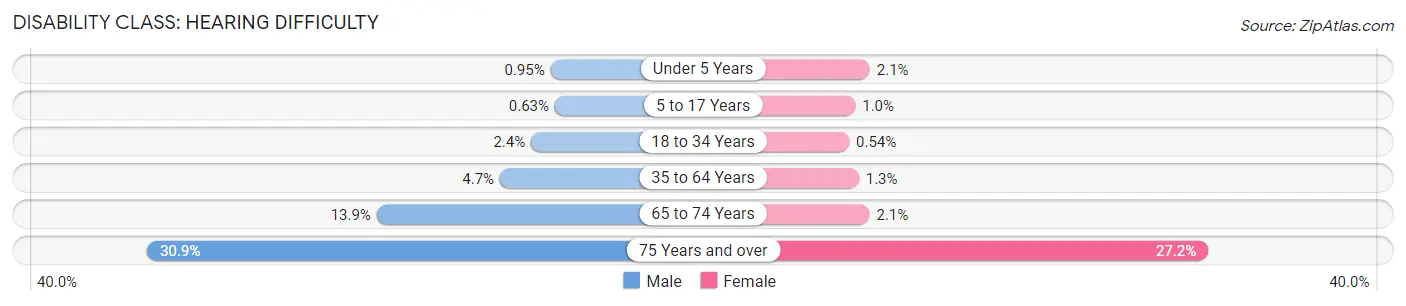
| Age Bracket | Male | Female |
| Under 5 Years | 13 (0.9%) | 37 (2.1%) |
| 5 to 17 Years | 24 (0.6%) | 42 (1.0%) |
| 18 to 34 Years | 101 (2.4%) | 29 (0.5%) |
| 35 to 64 Years | 421 (4.7%) | 109 (1.3%) |
| 65 to 74 Years | 308 (13.9%) | 47 (2.1%) |
| 75 Years and over | 345 (30.9%) | 434 (27.2%) |
Disability Class: Vision Difficulty
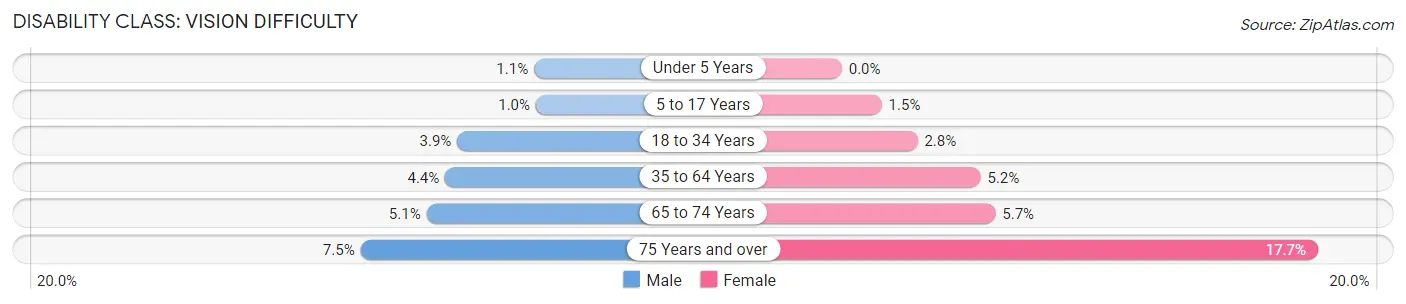
| Age Bracket | Male | Female |
| Under 5 Years | 15 (1.1%) | 0 (0.0%) |
| 5 to 17 Years | 39 (1.0%) | 62 (1.5%) |
| 18 to 34 Years | 166 (3.9%) | 151 (2.8%) |
| 35 to 64 Years | 392 (4.4%) | 446 (5.1%) |
| 65 to 74 Years | 113 (5.1%) | 130 (5.7%) |
| 75 Years and over | 84 (7.5%) | 282 (17.7%) |
Disability Class: Cognitive Difficulty
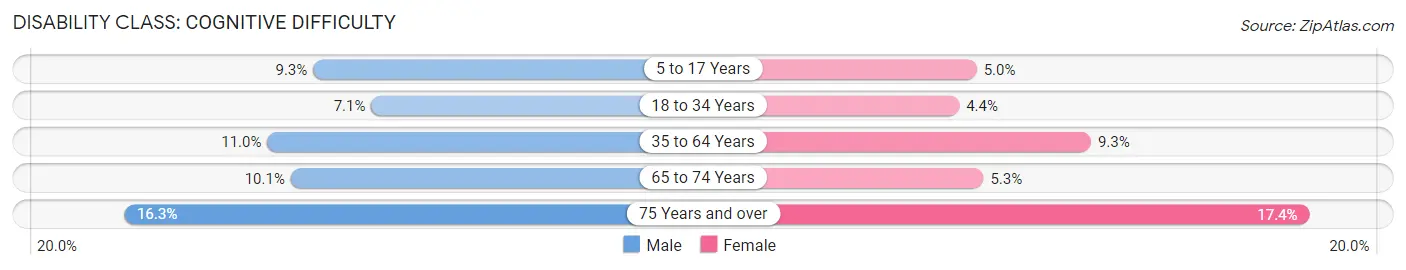
| Age Bracket | Male | Female |
| 5 to 17 Years | 354 (9.3%) | 210 (5.0%) |
| 18 to 34 Years | 300 (7.1%) | 234 (4.4%) |
| 35 to 64 Years | 982 (11.0%) | 801 (9.2%) |
| 65 to 74 Years | 225 (10.1%) | 120 (5.3%) |
| 75 Years and over | 182 (16.3%) | 277 (17.4%) |
Disability Class: Ambulatory Difficulty
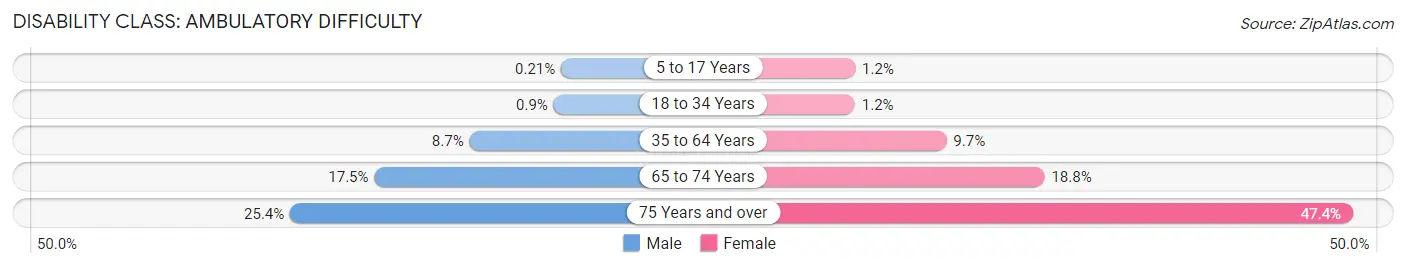
| Age Bracket | Male | Female |
| 5 to 17 Years | 8 (0.2%) | 52 (1.2%) |
| 18 to 34 Years | 38 (0.9%) | 65 (1.2%) |
| 35 to 64 Years | 778 (8.7%) | 841 (9.7%) |
| 65 to 74 Years | 390 (17.5%) | 429 (18.8%) |
| 75 Years and over | 283 (25.4%) | 757 (47.4%) |
Disability Class: Self-Care Difficulty
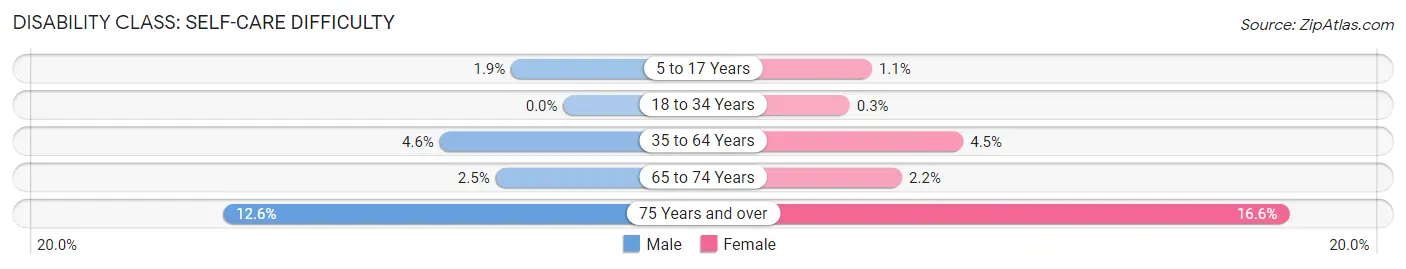
| Age Bracket | Male | Female |
| 5 to 17 Years | 74 (1.9%) | 47 (1.1%) |
| 18 to 34 Years | 0 (0.0%) | 16 (0.3%) |
| 35 to 64 Years | 410 (4.6%) | 391 (4.5%) |
| 65 to 74 Years | 56 (2.5%) | 51 (2.2%) |
| 75 Years and over | 141 (12.6%) | 265 (16.6%) |
Technology Access in Biloxi
Computing Device Access in Biloxi
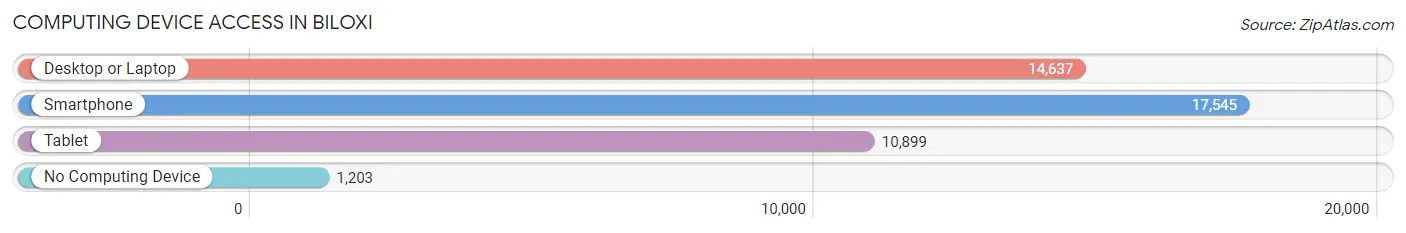
| Device Type | # Households | % Households |
| Desktop or Laptop | 14,637 | 74.4% |
| Smartphone | 17,545 | 89.2% |
| Tablet | 10,899 | 55.4% |
| No Computing Device | 1,203 | 6.1% |
| Total | 19,666 | 100.0% |
Internet Access in Biloxi
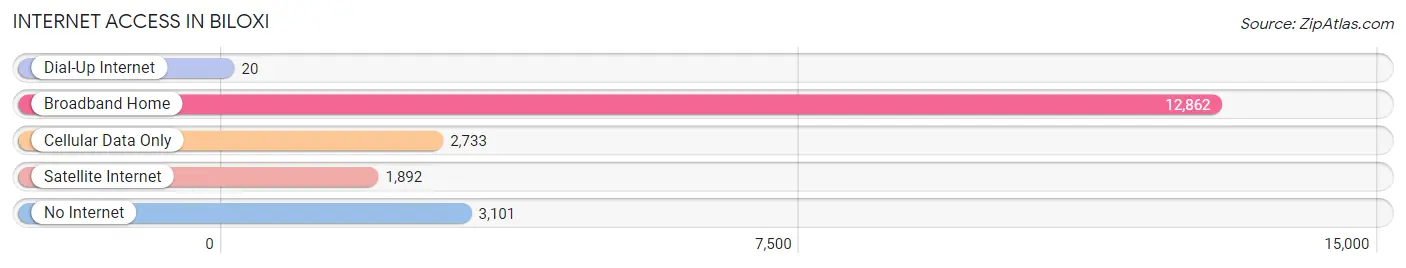
| Internet Type | # Households | % Households |
| Dial-Up Internet | 20 | 0.1% |
| Broadband Home | 12,862 | 65.4% |
| Cellular Data Only | 2,733 | 13.9% |
| Satellite Internet | 1,892 | 9.6% |
| No Internet | 3,101 | 15.8% |
| Total | 19,666 | 100.0% |
Biloxi Summary
Biloxi, Mississippi is a city located in Harrison County, Mississippi, United States. It is situated along the Gulf of Mexico and is part of the Gulf Coast region. The city is the county seat of Harrison County and is the second-largest city in the state. Biloxi is a popular tourist destination and is known for its casinos, beaches, and seafood restaurants.
History
The area that is now Biloxi was first inhabited by Native Americans, including the Choctaw, Chickasaw, and Houma tribes. The first European settlers arrived in the area in the late 17th century, and the city was officially founded in 1720 by Pierre Le Moyne d'Iberville. The city was named after the Biloxi tribe, which was a part of the Choctaw Nation.
In the 19th century, Biloxi became a popular resort destination for wealthy Americans. The city was also a major port for the export of cotton and other goods. During the Civil War, the city was occupied by Union forces and was the site of several battles.
In the late 19th century, Biloxi became a popular destination for immigrants from Italy, Croatia, and other parts of Europe. The city also became a major center for shrimping and fishing.
Geography
Biloxi is located in Harrison County, Mississippi, on the Gulf of Mexico. The city is situated on a peninsula, with the Back Bay of Biloxi to the north and the Mississippi Sound to the south. The city is bordered by the cities of Gulfport and Long Beach to the east and west, respectively.
The city has a total area of 44.2 square miles, of which 33.2 square miles is land and 11.0 square miles is water. The city has a humid subtropical climate, with hot, humid summers and mild winters.
Economy
Biloxi is a major tourist destination, with its casinos, beaches, and seafood restaurants. The city is also a major center for the seafood industry, with shrimping and fishing being major industries. The city is also home to several military bases, including Keesler Air Force Base and the Naval Construction Battalion Center.
The city is also home to several major employers, including Ingalls Shipbuilding, the largest private employer in the state, and the Beau Rivage Resort & Casino. The city also has a large retail sector, with several shopping malls and outlets.
Demographics
As of the 2010 census, Biloxi had a population of 44,054. The racial makeup of the city was 66.2% White, 28.2% African American, 0.5% Native American, 1.7% Asian, 0.1% Pacific Islander, 1.2% from other races, and 2.2% from two or more races. Hispanic or Latino of any race were 4.2% of the population.
The median income for a household in the city was $37,845, and the median income for a family was $45,845. The per capita income for the city was $20,845. About 17.2% of families and 20.7% of the population were below the poverty line, including 28.2% of those under age 18 and 13.2% of those age 65 or over.
Common Questions
What is Per Capita Income in Biloxi?
Per Capita income in Biloxi is $32,679.
What is the Median Family Income in Biloxi?
Median Family Income in Biloxi is $70,425.
What is the Median Household income in Biloxi?
Median Household Income in Biloxi is $55,775.
What is Income or Wage Gap in Biloxi?
Income or Wage Gap in Biloxi is 15.6%.
Women in Biloxi earn 84.4 cents for every dollar earned by a man.
What is Family Income Deficit in Biloxi?
Family Income Deficit in Biloxi is $10,208.
Families that are below poverty line in Biloxi earn $10,208 less on average than the poverty threshold level.
What is Inequality or Gini Index in Biloxi?
Inequality or Gini Index in Biloxi is 0.46.
What is the Total Population of Biloxi?
Total Population of Biloxi is 49,141.
What is the Total Male Population of Biloxi?
Total Male Population of Biloxi is 24,216.
What is the Total Female Population of Biloxi?
Total Female Population of Biloxi is 24,925.
What is the Ratio of Males per 100 Females in Biloxi?
There are 97.16 Males per 100 Females in Biloxi.
What is the Ratio of Females per 100 Males in Biloxi?
There are 102.93 Females per 100 Males in Biloxi.
What is the Median Population Age in Biloxi?
Median Population Age in Biloxi is 36.7 Years.
What is the Average Family Size in Biloxi
Average Family Size in Biloxi is 3.1 People.
What is the Average Household Size in Biloxi
Average Household Size in Biloxi is 2.4 People.
How Large is the Labor Force in Biloxi?
There are 25,939 People in the Labor Forcein in Biloxi.
What is the Percentage of People in the Labor Force in Biloxi?
66.5% of People are in the Labor Force in Biloxi.
What is the Unemployment Rate in Biloxi?
Unemployment Rate in Biloxi is 8.1%.