Marks, MS Map & Demographics
Marks Map
Marks Overview
$22,977
PER CAPITA INCOME
$49,464
AVG FAMILY INCOME
$37,000
AVG HOUSEHOLD INCOME
15.7%
WAGE / INCOME GAP [ % ]
84.3¢/ $1
WAGE / INCOME GAP [ $ ]
0.47
INEQUALITY / GINI INDEX
1,633
TOTAL POPULATION
683
MALE POPULATION
950
FEMALE POPULATION
71.89
MALES / 100 FEMALES
139.09
FEMALES / 100 MALES
41.4
MEDIAN AGE
3.1
AVG FAMILY SIZE
2.2
AVG HOUSEHOLD SIZE
623
LABOR FORCE [ PEOPLE ]
45.9%
PERCENT IN LABOR FORCE
10.6%
UNEMPLOYMENT RATE
Marks Zip Codes
Marks Area Codes
Income in Marks
Income Overview in Marks
Per Capita Income in Marks is $22,977, while median incomes of families and households are $49,464 and $37,000 respectively.
| Characteristic | Number | Measure |
| Per Capita Income | 1,633 | $22,977 |
| Median Family Income | 365 | $49,464 |
| Mean Family Income | 365 | $67,417 |
| Median Household Income | 696 | $37,000 |
| Mean Household Income | 696 | $53,587 |
| Income Deficit | 365 | $0 |
| Wage / Income Gap (%) | 1,633 | 15.72% |
| Wage / Income Gap ($) | 1,633 | 84.28¢ per $1 |
| Gini / Inequality Index | 1,633 | 0.47 |
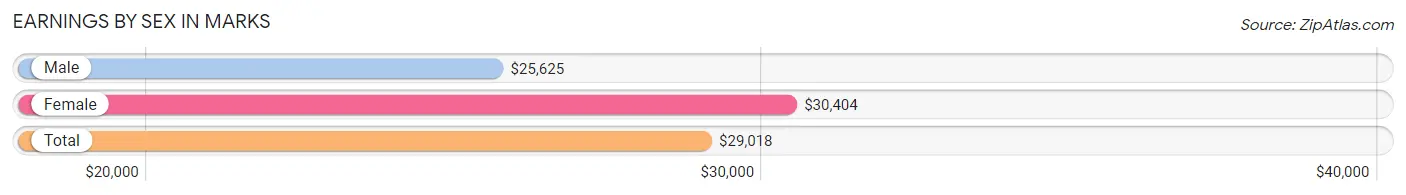
Earnings by Sex in Marks
Average Earnings in Marks are $29,018, $25,625 for men and $30,404 for women, a difference of 15.7%.
| Sex | Number | Average Earnings |
| Male | 265 (40.6%) | $25,625 |
| Female | 388 (59.4%) | $30,404 |
| Total | 653 (100.0%) | $29,018 |
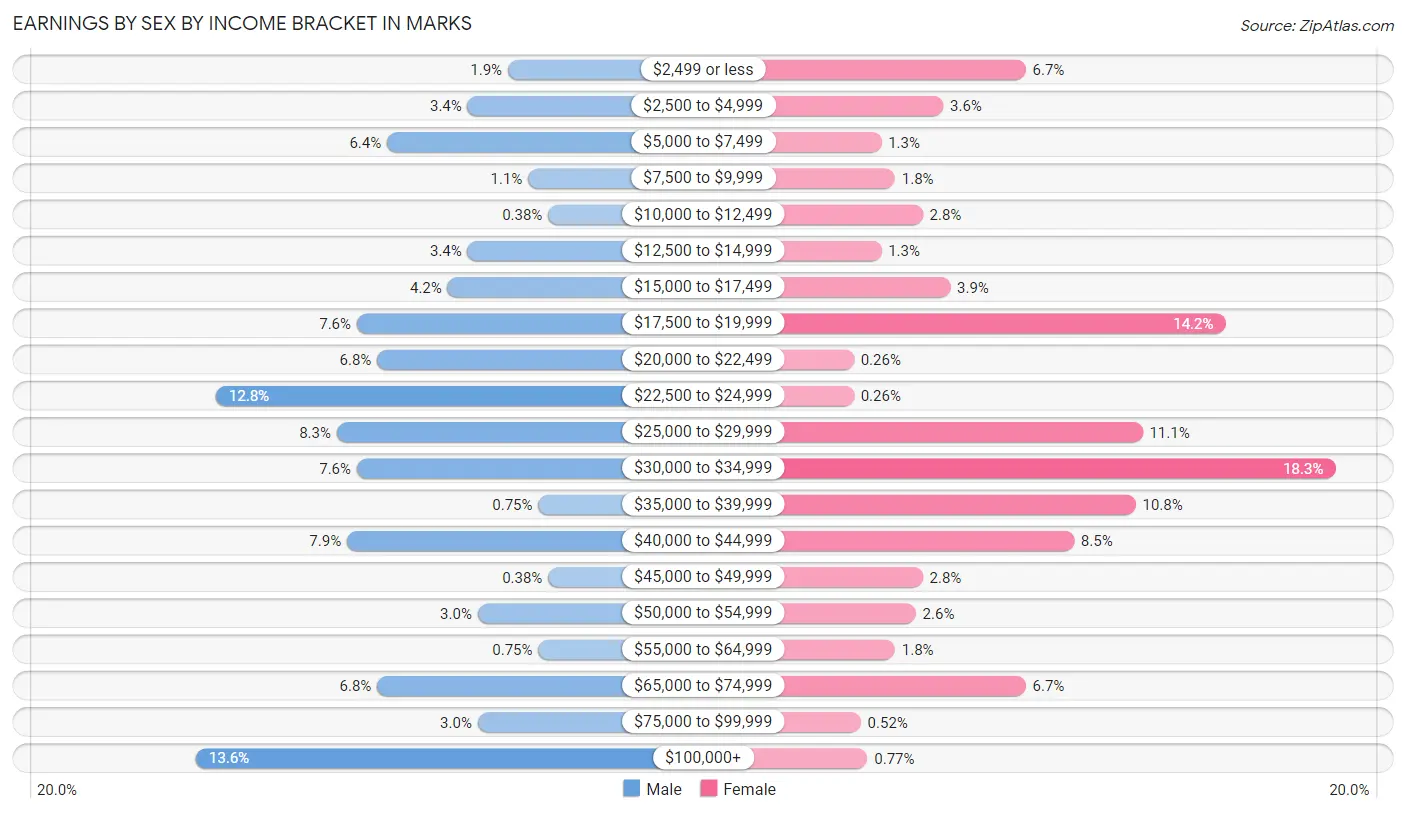
Earnings by Sex by Income Bracket in Marks
The most common earnings brackets in Marks are $100,000+ for men (36 | 13.6%) and $30,000 to $34,999 for women (71 | 18.3%).
| Income | Male | Female |
| $2,499 or less | 5 (1.9%) | 26 (6.7%) |
| $2,500 to $4,999 | 9 (3.4%) | 14 (3.6%) |
| $5,000 to $7,499 | 17 (6.4%) | 5 (1.3%) |
| $7,500 to $9,999 | 3 (1.1%) | 7 (1.8%) |
| $10,000 to $12,499 | 1 (0.4%) | 11 (2.8%) |
| $12,500 to $14,999 | 9 (3.4%) | 5 (1.3%) |
| $15,000 to $17,499 | 11 (4.2%) | 15 (3.9%) |
| $17,500 to $19,999 | 20 (7.5%) | 55 (14.2%) |
| $20,000 to $22,499 | 18 (6.8%) | 1 (0.3%) |
| $22,500 to $24,999 | 34 (12.8%) | 1 (0.3%) |
| $25,000 to $29,999 | 22 (8.3%) | 43 (11.1%) |
| $30,000 to $34,999 | 20 (7.5%) | 71 (18.3%) |
| $35,000 to $39,999 | 2 (0.7%) | 42 (10.8%) |
| $40,000 to $44,999 | 21 (7.9%) | 33 (8.5%) |
| $45,000 to $49,999 | 1 (0.4%) | 11 (2.8%) |
| $50,000 to $54,999 | 8 (3.0%) | 10 (2.6%) |
| $55,000 to $64,999 | 2 (0.7%) | 7 (1.8%) |
| $65,000 to $74,999 | 18 (6.8%) | 26 (6.7%) |
| $75,000 to $99,999 | 8 (3.0%) | 2 (0.5%) |
| $100,000+ | 36 (13.6%) | 3 (0.8%) |
| Total | 265 (100.0%) | 388 (100.0%) |
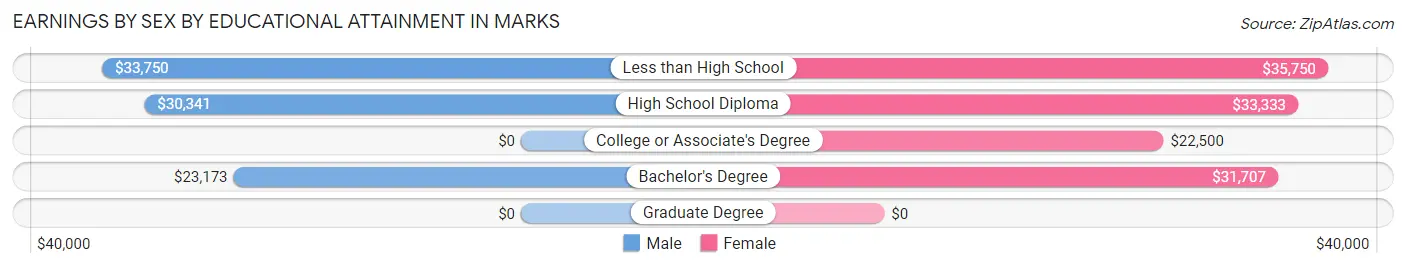
Earnings by Sex by Educational Attainment in Marks
Average earnings in Marks are $26,328 for men and $31,379 for women, a difference of 16.1%. Men with an educational attainment of less than high school enjoy the highest average annual earnings of $33,750, while those with bachelor's degree education earn the least with $23,173. Women with an educational attainment of less than high school earn the most with the average annual earnings of $35,750, while those with college or associate's degree education have the smallest earnings of $22,500.
| Educational Attainment | Male Income | Female Income |
| Less than High School | $33,750 | $35,750 |
| High School Diploma | $30,341 | $33,333 |
| College or Associate's Degree | - | - |
| Bachelor's Degree | $23,173 | $31,707 |
| Graduate Degree | - | - |
| Total | $26,328 | $31,379 |
Family Income in Marks
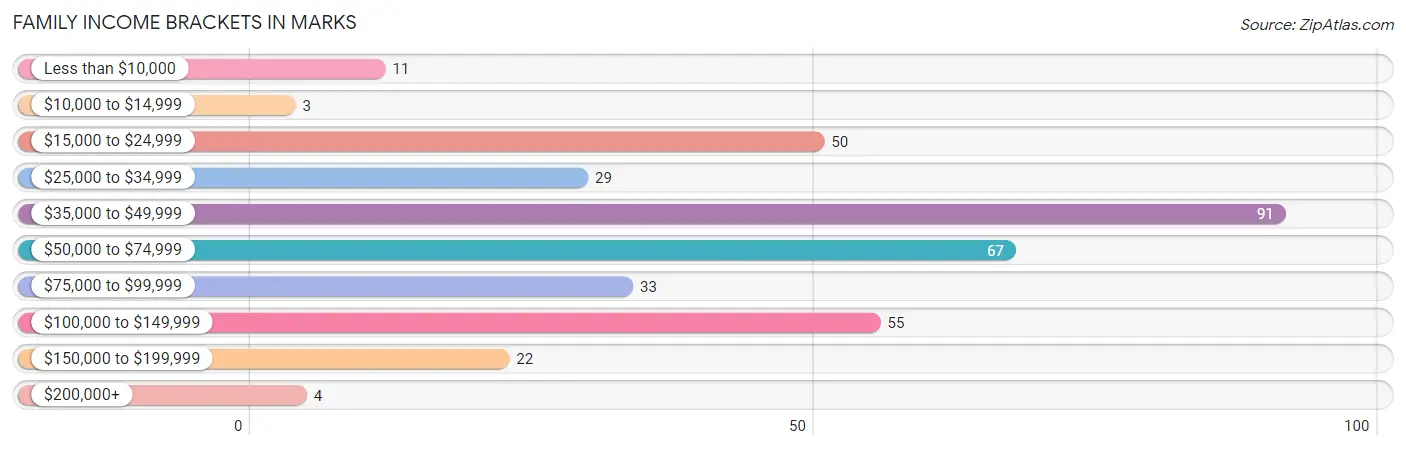
Family Income Brackets in Marks
According to the Marks family income data, there are 91 families falling into the $35,000 to $49,999 income range, which is the most common income bracket and makes up 24.9% of all families. Conversely, the $10,000 to $14,999 income bracket is the least frequent group with only 3 families (0.8%) belonging to this category.
| Income Bracket | # Families | % Families |
| Less than $10,000 | 11 | 3.0% |
| $10,000 to $14,999 | 3 | 0.8% |
| $15,000 to $24,999 | 50 | 13.7% |
| $25,000 to $34,999 | 29 | 7.9% |
| $35,000 to $49,999 | 91 | 24.9% |
| $50,000 to $74,999 | 67 | 18.4% |
| $75,000 to $99,999 | 33 | 9.0% |
| $100,000 to $149,999 | 55 | 15.1% |
| $150,000 to $199,999 | 22 | 6.0% |
| $200,000+ | 4 | 1.1% |
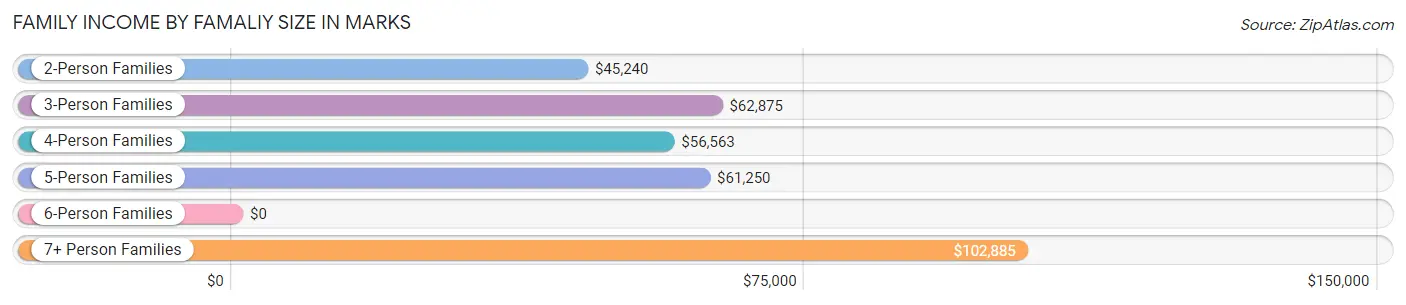
Family Income by Famaliy Size in Marks
7+ person families (22 | 6.0%) account for the highest median family income in Marks with $102,885 per family, while 2-person families (169 | 46.3%) have the highest median income of $22,620 per family member.
| Income Bracket | # Families | Median Income |
| 2-Person Families | 169 (46.3%) | $45,240 |
| 3-Person Families | 109 (29.9%) | $62,875 |
| 4-Person Families | 35 (9.6%) | $56,563 |
| 5-Person Families | 23 (6.3%) | $61,250 |
| 6-Person Families | 7 (1.9%) | $0 |
| 7+ Person Families | 22 (6.0%) | $102,885 |
| Total | 365 (100.0%) | $49,464 |
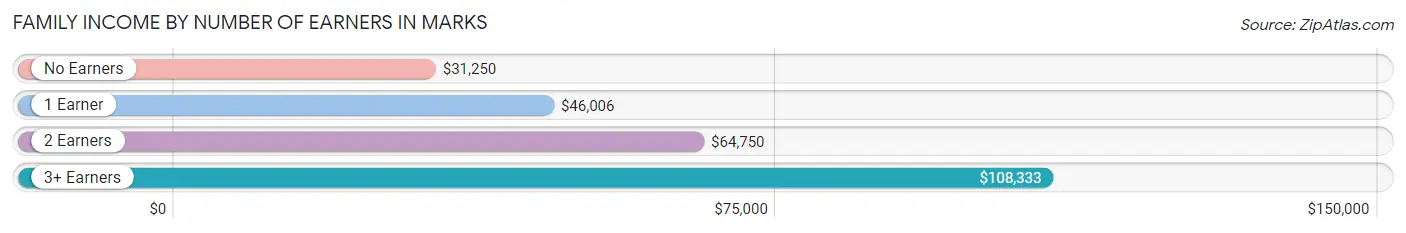
Family Income by Number of Earners in Marks
The median family income in Marks is $49,464, with families comprising 3+ earners (40) having the highest median family income of $108,333, while families with no earners (94) have the lowest median family income of $31,250, accounting for 11.0% and 25.8% of families, respectively.
| Number of Earners | # Families | Median Income |
| No Earners | 94 (25.8%) | $31,250 |
| 1 Earner | 163 (44.7%) | $46,006 |
| 2 Earners | 68 (18.6%) | $64,750 |
| 3+ Earners | 40 (11.0%) | $108,333 |
| Total | 365 (100.0%) | $49,464 |
Household Income in Marks
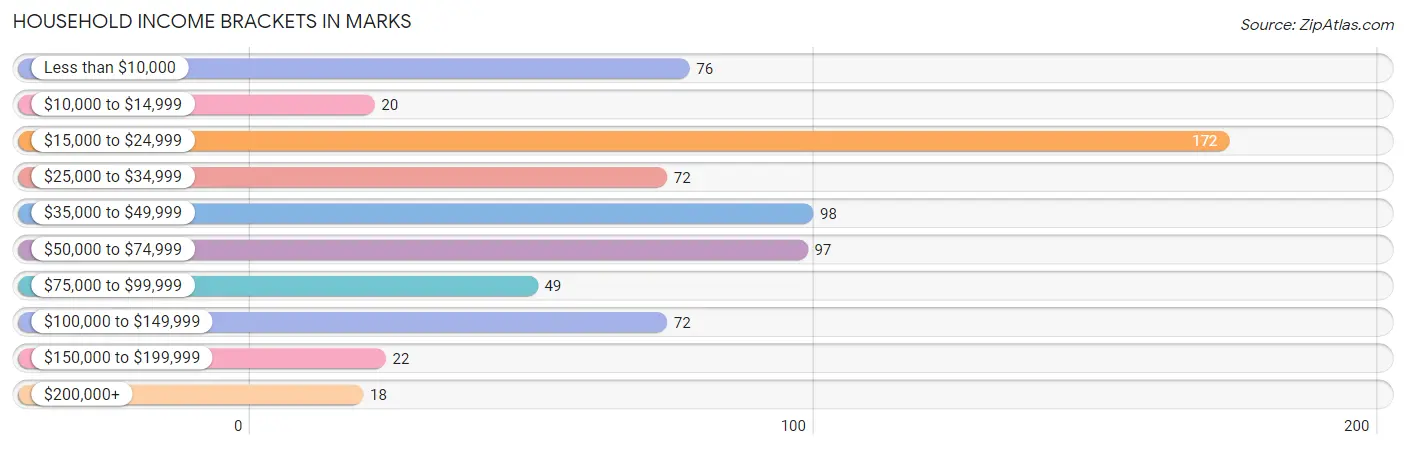
Household Income Brackets in Marks
With 172 households falling in the category, the $15,000 to $24,999 income range is the most frequent in Marks, accounting for 24.7% of all households. In contrast, only 18 households (2.6%) fall into the $200,000+ income bracket, making it the least populous group.
| Income Bracket | # Households | % Households |
| Less than $10,000 | 76 | 10.9% |
| $10,000 to $14,999 | 20 | 2.9% |
| $15,000 to $24,999 | 172 | 24.7% |
| $25,000 to $34,999 | 72 | 10.3% |
| $35,000 to $49,999 | 98 | 14.1% |
| $50,000 to $74,999 | 97 | 13.9% |
| $75,000 to $99,999 | 49 | 7.0% |
| $100,000 to $149,999 | 72 | 10.3% |
| $150,000 to $199,999 | 22 | 3.2% |
| $200,000+ | 18 | 2.6% |
Household Income by Householder Age in Marks
The median household income in Marks is $37,000, with the highest median household income of $45,679 found in the 25 to 44 years age bracket for the primary householder. A total of 171 households (24.6%) fall into this category. Meanwhile, the 15 to 24 years age bracket for the primary householder has the lowest median household income of $0, with 6 households (0.9%) in this group.
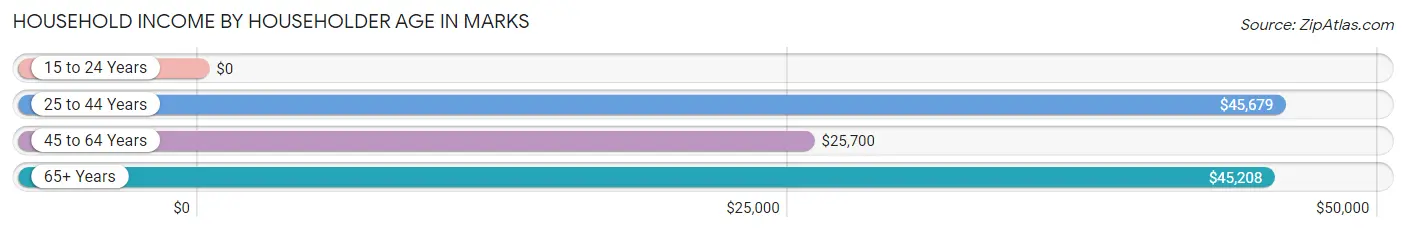
| Income Bracket | # Households | Median Income |
| 15 to 24 Years | 6 (0.9%) | $0 |
| 25 to 44 Years | 171 (24.6%) | $45,679 |
| 45 to 64 Years | 356 (51.1%) | $25,700 |
| 65+ Years | 163 (23.4%) | $45,208 |
| Total | 696 (100.0%) | $37,000 |
Poverty in Marks
Income Below Poverty by Sex and Age in Marks
With 22.6% poverty level for males and 15.8% for females among the residents of Marks, 6 to 11 year old males and 12 to 14 year old females are the most vulnerable to poverty, with 40 males (66.7%) and 2 females (100.0%) in their respective age groups living below the poverty level.
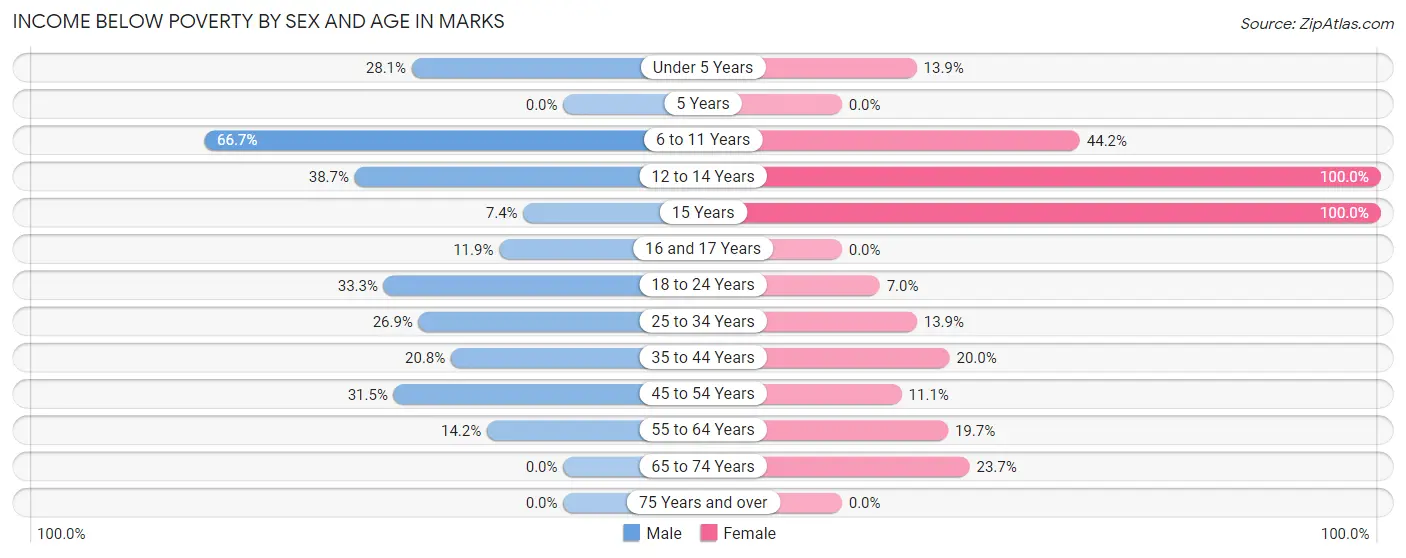
| Age Bracket | Male | Female |
| Under 5 Years | 9 (28.1%) | 5 (13.9%) |
| 5 Years | 0 (0.0%) | 0 (0.0%) |
| 6 to 11 Years | 40 (66.7%) | 19 (44.2%) |
| 12 to 14 Years | 12 (38.7%) | 2 (100.0%) |
| 15 Years | 2 (7.4%) | 4 (100.0%) |
| 16 and 17 Years | 5 (11.9%) | 0 (0.0%) |
| 18 to 24 Years | 11 (33.3%) | 10 (7.0%) |
| 25 to 34 Years | 29 (26.9%) | 11 (13.9%) |
| 35 to 44 Years | 5 (20.8%) | 19 (20.0%) |
| 45 to 54 Years | 17 (31.5%) | 17 (11.1%) |
| 55 to 64 Years | 16 (14.2%) | 27 (19.7%) |
| 65 to 74 Years | 0 (0.0%) | 23 (23.7%) |
| 75 Years and over | 0 (0.0%) | 0 (0.0%) |
| Total | 146 (22.6%) | 137 (15.8%) |
Income Above Poverty by Sex and Age in Marks
According to the poverty statistics in Marks, males aged 5 years and females aged 5 years are the age groups that are most secure financially, with 100.0% of males and 100.0% of females in these age groups living above the poverty line.
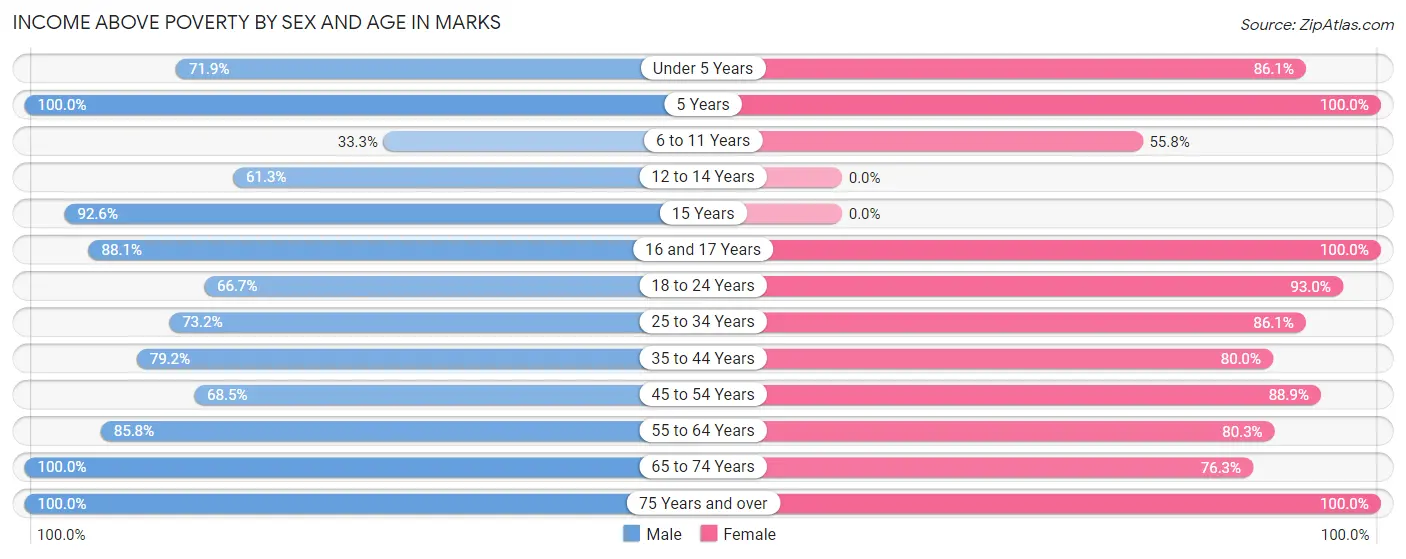
| Age Bracket | Male | Female |
| Under 5 Years | 23 (71.9%) | 31 (86.1%) |
| 5 Years | 6 (100.0%) | 12 (100.0%) |
| 6 to 11 Years | 20 (33.3%) | 24 (55.8%) |
| 12 to 14 Years | 19 (61.3%) | 0 (0.0%) |
| 15 Years | 25 (92.6%) | 0 (0.0%) |
| 16 and 17 Years | 37 (88.1%) | 28 (100.0%) |
| 18 to 24 Years | 22 (66.7%) | 132 (93.0%) |
| 25 to 34 Years | 79 (73.2%) | 68 (86.1%) |
| 35 to 44 Years | 19 (79.2%) | 76 (80.0%) |
| 45 to 54 Years | 37 (68.5%) | 136 (88.9%) |
| 55 to 64 Years | 97 (85.8%) | 110 (80.3%) |
| 65 to 74 Years | 77 (100.0%) | 74 (76.3%) |
| 75 Years and over | 40 (100.0%) | 37 (100.0%) |
| Total | 501 (77.4%) | 728 (84.2%) |
Income Below Poverty Among Married-Couple Families in Marks
The poverty statistics for married-couple families in Marks show that 6.2% or 9 of the total 144 families live below the poverty line. Families with 3 or 4 children have the highest poverty rate of 100.0%, comprising of 7 families. On the other hand, families with 1 or 2 children have the lowest poverty rate of 0.0%, which includes 0 families.
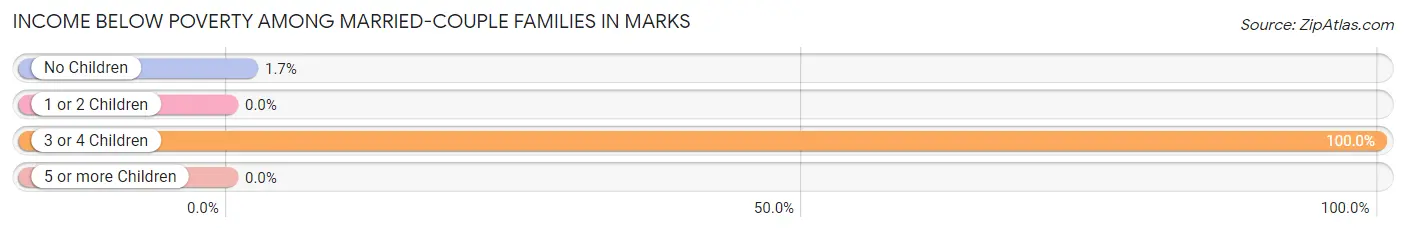
| Children | Above Poverty | Below Poverty |
| No Children | 113 (98.3%) | 2 (1.7%) |
| 1 or 2 Children | 22 (100.0%) | 0 (0.0%) |
| 3 or 4 Children | 0 (0.0%) | 7 (100.0%) |
| 5 or more Children | 0 (0.0%) | 0 (0.0%) |
| Total | 135 (93.8%) | 9 (6.2%) |
Income Below Poverty Among Single-Parent Households in Marks
According to the poverty data in Marks, 14.3% or 2 single-father households and 5.3% or 11 single-mother households are living below the poverty line. Among single-father households, those with 3 or 4 children have the highest poverty rate, with 2 households (100.0%) experiencing poverty. Likewise, among single-mother households, those with 5 or more children have the highest poverty rate, with 4 households (100.0%) falling below the poverty line.
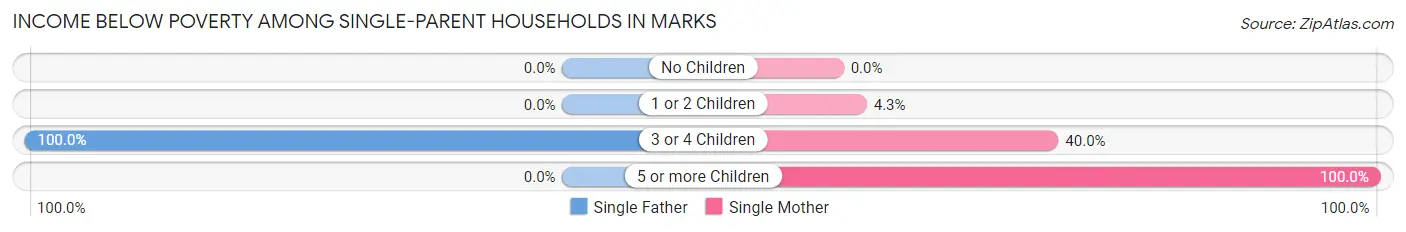
| Children | Single Father | Single Mother |
| No Children | 0 (0.0%) | 0 (0.0%) |
| 1 or 2 Children | 0 (0.0%) | 5 (4.3%) |
| 3 or 4 Children | 2 (100.0%) | 2 (40.0%) |
| 5 or more Children | 0 (0.0%) | 4 (100.0%) |
| Total | 2 (14.3%) | 11 (5.3%) |
Income Below Poverty Among Married-Couple vs Single-Parent Households in Marks
The poverty data for Marks shows that 9 of the married-couple family households (6.2%) and 13 of the single-parent households (5.9%) are living below the poverty level. Within the married-couple family households, those with 3 or 4 children have the highest poverty rate, with 7 households (100.0%) falling below the poverty line. Among the single-parent households, those with 5 or more children have the highest poverty rate, with 4 household (100.0%) living below poverty.
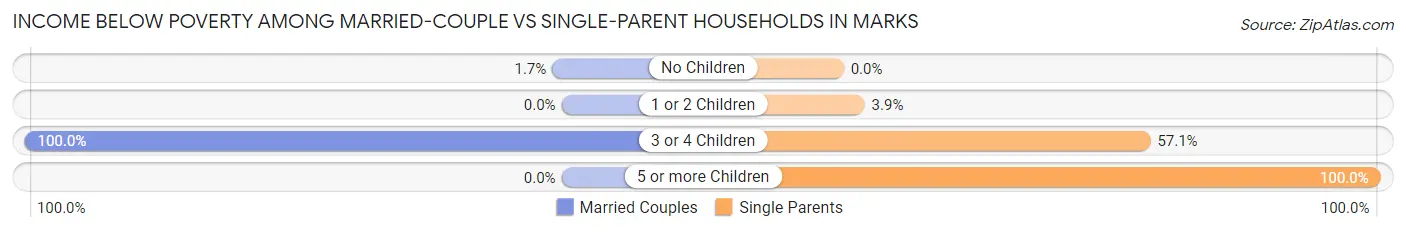
| Children | Married-Couple Families | Single-Parent Households |
| No Children | 2 (1.7%) | 0 (0.0%) |
| 1 or 2 Children | 0 (0.0%) | 5 (3.9%) |
| 3 or 4 Children | 7 (100.0%) | 4 (57.1%) |
| 5 or more Children | 0 (0.0%) | 4 (100.0%) |
| Total | 9 (6.2%) | 13 (5.9%) |
Race in Marks
The most populous races in Marks are Black / African American (1,206 | 73.9%), White / Caucasian (379 | 23.2%), and Two or more Races (33 | 2.0%).
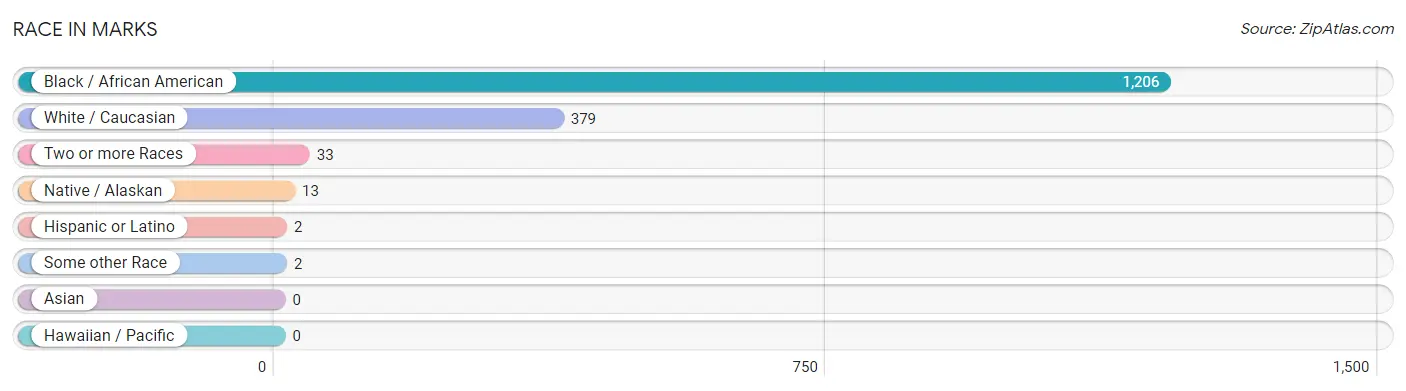
| Race | # Population | % Population |
| Asian | 0 | 0.0% |
| Black / African American | 1,206 | 73.9% |
| Hawaiian / Pacific | 0 | 0.0% |
| Hispanic or Latino | 2 | 0.1% |
| Native / Alaskan | 13 | 0.8% |
| White / Caucasian | 379 | 23.2% |
| Two or more Races | 33 | 2.0% |
| Some other Race | 2 | 0.1% |
| Total | 1,633 | 100.0% |
Ancestry in Marks
The most populous ancestries reported in Marks are English (148 | 9.1%), Irish (76 | 4.6%), American (31 | 1.9%), German (24 | 1.5%), and Scotch-Irish (22 | 1.3%), together accounting for 18.4% of all Marks residents.
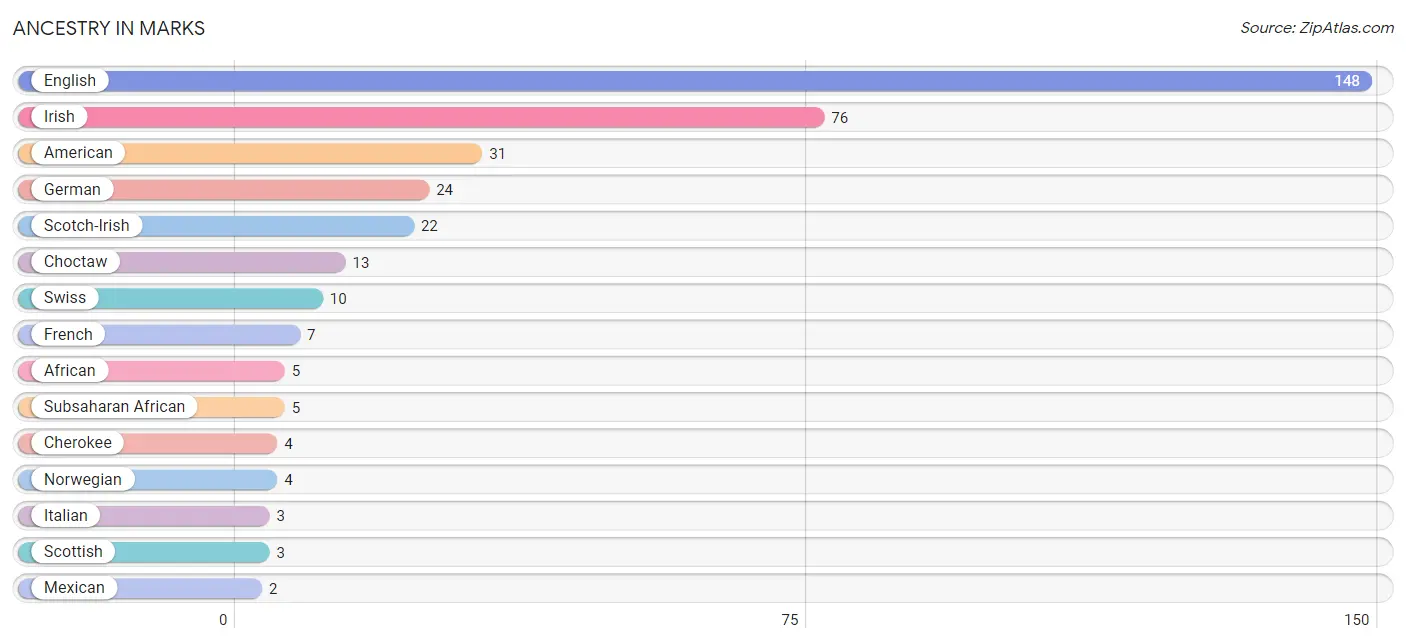
| Ancestry | # Population | % Population |
| African | 5 | 0.3% |
| American | 31 | 1.9% |
| Cherokee | 4 | 0.2% |
| Choctaw | 13 | 0.8% |
| English | 148 | 9.1% |
| French | 7 | 0.4% |
| German | 24 | 1.5% |
| Irish | 76 | 4.6% |
| Italian | 3 | 0.2% |
| Korean | 1 | 0.1% |
| Mexican | 2 | 0.1% |
| Norwegian | 4 | 0.2% |
| Scotch-Irish | 22 | 1.3% |
| Scottish | 3 | 0.2% |
| Subsaharan African | 5 | 0.3% |
| Swiss | 10 | 0.6% | View All 16 Rows |
Immigrants in Marks
The most numerous immigrant groups reported in Marks came from Central America (2 | 0.1%), Latin America (2 | 0.1%), and Mexico (2 | 0.1%), together accounting for 0.4% of all Marks residents.
| Immigration Origin | # Population | % Population |
| Central America | 2 | 0.1% |
| Latin America | 2 | 0.1% |
| Mexico | 2 | 0.1% | View All 3 Rows |
Sex and Age in Marks
Sex and Age in Marks
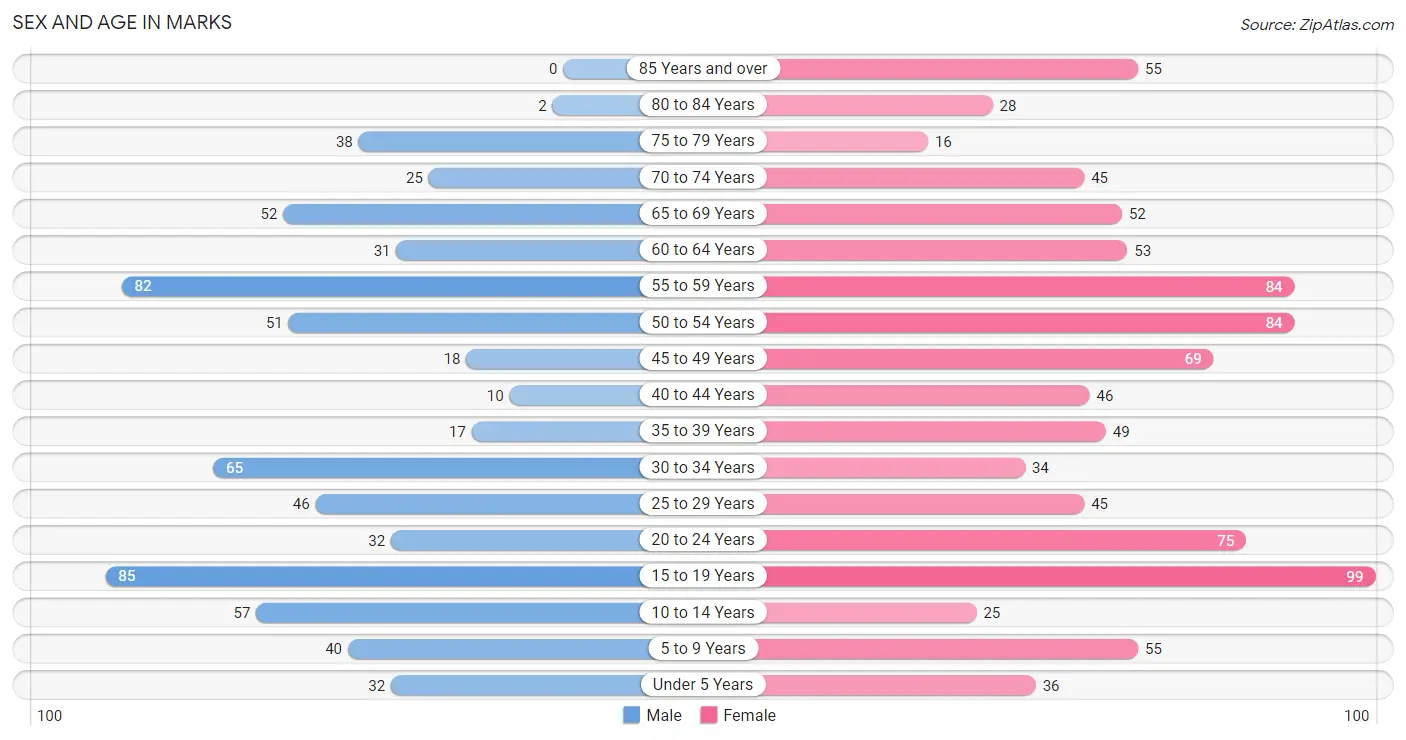
The most populous age groups in Marks are 15 to 19 Years (85 | 12.4%) for men and 15 to 19 Years (99 | 10.4%) for women.
| Age Bracket | Male | Female |
| Under 5 Years | 32 (4.7%) | 36 (3.8%) |
| 5 to 9 Years | 40 (5.9%) | 55 (5.8%) |
| 10 to 14 Years | 57 (8.4%) | 25 (2.6%) |
| 15 to 19 Years | 85 (12.4%) | 99 (10.4%) |
| 20 to 24 Years | 32 (4.7%) | 75 (7.9%) |
| 25 to 29 Years | 46 (6.7%) | 45 (4.7%) |
| 30 to 34 Years | 65 (9.5%) | 34 (3.6%) |
| 35 to 39 Years | 17 (2.5%) | 49 (5.2%) |
| 40 to 44 Years | 10 (1.5%) | 46 (4.8%) |
| 45 to 49 Years | 18 (2.6%) | 69 (7.3%) |
| 50 to 54 Years | 51 (7.5%) | 84 (8.8%) |
| 55 to 59 Years | 82 (12.0%) | 84 (8.8%) |
| 60 to 64 Years | 31 (4.5%) | 53 (5.6%) |
| 65 to 69 Years | 52 (7.6%) | 52 (5.5%) |
| 70 to 74 Years | 25 (3.7%) | 45 (4.7%) |
| 75 to 79 Years | 38 (5.6%) | 16 (1.7%) |
| 80 to 84 Years | 2 (0.3%) | 28 (2.9%) |
| 85 Years and over | 0 (0.0%) | 55 (5.8%) |
| Total | 683 (100.0%) | 950 (100.0%) |
Families and Households in Marks
Median Family Size in Marks
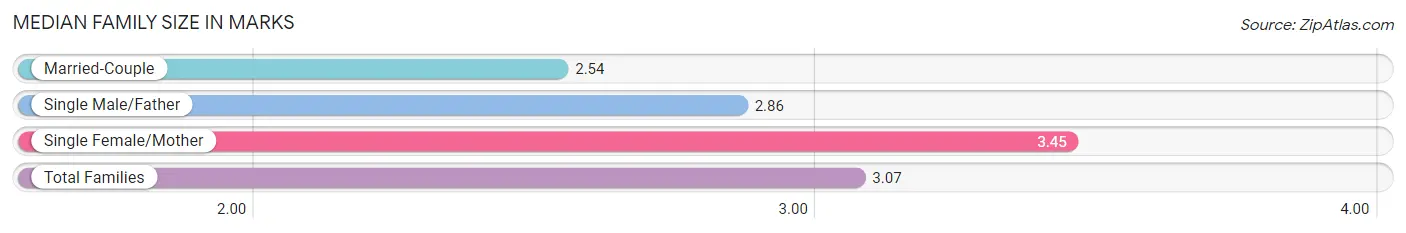
The median family size in Marks is 3.07 persons per family, with single female/mother families (207 | 56.7%) accounting for the largest median family size of 3.45 persons per family. On the other hand, married-couple families (144 | 39.5%) represent the smallest median family size with 2.54 persons per family.
| Family Type | # Families | Family Size |
| Married-Couple | 144 (39.5%) | 2.54 |
| Single Male/Father | 14 (3.8%) | 2.86 |
| Single Female/Mother | 207 (56.7%) | 3.45 |
| Total Families | 365 (100.0%) | 3.07 |
Median Household Size in Marks
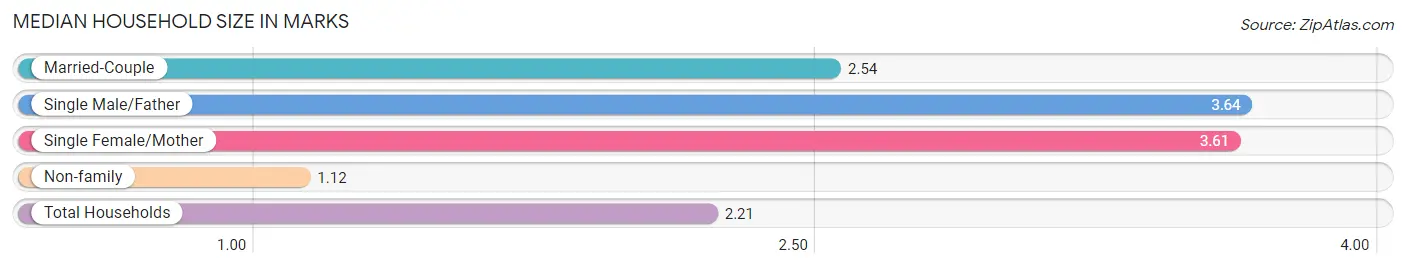
The median household size in Marks is 2.21 persons per household, with single male/father households (14 | 2.0%) accounting for the largest median household size of 3.64 persons per household. non-family households (331 | 47.6%) represent the smallest median household size with 1.12 persons per household.
| Household Type | # Households | Household Size |
| Married-Couple | 144 (20.7%) | 2.54 |
| Single Male/Father | 14 (2.0%) | 3.64 |
| Single Female/Mother | 207 (29.7%) | 3.61 |
| Non-family | 331 (47.6%) | 1.12 |
| Total Households | 696 (100.0%) | 2.21 |
Household Size by Marriage Status in Marks
Out of a total of 696 households in Marks, 365 (52.4%) are family households, while 331 (47.6%) are nonfamily households. The most numerous type of family households are 2-person households, comprising 156, and the most common type of nonfamily households are 1-person households, comprising 291.
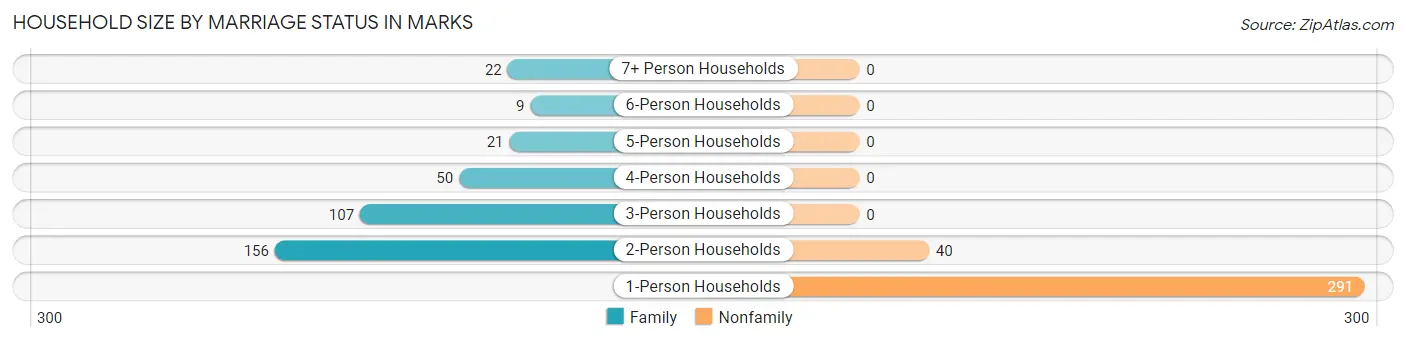
| Household Size | Family Households | Nonfamily Households |
| 1-Person Households | - | 291 (41.8%) |
| 2-Person Households | 156 (22.4%) | 40 (5.8%) |
| 3-Person Households | 107 (15.4%) | 0 (0.0%) |
| 4-Person Households | 50 (7.2%) | 0 (0.0%) |
| 5-Person Households | 21 (3.0%) | 0 (0.0%) |
| 6-Person Households | 9 (1.3%) | 0 (0.0%) |
| 7+ Person Households | 22 (3.2%) | 0 (0.0%) |
| Total | 365 (52.4%) | 331 (47.6%) |
Female Fertility in Marks
Fertility by Age in Marks
Average fertility rate in Marks is 7.0 births per 1,000 women. Women in the age bracket of 20 to 34 years have the highest fertility rate with 19.0 births per 1,000 women. Women in the age bracket of 20 to 34 years acount for 100.0% of all women with births.
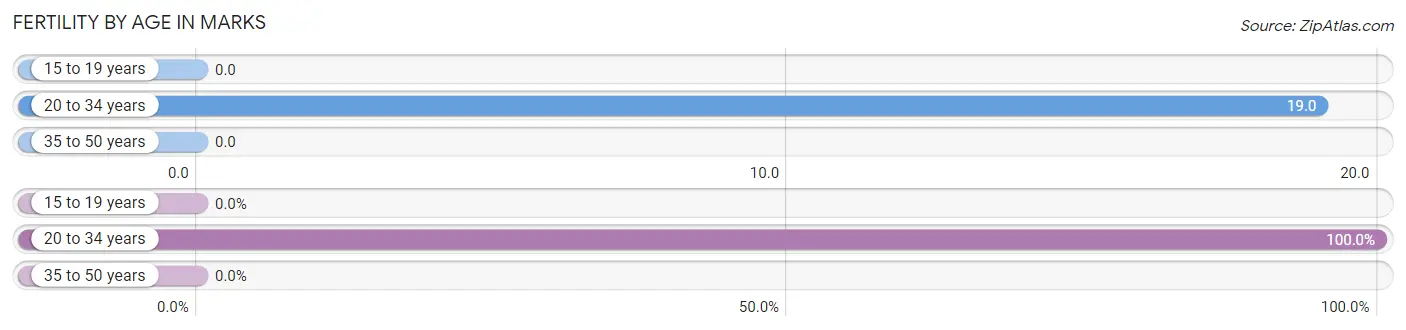
| Age Bracket | Women with Births | Births / 1,000 Women |
| 15 to 19 years | 0 (0.0%) | 0.0 |
| 20 to 34 years | 3 (100.0%) | 19.0 |
| 35 to 50 years | 0 (0.0%) | 0.0 |
| Total | 3 (100.0%) | 7.0 |
Fertility by Age by Marriage Status in Marks
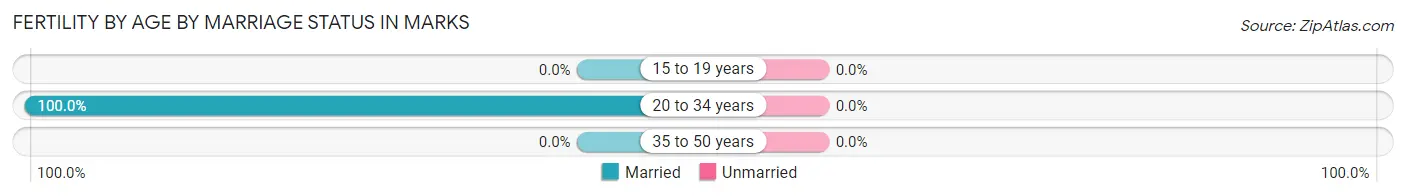
| Age Bracket | Married | Unmarried |
| 15 to 19 years | 0 (0.0%) | 0 (0.0%) |
| 20 to 34 years | 3 (100.0%) | 0 (0.0%) |
| 35 to 50 years | 0 (0.0%) | 0 (0.0%) |
| Total | 3 (100.0%) | 0 (0.0%) |
Fertility by Education in Marks
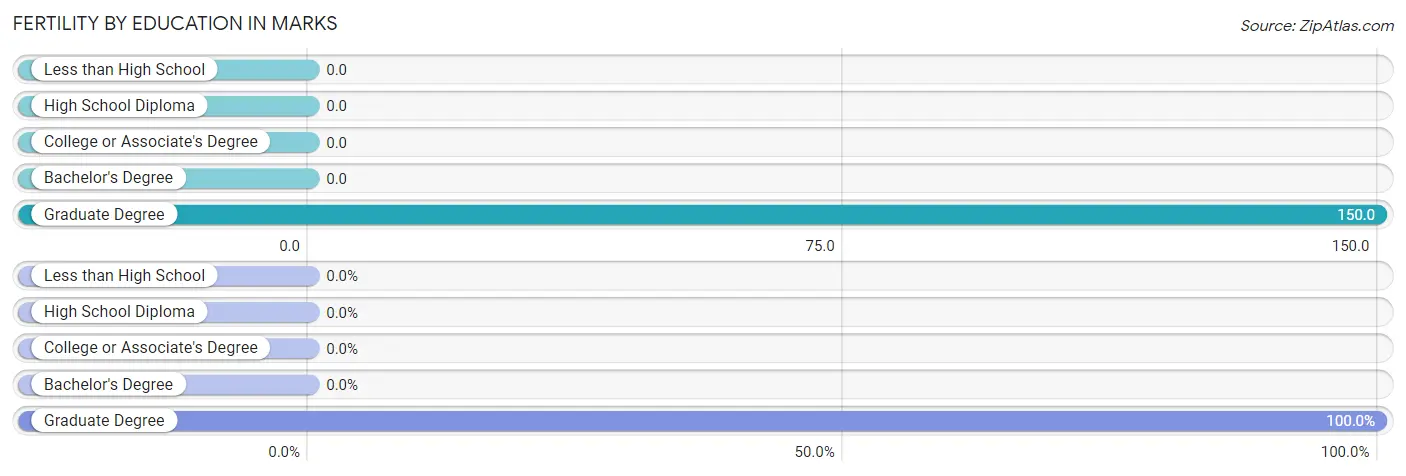
| Educational Attainment | Women with Births | Births / 1,000 Women |
| Less than High School | 0 (0.0%) | 0.0 |
| High School Diploma | 0 (0.0%) | 0.0 |
| College or Associate's Degree | 0 (0.0%) | 0.0 |
| Bachelor's Degree | 0 (0.0%) | 0.0 |
| Graduate Degree | 3 (100.0%) | 150.0 |
| Total | 3 (100.0%) | 7.0 |
Fertility by Education by Marriage Status in Marks
| Educational Attainment | Married | Unmarried |
| Less than High School | 0 (0.0%) | 0 (0.0%) |
| High School Diploma | 0 (0.0%) | 0 (0.0%) |
| College or Associate's Degree | 0 (0.0%) | 0 (0.0%) |
| Bachelor's Degree | 0 (0.0%) | 0 (0.0%) |
| Graduate Degree | 3 (100.0%) | 0 (0.0%) |
| Total | 3 (100.0%) | 0 (0.0%) |
Employment Characteristics in Marks
Employment by Class of Employer in Marks
Among the 557 employed individuals in Marks, private company employees (268 | 48.1%), state government employees (89 | 16.0%), and local government employees (80 | 14.4%) make up the most common classes of employment.
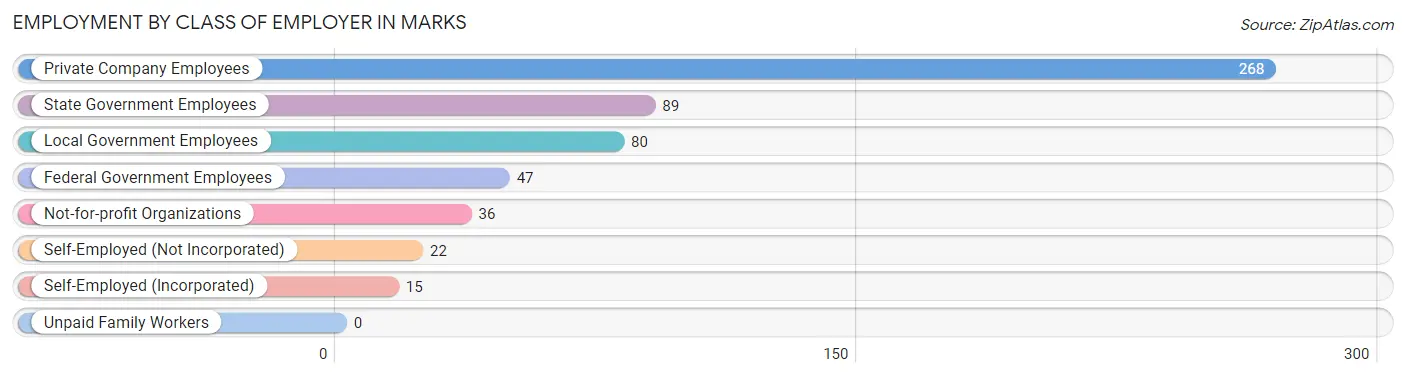
| Employer Class | # Employees | % Employees |
| Private Company Employees | 268 | 48.1% |
| Self-Employed (Incorporated) | 15 | 2.7% |
| Self-Employed (Not Incorporated) | 22 | 4.0% |
| Not-for-profit Organizations | 36 | 6.5% |
| Local Government Employees | 80 | 14.4% |
| State Government Employees | 89 | 16.0% |
| Federal Government Employees | 47 | 8.4% |
| Unpaid Family Workers | 0 | 0.0% |
| Total | 557 | 100.0% |
Employment Status by Age in Marks
According to the labor force statistics for Marks, out of the total population over 16 years of age (1,357), 45.9% or 623 individuals are in the labor force, with 10.6% or 66 of them unemployed. The age group with the highest labor force participation rate is 35 to 44 years, with 71.3% or 87 individuals in the labor force. Within the labor force, the 16 to 19 years age range has the highest percentage of unemployed individuals, with 38.1% or 8 of them being unemployed.
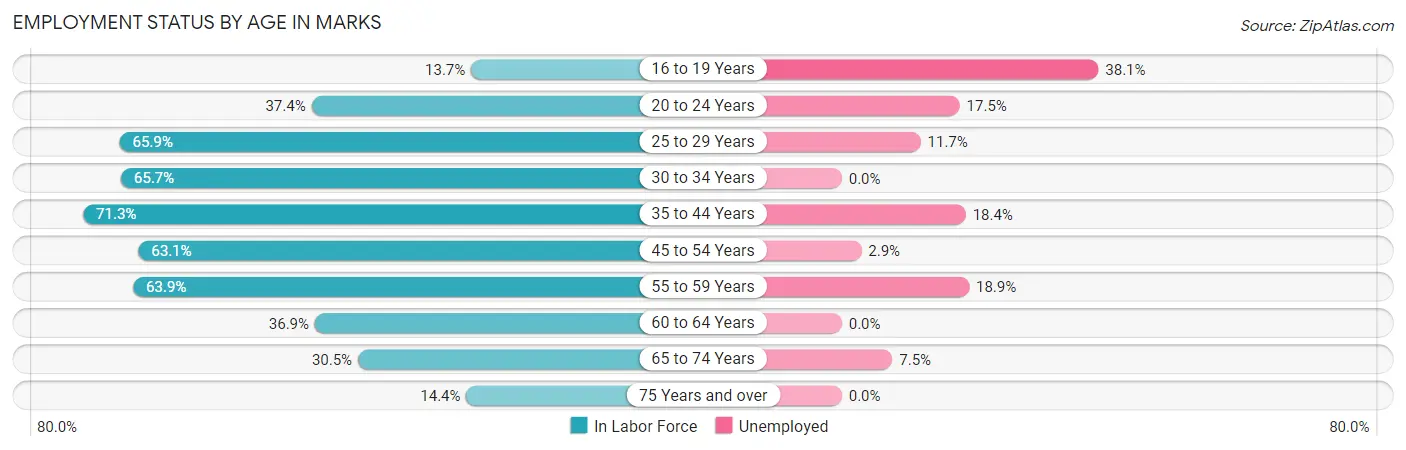
| Age Bracket | In Labor Force | Unemployed |
| 16 to 19 Years | 21 (13.7%) | 8 (38.1%) |
| 20 to 24 Years | 40 (37.4%) | 7 (17.5%) |
| 25 to 29 Years | 60 (65.9%) | 7 (11.7%) |
| 30 to 34 Years | 65 (65.7%) | 0 (0.0%) |
| 35 to 44 Years | 87 (71.3%) | 16 (18.4%) |
| 45 to 54 Years | 140 (63.1%) | 4 (2.9%) |
| 55 to 59 Years | 106 (63.9%) | 20 (18.9%) |
| 60 to 64 Years | 31 (36.9%) | 0 (0.0%) |
| 65 to 74 Years | 53 (30.5%) | 4 (7.5%) |
| 75 Years and over | 20 (14.4%) | 0 (0.0%) |
| Total | 623 (45.9%) | 66 (10.6%) |
Employment Status by Educational Attainment in Marks
According to labor force statistics for Marks, 62.4% of individuals (489) out of the total population between 25 and 64 years of age (784) are in the labor force, with 9.6% or 47 of them being unemployed. The group with the highest labor force participation rate are those with the educational attainment of college / associate degree, with 89.7% or 252 individuals in the labor force. Within the labor force, individuals with college / associate degree education have the highest percentage of unemployment, with 15.1% or 38 of them being unemployed.
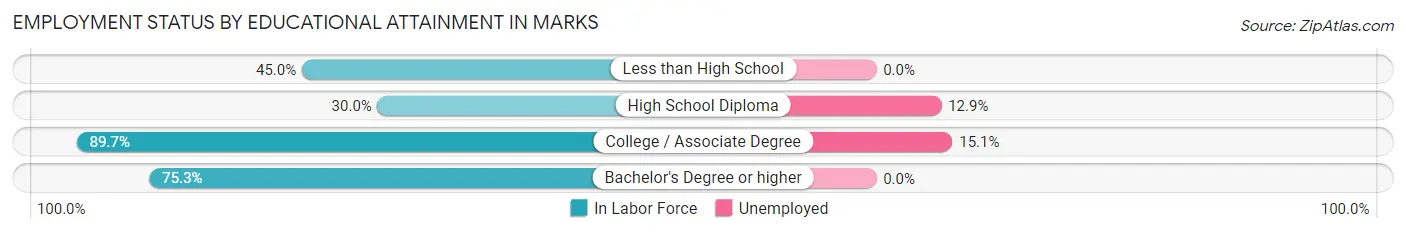
| Educational Attainment | In Labor Force | Unemployed |
| Less than High School | 54 (45.0%) | 0 (0.0%) |
| High School Diploma | 70 (30.0%) | 30 (12.9%) |
| College / Associate Degree | 252 (89.7%) | 42 (15.1%) |
| Bachelor's Degree or higher | 113 (75.3%) | 0 (0.0%) |
| Total | 489 (62.4%) | 75 (9.6%) |
Employment Occupations by Sex in Marks
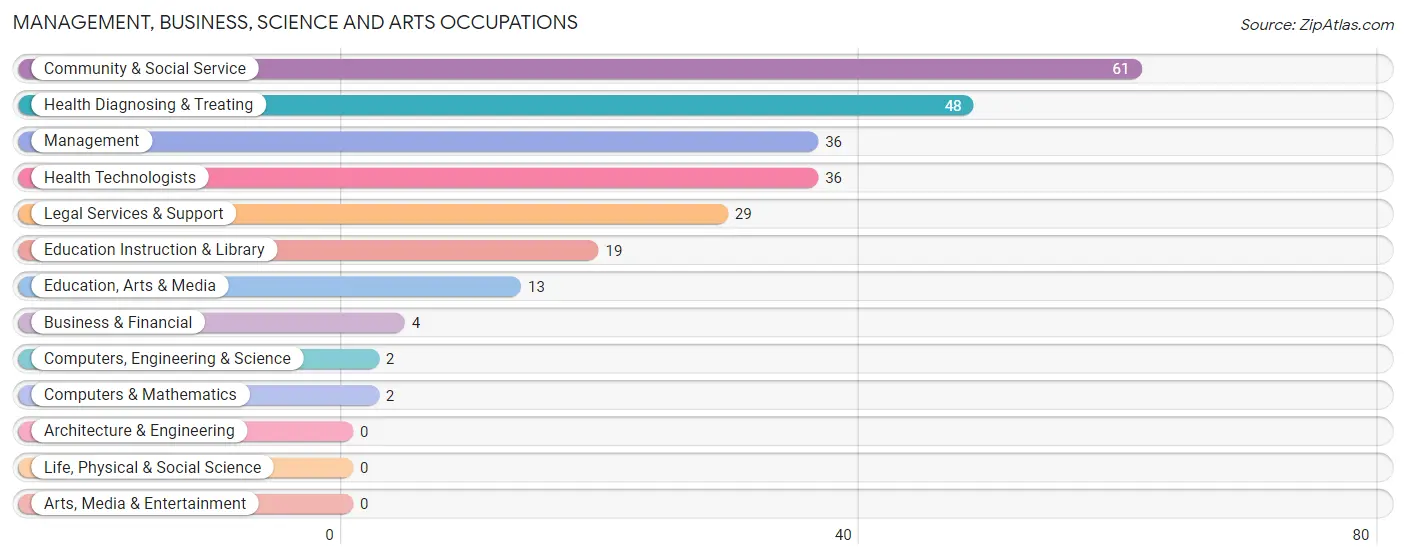
Management, Business, Science and Arts Occupations
The most common Management, Business, Science and Arts occupations in Marks are Community & Social Service (61 | 11.0%), Health Diagnosing & Treating (48 | 8.6%), Management (36 | 6.5%), Health Technologists (36 | 6.5%), and Legal Services & Support (29 | 5.2%).
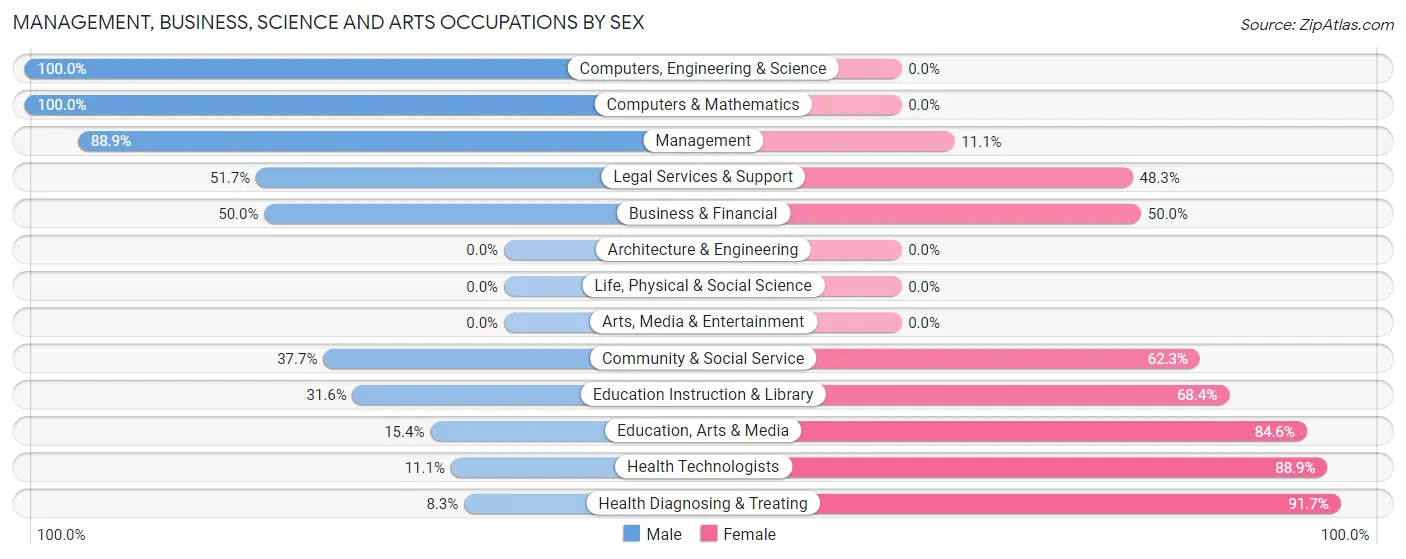
Management, Business, Science and Arts Occupations by Sex
Within the Management, Business, Science and Arts occupations in Marks, the most male-oriented occupations are Computers, Engineering & Science (100.0%), Computers & Mathematics (100.0%), and Management (88.9%), while the most female-oriented occupations are Health Diagnosing & Treating (91.7%), Health Technologists (88.9%), and Education, Arts & Media (84.6%).
| Occupation | Male | Female |
| Management | 32 (88.9%) | 4 (11.1%) |
| Business & Financial | 2 (50.0%) | 2 (50.0%) |
| Computers, Engineering & Science | 2 (100.0%) | 0 (0.0%) |
| Computers & Mathematics | 2 (100.0%) | 0 (0.0%) |
| Architecture & Engineering | 0 (0.0%) | 0 (0.0%) |
| Life, Physical & Social Science | 0 (0.0%) | 0 (0.0%) |
| Community & Social Service | 23 (37.7%) | 38 (62.3%) |
| Education, Arts & Media | 2 (15.4%) | 11 (84.6%) |
| Legal Services & Support | 15 (51.7%) | 14 (48.3%) |
| Education Instruction & Library | 6 (31.6%) | 13 (68.4%) |
| Arts, Media & Entertainment | 0 (0.0%) | 0 (0.0%) |
| Health Diagnosing & Treating | 4 (8.3%) | 44 (91.7%) |
| Health Technologists | 4 (11.1%) | 32 (88.9%) |
| Total (Category) | 63 (41.7%) | 88 (58.3%) |
| Total (Overall) | 200 (35.9%) | 357 (64.1%) |
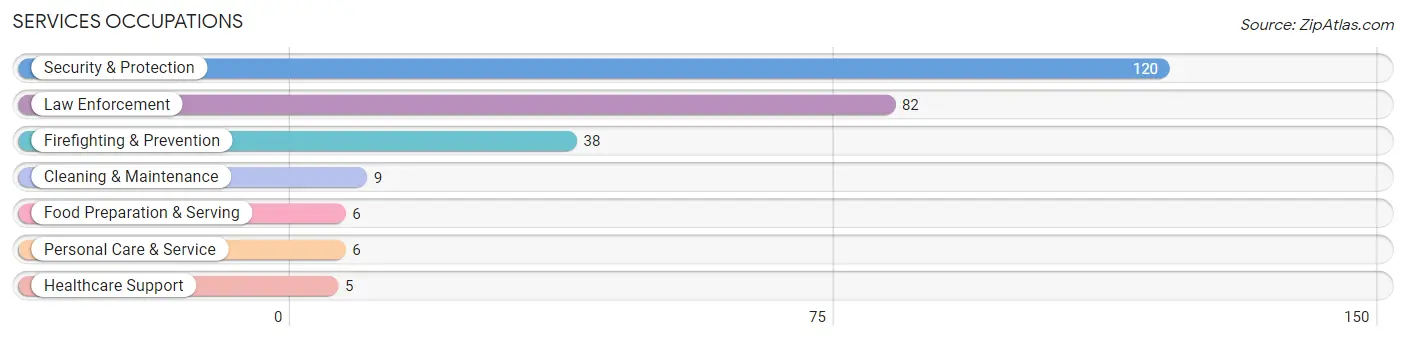
Services Occupations
The most common Services occupations in Marks are Security & Protection (120 | 21.5%), Law Enforcement (82 | 14.7%), Firefighting & Prevention (38 | 6.8%), Cleaning & Maintenance (9 | 1.6%), and Food Preparation & Serving (6 | 1.1%).
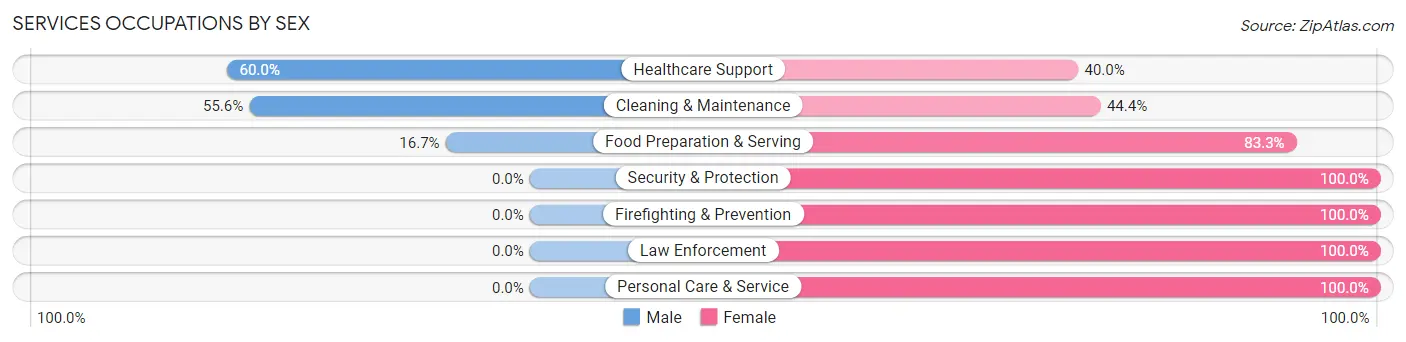
Services Occupations by Sex
Within the Services occupations in Marks, the most male-oriented occupations are Healthcare Support (60.0%), Cleaning & Maintenance (55.6%), and Food Preparation & Serving (16.7%), while the most female-oriented occupations are Security & Protection (100.0%), Firefighting & Prevention (100.0%), and Law Enforcement (100.0%).
| Occupation | Male | Female |
| Healthcare Support | 3 (60.0%) | 2 (40.0%) |
| Security & Protection | 0 (0.0%) | 120 (100.0%) |
| Firefighting & Prevention | 0 (0.0%) | 38 (100.0%) |
| Law Enforcement | 0 (0.0%) | 82 (100.0%) |
| Food Preparation & Serving | 1 (16.7%) | 5 (83.3%) |
| Cleaning & Maintenance | 5 (55.6%) | 4 (44.4%) |
| Personal Care & Service | 0 (0.0%) | 6 (100.0%) |
| Total (Category) | 9 (6.2%) | 137 (93.8%) |
| Total (Overall) | 200 (35.9%) | 357 (64.1%) |
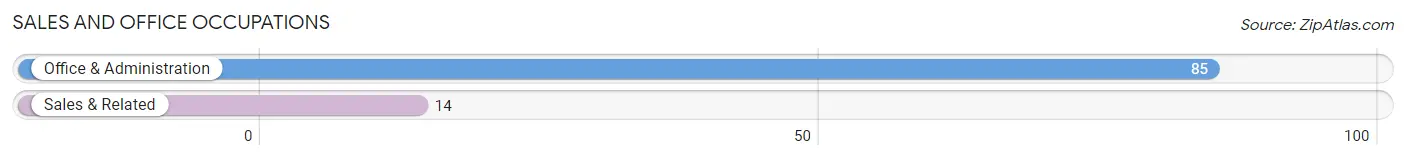
Sales and Office Occupations
The most common Sales and Office occupations in Marks are Office & Administration (85 | 15.3%), and Sales & Related (14 | 2.5%).
Sales and Office Occupations by Sex
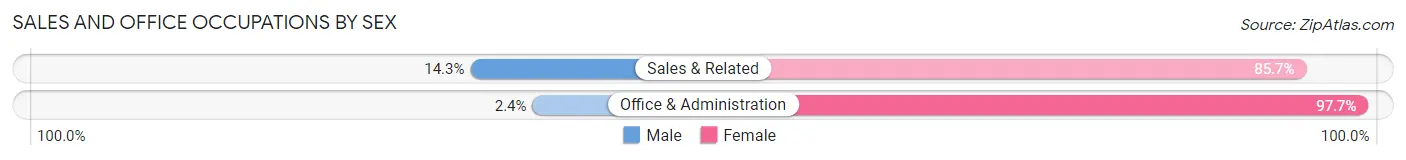
| Occupation | Male | Female |
| Sales & Related | 2 (14.3%) | 12 (85.7%) |
| Office & Administration | 2 (2.4%) | 83 (97.7%) |
| Total (Category) | 4 (4.0%) | 95 (96.0%) |
| Total (Overall) | 200 (35.9%) | 357 (64.1%) |
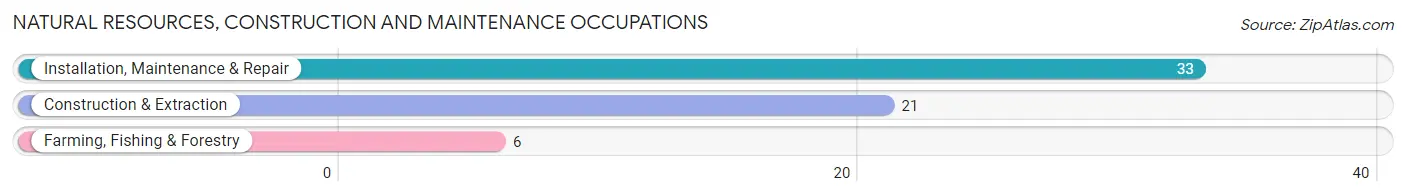
Natural Resources, Construction and Maintenance Occupations
The most common Natural Resources, Construction and Maintenance occupations in Marks are Installation, Maintenance & Repair (33 | 5.9%), Construction & Extraction (21 | 3.8%), and Farming, Fishing & Forestry (6 | 1.1%).
Natural Resources, Construction and Maintenance Occupations by Sex
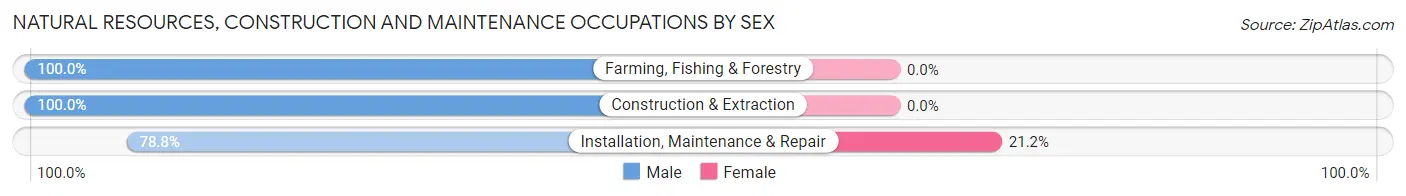
| Occupation | Male | Female |
| Farming, Fishing & Forestry | 6 (100.0%) | 0 (0.0%) |
| Construction & Extraction | 21 (100.0%) | 0 (0.0%) |
| Installation, Maintenance & Repair | 26 (78.8%) | 7 (21.2%) |
| Total (Category) | 53 (88.3%) | 7 (11.7%) |
| Total (Overall) | 200 (35.9%) | 357 (64.1%) |
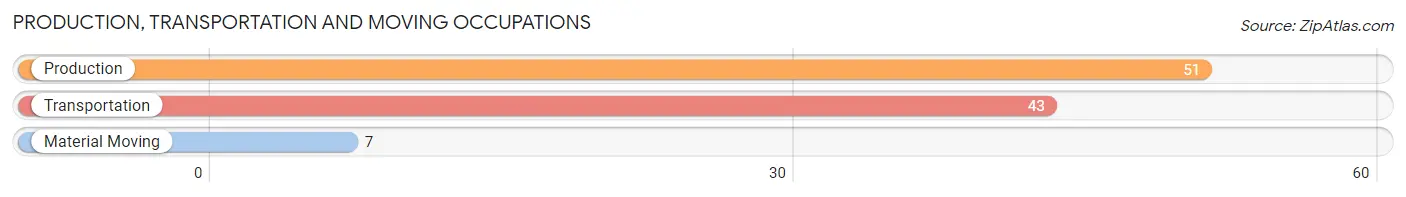
Production, Transportation and Moving Occupations
The most common Production, Transportation and Moving occupations in Marks are Production (51 | 9.2%), Transportation (43 | 7.7%), and Material Moving (7 | 1.3%).
Production, Transportation and Moving Occupations by Sex
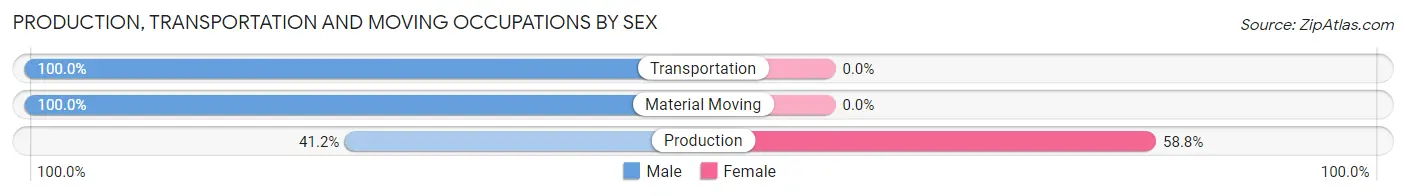
| Occupation | Male | Female |
| Production | 21 (41.2%) | 30 (58.8%) |
| Transportation | 43 (100.0%) | 0 (0.0%) |
| Material Moving | 7 (100.0%) | 0 (0.0%) |
| Total (Category) | 71 (70.3%) | 30 (29.7%) |
| Total (Overall) | 200 (35.9%) | 357 (64.1%) |
Employment Industries by Sex in Marks
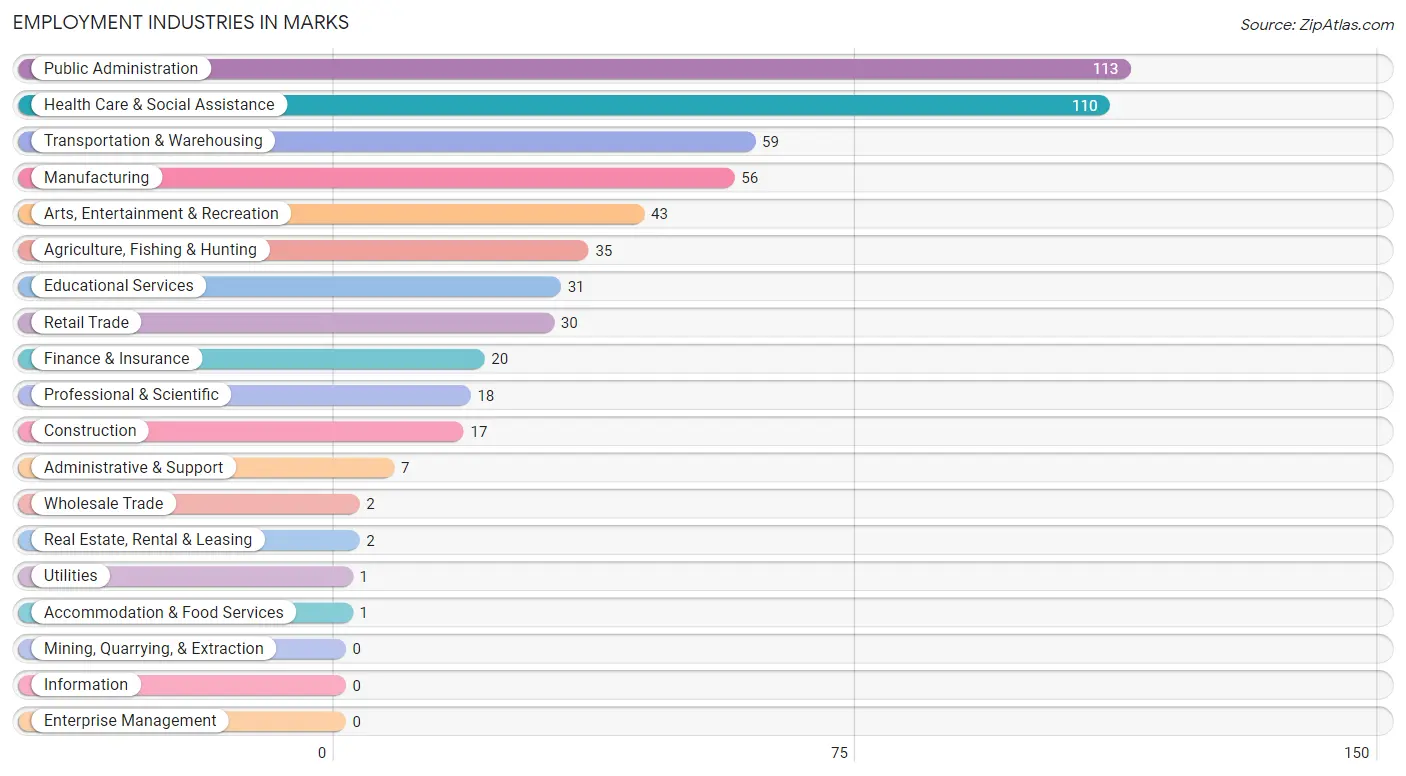
Employment Industries in Marks
The major employment industries in Marks include Public Administration (113 | 20.3%), Health Care & Social Assistance (110 | 19.8%), Transportation & Warehousing (59 | 10.6%), Manufacturing (56 | 10.1%), and Arts, Entertainment & Recreation (43 | 7.7%).
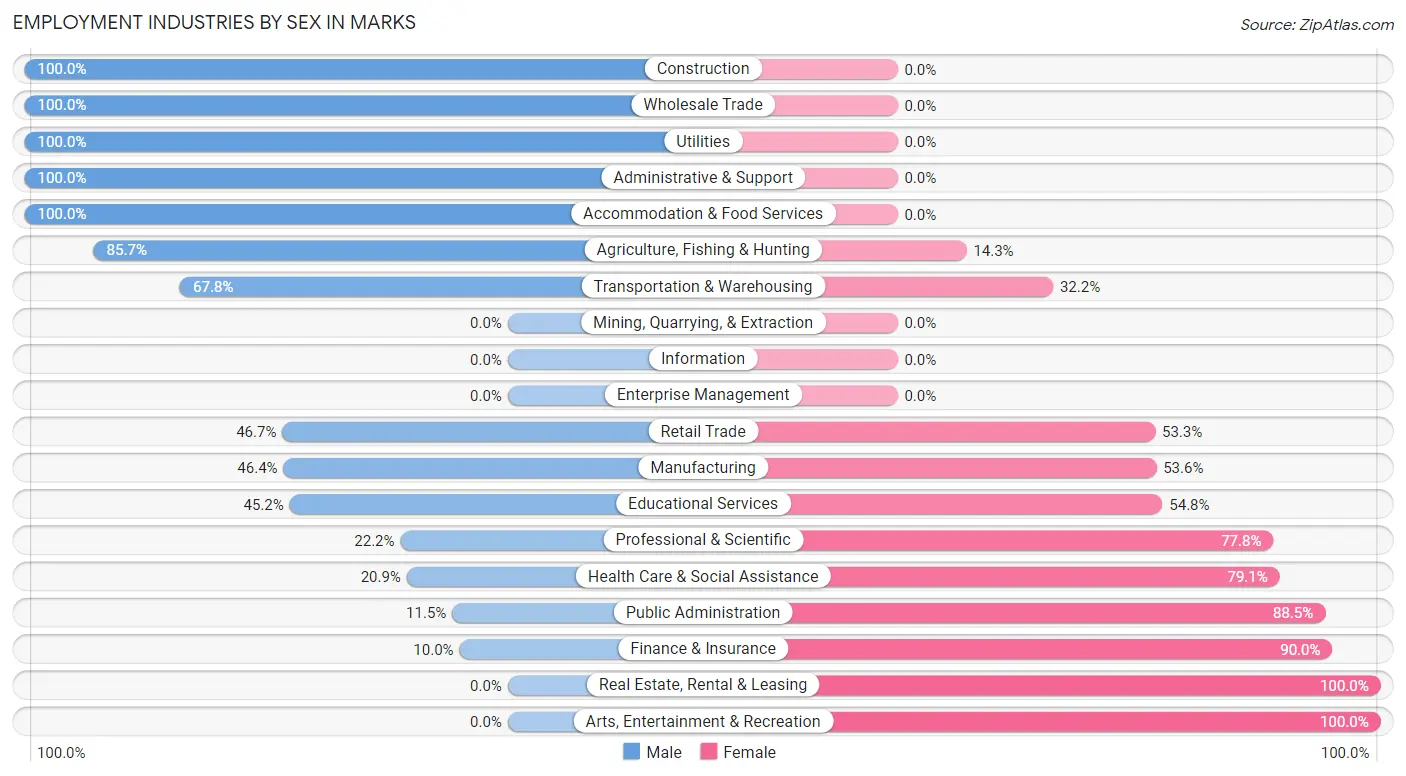
Employment Industries by Sex in Marks
The Marks industries that see more men than women are Construction (100.0%), Wholesale Trade (100.0%), and Utilities (100.0%), whereas the industries that tend to have a higher number of women are Real Estate, Rental & Leasing (100.0%), Arts, Entertainment & Recreation (100.0%), and Finance & Insurance (90.0%).
| Industry | Male | Female |
| Agriculture, Fishing & Hunting | 30 (85.7%) | 5 (14.3%) |
| Mining, Quarrying, & Extraction | 0 (0.0%) | 0 (0.0%) |
| Construction | 17 (100.0%) | 0 (0.0%) |
| Manufacturing | 26 (46.4%) | 30 (53.6%) |
| Wholesale Trade | 2 (100.0%) | 0 (0.0%) |
| Retail Trade | 14 (46.7%) | 16 (53.3%) |
| Transportation & Warehousing | 40 (67.8%) | 19 (32.2%) |
| Utilities | 1 (100.0%) | 0 (0.0%) |
| Information | 0 (0.0%) | 0 (0.0%) |
| Finance & Insurance | 2 (10.0%) | 18 (90.0%) |
| Real Estate, Rental & Leasing | 0 (0.0%) | 2 (100.0%) |
| Professional & Scientific | 4 (22.2%) | 14 (77.8%) |
| Enterprise Management | 0 (0.0%) | 0 (0.0%) |
| Administrative & Support | 7 (100.0%) | 0 (0.0%) |
| Educational Services | 14 (45.2%) | 17 (54.8%) |
| Health Care & Social Assistance | 23 (20.9%) | 87 (79.1%) |
| Arts, Entertainment & Recreation | 0 (0.0%) | 43 (100.0%) |
| Accommodation & Food Services | 1 (100.0%) | 0 (0.0%) |
| Public Administration | 13 (11.5%) | 100 (88.5%) |
| Total | 200 (35.9%) | 357 (64.1%) |
Education in Marks
School Enrollment in Marks
The most common levels of schooling among the 460 students in Marks are high school (139 | 30.2%), college / undergraduate (115 | 25.0%), and elementary school (78 | 17.0%).
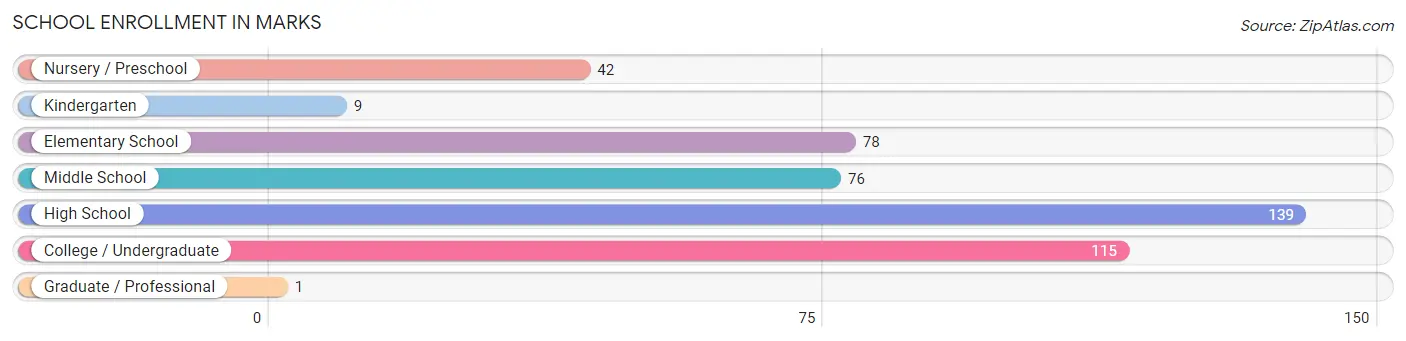
| School Level | # Students | % Students |
| Nursery / Preschool | 42 | 9.1% |
| Kindergarten | 9 | 2.0% |
| Elementary School | 78 | 17.0% |
| Middle School | 76 | 16.5% |
| High School | 139 | 30.2% |
| College / Undergraduate | 115 | 25.0% |
| Graduate / Professional | 1 | 0.2% |
| Total | 460 | 100.0% |
School Enrollment by Age by Funding Source in Marks
Out of a total of 460 students who are enrolled in schools in Marks, 5 (1.1%) attend a private institution, while the remaining 455 (98.9%) are enrolled in public schools. The age group of 35 years and over has the highest likelihood of being enrolled in private schools, with 2 (8.3% in the age bracket) enrolled. Conversely, the age group of 3 to 4 year olds has the lowest likelihood of being enrolled in a private school, with 30 (100.0% in the age bracket) attending a public institution.
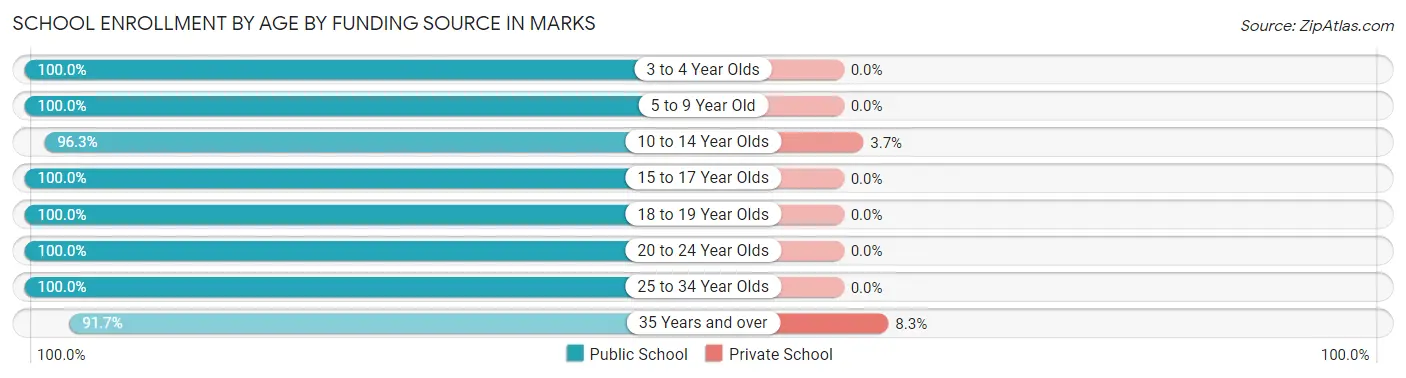
| Age Bracket | Public School | Private School |
| 3 to 4 Year Olds | 30 (100.0%) | 0 (0.0%) |
| 5 to 9 Year Old | 95 (100.0%) | 0 (0.0%) |
| 10 to 14 Year Olds | 79 (96.3%) | 3 (3.7%) |
| 15 to 17 Year Olds | 101 (100.0%) | 0 (0.0%) |
| 18 to 19 Year Olds | 62 (100.0%) | 0 (0.0%) |
| 20 to 24 Year Olds | 53 (100.0%) | 0 (0.0%) |
| 25 to 34 Year Olds | 13 (100.0%) | 0 (0.0%) |
| 35 Years and over | 22 (91.7%) | 2 (8.3%) |
| Total | 455 (98.9%) | 5 (1.1%) |
Educational Attainment by Field of Study in Marks
Science & technology (60 | 24.2%), business (54 | 21.8%), education (48 | 19.4%), arts & humanities (22 | 8.9%), and computers & mathematics (20 | 8.1%) are the most common fields of study among 248 individuals in Marks who have obtained a bachelor's degree or higher.
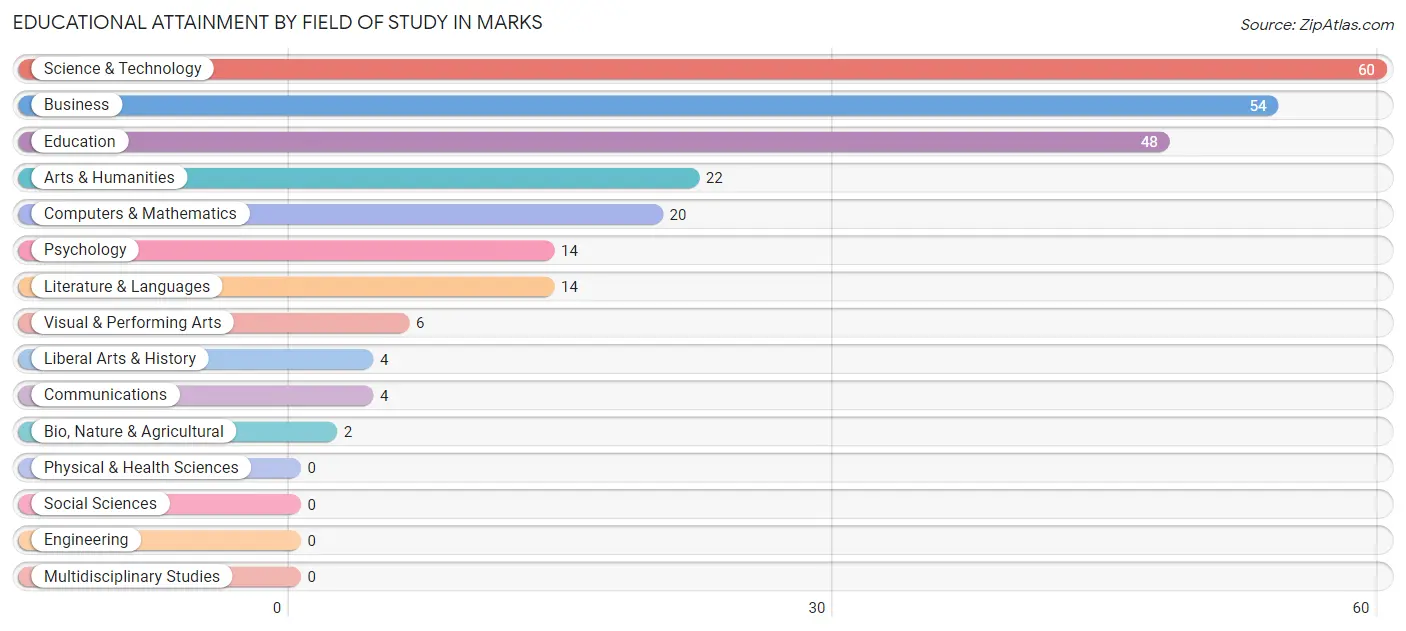
| Field of Study | # Graduates | % Graduates |
| Computers & Mathematics | 20 | 8.1% |
| Bio, Nature & Agricultural | 2 | 0.8% |
| Physical & Health Sciences | 0 | 0.0% |
| Psychology | 14 | 5.7% |
| Social Sciences | 0 | 0.0% |
| Engineering | 0 | 0.0% |
| Multidisciplinary Studies | 0 | 0.0% |
| Science & Technology | 60 | 24.2% |
| Business | 54 | 21.8% |
| Education | 48 | 19.4% |
| Literature & Languages | 14 | 5.7% |
| Liberal Arts & History | 4 | 1.6% |
| Visual & Performing Arts | 6 | 2.4% |
| Communications | 4 | 1.6% |
| Arts & Humanities | 22 | 8.9% |
| Total | 248 | 100.0% |
Transportation & Commute in Marks
Vehicle Availability by Sex in Marks
The most prevalent vehicle ownership categories in Marks are males with 1 vehicle (86, accounting for 43.0%) and females with 1 vehicle (108, making up 24.1%).
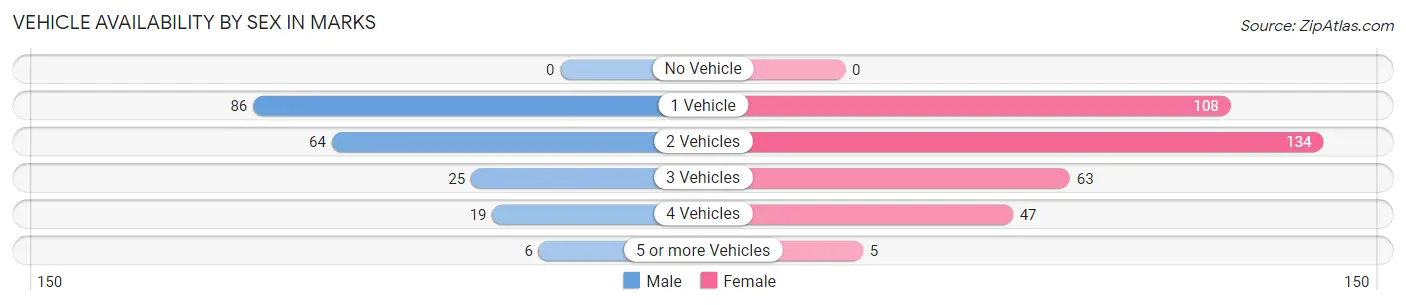
| Vehicles Available | Male | Female |
| No Vehicle | 0 (0.0%) | 0 (0.0%) |
| 1 Vehicle | 86 (43.0%) | 108 (30.2%) |
| 2 Vehicles | 64 (32.0%) | 134 (37.5%) |
| 3 Vehicles | 25 (12.5%) | 63 (17.6%) |
| 4 Vehicles | 19 (9.5%) | 47 (13.2%) |
| 5 or more Vehicles | 6 (3.0%) | 5 (1.4%) |
| Total | 200 (100.0%) | 357 (100.0%) |
Commute Time in Marks
The most frequently occuring commute durations in Marks are 45 to 59 minutes (80 commuters, 14.8%), 60 to 89 minutes (77 commuters, 14.2%), and 10 to 14 minutes (76 commuters, 14.1%).
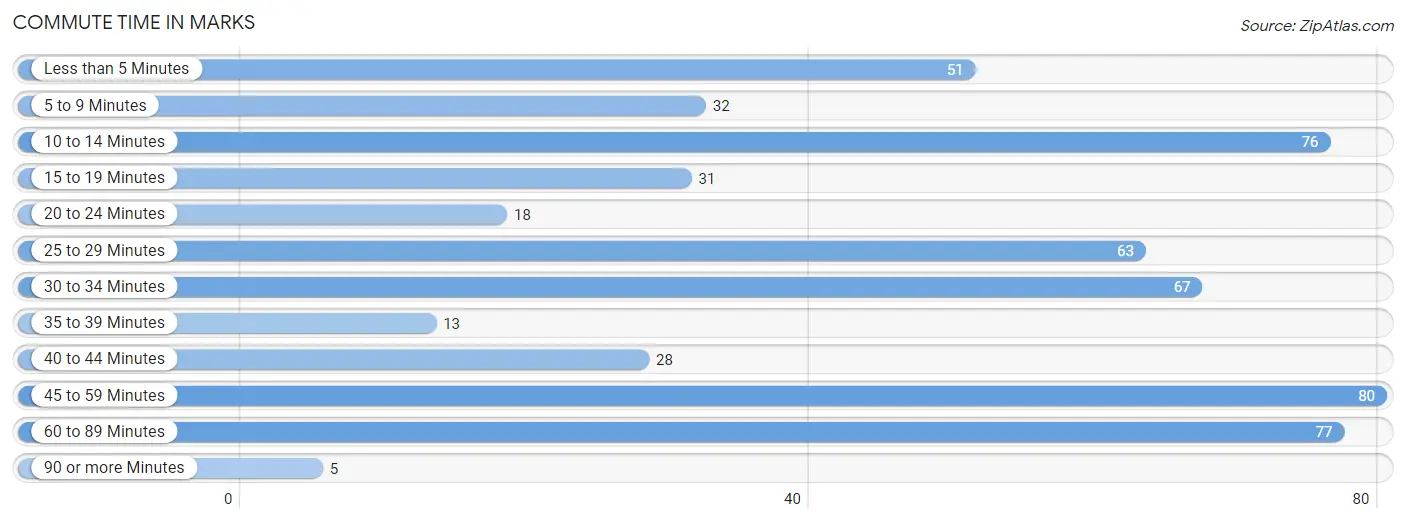
| Commute Time | # Commuters | % Commuters |
| Less than 5 Minutes | 51 | 9.4% |
| 5 to 9 Minutes | 32 | 5.9% |
| 10 to 14 Minutes | 76 | 14.1% |
| 15 to 19 Minutes | 31 | 5.7% |
| 20 to 24 Minutes | 18 | 3.3% |
| 25 to 29 Minutes | 63 | 11.7% |
| 30 to 34 Minutes | 67 | 12.4% |
| 35 to 39 Minutes | 13 | 2.4% |
| 40 to 44 Minutes | 28 | 5.2% |
| 45 to 59 Minutes | 80 | 14.8% |
| 60 to 89 Minutes | 77 | 14.2% |
| 90 or more Minutes | 5 | 0.9% |
Commute Time by Sex in Marks
The most common commute times in Marks are 30 to 34 minutes (37 commuters, 19.1%) for males and 60 to 89 minutes (63 commuters, 18.2%) for females.
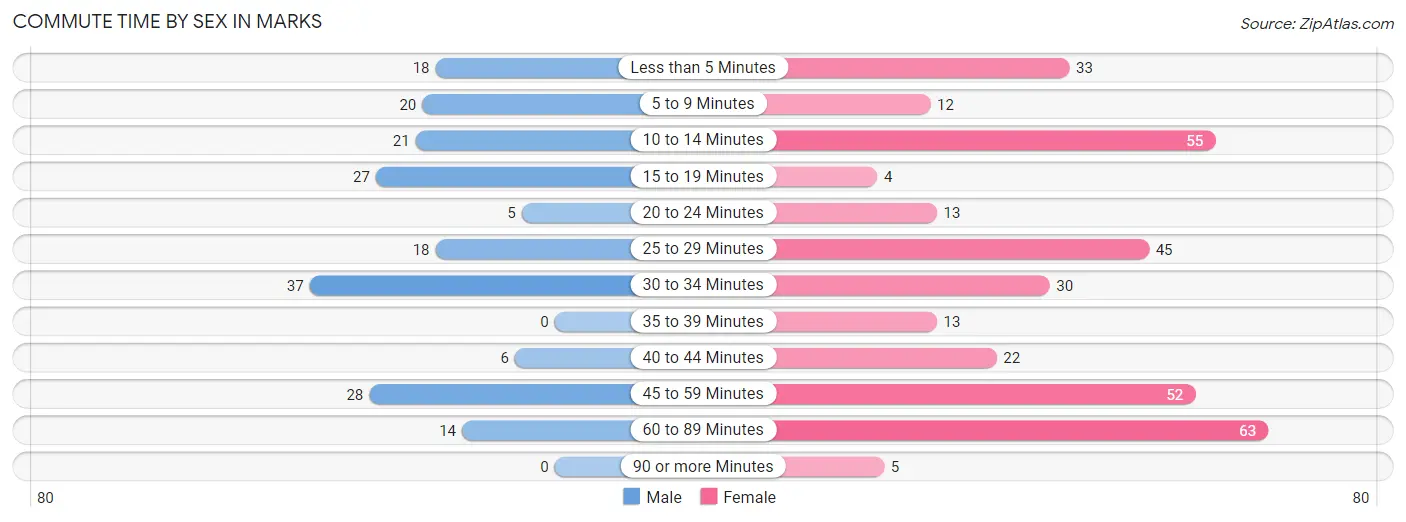
| Commute Time | Male | Female |
| Less than 5 Minutes | 18 (9.3%) | 33 (9.5%) |
| 5 to 9 Minutes | 20 (10.3%) | 12 (3.5%) |
| 10 to 14 Minutes | 21 (10.8%) | 55 (15.9%) |
| 15 to 19 Minutes | 27 (13.9%) | 4 (1.1%) |
| 20 to 24 Minutes | 5 (2.6%) | 13 (3.7%) |
| 25 to 29 Minutes | 18 (9.3%) | 45 (13.0%) |
| 30 to 34 Minutes | 37 (19.1%) | 30 (8.6%) |
| 35 to 39 Minutes | 0 (0.0%) | 13 (3.7%) |
| 40 to 44 Minutes | 6 (3.1%) | 22 (6.3%) |
| 45 to 59 Minutes | 28 (14.4%) | 52 (15.0%) |
| 60 to 89 Minutes | 14 (7.2%) | 63 (18.2%) |
| 90 or more Minutes | 0 (0.0%) | 5 (1.4%) |
Time of Departure to Work by Sex in Marks
The most frequent times of departure to work in Marks are 6:00 AM to 6:29 AM (39, 20.1%) for males and 4:00 PM to 11:59 PM (73, 21.0%) for females.
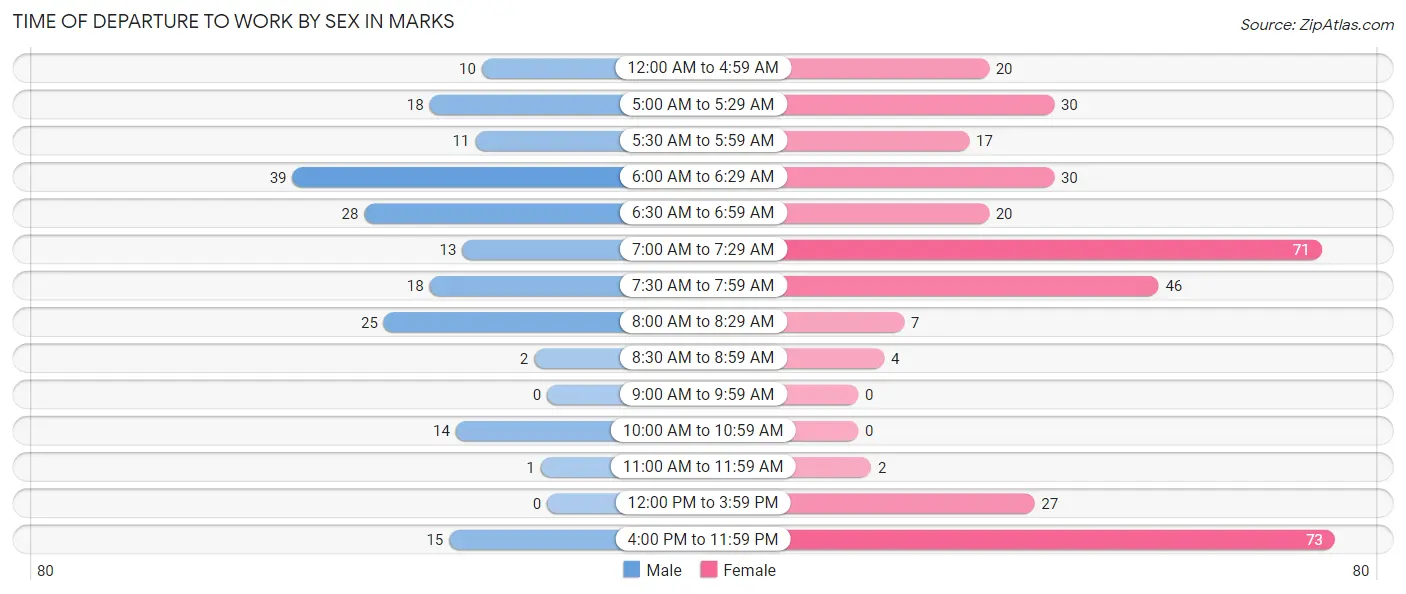
| Time of Departure | Male | Female |
| 12:00 AM to 4:59 AM | 10 (5.1%) | 20 (5.8%) |
| 5:00 AM to 5:29 AM | 18 (9.3%) | 30 (8.6%) |
| 5:30 AM to 5:59 AM | 11 (5.7%) | 17 (4.9%) |
| 6:00 AM to 6:29 AM | 39 (20.1%) | 30 (8.6%) |
| 6:30 AM to 6:59 AM | 28 (14.4%) | 20 (5.8%) |
| 7:00 AM to 7:29 AM | 13 (6.7%) | 71 (20.5%) |
| 7:30 AM to 7:59 AM | 18 (9.3%) | 46 (13.3%) |
| 8:00 AM to 8:29 AM | 25 (12.9%) | 7 (2.0%) |
| 8:30 AM to 8:59 AM | 2 (1.0%) | 4 (1.1%) |
| 9:00 AM to 9:59 AM | 0 (0.0%) | 0 (0.0%) |
| 10:00 AM to 10:59 AM | 14 (7.2%) | 0 (0.0%) |
| 11:00 AM to 11:59 AM | 1 (0.5%) | 2 (0.6%) |
| 12:00 PM to 3:59 PM | 0 (0.0%) | 27 (7.8%) |
| 4:00 PM to 11:59 PM | 15 (7.7%) | 73 (21.0%) |
| Total | 194 (100.0%) | 347 (100.0%) |
Housing Occupancy in Marks
Occupancy by Ownership in Marks
Of the total 696 dwellings in Marks, owner-occupied units account for 458 (65.8%), while renter-occupied units make up 238 (34.2%).
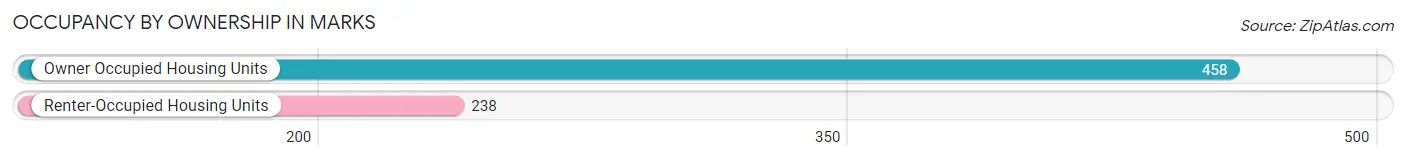
| Occupancy | # Housing Units | % Housing Units |
| Owner Occupied Housing Units | 458 | 65.8% |
| Renter-Occupied Housing Units | 238 | 34.2% |
| Total Occupied Housing Units | 696 | 100.0% |
Occupancy by Household Size in Marks
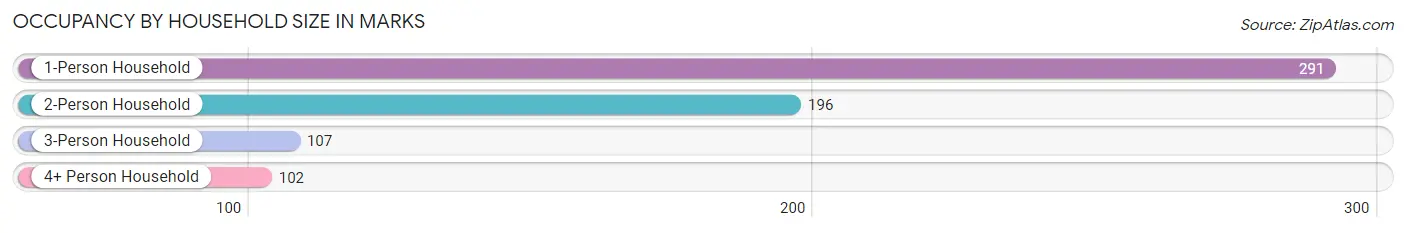
| Household Size | # Housing Units | % Housing Units |
| 1-Person Household | 291 | 41.8% |
| 2-Person Household | 196 | 28.2% |
| 3-Person Household | 107 | 15.4% |
| 4+ Person Household | 102 | 14.7% |
| Total Housing Units | 696 | 100.0% |
Occupancy by Ownership by Household Size in Marks
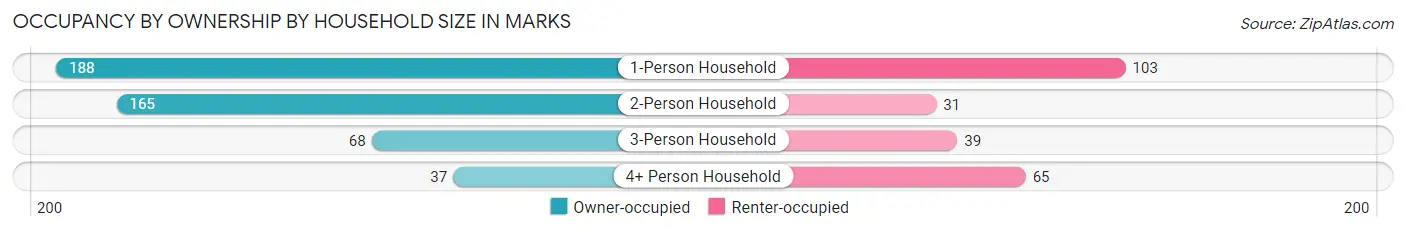
| Household Size | Owner-occupied | Renter-occupied |
| 1-Person Household | 188 (64.6%) | 103 (35.4%) |
| 2-Person Household | 165 (84.2%) | 31 (15.8%) |
| 3-Person Household | 68 (63.5%) | 39 (36.4%) |
| 4+ Person Household | 37 (36.3%) | 65 (63.7%) |
| Total Housing Units | 458 (65.8%) | 238 (34.2%) |
Occupancy by Educational Attainment in Marks
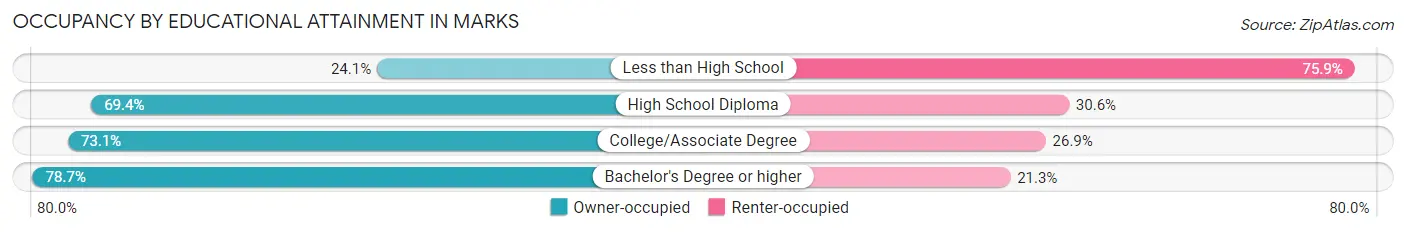
| Household Size | Owner-occupied | Renter-occupied |
| Less than High School | 27 (24.1%) | 85 (75.9%) |
| High School Diploma | 109 (69.4%) | 48 (30.6%) |
| College/Associate Degree | 185 (73.1%) | 68 (26.9%) |
| Bachelor's Degree or higher | 137 (78.7%) | 37 (21.3%) |
Occupancy by Age of Householder in Marks
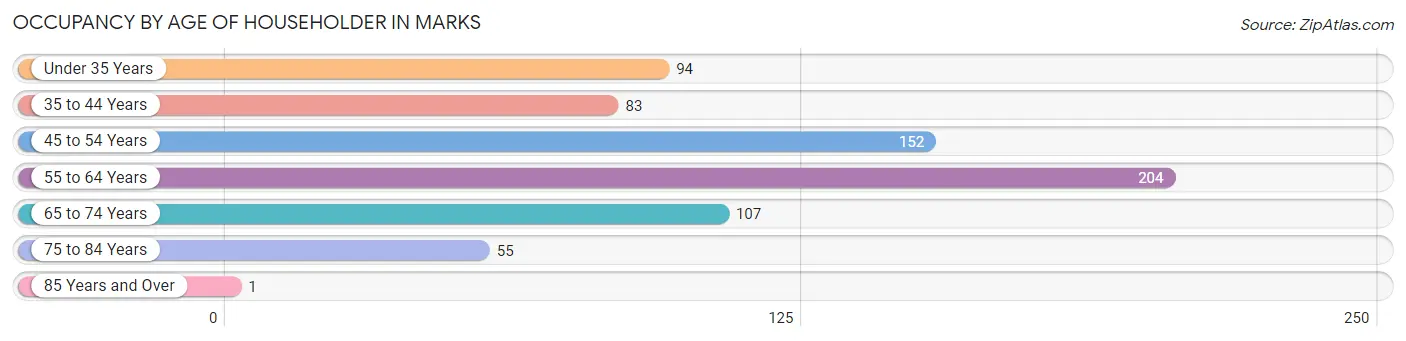
| Age Bracket | # Households | % Households |
| Under 35 Years | 94 | 13.5% |
| 35 to 44 Years | 83 | 11.9% |
| 45 to 54 Years | 152 | 21.8% |
| 55 to 64 Years | 204 | 29.3% |
| 65 to 74 Years | 107 | 15.4% |
| 75 to 84 Years | 55 | 7.9% |
| 85 Years and Over | 1 | 0.1% |
| Total | 696 | 100.0% |
Housing Finances in Marks
Median Income by Occupancy in Marks
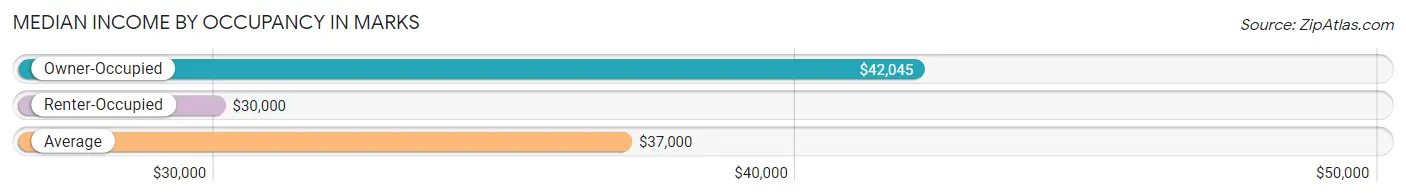
| Occupancy Type | # Households | Median Income |
| Owner-Occupied | 458 (65.8%) | $42,045 |
| Renter-Occupied | 238 (34.2%) | $30,000 |
| Average | 696 (100.0%) | $37,000 |
Occupancy by Householder Income Bracket in Marks
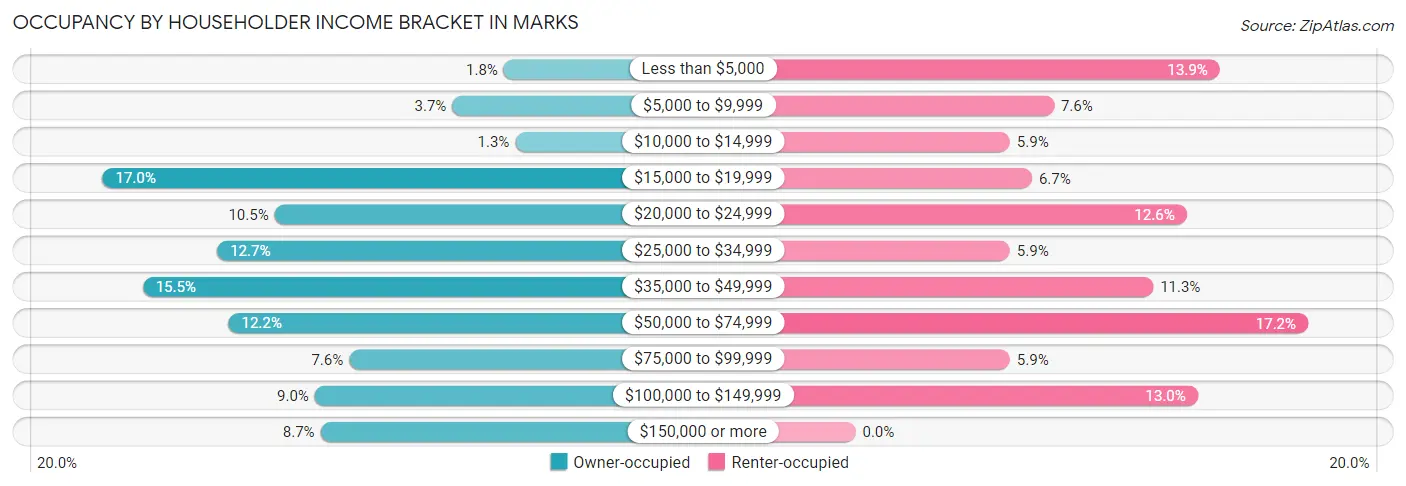
| Income Bracket | Owner-occupied | Renter-occupied |
| Less than $5,000 | 8 (1.8%) | 33 (13.9%) |
| $5,000 to $9,999 | 17 (3.7%) | 18 (7.6%) |
| $10,000 to $14,999 | 6 (1.3%) | 14 (5.9%) |
| $15,000 to $19,999 | 78 (17.0%) | 16 (6.7%) |
| $20,000 to $24,999 | 48 (10.5%) | 30 (12.6%) |
| $25,000 to $34,999 | 58 (12.7%) | 14 (5.9%) |
| $35,000 to $49,999 | 71 (15.5%) | 27 (11.3%) |
| $50,000 to $74,999 | 56 (12.2%) | 41 (17.2%) |
| $75,000 to $99,999 | 35 (7.6%) | 14 (5.9%) |
| $100,000 to $149,999 | 41 (8.9%) | 31 (13.0%) |
| $150,000 or more | 40 (8.7%) | 0 (0.0%) |
| Total | 458 (100.0%) | 238 (100.0%) |
Monthly Housing Cost Tiers in Marks
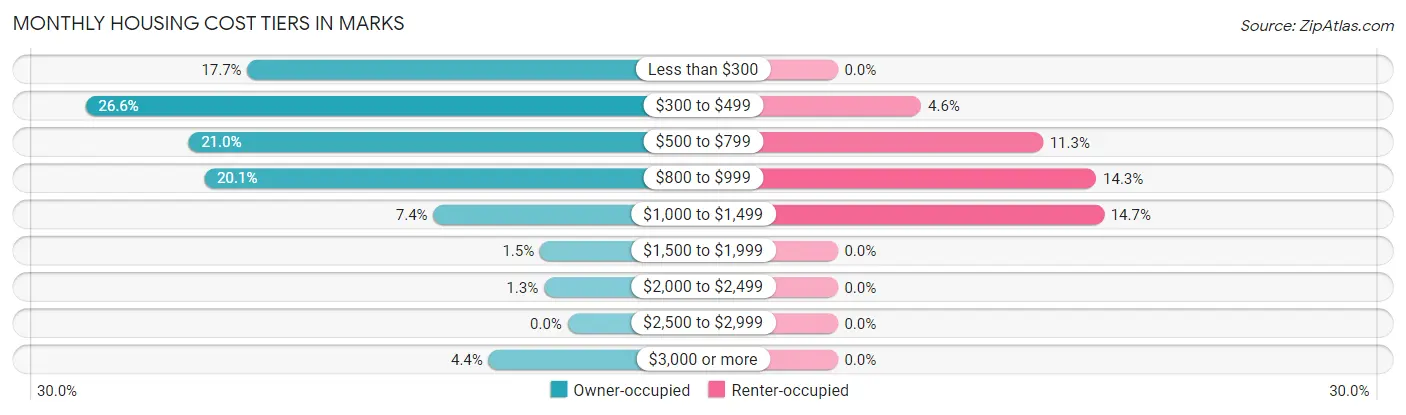
| Monthly Cost | Owner-occupied | Renter-occupied |
| Less than $300 | 81 (17.7%) | 0 (0.0%) |
| $300 to $499 | 122 (26.6%) | 11 (4.6%) |
| $500 to $799 | 96 (21.0%) | 27 (11.3%) |
| $800 to $999 | 92 (20.1%) | 34 (14.3%) |
| $1,000 to $1,499 | 34 (7.4%) | 35 (14.7%) |
| $1,500 to $1,999 | 7 (1.5%) | 0 (0.0%) |
| $2,000 to $2,499 | 6 (1.3%) | 0 (0.0%) |
| $2,500 to $2,999 | 0 (0.0%) | 0 (0.0%) |
| $3,000 or more | 20 (4.4%) | 0 (0.0%) |
| Total | 458 (100.0%) | 238 (100.0%) |
Physical Housing Characteristics in Marks
Housing Structures in Marks
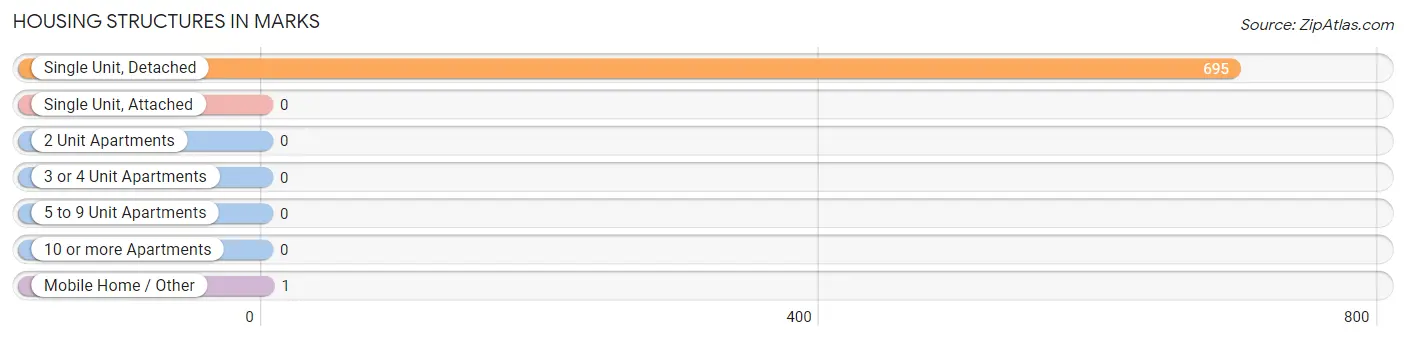
| Structure Type | # Housing Units | % Housing Units |
| Single Unit, Detached | 695 | 99.9% |
| Single Unit, Attached | 0 | 0.0% |
| 2 Unit Apartments | 0 | 0.0% |
| 3 or 4 Unit Apartments | 0 | 0.0% |
| 5 to 9 Unit Apartments | 0 | 0.0% |
| 10 or more Apartments | 0 | 0.0% |
| Mobile Home / Other | 1 | 0.1% |
| Total | 696 | 100.0% |
Housing Structures by Occupancy in Marks
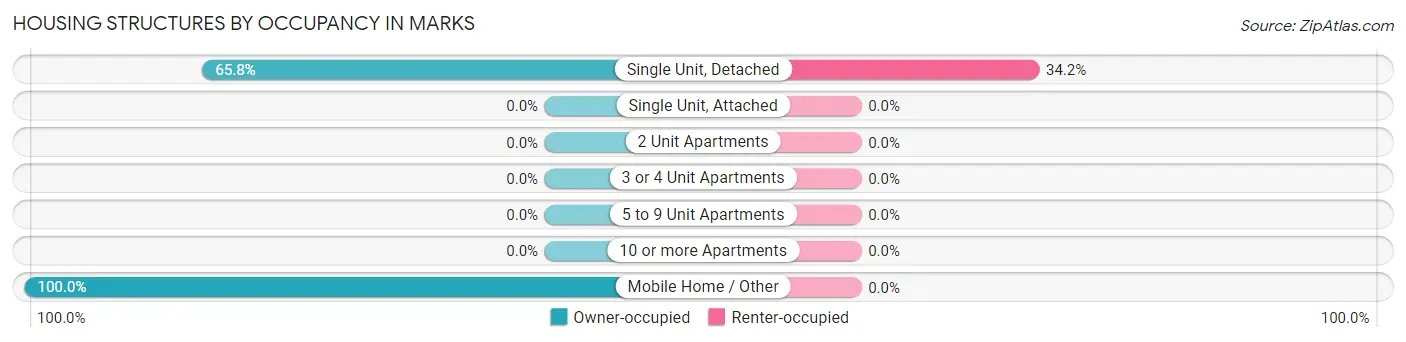
| Structure Type | Owner-occupied | Renter-occupied |
| Single Unit, Detached | 457 (65.8%) | 238 (34.2%) |
| Single Unit, Attached | 0 (0.0%) | 0 (0.0%) |
| 2 Unit Apartments | 0 (0.0%) | 0 (0.0%) |
| 3 or 4 Unit Apartments | 0 (0.0%) | 0 (0.0%) |
| 5 to 9 Unit Apartments | 0 (0.0%) | 0 (0.0%) |
| 10 or more Apartments | 0 (0.0%) | 0 (0.0%) |
| Mobile Home / Other | 1 (100.0%) | 0 (0.0%) |
| Total | 458 (65.8%) | 238 (34.2%) |
Housing Structures by Number of Rooms in Marks
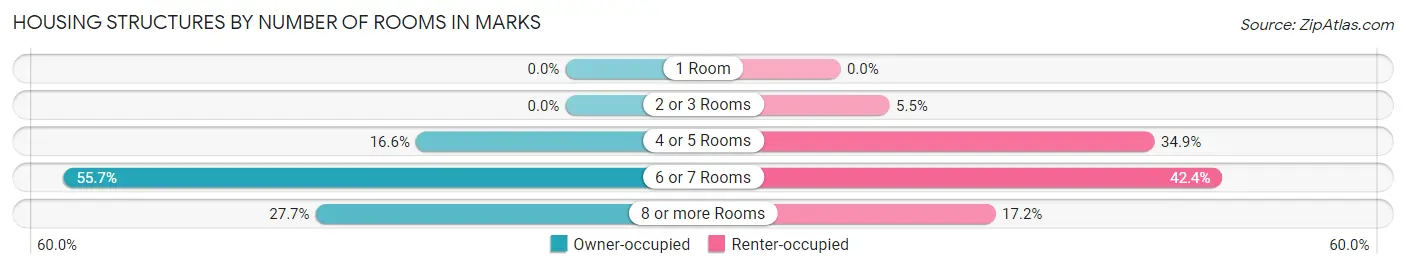
| Number of Rooms | Owner-occupied | Renter-occupied |
| 1 Room | 0 (0.0%) | 0 (0.0%) |
| 2 or 3 Rooms | 0 (0.0%) | 13 (5.5%) |
| 4 or 5 Rooms | 76 (16.6%) | 83 (34.9%) |
| 6 or 7 Rooms | 255 (55.7%) | 101 (42.4%) |
| 8 or more Rooms | 127 (27.7%) | 41 (17.2%) |
| Total | 458 (100.0%) | 238 (100.0%) |
Housing Structure by Heating Type in Marks
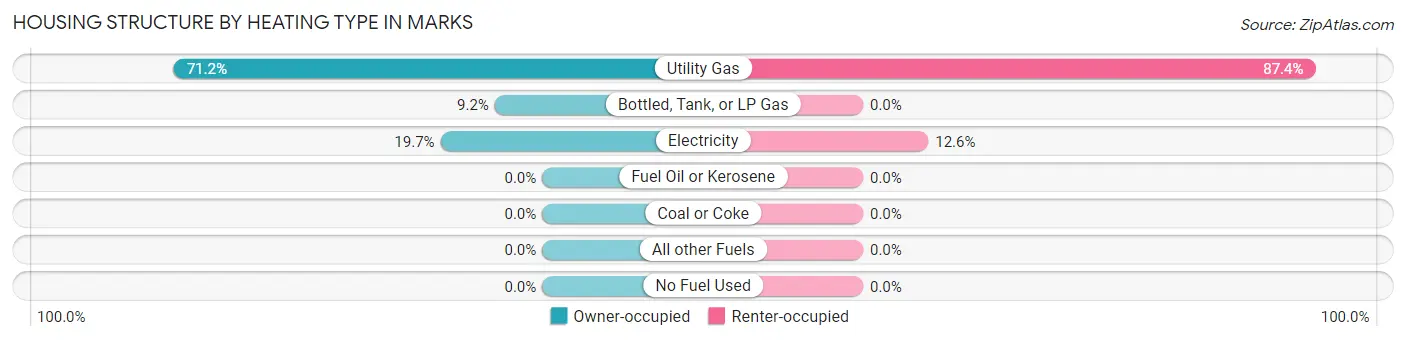
| Heating Type | Owner-occupied | Renter-occupied |
| Utility Gas | 326 (71.2%) | 208 (87.4%) |
| Bottled, Tank, or LP Gas | 42 (9.2%) | 0 (0.0%) |
| Electricity | 90 (19.7%) | 30 (12.6%) |
| Fuel Oil or Kerosene | 0 (0.0%) | 0 (0.0%) |
| Coal or Coke | 0 (0.0%) | 0 (0.0%) |
| All other Fuels | 0 (0.0%) | 0 (0.0%) |
| No Fuel Used | 0 (0.0%) | 0 (0.0%) |
| Total | 458 (100.0%) | 238 (100.0%) |
Household Vehicle Usage in Marks
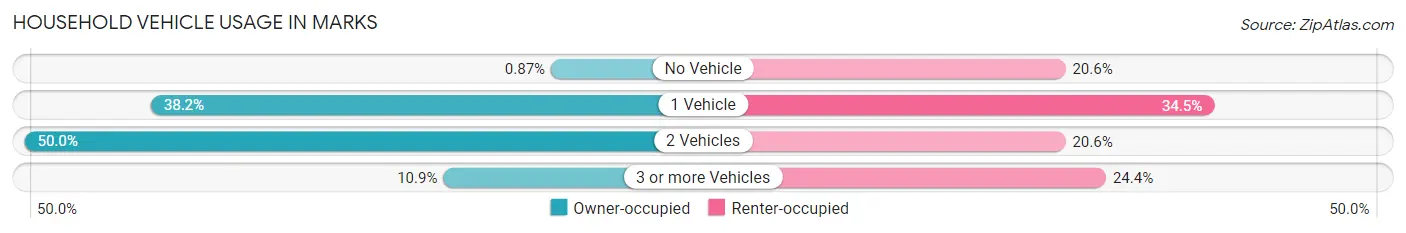
| Vehicles per Household | Owner-occupied | Renter-occupied |
| No Vehicle | 4 (0.9%) | 49 (20.6%) |
| 1 Vehicle | 175 (38.2%) | 82 (34.4%) |
| 2 Vehicles | 229 (50.0%) | 49 (20.6%) |
| 3 or more Vehicles | 50 (10.9%) | 58 (24.4%) |
| Total | 458 (100.0%) | 238 (100.0%) |
Real Estate & Mortgages in Marks
Real Estate and Mortgage Overview in Marks
| Characteristic | Without Mortgage | With Mortgage |
| Housing Units | 259 | 199 |
| Median Property Value | $88,100 | $97,700 |
| Median Household Income | $43,750 | $29 |
| Monthly Housing Costs | $374 | $20 |
| Real Estate Taxes | $991 | $55 |
Property Value by Mortgage Status in Marks
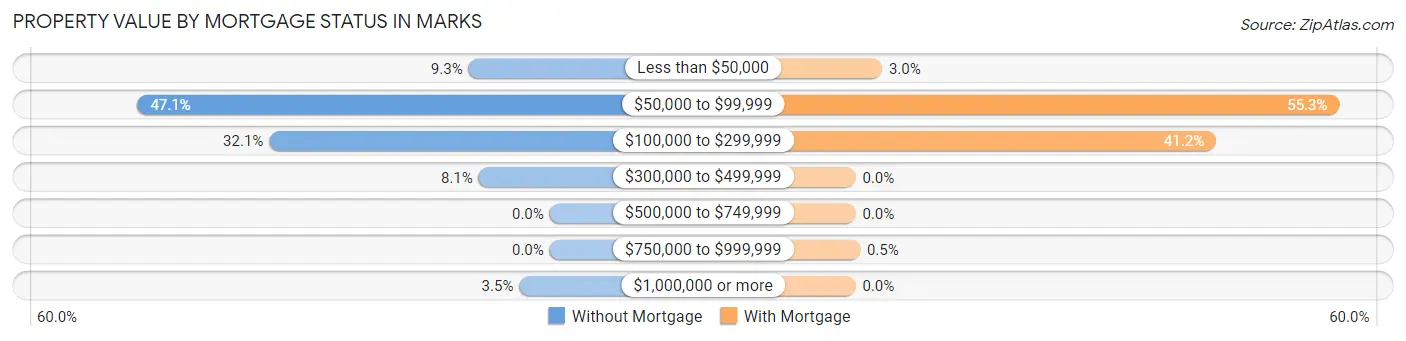
| Property Value | Without Mortgage | With Mortgage |
| Less than $50,000 | 24 (9.3%) | 6 (3.0%) |
| $50,000 to $99,999 | 122 (47.1%) | 110 (55.3%) |
| $100,000 to $299,999 | 83 (32.1%) | 82 (41.2%) |
| $300,000 to $499,999 | 21 (8.1%) | 0 (0.0%) |
| $500,000 to $749,999 | 0 (0.0%) | 0 (0.0%) |
| $750,000 to $999,999 | 0 (0.0%) | 1 (0.5%) |
| $1,000,000 or more | 9 (3.5%) | 0 (0.0%) |
| Total | 259 (100.0%) | 199 (100.0%) |
Household Income by Mortgage Status in Marks
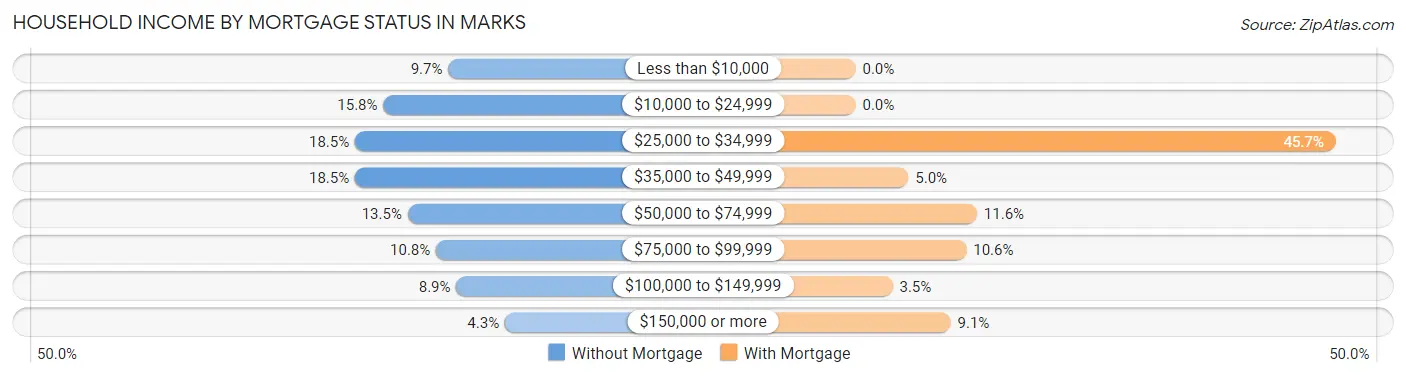
| Household Income | Without Mortgage | With Mortgage |
| Less than $10,000 | 25 (9.7%) | 0 (0.0%) |
| $10,000 to $24,999 | 41 (15.8%) | 0 (0.0%) |
| $25,000 to $34,999 | 48 (18.5%) | 91 (45.7%) |
| $35,000 to $49,999 | 48 (18.5%) | 10 (5.0%) |
| $50,000 to $74,999 | 35 (13.5%) | 23 (11.6%) |
| $75,000 to $99,999 | 28 (10.8%) | 21 (10.5%) |
| $100,000 to $149,999 | 23 (8.9%) | 7 (3.5%) |
| $150,000 or more | 11 (4.3%) | 18 (9.0%) |
| Total | 259 (100.0%) | 199 (100.0%) |
Property Value to Household Income Ratio in Marks
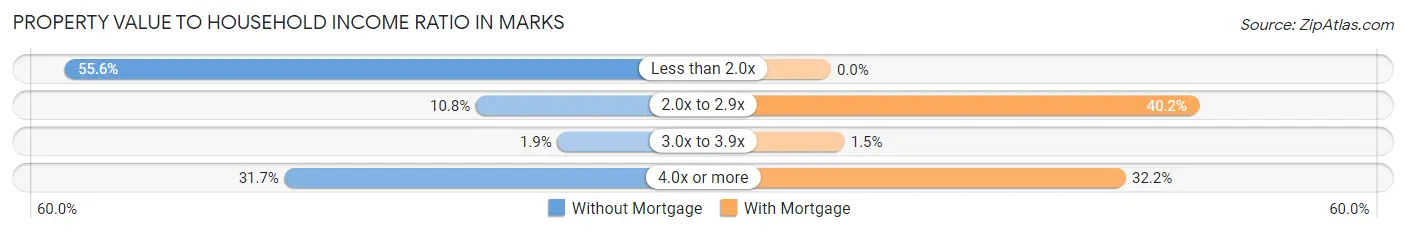
| Value-to-Income Ratio | Without Mortgage | With Mortgage |
| Less than 2.0x | 144 (55.6%) | 0 (0.0%) |
| 2.0x to 2.9x | 28 (10.8%) | 80 (40.2%) |
| 3.0x to 3.9x | 5 (1.9%) | 3 (1.5%) |
| 4.0x or more | 82 (31.7%) | 64 (32.2%) |
| Total | 259 (100.0%) | 199 (100.0%) |
Real Estate Taxes by Mortgage Status in Marks
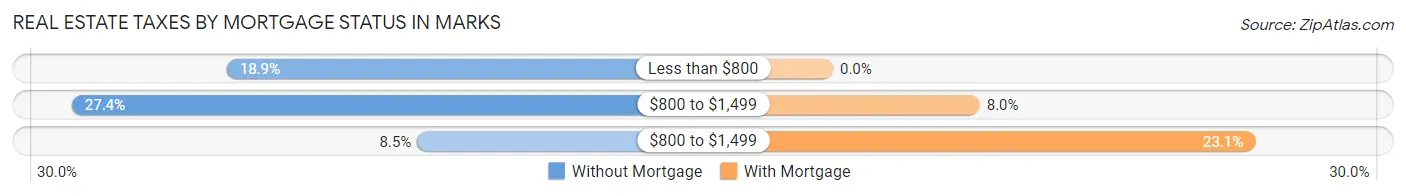
| Property Taxes | Without Mortgage | With Mortgage |
| Less than $800 | 49 (18.9%) | 0 (0.0%) |
| $800 to $1,499 | 71 (27.4%) | 16 (8.0%) |
| $800 to $1,499 | 22 (8.5%) | 46 (23.1%) |
| Total | 259 (100.0%) | 199 (100.0%) |
Health & Disability in Marks
Health Insurance Coverage by Age in Marks
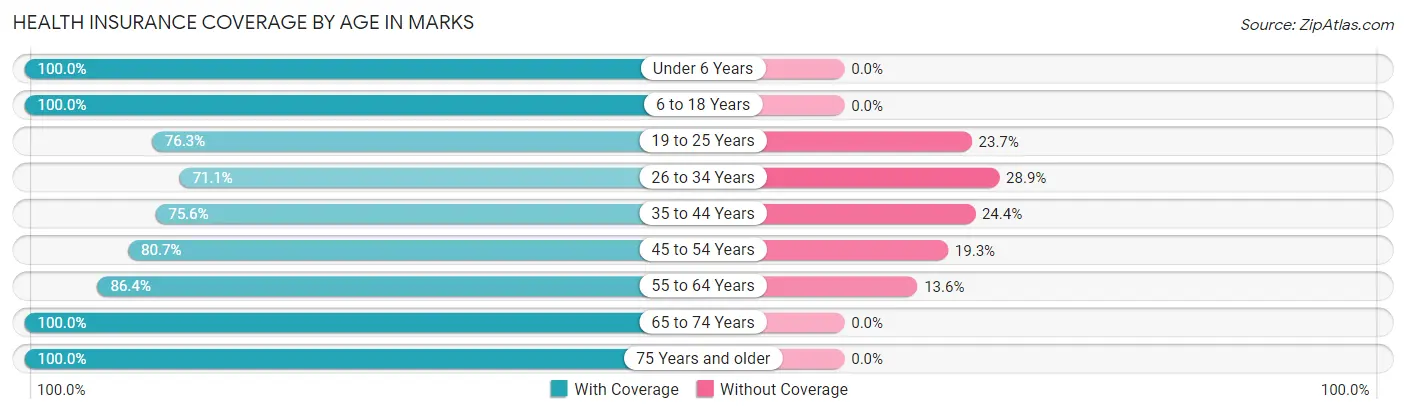
| Age Bracket | With Coverage | Without Coverage |
| Under 6 Years | 86 (100.0%) | 0 (0.0%) |
| 6 to 18 Years | 296 (100.0%) | 0 (0.0%) |
| 19 to 25 Years | 106 (76.3%) | 33 (23.7%) |
| 26 to 34 Years | 133 (71.1%) | 54 (28.9%) |
| 35 to 44 Years | 90 (75.6%) | 29 (24.4%) |
| 45 to 54 Years | 167 (80.7%) | 40 (19.3%) |
| 55 to 64 Years | 216 (86.4%) | 34 (13.6%) |
| 65 to 74 Years | 174 (100.0%) | 0 (0.0%) |
| 75 Years and older | 77 (100.0%) | 0 (0.0%) |
| Total | 1,345 (87.6%) | 190 (12.4%) |
Health Insurance Coverage by Citizenship Status in Marks
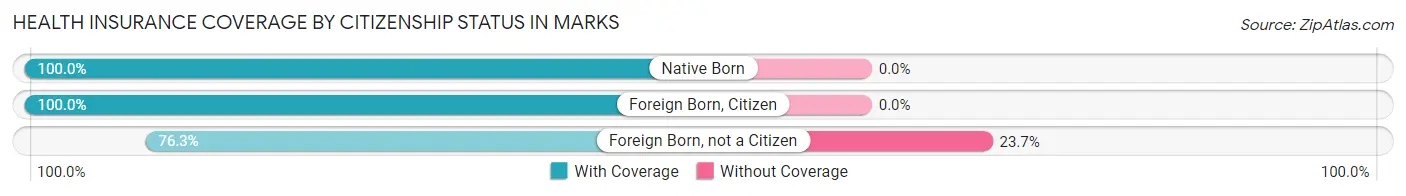
| Citizenship Status | With Coverage | Without Coverage |
| Native Born | 86 (100.0%) | 0 (0.0%) |
| Foreign Born, Citizen | 296 (100.0%) | 0 (0.0%) |
| Foreign Born, not a Citizen | 106 (76.3%) | 33 (23.7%) |
Health Insurance Coverage by Household Income in Marks
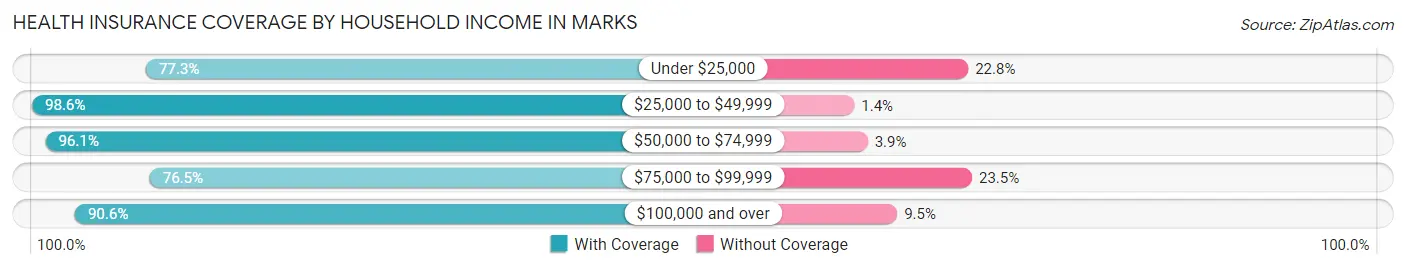
| Household Income | With Coverage | Without Coverage |
| Under $25,000 | 377 (77.2%) | 111 (22.8%) |
| $25,000 to $49,999 | 350 (98.6%) | 5 (1.4%) |
| $50,000 to $74,999 | 245 (96.1%) | 10 (3.9%) |
| $75,000 to $99,999 | 124 (76.5%) | 38 (23.5%) |
| $100,000 and over | 249 (90.5%) | 26 (9.5%) |
Public vs Private Health Insurance Coverage by Age in Marks
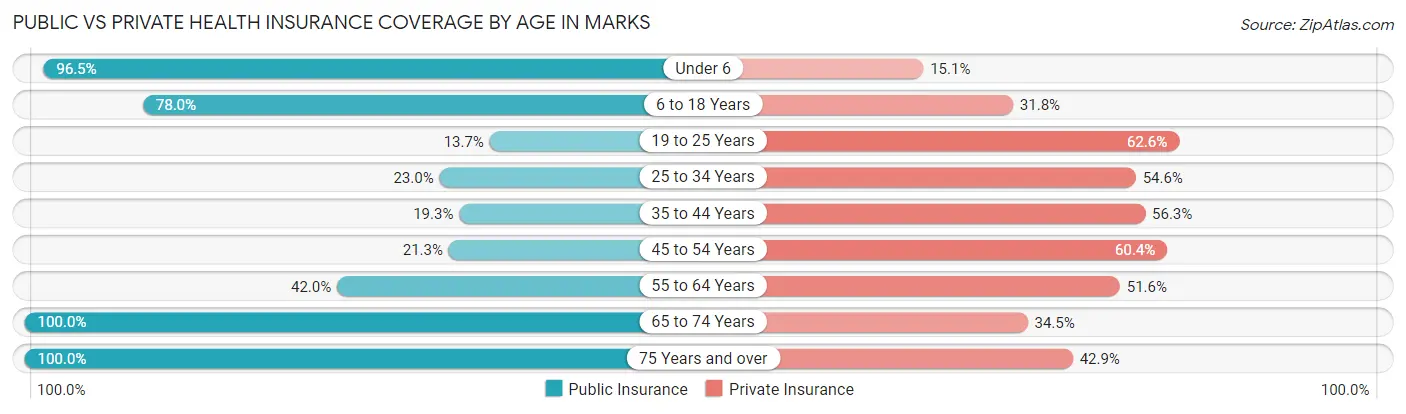
| Age Bracket | Public Insurance | Private Insurance |
| Under 6 | 83 (96.5%) | 13 (15.1%) |
| 6 to 18 Years | 231 (78.0%) | 94 (31.8%) |
| 19 to 25 Years | 19 (13.7%) | 87 (62.6%) |
| 25 to 34 Years | 43 (23.0%) | 102 (54.5%) |
| 35 to 44 Years | 23 (19.3%) | 67 (56.3%) |
| 45 to 54 Years | 44 (21.3%) | 125 (60.4%) |
| 55 to 64 Years | 105 (42.0%) | 129 (51.6%) |
| 65 to 74 Years | 174 (100.0%) | 60 (34.5%) |
| 75 Years and over | 77 (100.0%) | 33 (42.9%) |
| Total | 799 (52.0%) | 710 (46.3%) |
Disability Status by Sex by Age in Marks
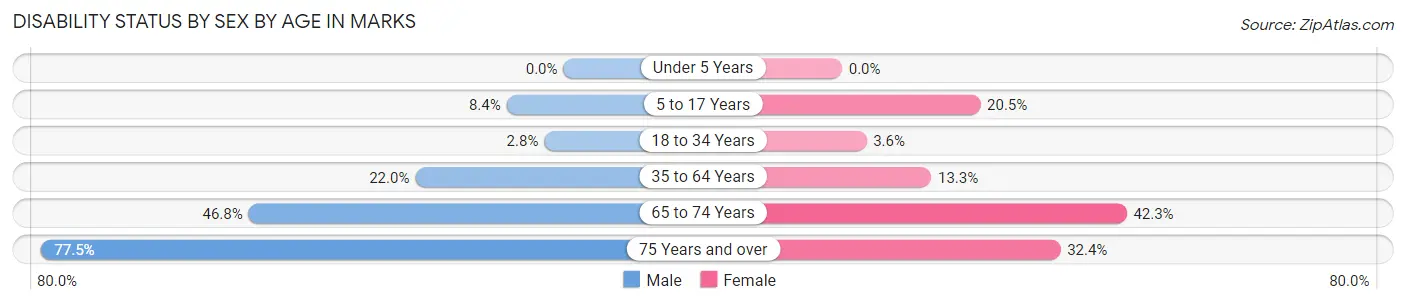
| Age Bracket | Male | Female |
| Under 5 Years | 0 (0.0%) | 0 (0.0%) |
| 5 to 17 Years | 14 (8.4%) | 23 (20.5%) |
| 18 to 34 Years | 4 (2.8%) | 8 (3.6%) |
| 35 to 64 Years | 42 (22.0%) | 51 (13.3%) |
| 65 to 74 Years | 36 (46.8%) | 41 (42.3%) |
| 75 Years and over | 31 (77.5%) | 12 (32.4%) |
Disability Class by Sex by Age in Marks
Disability Class: Hearing Difficulty
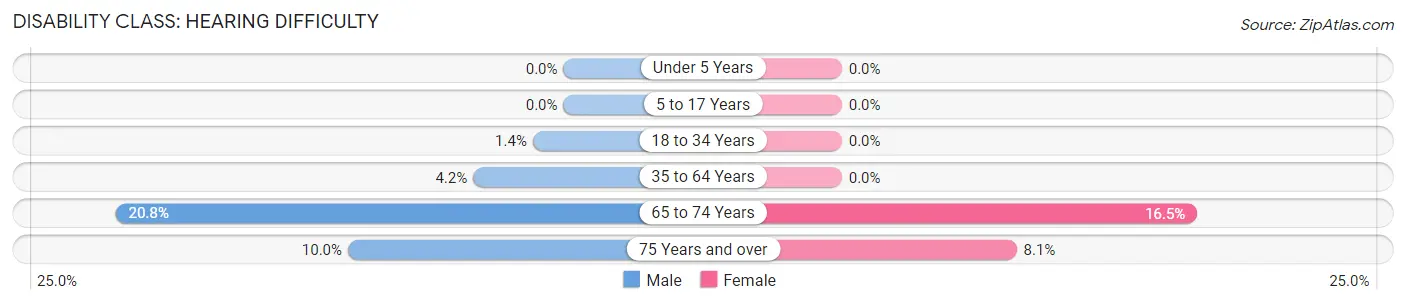
| Age Bracket | Male | Female |
| Under 5 Years | 0 (0.0%) | 0 (0.0%) |
| 5 to 17 Years | 0 (0.0%) | 0 (0.0%) |
| 18 to 34 Years | 2 (1.4%) | 0 (0.0%) |
| 35 to 64 Years | 8 (4.2%) | 0 (0.0%) |
| 65 to 74 Years | 16 (20.8%) | 16 (16.5%) |
| 75 Years and over | 4 (10.0%) | 3 (8.1%) |
Disability Class: Vision Difficulty
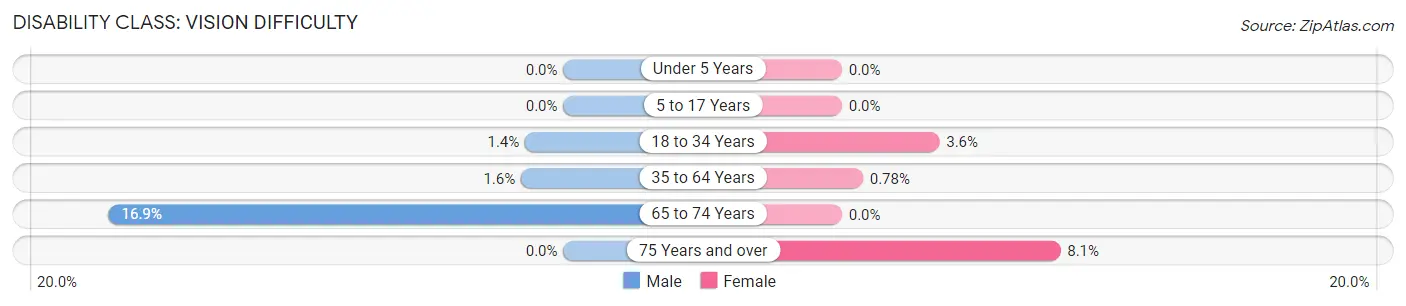
| Age Bracket | Male | Female |
| Under 5 Years | 0 (0.0%) | 0 (0.0%) |
| 5 to 17 Years | 0 (0.0%) | 0 (0.0%) |
| 18 to 34 Years | 2 (1.4%) | 8 (3.6%) |
| 35 to 64 Years | 3 (1.6%) | 3 (0.8%) |
| 65 to 74 Years | 13 (16.9%) | 0 (0.0%) |
| 75 Years and over | 0 (0.0%) | 3 (8.1%) |
Disability Class: Cognitive Difficulty
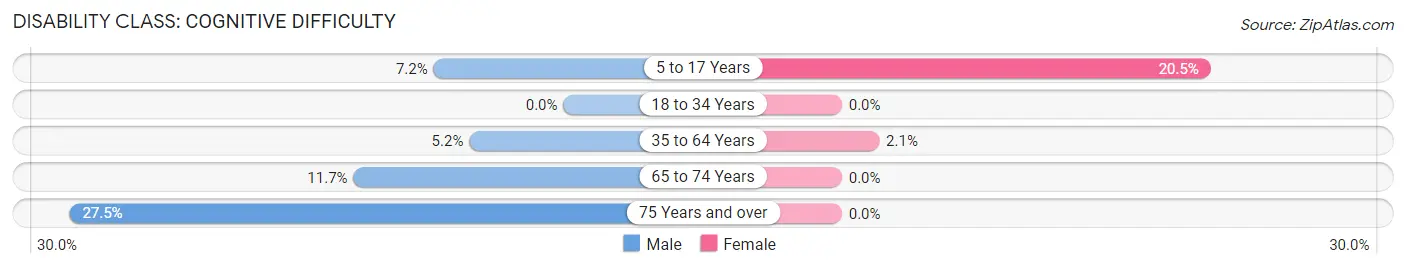
| Age Bracket | Male | Female |
| 5 to 17 Years | 12 (7.2%) | 23 (20.5%) |
| 18 to 34 Years | 0 (0.0%) | 0 (0.0%) |
| 35 to 64 Years | 10 (5.2%) | 8 (2.1%) |
| 65 to 74 Years | 9 (11.7%) | 0 (0.0%) |
| 75 Years and over | 11 (27.5%) | 0 (0.0%) |
Disability Class: Ambulatory Difficulty
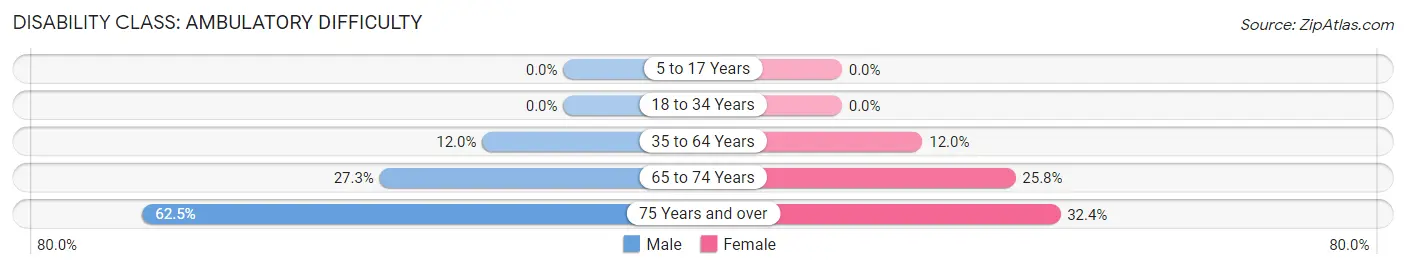
| Age Bracket | Male | Female |
| 5 to 17 Years | 0 (0.0%) | 0 (0.0%) |
| 18 to 34 Years | 0 (0.0%) | 0 (0.0%) |
| 35 to 64 Years | 23 (12.0%) | 46 (11.9%) |
| 65 to 74 Years | 21 (27.3%) | 25 (25.8%) |
| 75 Years and over | 25 (62.5%) | 12 (32.4%) |
Disability Class: Self-Care Difficulty
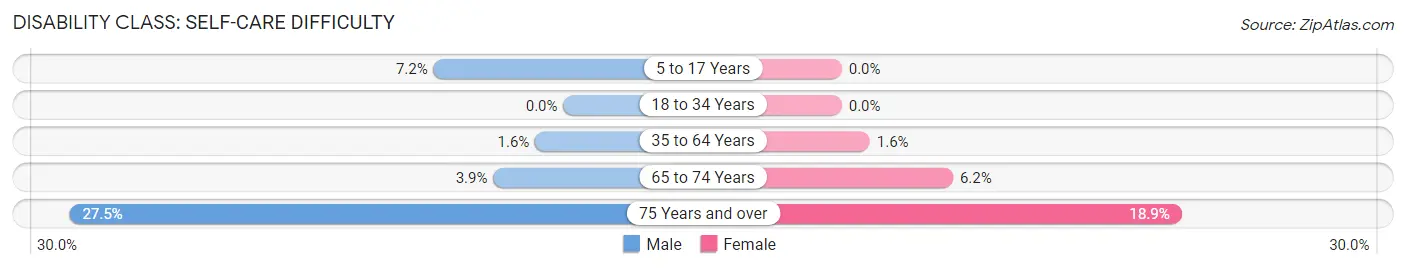
| Age Bracket | Male | Female |
| 5 to 17 Years | 12 (7.2%) | 0 (0.0%) |
| 18 to 34 Years | 0 (0.0%) | 0 (0.0%) |
| 35 to 64 Years | 3 (1.6%) | 6 (1.6%) |
| 65 to 74 Years | 3 (3.9%) | 6 (6.2%) |
| 75 Years and over | 11 (27.5%) | 7 (18.9%) |
Technology Access in Marks
Computing Device Access in Marks
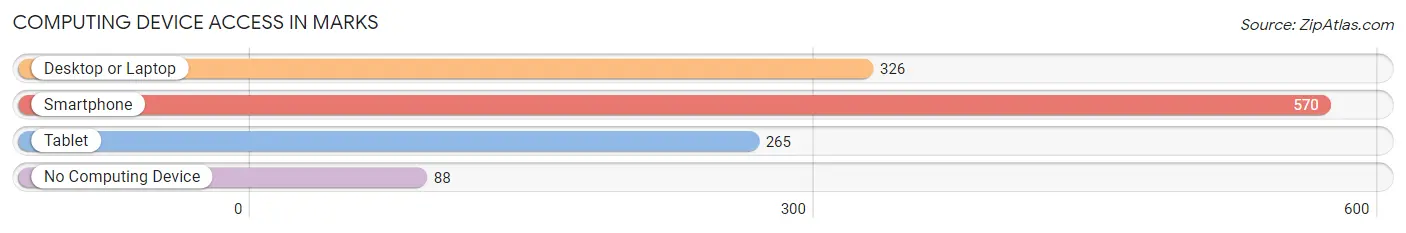
| Device Type | # Households | % Households |
| Desktop or Laptop | 326 | 46.8% |
| Smartphone | 570 | 81.9% |
| Tablet | 265 | 38.1% |
| No Computing Device | 88 | 12.6% |
| Total | 696 | 100.0% |
Internet Access in Marks
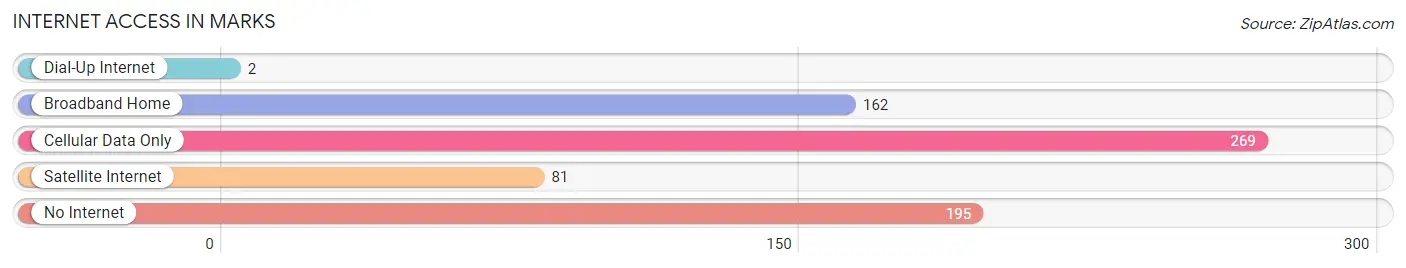
| Internet Type | # Households | % Households |
| Dial-Up Internet | 2 | 0.3% |
| Broadband Home | 162 | 23.3% |
| Cellular Data Only | 269 | 38.7% |
| Satellite Internet | 81 | 11.6% |
| No Internet | 195 | 28.0% |
| Total | 696 | 100.0% |
Marks Summary
MS History
Mississippi is a state located in the southeastern region of the United States. It is bordered by Tennessee to the north, Alabama to the east, the Gulf of Mexico to the south, and Louisiana and Arkansas to the west. Mississippi is the 32nd largest state in the United States, with an area of 48,430 square miles. It is the 31st most populous state, with a population of 2,976,149 as of the 2010 census. Mississippi is known for its rich history and culture, which has been shaped by its location in the Deep South and its African American heritage.
The history of Mississippi dates back to the Paleo-Indian period, which began around 10,000 BC. The first inhabitants of the area were Native American tribes, including the Choctaw, Chickasaw, and Natchez. The first Europeans to explore the area were the Spanish, who arrived in the early 16th century. The French also explored the area, and in 1699, they established the first permanent settlement in what is now Mississippi.
In 1798, Mississippi became the 20th state to join the Union. During the 19th century, Mississippi was a slave state, and it was the site of several battles during the Civil War. After the war, Mississippi was the first state to ratify the 13th Amendment, which abolished slavery.
In the late 19th and early 20th centuries, Mississippi was a major center of the civil rights movement. In 1964, the state passed the Mississippi Freedom Summer, which was a major event in the civil rights movement. In the late 20th century, Mississippi experienced a period of economic growth, and it is now one of the fastest-growing states in the nation.
Geography
Mississippi is located in the southeastern region of the United States. It is bordered by Tennessee to the north, Alabama to the east, the Gulf of Mexico to the south, and Louisiana and Arkansas to the west. Mississippi is the 32nd largest state in the United States, with an area of 48,430 square miles.
The landscape of Mississippi is mostly flat, with rolling hills in the north and east. The state is divided into three distinct regions: the Gulf Coastal Plain, the Mississippi Alluvial Plain, and the Mississippi Delta. The Gulf Coastal Plain is located along the Gulf of Mexico and is characterized by sandy beaches and wetlands. The Mississippi Alluvial Plain is located in the central part of the state and is characterized by flat, fertile land. The Mississippi Delta is located in the northwest corner of the state and is characterized by flat, low-lying land.
Economy
The economy of Mississippi is largely based on agriculture, manufacturing, and tourism. Agriculture is the state’s largest industry, and it accounts for about one-third of the state’s total economic output. The state’s major agricultural products include cotton, soybeans, corn, rice, and poultry.
Manufacturing is the second-largest industry in Mississippi, and it accounts for about one-fourth of the state’s total economic output. The state’s major manufactured products include chemicals, furniture, paper products, and transportation equipment.
Tourism is also an important part of the state’s economy. Mississippi is home to several popular tourist attractions, including the Gulf Coast beaches, the Mississippi Delta, and the Natchez Trace Parkway.
Demographics
As of the 2010 census, the population of Mississippi was 2,976,149. The state is racially diverse, with the majority of the population (58.4%) being African American. The second-largest racial group is white (37.3%), followed by Hispanic (2.2%), Asian (1.2%), and Native American (0.7%).
The median household income in Mississippi is $41,754, which is lower than the national median of $53,482. The poverty rate in the state is 22.4%, which is higher than the national poverty rate of 15.1%.
Conclusion
Mississippi is a state located in the southeastern region of the United States. It is bordered by Tennessee to the north, Alabama to the east, the Gulf of Mexico to the south, and Louisiana and Arkansas to the west. Mississippi is the 32nd largest state in the United States, with an area of 48,430 square miles. It is the 31st most populous state, with a population of 2,976,149 as of the 2010 census. Mississippi is known for its rich history and culture, which has been shaped by its location in the Deep South and its African American heritage. The economy of Mississippi is largely based on agriculture, manufacturing, and tourism. The state is racially diverse, with the majority of the population (58.4%) being African American. The median household income in Mississippi is $41,754, which is lower than the national median of $53,482. The poverty rate in the state is 22.4%, which is higher than the national poverty rate of 15.1%.
Common Questions
What is Per Capita Income in Marks?
Per Capita income in Marks is $22,977.
What is the Median Family Income in Marks?
Median Family Income in Marks is $49,464.
What is the Median Household income in Marks?
Median Household Income in Marks is $37,000.
What is Income or Wage Gap in Marks?
Income or Wage Gap in Marks is 15.7%.
Women in Marks earn 84.3 cents for every dollar earned by a man.
What is Inequality or Gini Index in Marks?
Inequality or Gini Index in Marks is 0.47.
What is the Total Population of Marks?
Total Population of Marks is 1,633.
What is the Total Male Population of Marks?
Total Male Population of Marks is 683.
What is the Total Female Population of Marks?
Total Female Population of Marks is 950.
What is the Ratio of Males per 100 Females in Marks?
There are 71.89 Males per 100 Females in Marks.
What is the Ratio of Females per 100 Males in Marks?
There are 139.09 Females per 100 Males in Marks.
What is the Median Population Age in Marks?
Median Population Age in Marks is 41.4 Years.
What is the Average Family Size in Marks
Average Family Size in Marks is 3.1 People.
What is the Average Household Size in Marks
Average Household Size in Marks is 2.2 People.
How Large is the Labor Force in Marks?
There are 623 People in the Labor Forcein in Marks.
What is the Percentage of People in the Labor Force in Marks?
45.9% of People are in the Labor Force in Marks.
What is the Unemployment Rate in Marks?
Unemployment Rate in Marks is 10.6%.