Silver Creek, MS Map & Demographics
Silver Creek Map
Silver Creek Overview
$21,624
PER CAPITA INCOME
$26,458
AVG HOUSEHOLD INCOME
0.53
INEQUALITY / GINI INDEX
209
TOTAL POPULATION
100
MALE POPULATION
109
FEMALE POPULATION
91.74
MALES / 100 FEMALES
109.00
FEMALES / 100 MALES
37.1
MEDIAN AGE
4.2
AVG FAMILY SIZE
3.4
AVG HOUSEHOLD SIZE
54
LABOR FORCE [ PEOPLE ]
37.8%
PERCENT IN LABOR FORCE
14.8%
UNEMPLOYMENT RATE
Silver Creek Zip Codes
Income in Silver Creek
Income Overview in Silver Creek
| Characteristic | Number | Measure |
| Per Capita Income | 209 | $21,624 |
| Median Family Income | 44 | $0 |
| Mean Family Income | 44 | $57,436 |
| Median Household Income | 61 | $26,458 |
| Mean Household Income | 61 | $48,944 |
| Income Deficit | 44 | $0 |
| Wage / Income Gap (%) | 209 | 0.00% |
| Wage / Income Gap ($) | 209 | 100.00¢ per $1 |
| Gini / Inequality Index | 209 | 0.53 |
Earnings by Sex in Silver Creek
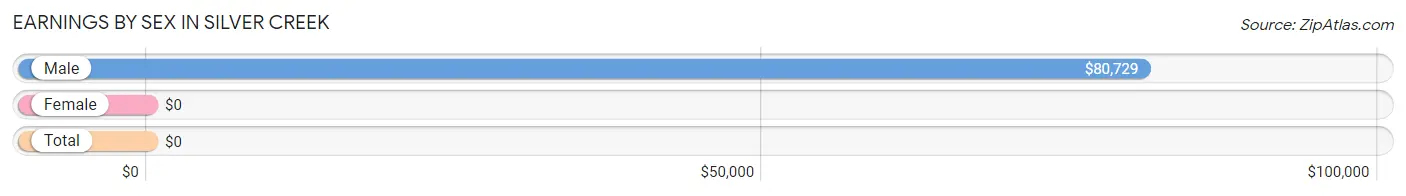
| Sex | Number | Average Earnings |
| Male | 35 (68.6%) | $80,729 |
| Female | 16 (31.4%) | $0 |
| Total | 51 (100.0%) | $0 |
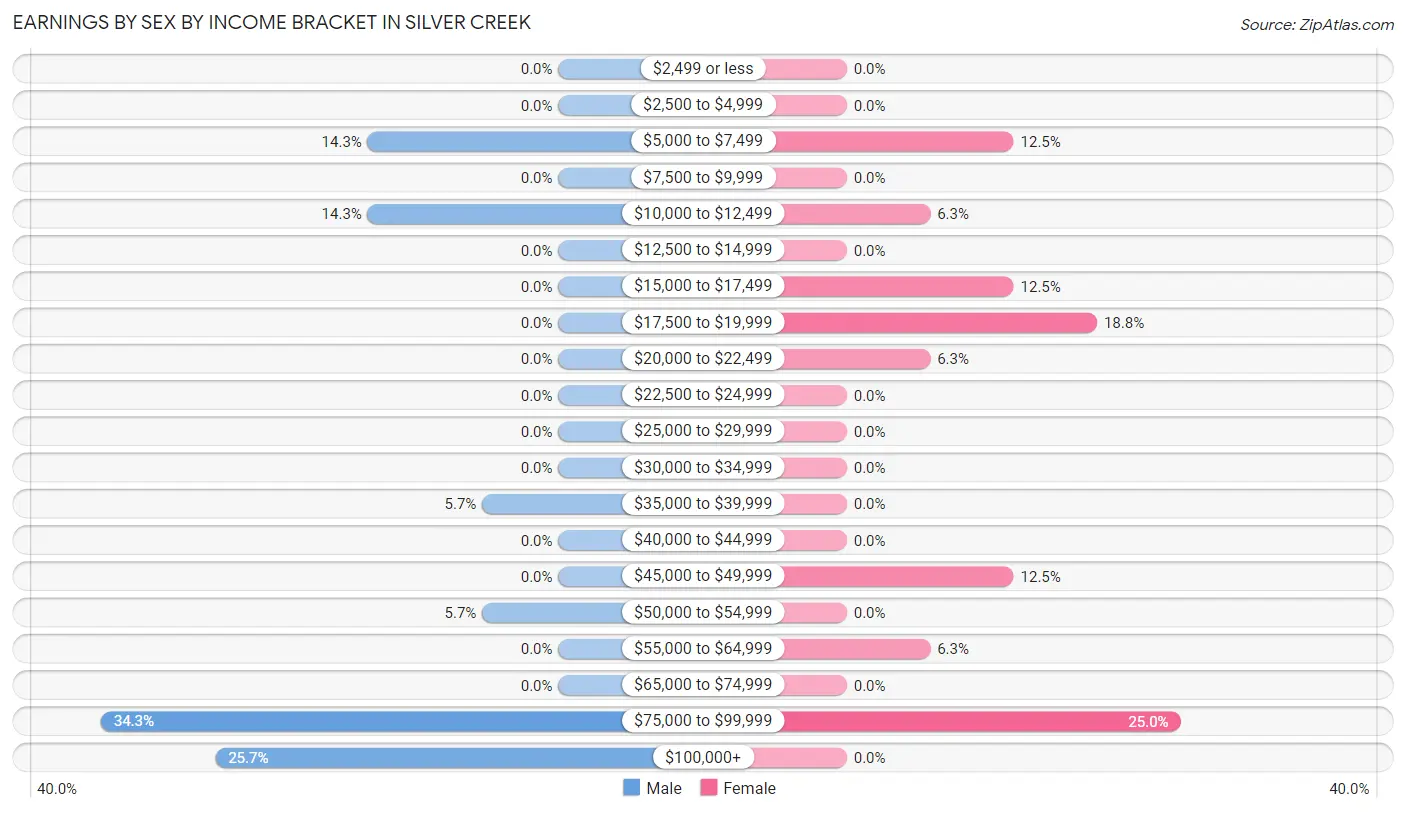
Earnings by Sex by Income Bracket in Silver Creek
The most common earnings brackets in Silver Creek are $75,000 to $99,999 for men (12 | 34.3%) and $75,000 to $99,999 for women (4 | 25.0%).
| Income | Male | Female |
| $2,499 or less | 0 (0.0%) | 0 (0.0%) |
| $2,500 to $4,999 | 0 (0.0%) | 0 (0.0%) |
| $5,000 to $7,499 | 5 (14.3%) | 2 (12.5%) |
| $7,500 to $9,999 | 0 (0.0%) | 0 (0.0%) |
| $10,000 to $12,499 | 5 (14.3%) | 1 (6.2%) |
| $12,500 to $14,999 | 0 (0.0%) | 0 (0.0%) |
| $15,000 to $17,499 | 0 (0.0%) | 2 (12.5%) |
| $17,500 to $19,999 | 0 (0.0%) | 3 (18.8%) |
| $20,000 to $22,499 | 0 (0.0%) | 1 (6.2%) |
| $22,500 to $24,999 | 0 (0.0%) | 0 (0.0%) |
| $25,000 to $29,999 | 0 (0.0%) | 0 (0.0%) |
| $30,000 to $34,999 | 0 (0.0%) | 0 (0.0%) |
| $35,000 to $39,999 | 2 (5.7%) | 0 (0.0%) |
| $40,000 to $44,999 | 0 (0.0%) | 0 (0.0%) |
| $45,000 to $49,999 | 0 (0.0%) | 2 (12.5%) |
| $50,000 to $54,999 | 2 (5.7%) | 0 (0.0%) |
| $55,000 to $64,999 | 0 (0.0%) | 1 (6.2%) |
| $65,000 to $74,999 | 0 (0.0%) | 0 (0.0%) |
| $75,000 to $99,999 | 12 (34.3%) | 4 (25.0%) |
| $100,000+ | 9 (25.7%) | 0 (0.0%) |
| Total | 35 (100.0%) | 16 (100.0%) |
Earnings by Sex by Educational Attainment in Silver Creek
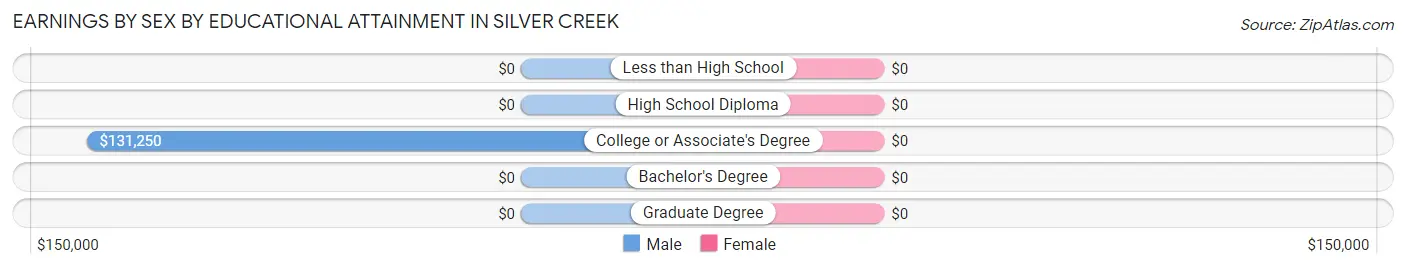
| Educational Attainment | Male Income | Female Income |
| Less than High School | - | - |
| High School Diploma | - | - |
| College or Associate's Degree | $131,250 | $0 |
| Bachelor's Degree | - | - |
| Graduate Degree | - | - |
| Total | $81,458 | $0 |
Family Income in Silver Creek
Family Income Brackets in Silver Creek
According to the Silver Creek family income data, there are 8 families falling into the less than $10,000 income range, which is the most common income bracket and makes up 18.2% of all families.
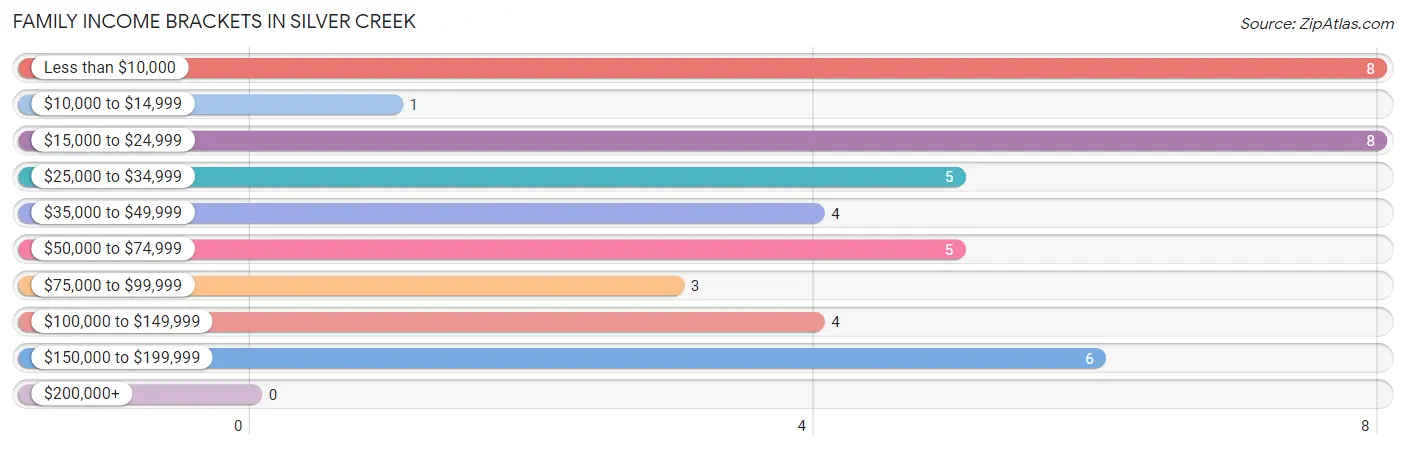
| Income Bracket | # Families | % Families |
| Less than $10,000 | 8 | 18.2% |
| $10,000 to $14,999 | 1 | 2.3% |
| $15,000 to $24,999 | 8 | 18.2% |
| $25,000 to $34,999 | 5 | 11.4% |
| $35,000 to $49,999 | 4 | 9.1% |
| $50,000 to $74,999 | 5 | 11.4% |
| $75,000 to $99,999 | 3 | 6.8% |
| $100,000 to $149,999 | 4 | 9.1% |
| $150,000 to $199,999 | 6 | 13.6% |
| $200,000+ | 0 | 0.0% |
Family Income by Famaliy Size in Silver Creek
2-person families (24 | 54.5%) account for the highest median family income in Silver Creek with $41,250 per family, while 2-person families (24 | 54.5%) have the highest median income of $20,625 per family member.
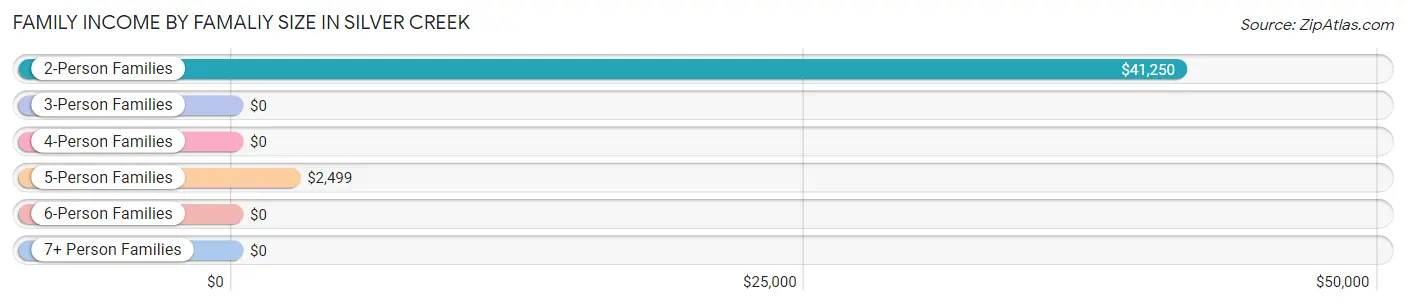
| Income Bracket | # Families | Median Income |
| 2-Person Families | 24 (54.5%) | $41,250 |
| 3-Person Families | 4 (9.1%) | $0 |
| 4-Person Families | 9 (20.4%) | $0 |
| 5-Person Families | 7 (15.9%) | $2,499 |
| 6-Person Families | 0 (0.0%) | $0 |
| 7+ Person Families | 0 (0.0%) | $0 |
| Total | 44 (100.0%) | $0 |
Family Income by Number of Earners in Silver Creek
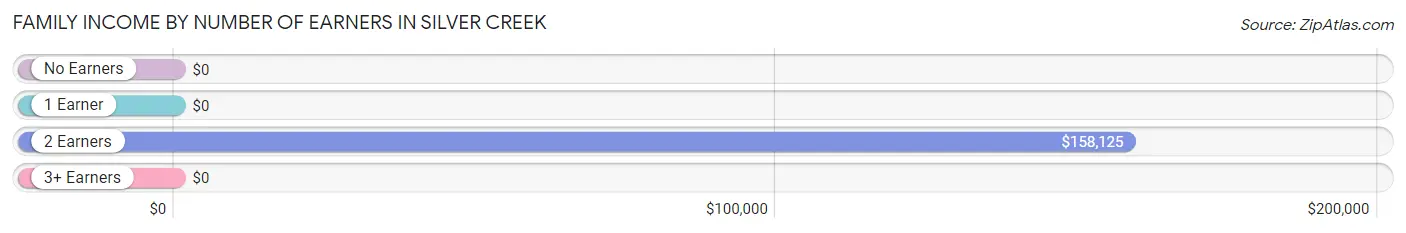
| Number of Earners | # Families | Median Income |
| No Earners | 23 (52.3%) | $0 |
| 1 Earner | 15 (34.1%) | $0 |
| 2 Earners | 6 (13.6%) | $158,125 |
| 3+ Earners | 0 (0.0%) | $0 |
| Total | 44 (100.0%) | $0 |
Household Income in Silver Creek
Household Income Brackets in Silver Creek
With 17 households falling in the category, the $15,000 to $24,999 income range is the most frequent in Silver Creek, accounting for 27.9% of all households.
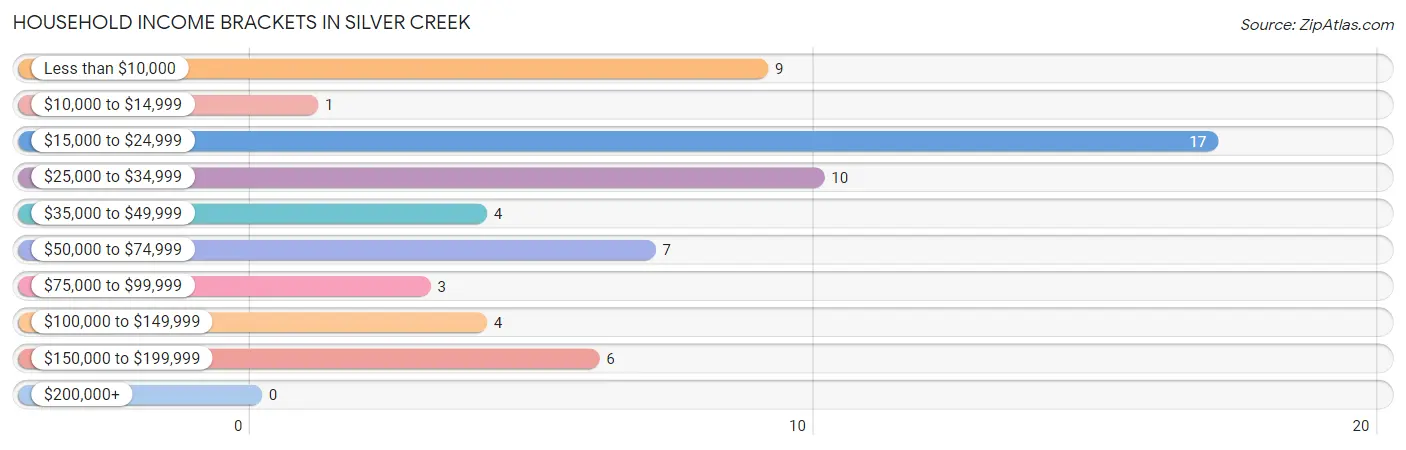
| Income Bracket | # Households | % Households |
| Less than $10,000 | 9 | 14.8% |
| $10,000 to $14,999 | 1 | 1.6% |
| $15,000 to $24,999 | 17 | 27.9% |
| $25,000 to $34,999 | 10 | 16.4% |
| $35,000 to $49,999 | 4 | 6.6% |
| $50,000 to $74,999 | 7 | 11.5% |
| $75,000 to $99,999 | 3 | 4.9% |
| $100,000 to $149,999 | 4 | 6.6% |
| $150,000 to $199,999 | 6 | 9.8% |
| $200,000+ | 0 | 0.0% |
Household Income by Householder Age in Silver Creek
The median household income in Silver Creek is $26,458, with the highest median household income of $26,667 found in the 65+ years age bracket for the primary householder. A total of 28 households (45.9%) fall into this category. Meanwhile, the 15 to 24 years age bracket for the primary householder has the lowest median household income of $0, with 2 households (3.3%) in this group.
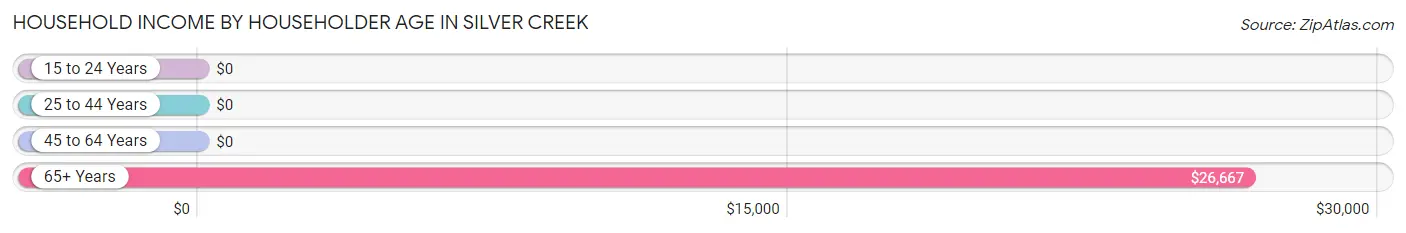
| Income Bracket | # Households | Median Income |
| 15 to 24 Years | 2 (3.3%) | $0 |
| 25 to 44 Years | 17 (27.9%) | $0 |
| 45 to 64 Years | 14 (23.0%) | $0 |
| 65+ Years | 28 (45.9%) | $26,667 |
| Total | 61 (100.0%) | $26,458 |
Poverty in Silver Creek
Income Below Poverty by Sex and Age in Silver Creek
With 39.0% poverty level for males and 41.3% for females among the residents of Silver Creek, 45 to 54 year old males and 6 to 11 year old females are the most vulnerable to poverty, with 11 males (91.7%) and 10 females (100.0%) in their respective age groups living below the poverty level.
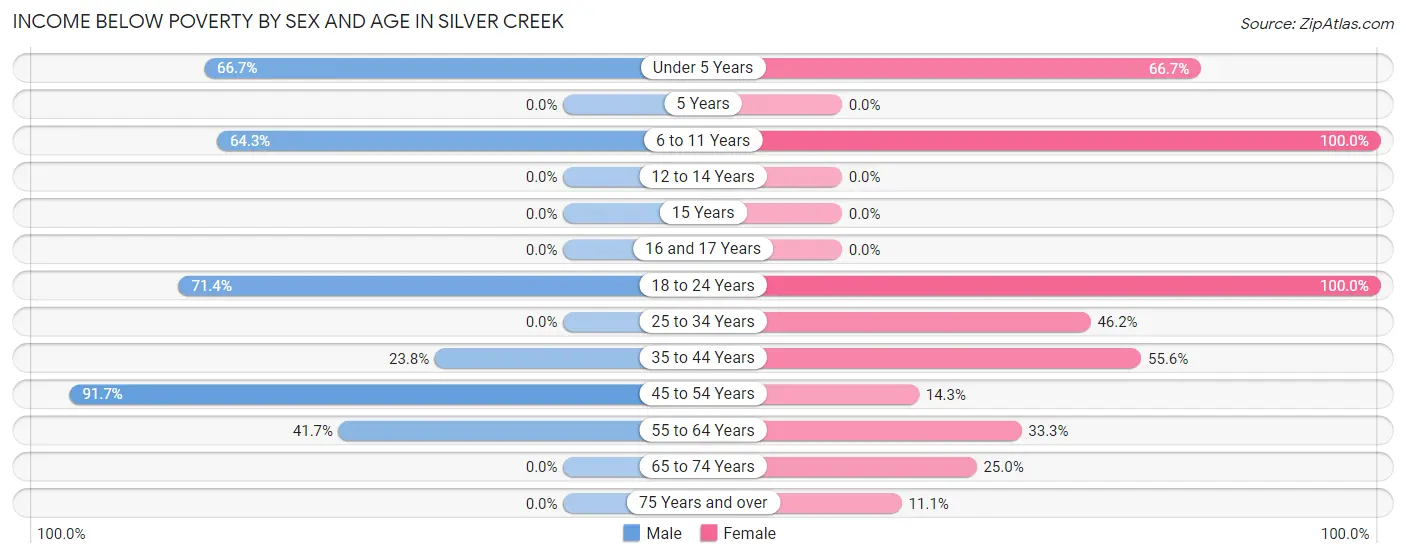
| Age Bracket | Male | Female |
| Under 5 Years | 4 (66.7%) | 10 (66.7%) |
| 5 Years | 0 (0.0%) | 0 (0.0%) |
| 6 to 11 Years | 9 (64.3%) | 10 (100.0%) |
| 12 to 14 Years | 0 (0.0%) | 0 (0.0%) |
| 15 Years | 0 (0.0%) | 0 (0.0%) |
| 16 and 17 Years | 0 (0.0%) | 0 (0.0%) |
| 18 to 24 Years | 5 (71.4%) | 7 (100.0%) |
| 25 to 34 Years | 0 (0.0%) | 6 (46.2%) |
| 35 to 44 Years | 5 (23.8%) | 5 (55.6%) |
| 45 to 54 Years | 11 (91.7%) | 1 (14.3%) |
| 55 to 64 Years | 5 (41.7%) | 1 (33.3%) |
| 65 to 74 Years | 0 (0.0%) | 4 (25.0%) |
| 75 Years and over | 0 (0.0%) | 1 (11.1%) |
| Total | 39 (39.0%) | 45 (41.3%) |
Income Above Poverty by Sex and Age in Silver Creek
According to the poverty statistics in Silver Creek, males aged 12 to 14 years and females aged 12 to 14 years are the age groups that are most secure financially, with 100.0% of males and 100.0% of females in these age groups living above the poverty line.
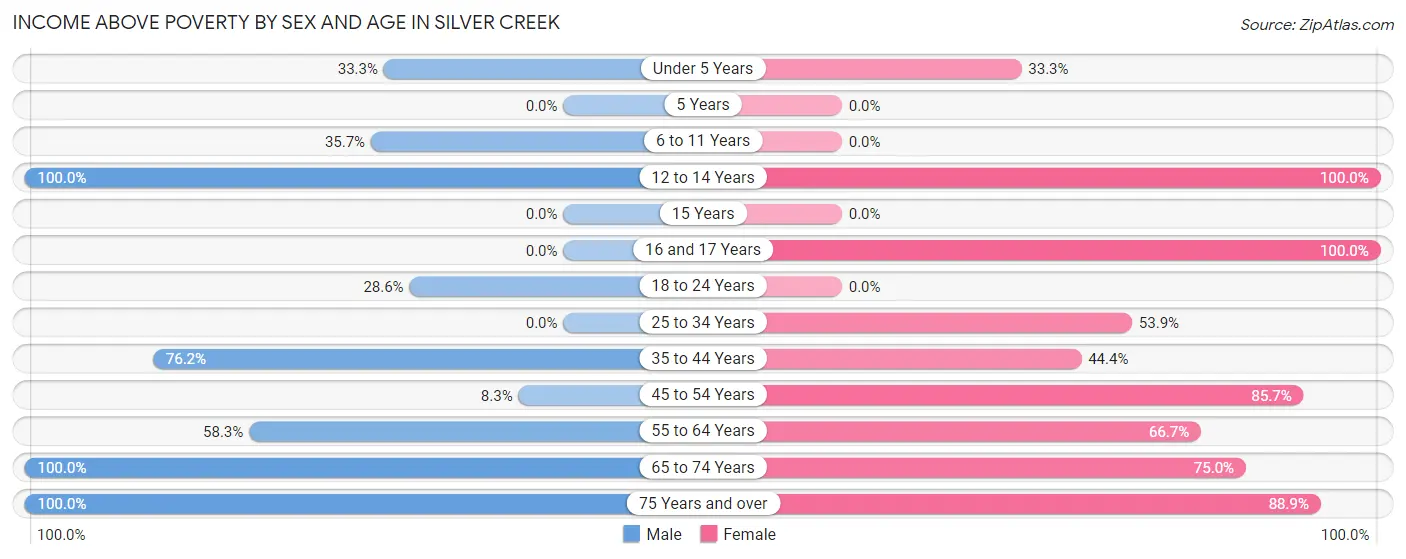
| Age Bracket | Male | Female |
| Under 5 Years | 2 (33.3%) | 5 (33.3%) |
| 5 Years | 0 (0.0%) | 0 (0.0%) |
| 6 to 11 Years | 5 (35.7%) | 0 (0.0%) |
| 12 to 14 Years | 7 (100.0%) | 14 (100.0%) |
| 15 Years | 0 (0.0%) | 0 (0.0%) |
| 16 and 17 Years | 0 (0.0%) | 6 (100.0%) |
| 18 to 24 Years | 2 (28.6%) | 0 (0.0%) |
| 25 to 34 Years | 0 (0.0%) | 7 (53.8%) |
| 35 to 44 Years | 16 (76.2%) | 4 (44.4%) |
| 45 to 54 Years | 1 (8.3%) | 6 (85.7%) |
| 55 to 64 Years | 7 (58.3%) | 2 (66.7%) |
| 65 to 74 Years | 6 (100.0%) | 12 (75.0%) |
| 75 Years and over | 15 (100.0%) | 8 (88.9%) |
| Total | 61 (61.0%) | 64 (58.7%) |
Income Below Poverty Among Married-Couple Families in Silver Creek
The poverty statistics for married-couple families in Silver Creek show that 20.8% or 5 of the total 24 families live below the poverty line. Families with 3 or 4 children have the highest poverty rate of 100.0%, comprising of 5 families. On the other hand, families with no children have the lowest poverty rate of 0.0%, which includes 0 families.
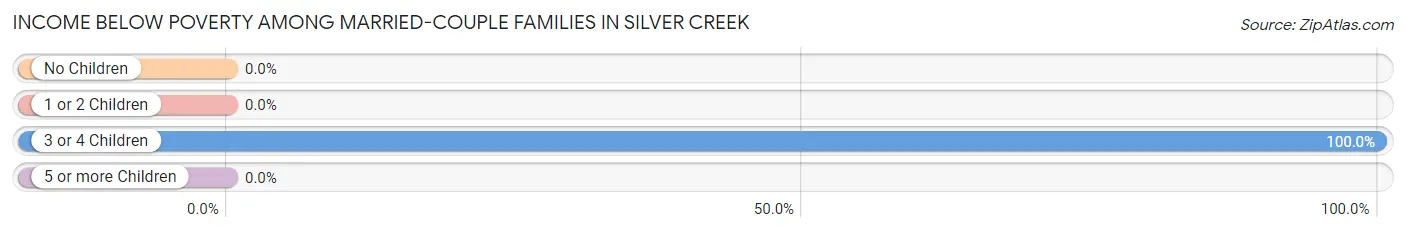
| Children | Above Poverty | Below Poverty |
| No Children | 13 (100.0%) | 0 (0.0%) |
| 1 or 2 Children | 6 (100.0%) | 0 (0.0%) |
| 3 or 4 Children | 0 (0.0%) | 5 (100.0%) |
| 5 or more Children | 0 (0.0%) | 0 (0.0%) |
| Total | 19 (79.2%) | 5 (20.8%) |
Income Below Poverty Among Single-Parent Households in Silver Creek
According to the poverty data in Silver Creek, 36.4% or 4 single-father households and 88.9% or 8 single-mother households are living below the poverty line. Among single-father households, those with no children have the highest poverty rate, with 4 households (66.7%) experiencing poverty. Likewise, among single-mother households, those with no children have the highest poverty rate, with 1 households (100.0%) falling below the poverty line.
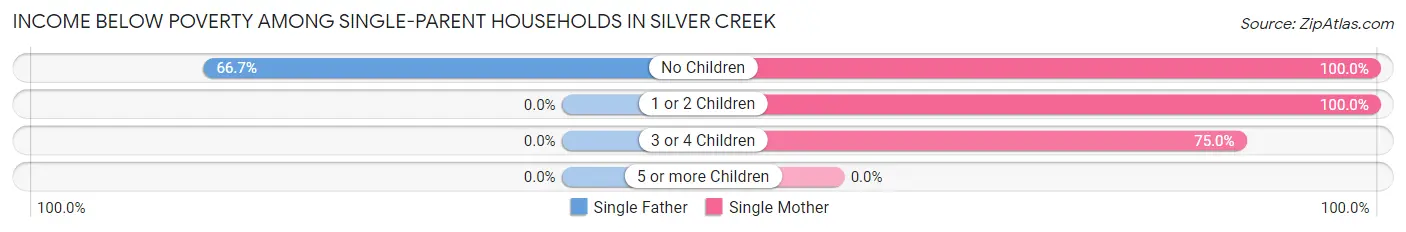
| Children | Single Father | Single Mother |
| No Children | 4 (66.7%) | 1 (100.0%) |
| 1 or 2 Children | 0 (0.0%) | 4 (100.0%) |
| 3 or 4 Children | 0 (0.0%) | 3 (75.0%) |
| 5 or more Children | 0 (0.0%) | 0 (0.0%) |
| Total | 4 (36.4%) | 8 (88.9%) |
Income Below Poverty Among Married-Couple vs Single-Parent Households in Silver Creek
The poverty data for Silver Creek shows that 5 of the married-couple family households (20.8%) and 12 of the single-parent households (60.0%) are living below the poverty level. Within the married-couple family households, those with 3 or 4 children have the highest poverty rate, with 5 households (100.0%) falling below the poverty line. Among the single-parent households, those with 3 or 4 children have the highest poverty rate, with 3 household (75.0%) living below poverty.
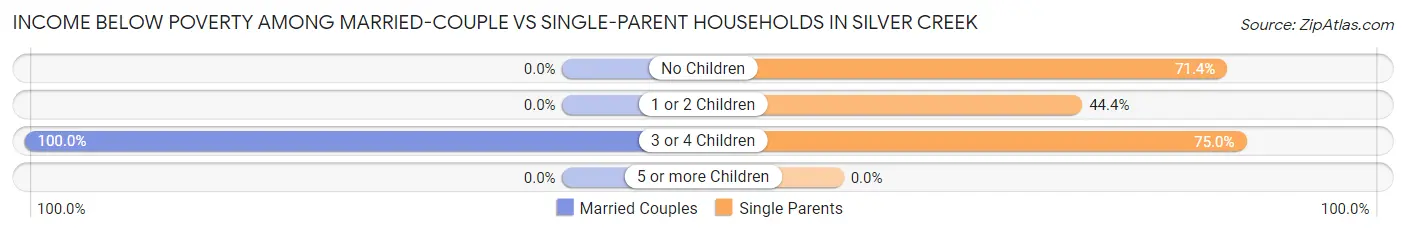
| Children | Married-Couple Families | Single-Parent Households |
| No Children | 0 (0.0%) | 5 (71.4%) |
| 1 or 2 Children | 0 (0.0%) | 4 (44.4%) |
| 3 or 4 Children | 5 (100.0%) | 3 (75.0%) |
| 5 or more Children | 0 (0.0%) | 0 (0.0%) |
| Total | 5 (20.8%) | 12 (60.0%) |
Race in Silver Creek
The most populous races in Silver Creek are White / Caucasian (151 | 72.3%), Black / African American (52 | 24.9%), and Native / Alaskan (3 | 1.4%).
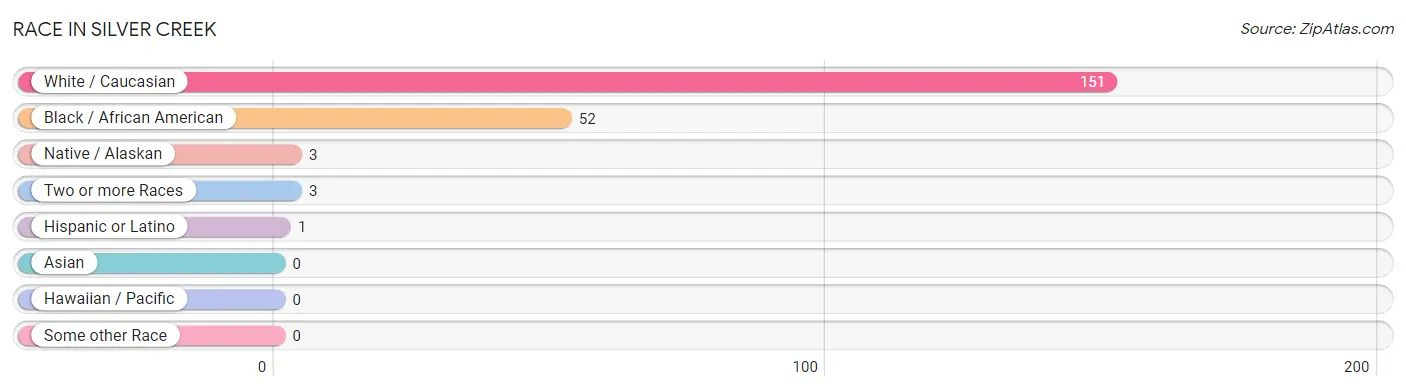
| Race | # Population | % Population |
| Asian | 0 | 0.0% |
| Black / African American | 52 | 24.9% |
| Hawaiian / Pacific | 0 | 0.0% |
| Hispanic or Latino | 1 | 0.5% |
| Native / Alaskan | 3 | 1.4% |
| White / Caucasian | 151 | 72.3% |
| Two or more Races | 3 | 1.4% |
| Some other Race | 0 | 0.0% |
| Total | 209 | 100.0% |
Ancestry in Silver Creek
The most populous ancestries reported in Silver Creek are Irish (14 | 6.7%), American (13 | 6.2%), English (12 | 5.7%), European (12 | 5.7%), and Italian (6 | 2.9%), together accounting for 27.3% of all Silver Creek residents.
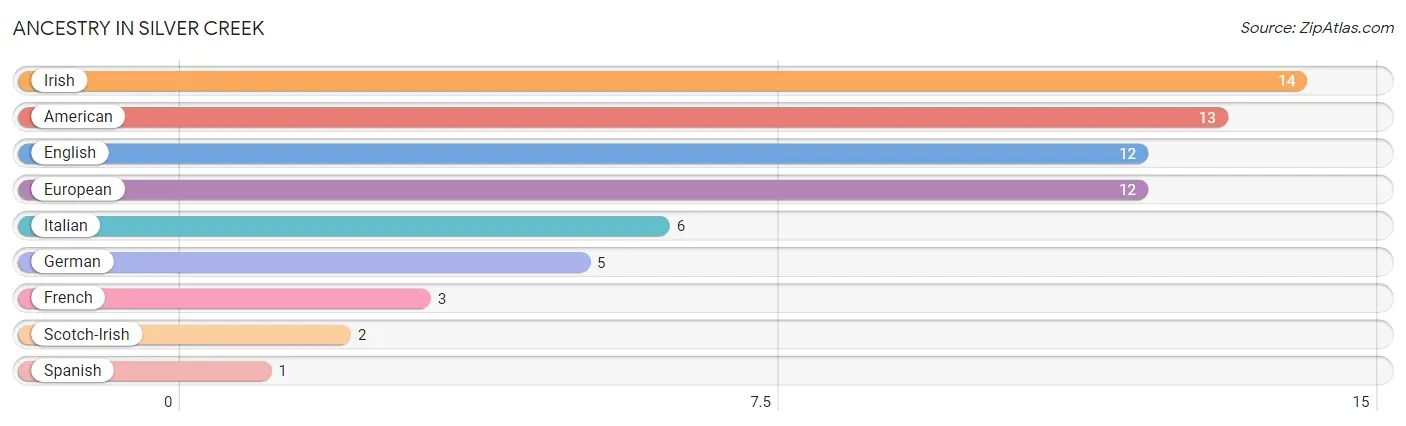
| Ancestry | # Population | % Population |
| American | 13 | 6.2% |
| English | 12 | 5.7% |
| European | 12 | 5.7% |
| French | 3 | 1.4% |
| German | 5 | 2.4% |
| Irish | 14 | 6.7% |
| Italian | 6 | 2.9% |
| Scotch-Irish | 2 | 1.0% |
| Spanish | 1 | 0.5% | View All 9 Rows |
Immigrants in Silver Creek
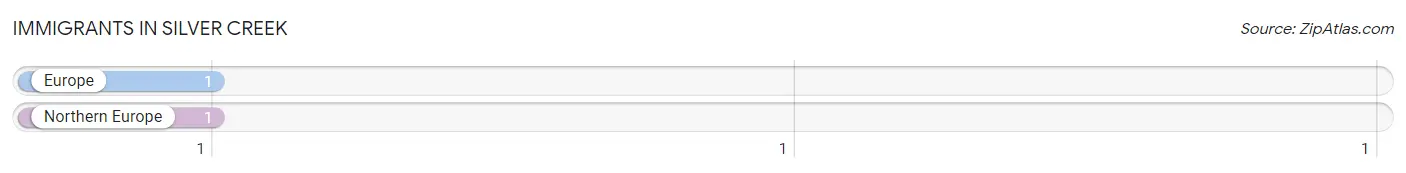
The most numerous immigrant groups reported in Silver Creek came from Europe (1 | 0.5%), and Northern Europe (1 | 0.5%), together accounting for 1.0% of all Silver Creek residents.
| Immigration Origin | # Population | % Population |
| Europe | 1 | 0.5% |
| Northern Europe | 1 | 0.5% | View All 2 Rows |
Sex and Age in Silver Creek
Sex and Age in Silver Creek
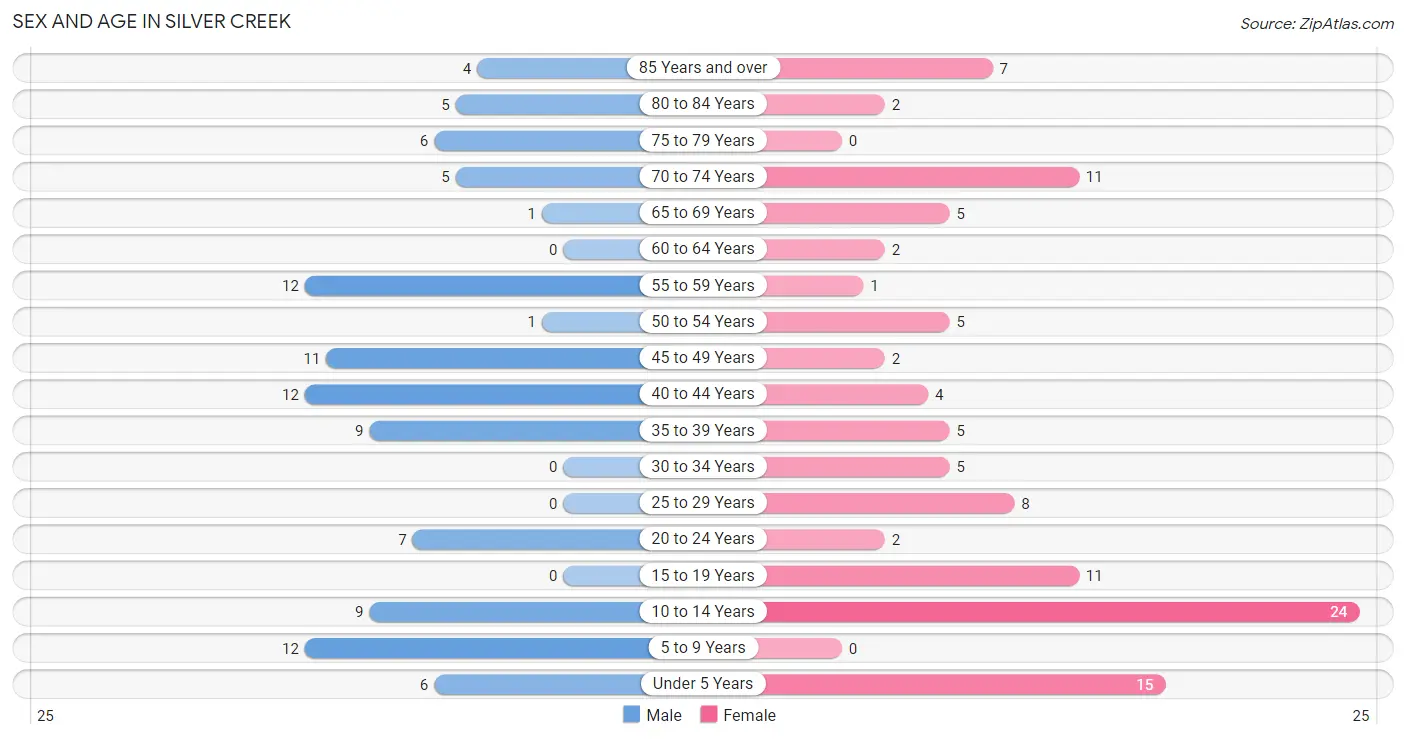
The most populous age groups in Silver Creek are 5 to 9 Years (12 | 12.0%) for men and 10 to 14 Years (24 | 22.0%) for women.
| Age Bracket | Male | Female |
| Under 5 Years | 6 (6.0%) | 15 (13.8%) |
| 5 to 9 Years | 12 (12.0%) | 0 (0.0%) |
| 10 to 14 Years | 9 (9.0%) | 24 (22.0%) |
| 15 to 19 Years | 0 (0.0%) | 11 (10.1%) |
| 20 to 24 Years | 7 (7.0%) | 2 (1.8%) |
| 25 to 29 Years | 0 (0.0%) | 8 (7.3%) |
| 30 to 34 Years | 0 (0.0%) | 5 (4.6%) |
| 35 to 39 Years | 9 (9.0%) | 5 (4.6%) |
| 40 to 44 Years | 12 (12.0%) | 4 (3.7%) |
| 45 to 49 Years | 11 (11.0%) | 2 (1.8%) |
| 50 to 54 Years | 1 (1.0%) | 5 (4.6%) |
| 55 to 59 Years | 12 (12.0%) | 1 (0.9%) |
| 60 to 64 Years | 0 (0.0%) | 2 (1.8%) |
| 65 to 69 Years | 1 (1.0%) | 5 (4.6%) |
| 70 to 74 Years | 5 (5.0%) | 11 (10.1%) |
| 75 to 79 Years | 6 (6.0%) | 0 (0.0%) |
| 80 to 84 Years | 5 (5.0%) | 2 (1.8%) |
| 85 Years and over | 4 (4.0%) | 7 (6.4%) |
| Total | 100 (100.0%) | 109 (100.0%) |
Families and Households in Silver Creek
Median Family Size in Silver Creek
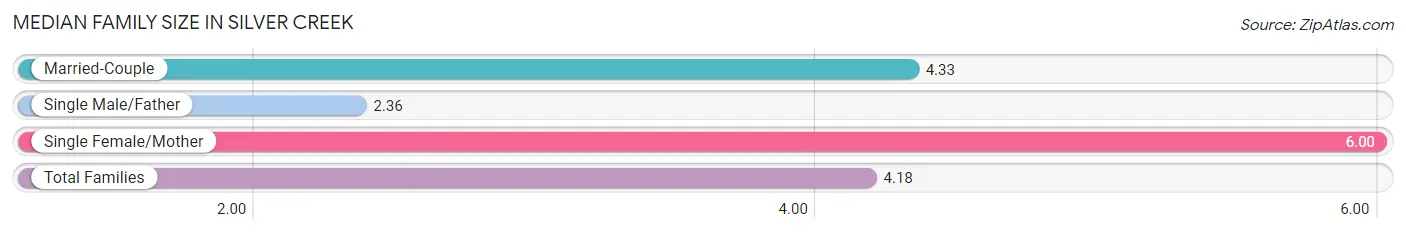
The median family size in Silver Creek is 4.18 persons per family, with single female/mother families (9 | 20.4%) accounting for the largest median family size of 6 persons per family. On the other hand, single male/father families (11 | 25.0%) represent the smallest median family size with 2.36 persons per family.
| Family Type | # Families | Family Size |
| Married-Couple | 24 (54.5%) | 4.33 |
| Single Male/Father | 11 (25.0%) | 2.36 |
| Single Female/Mother | 9 (20.4%) | 6.00 |
| Total Families | 44 (100.0%) | 4.18 |
Median Household Size in Silver Creek
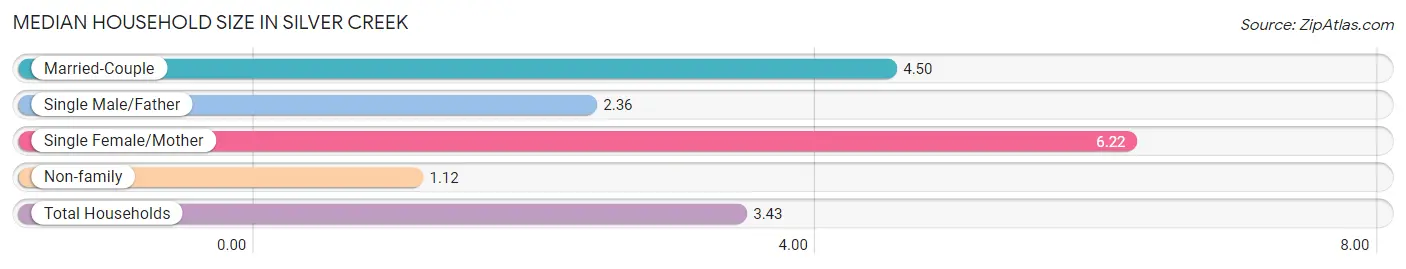
The median household size in Silver Creek is 3.43 persons per household, with single female/mother households (9 | 14.7%) accounting for the largest median household size of 6.22 persons per household. non-family households (17 | 27.9%) represent the smallest median household size with 1.12 persons per household.
| Household Type | # Households | Household Size |
| Married-Couple | 24 (39.3%) | 4.50 |
| Single Male/Father | 11 (18.0%) | 2.36 |
| Single Female/Mother | 9 (14.7%) | 6.22 |
| Non-family | 17 (27.9%) | 1.12 |
| Total Households | 61 (100.0%) | 3.43 |
Household Size by Marriage Status in Silver Creek
Out of a total of 61 households in Silver Creek, 44 (72.1%) are family households, while 17 (27.9%) are nonfamily households. The most numerous type of family households are 2-person households, comprising 22, and the most common type of nonfamily households are 1-person households, comprising 15.
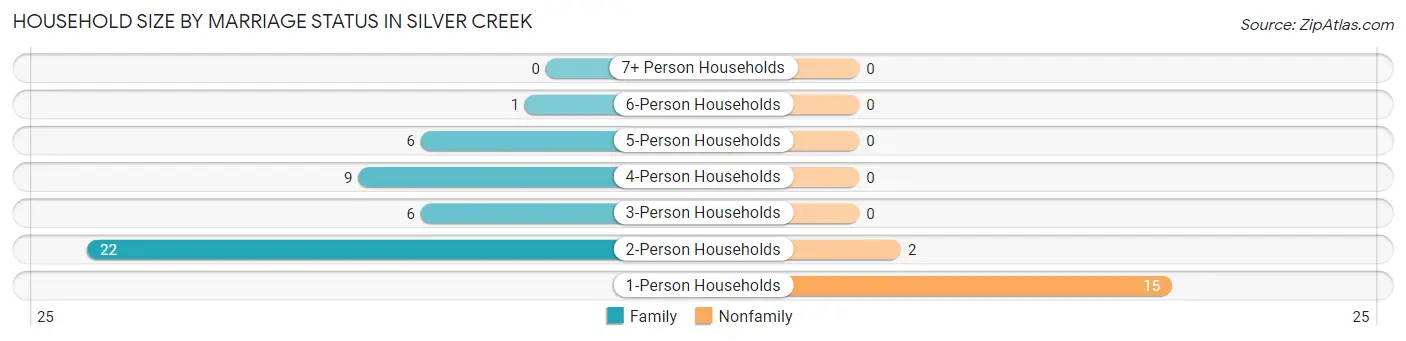
| Household Size | Family Households | Nonfamily Households |
| 1-Person Households | - | 15 (24.6%) |
| 2-Person Households | 22 (36.1%) | 2 (3.3%) |
| 3-Person Households | 6 (9.8%) | 0 (0.0%) |
| 4-Person Households | 9 (14.7%) | 0 (0.0%) |
| 5-Person Households | 6 (9.8%) | 0 (0.0%) |
| 6-Person Households | 1 (1.6%) | 0 (0.0%) |
| 7+ Person Households | 0 (0.0%) | 0 (0.0%) |
| Total | 44 (72.1%) | 17 (27.9%) |
Female Fertility in Silver Creek
Fertility by Age in Silver Creek
Average fertility rate in Silver Creek is 189.0 births per 1,000 women. Women in the age bracket of 15 to 19 years have the highest fertility rate with 455.0 births per 1,000 women. Women in the age bracket of 15 to 19 years acount for 71.4% of all women with births.
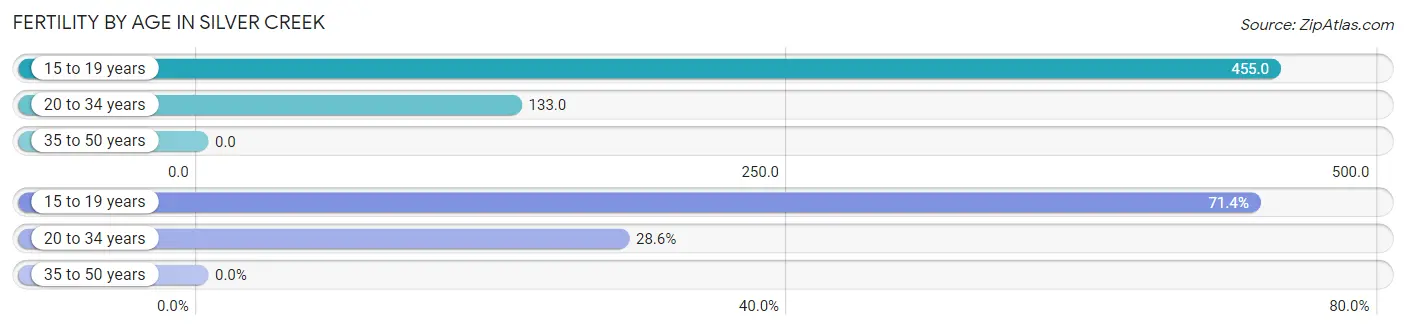
| Age Bracket | Women with Births | Births / 1,000 Women |
| 15 to 19 years | 5 (71.4%) | 455.0 |
| 20 to 34 years | 2 (28.6%) | 133.0 |
| 35 to 50 years | 0 (0.0%) | 0.0 |
| Total | 7 (100.0%) | 189.0 |
Fertility by Age by Marriage Status in Silver Creek
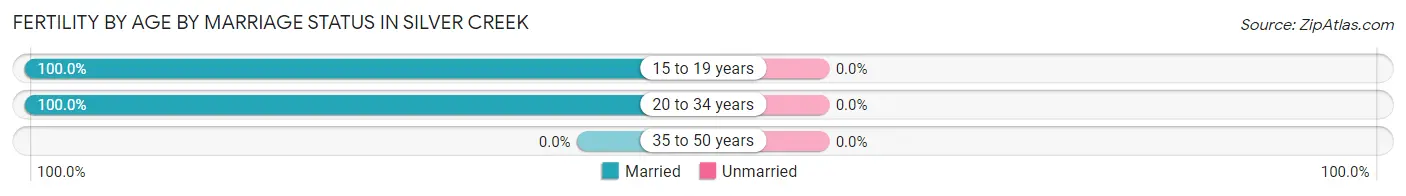
| Age Bracket | Married | Unmarried |
| 15 to 19 years | 5 (100.0%) | 0 (0.0%) |
| 20 to 34 years | 2 (100.0%) | 0 (0.0%) |
| 35 to 50 years | 0 (0.0%) | 0 (0.0%) |
| Total | 7 (100.0%) | 0 (0.0%) |
Fertility by Education in Silver Creek
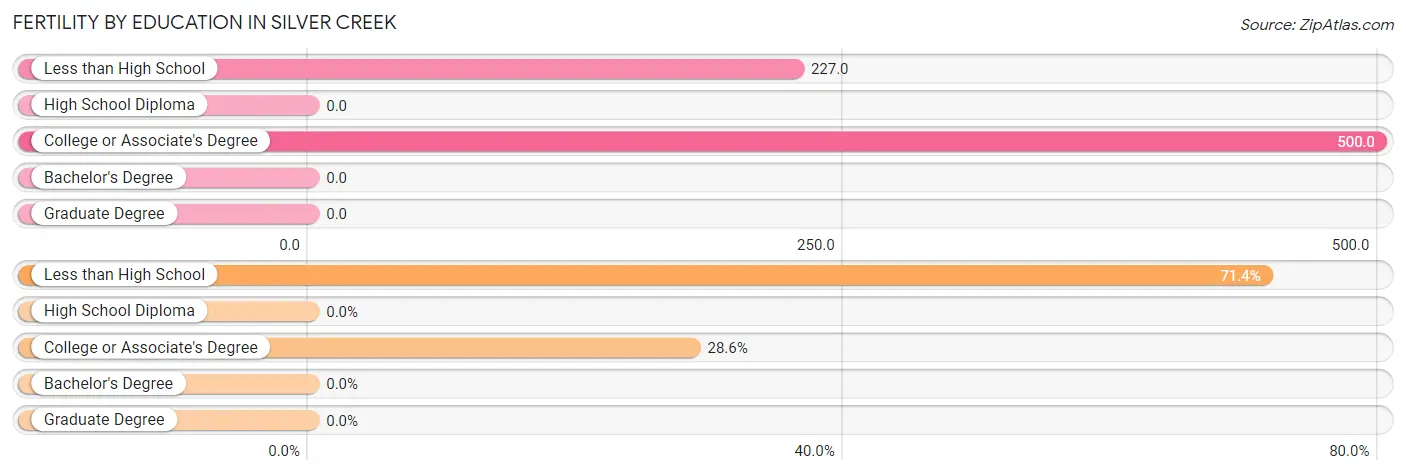
| Educational Attainment | Women with Births | Births / 1,000 Women |
| Less than High School | 5 (71.4%) | 227.0 |
| High School Diploma | 0 (0.0%) | 0.0 |
| College or Associate's Degree | 2 (28.6%) | 500.0 |
| Bachelor's Degree | 0 (0.0%) | 0.0 |
| Graduate Degree | 0 (0.0%) | 0.0 |
| Total | 7 (100.0%) | 189.0 |
Fertility by Education by Marriage Status in Silver Creek
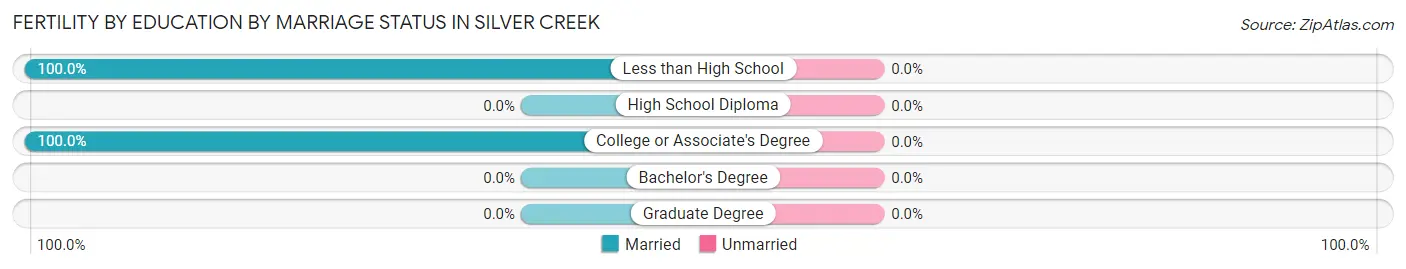
| Educational Attainment | Married | Unmarried |
| Less than High School | 5 (100.0%) | 0 (0.0%) |
| High School Diploma | 0 (0.0%) | 0 (0.0%) |
| College or Associate's Degree | 2 (100.0%) | 0 (0.0%) |
| Bachelor's Degree | 0 (0.0%) | 0 (0.0%) |
| Graduate Degree | 0 (0.0%) | 0 (0.0%) |
| Total | 7 (100.0%) | 0 (0.0%) |
Employment Characteristics in Silver Creek
Employment by Class of Employer in Silver Creek
Among the 46 employed individuals in Silver Creek, private company employees (25 | 54.3%), state government employees (16 | 34.8%), and local government employees (3 | 6.5%) make up the most common classes of employment.
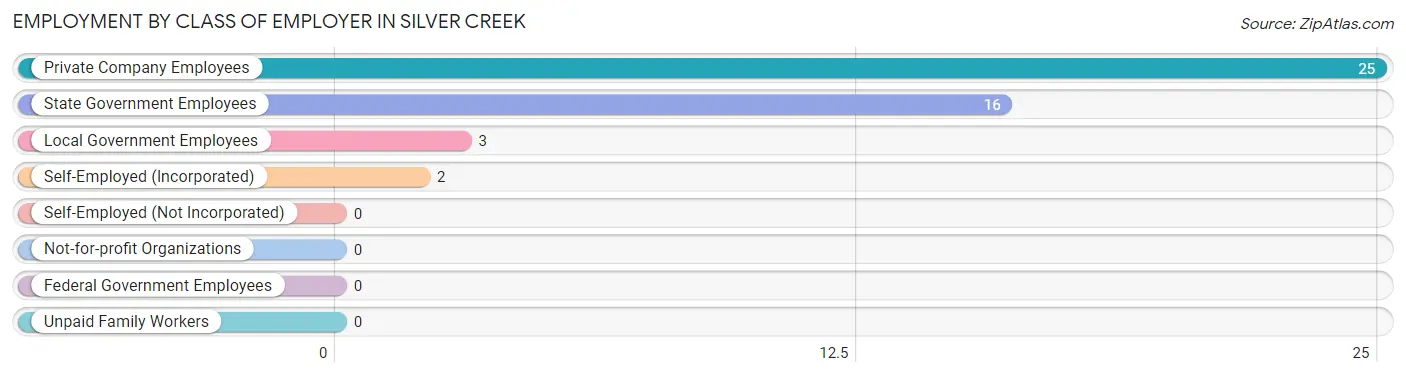
| Employer Class | # Employees | % Employees |
| Private Company Employees | 25 | 54.3% |
| Self-Employed (Incorporated) | 2 | 4.3% |
| Self-Employed (Not Incorporated) | 0 | 0.0% |
| Not-for-profit Organizations | 0 | 0.0% |
| Local Government Employees | 3 | 6.5% |
| State Government Employees | 16 | 34.8% |
| Federal Government Employees | 0 | 0.0% |
| Unpaid Family Workers | 0 | 0.0% |
| Total | 46 | 100.0% |
Employment Status by Age in Silver Creek
According to the labor force statistics for Silver Creek, out of the total population over 16 years of age (143), 37.8% or 54 individuals are in the labor force, with 14.8% or 8 of them unemployed. The age group with the highest labor force participation rate is 20 to 24 years, with 100.0% or 9 individuals in the labor force. Within the labor force, the 45 to 54 years age range has the highest percentage of unemployed individuals, with 42.9% or 3 of them being unemployed.
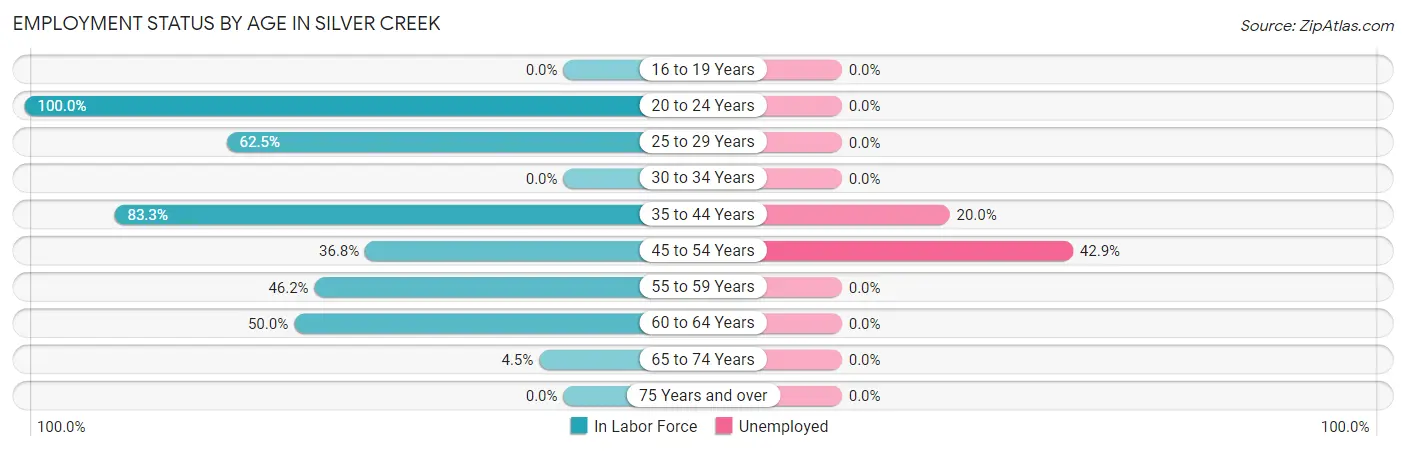
| Age Bracket | In Labor Force | Unemployed |
| 16 to 19 Years | 0 (0.0%) | 0 (0.0%) |
| 20 to 24 Years | 9 (100.0%) | 0 (0.0%) |
| 25 to 29 Years | 5 (62.5%) | 0 (0.0%) |
| 30 to 34 Years | 0 (0.0%) | 0 (0.0%) |
| 35 to 44 Years | 25 (83.3%) | 5 (20.0%) |
| 45 to 54 Years | 7 (36.8%) | 3 (42.9%) |
| 55 to 59 Years | 6 (46.2%) | 0 (0.0%) |
| 60 to 64 Years | 1 (50.0%) | 0 (0.0%) |
| 65 to 74 Years | 1 (4.5%) | 0 (0.0%) |
| 75 Years and over | 0 (0.0%) | 0 (0.0%) |
| Total | 54 (37.8%) | 8 (14.8%) |
Employment Status by Educational Attainment in Silver Creek
According to labor force statistics for Silver Creek, 57.1% of individuals (44) out of the total population between 25 and 64 years of age (77) are in the labor force, with 18.2% or 8 of them being unemployed. The group with the highest labor force participation rate are those with the educational attainment of bachelor's degree or higher, with 100.0% or 18 individuals in the labor force. Within the labor force, individuals with high school diploma education have the highest percentage of unemployment, with 54.5% or 6 of them being unemployed.
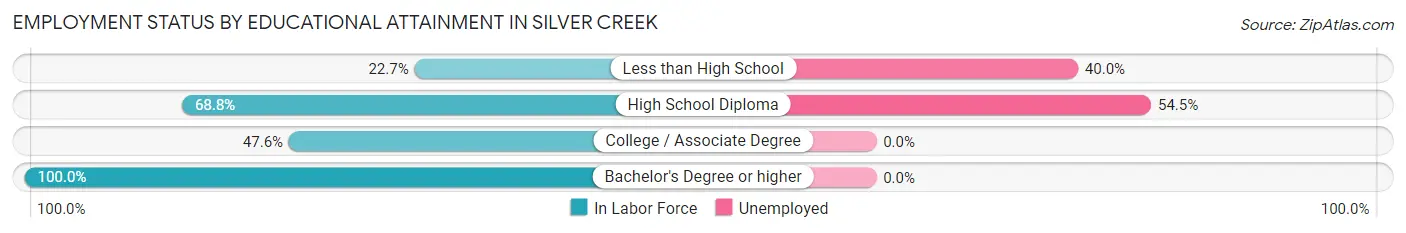
| Educational Attainment | In Labor Force | Unemployed |
| Less than High School | 5 (22.7%) | 9 (40.0%) |
| High School Diploma | 11 (68.8%) | 9 (54.5%) |
| College / Associate Degree | 10 (47.6%) | 0 (0.0%) |
| Bachelor's Degree or higher | 18 (100.0%) | 0 (0.0%) |
| Total | 44 (57.1%) | 14 (18.2%) |
Employment Occupations by Sex in Silver Creek
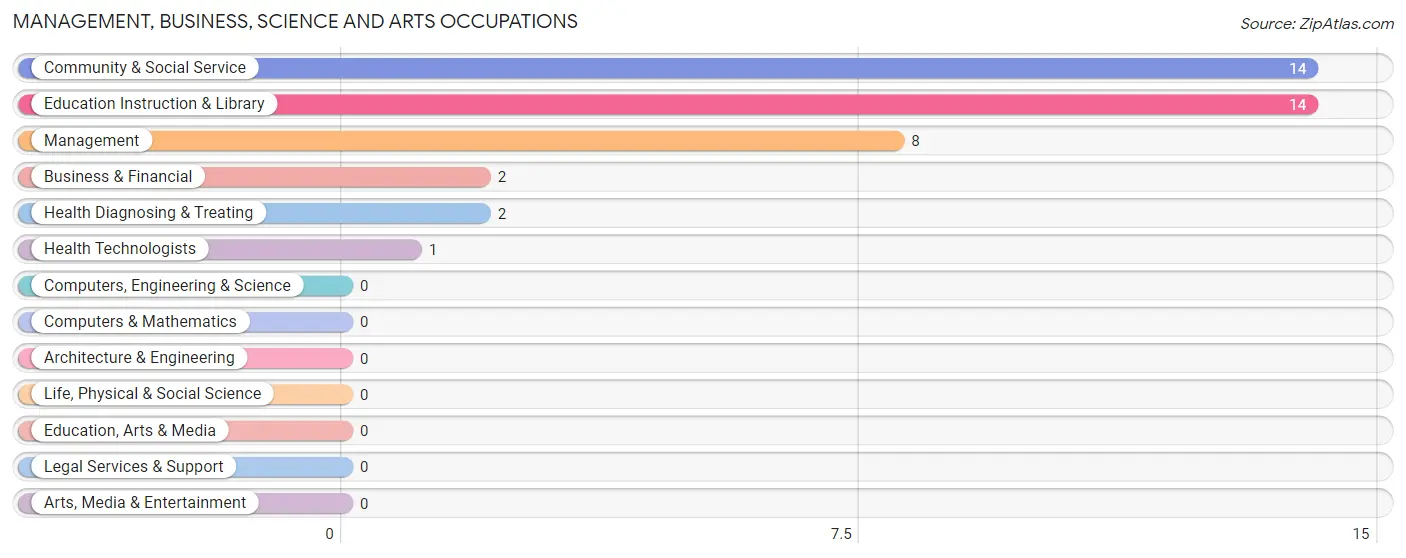
Management, Business, Science and Arts Occupations
The most common Management, Business, Science and Arts occupations in Silver Creek are Community & Social Service (14 | 30.4%), Education Instruction & Library (14 | 30.4%), Management (8 | 17.4%), Business & Financial (2 | 4.3%), and Health Diagnosing & Treating (2 | 4.3%).
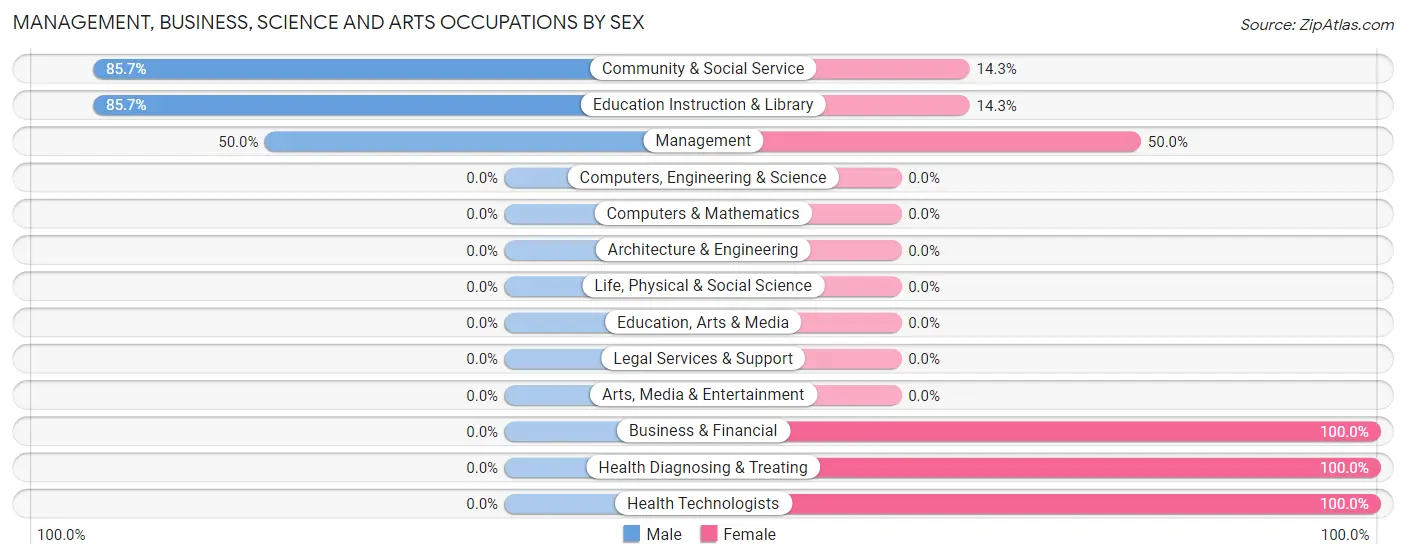
Management, Business, Science and Arts Occupations by Sex
Within the Management, Business, Science and Arts occupations in Silver Creek, the most male-oriented occupations are Community & Social Service (85.7%), Education Instruction & Library (85.7%), and Management (50.0%), while the most female-oriented occupations are Business & Financial (100.0%), Health Diagnosing & Treating (100.0%), and Health Technologists (100.0%).
| Occupation | Male | Female |
| Management | 4 (50.0%) | 4 (50.0%) |
| Business & Financial | 0 (0.0%) | 2 (100.0%) |
| Computers, Engineering & Science | 0 (0.0%) | 0 (0.0%) |
| Computers & Mathematics | 0 (0.0%) | 0 (0.0%) |
| Architecture & Engineering | 0 (0.0%) | 0 (0.0%) |
| Life, Physical & Social Science | 0 (0.0%) | 0 (0.0%) |
| Community & Social Service | 12 (85.7%) | 2 (14.3%) |
| Education, Arts & Media | 0 (0.0%) | 0 (0.0%) |
| Legal Services & Support | 0 (0.0%) | 0 (0.0%) |
| Education Instruction & Library | 12 (85.7%) | 2 (14.3%) |
| Arts, Media & Entertainment | 0 (0.0%) | 0 (0.0%) |
| Health Diagnosing & Treating | 0 (0.0%) | 2 (100.0%) |
| Health Technologists | 0 (0.0%) | 1 (100.0%) |
| Total (Category) | 16 (61.5%) | 10 (38.5%) |
| Total (Overall) | 30 (65.2%) | 16 (34.8%) |
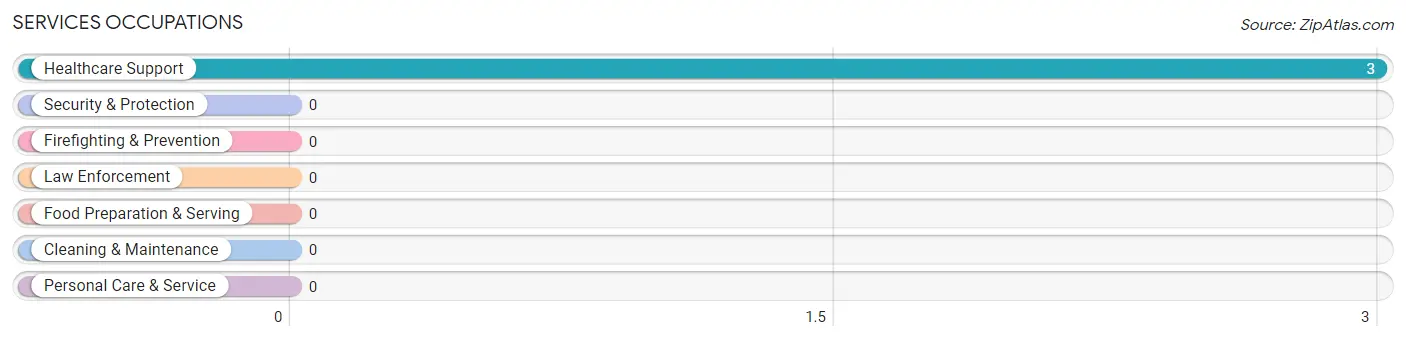
Services Occupations
The most common Services occupations in Silver Creek are , and Healthcare Support (3 | 6.5%).
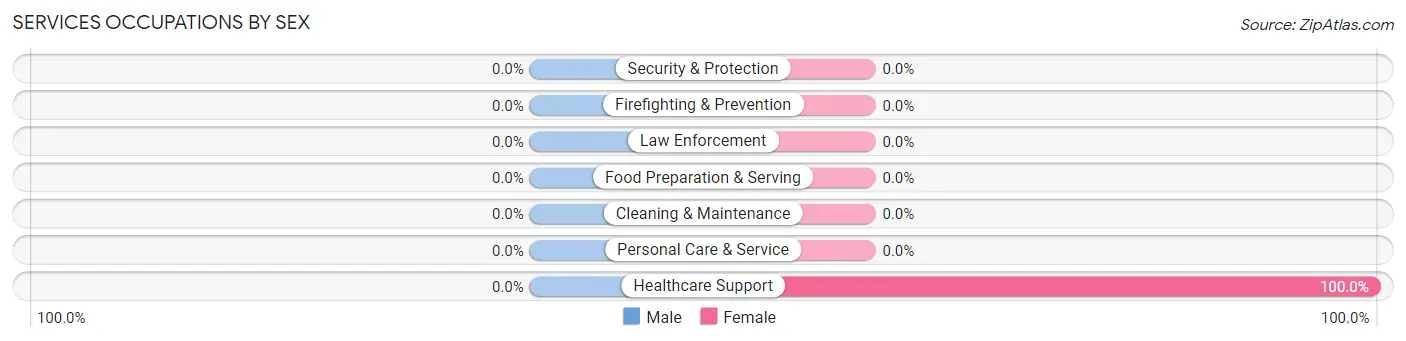
Services Occupations by Sex
| Occupation | Male | Female |
| Healthcare Support | 0 (0.0%) | 3 (100.0%) |
| Security & Protection | 0 (0.0%) | 0 (0.0%) |
| Firefighting & Prevention | 0 (0.0%) | 0 (0.0%) |
| Law Enforcement | 0 (0.0%) | 0 (0.0%) |
| Food Preparation & Serving | 0 (0.0%) | 0 (0.0%) |
| Cleaning & Maintenance | 0 (0.0%) | 0 (0.0%) |
| Personal Care & Service | 0 (0.0%) | 0 (0.0%) |
| Total (Category) | 0 (0.0%) | 3 (100.0%) |
| Total (Overall) | 30 (65.2%) | 16 (34.8%) |
Sales and Office Occupations
The most common Sales and Office occupations in Silver Creek are , and Sales & Related (2 | 4.3%).
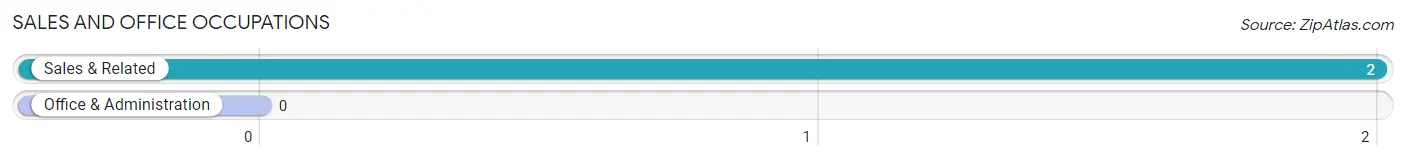
Sales and Office Occupations by Sex

| Occupation | Male | Female |
| Sales & Related | 2 (100.0%) | 0 (0.0%) |
| Office & Administration | 0 (0.0%) | 0 (0.0%) |
| Total (Category) | 2 (100.0%) | 0 (0.0%) |
| Total (Overall) | 30 (65.2%) | 16 (34.8%) |
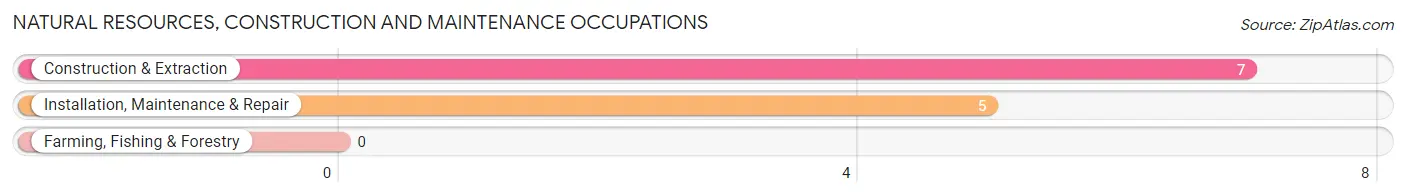
Natural Resources, Construction and Maintenance Occupations
The most common Natural Resources, Construction and Maintenance occupations in Silver Creek are Construction & Extraction (7 | 15.2%), and Installation, Maintenance & Repair (5 | 10.9%).
Natural Resources, Construction and Maintenance Occupations by Sex
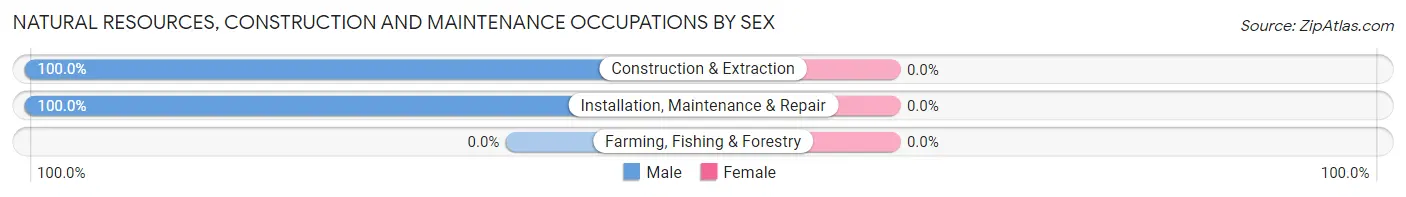
| Occupation | Male | Female |
| Farming, Fishing & Forestry | 0 (0.0%) | 0 (0.0%) |
| Construction & Extraction | 7 (100.0%) | 0 (0.0%) |
| Installation, Maintenance & Repair | 5 (100.0%) | 0 (0.0%) |
| Total (Category) | 12 (100.0%) | 0 (0.0%) |
| Total (Overall) | 30 (65.2%) | 16 (34.8%) |
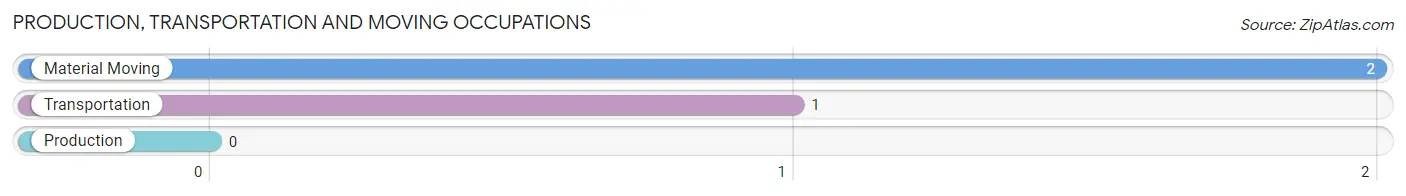
Production, Transportation and Moving Occupations
The most common Production, Transportation and Moving occupations in Silver Creek are Material Moving (2 | 4.3%), and Transportation (1 | 2.2%).
Production, Transportation and Moving Occupations by Sex
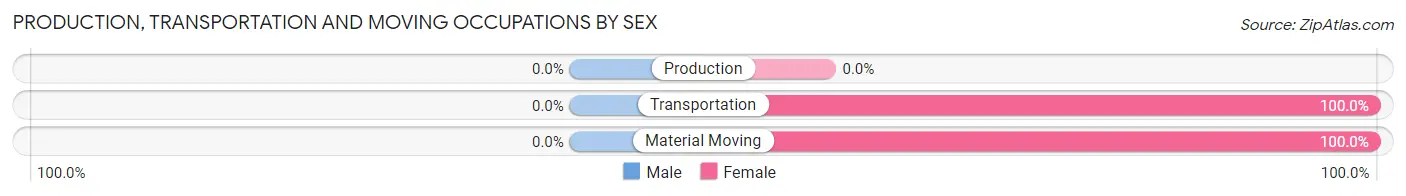
| Occupation | Male | Female |
| Production | 0 (0.0%) | 0 (0.0%) |
| Transportation | 0 (0.0%) | 1 (100.0%) |
| Material Moving | 0 (0.0%) | 2 (100.0%) |
| Total (Category) | 0 (0.0%) | 3 (100.0%) |
| Total (Overall) | 30 (65.2%) | 16 (34.8%) |
Employment Industries by Sex in Silver Creek
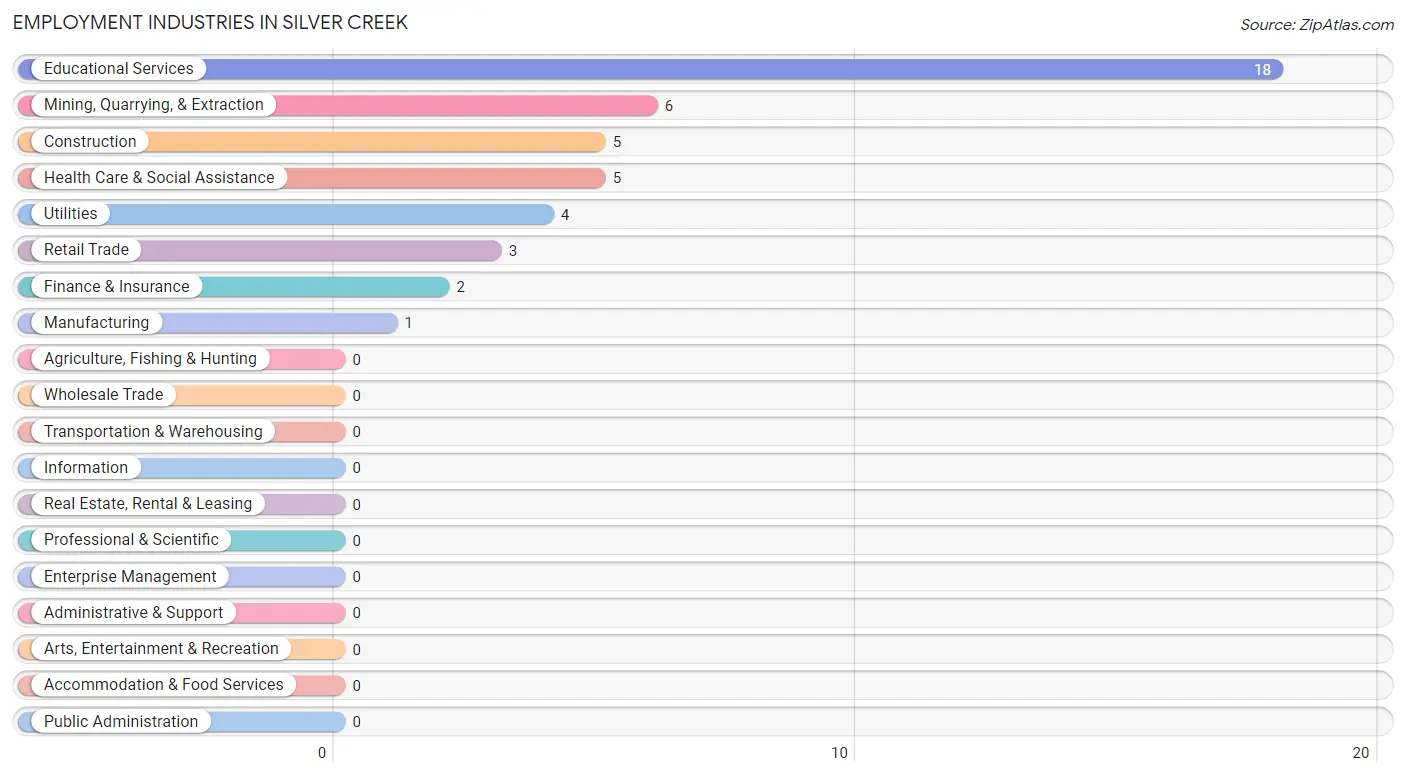
Employment Industries in Silver Creek
The major employment industries in Silver Creek include Educational Services (18 | 39.1%), Mining, Quarrying, & Extraction (6 | 13.0%), Construction (5 | 10.9%), Health Care & Social Assistance (5 | 10.9%), and Utilities (4 | 8.7%).
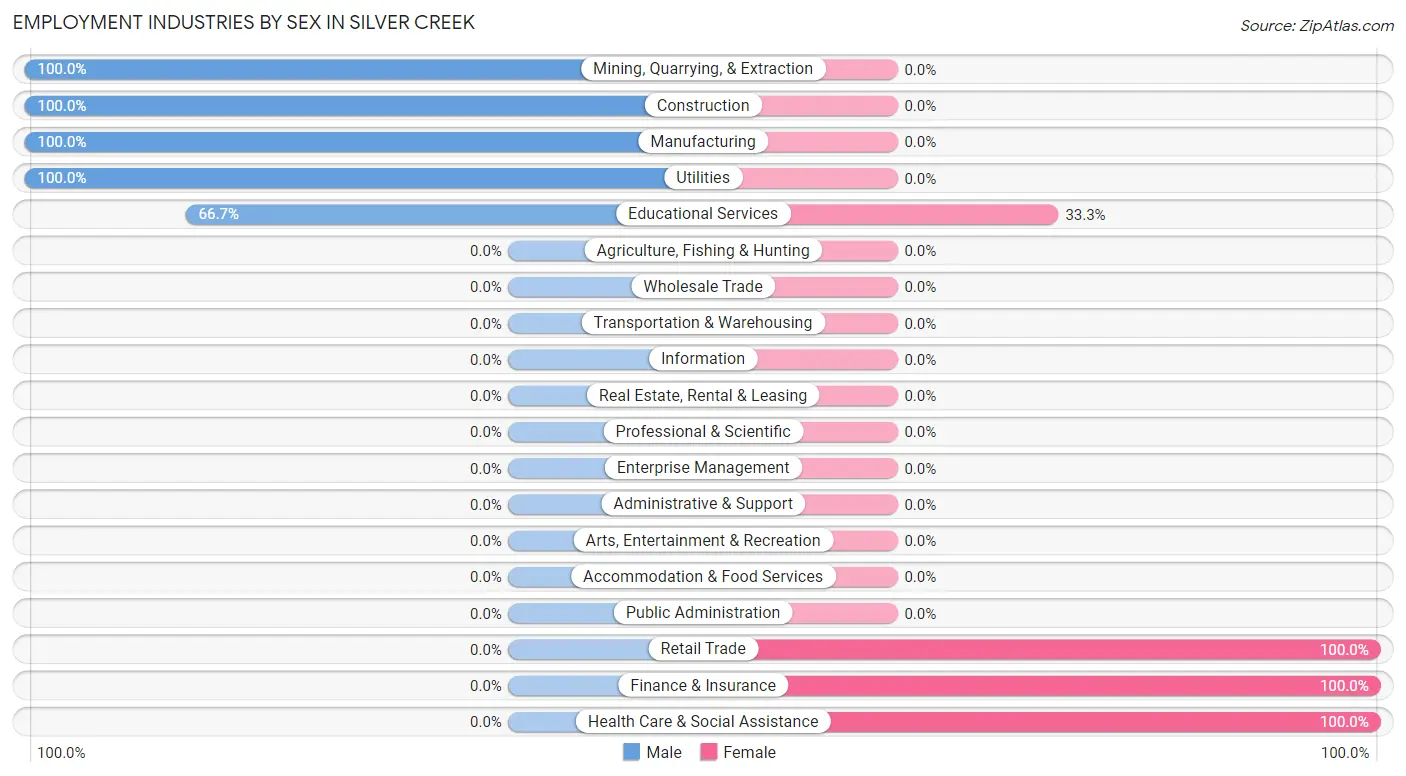
Employment Industries by Sex in Silver Creek
The Silver Creek industries that see more men than women are Mining, Quarrying, & Extraction (100.0%), Construction (100.0%), and Manufacturing (100.0%), whereas the industries that tend to have a higher number of women are Retail Trade (100.0%), Finance & Insurance (100.0%), and Health Care & Social Assistance (100.0%).
| Industry | Male | Female |
| Agriculture, Fishing & Hunting | 0 (0.0%) | 0 (0.0%) |
| Mining, Quarrying, & Extraction | 6 (100.0%) | 0 (0.0%) |
| Construction | 5 (100.0%) | 0 (0.0%) |
| Manufacturing | 1 (100.0%) | 0 (0.0%) |
| Wholesale Trade | 0 (0.0%) | 0 (0.0%) |
| Retail Trade | 0 (0.0%) | 3 (100.0%) |
| Transportation & Warehousing | 0 (0.0%) | 0 (0.0%) |
| Utilities | 4 (100.0%) | 0 (0.0%) |
| Information | 0 (0.0%) | 0 (0.0%) |
| Finance & Insurance | 0 (0.0%) | 2 (100.0%) |
| Real Estate, Rental & Leasing | 0 (0.0%) | 0 (0.0%) |
| Professional & Scientific | 0 (0.0%) | 0 (0.0%) |
| Enterprise Management | 0 (0.0%) | 0 (0.0%) |
| Administrative & Support | 0 (0.0%) | 0 (0.0%) |
| Educational Services | 12 (66.7%) | 6 (33.3%) |
| Health Care & Social Assistance | 0 (0.0%) | 5 (100.0%) |
| Arts, Entertainment & Recreation | 0 (0.0%) | 0 (0.0%) |
| Accommodation & Food Services | 0 (0.0%) | 0 (0.0%) |
| Public Administration | 0 (0.0%) | 0 (0.0%) |
| Total | 30 (65.2%) | 16 (34.8%) |
Education in Silver Creek
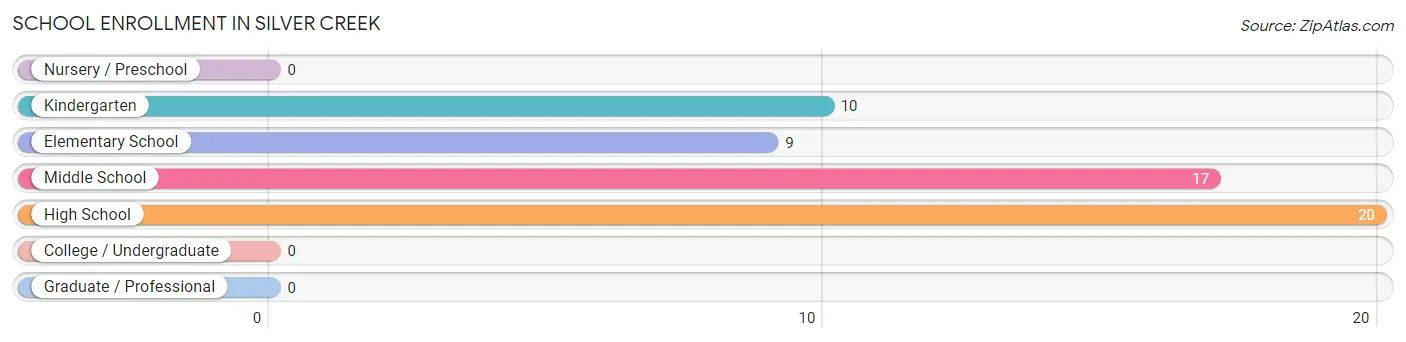
School Enrollment in Silver Creek
The most common levels of schooling among the 56 students in Silver Creek are high school (20 | 35.7%), middle school (17 | 30.4%), and kindergarten (10 | 17.9%).
| School Level | # Students | % Students |
| Nursery / Preschool | 0 | 0.0% |
| Kindergarten | 10 | 17.9% |
| Elementary School | 9 | 16.1% |
| Middle School | 17 | 30.4% |
| High School | 20 | 35.7% |
| College / Undergraduate | 0 | 0.0% |
| Graduate / Professional | 0 | 0.0% |
| Total | 56 | 100.0% |
School Enrollment by Age by Funding Source in Silver Creek
Out of a total of 56 students who are enrolled in schools in Silver Creek, 5 (8.9%) attend a private institution, while the remaining 51 (91.1%) are enrolled in public schools. The age group of 3 to 4 year olds has the highest likelihood of being enrolled in private schools, with 5 (100.0% in the age bracket) enrolled. Conversely, the age group of 5 to 9 year old has the lowest likelihood of being enrolled in a private school, with 12 (100.0% in the age bracket) attending a public institution.
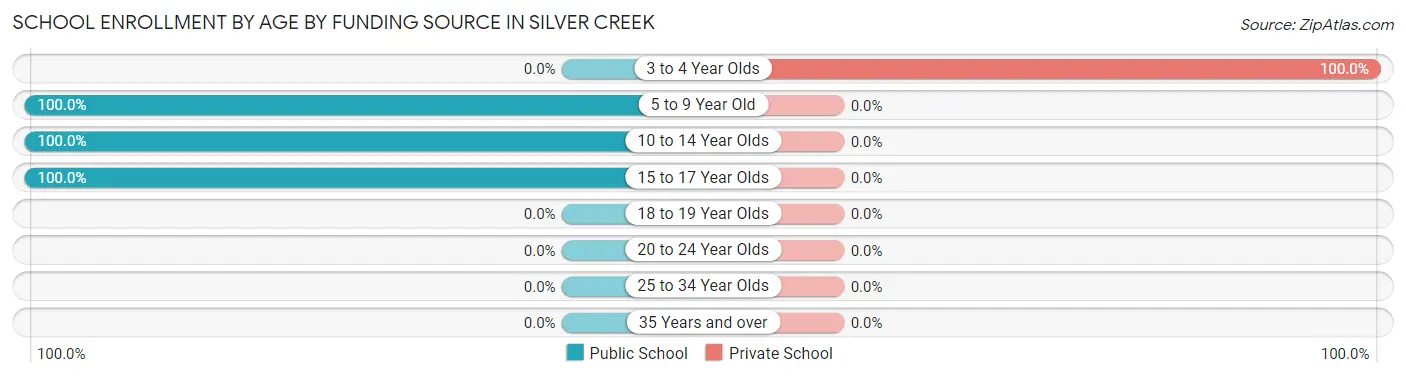
| Age Bracket | Public School | Private School |
| 3 to 4 Year Olds | 0 (0.0%) | 5 (100.0%) |
| 5 to 9 Year Old | 12 (100.0%) | 0 (0.0%) |
| 10 to 14 Year Olds | 33 (100.0%) | 0 (0.0%) |
| 15 to 17 Year Olds | 6 (100.0%) | 0 (0.0%) |
| 18 to 19 Year Olds | 0 (0.0%) | 0 (0.0%) |
| 20 to 24 Year Olds | 0 (0.0%) | 0 (0.0%) |
| 25 to 34 Year Olds | 0 (0.0%) | 0 (0.0%) |
| 35 Years and over | 0 (0.0%) | 0 (0.0%) |
| Total | 51 (91.1%) | 5 (8.9%) |
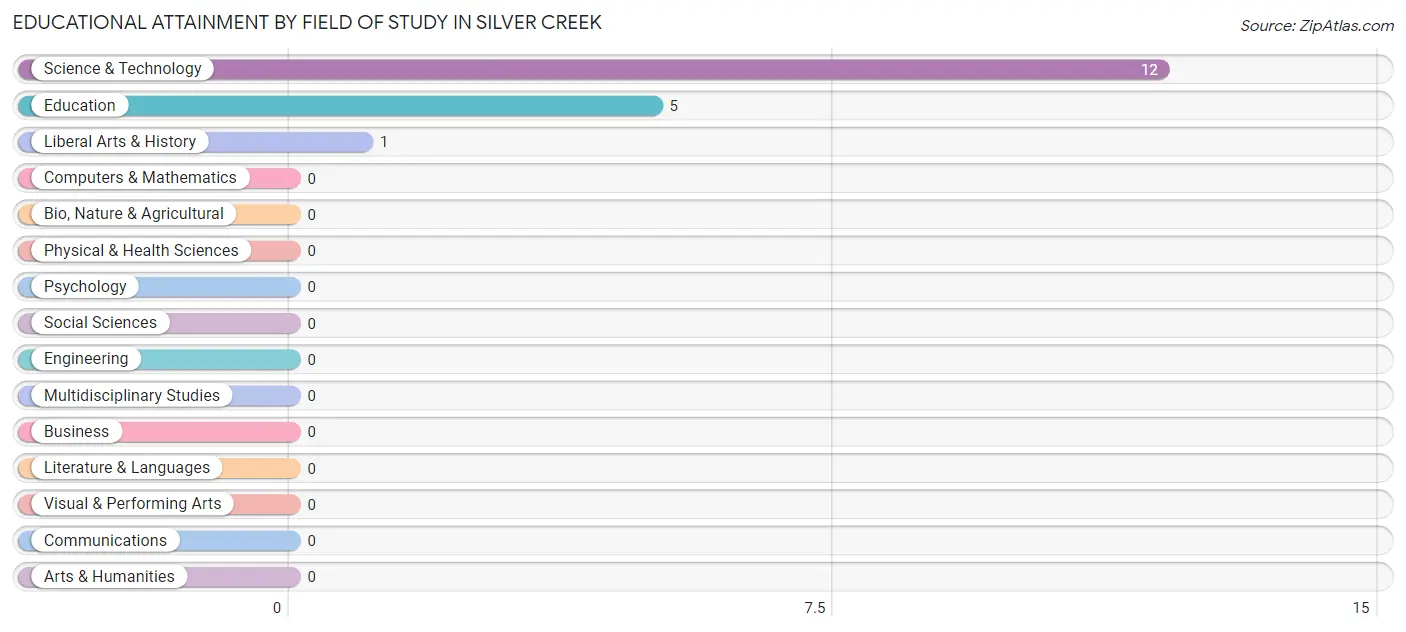
Educational Attainment by Field of Study in Silver Creek
Science & technology (12 | 66.7%), education (5 | 27.8%), and liberal arts & history (1 | 5.6%) are the most common fields of study among 18 individuals in Silver Creek who have obtained a bachelor's degree or higher.
| Field of Study | # Graduates | % Graduates |
| Computers & Mathematics | 0 | 0.0% |
| Bio, Nature & Agricultural | 0 | 0.0% |
| Physical & Health Sciences | 0 | 0.0% |
| Psychology | 0 | 0.0% |
| Social Sciences | 0 | 0.0% |
| Engineering | 0 | 0.0% |
| Multidisciplinary Studies | 0 | 0.0% |
| Science & Technology | 12 | 66.7% |
| Business | 0 | 0.0% |
| Education | 5 | 27.8% |
| Literature & Languages | 0 | 0.0% |
| Liberal Arts & History | 1 | 5.6% |
| Visual & Performing Arts | 0 | 0.0% |
| Communications | 0 | 0.0% |
| Arts & Humanities | 0 | 0.0% |
| Total | 18 | 100.0% |
Transportation & Commute in Silver Creek
Vehicle Availability by Sex in Silver Creek
The most prevalent vehicle ownership categories in Silver Creek are males with 3 vehicles (18, accounting for 60.0%) and females with 3 vehicles (6, making up 112.5%).
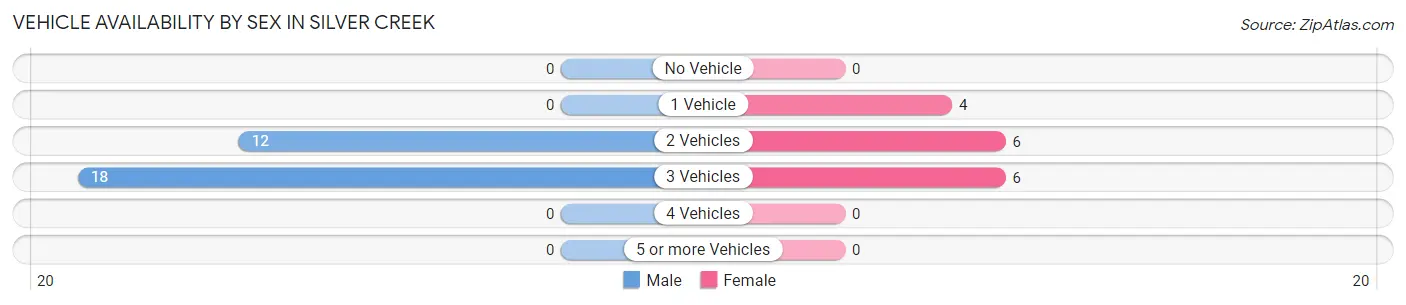
| Vehicles Available | Male | Female |
| No Vehicle | 0 (0.0%) | 0 (0.0%) |
| 1 Vehicle | 0 (0.0%) | 4 (25.0%) |
| 2 Vehicles | 12 (40.0%) | 6 (37.5%) |
| 3 Vehicles | 18 (60.0%) | 6 (37.5%) |
| 4 Vehicles | 0 (0.0%) | 0 (0.0%) |
| 5 or more Vehicles | 0 (0.0%) | 0 (0.0%) |
| Total | 30 (100.0%) | 16 (100.0%) |
Commute Time in Silver Creek
The most frequently occuring commute durations in Silver Creek are 10 to 14 minutes (18 commuters, 39.1%), 90 or more minutes (6 commuters, 13.0%), and 20 to 24 minutes (5 commuters, 10.9%).
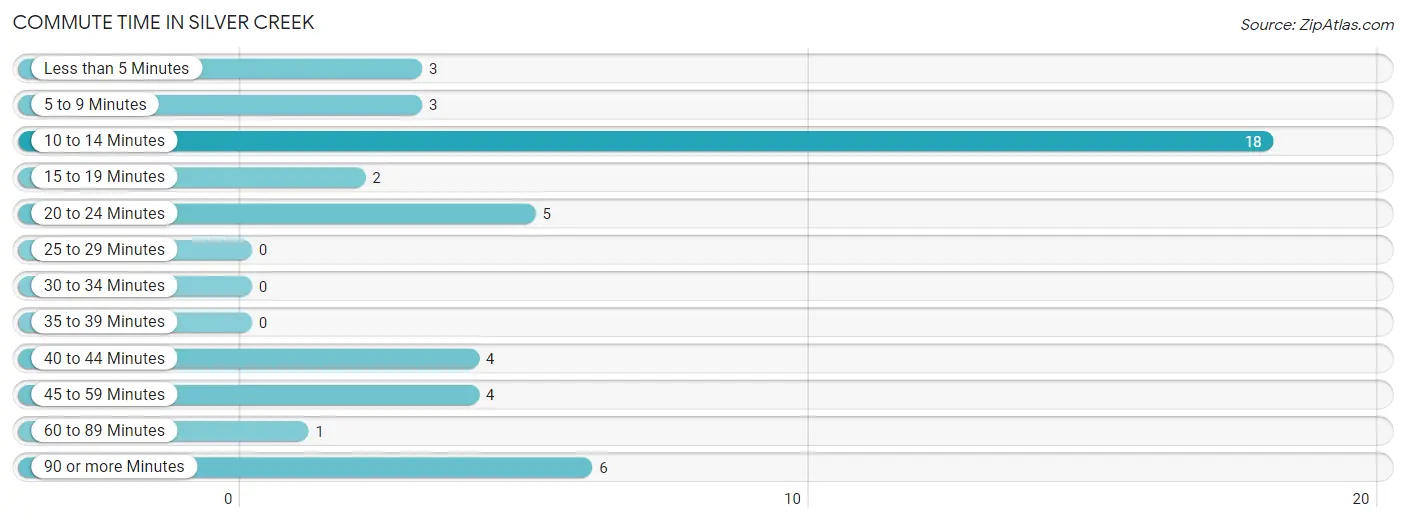
| Commute Time | # Commuters | % Commuters |
| Less than 5 Minutes | 3 | 6.5% |
| 5 to 9 Minutes | 3 | 6.5% |
| 10 to 14 Minutes | 18 | 39.1% |
| 15 to 19 Minutes | 2 | 4.3% |
| 20 to 24 Minutes | 5 | 10.9% |
| 25 to 29 Minutes | 0 | 0.0% |
| 30 to 34 Minutes | 0 | 0.0% |
| 35 to 39 Minutes | 0 | 0.0% |
| 40 to 44 Minutes | 4 | 8.7% |
| 45 to 59 Minutes | 4 | 8.7% |
| 60 to 89 Minutes | 1 | 2.2% |
| 90 or more Minutes | 6 | 13.0% |
Commute Time by Sex in Silver Creek
The most common commute times in Silver Creek are 10 to 14 minutes (12 commuters, 40.0%) for males and 10 to 14 minutes (6 commuters, 37.5%) for females.
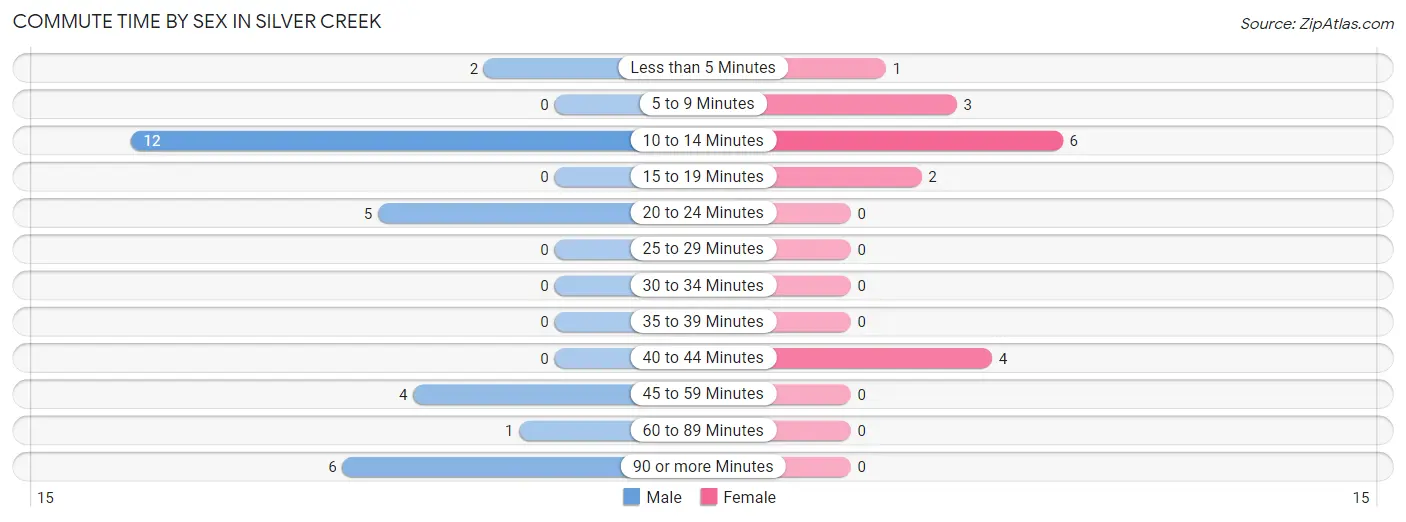
| Commute Time | Male | Female |
| Less than 5 Minutes | 2 (6.7%) | 1 (6.2%) |
| 5 to 9 Minutes | 0 (0.0%) | 3 (18.8%) |
| 10 to 14 Minutes | 12 (40.0%) | 6 (37.5%) |
| 15 to 19 Minutes | 0 (0.0%) | 2 (12.5%) |
| 20 to 24 Minutes | 5 (16.7%) | 0 (0.0%) |
| 25 to 29 Minutes | 0 (0.0%) | 0 (0.0%) |
| 30 to 34 Minutes | 0 (0.0%) | 0 (0.0%) |
| 35 to 39 Minutes | 0 (0.0%) | 0 (0.0%) |
| 40 to 44 Minutes | 0 (0.0%) | 4 (25.0%) |
| 45 to 59 Minutes | 4 (13.3%) | 0 (0.0%) |
| 60 to 89 Minutes | 1 (3.3%) | 0 (0.0%) |
| 90 or more Minutes | 6 (20.0%) | 0 (0.0%) |
Time of Departure to Work by Sex in Silver Creek
The most frequent times of departure to work in Silver Creek are 6:30 AM to 6:59 AM (14, 46.7%) for males and 7:00 AM to 7:29 AM (9, 56.2%) for females.
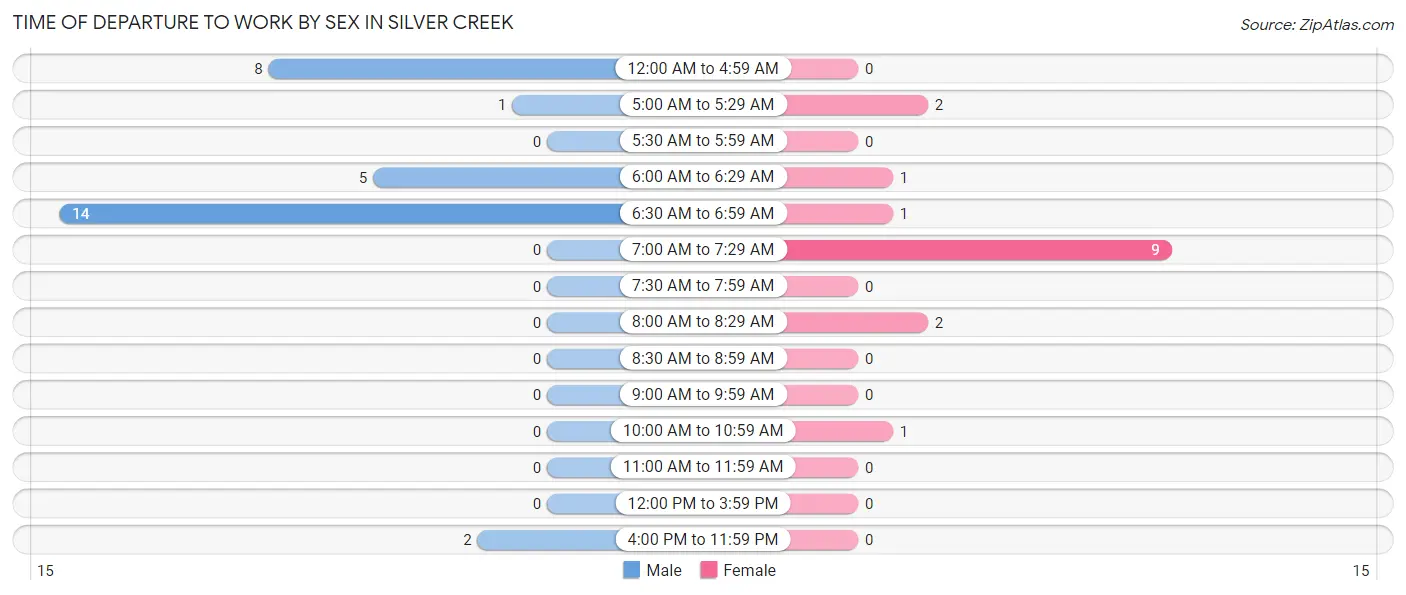
| Time of Departure | Male | Female |
| 12:00 AM to 4:59 AM | 8 (26.7%) | 0 (0.0%) |
| 5:00 AM to 5:29 AM | 1 (3.3%) | 2 (12.5%) |
| 5:30 AM to 5:59 AM | 0 (0.0%) | 0 (0.0%) |
| 6:00 AM to 6:29 AM | 5 (16.7%) | 1 (6.2%) |
| 6:30 AM to 6:59 AM | 14 (46.7%) | 1 (6.2%) |
| 7:00 AM to 7:29 AM | 0 (0.0%) | 9 (56.2%) |
| 7:30 AM to 7:59 AM | 0 (0.0%) | 0 (0.0%) |
| 8:00 AM to 8:29 AM | 0 (0.0%) | 2 (12.5%) |
| 8:30 AM to 8:59 AM | 0 (0.0%) | 0 (0.0%) |
| 9:00 AM to 9:59 AM | 0 (0.0%) | 0 (0.0%) |
| 10:00 AM to 10:59 AM | 0 (0.0%) | 1 (6.2%) |
| 11:00 AM to 11:59 AM | 0 (0.0%) | 0 (0.0%) |
| 12:00 PM to 3:59 PM | 0 (0.0%) | 0 (0.0%) |
| 4:00 PM to 11:59 PM | 2 (6.7%) | 0 (0.0%) |
| Total | 30 (100.0%) | 16 (100.0%) |
Housing Occupancy in Silver Creek
Occupancy by Ownership in Silver Creek
Of the total 61 dwellings in Silver Creek, owner-occupied units account for 53 (86.9%), while renter-occupied units make up 8 (13.1%).
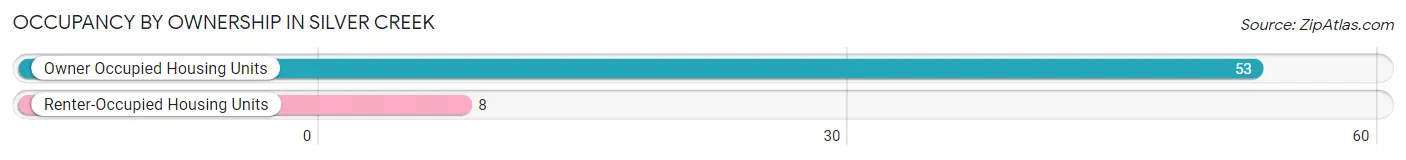
| Occupancy | # Housing Units | % Housing Units |
| Owner Occupied Housing Units | 53 | 86.9% |
| Renter-Occupied Housing Units | 8 | 13.1% |
| Total Occupied Housing Units | 61 | 100.0% |
Occupancy by Household Size in Silver Creek
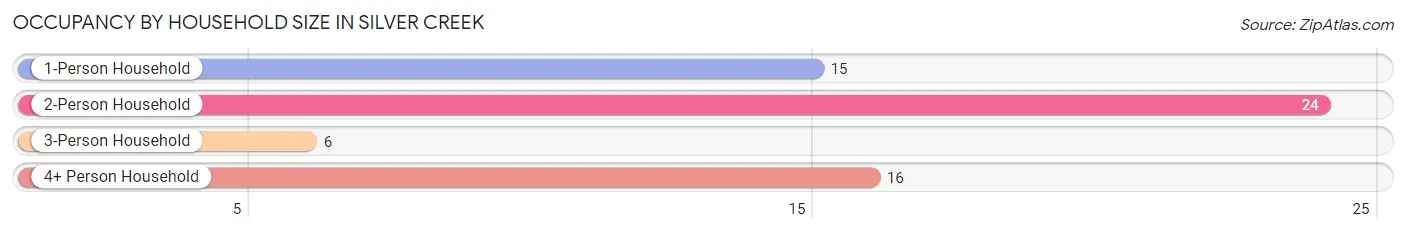
| Household Size | # Housing Units | % Housing Units |
| 1-Person Household | 15 | 24.6% |
| 2-Person Household | 24 | 39.3% |
| 3-Person Household | 6 | 9.8% |
| 4+ Person Household | 16 | 26.2% |
| Total Housing Units | 61 | 100.0% |
Occupancy by Ownership by Household Size in Silver Creek
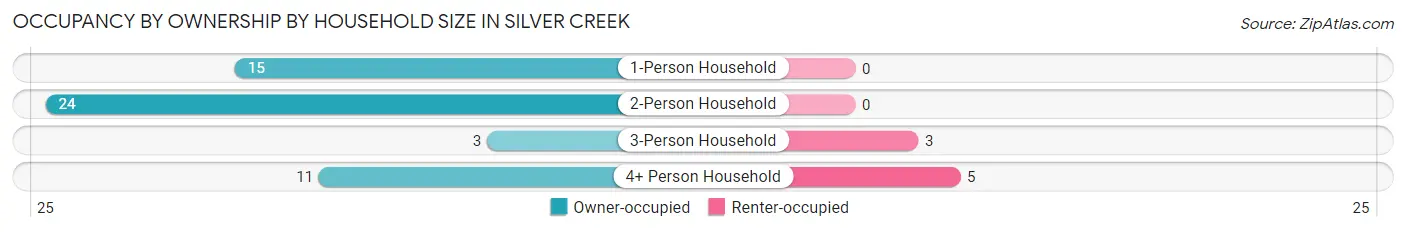
| Household Size | Owner-occupied | Renter-occupied |
| 1-Person Household | 15 (100.0%) | 0 (0.0%) |
| 2-Person Household | 24 (100.0%) | 0 (0.0%) |
| 3-Person Household | 3 (50.0%) | 3 (50.0%) |
| 4+ Person Household | 11 (68.8%) | 5 (31.2%) |
| Total Housing Units | 53 (86.9%) | 8 (13.1%) |
Occupancy by Educational Attainment in Silver Creek
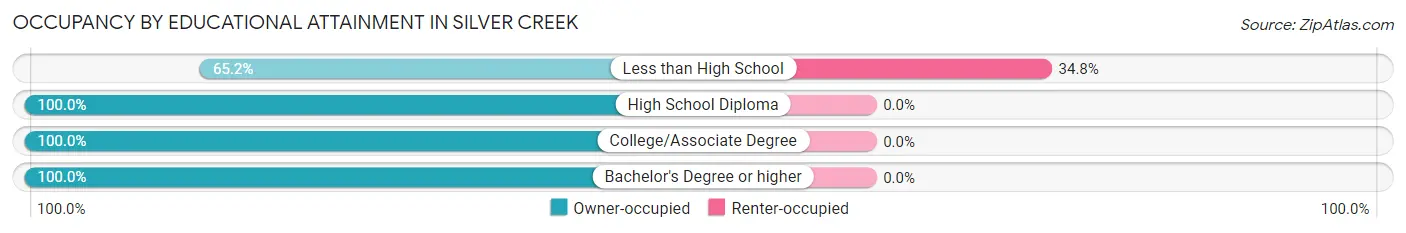
| Household Size | Owner-occupied | Renter-occupied |
| Less than High School | 15 (65.2%) | 8 (34.8%) |
| High School Diploma | 14 (100.0%) | 0 (0.0%) |
| College/Associate Degree | 18 (100.0%) | 0 (0.0%) |
| Bachelor's Degree or higher | 6 (100.0%) | 0 (0.0%) |
Occupancy by Age of Householder in Silver Creek
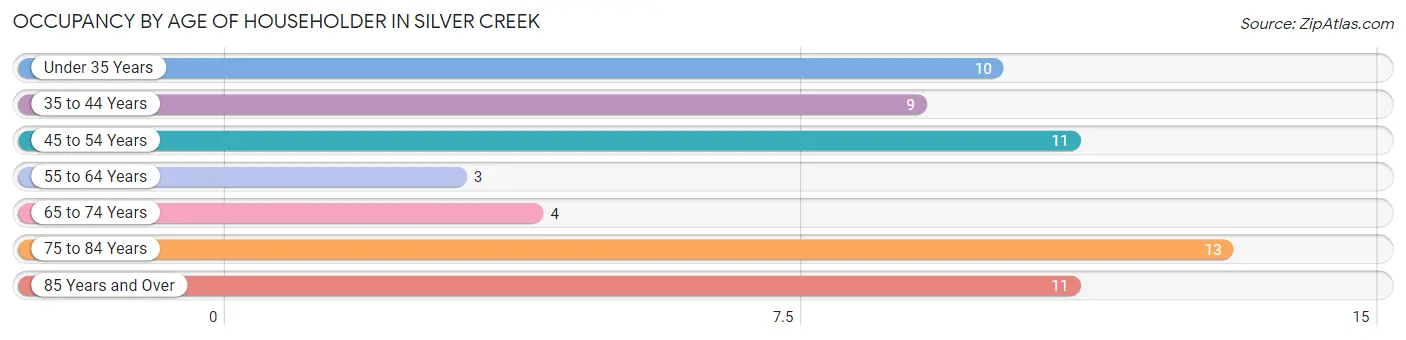
| Age Bracket | # Households | % Households |
| Under 35 Years | 10 | 16.4% |
| 35 to 44 Years | 9 | 14.7% |
| 45 to 54 Years | 11 | 18.0% |
| 55 to 64 Years | 3 | 4.9% |
| 65 to 74 Years | 4 | 6.6% |
| 75 to 84 Years | 13 | 21.3% |
| 85 Years and Over | 11 | 18.0% |
| Total | 61 | 100.0% |
Housing Finances in Silver Creek
Median Income by Occupancy in Silver Creek
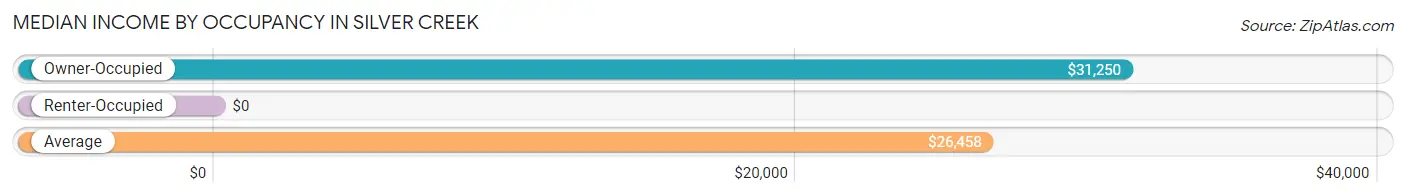
| Occupancy Type | # Households | Median Income |
| Owner-Occupied | 53 (86.9%) | $31,250 |
| Renter-Occupied | 8 (13.1%) | $0 |
| Average | 61 (100.0%) | $26,458 |
Occupancy by Householder Income Bracket in Silver Creek
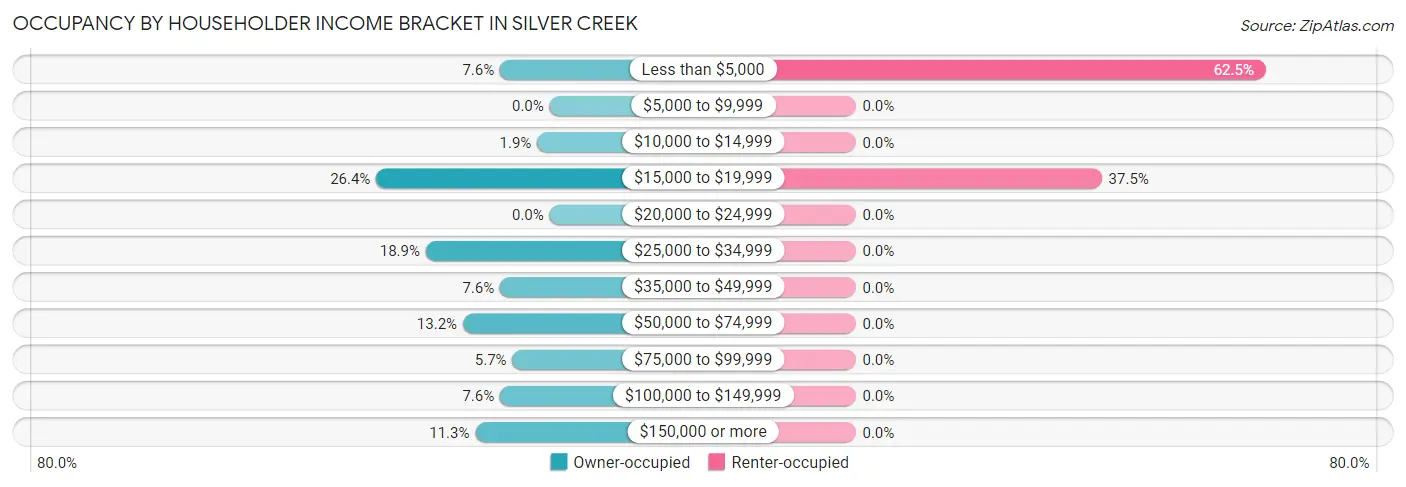
| Income Bracket | Owner-occupied | Renter-occupied |
| Less than $5,000 | 4 (7.5%) | 5 (62.5%) |
| $5,000 to $9,999 | 0 (0.0%) | 0 (0.0%) |
| $10,000 to $14,999 | 1 (1.9%) | 0 (0.0%) |
| $15,000 to $19,999 | 14 (26.4%) | 3 (37.5%) |
| $20,000 to $24,999 | 0 (0.0%) | 0 (0.0%) |
| $25,000 to $34,999 | 10 (18.9%) | 0 (0.0%) |
| $35,000 to $49,999 | 4 (7.5%) | 0 (0.0%) |
| $50,000 to $74,999 | 7 (13.2%) | 0 (0.0%) |
| $75,000 to $99,999 | 3 (5.7%) | 0 (0.0%) |
| $100,000 to $149,999 | 4 (7.5%) | 0 (0.0%) |
| $150,000 or more | 6 (11.3%) | 0 (0.0%) |
| Total | 53 (100.0%) | 8 (100.0%) |
Monthly Housing Cost Tiers in Silver Creek
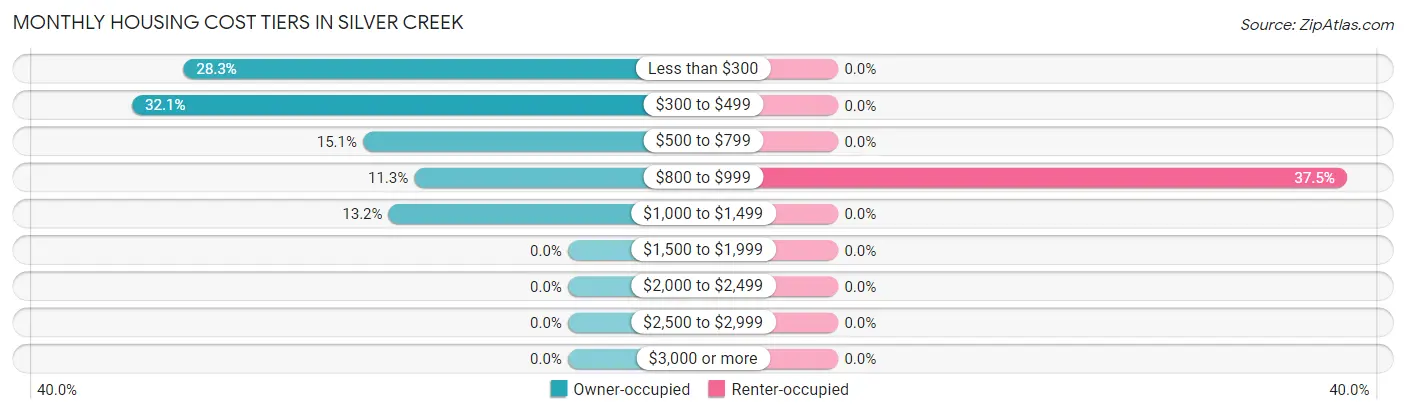
| Monthly Cost | Owner-occupied | Renter-occupied |
| Less than $300 | 15 (28.3%) | 0 (0.0%) |
| $300 to $499 | 17 (32.1%) | 0 (0.0%) |
| $500 to $799 | 8 (15.1%) | 0 (0.0%) |
| $800 to $999 | 6 (11.3%) | 3 (37.5%) |
| $1,000 to $1,499 | 7 (13.2%) | 0 (0.0%) |
| $1,500 to $1,999 | 0 (0.0%) | 0 (0.0%) |
| $2,000 to $2,499 | 0 (0.0%) | 0 (0.0%) |
| $2,500 to $2,999 | 0 (0.0%) | 0 (0.0%) |
| $3,000 or more | 0 (0.0%) | 0 (0.0%) |
| Total | 53 (100.0%) | 8 (100.0%) |
Physical Housing Characteristics in Silver Creek
Housing Structures in Silver Creek
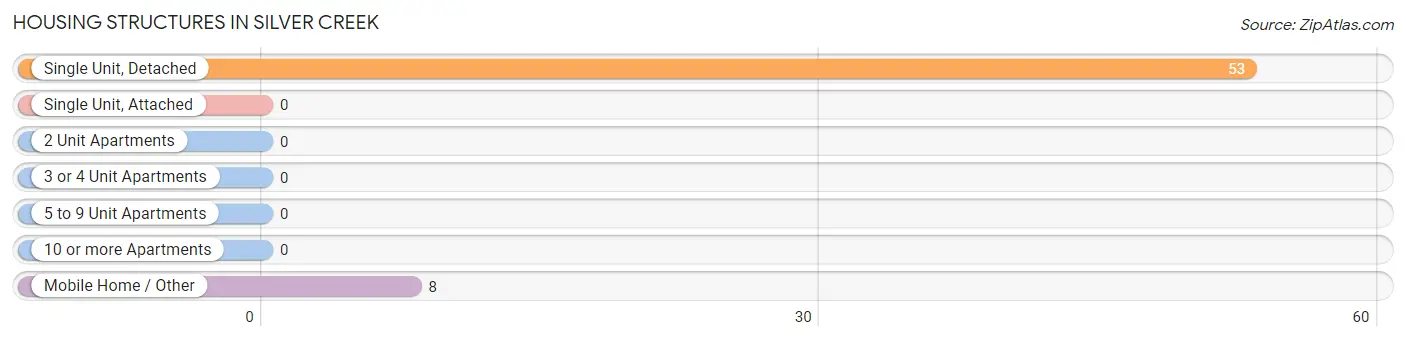
| Structure Type | # Housing Units | % Housing Units |
| Single Unit, Detached | 53 | 86.9% |
| Single Unit, Attached | 0 | 0.0% |
| 2 Unit Apartments | 0 | 0.0% |
| 3 or 4 Unit Apartments | 0 | 0.0% |
| 5 to 9 Unit Apartments | 0 | 0.0% |
| 10 or more Apartments | 0 | 0.0% |
| Mobile Home / Other | 8 | 13.1% |
| Total | 61 | 100.0% |
Housing Structures by Occupancy in Silver Creek
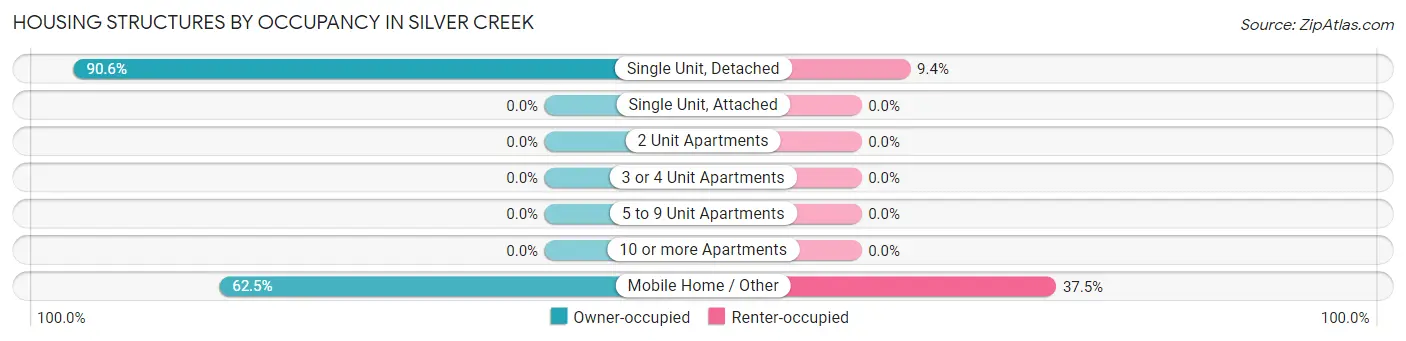
| Structure Type | Owner-occupied | Renter-occupied |
| Single Unit, Detached | 48 (90.6%) | 5 (9.4%) |
| Single Unit, Attached | 0 (0.0%) | 0 (0.0%) |
| 2 Unit Apartments | 0 (0.0%) | 0 (0.0%) |
| 3 or 4 Unit Apartments | 0 (0.0%) | 0 (0.0%) |
| 5 to 9 Unit Apartments | 0 (0.0%) | 0 (0.0%) |
| 10 or more Apartments | 0 (0.0%) | 0 (0.0%) |
| Mobile Home / Other | 5 (62.5%) | 3 (37.5%) |
| Total | 53 (86.9%) | 8 (13.1%) |
Housing Structures by Number of Rooms in Silver Creek
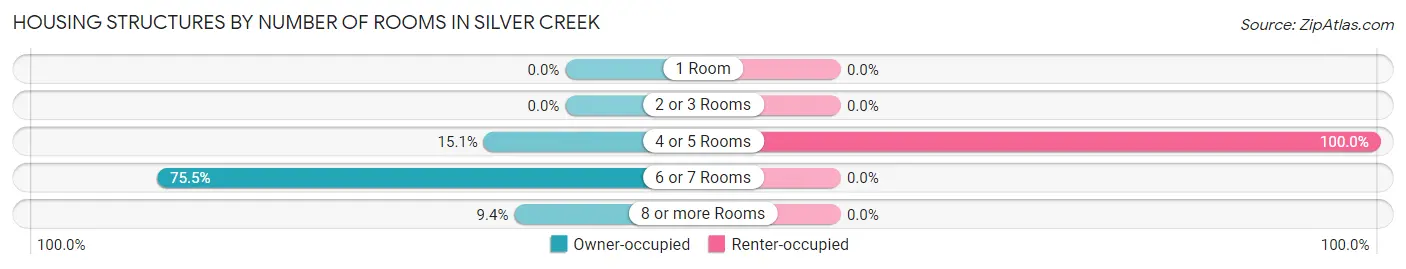
| Number of Rooms | Owner-occupied | Renter-occupied |
| 1 Room | 0 (0.0%) | 0 (0.0%) |
| 2 or 3 Rooms | 0 (0.0%) | 0 (0.0%) |
| 4 or 5 Rooms | 8 (15.1%) | 8 (100.0%) |
| 6 or 7 Rooms | 40 (75.5%) | 0 (0.0%) |
| 8 or more Rooms | 5 (9.4%) | 0 (0.0%) |
| Total | 53 (100.0%) | 8 (100.0%) |
Housing Structure by Heating Type in Silver Creek
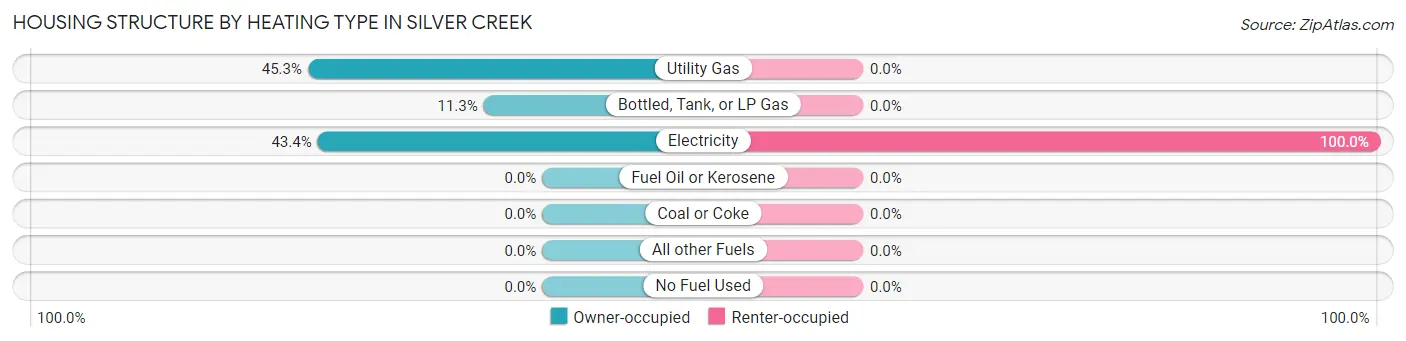
| Heating Type | Owner-occupied | Renter-occupied |
| Utility Gas | 24 (45.3%) | 0 (0.0%) |
| Bottled, Tank, or LP Gas | 6 (11.3%) | 0 (0.0%) |
| Electricity | 23 (43.4%) | 8 (100.0%) |
| Fuel Oil or Kerosene | 0 (0.0%) | 0 (0.0%) |
| Coal or Coke | 0 (0.0%) | 0 (0.0%) |
| All other Fuels | 0 (0.0%) | 0 (0.0%) |
| No Fuel Used | 0 (0.0%) | 0 (0.0%) |
| Total | 53 (100.0%) | 8 (100.0%) |
Household Vehicle Usage in Silver Creek
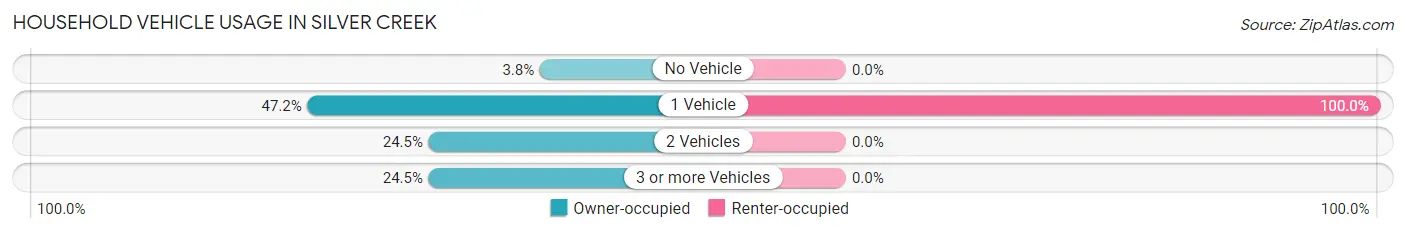
| Vehicles per Household | Owner-occupied | Renter-occupied |
| No Vehicle | 2 (3.8%) | 0 (0.0%) |
| 1 Vehicle | 25 (47.2%) | 8 (100.0%) |
| 2 Vehicles | 13 (24.5%) | 0 (0.0%) |
| 3 or more Vehicles | 13 (24.5%) | 0 (0.0%) |
| Total | 53 (100.0%) | 8 (100.0%) |
Real Estate & Mortgages in Silver Creek
Real Estate and Mortgage Overview in Silver Creek
| Characteristic | Without Mortgage | With Mortgage |
| Housing Units | 31 | 22 |
| Median Property Value | $73,800 | $84,300 |
| Median Household Income | $30,417 | $6 |
| Monthly Housing Costs | $305 | $0 |
| Real Estate Taxes | $833 | $11 |
Property Value by Mortgage Status in Silver Creek
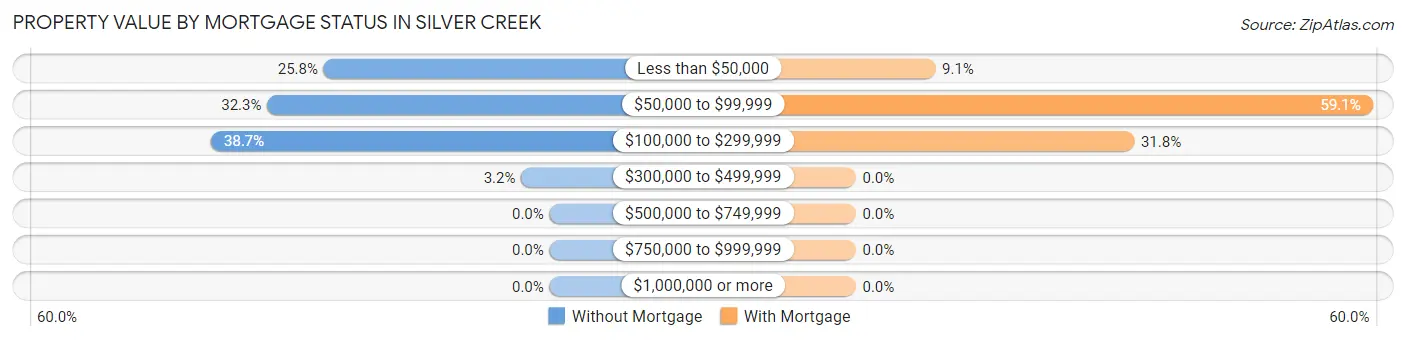
| Property Value | Without Mortgage | With Mortgage |
| Less than $50,000 | 8 (25.8%) | 2 (9.1%) |
| $50,000 to $99,999 | 10 (32.3%) | 13 (59.1%) |
| $100,000 to $299,999 | 12 (38.7%) | 7 (31.8%) |
| $300,000 to $499,999 | 1 (3.2%) | 0 (0.0%) |
| $500,000 to $749,999 | 0 (0.0%) | 0 (0.0%) |
| $750,000 to $999,999 | 0 (0.0%) | 0 (0.0%) |
| $1,000,000 or more | 0 (0.0%) | 0 (0.0%) |
| Total | 31 (100.0%) | 22 (100.0%) |
Household Income by Mortgage Status in Silver Creek
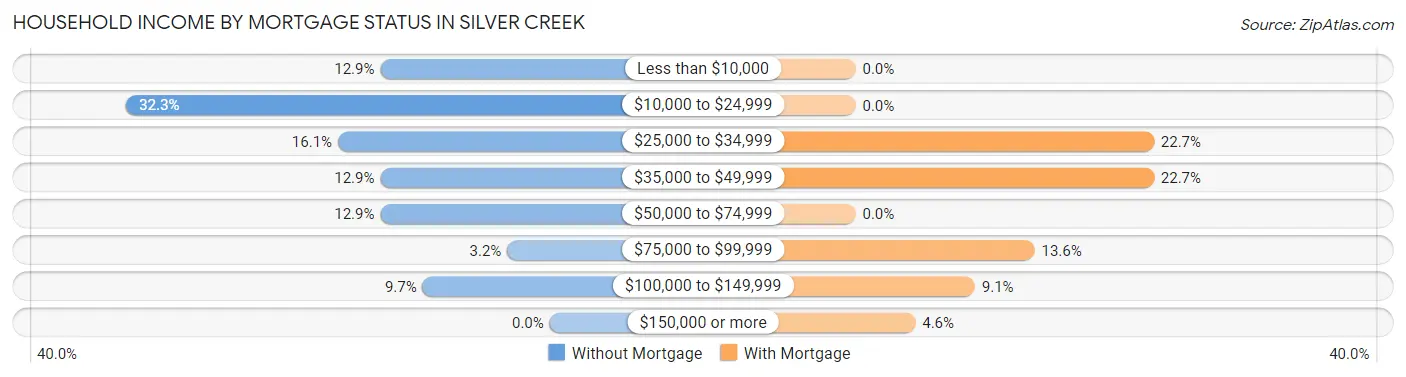
| Household Income | Without Mortgage | With Mortgage |
| Less than $10,000 | 4 (12.9%) | 0 (0.0%) |
| $10,000 to $24,999 | 10 (32.3%) | 0 (0.0%) |
| $25,000 to $34,999 | 5 (16.1%) | 5 (22.7%) |
| $35,000 to $49,999 | 4 (12.9%) | 5 (22.7%) |
| $50,000 to $74,999 | 4 (12.9%) | 0 (0.0%) |
| $75,000 to $99,999 | 1 (3.2%) | 3 (13.6%) |
| $100,000 to $149,999 | 3 (9.7%) | 2 (9.1%) |
| $150,000 or more | 0 (0.0%) | 1 (4.5%) |
| Total | 31 (100.0%) | 22 (100.0%) |
Property Value to Household Income Ratio in Silver Creek
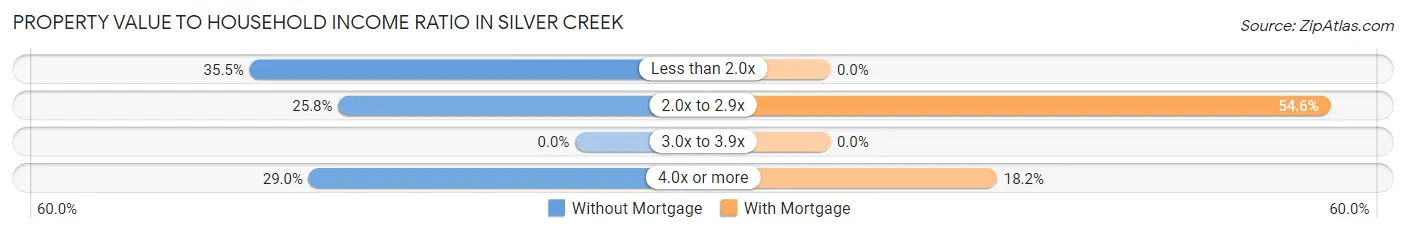
| Value-to-Income Ratio | Without Mortgage | With Mortgage |
| Less than 2.0x | 11 (35.5%) | 0 (0.0%) |
| 2.0x to 2.9x | 8 (25.8%) | 12 (54.5%) |
| 3.0x to 3.9x | 0 (0.0%) | 0 (0.0%) |
| 4.0x or more | 9 (29.0%) | 4 (18.2%) |
| Total | 31 (100.0%) | 22 (100.0%) |
Real Estate Taxes by Mortgage Status in Silver Creek
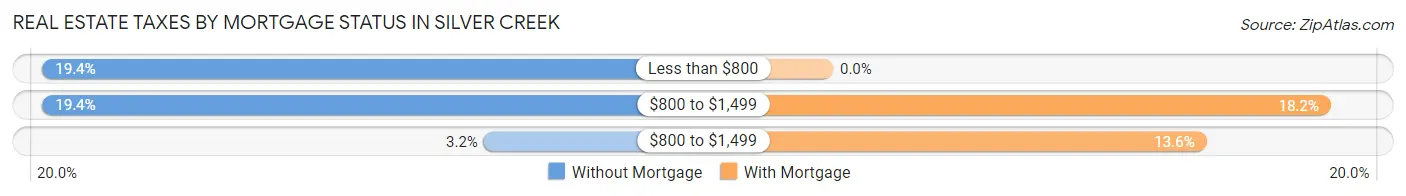
| Property Taxes | Without Mortgage | With Mortgage |
| Less than $800 | 6 (19.4%) | 0 (0.0%) |
| $800 to $1,499 | 6 (19.4%) | 4 (18.2%) |
| $800 to $1,499 | 1 (3.2%) | 3 (13.6%) |
| Total | 31 (100.0%) | 22 (100.0%) |
Health & Disability in Silver Creek
Health Insurance Coverage by Age in Silver Creek
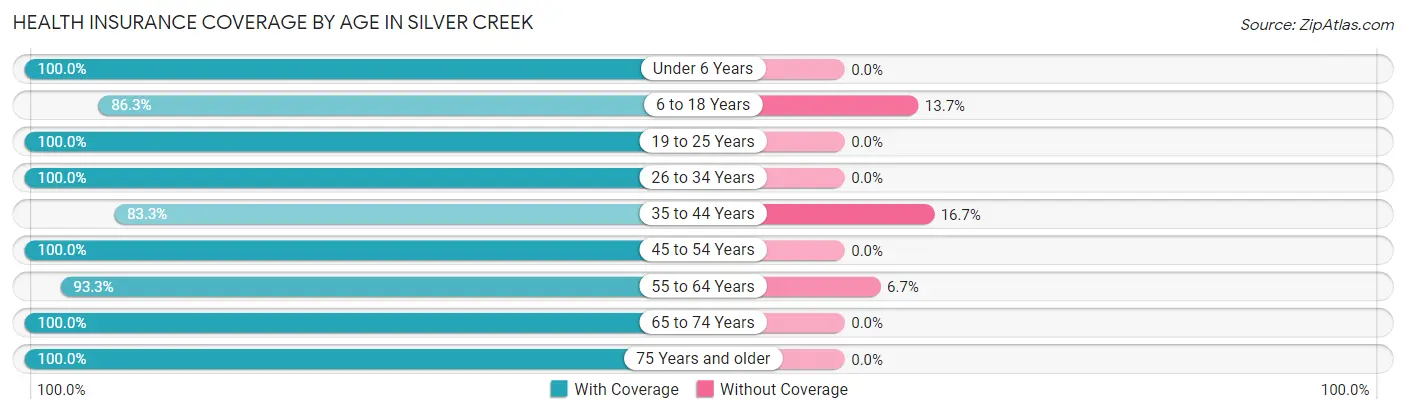
| Age Bracket | With Coverage | Without Coverage |
| Under 6 Years | 21 (100.0%) | 0 (0.0%) |
| 6 to 18 Years | 44 (86.3%) | 7 (13.7%) |
| 19 to 25 Years | 14 (100.0%) | 0 (0.0%) |
| 26 to 34 Years | 13 (100.0%) | 0 (0.0%) |
| 35 to 44 Years | 25 (83.3%) | 5 (16.7%) |
| 45 to 54 Years | 19 (100.0%) | 0 (0.0%) |
| 55 to 64 Years | 14 (93.3%) | 1 (6.7%) |
| 65 to 74 Years | 22 (100.0%) | 0 (0.0%) |
| 75 Years and older | 24 (100.0%) | 0 (0.0%) |
| Total | 196 (93.8%) | 13 (6.2%) |
Health Insurance Coverage by Citizenship Status in Silver Creek
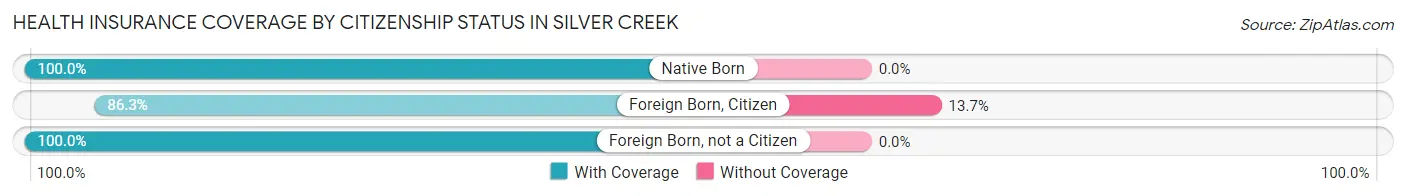
| Citizenship Status | With Coverage | Without Coverage |
| Native Born | 21 (100.0%) | 0 (0.0%) |
| Foreign Born, Citizen | 44 (86.3%) | 7 (13.7%) |
| Foreign Born, not a Citizen | 14 (100.0%) | 0 (0.0%) |
Health Insurance Coverage by Household Income in Silver Creek
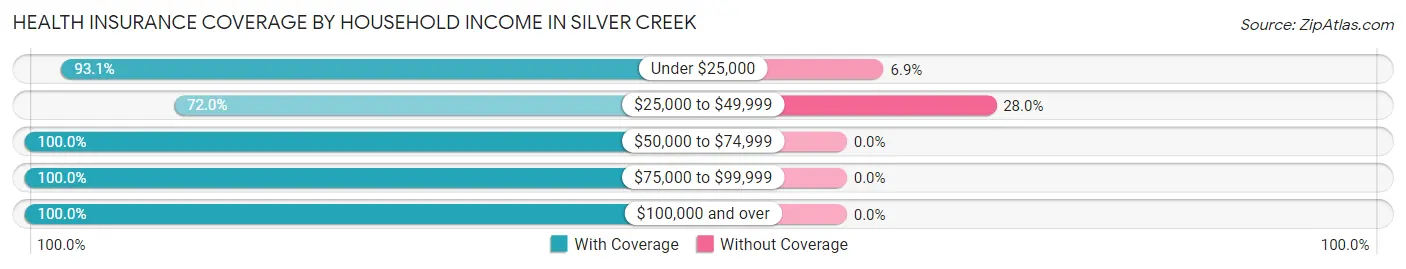
| Household Income | With Coverage | Without Coverage |
| Under $25,000 | 81 (93.1%) | 6 (6.9%) |
| $25,000 to $49,999 | 18 (72.0%) | 7 (28.0%) |
| $50,000 to $74,999 | 28 (100.0%) | 0 (0.0%) |
| $75,000 to $99,999 | 8 (100.0%) | 0 (0.0%) |
| $100,000 and over | 61 (100.0%) | 0 (0.0%) |
Public vs Private Health Insurance Coverage by Age in Silver Creek
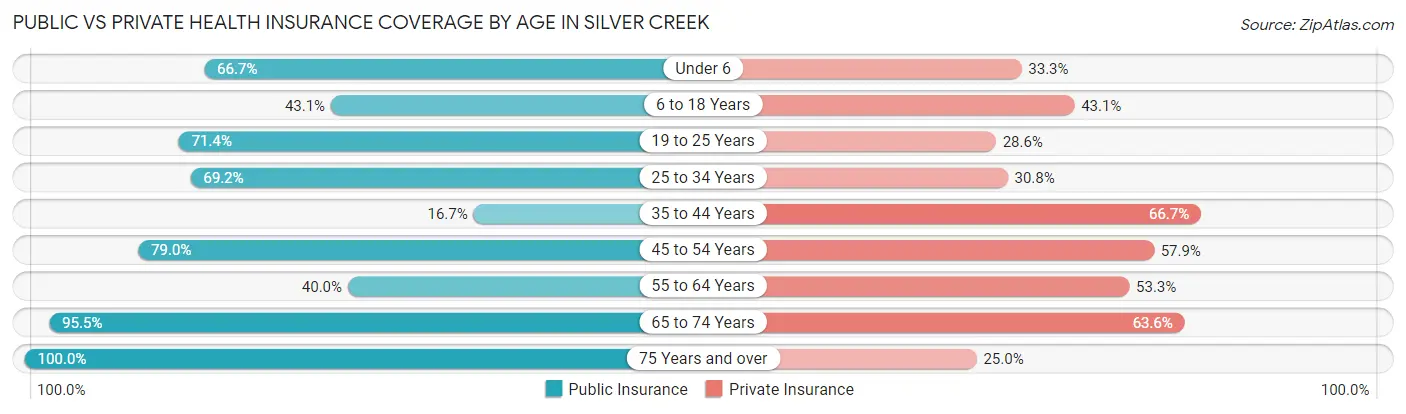
| Age Bracket | Public Insurance | Private Insurance |
| Under 6 | 14 (66.7%) | 7 (33.3%) |
| 6 to 18 Years | 22 (43.1%) | 22 (43.1%) |
| 19 to 25 Years | 10 (71.4%) | 4 (28.6%) |
| 25 to 34 Years | 9 (69.2%) | 4 (30.8%) |
| 35 to 44 Years | 5 (16.7%) | 20 (66.7%) |
| 45 to 54 Years | 15 (78.9%) | 11 (57.9%) |
| 55 to 64 Years | 6 (40.0%) | 8 (53.3%) |
| 65 to 74 Years | 21 (95.5%) | 14 (63.6%) |
| 75 Years and over | 24 (100.0%) | 6 (25.0%) |
| Total | 126 (60.3%) | 96 (45.9%) |
Disability Status by Sex by Age in Silver Creek
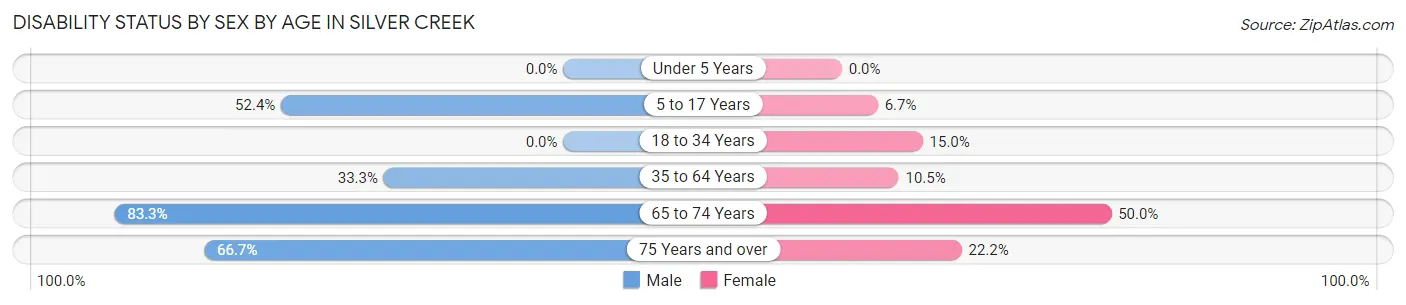
| Age Bracket | Male | Female |
| Under 5 Years | 0 (0.0%) | 0 (0.0%) |
| 5 to 17 Years | 11 (52.4%) | 2 (6.7%) |
| 18 to 34 Years | 0 (0.0%) | 3 (15.0%) |
| 35 to 64 Years | 15 (33.3%) | 2 (10.5%) |
| 65 to 74 Years | 5 (83.3%) | 8 (50.0%) |
| 75 Years and over | 10 (66.7%) | 2 (22.2%) |
Disability Class by Sex by Age in Silver Creek
Disability Class: Hearing Difficulty
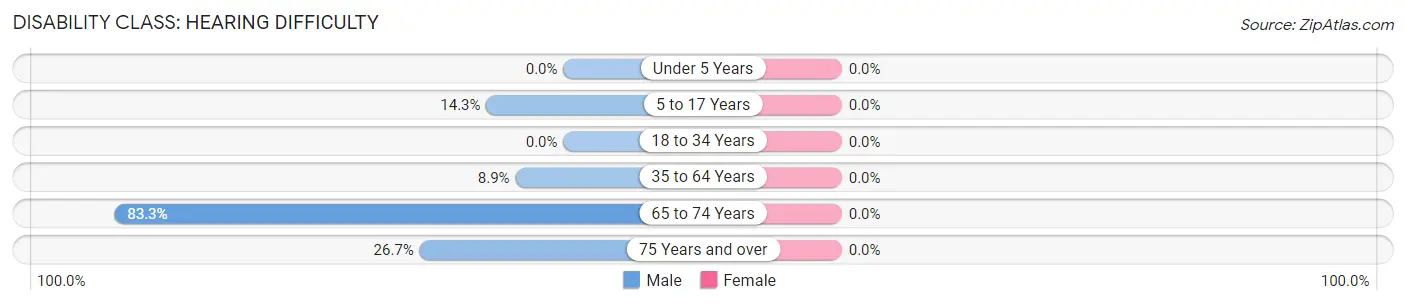
| Age Bracket | Male | Female |
| Under 5 Years | 0 (0.0%) | 0 (0.0%) |
| 5 to 17 Years | 3 (14.3%) | 0 (0.0%) |
| 18 to 34 Years | 0 (0.0%) | 0 (0.0%) |
| 35 to 64 Years | 4 (8.9%) | 0 (0.0%) |
| 65 to 74 Years | 5 (83.3%) | 0 (0.0%) |
| 75 Years and over | 4 (26.7%) | 0 (0.0%) |
Disability Class: Vision Difficulty
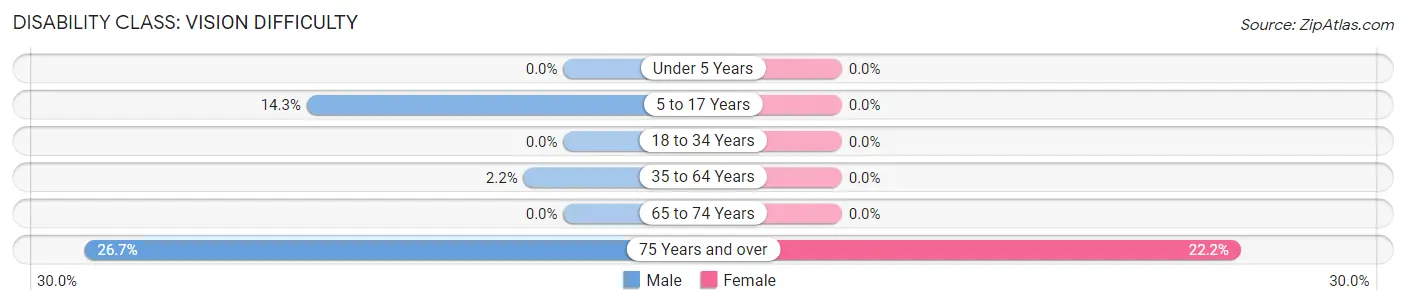
| Age Bracket | Male | Female |
| Under 5 Years | 0 (0.0%) | 0 (0.0%) |
| 5 to 17 Years | 3 (14.3%) | 0 (0.0%) |
| 18 to 34 Years | 0 (0.0%) | 0 (0.0%) |
| 35 to 64 Years | 1 (2.2%) | 0 (0.0%) |
| 65 to 74 Years | 0 (0.0%) | 0 (0.0%) |
| 75 Years and over | 4 (26.7%) | 2 (22.2%) |
Disability Class: Cognitive Difficulty
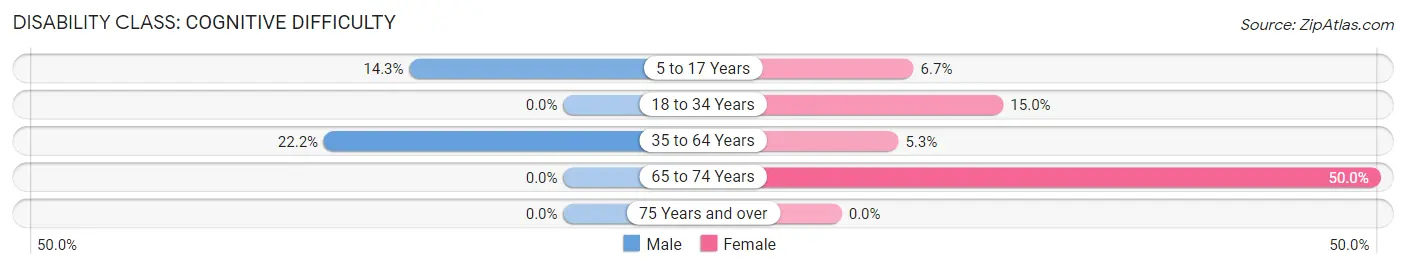
| Age Bracket | Male | Female |
| 5 to 17 Years | 3 (14.3%) | 2 (6.7%) |
| 18 to 34 Years | 0 (0.0%) | 3 (15.0%) |
| 35 to 64 Years | 10 (22.2%) | 1 (5.3%) |
| 65 to 74 Years | 0 (0.0%) | 8 (50.0%) |
| 75 Years and over | 0 (0.0%) | 0 (0.0%) |
Disability Class: Ambulatory Difficulty
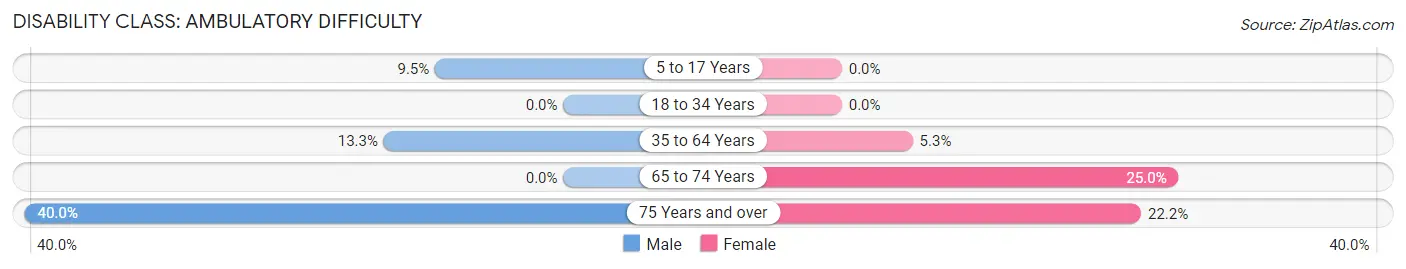
| Age Bracket | Male | Female |
| 5 to 17 Years | 2 (9.5%) | 0 (0.0%) |
| 18 to 34 Years | 0 (0.0%) | 0 (0.0%) |
| 35 to 64 Years | 6 (13.3%) | 1 (5.3%) |
| 65 to 74 Years | 0 (0.0%) | 4 (25.0%) |
| 75 Years and over | 6 (40.0%) | 2 (22.2%) |
Disability Class: Self-Care Difficulty
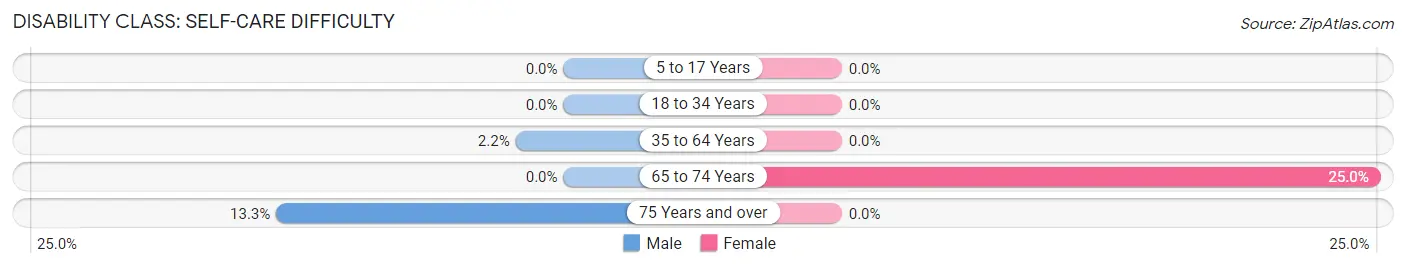
| Age Bracket | Male | Female |
| 5 to 17 Years | 0 (0.0%) | 0 (0.0%) |
| 18 to 34 Years | 0 (0.0%) | 0 (0.0%) |
| 35 to 64 Years | 1 (2.2%) | 0 (0.0%) |
| 65 to 74 Years | 0 (0.0%) | 4 (25.0%) |
| 75 Years and over | 2 (13.3%) | 0 (0.0%) |
Technology Access in Silver Creek
Computing Device Access in Silver Creek
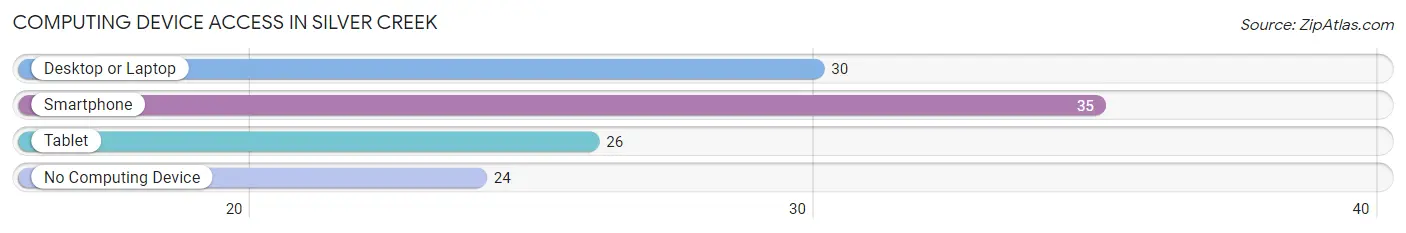
| Device Type | # Households | % Households |
| Desktop or Laptop | 30 | 49.2% |
| Smartphone | 35 | 57.4% |
| Tablet | 26 | 42.6% |
| No Computing Device | 24 | 39.3% |
| Total | 61 | 100.0% |
Internet Access in Silver Creek
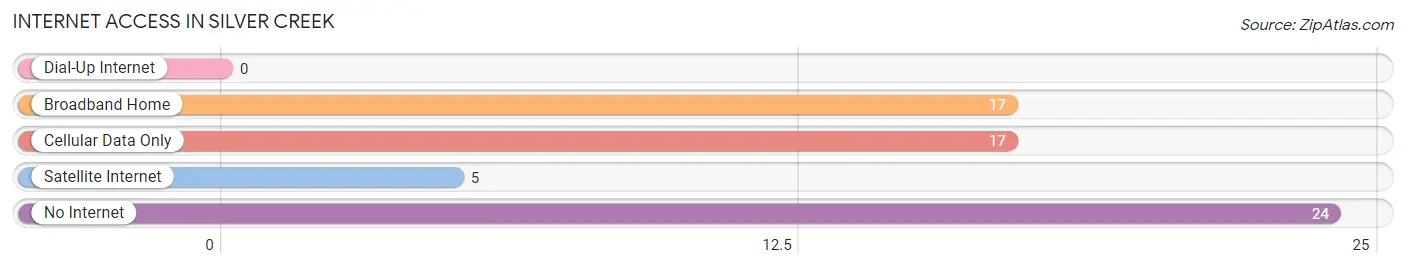
| Internet Type | # Households | % Households |
| Dial-Up Internet | 0 | 0.0% |
| Broadband Home | 17 | 27.9% |
| Cellular Data Only | 17 | 27.9% |
| Satellite Internet | 5 | 8.2% |
| No Internet | 24 | 39.3% |
| Total | 61 | 100.0% |
Silver Creek Summary
Introduction
Silver Creek is a small town located in the state of Mississippi, United States. It is situated in the northern part of the state, in the county of Tishomingo. The town is located on the banks of the Tennessee River and is home to a population of around 1,000 people. The town is known for its rich history, its unique geography, its vibrant economy, and its diverse demographics.
History
Silver Creek was founded in 1837 by a group of settlers from Tennessee. The town was named after the nearby creek, which was named for its silver-colored rocks. The town quickly grew and became a popular destination for settlers from the surrounding states. In 1845, the town was incorporated and the first post office was established.
In the late 1800s, Silver Creek was a thriving agricultural community. The town was home to several cotton plantations and was a major producer of cotton. The town also had a thriving lumber industry, with several sawmills located in the area.
In the early 1900s, Silver Creek began to experience a decline in its economy. The cotton industry began to decline and the sawmills began to close. The town was also hit hard by the Great Depression, and many of the town’s residents were forced to leave in search of work.
In the 1950s, Silver Creek began to experience a resurgence in its economy. The town was home to several manufacturing plants, and the population began to grow again. The town also began to attract tourists, as the nearby Tennessee River was a popular destination for fishing and boating.
Geography
Silver Creek is located in the northern part of Mississippi, in the county of Tishomingo. The town is situated on the banks of the Tennessee River, and is surrounded by rolling hills and forests. The town is located about 30 miles south of the state capital, Jackson.
The climate in Silver Creek is humid subtropical, with hot summers and mild winters. The average temperature in the summer is around 90 degrees Fahrenheit, and the average temperature in the winter is around 40 degrees Fahrenheit. The town receives an average of 48 inches of rain per year.
Economy
Silver Creek’s economy is largely based on agriculture and tourism. The town is home to several farms, which produce a variety of crops, including cotton, corn, soybeans, and wheat. The town is also home to several manufacturing plants, which produce a variety of products, including furniture, clothing, and electronics.
The town is also a popular tourist destination, as the nearby Tennessee River is a popular destination for fishing and boating. The town also has several restaurants, hotels, and other attractions, which attract visitors from all over the state.
Demographics
As of the 2010 census, Silver Creek had a population of 1,000 people. The town is predominantly white, with around 90% of the population being white. The town also has a small African American population, with around 8% of the population being African American. The town also has a small Hispanic population, with around 2% of the population being Hispanic.
Conclusion
Silver Creek is a small town located in the state of Mississippi, United States. The town is known for its rich history, its unique geography, its vibrant economy, and its diverse demographics. The town is home to several farms, manufacturing plants, and tourist attractions, which attract visitors from all over the state. The town is predominantly white, with around 90% of the population being white. The town also has a small African American population, with around 8% of the population being African American. The town also has a small Hispanic population, with around 2% of the population being Hispanic.
Common Questions
What is Per Capita Income in Silver Creek?
Per Capita income in Silver Creek is $21,624.
What is the Median Household income in Silver Creek?
Median Household Income in Silver Creek is $26,458.
What is Inequality or Gini Index in Silver Creek?
Inequality or Gini Index in Silver Creek is 0.53.
What is the Total Population of Silver Creek?
Total Population of Silver Creek is 209.
What is the Total Male Population of Silver Creek?
Total Male Population of Silver Creek is 100.
What is the Total Female Population of Silver Creek?
Total Female Population of Silver Creek is 109.
What is the Ratio of Males per 100 Females in Silver Creek?
There are 91.74 Males per 100 Females in Silver Creek.
What is the Ratio of Females per 100 Males in Silver Creek?
There are 109.00 Females per 100 Males in Silver Creek.
What is the Median Population Age in Silver Creek?
Median Population Age in Silver Creek is 37.1 Years.
What is the Average Family Size in Silver Creek
Average Family Size in Silver Creek is 4.2 People.
What is the Average Household Size in Silver Creek
Average Household Size in Silver Creek is 3.4 People.
How Large is the Labor Force in Silver Creek?
There are 54 People in the Labor Forcein in Silver Creek.
What is the Percentage of People in the Labor Force in Silver Creek?
37.8% of People are in the Labor Force in Silver Creek.
What is the Unemployment Rate in Silver Creek?
Unemployment Rate in Silver Creek is 14.8%.