Senatobia, MS Map & Demographics
Senatobia Map
Senatobia Overview
$23,705
PER CAPITA INCOME
$70,938
AVG FAMILY INCOME
$56,780
AVG HOUSEHOLD INCOME
38.7%
WAGE / INCOME GAP [ % ]
61.3¢/ $1
WAGE / INCOME GAP [ $ ]
$8,323
FAMILY INCOME DEFICIT
0.44
INEQUALITY / GINI INDEX
8,288
TOTAL POPULATION
4,082
MALE POPULATION
4,206
FEMALE POPULATION
97.05
MALES / 100 FEMALES
103.04
FEMALES / 100 MALES
30.1
MEDIAN AGE
3.0
AVG FAMILY SIZE
2.4
AVG HOUSEHOLD SIZE
3,878
LABOR FORCE [ PEOPLE ]
57.6%
PERCENT IN LABOR FORCE
5.1%
UNEMPLOYMENT RATE
Senatobia Zip Codes
Senatobia Area Codes
Income in Senatobia
Income Overview in Senatobia
Per Capita Income in Senatobia is $23,705, while median incomes of families and households are $70,938 and $56,780 respectively.
| Characteristic | Number | Measure |
| Per Capita Income | 8,288 | $23,705 |
| Median Family Income | 1,765 | $70,938 |
| Mean Family Income | 1,765 | $83,827 |
| Median Household Income | 2,636 | $56,780 |
| Mean Household Income | 2,636 | $70,124 |
| Income Deficit | 1,765 | $8,323 |
| Wage / Income Gap (%) | 8,288 | 38.69% |
| Wage / Income Gap ($) | 8,288 | 61.31¢ per $1 |
| Gini / Inequality Index | 8,288 | 0.44 |
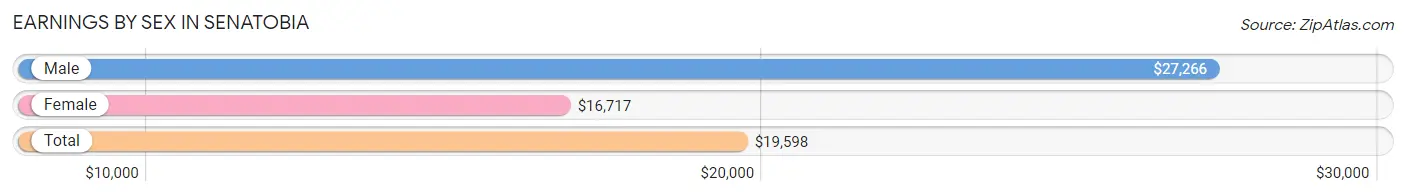
Earnings by Sex in Senatobia
Average Earnings in Senatobia are $19,598, $27,266 for men and $16,717 for women, a difference of 38.7%.
| Sex | Number | Average Earnings |
| Male | 2,109 (48.3%) | $27,266 |
| Female | 2,257 (51.7%) | $16,717 |
| Total | 4,366 (100.0%) | $19,598 |
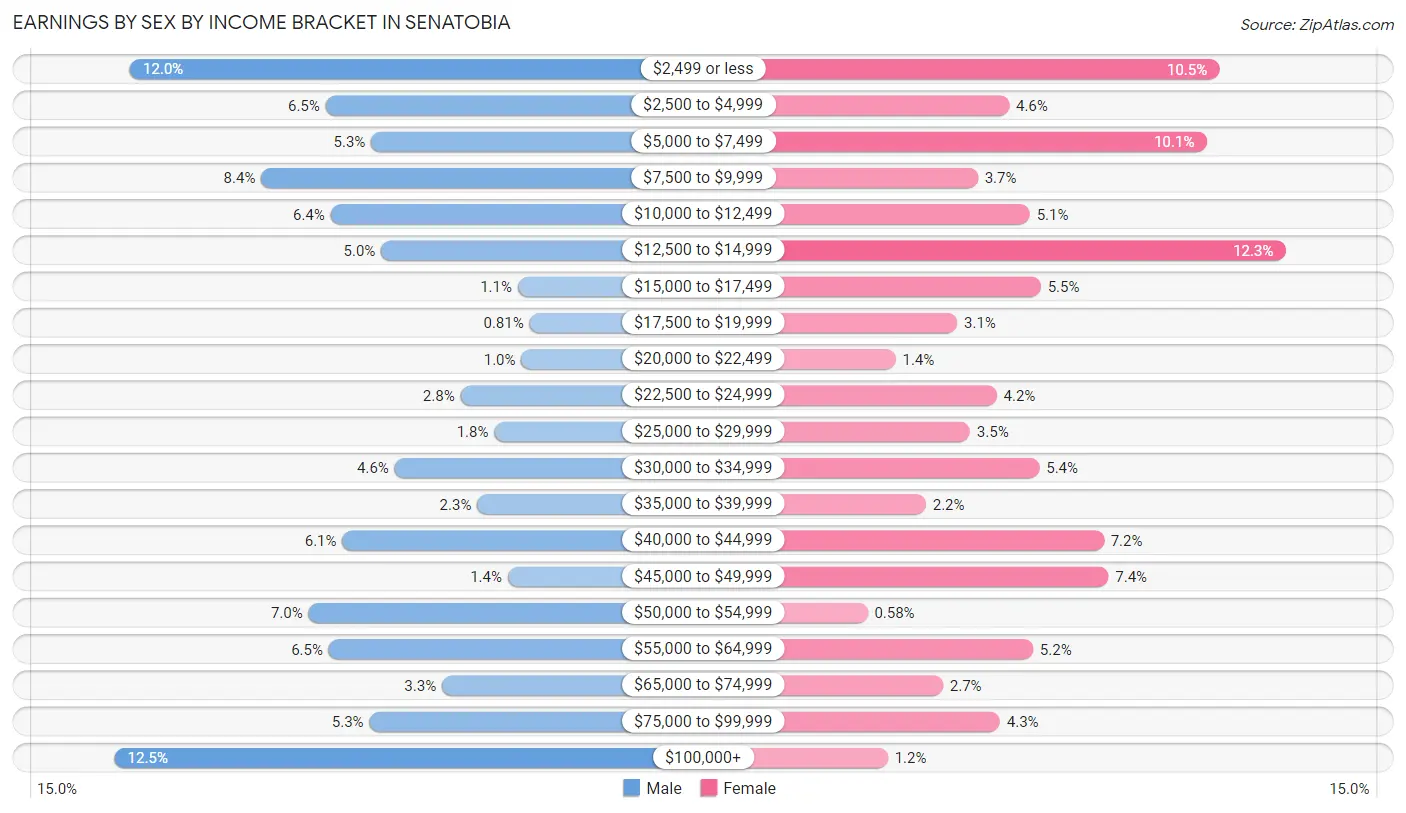
Earnings by Sex by Income Bracket in Senatobia
The most common earnings brackets in Senatobia are $100,000+ for men (263 | 12.5%) and $12,500 to $14,999 for women (278 | 12.3%).
| Income | Male | Female |
| $2,499 or less | 254 (12.0%) | 236 (10.5%) |
| $2,500 to $4,999 | 138 (6.5%) | 103 (4.6%) |
| $5,000 to $7,499 | 111 (5.3%) | 228 (10.1%) |
| $7,500 to $9,999 | 176 (8.4%) | 83 (3.7%) |
| $10,000 to $12,499 | 135 (6.4%) | 116 (5.1%) |
| $12,500 to $14,999 | 105 (5.0%) | 278 (12.3%) |
| $15,000 to $17,499 | 24 (1.1%) | 123 (5.4%) |
| $17,500 to $19,999 | 17 (0.8%) | 70 (3.1%) |
| $20,000 to $22,499 | 22 (1.0%) | 31 (1.4%) |
| $22,500 to $24,999 | 58 (2.8%) | 95 (4.2%) |
| $25,000 to $29,999 | 38 (1.8%) | 78 (3.5%) |
| $30,000 to $34,999 | 97 (4.6%) | 122 (5.4%) |
| $35,000 to $39,999 | 48 (2.3%) | 50 (2.2%) |
| $40,000 to $44,999 | 128 (6.1%) | 163 (7.2%) |
| $45,000 to $49,999 | 30 (1.4%) | 166 (7.3%) |
| $50,000 to $54,999 | 148 (7.0%) | 13 (0.6%) |
| $55,000 to $64,999 | 136 (6.5%) | 118 (5.2%) |
| $65,000 to $74,999 | 69 (3.3%) | 61 (2.7%) |
| $75,000 to $99,999 | 112 (5.3%) | 97 (4.3%) |
| $100,000+ | 263 (12.5%) | 26 (1.1%) |
| Total | 2,109 (100.0%) | 2,257 (100.0%) |
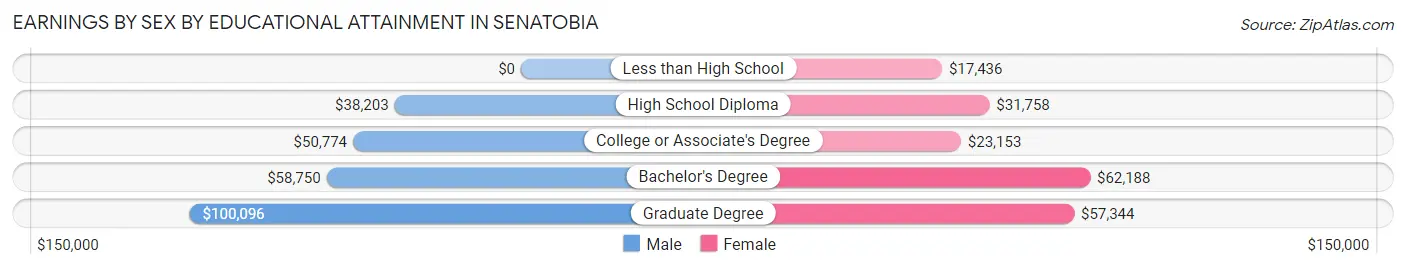
Earnings by Sex by Educational Attainment in Senatobia
Average earnings in Senatobia are $50,430 for men and $29,915 for women, a difference of 40.7%. Men with an educational attainment of graduate degree enjoy the highest average annual earnings of $100,096, while those with high school diploma education earn the least with $38,203. Women with an educational attainment of bachelor's degree earn the most with the average annual earnings of $62,188, while those with less than high school education have the smallest earnings of $17,436.
| Educational Attainment | Male Income | Female Income |
| Less than High School | - | - |
| High School Diploma | $38,203 | $31,758 |
| College or Associate's Degree | $50,774 | $23,153 |
| Bachelor's Degree | $58,750 | $62,188 |
| Graduate Degree | $100,096 | $57,344 |
| Total | $50,430 | $29,915 |
Family Income in Senatobia
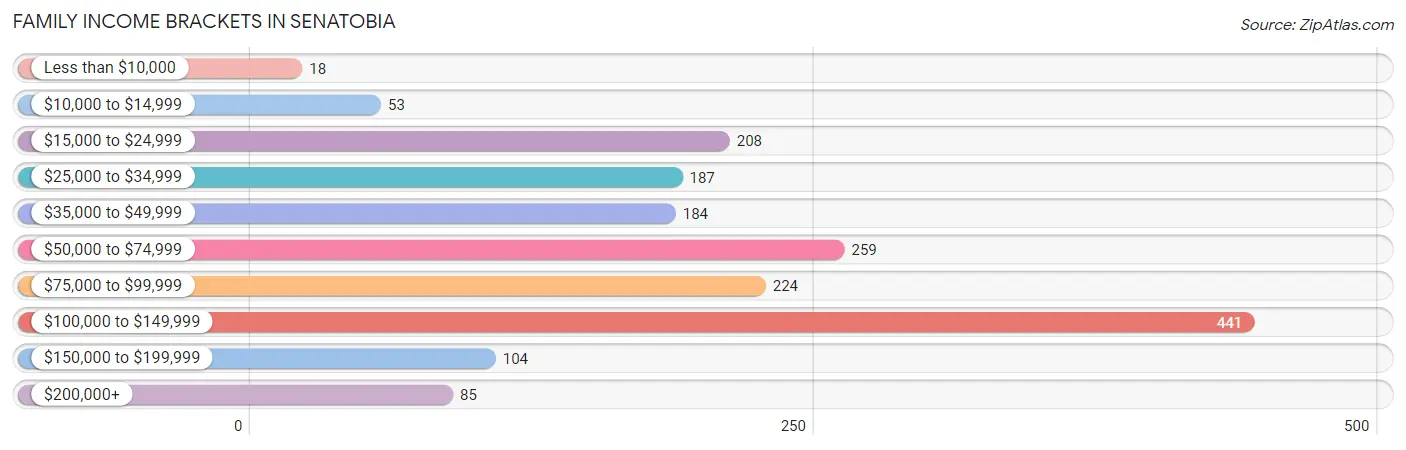
Family Income Brackets in Senatobia
According to the Senatobia family income data, there are 441 families falling into the $100,000 to $149,999 income range, which is the most common income bracket and makes up 25.0% of all families. Conversely, the less than $10,000 income bracket is the least frequent group with only 18 families (1.0%) belonging to this category.
| Income Bracket | # Families | % Families |
| Less than $10,000 | 18 | 1.0% |
| $10,000 to $14,999 | 53 | 3.0% |
| $15,000 to $24,999 | 208 | 11.8% |
| $25,000 to $34,999 | 187 | 10.6% |
| $35,000 to $49,999 | 184 | 10.4% |
| $50,000 to $74,999 | 259 | 14.7% |
| $75,000 to $99,999 | 224 | 12.7% |
| $100,000 to $149,999 | 441 | 25.0% |
| $150,000 to $199,999 | 104 | 5.9% |
| $200,000+ | 85 | 4.8% |
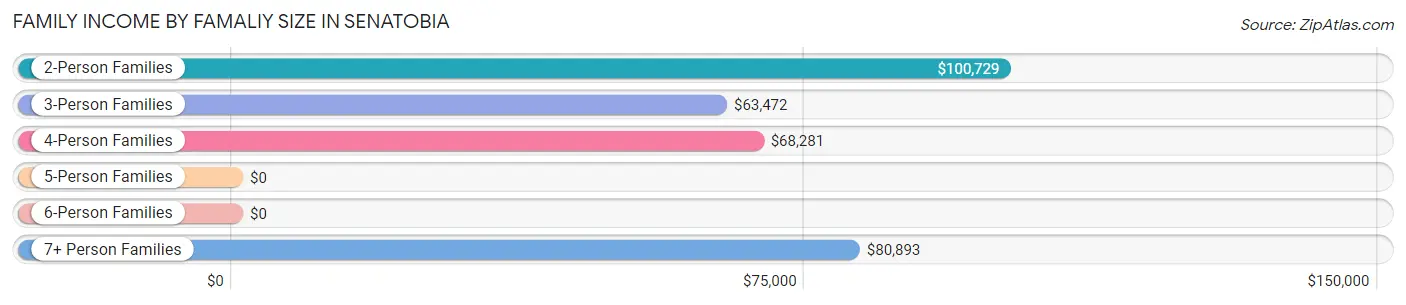
Family Income by Famaliy Size in Senatobia
2-person families (654 | 37.0%) account for the highest median family income in Senatobia with $100,729 per family, while 2-person families (654 | 37.0%) have the highest median income of $50,364 per family member.
| Income Bracket | # Families | Median Income |
| 2-Person Families | 654 (37.0%) | $100,729 |
| 3-Person Families | 303 (17.2%) | $63,472 |
| 4-Person Families | 529 (30.0%) | $68,281 |
| 5-Person Families | 125 (7.1%) | $0 |
| 6-Person Families | 133 (7.5%) | $0 |
| 7+ Person Families | 21 (1.2%) | $80,893 |
| Total | 1,765 (100.0%) | $70,938 |
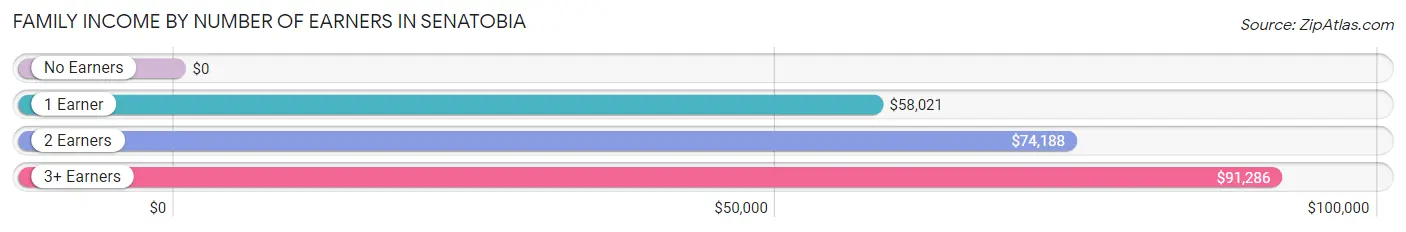
Family Income by Number of Earners in Senatobia
| Number of Earners | # Families | Median Income |
| No Earners | 240 (13.6%) | $0 |
| 1 Earner | 424 (24.0%) | $58,021 |
| 2 Earners | 887 (50.2%) | $74,188 |
| 3+ Earners | 214 (12.1%) | $91,286 |
| Total | 1,765 (100.0%) | $70,938 |
Household Income in Senatobia
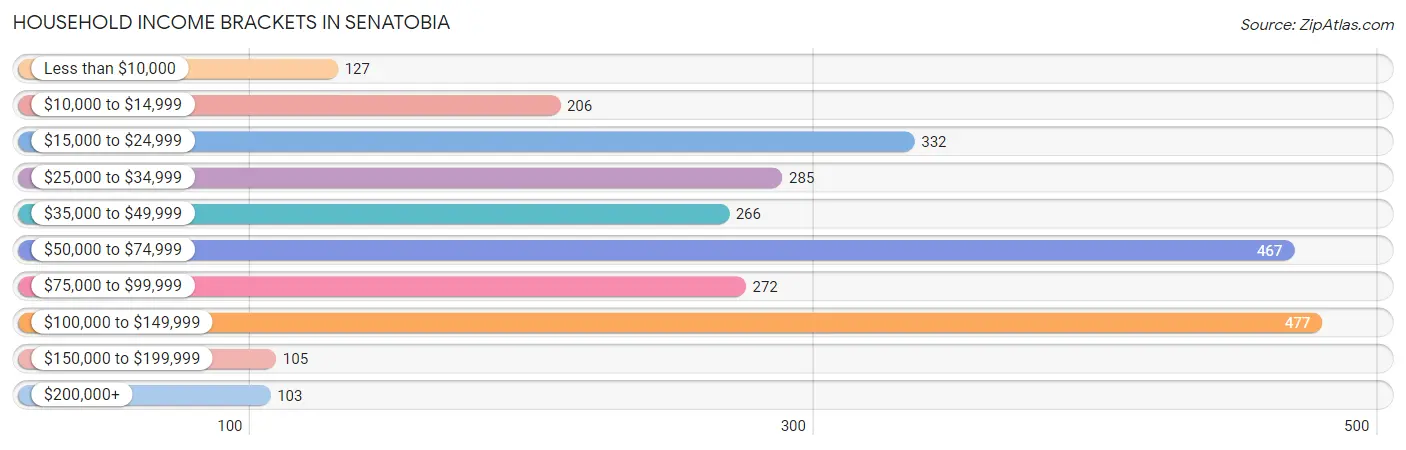
Household Income Brackets in Senatobia
With 477 households falling in the category, the $100,000 to $149,999 income range is the most frequent in Senatobia, accounting for 18.1% of all households. In contrast, only 103 households (3.9%) fall into the $200,000+ income bracket, making it the least populous group.
| Income Bracket | # Households | % Households |
| Less than $10,000 | 127 | 4.8% |
| $10,000 to $14,999 | 206 | 7.8% |
| $15,000 to $24,999 | 332 | 12.6% |
| $25,000 to $34,999 | 285 | 10.8% |
| $35,000 to $49,999 | 266 | 10.1% |
| $50,000 to $74,999 | 467 | 17.7% |
| $75,000 to $99,999 | 272 | 10.3% |
| $100,000 to $149,999 | 477 | 18.1% |
| $150,000 to $199,999 | 105 | 4.0% |
| $200,000+ | 103 | 3.9% |
Household Income by Householder Age in Senatobia
The median household income in Senatobia is $56,780, with the highest median household income of $63,029 found in the 25 to 44 years age bracket for the primary householder. A total of 1,032 households (39.2%) fall into this category. Meanwhile, the 45 to 64 years age bracket for the primary householder has the lowest median household income of $51,036, with 817 households (31.0%) in this group.
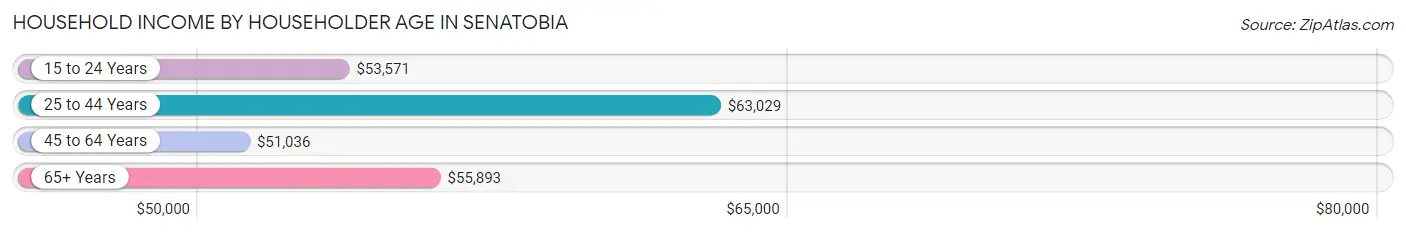
| Income Bracket | # Households | Median Income |
| 15 to 24 Years | 64 (2.4%) | $53,571 |
| 25 to 44 Years | 1,032 (39.2%) | $63,029 |
| 45 to 64 Years | 817 (31.0%) | $51,036 |
| 65+ Years | 723 (27.4%) | $55,893 |
| Total | 2,636 (100.0%) | $56,780 |
Poverty in Senatobia
Income Below Poverty by Sex and Age in Senatobia
With 26.4% poverty level for males and 19.9% for females among the residents of Senatobia, 6 to 11 year old males and 16 and 17 year old females are the most vulnerable to poverty, with 254 males (56.8%) and 24 females (42.1%) in their respective age groups living below the poverty level.
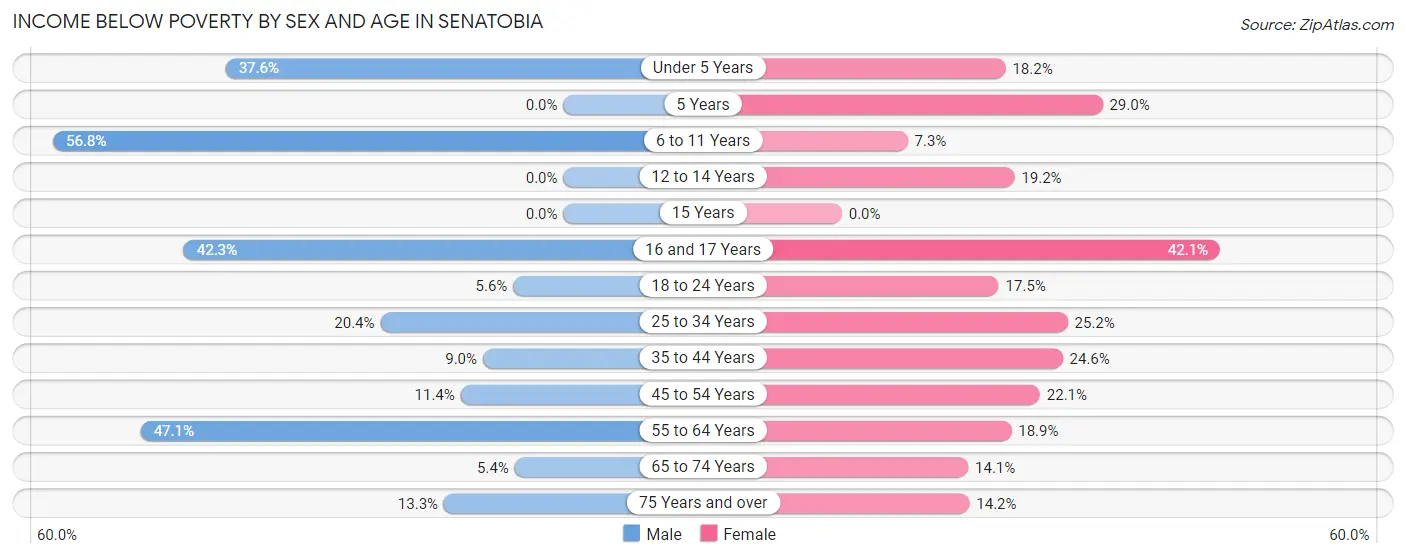
| Age Bracket | Male | Female |
| Under 5 Years | 91 (37.6%) | 35 (18.2%) |
| 5 Years | 0 (0.0%) | 18 (29.0%) |
| 6 to 11 Years | 254 (56.8%) | 14 (7.3%) |
| 12 to 14 Years | 0 (0.0%) | 25 (19.2%) |
| 15 Years | 0 (0.0%) | 0 (0.0%) |
| 16 and 17 Years | 71 (42.3%) | 24 (42.1%) |
| 18 to 24 Years | 9 (5.6%) | 29 (17.5%) |
| 25 to 34 Years | 97 (20.4%) | 129 (25.2%) |
| 35 to 44 Years | 32 (9.0%) | 136 (24.6%) |
| 45 to 54 Years | 31 (11.4%) | 88 (22.1%) |
| 55 to 64 Years | 208 (47.1%) | 47 (18.9%) |
| 65 to 74 Years | 13 (5.4%) | 75 (14.1%) |
| 75 Years and over | 25 (13.3%) | 28 (14.2%) |
| Total | 831 (26.4%) | 648 (19.9%) |
Income Above Poverty by Sex and Age in Senatobia
According to the poverty statistics in Senatobia, males aged 5 years and females aged 15 years are the age groups that are most secure financially, with 100.0% of males and 100.0% of females in these age groups living above the poverty line.
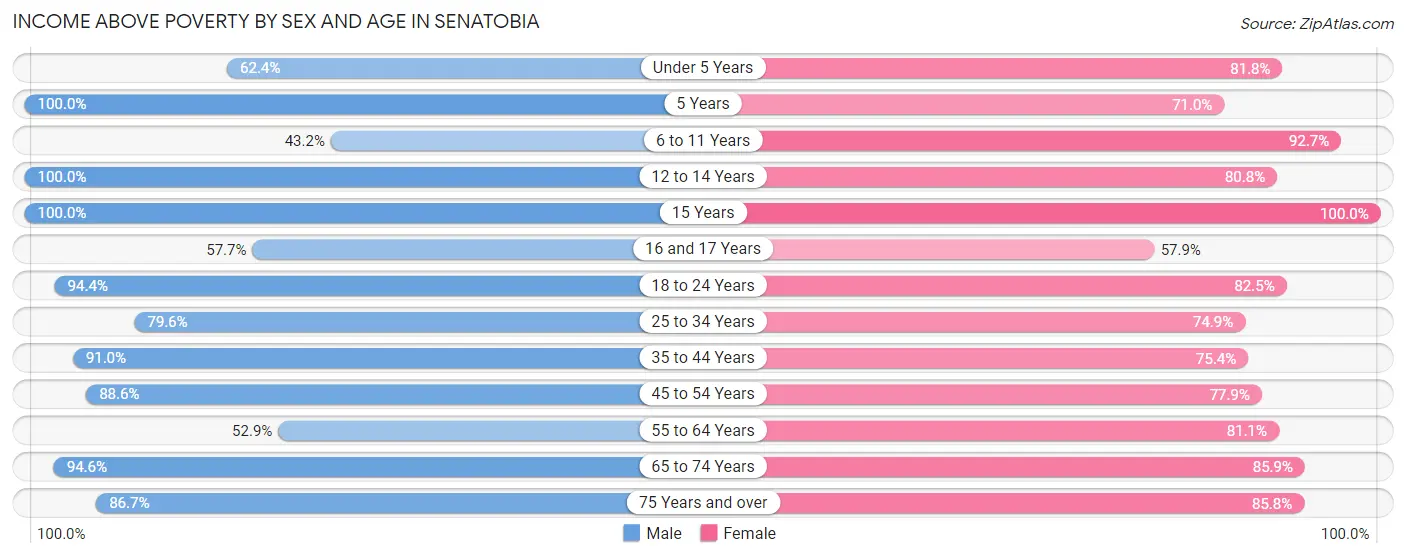
| Age Bracket | Male | Female |
| Under 5 Years | 151 (62.4%) | 157 (81.8%) |
| 5 Years | 35 (100.0%) | 44 (71.0%) |
| 6 to 11 Years | 193 (43.2%) | 177 (92.7%) |
| 12 to 14 Years | 119 (100.0%) | 105 (80.8%) |
| 15 Years | 8 (100.0%) | 21 (100.0%) |
| 16 and 17 Years | 97 (57.7%) | 33 (57.9%) |
| 18 to 24 Years | 152 (94.4%) | 137 (82.5%) |
| 25 to 34 Years | 379 (79.6%) | 384 (74.9%) |
| 35 to 44 Years | 325 (91.0%) | 417 (75.4%) |
| 45 to 54 Years | 240 (88.6%) | 311 (77.9%) |
| 55 to 64 Years | 234 (52.9%) | 202 (81.1%) |
| 65 to 74 Years | 227 (94.6%) | 458 (85.9%) |
| 75 Years and over | 163 (86.7%) | 169 (85.8%) |
| Total | 2,323 (73.7%) | 2,615 (80.1%) |
Income Below Poverty Among Married-Couple Families in Senatobia
The poverty statistics for married-couple families in Senatobia show that 15.4% or 195 of the total 1,266 families live below the poverty line. Families with 3 or 4 children have the highest poverty rate of 37.6%, comprising of 79 families. On the other hand, families with 5 or more children have the lowest poverty rate of 0.0%, which includes 0 families.
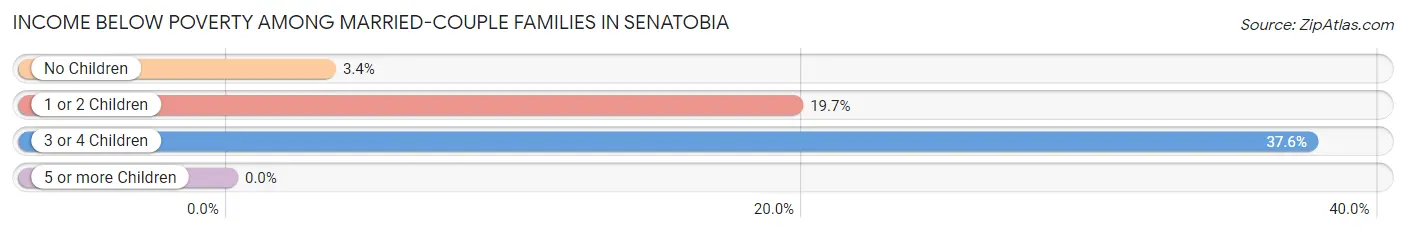
| Children | Above Poverty | Below Poverty |
| No Children | 538 (96.6%) | 19 (3.4%) |
| 1 or 2 Children | 396 (80.3%) | 97 (19.7%) |
| 3 or 4 Children | 131 (62.4%) | 79 (37.6%) |
| 5 or more Children | 6 (100.0%) | 0 (0.0%) |
| Total | 1,071 (84.6%) | 195 (15.4%) |
Income Below Poverty Among Single-Parent Households in Senatobia
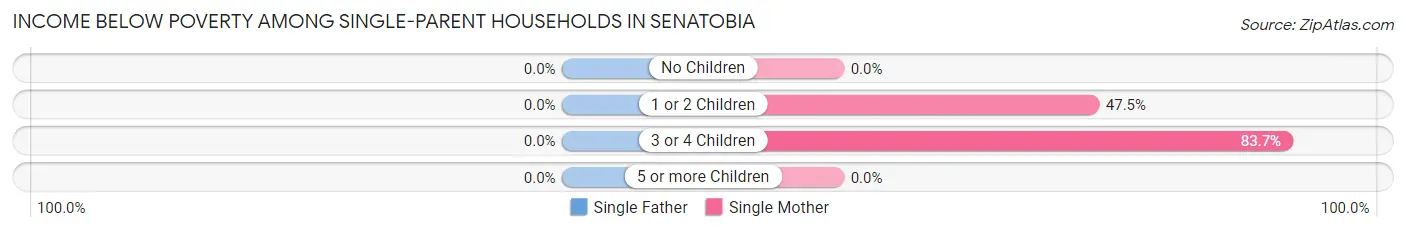
| Children | Single Father | Single Mother |
| No Children | 0 (0.0%) | 0 (0.0%) |
| 1 or 2 Children | 0 (0.0%) | 77 (47.5%) |
| 3 or 4 Children | 0 (0.0%) | 82 (83.7%) |
| 5 or more Children | 0 (0.0%) | 0 (0.0%) |
| Total | 0 (0.0%) | 159 (39.7%) |
Income Below Poverty Among Married-Couple vs Single-Parent Households in Senatobia
The poverty data for Senatobia shows that 195 of the married-couple family households (15.4%) and 159 of the single-parent households (31.9%) are living below the poverty level. Within the married-couple family households, those with 3 or 4 children have the highest poverty rate, with 79 households (37.6%) falling below the poverty line. Among the single-parent households, those with 3 or 4 children have the highest poverty rate, with 82 household (83.7%) living below poverty.
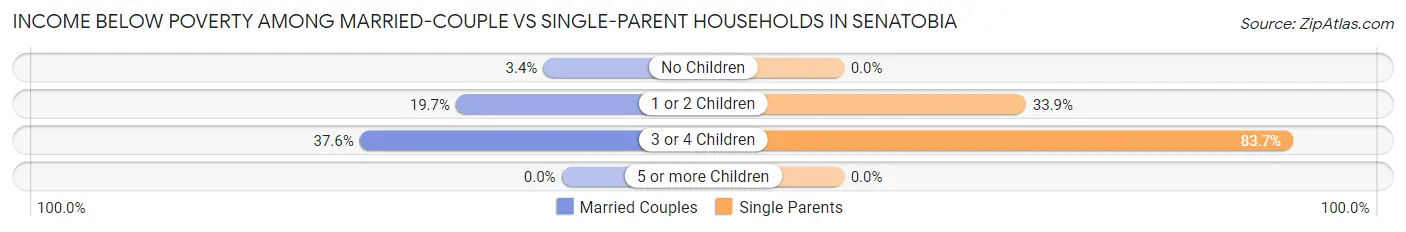
| Children | Married-Couple Families | Single-Parent Households |
| No Children | 19 (3.4%) | 0 (0.0%) |
| 1 or 2 Children | 97 (19.7%) | 77 (33.9%) |
| 3 or 4 Children | 79 (37.6%) | 82 (83.7%) |
| 5 or more Children | 0 (0.0%) | 0 (0.0%) |
| Total | 195 (15.4%) | 159 (31.9%) |
Race in Senatobia
The most populous races in Senatobia are White / Caucasian (4,421 | 53.3%), Black / African American (3,630 | 43.8%), and Two or more Races (158 | 1.9%).
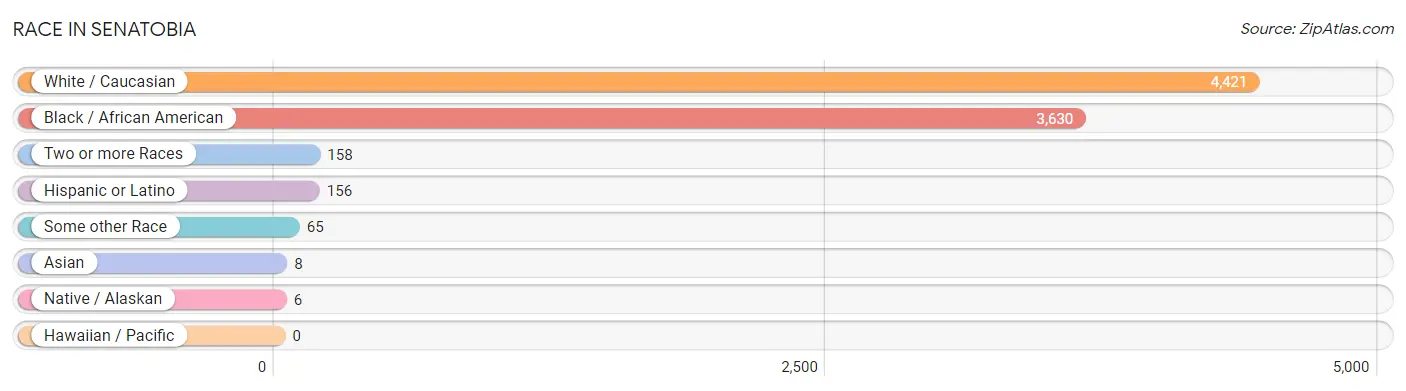
| Race | # Population | % Population |
| Asian | 8 | 0.1% |
| Black / African American | 3,630 | 43.8% |
| Hawaiian / Pacific | 0 | 0.0% |
| Hispanic or Latino | 156 | 1.9% |
| Native / Alaskan | 6 | 0.1% |
| White / Caucasian | 4,421 | 53.3% |
| Two or more Races | 158 | 1.9% |
| Some other Race | 65 | 0.8% |
| Total | 8,288 | 100.0% |
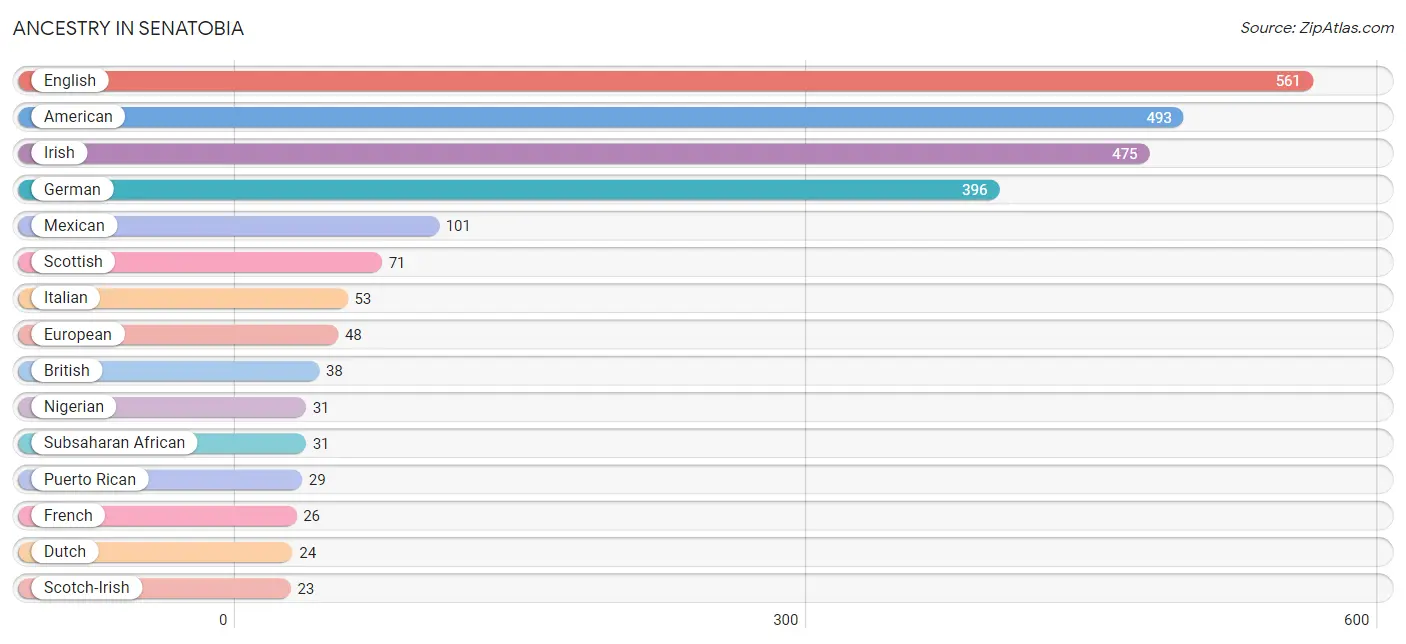
Ancestry in Senatobia
The most populous ancestries reported in Senatobia are English (561 | 6.8%), American (493 | 5.9%), Irish (475 | 5.7%), German (396 | 4.8%), and Mexican (101 | 1.2%), together accounting for 24.4% of all Senatobia residents.
| Ancestry | # Population | % Population |
| American | 493 | 5.9% |
| Armenian | 8 | 0.1% |
| British | 38 | 0.5% |
| Canadian | 7 | 0.1% |
| Central American | 5 | 0.1% |
| Choctaw | 9 | 0.1% |
| Cuban | 7 | 0.1% |
| Dutch | 24 | 0.3% |
| Eastern European | 7 | 0.1% |
| English | 561 | 6.8% |
| European | 48 | 0.6% |
| French | 26 | 0.3% |
| German | 396 | 4.8% |
| Indian (Asian) | 8 | 0.1% |
| Irish | 475 | 5.7% |
| Italian | 53 | 0.6% |
| Mexican | 101 | 1.2% |
| Nigerian | 31 | 0.4% |
| Polish | 14 | 0.2% |
| Puerto Rican | 29 | 0.4% |
| Salvadoran | 5 | 0.1% |
| Scotch-Irish | 23 | 0.3% |
| Scottish | 71 | 0.9% |
| Subsaharan African | 31 | 0.4% |
| Swedish | 17 | 0.2% | View All 25 Rows |
Immigrants in Senatobia
The most numerous immigrant groups reported in Senatobia came from Africa (31 | 0.4%), Nigeria (31 | 0.4%), Western Africa (31 | 0.4%), Central America (28 | 0.3%), and Latin America (28 | 0.3%), together accounting for 1.8% of all Senatobia residents.
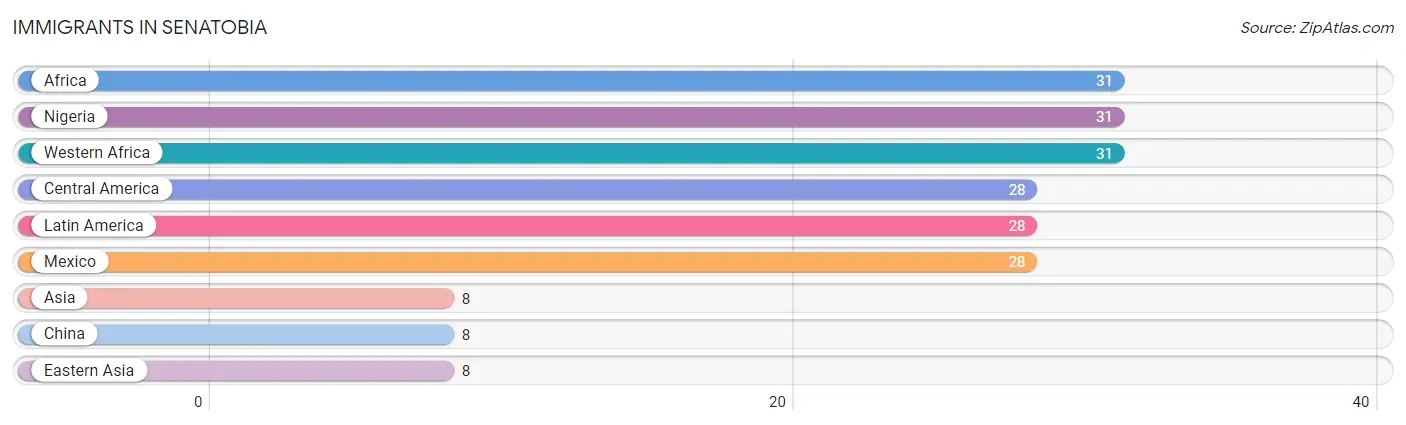
| Immigration Origin | # Population | % Population |
| Africa | 31 | 0.4% |
| Asia | 8 | 0.1% |
| Central America | 28 | 0.3% |
| China | 8 | 0.1% |
| Eastern Asia | 8 | 0.1% |
| Latin America | 28 | 0.3% |
| Mexico | 28 | 0.3% |
| Nigeria | 31 | 0.4% |
| Western Africa | 31 | 0.4% | View All 9 Rows |
Sex and Age in Senatobia
Sex and Age in Senatobia
The most populous age groups in Senatobia are 15 to 19 Years (901 | 22.1%) for men and 15 to 19 Years (726 | 17.3%) for women.
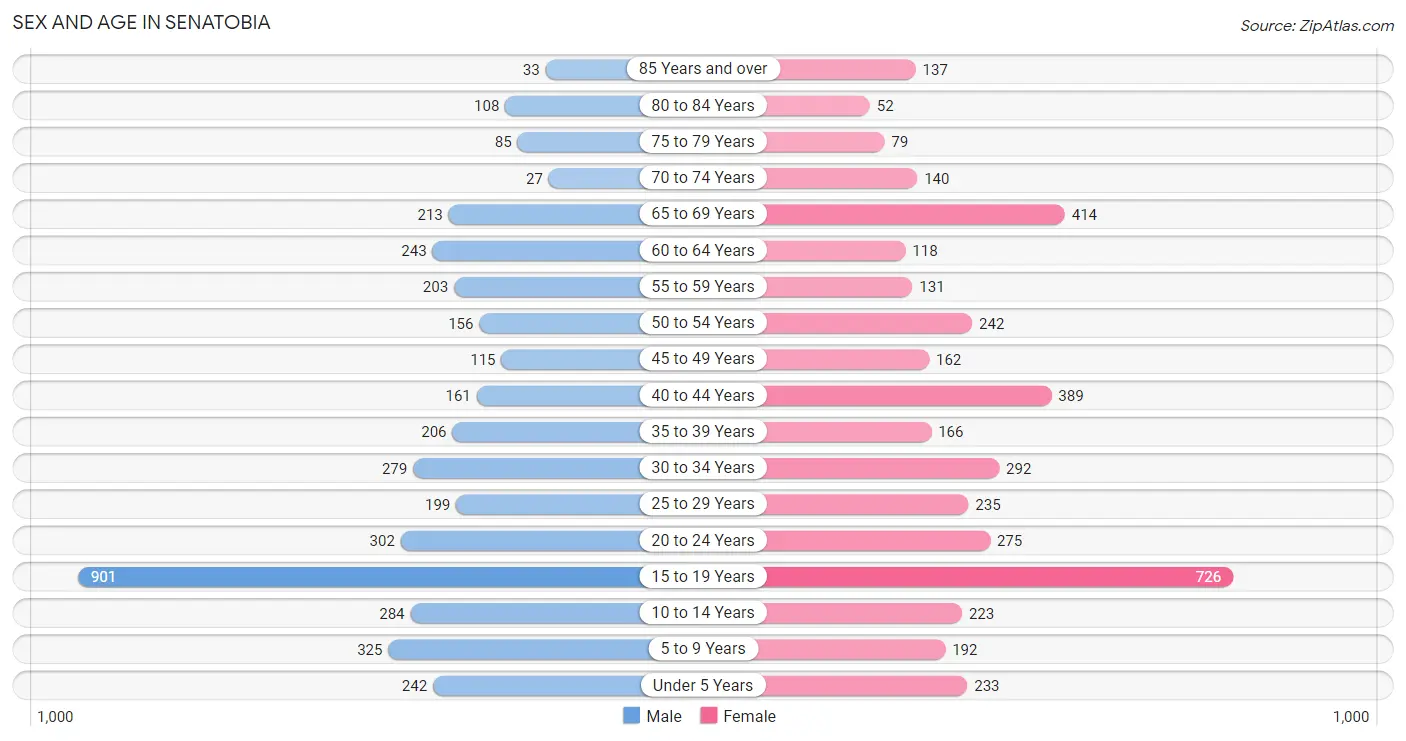
| Age Bracket | Male | Female |
| Under 5 Years | 242 (5.9%) | 233 (5.5%) |
| 5 to 9 Years | 325 (8.0%) | 192 (4.6%) |
| 10 to 14 Years | 284 (7.0%) | 223 (5.3%) |
| 15 to 19 Years | 901 (22.1%) | 726 (17.3%) |
| 20 to 24 Years | 302 (7.4%) | 275 (6.5%) |
| 25 to 29 Years | 199 (4.9%) | 235 (5.6%) |
| 30 to 34 Years | 279 (6.8%) | 292 (6.9%) |
| 35 to 39 Years | 206 (5.1%) | 166 (4.0%) |
| 40 to 44 Years | 161 (3.9%) | 389 (9.2%) |
| 45 to 49 Years | 115 (2.8%) | 162 (3.8%) |
| 50 to 54 Years | 156 (3.8%) | 242 (5.8%) |
| 55 to 59 Years | 203 (5.0%) | 131 (3.1%) |
| 60 to 64 Years | 243 (5.9%) | 118 (2.8%) |
| 65 to 69 Years | 213 (5.2%) | 414 (9.8%) |
| 70 to 74 Years | 27 (0.7%) | 140 (3.3%) |
| 75 to 79 Years | 85 (2.1%) | 79 (1.9%) |
| 80 to 84 Years | 108 (2.6%) | 52 (1.2%) |
| 85 Years and over | 33 (0.8%) | 137 (3.3%) |
| Total | 4,082 (100.0%) | 4,206 (100.0%) |
Families and Households in Senatobia
Median Family Size in Senatobia
The median family size in Senatobia is 2.96 persons per family, with married-couple families (1,266 | 71.7%) accounting for the largest median family size of 3.12 persons per family. On the other hand, single male/father families (98 | 5.6%) represent the smallest median family size with 2.20 persons per family.
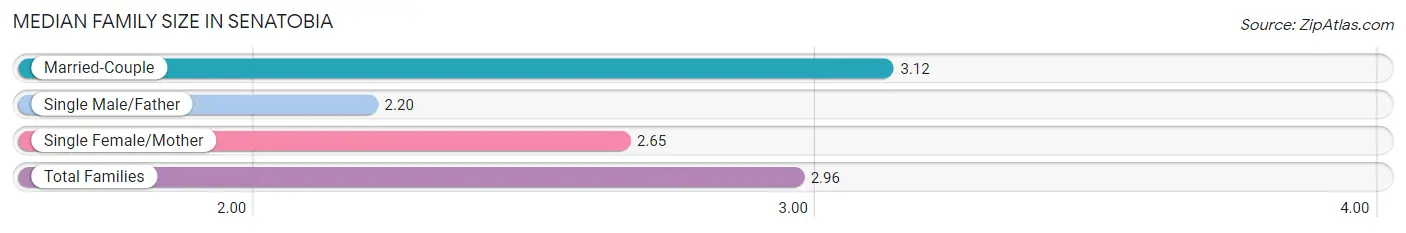
| Family Type | # Families | Family Size |
| Married-Couple | 1,266 (71.7%) | 3.12 |
| Single Male/Father | 98 (5.6%) | 2.20 |
| Single Female/Mother | 401 (22.7%) | 2.65 |
| Total Families | 1,765 (100.0%) | 2.96 |
Median Household Size in Senatobia
The median household size in Senatobia is 2.43 persons per household, with single male/father households (98 | 3.7%) accounting for the largest median household size of 3.7 persons per household. non-family households (871 | 33.0%) represent the smallest median household size with 1.19 persons per household.
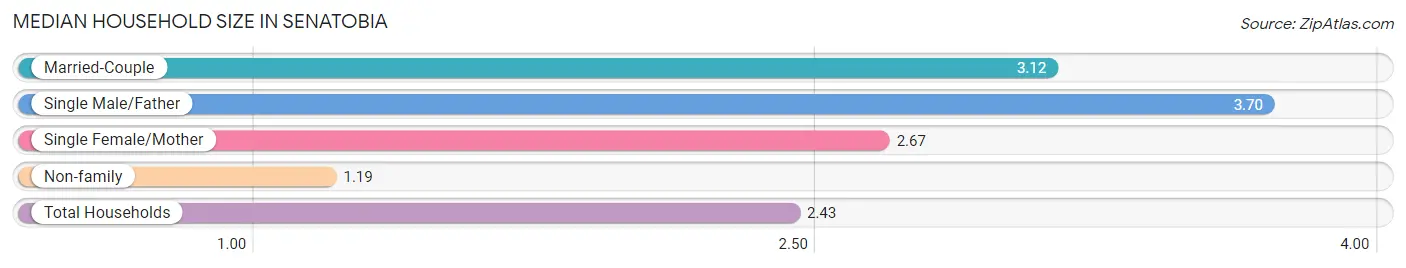
| Household Type | # Households | Household Size |
| Married-Couple | 1,266 (48.0%) | 3.12 |
| Single Male/Father | 98 (3.7%) | 3.70 |
| Single Female/Mother | 401 (15.2%) | 2.67 |
| Non-family | 871 (33.0%) | 1.19 |
| Total Households | 2,636 (100.0%) | 2.43 |
Household Size by Marriage Status in Senatobia
Out of a total of 2,636 households in Senatobia, 1,765 (67.0%) are family households, while 871 (33.0%) are nonfamily households. The most numerous type of family households are 2-person households, comprising 622, and the most common type of nonfamily households are 1-person households, comprising 712.
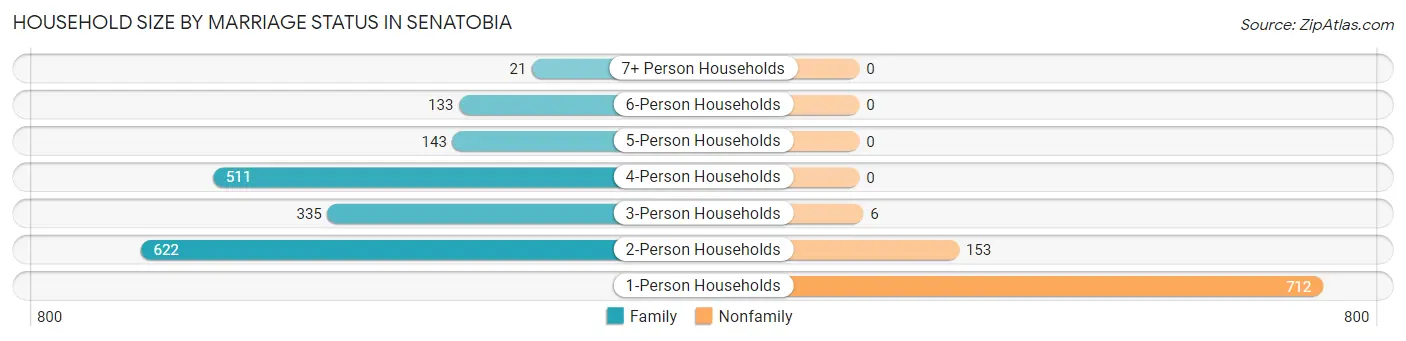
| Household Size | Family Households | Nonfamily Households |
| 1-Person Households | - | 712 (27.0%) |
| 2-Person Households | 622 (23.6%) | 153 (5.8%) |
| 3-Person Households | 335 (12.7%) | 6 (0.2%) |
| 4-Person Households | 511 (19.4%) | 0 (0.0%) |
| 5-Person Households | 143 (5.4%) | 0 (0.0%) |
| 6-Person Households | 133 (5.1%) | 0 (0.0%) |
| 7+ Person Households | 21 (0.8%) | 0 (0.0%) |
| Total | 1,765 (67.0%) | 871 (33.0%) |
Female Fertility in Senatobia
Fertility by Age in Senatobia
Average fertility rate in Senatobia is 52.0 births per 1,000 women. Women in the age bracket of 20 to 34 years have the highest fertility rate with 95.0 births per 1,000 women. Women in the age bracket of 20 to 34 years acount for 63.9% of all women with births.
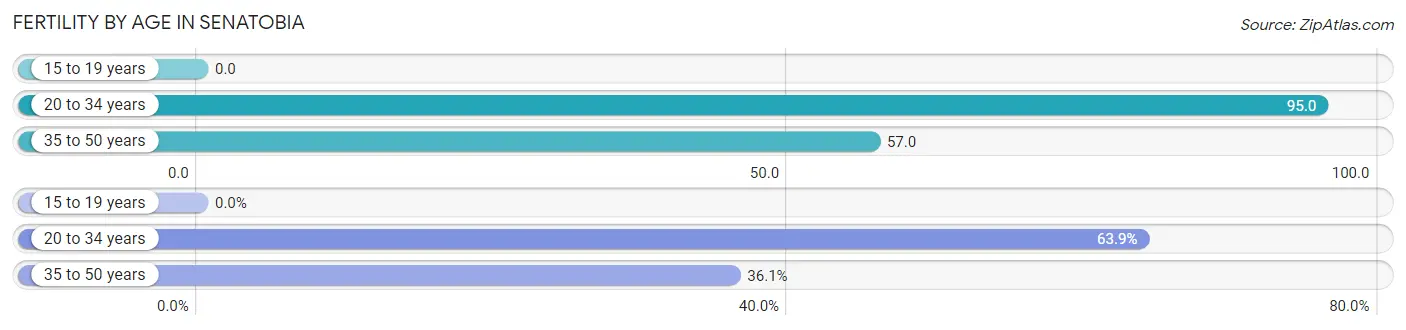
| Age Bracket | Women with Births | Births / 1,000 Women |
| 15 to 19 years | 0 (0.0%) | 0.0 |
| 20 to 34 years | 76 (63.9%) | 95.0 |
| 35 to 50 years | 43 (36.1%) | 57.0 |
| Total | 119 (100.0%) | 52.0 |
Fertility by Age by Marriage Status in Senatobia
72.3% of women with births (119) in Senatobia are married. The highest percentage of unmarried women with births falls into 20 to 34 years age bracket with 43.4% of them unmarried at the time of birth, while the lowest percentage of unmarried women with births belong to 35 to 50 years age bracket with 0.0% of them unmarried.
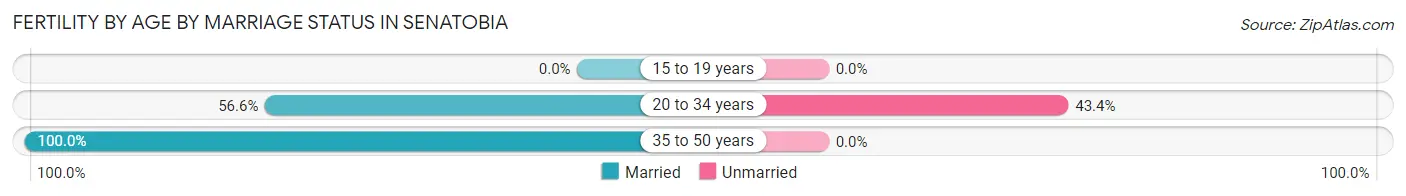
| Age Bracket | Married | Unmarried |
| 15 to 19 years | 0 (0.0%) | 0 (0.0%) |
| 20 to 34 years | 43 (56.6%) | 33 (43.4%) |
| 35 to 50 years | 43 (100.0%) | 0 (0.0%) |
| Total | 86 (72.3%) | 33 (27.7%) |
Fertility by Education in Senatobia
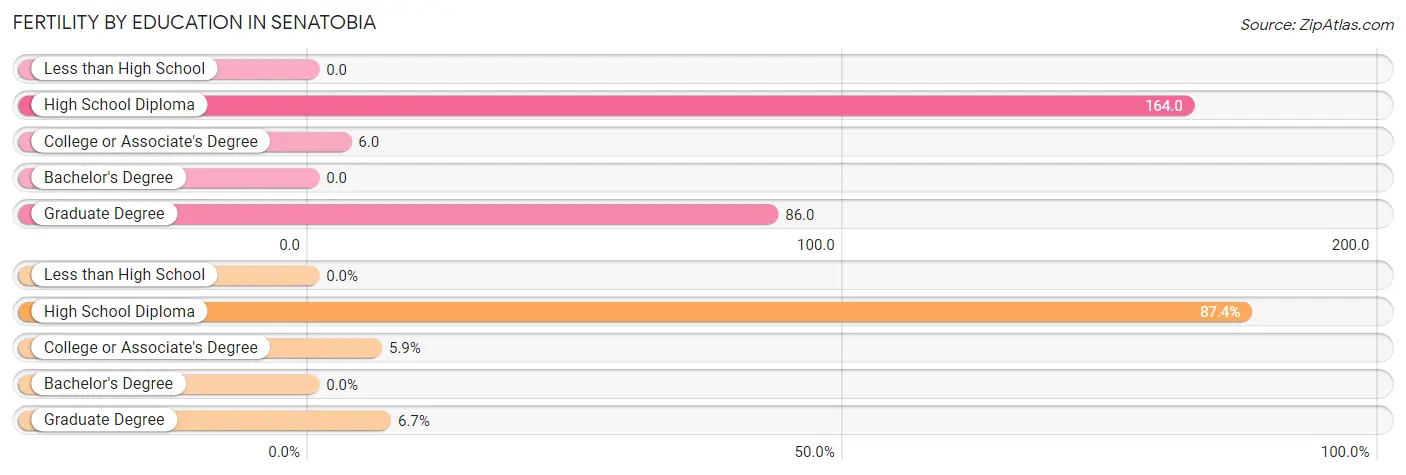
| Educational Attainment | Women with Births | Births / 1,000 Women |
| Less than High School | 0 (0.0%) | 0.0 |
| High School Diploma | 104 (87.4%) | 164.0 |
| College or Associate's Degree | 7 (5.9%) | 6.0 |
| Bachelor's Degree | 0 (0.0%) | 0.0 |
| Graduate Degree | 8 (6.7%) | 86.0 |
| Total | 119 (100.0%) | 52.0 |
Fertility by Education by Marriage Status in Senatobia
27.7% of women with births in Senatobia are unmarried. Women with the educational attainment of college or associate's degree are most likely to be married with 100.0% of them married at childbirth, while women with the educational attainment of high school diploma are least likely to be married with 31.7% of them unmarried at childbirth.
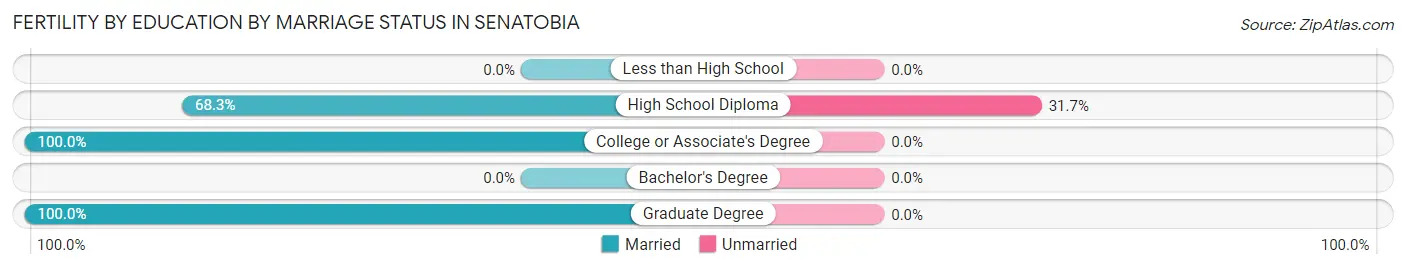
| Educational Attainment | Married | Unmarried |
| Less than High School | 0 (0.0%) | 0 (0.0%) |
| High School Diploma | 71 (68.3%) | 33 (31.7%) |
| College or Associate's Degree | 7 (100.0%) | 0 (0.0%) |
| Bachelor's Degree | 0 (0.0%) | 0 (0.0%) |
| Graduate Degree | 8 (100.0%) | 0 (0.0%) |
| Total | 86 (72.3%) | 33 (27.7%) |
Employment Characteristics in Senatobia
Employment by Class of Employer in Senatobia
Among the 3,632 employed individuals in Senatobia, private company employees (2,742 | 75.5%), state government employees (378 | 10.4%), and not-for-profit organizations (212 | 5.8%) make up the most common classes of employment.
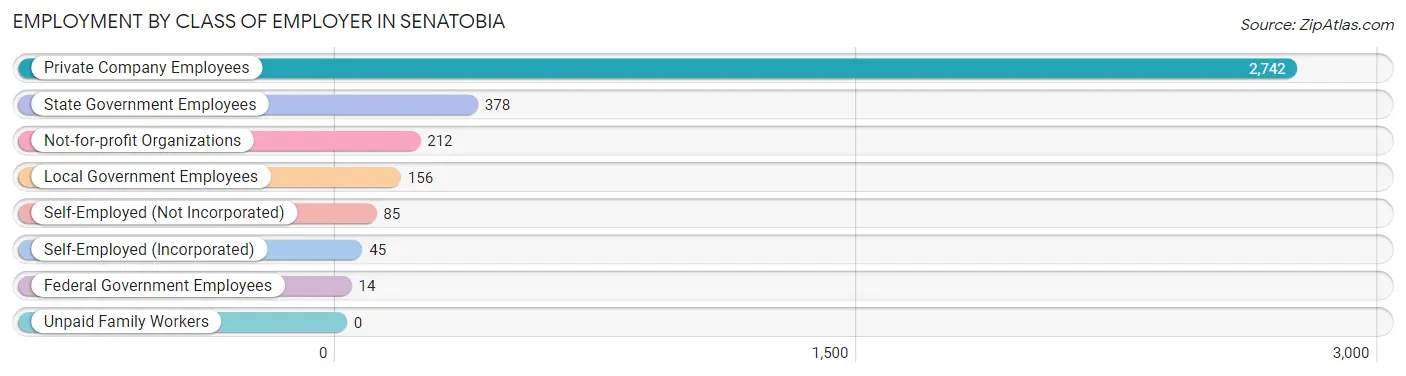
| Employer Class | # Employees | % Employees |
| Private Company Employees | 2,742 | 75.5% |
| Self-Employed (Incorporated) | 45 | 1.2% |
| Self-Employed (Not Incorporated) | 85 | 2.3% |
| Not-for-profit Organizations | 212 | 5.8% |
| Local Government Employees | 156 | 4.3% |
| State Government Employees | 378 | 10.4% |
| Federal Government Employees | 14 | 0.4% |
| Unpaid Family Workers | 0 | 0.0% |
| Total | 3,632 | 100.0% |
Employment Status by Age in Senatobia
According to the labor force statistics for Senatobia, out of the total population over 16 years of age (6,733), 57.6% or 3,878 individuals are in the labor force, with 5.1% or 198 of them unemployed. The age group with the highest labor force participation rate is 25 to 29 years, with 88.2% or 383 individuals in the labor force. Within the labor force, the 35 to 44 years age range has the highest percentage of unemployed individuals, with 13.9% or 106 of them being unemployed.
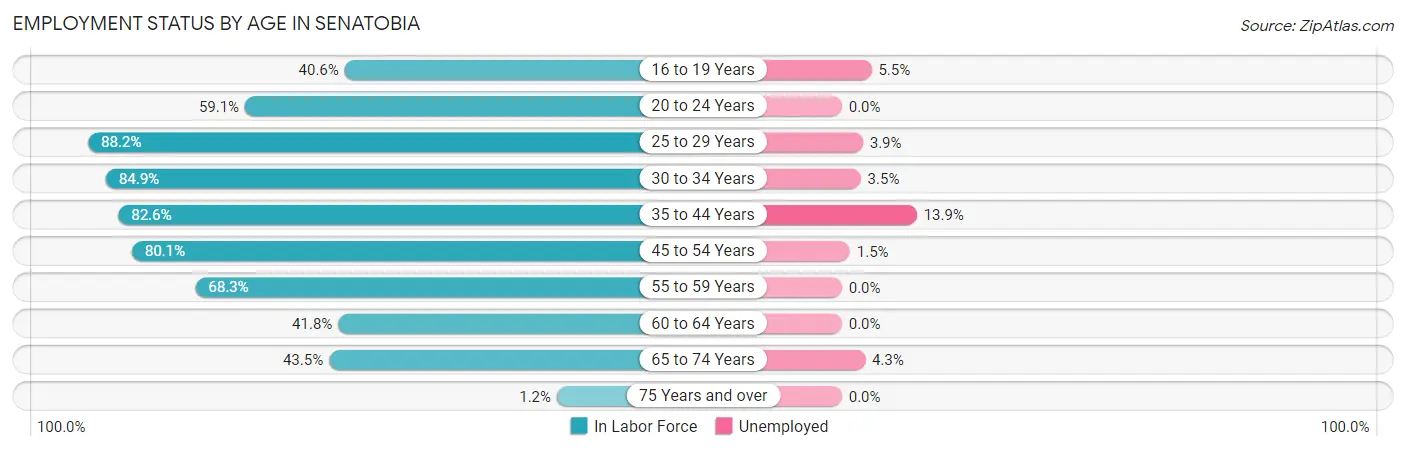
| Age Bracket | In Labor Force | Unemployed |
| 16 to 19 Years | 638 (40.6%) | 35 (5.5%) |
| 20 to 24 Years | 341 (59.1%) | 0 (0.0%) |
| 25 to 29 Years | 383 (88.2%) | 15 (3.9%) |
| 30 to 34 Years | 485 (84.9%) | 17 (3.5%) |
| 35 to 44 Years | 762 (82.6%) | 106 (13.9%) |
| 45 to 54 Years | 541 (80.1%) | 8 (1.5%) |
| 55 to 59 Years | 228 (68.3%) | 0 (0.0%) |
| 60 to 64 Years | 151 (41.8%) | 0 (0.0%) |
| 65 to 74 Years | 345 (43.5%) | 15 (4.3%) |
| 75 Years and over | 6 (1.2%) | 0 (0.0%) |
| Total | 3,878 (57.6%) | 198 (5.1%) |
Employment Status by Educational Attainment in Senatobia
According to labor force statistics for Senatobia, 77.3% of individuals (2,549) out of the total population between 25 and 64 years of age (3,297) are in the labor force, with 5.7% or 145 of them being unemployed. The group with the highest labor force participation rate are those with the educational attainment of bachelor's degree or higher, with 83.7% or 565 individuals in the labor force. Within the labor force, individuals with high school diploma education have the highest percentage of unemployment, with 10.6% or 83 of them being unemployed.
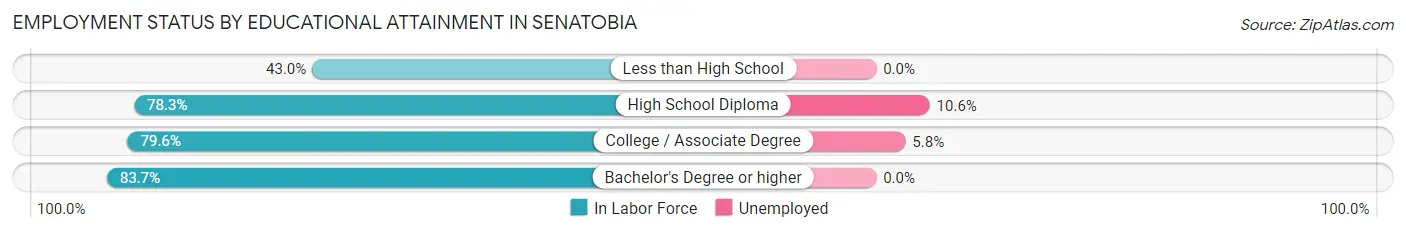
| Educational Attainment | In Labor Force | Unemployed |
| Less than High School | 105 (43.0%) | 0 (0.0%) |
| High School Diploma | 786 (78.3%) | 106 (10.6%) |
| College / Associate Degree | 1,094 (79.6%) | 80 (5.8%) |
| Bachelor's Degree or higher | 565 (83.7%) | 0 (0.0%) |
| Total | 2,549 (77.3%) | 188 (5.7%) |
Employment Occupations by Sex in Senatobia
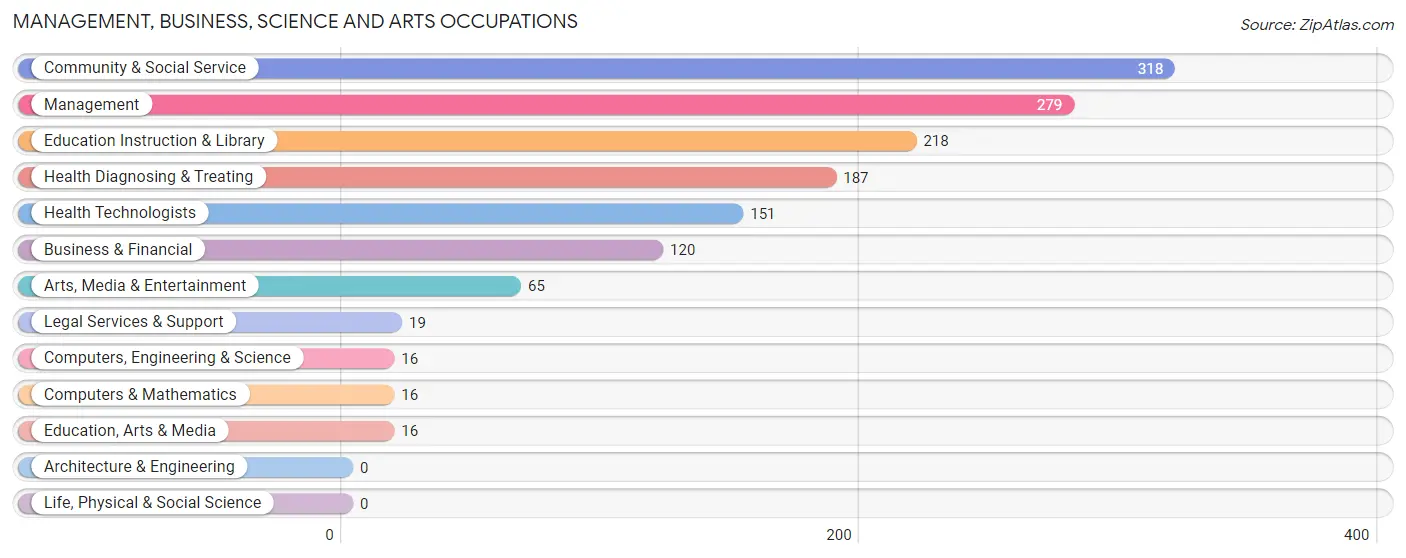
Management, Business, Science and Arts Occupations
The most common Management, Business, Science and Arts occupations in Senatobia are Community & Social Service (318 | 8.6%), Management (279 | 7.6%), Education Instruction & Library (218 | 5.9%), Health Diagnosing & Treating (187 | 5.1%), and Health Technologists (151 | 4.1%).
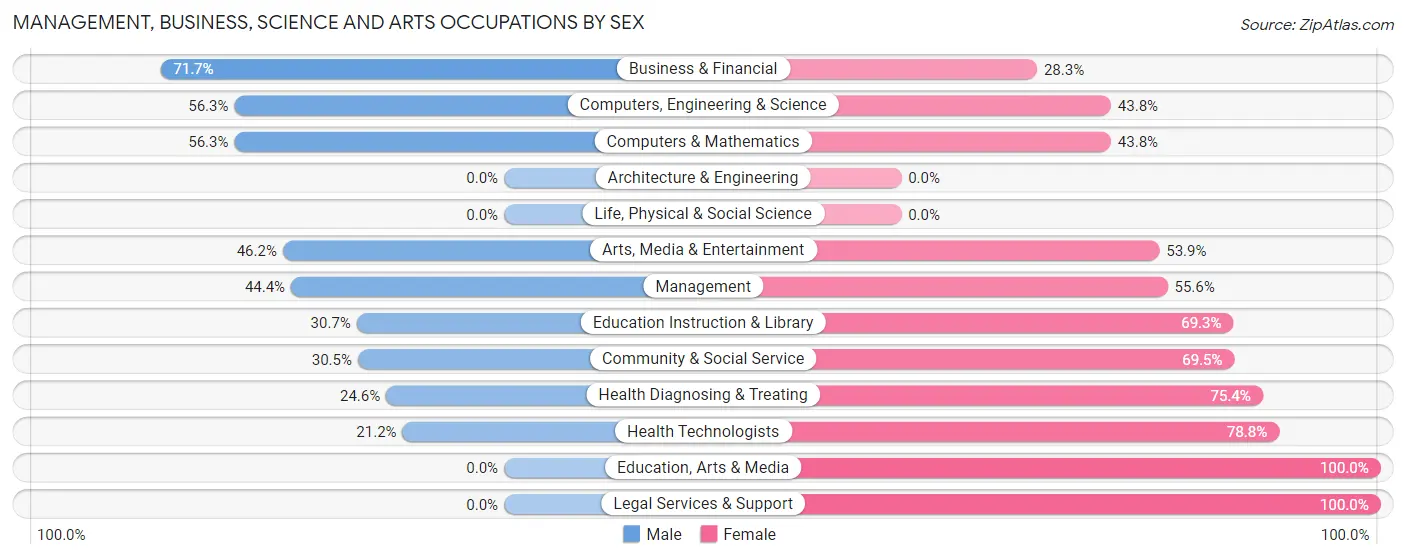
Management, Business, Science and Arts Occupations by Sex
Within the Management, Business, Science and Arts occupations in Senatobia, the most male-oriented occupations are Business & Financial (71.7%), Computers, Engineering & Science (56.2%), and Computers & Mathematics (56.2%), while the most female-oriented occupations are Education, Arts & Media (100.0%), Legal Services & Support (100.0%), and Health Technologists (78.8%).
| Occupation | Male | Female |
| Management | 124 (44.4%) | 155 (55.6%) |
| Business & Financial | 86 (71.7%) | 34 (28.3%) |
| Computers, Engineering & Science | 9 (56.2%) | 7 (43.8%) |
| Computers & Mathematics | 9 (56.2%) | 7 (43.8%) |
| Architecture & Engineering | 0 (0.0%) | 0 (0.0%) |
| Life, Physical & Social Science | 0 (0.0%) | 0 (0.0%) |
| Community & Social Service | 97 (30.5%) | 221 (69.5%) |
| Education, Arts & Media | 0 (0.0%) | 16 (100.0%) |
| Legal Services & Support | 0 (0.0%) | 19 (100.0%) |
| Education Instruction & Library | 67 (30.7%) | 151 (69.3%) |
| Arts, Media & Entertainment | 30 (46.2%) | 35 (53.8%) |
| Health Diagnosing & Treating | 46 (24.6%) | 141 (75.4%) |
| Health Technologists | 32 (21.2%) | 119 (78.8%) |
| Total (Category) | 362 (39.4%) | 558 (60.7%) |
| Total (Overall) | 1,657 (45.0%) | 2,027 (55.0%) |
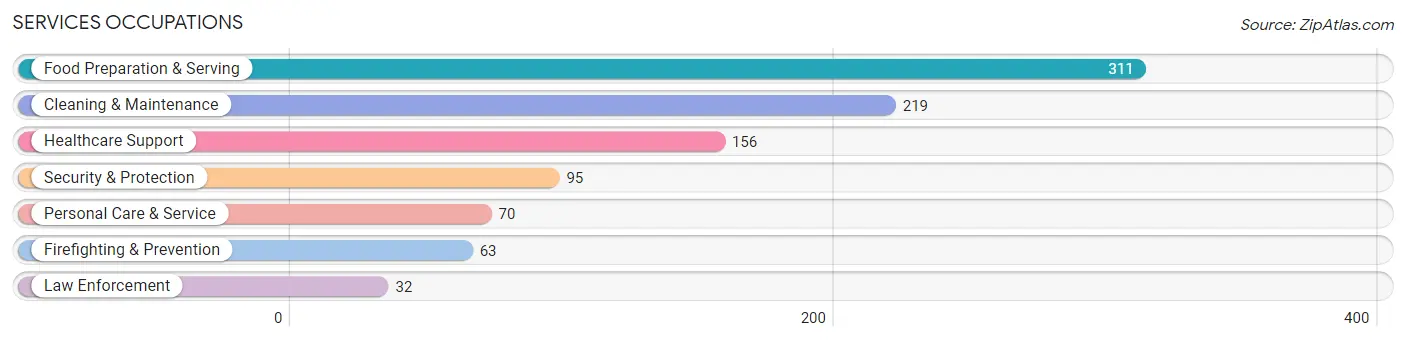
Services Occupations
The most common Services occupations in Senatobia are Food Preparation & Serving (311 | 8.4%), Cleaning & Maintenance (219 | 5.9%), Healthcare Support (156 | 4.2%), Security & Protection (95 | 2.6%), and Personal Care & Service (70 | 1.9%).
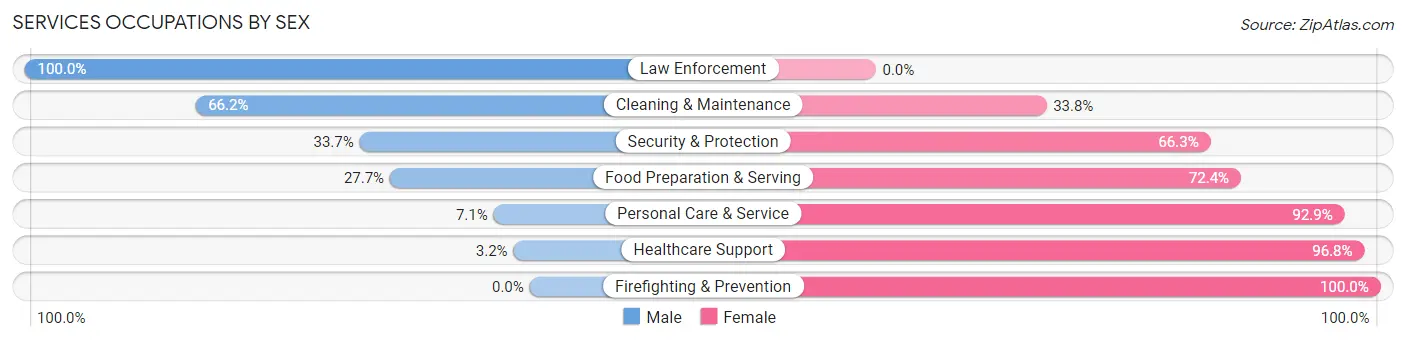
Services Occupations by Sex
Within the Services occupations in Senatobia, the most male-oriented occupations are Law Enforcement (100.0%), Cleaning & Maintenance (66.2%), and Security & Protection (33.7%), while the most female-oriented occupations are Firefighting & Prevention (100.0%), Healthcare Support (96.8%), and Personal Care & Service (92.9%).
| Occupation | Male | Female |
| Healthcare Support | 5 (3.2%) | 151 (96.8%) |
| Security & Protection | 32 (33.7%) | 63 (66.3%) |
| Firefighting & Prevention | 0 (0.0%) | 63 (100.0%) |
| Law Enforcement | 32 (100.0%) | 0 (0.0%) |
| Food Preparation & Serving | 86 (27.7%) | 225 (72.4%) |
| Cleaning & Maintenance | 145 (66.2%) | 74 (33.8%) |
| Personal Care & Service | 5 (7.1%) | 65 (92.9%) |
| Total (Category) | 273 (32.1%) | 578 (67.9%) |
| Total (Overall) | 1,657 (45.0%) | 2,027 (55.0%) |
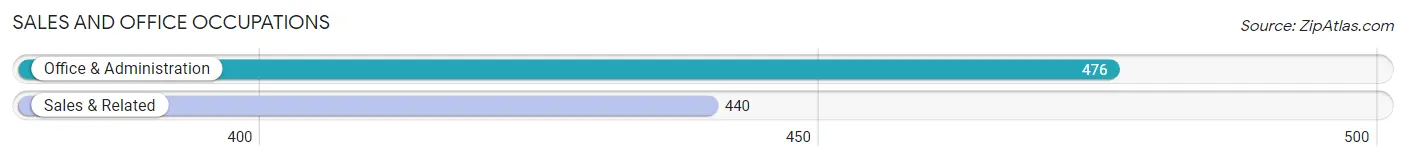
Sales and Office Occupations
The most common Sales and Office occupations in Senatobia are Office & Administration (476 | 12.9%), and Sales & Related (440 | 11.9%).
Sales and Office Occupations by Sex
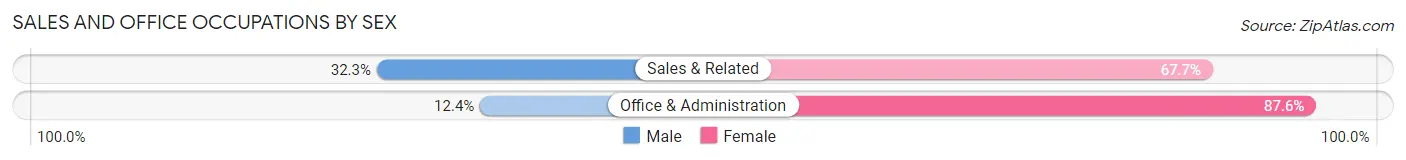
| Occupation | Male | Female |
| Sales & Related | 142 (32.3%) | 298 (67.7%) |
| Office & Administration | 59 (12.4%) | 417 (87.6%) |
| Total (Category) | 201 (21.9%) | 715 (78.1%) |
| Total (Overall) | 1,657 (45.0%) | 2,027 (55.0%) |
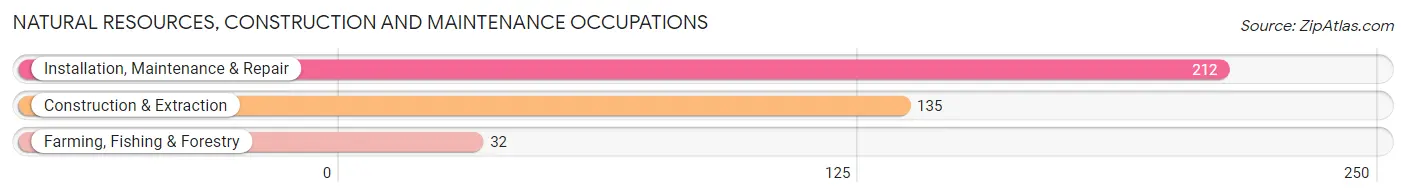
Natural Resources, Construction and Maintenance Occupations
The most common Natural Resources, Construction and Maintenance occupations in Senatobia are Installation, Maintenance & Repair (212 | 5.8%), Construction & Extraction (135 | 3.7%), and Farming, Fishing & Forestry (32 | 0.9%).
Natural Resources, Construction and Maintenance Occupations by Sex
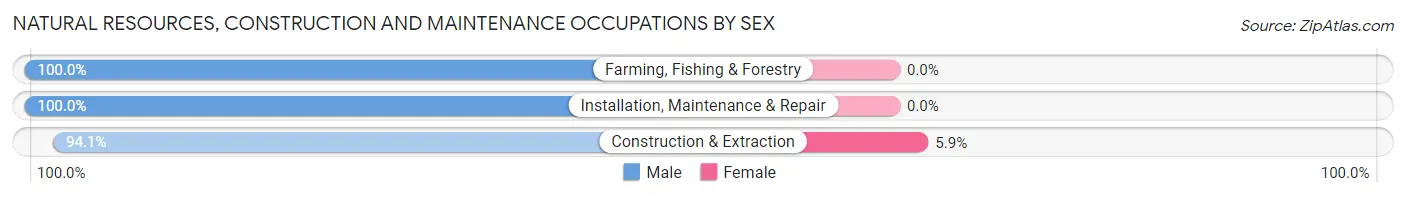
| Occupation | Male | Female |
| Farming, Fishing & Forestry | 32 (100.0%) | 0 (0.0%) |
| Construction & Extraction | 127 (94.1%) | 8 (5.9%) |
| Installation, Maintenance & Repair | 212 (100.0%) | 0 (0.0%) |
| Total (Category) | 371 (97.9%) | 8 (2.1%) |
| Total (Overall) | 1,657 (45.0%) | 2,027 (55.0%) |
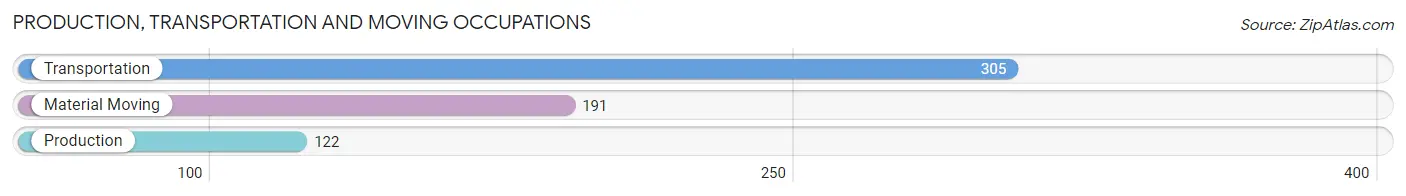
Production, Transportation and Moving Occupations
The most common Production, Transportation and Moving occupations in Senatobia are Transportation (305 | 8.3%), Material Moving (191 | 5.2%), and Production (122 | 3.3%).
Production, Transportation and Moving Occupations by Sex
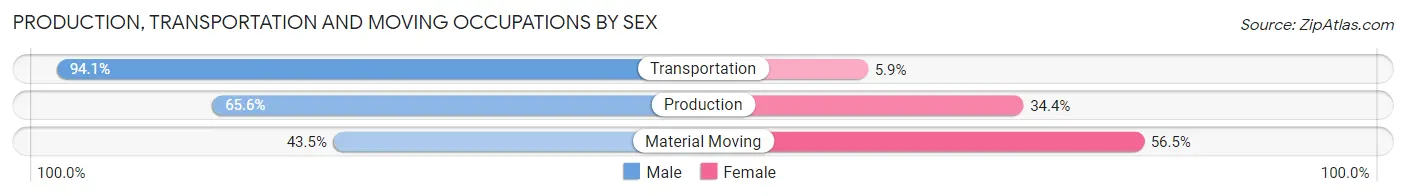
| Occupation | Male | Female |
| Production | 80 (65.6%) | 42 (34.4%) |
| Transportation | 287 (94.1%) | 18 (5.9%) |
| Material Moving | 83 (43.5%) | 108 (56.5%) |
| Total (Category) | 450 (72.8%) | 168 (27.2%) |
| Total (Overall) | 1,657 (45.0%) | 2,027 (55.0%) |
Employment Industries by Sex in Senatobia
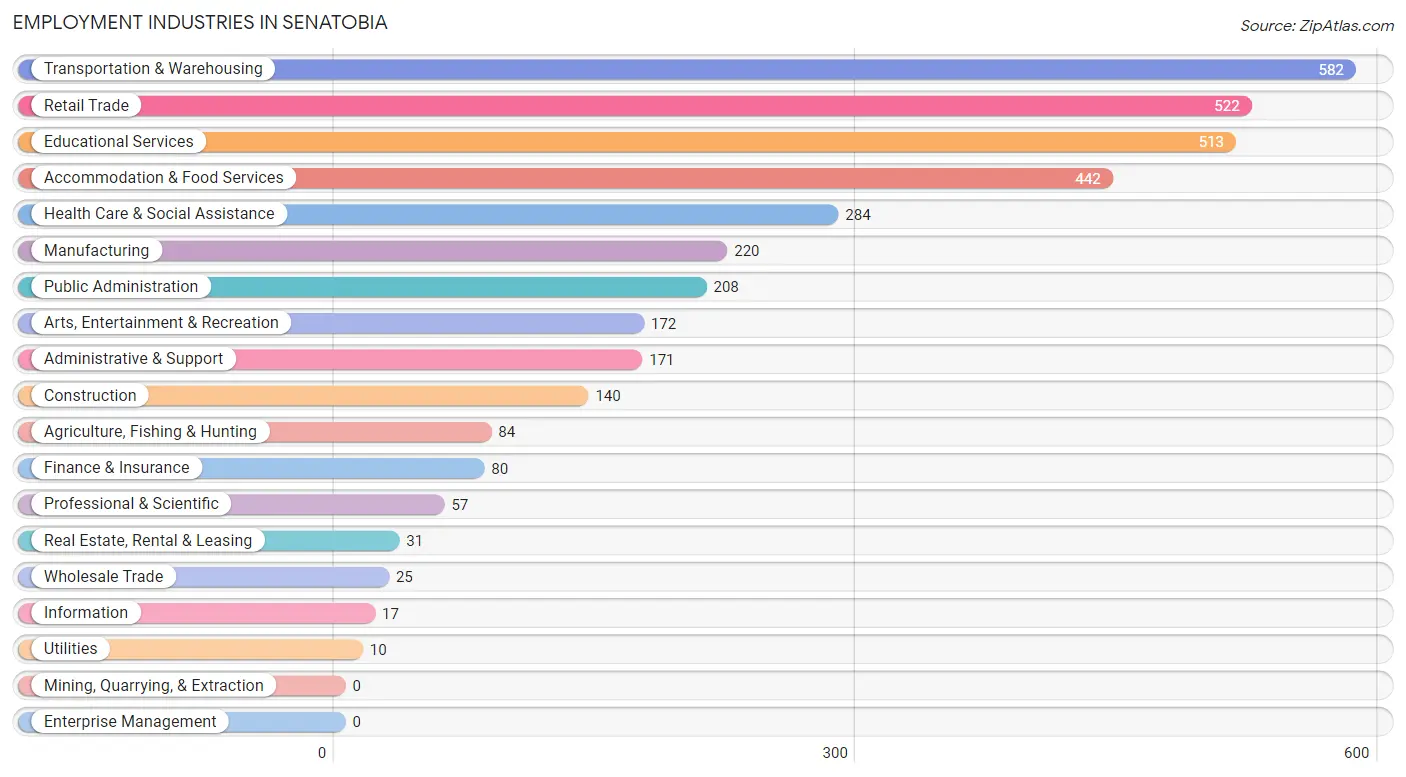
Employment Industries in Senatobia
The major employment industries in Senatobia include Transportation & Warehousing (582 | 15.8%), Retail Trade (522 | 14.2%), Educational Services (513 | 13.9%), Accommodation & Food Services (442 | 12.0%), and Health Care & Social Assistance (284 | 7.7%).
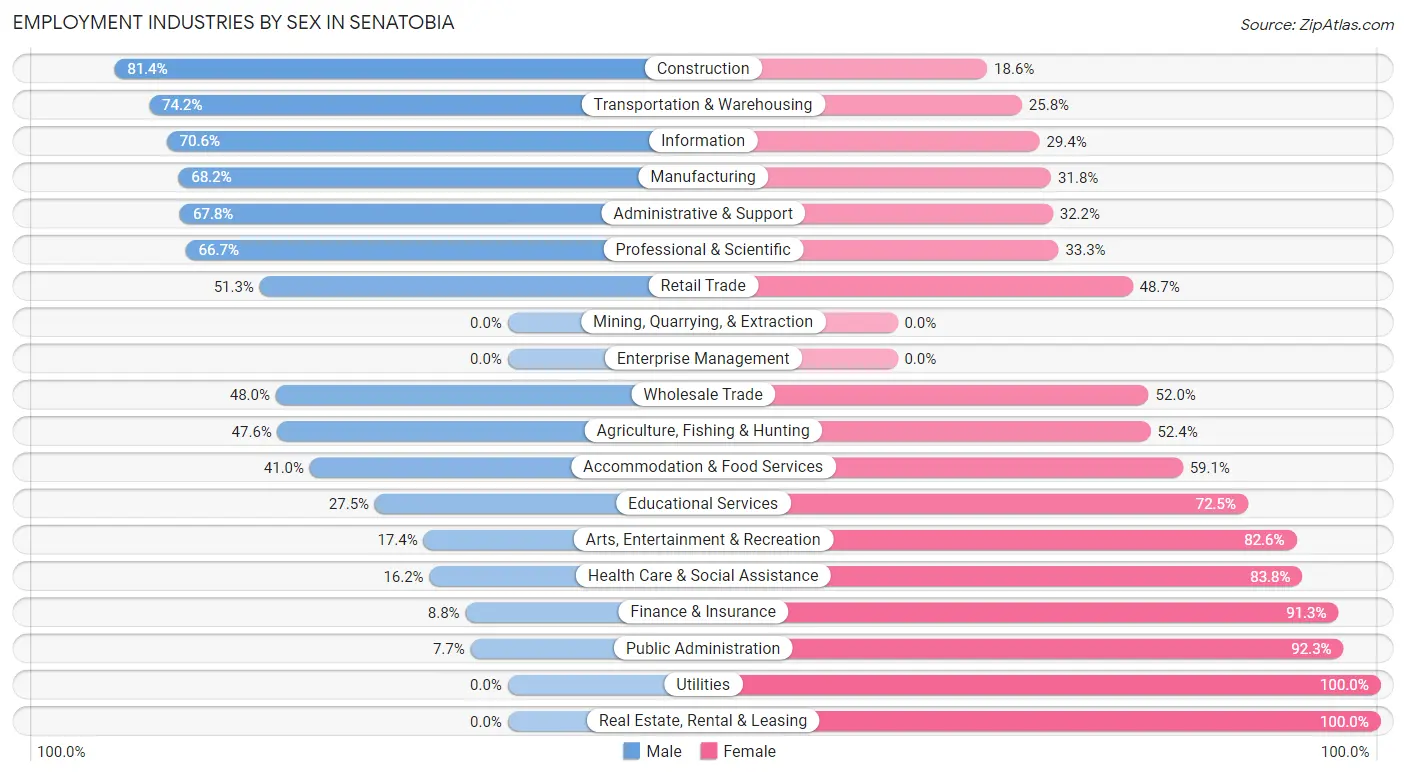
Employment Industries by Sex in Senatobia
The Senatobia industries that see more men than women are Construction (81.4%), Transportation & Warehousing (74.2%), and Information (70.6%), whereas the industries that tend to have a higher number of women are Utilities (100.0%), Real Estate, Rental & Leasing (100.0%), and Public Administration (92.3%).
| Industry | Male | Female |
| Agriculture, Fishing & Hunting | 40 (47.6%) | 44 (52.4%) |
| Mining, Quarrying, & Extraction | 0 (0.0%) | 0 (0.0%) |
| Construction | 114 (81.4%) | 26 (18.6%) |
| Manufacturing | 150 (68.2%) | 70 (31.8%) |
| Wholesale Trade | 12 (48.0%) | 13 (52.0%) |
| Retail Trade | 268 (51.3%) | 254 (48.7%) |
| Transportation & Warehousing | 432 (74.2%) | 150 (25.8%) |
| Utilities | 0 (0.0%) | 10 (100.0%) |
| Information | 12 (70.6%) | 5 (29.4%) |
| Finance & Insurance | 7 (8.7%) | 73 (91.2%) |
| Real Estate, Rental & Leasing | 0 (0.0%) | 31 (100.0%) |
| Professional & Scientific | 38 (66.7%) | 19 (33.3%) |
| Enterprise Management | 0 (0.0%) | 0 (0.0%) |
| Administrative & Support | 116 (67.8%) | 55 (32.2%) |
| Educational Services | 141 (27.5%) | 372 (72.5%) |
| Health Care & Social Assistance | 46 (16.2%) | 238 (83.8%) |
| Arts, Entertainment & Recreation | 30 (17.4%) | 142 (82.6%) |
| Accommodation & Food Services | 181 (40.9%) | 261 (59.1%) |
| Public Administration | 16 (7.7%) | 192 (92.3%) |
| Total | 1,657 (45.0%) | 2,027 (55.0%) |
Education in Senatobia
School Enrollment in Senatobia
The most common levels of schooling among the 2,946 students in Senatobia are college / undergraduate (1,579 | 53.6%), elementary school (449 | 15.2%), and middle school (355 | 12.0%).
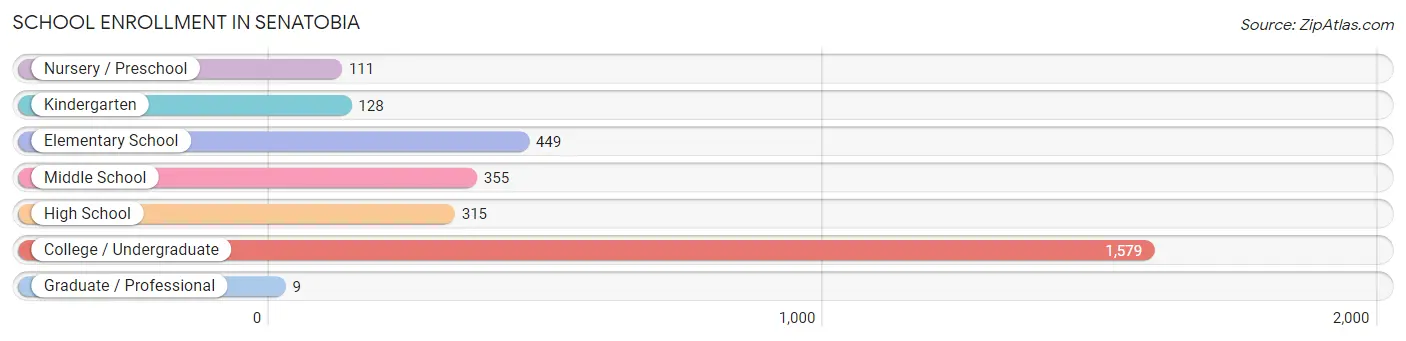
| School Level | # Students | % Students |
| Nursery / Preschool | 111 | 3.8% |
| Kindergarten | 128 | 4.3% |
| Elementary School | 449 | 15.2% |
| Middle School | 355 | 12.0% |
| High School | 315 | 10.7% |
| College / Undergraduate | 1,579 | 53.6% |
| Graduate / Professional | 9 | 0.3% |
| Total | 2,946 | 100.0% |
School Enrollment by Age by Funding Source in Senatobia
Out of a total of 2,946 students who are enrolled in schools in Senatobia, 112 (3.8%) attend a private institution, while the remaining 2,834 (96.2%) are enrolled in public schools. The age group of 35 years and over has the highest likelihood of being enrolled in private schools, with 24 (100.0% in the age bracket) enrolled. Conversely, the age group of 20 to 24 year olds has the lowest likelihood of being enrolled in a private school, with 327 (100.0% in the age bracket) attending a public institution.
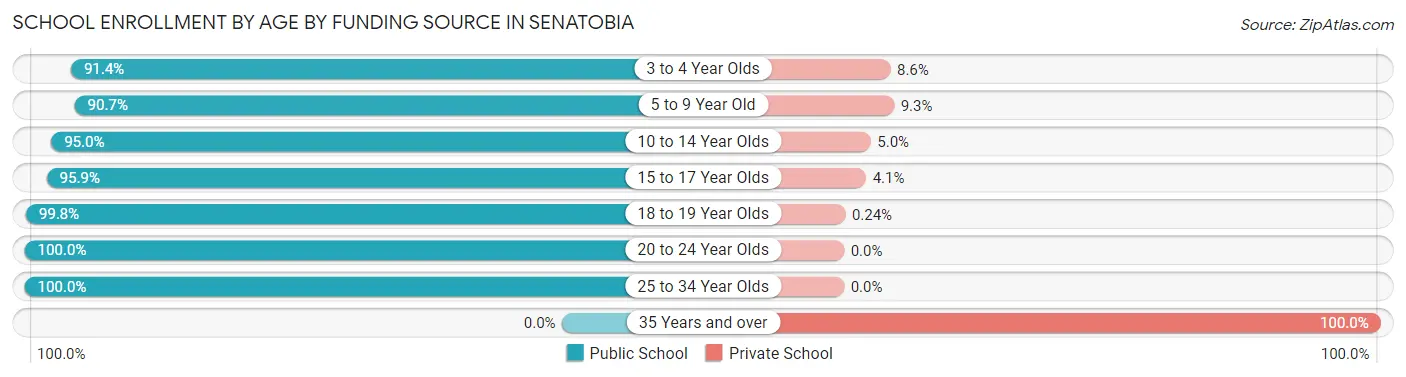
| Age Bracket | Public School | Private School |
| 3 to 4 Year Olds | 74 (91.4%) | 7 (8.6%) |
| 5 to 9 Year Old | 428 (90.7%) | 44 (9.3%) |
| 10 to 14 Year Olds | 459 (95.0%) | 24 (5.0%) |
| 15 to 17 Year Olds | 257 (95.9%) | 11 (4.1%) |
| 18 to 19 Year Olds | 1,272 (99.8%) | 3 (0.2%) |
| 20 to 24 Year Olds | 327 (100.0%) | 0 (0.0%) |
| 25 to 34 Year Olds | 16 (100.0%) | 0 (0.0%) |
| 35 Years and over | 0 (0.0%) | 24 (100.0%) |
| Total | 2,834 (96.2%) | 112 (3.8%) |
Educational Attainment by Field of Study in Senatobia
Education (363 | 35.6%), business (191 | 18.7%), science & technology (159 | 15.6%), engineering (75 | 7.3%), and arts & humanities (55 | 5.4%) are the most common fields of study among 1,020 individuals in Senatobia who have obtained a bachelor's degree or higher.
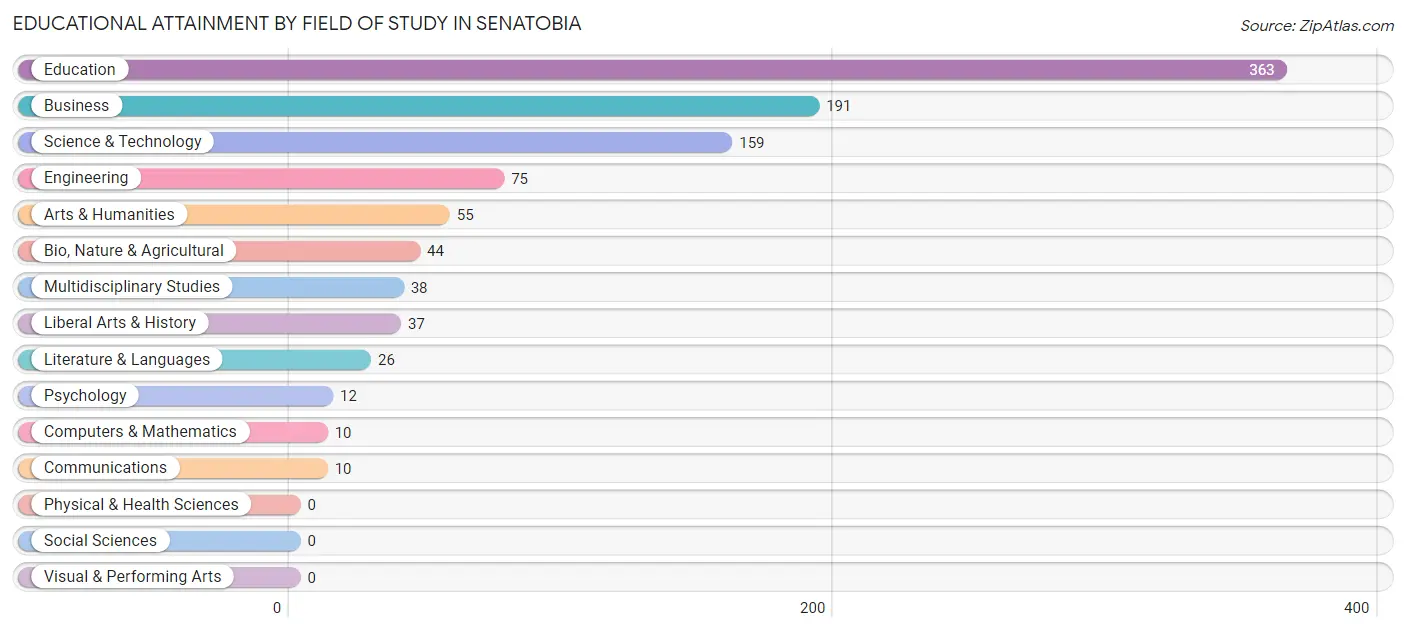
| Field of Study | # Graduates | % Graduates |
| Computers & Mathematics | 10 | 1.0% |
| Bio, Nature & Agricultural | 44 | 4.3% |
| Physical & Health Sciences | 0 | 0.0% |
| Psychology | 12 | 1.2% |
| Social Sciences | 0 | 0.0% |
| Engineering | 75 | 7.3% |
| Multidisciplinary Studies | 38 | 3.7% |
| Science & Technology | 159 | 15.6% |
| Business | 191 | 18.7% |
| Education | 363 | 35.6% |
| Literature & Languages | 26 | 2.5% |
| Liberal Arts & History | 37 | 3.6% |
| Visual & Performing Arts | 0 | 0.0% |
| Communications | 10 | 1.0% |
| Arts & Humanities | 55 | 5.4% |
| Total | 1,020 | 100.0% |
Transportation & Commute in Senatobia
Vehicle Availability by Sex in Senatobia
The most prevalent vehicle ownership categories in Senatobia are males with 2 vehicles (511, accounting for 40.3%) and females with 2 vehicles (666, making up 31.3%).
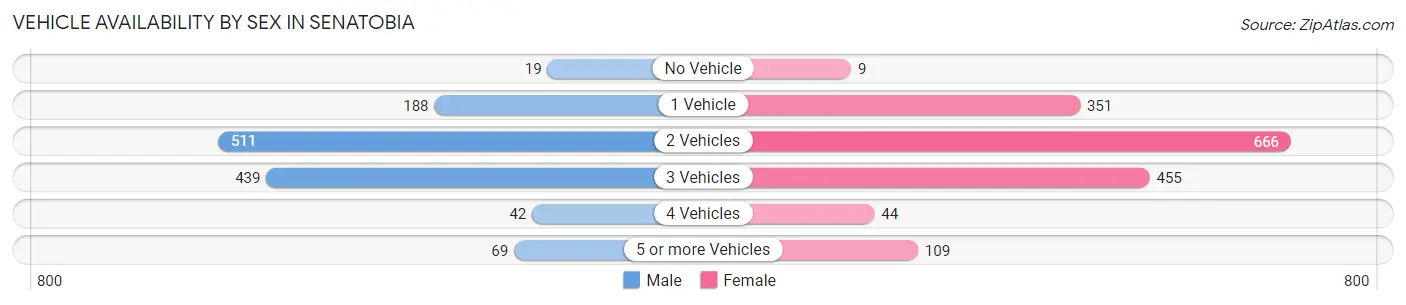
| Vehicles Available | Male | Female |
| No Vehicle | 19 (1.5%) | 9 (0.5%) |
| 1 Vehicle | 188 (14.8%) | 351 (21.5%) |
| 2 Vehicles | 511 (40.3%) | 666 (40.8%) |
| 3 Vehicles | 439 (34.6%) | 455 (27.9%) |
| 4 Vehicles | 42 (3.3%) | 44 (2.7%) |
| 5 or more Vehicles | 69 (5.4%) | 109 (6.7%) |
| Total | 1,268 (100.0%) | 1,634 (100.0%) |
Commute Time in Senatobia
The most frequently occuring commute durations in Senatobia are 45 to 59 minutes (718 commuters, 19.8%), 5 to 9 minutes (687 commuters, 19.0%), and 30 to 34 minutes (536 commuters, 14.8%).
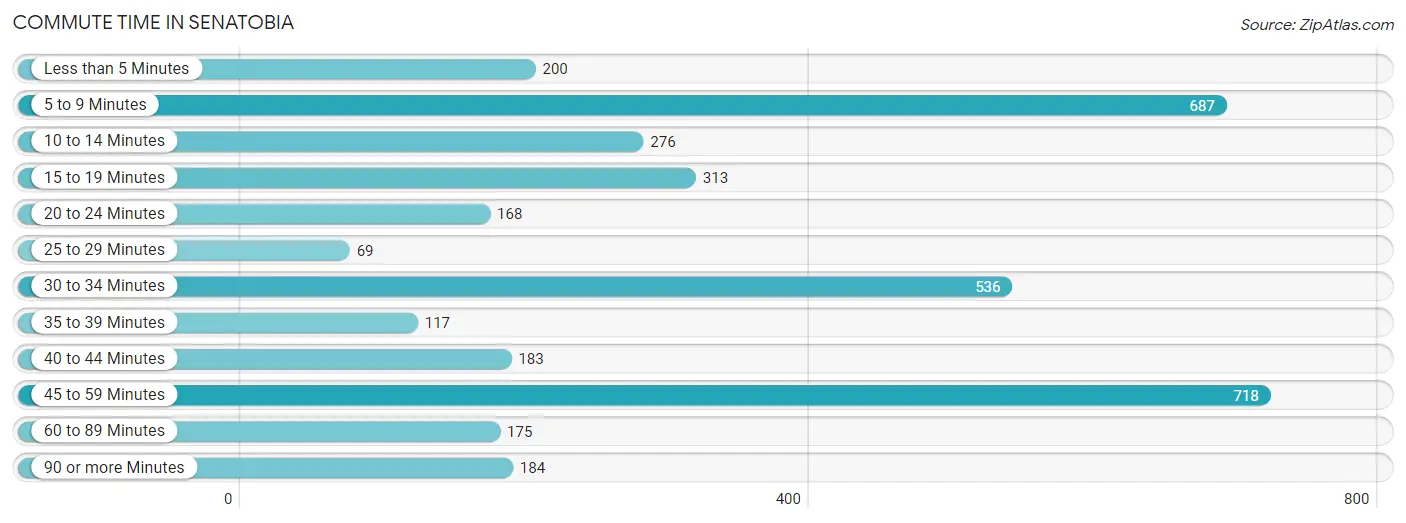
| Commute Time | # Commuters | % Commuters |
| Less than 5 Minutes | 200 | 5.5% |
| 5 to 9 Minutes | 687 | 19.0% |
| 10 to 14 Minutes | 276 | 7.6% |
| 15 to 19 Minutes | 313 | 8.6% |
| 20 to 24 Minutes | 168 | 4.6% |
| 25 to 29 Minutes | 69 | 1.9% |
| 30 to 34 Minutes | 536 | 14.8% |
| 35 to 39 Minutes | 117 | 3.2% |
| 40 to 44 Minutes | 183 | 5.1% |
| 45 to 59 Minutes | 718 | 19.8% |
| 60 to 89 Minutes | 175 | 4.8% |
| 90 or more Minutes | 184 | 5.1% |
Commute Time by Sex in Senatobia
The most common commute times in Senatobia are 45 to 59 minutes (323 commuters, 19.8%) for males and 5 to 9 minutes (439 commuters, 22.0%) for females.
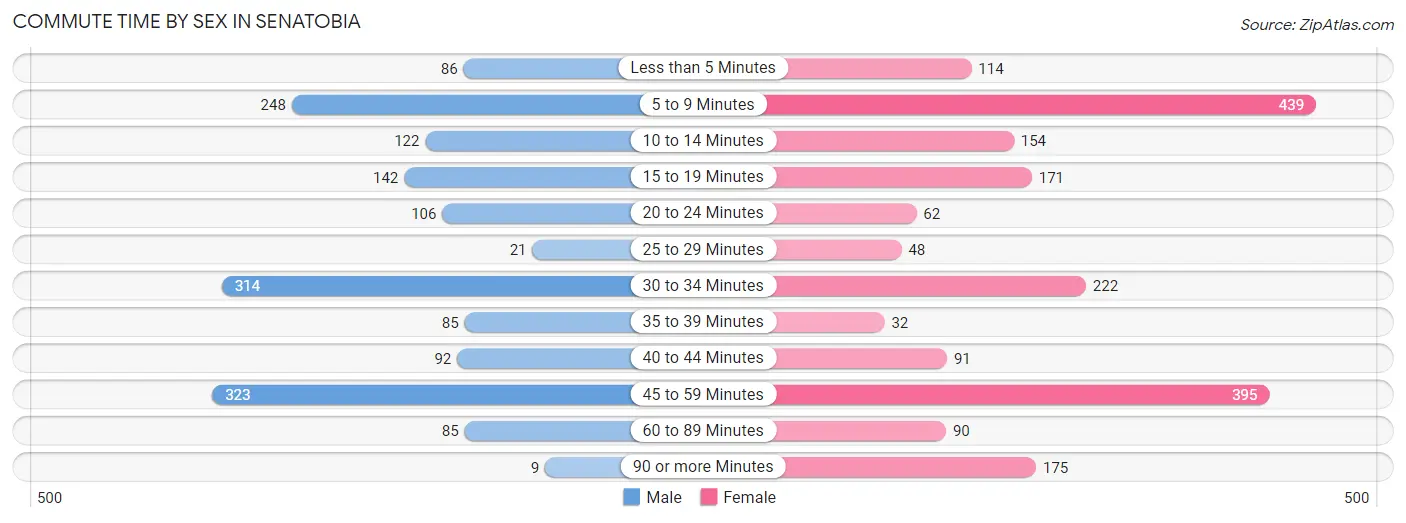
| Commute Time | Male | Female |
| Less than 5 Minutes | 86 (5.3%) | 114 (5.7%) |
| 5 to 9 Minutes | 248 (15.2%) | 439 (22.0%) |
| 10 to 14 Minutes | 122 (7.5%) | 154 (7.7%) |
| 15 to 19 Minutes | 142 (8.7%) | 171 (8.6%) |
| 20 to 24 Minutes | 106 (6.5%) | 62 (3.1%) |
| 25 to 29 Minutes | 21 (1.3%) | 48 (2.4%) |
| 30 to 34 Minutes | 314 (19.2%) | 222 (11.1%) |
| 35 to 39 Minutes | 85 (5.2%) | 32 (1.6%) |
| 40 to 44 Minutes | 92 (5.6%) | 91 (4.6%) |
| 45 to 59 Minutes | 323 (19.8%) | 395 (19.8%) |
| 60 to 89 Minutes | 85 (5.2%) | 90 (4.5%) |
| 90 or more Minutes | 9 (0.5%) | 175 (8.8%) |
Time of Departure to Work by Sex in Senatobia
The most frequent times of departure to work in Senatobia are 4:00 PM to 11:59 PM (338, 20.7%) for males and 7:00 AM to 7:29 AM (336, 16.9%) for females.
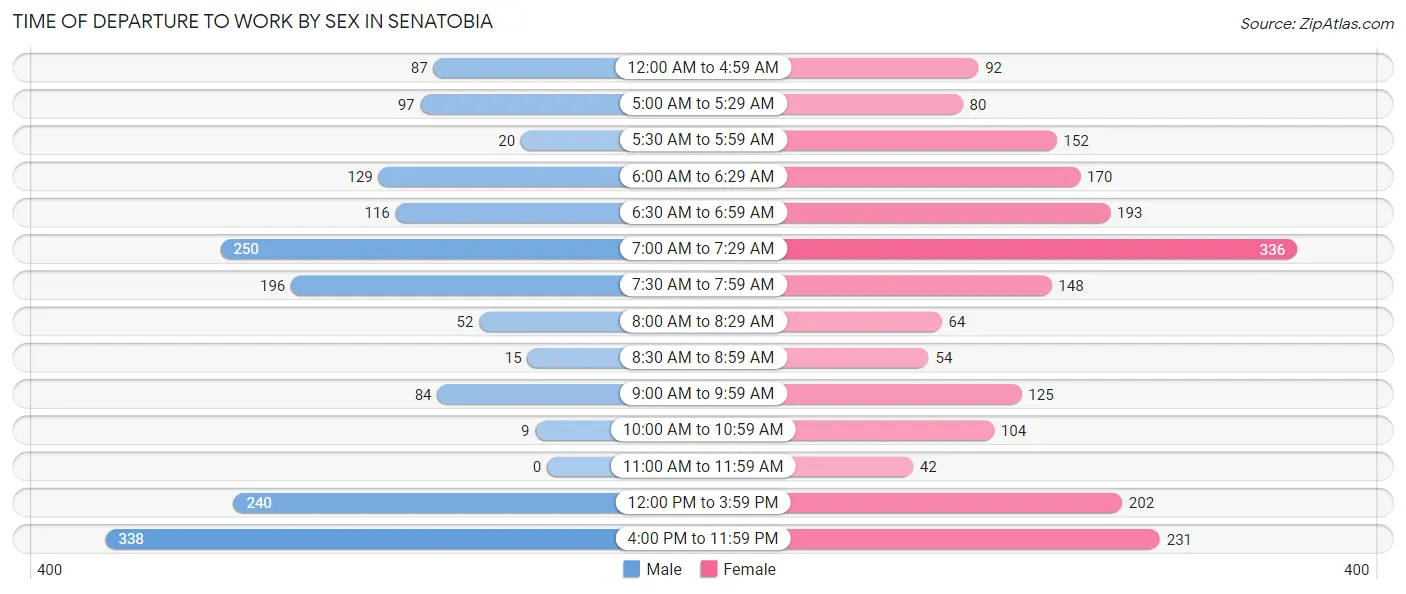
| Time of Departure | Male | Female |
| 12:00 AM to 4:59 AM | 87 (5.3%) | 92 (4.6%) |
| 5:00 AM to 5:29 AM | 97 (5.9%) | 80 (4.0%) |
| 5:30 AM to 5:59 AM | 20 (1.2%) | 152 (7.6%) |
| 6:00 AM to 6:29 AM | 129 (7.9%) | 170 (8.5%) |
| 6:30 AM to 6:59 AM | 116 (7.1%) | 193 (9.7%) |
| 7:00 AM to 7:29 AM | 250 (15.3%) | 336 (16.9%) |
| 7:30 AM to 7:59 AM | 196 (12.0%) | 148 (7.4%) |
| 8:00 AM to 8:29 AM | 52 (3.2%) | 64 (3.2%) |
| 8:30 AM to 8:59 AM | 15 (0.9%) | 54 (2.7%) |
| 9:00 AM to 9:59 AM | 84 (5.1%) | 125 (6.3%) |
| 10:00 AM to 10:59 AM | 9 (0.5%) | 104 (5.2%) |
| 11:00 AM to 11:59 AM | 0 (0.0%) | 42 (2.1%) |
| 12:00 PM to 3:59 PM | 240 (14.7%) | 202 (10.1%) |
| 4:00 PM to 11:59 PM | 338 (20.7%) | 231 (11.6%) |
| Total | 1,633 (100.0%) | 1,993 (100.0%) |
Housing Occupancy in Senatobia
Occupancy by Ownership in Senatobia
Of the total 2,636 dwellings in Senatobia, owner-occupied units account for 1,457 (55.3%), while renter-occupied units make up 1,179 (44.7%).
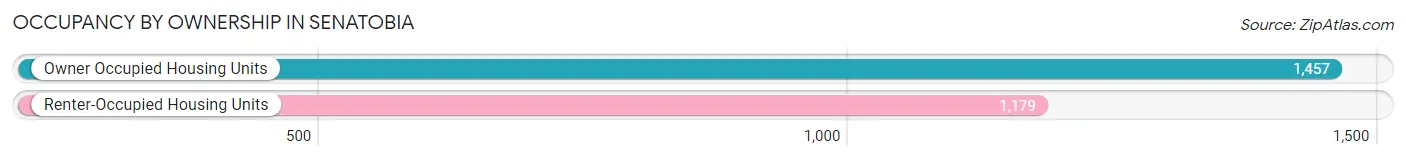
| Occupancy | # Housing Units | % Housing Units |
| Owner Occupied Housing Units | 1,457 | 55.3% |
| Renter-Occupied Housing Units | 1,179 | 44.7% |
| Total Occupied Housing Units | 2,636 | 100.0% |
Occupancy by Household Size in Senatobia
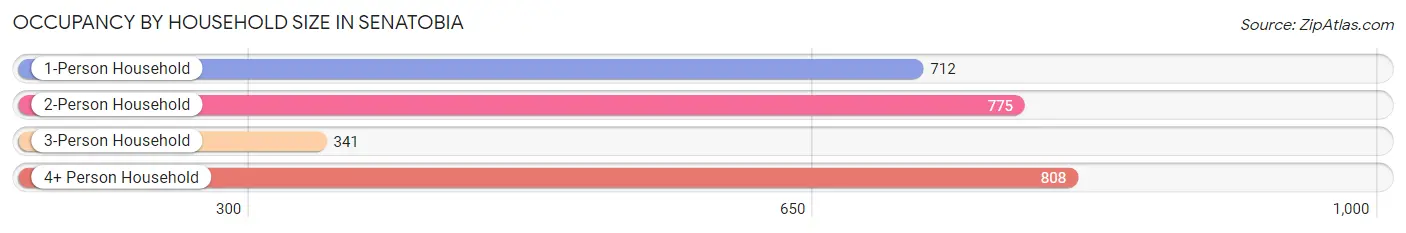
| Household Size | # Housing Units | % Housing Units |
| 1-Person Household | 712 | 27.0% |
| 2-Person Household | 775 | 29.4% |
| 3-Person Household | 341 | 12.9% |
| 4+ Person Household | 808 | 30.6% |
| Total Housing Units | 2,636 | 100.0% |
Occupancy by Ownership by Household Size in Senatobia
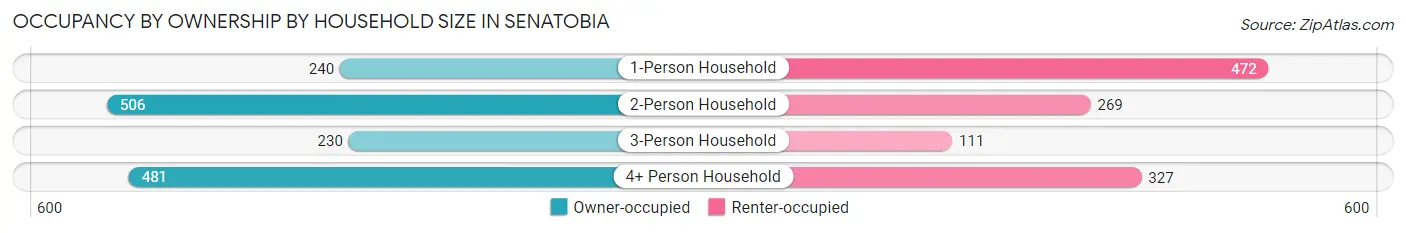
| Household Size | Owner-occupied | Renter-occupied |
| 1-Person Household | 240 (33.7%) | 472 (66.3%) |
| 2-Person Household | 506 (65.3%) | 269 (34.7%) |
| 3-Person Household | 230 (67.4%) | 111 (32.6%) |
| 4+ Person Household | 481 (59.5%) | 327 (40.5%) |
| Total Housing Units | 1,457 (55.3%) | 1,179 (44.7%) |
Occupancy by Educational Attainment in Senatobia
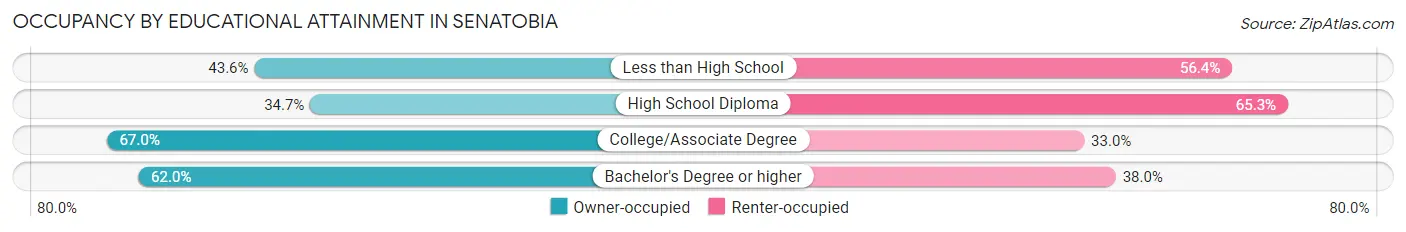
| Household Size | Owner-occupied | Renter-occupied |
| Less than High School | 88 (43.6%) | 114 (56.4%) |
| High School Diploma | 246 (34.7%) | 463 (65.3%) |
| College/Associate Degree | 715 (67.0%) | 352 (33.0%) |
| Bachelor's Degree or higher | 408 (62.0%) | 250 (38.0%) |
Occupancy by Age of Householder in Senatobia
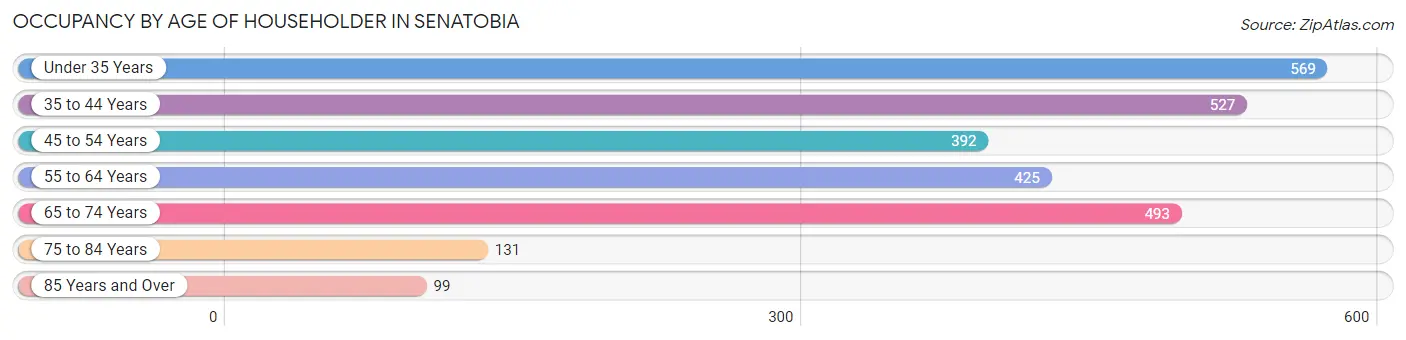
| Age Bracket | # Households | % Households |
| Under 35 Years | 569 | 21.6% |
| 35 to 44 Years | 527 | 20.0% |
| 45 to 54 Years | 392 | 14.9% |
| 55 to 64 Years | 425 | 16.1% |
| 65 to 74 Years | 493 | 18.7% |
| 75 to 84 Years | 131 | 5.0% |
| 85 Years and Over | 99 | 3.8% |
| Total | 2,636 | 100.0% |
Housing Finances in Senatobia
Median Income by Occupancy in Senatobia
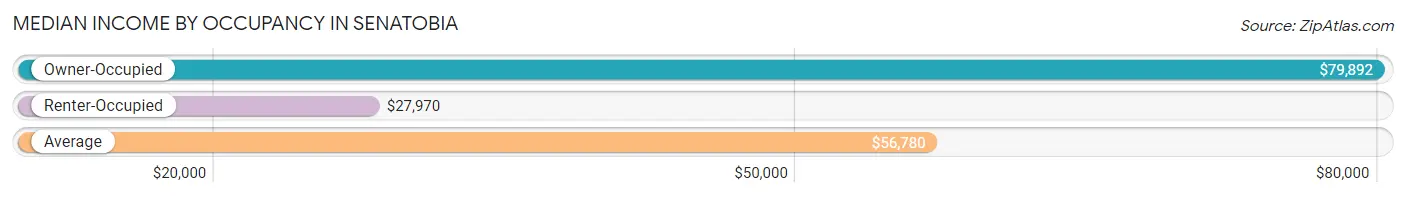
| Occupancy Type | # Households | Median Income |
| Owner-Occupied | 1,457 (55.3%) | $79,892 |
| Renter-Occupied | 1,179 (44.7%) | $27,970 |
| Average | 2,636 (100.0%) | $56,780 |
Occupancy by Householder Income Bracket in Senatobia
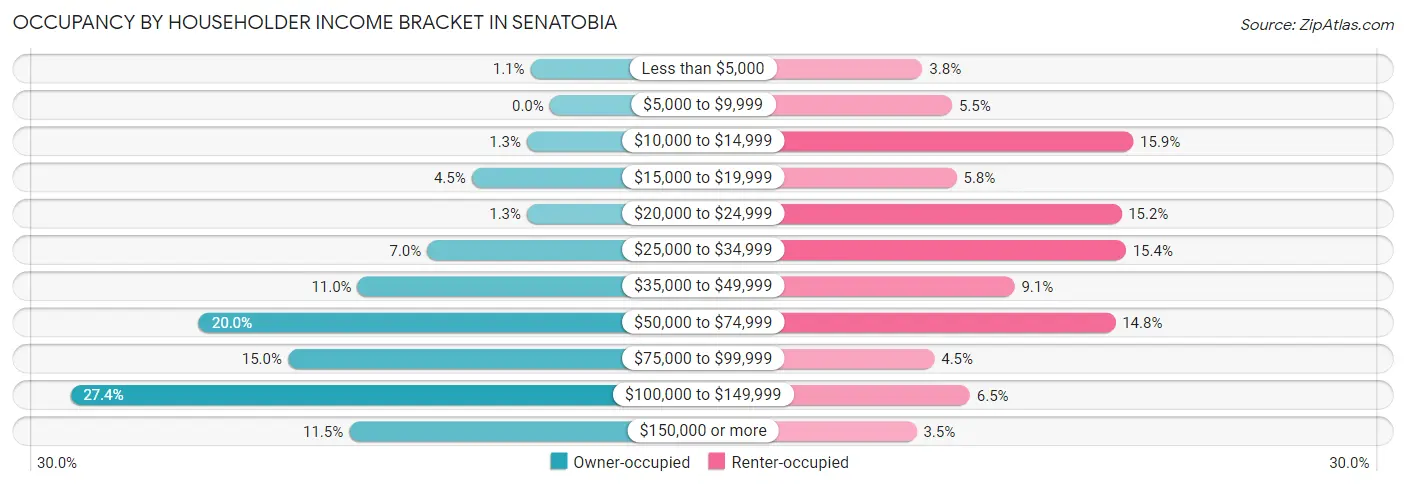
| Income Bracket | Owner-occupied | Renter-occupied |
| Less than $5,000 | 16 (1.1%) | 45 (3.8%) |
| $5,000 to $9,999 | 0 (0.0%) | 65 (5.5%) |
| $10,000 to $14,999 | 19 (1.3%) | 187 (15.9%) |
| $15,000 to $19,999 | 65 (4.5%) | 68 (5.8%) |
| $20,000 to $24,999 | 19 (1.3%) | 179 (15.2%) |
| $25,000 to $34,999 | 102 (7.0%) | 182 (15.4%) |
| $35,000 to $49,999 | 160 (11.0%) | 107 (9.1%) |
| $50,000 to $74,999 | 292 (20.0%) | 175 (14.8%) |
| $75,000 to $99,999 | 218 (15.0%) | 53 (4.5%) |
| $100,000 to $149,999 | 399 (27.4%) | 77 (6.5%) |
| $150,000 or more | 167 (11.5%) | 41 (3.5%) |
| Total | 1,457 (100.0%) | 1,179 (100.0%) |
Monthly Housing Cost Tiers in Senatobia
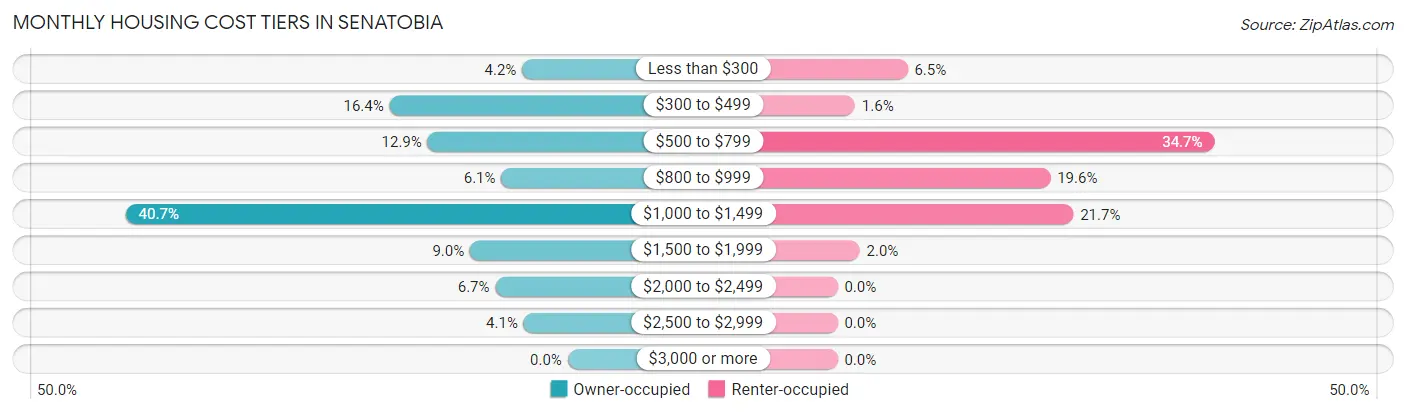
| Monthly Cost | Owner-occupied | Renter-occupied |
| Less than $300 | 61 (4.2%) | 76 (6.5%) |
| $300 to $499 | 239 (16.4%) | 19 (1.6%) |
| $500 to $799 | 188 (12.9%) | 409 (34.7%) |
| $800 to $999 | 89 (6.1%) | 231 (19.6%) |
| $1,000 to $1,499 | 593 (40.7%) | 256 (21.7%) |
| $1,500 to $1,999 | 131 (9.0%) | 24 (2.0%) |
| $2,000 to $2,499 | 97 (6.7%) | 0 (0.0%) |
| $2,500 to $2,999 | 59 (4.1%) | 0 (0.0%) |
| $3,000 or more | 0 (0.0%) | 0 (0.0%) |
| Total | 1,457 (100.0%) | 1,179 (100.0%) |
Physical Housing Characteristics in Senatobia
Housing Structures in Senatobia
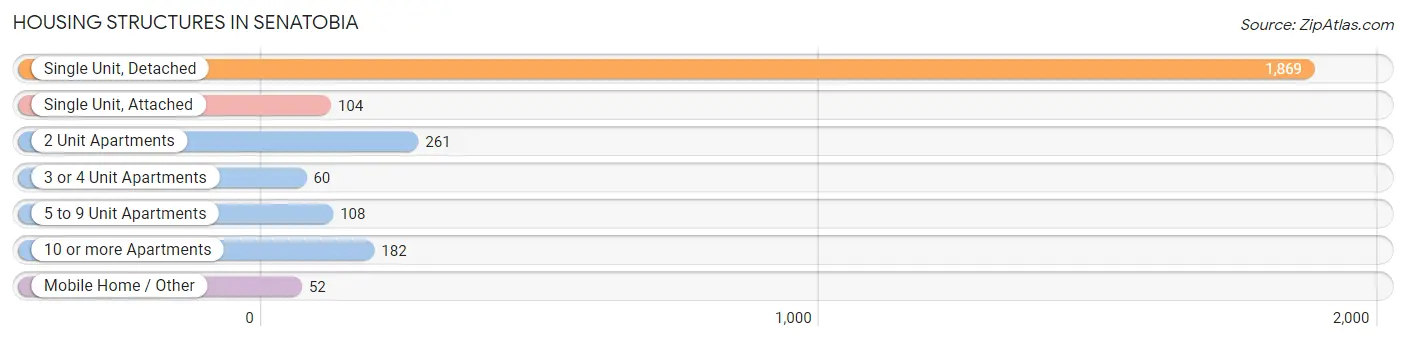
| Structure Type | # Housing Units | % Housing Units |
| Single Unit, Detached | 1,869 | 70.9% |
| Single Unit, Attached | 104 | 4.0% |
| 2 Unit Apartments | 261 | 9.9% |
| 3 or 4 Unit Apartments | 60 | 2.3% |
| 5 to 9 Unit Apartments | 108 | 4.1% |
| 10 or more Apartments | 182 | 6.9% |
| Mobile Home / Other | 52 | 2.0% |
| Total | 2,636 | 100.0% |
Housing Structures by Occupancy in Senatobia
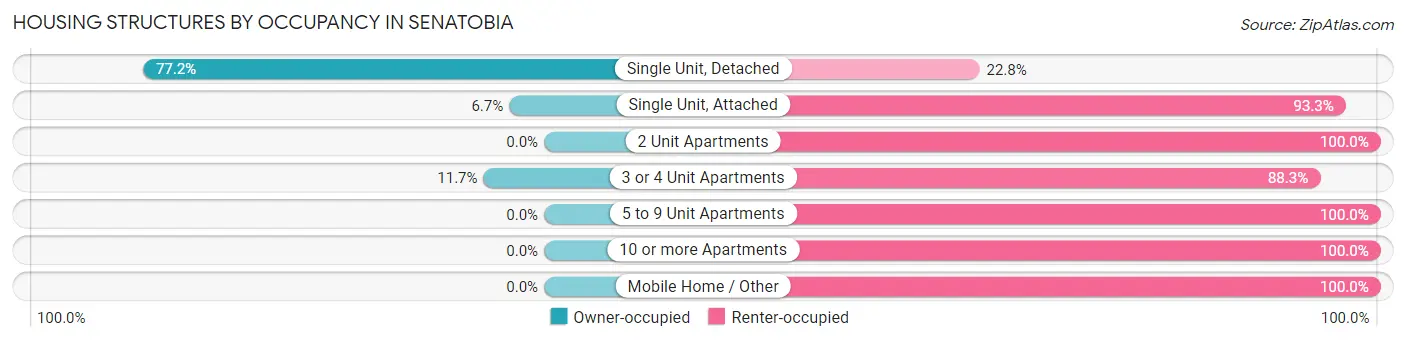
| Structure Type | Owner-occupied | Renter-occupied |
| Single Unit, Detached | 1,443 (77.2%) | 426 (22.8%) |
| Single Unit, Attached | 7 (6.7%) | 97 (93.3%) |
| 2 Unit Apartments | 0 (0.0%) | 261 (100.0%) |
| 3 or 4 Unit Apartments | 7 (11.7%) | 53 (88.3%) |
| 5 to 9 Unit Apartments | 0 (0.0%) | 108 (100.0%) |
| 10 or more Apartments | 0 (0.0%) | 182 (100.0%) |
| Mobile Home / Other | 0 (0.0%) | 52 (100.0%) |
| Total | 1,457 (55.3%) | 1,179 (44.7%) |
Housing Structures by Number of Rooms in Senatobia
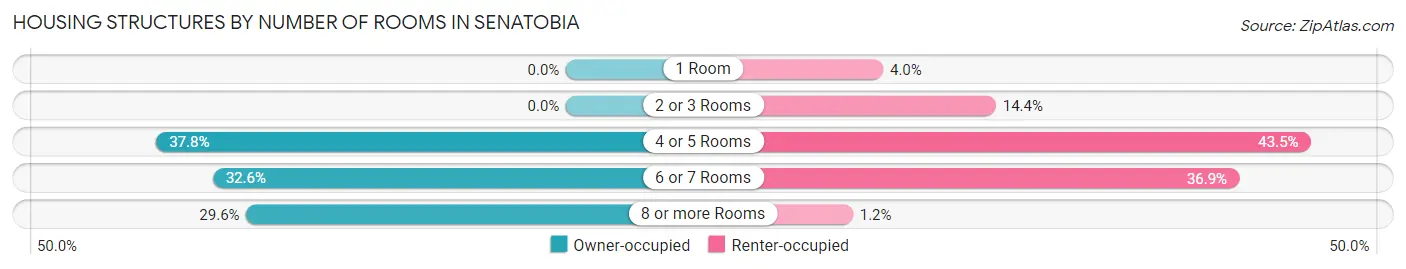
| Number of Rooms | Owner-occupied | Renter-occupied |
| 1 Room | 0 (0.0%) | 47 (4.0%) |
| 2 or 3 Rooms | 0 (0.0%) | 170 (14.4%) |
| 4 or 5 Rooms | 551 (37.8%) | 513 (43.5%) |
| 6 or 7 Rooms | 475 (32.6%) | 435 (36.9%) |
| 8 or more Rooms | 431 (29.6%) | 14 (1.2%) |
| Total | 1,457 (100.0%) | 1,179 (100.0%) |
Housing Structure by Heating Type in Senatobia
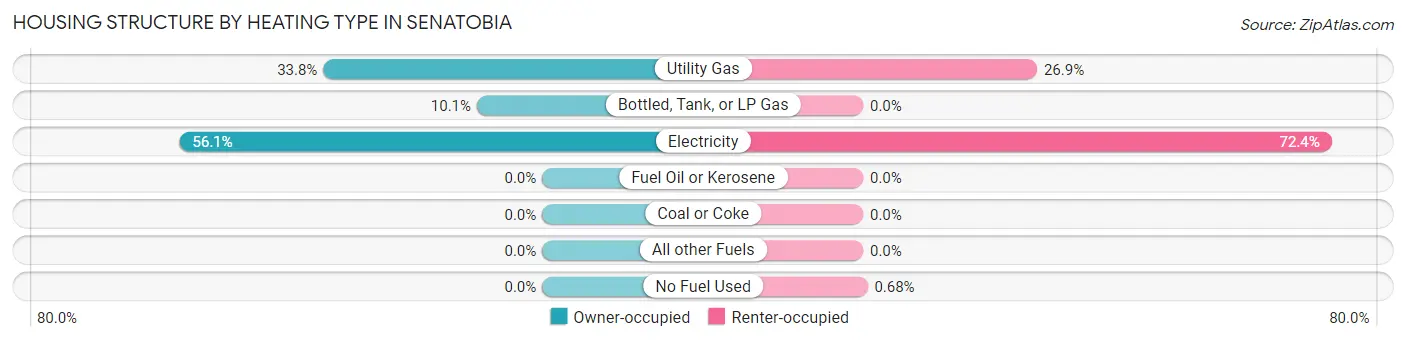
| Heating Type | Owner-occupied | Renter-occupied |
| Utility Gas | 493 (33.8%) | 317 (26.9%) |
| Bottled, Tank, or LP Gas | 147 (10.1%) | 0 (0.0%) |
| Electricity | 817 (56.1%) | 854 (72.4%) |
| Fuel Oil or Kerosene | 0 (0.0%) | 0 (0.0%) |
| Coal or Coke | 0 (0.0%) | 0 (0.0%) |
| All other Fuels | 0 (0.0%) | 0 (0.0%) |
| No Fuel Used | 0 (0.0%) | 8 (0.7%) |
| Total | 1,457 (100.0%) | 1,179 (100.0%) |
Household Vehicle Usage in Senatobia
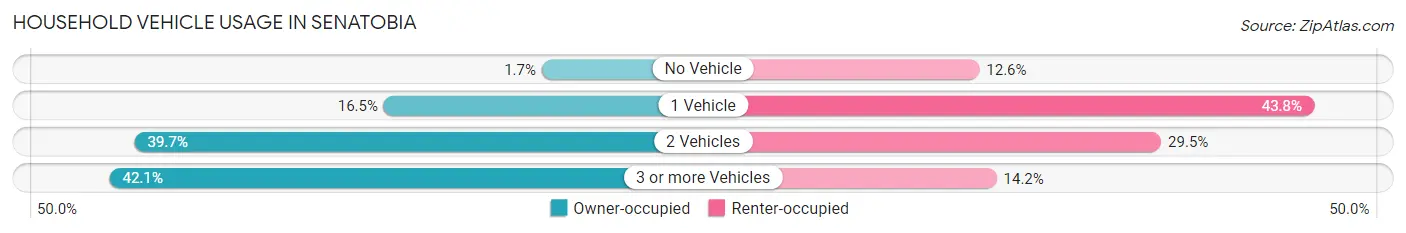
| Vehicles per Household | Owner-occupied | Renter-occupied |
| No Vehicle | 25 (1.7%) | 148 (12.6%) |
| 1 Vehicle | 240 (16.5%) | 516 (43.8%) |
| 2 Vehicles | 579 (39.7%) | 348 (29.5%) |
| 3 or more Vehicles | 613 (42.1%) | 167 (14.2%) |
| Total | 1,457 (100.0%) | 1,179 (100.0%) |
Real Estate & Mortgages in Senatobia
Real Estate and Mortgage Overview in Senatobia
| Characteristic | Without Mortgage | With Mortgage |
| Housing Units | 484 | 973 |
| Median Property Value | $195,100 | $171,000 |
| Median Household Income | $67,035 | $111 |
| Monthly Housing Costs | $468 | $0 |
| Real Estate Taxes | $1,624 | $120 |
Property Value by Mortgage Status in Senatobia
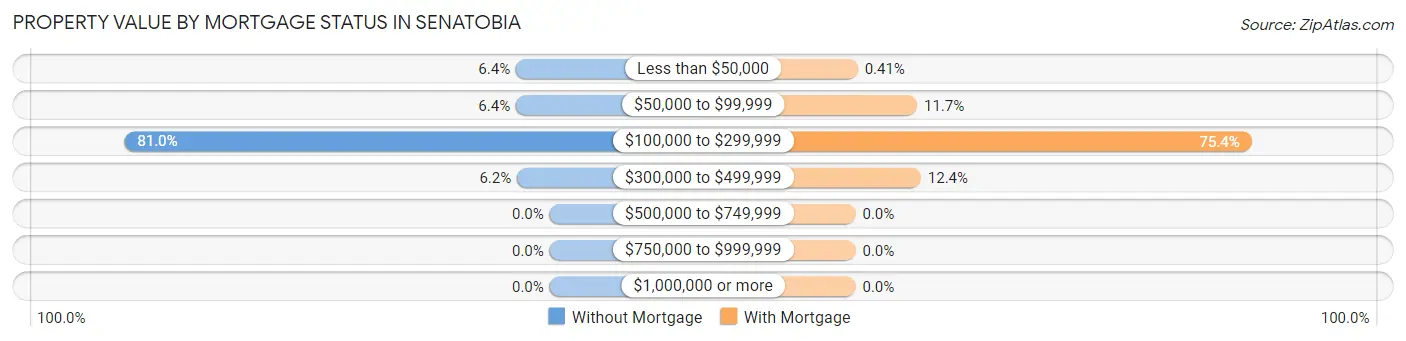
| Property Value | Without Mortgage | With Mortgage |
| Less than $50,000 | 31 (6.4%) | 4 (0.4%) |
| $50,000 to $99,999 | 31 (6.4%) | 114 (11.7%) |
| $100,000 to $299,999 | 392 (81.0%) | 734 (75.4%) |
| $300,000 to $499,999 | 30 (6.2%) | 121 (12.4%) |
| $500,000 to $749,999 | 0 (0.0%) | 0 (0.0%) |
| $750,000 to $999,999 | 0 (0.0%) | 0 (0.0%) |
| $1,000,000 or more | 0 (0.0%) | 0 (0.0%) |
| Total | 484 (100.0%) | 973 (100.0%) |
Household Income by Mortgage Status in Senatobia
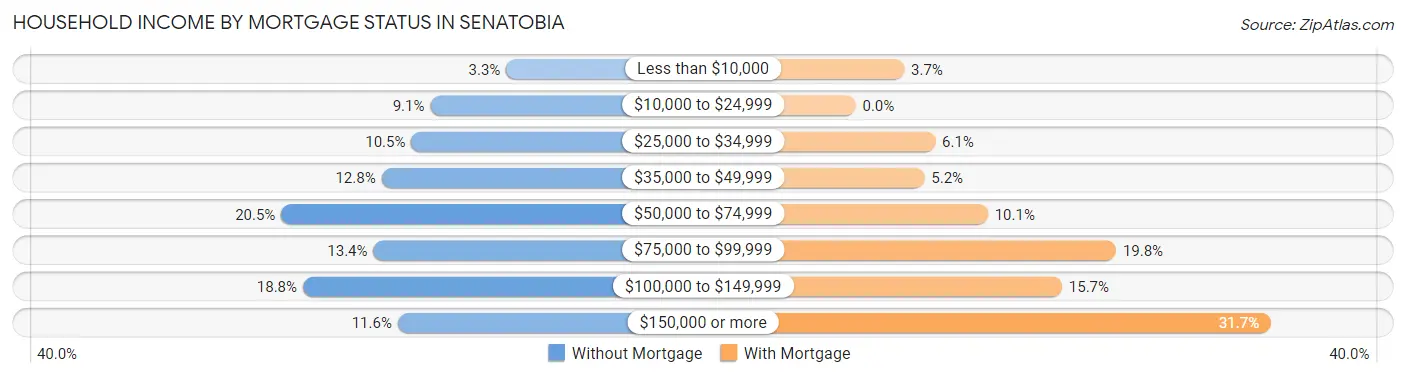
| Household Income | Without Mortgage | With Mortgage |
| Less than $10,000 | 16 (3.3%) | 36 (3.7%) |
| $10,000 to $24,999 | 44 (9.1%) | 0 (0.0%) |
| $25,000 to $34,999 | 51 (10.5%) | 59 (6.1%) |
| $35,000 to $49,999 | 62 (12.8%) | 51 (5.2%) |
| $50,000 to $74,999 | 99 (20.4%) | 98 (10.1%) |
| $75,000 to $99,999 | 65 (13.4%) | 193 (19.8%) |
| $100,000 to $149,999 | 91 (18.8%) | 153 (15.7%) |
| $150,000 or more | 56 (11.6%) | 308 (31.7%) |
| Total | 484 (100.0%) | 973 (100.0%) |
Property Value to Household Income Ratio in Senatobia
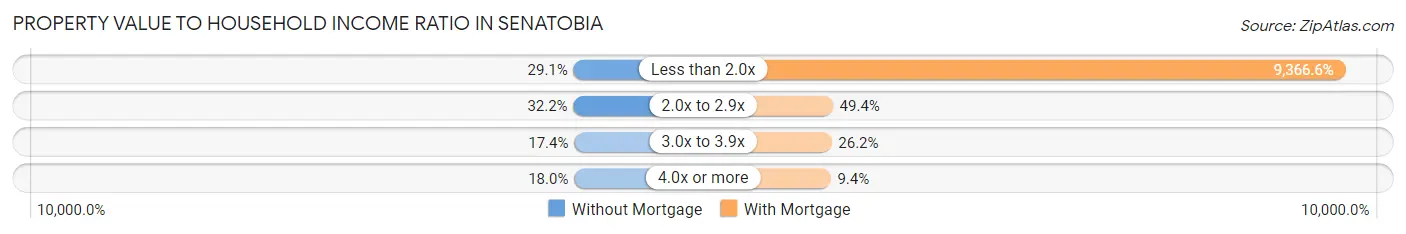
| Value-to-Income Ratio | Without Mortgage | With Mortgage |
| Less than 2.0x | 141 (29.1%) | 91,137 (9,366.6%) |
| 2.0x to 2.9x | 156 (32.2%) | 481 (49.4%) |
| 3.0x to 3.9x | 84 (17.4%) | 255 (26.2%) |
| 4.0x or more | 87 (18.0%) | 91 (9.3%) |
| Total | 484 (100.0%) | 973 (100.0%) |
Real Estate Taxes by Mortgage Status in Senatobia
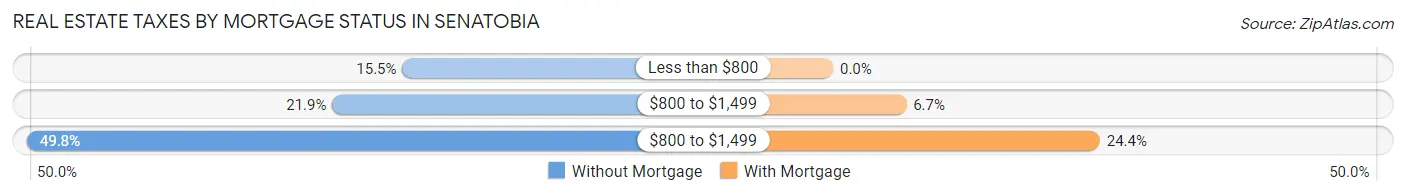
| Property Taxes | Without Mortgage | With Mortgage |
| Less than $800 | 75 (15.5%) | 0 (0.0%) |
| $800 to $1,499 | 106 (21.9%) | 65 (6.7%) |
| $800 to $1,499 | 241 (49.8%) | 237 (24.4%) |
| Total | 484 (100.0%) | 973 (100.0%) |
Health & Disability in Senatobia
Health Insurance Coverage by Age in Senatobia
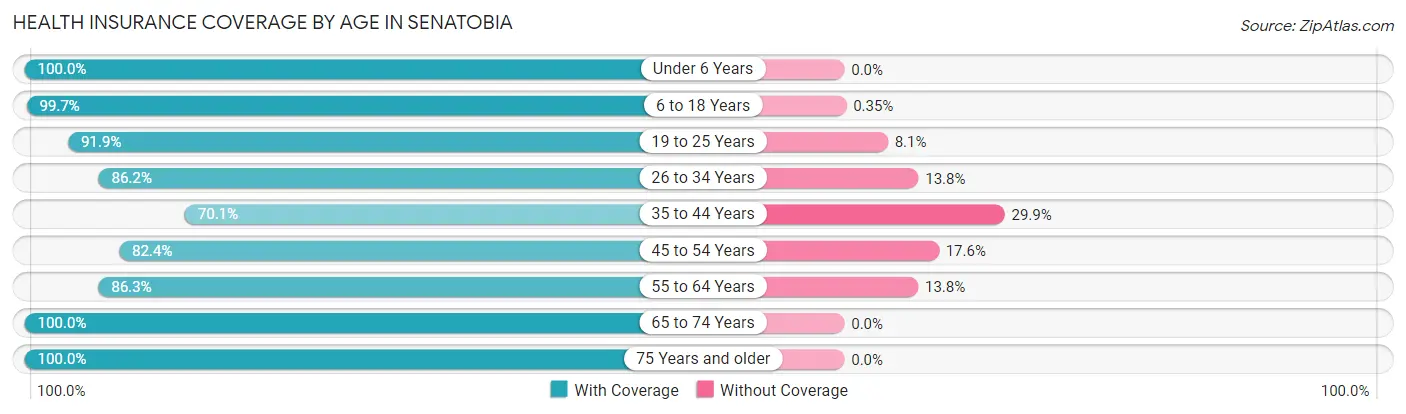
| Age Bracket | With Coverage | Without Coverage |
| Under 6 Years | 577 (100.0%) | 0 (0.0%) |
| 6 to 18 Years | 1,700 (99.7%) | 6 (0.4%) |
| 19 to 25 Years | 1,202 (91.9%) | 106 (8.1%) |
| 26 to 34 Years | 781 (86.2%) | 125 (13.8%) |
| 35 to 44 Years | 638 (70.1%) | 272 (29.9%) |
| 45 to 54 Years | 552 (82.4%) | 118 (17.6%) |
| 55 to 64 Years | 596 (86.3%) | 95 (13.8%) |
| 65 to 74 Years | 773 (100.0%) | 0 (0.0%) |
| 75 Years and older | 385 (100.0%) | 0 (0.0%) |
| Total | 7,204 (90.9%) | 722 (9.1%) |
Health Insurance Coverage by Citizenship Status in Senatobia

| Citizenship Status | With Coverage | Without Coverage |
| Native Born | 577 (100.0%) | 0 (0.0%) |
| Foreign Born, Citizen | 1,700 (99.7%) | 6 (0.4%) |
| Foreign Born, not a Citizen | 1,202 (91.9%) | 106 (8.1%) |
Health Insurance Coverage by Household Income in Senatobia
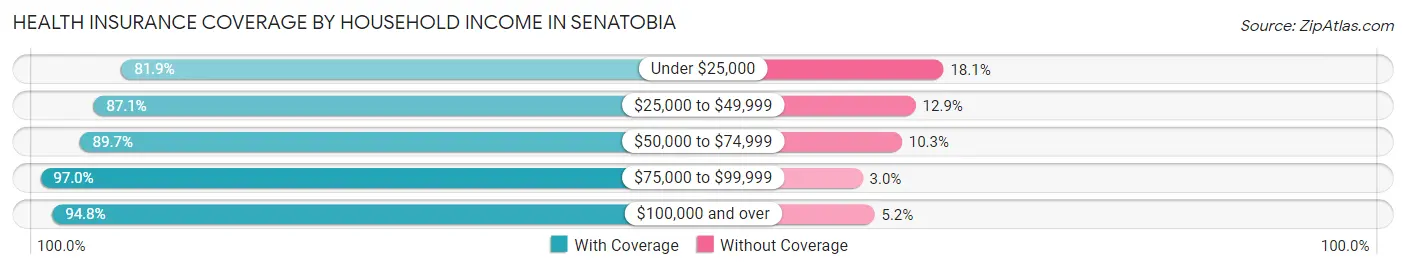
| Household Income | With Coverage | Without Coverage |
| Under $25,000 | 985 (81.9%) | 218 (18.1%) |
| $25,000 to $49,999 | 1,101 (87.1%) | 163 (12.9%) |
| $50,000 to $74,999 | 1,253 (89.7%) | 144 (10.3%) |
| $75,000 to $99,999 | 722 (97.0%) | 22 (3.0%) |
| $100,000 and over | 1,714 (94.8%) | 94 (5.2%) |
Public vs Private Health Insurance Coverage by Age in Senatobia
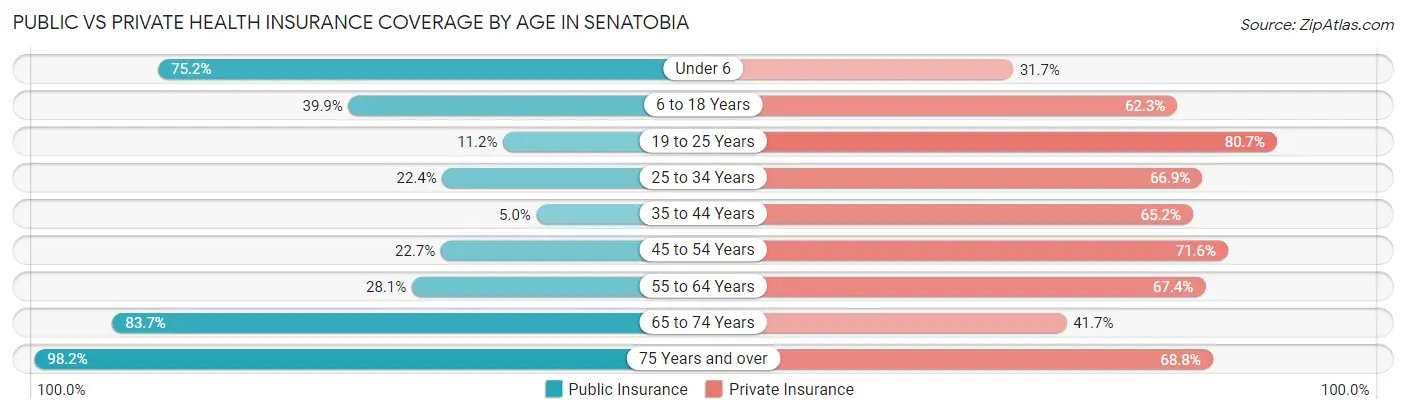
| Age Bracket | Public Insurance | Private Insurance |
| Under 6 | 434 (75.2%) | 183 (31.7%) |
| 6 to 18 Years | 680 (39.9%) | 1,062 (62.3%) |
| 19 to 25 Years | 146 (11.2%) | 1,056 (80.7%) |
| 25 to 34 Years | 203 (22.4%) | 606 (66.9%) |
| 35 to 44 Years | 45 (5.0%) | 593 (65.2%) |
| 45 to 54 Years | 152 (22.7%) | 480 (71.6%) |
| 55 to 64 Years | 194 (28.1%) | 466 (67.4%) |
| 65 to 74 Years | 647 (83.7%) | 322 (41.7%) |
| 75 Years and over | 378 (98.2%) | 265 (68.8%) |
| Total | 2,879 (36.3%) | 5,033 (63.5%) |
Disability Status by Sex by Age in Senatobia
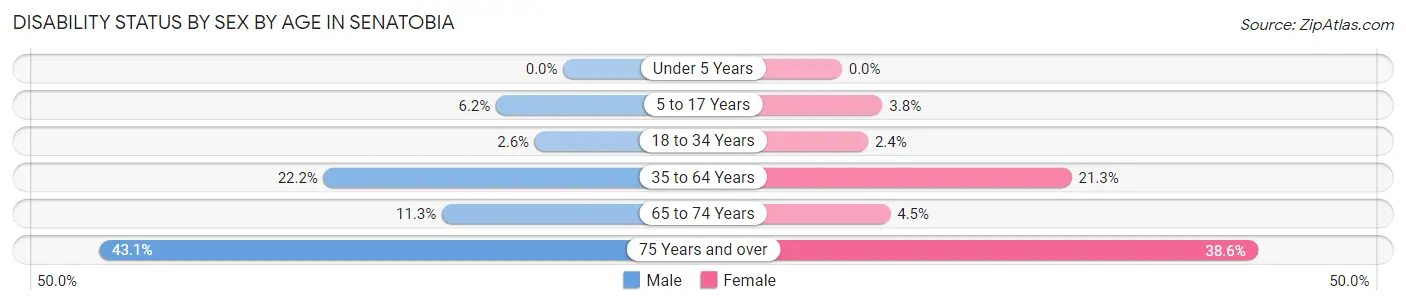
| Age Bracket | Male | Female |
| Under 5 Years | 0 (0.0%) | 0 (0.0%) |
| 5 to 17 Years | 49 (6.2%) | 18 (3.8%) |
| 18 to 34 Years | 37 (2.6%) | 33 (2.4%) |
| 35 to 64 Years | 238 (22.2%) | 256 (21.3%) |
| 65 to 74 Years | 27 (11.3%) | 24 (4.5%) |
| 75 Years and over | 81 (43.1%) | 76 (38.6%) |
Disability Class by Sex by Age in Senatobia
Disability Class: Hearing Difficulty
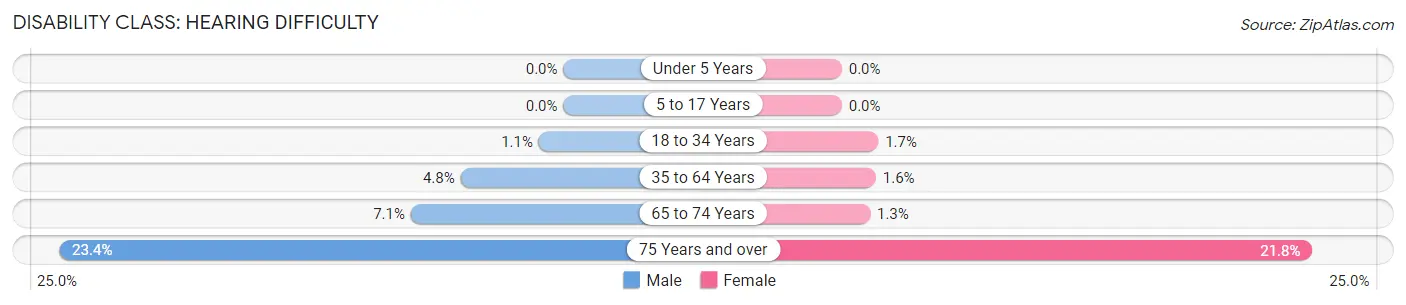
| Age Bracket | Male | Female |
| Under 5 Years | 0 (0.0%) | 0 (0.0%) |
| 5 to 17 Years | 0 (0.0%) | 0 (0.0%) |
| 18 to 34 Years | 16 (1.1%) | 23 (1.7%) |
| 35 to 64 Years | 51 (4.8%) | 19 (1.6%) |
| 65 to 74 Years | 17 (7.1%) | 7 (1.3%) |
| 75 Years and over | 44 (23.4%) | 43 (21.8%) |
Disability Class: Vision Difficulty
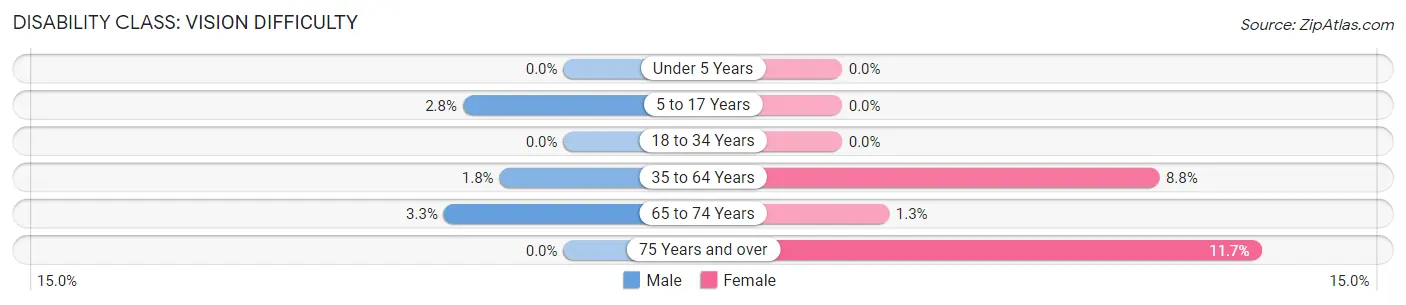
| Age Bracket | Male | Female |
| Under 5 Years | 0 (0.0%) | 0 (0.0%) |
| 5 to 17 Years | 22 (2.8%) | 0 (0.0%) |
| 18 to 34 Years | 0 (0.0%) | 0 (0.0%) |
| 35 to 64 Years | 19 (1.8%) | 106 (8.8%) |
| 65 to 74 Years | 8 (3.3%) | 7 (1.3%) |
| 75 Years and over | 0 (0.0%) | 23 (11.7%) |
Disability Class: Cognitive Difficulty
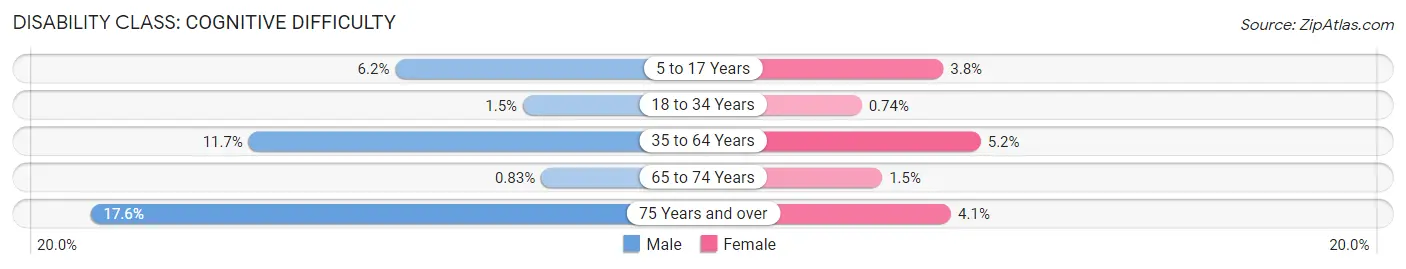
| Age Bracket | Male | Female |
| 5 to 17 Years | 49 (6.2%) | 18 (3.8%) |
| 18 to 34 Years | 21 (1.5%) | 10 (0.7%) |
| 35 to 64 Years | 125 (11.7%) | 62 (5.2%) |
| 65 to 74 Years | 2 (0.8%) | 8 (1.5%) |
| 75 Years and over | 33 (17.5%) | 8 (4.1%) |
Disability Class: Ambulatory Difficulty
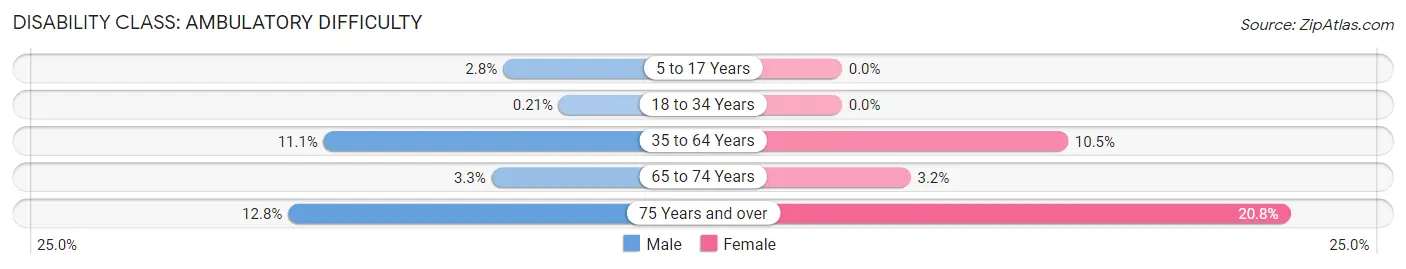
| Age Bracket | Male | Female |
| 5 to 17 Years | 22 (2.8%) | 0 (0.0%) |
| 18 to 34 Years | 3 (0.2%) | 0 (0.0%) |
| 35 to 64 Years | 119 (11.1%) | 126 (10.5%) |
| 65 to 74 Years | 8 (3.3%) | 17 (3.2%) |
| 75 Years and over | 24 (12.8%) | 41 (20.8%) |
Disability Class: Self-Care Difficulty
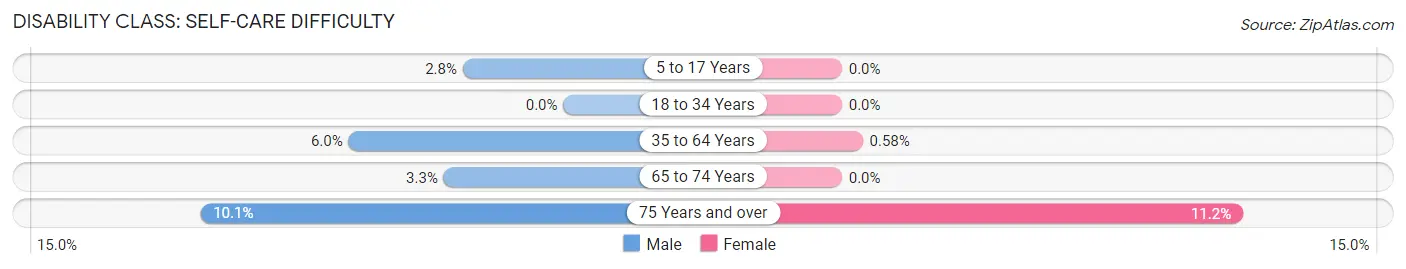
| Age Bracket | Male | Female |
| 5 to 17 Years | 22 (2.8%) | 0 (0.0%) |
| 18 to 34 Years | 0 (0.0%) | 0 (0.0%) |
| 35 to 64 Years | 64 (6.0%) | 7 (0.6%) |
| 65 to 74 Years | 8 (3.3%) | 0 (0.0%) |
| 75 Years and over | 19 (10.1%) | 22 (11.2%) |
Technology Access in Senatobia
Computing Device Access in Senatobia
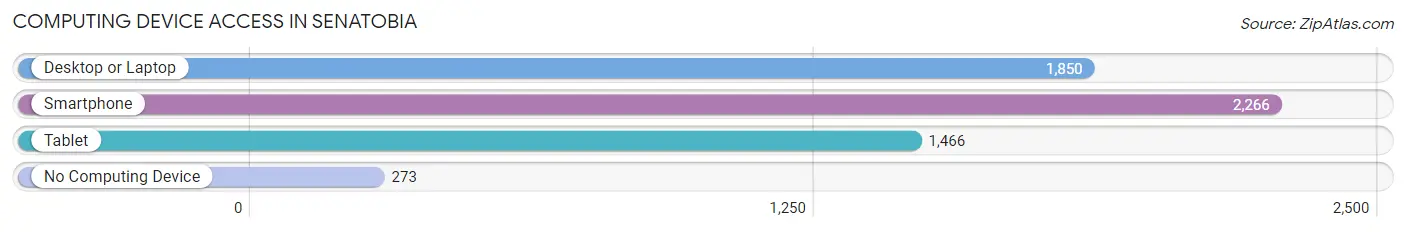
| Device Type | # Households | % Households |
| Desktop or Laptop | 1,850 | 70.2% |
| Smartphone | 2,266 | 86.0% |
| Tablet | 1,466 | 55.6% |
| No Computing Device | 273 | 10.4% |
| Total | 2,636 | 100.0% |
Internet Access in Senatobia
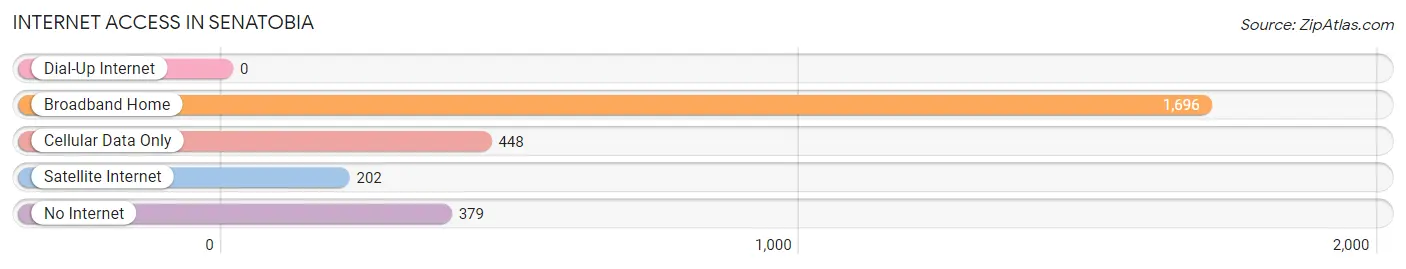
| Internet Type | # Households | % Households |
| Dial-Up Internet | 0 | 0.0% |
| Broadband Home | 1,696 | 64.3% |
| Cellular Data Only | 448 | 17.0% |
| Satellite Internet | 202 | 7.7% |
| No Internet | 379 | 14.4% |
| Total | 2,636 | 100.0% |
Senatobia Summary
Senatobia, Mississippi is a small city located in Tate County, Mississippi. It is the county seat of Tate County and is located approximately 50 miles south of Memphis, Tennessee. The city has a population of 8,165 as of the 2010 census.
History
The area that is now Senatobia was first settled in the early 1800s by settlers from the Chickasaw Nation. The city was originally known as “Horse Creek” and was later renamed “Senatobia” in honor of Chief Senatobia, a Chickasaw leader. The city was officially incorporated in 1848.
During the Civil War, Senatobia was the site of a major battle between Union and Confederate forces. The Battle of Senatobia was fought on April 17, 1864 and resulted in a Confederate victory.
In the late 19th century, Senatobia became an important railroad hub. The city was home to several cotton gins and sawmills, and the railroad allowed for the transportation of goods and services to and from the city.
Geography
Senatobia is located in the northwest corner of Tate County, Mississippi. It is situated at an elevation of approximately 300 feet above sea level. The city is located approximately 50 miles south of Memphis, Tennessee and is bordered by the towns of Coldwater, Como, and Sardis.
The city is located in the Mississippi Delta region and is part of the Yazoo-Mississippi Delta watershed. The city is located in a flat, low-lying area and is surrounded by farmland. The city is located near the Coldwater River, which flows through the city.
Economy
Senatobia’s economy is largely based on agriculture and manufacturing. The city is home to several large agricultural operations, including cotton, soybeans, corn, and wheat. The city is also home to several manufacturing companies, including furniture, automotive, and food processing.
The city is also home to several retail stores, restaurants, and other businesses. The city is home to a branch of Northwest Mississippi Community College, which offers a variety of educational programs.
Demographics
As of the 2010 census, Senatobia had a population of 8,165. The racial makeup of the city was 68.3% White, 28.3% African American, 0.3% Native American, 0.7% Asian, 0.1% Pacific Islander, 0.7% from other races, and 1.9% from two or more races. Hispanic or Latino of any race were 2.2% of the population.
The median income for a household in the city was $30,938, and the median income for a family was $37,917. The per capita income for the city was $15,945. About 19.2% of families and 22.7% of the population were below the poverty line, including 33.2% of those under age 18 and 16.2% of those age 65 or over.
Common Questions
What is Per Capita Income in Senatobia?
Per Capita income in Senatobia is $23,705.
What is the Median Family Income in Senatobia?
Median Family Income in Senatobia is $70,938.
What is the Median Household income in Senatobia?
Median Household Income in Senatobia is $56,780.
What is Income or Wage Gap in Senatobia?
Income or Wage Gap in Senatobia is 38.7%.
Women in Senatobia earn 61.3 cents for every dollar earned by a man.
What is Family Income Deficit in Senatobia?
Family Income Deficit in Senatobia is $8,323.
Families that are below poverty line in Senatobia earn $8,323 less on average than the poverty threshold level.
What is Inequality or Gini Index in Senatobia?
Inequality or Gini Index in Senatobia is 0.44.
What is the Total Population of Senatobia?
Total Population of Senatobia is 8,288.
What is the Total Male Population of Senatobia?
Total Male Population of Senatobia is 4,082.
What is the Total Female Population of Senatobia?
Total Female Population of Senatobia is 4,206.
What is the Ratio of Males per 100 Females in Senatobia?
There are 97.05 Males per 100 Females in Senatobia.
What is the Ratio of Females per 100 Males in Senatobia?
There are 103.04 Females per 100 Males in Senatobia.
What is the Median Population Age in Senatobia?
Median Population Age in Senatobia is 30.1 Years.
What is the Average Family Size in Senatobia
Average Family Size in Senatobia is 3.0 People.
What is the Average Household Size in Senatobia
Average Household Size in Senatobia is 2.4 People.
How Large is the Labor Force in Senatobia?
There are 3,878 People in the Labor Forcein in Senatobia.
What is the Percentage of People in the Labor Force in Senatobia?
57.6% of People are in the Labor Force in Senatobia.
What is the Unemployment Rate in Senatobia?
Unemployment Rate in Senatobia is 5.1%.