Tupelo, MS Map & Demographics
Tupelo Map

Tupelo Overview
$37,884
PER CAPITA INCOME
$86,732
AVG FAMILY INCOME
$62,686
AVG HOUSEHOLD INCOME
37.8%
WAGE / INCOME GAP [ % ]
62.2¢/ $1
WAGE / INCOME GAP [ $ ]
$8,468
FAMILY INCOME DEFICIT
0.50
INEQUALITY / GINI INDEX
37,939
TOTAL POPULATION
17,313
MALE POPULATION
20,626
FEMALE POPULATION
83.94
MALES / 100 FEMALES
119.14
FEMALES / 100 MALES
38.3
MEDIAN AGE
3.1
AVG FAMILY SIZE
2.4
AVG HOUSEHOLD SIZE
19,063
LABOR FORCE [ PEOPLE ]
64.0%
PERCENT IN LABOR FORCE
5.1%
UNEMPLOYMENT RATE
Tupelo Area Codes
Income in Tupelo
Income Overview in Tupelo
Per Capita Income in Tupelo is $37,884, while median incomes of families and households are $86,732 and $62,686 respectively.
| Characteristic | Number | Measure |
| Per Capita Income | 37,939 | $37,884 |
| Median Family Income | 9,882 | $86,732 |
| Mean Family Income | 9,882 | $115,366 |
| Median Household Income | 15,282 | $62,686 |
| Mean Household Income | 15,282 | $91,676 |
| Income Deficit | 9,882 | $8,468 |
| Wage / Income Gap (%) | 37,939 | 37.76% |
| Wage / Income Gap ($) | 37,939 | 62.24¢ per $1 |
| Gini / Inequality Index | 37,939 | 0.50 |
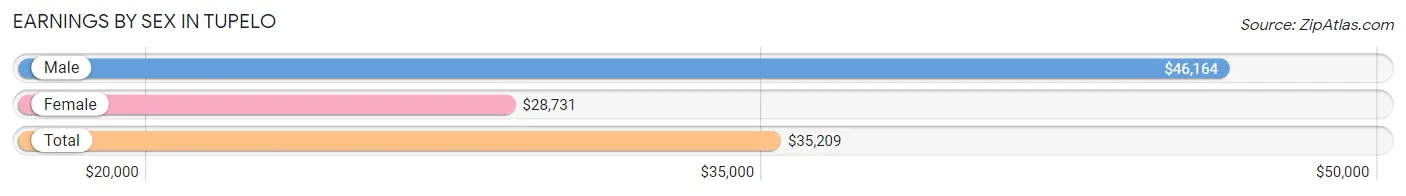
Earnings by Sex in Tupelo
Average Earnings in Tupelo are $35,209, $46,164 for men and $28,731 for women, a difference of 37.8%.
| Sex | Number | Average Earnings |
| Male | 9,612 (49.2%) | $46,164 |
| Female | 9,931 (50.8%) | $28,731 |
| Total | 19,543 (100.0%) | $35,209 |
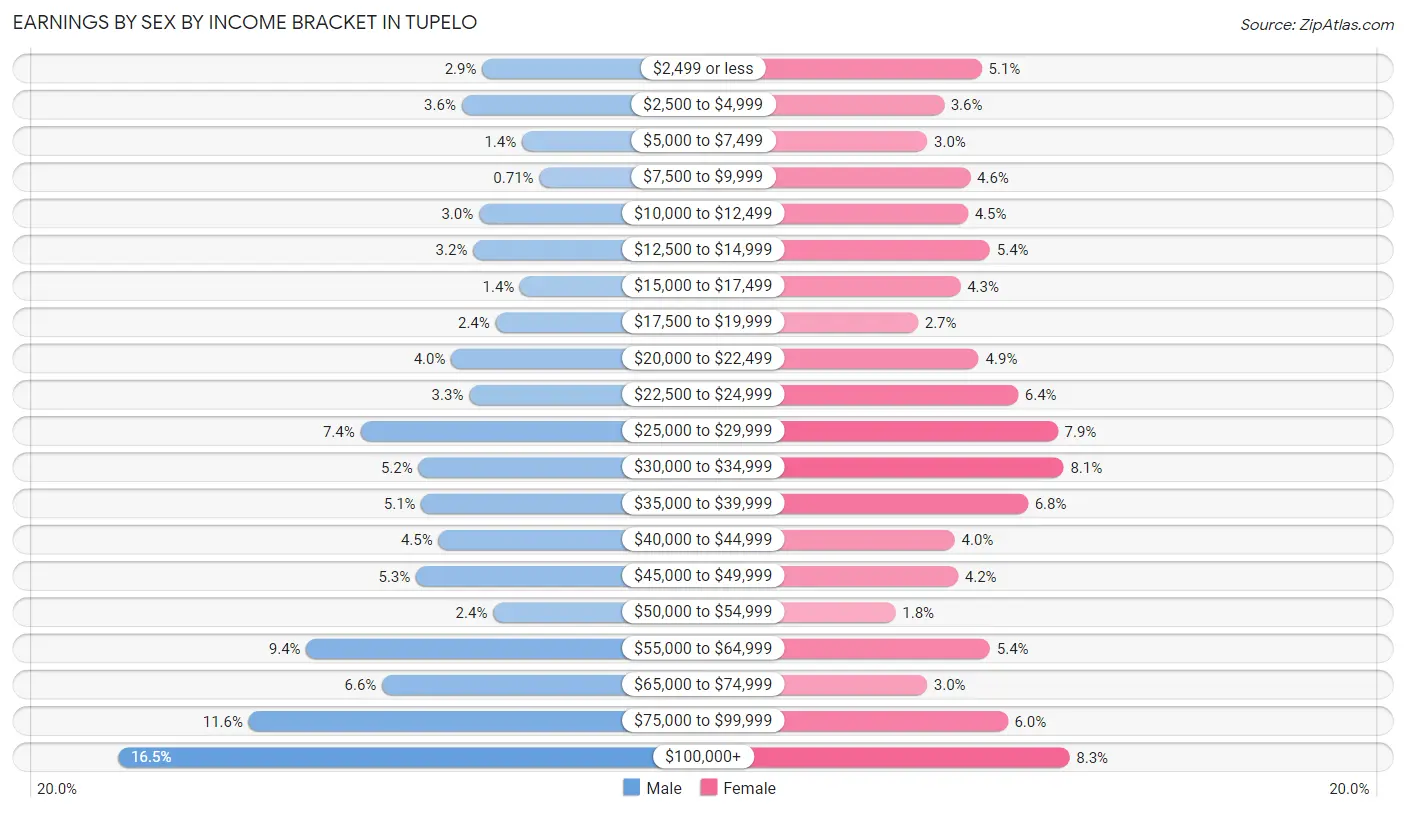
Earnings by Sex by Income Bracket in Tupelo
The most common earnings brackets in Tupelo are $100,000+ for men (1,586 | 16.5%) and $100,000+ for women (828 | 8.3%).
| Income | Male | Female |
| $2,499 or less | 274 (2.9%) | 502 (5.1%) |
| $2,500 to $4,999 | 348 (3.6%) | 360 (3.6%) |
| $5,000 to $7,499 | 131 (1.4%) | 299 (3.0%) |
| $7,500 to $9,999 | 68 (0.7%) | 459 (4.6%) |
| $10,000 to $12,499 | 285 (3.0%) | 450 (4.5%) |
| $12,500 to $14,999 | 307 (3.2%) | 532 (5.4%) |
| $15,000 to $17,499 | 137 (1.4%) | 422 (4.3%) |
| $17,500 to $19,999 | 226 (2.4%) | 264 (2.7%) |
| $20,000 to $22,499 | 385 (4.0%) | 491 (4.9%) |
| $22,500 to $24,999 | 321 (3.3%) | 637 (6.4%) |
| $25,000 to $29,999 | 712 (7.4%) | 785 (7.9%) |
| $30,000 to $34,999 | 504 (5.2%) | 806 (8.1%) |
| $35,000 to $39,999 | 493 (5.1%) | 673 (6.8%) |
| $40,000 to $44,999 | 432 (4.5%) | 401 (4.0%) |
| $45,000 to $49,999 | 512 (5.3%) | 413 (4.2%) |
| $50,000 to $54,999 | 235 (2.4%) | 181 (1.8%) |
| $55,000 to $64,999 | 907 (9.4%) | 532 (5.4%) |
| $65,000 to $74,999 | 634 (6.6%) | 298 (3.0%) |
| $75,000 to $99,999 | 1,115 (11.6%) | 598 (6.0%) |
| $100,000+ | 1,586 (16.5%) | 828 (8.3%) |
| Total | 9,612 (100.0%) | 9,931 (100.0%) |
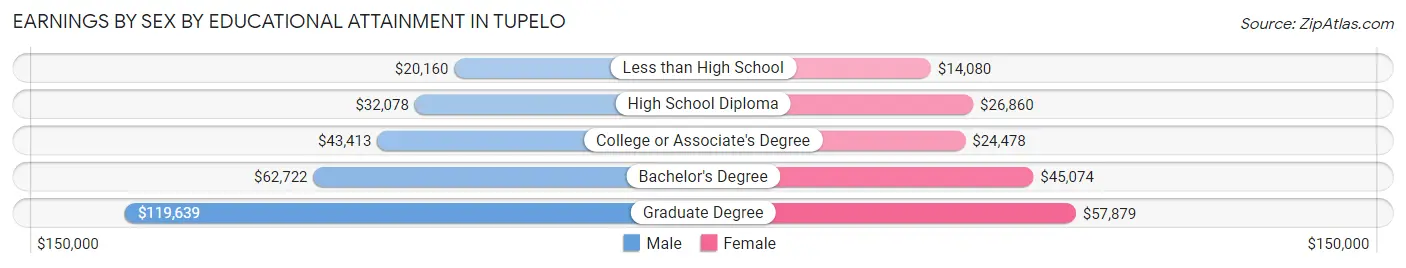
Earnings by Sex by Educational Attainment in Tupelo
Average earnings in Tupelo are $52,661 for men and $32,569 for women, a difference of 38.2%. Men with an educational attainment of graduate degree enjoy the highest average annual earnings of $119,639, while those with less than high school education earn the least with $20,160. Women with an educational attainment of graduate degree earn the most with the average annual earnings of $57,879, while those with less than high school education have the smallest earnings of $14,080.
| Educational Attainment | Male Income | Female Income |
| Less than High School | $20,160 | $14,080 |
| High School Diploma | $32,078 | $26,860 |
| College or Associate's Degree | $43,413 | $24,478 |
| Bachelor's Degree | $62,722 | $45,074 |
| Graduate Degree | $119,639 | $57,879 |
| Total | $52,661 | $32,569 |
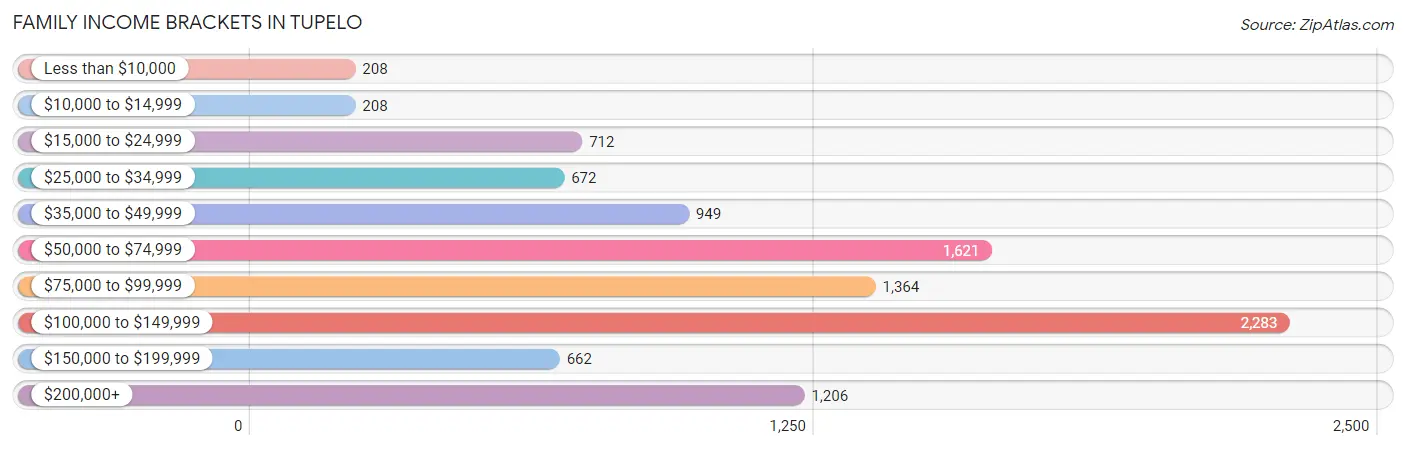
Family Income in Tupelo
Family Income Brackets in Tupelo
According to the Tupelo family income data, there are 2,283 families falling into the $100,000 to $149,999 income range, which is the most common income bracket and makes up 23.1% of all families. Conversely, the less than $10,000 income bracket is the least frequent group with only 208 families (2.1%) belonging to this category.
| Income Bracket | # Families | % Families |
| Less than $10,000 | 208 | 2.1% |
| $10,000 to $14,999 | 208 | 2.1% |
| $15,000 to $24,999 | 712 | 7.2% |
| $25,000 to $34,999 | 672 | 6.8% |
| $35,000 to $49,999 | 949 | 9.6% |
| $50,000 to $74,999 | 1,621 | 16.4% |
| $75,000 to $99,999 | 1,364 | 13.8% |
| $100,000 to $149,999 | 2,283 | 23.1% |
| $150,000 to $199,999 | 662 | 6.7% |
| $200,000+ | 1,206 | 12.2% |
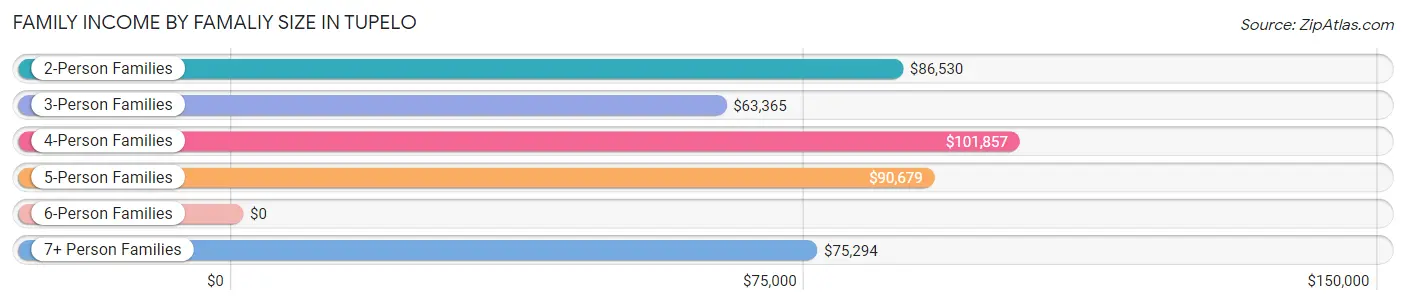
Family Income by Famaliy Size in Tupelo
4-person families (1,718 | 17.4%) account for the highest median family income in Tupelo with $101,857 per family, while 2-person families (4,939 | 50.0%) have the highest median income of $43,265 per family member.
| Income Bracket | # Families | Median Income |
| 2-Person Families | 4,939 (50.0%) | $86,530 |
| 3-Person Families | 2,221 (22.5%) | $63,365 |
| 4-Person Families | 1,718 (17.4%) | $101,857 |
| 5-Person Families | 689 (7.0%) | $90,679 |
| 6-Person Families | 277 (2.8%) | $0 |
| 7+ Person Families | 38 (0.4%) | $75,294 |
| Total | 9,882 (100.0%) | $86,732 |
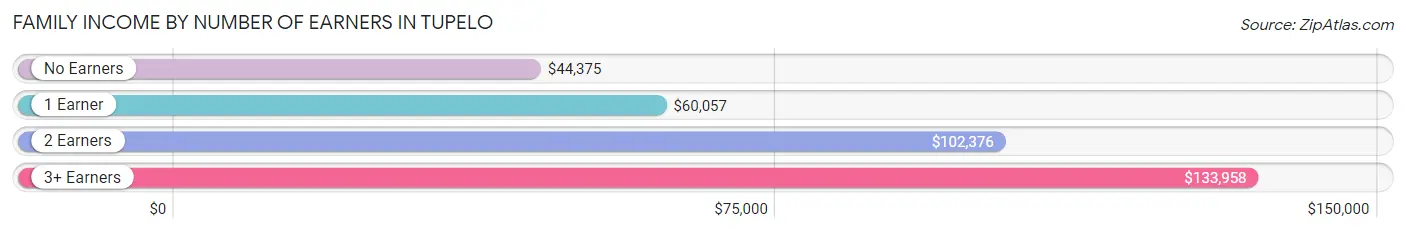
Family Income by Number of Earners in Tupelo
The median family income in Tupelo is $86,732, with families comprising 3+ earners (558) having the highest median family income of $133,958, while families with no earners (1,274) have the lowest median family income of $44,375, accounting for 5.7% and 12.9% of families, respectively.
| Number of Earners | # Families | Median Income |
| No Earners | 1,274 (12.9%) | $44,375 |
| 1 Earner | 3,265 (33.0%) | $60,057 |
| 2 Earners | 4,785 (48.4%) | $102,376 |
| 3+ Earners | 558 (5.7%) | $133,958 |
| Total | 9,882 (100.0%) | $86,732 |
Household Income in Tupelo
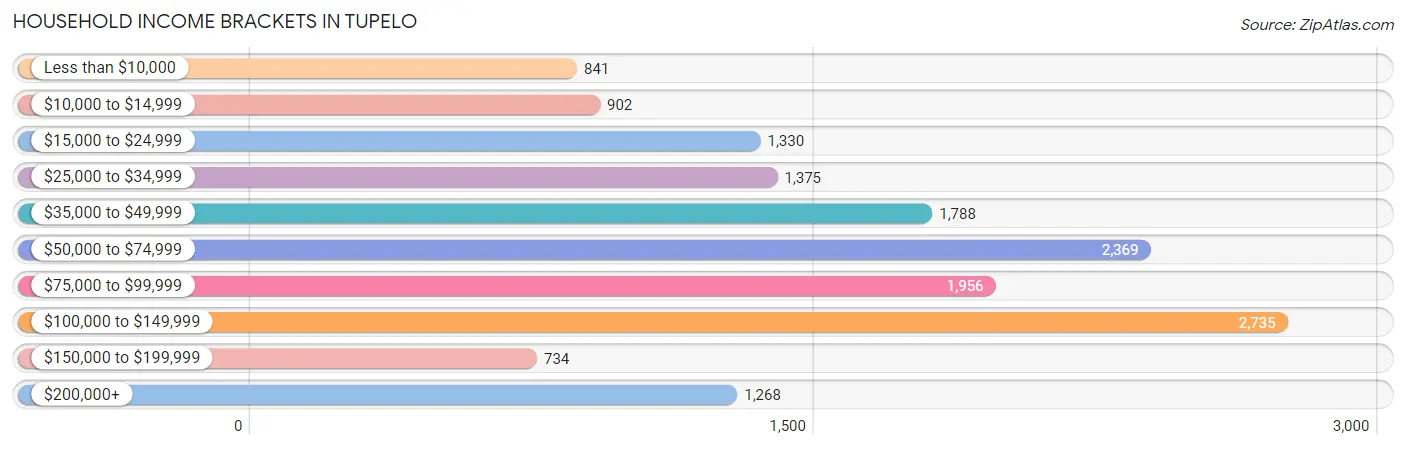
Household Income Brackets in Tupelo
With 2,735 households falling in the category, the $100,000 to $149,999 income range is the most frequent in Tupelo, accounting for 17.9% of all households. In contrast, only 734 households (4.8%) fall into the $150,000 to $199,999 income bracket, making it the least populous group.
| Income Bracket | # Households | % Households |
| Less than $10,000 | 841 | 5.5% |
| $10,000 to $14,999 | 902 | 5.9% |
| $15,000 to $24,999 | 1,330 | 8.7% |
| $25,000 to $34,999 | 1,375 | 9.0% |
| $35,000 to $49,999 | 1,788 | 11.7% |
| $50,000 to $74,999 | 2,369 | 15.5% |
| $75,000 to $99,999 | 1,956 | 12.8% |
| $100,000 to $149,999 | 2,735 | 17.9% |
| $150,000 to $199,999 | 734 | 4.8% |
| $200,000+ | 1,268 | 8.3% |
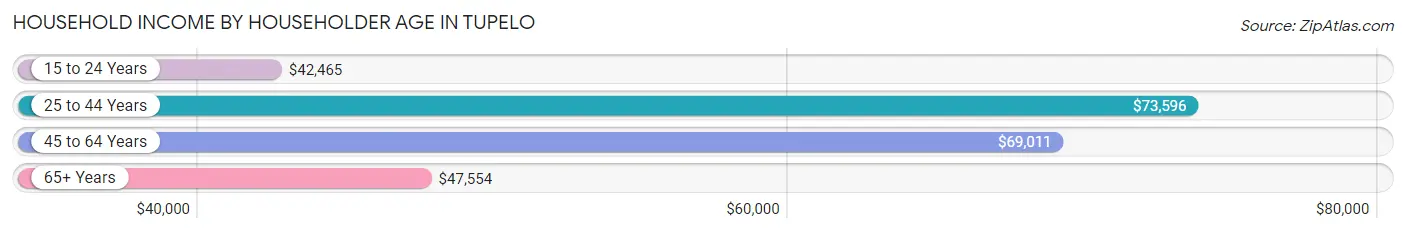
Household Income by Householder Age in Tupelo
The median household income in Tupelo is $62,686, with the highest median household income of $73,596 found in the 25 to 44 years age bracket for the primary householder. A total of 5,353 households (35.0%) fall into this category. Meanwhile, the 15 to 24 years age bracket for the primary householder has the lowest median household income of $42,465, with 503 households (3.3%) in this group.
| Income Bracket | # Households | Median Income |
| 15 to 24 Years | 503 (3.3%) | $42,465 |
| 25 to 44 Years | 5,353 (35.0%) | $73,596 |
| 45 to 64 Years | 5,811 (38.0%) | $69,011 |
| 65+ Years | 3,615 (23.7%) | $47,554 |
| Total | 15,282 (100.0%) | $62,686 |
Poverty in Tupelo
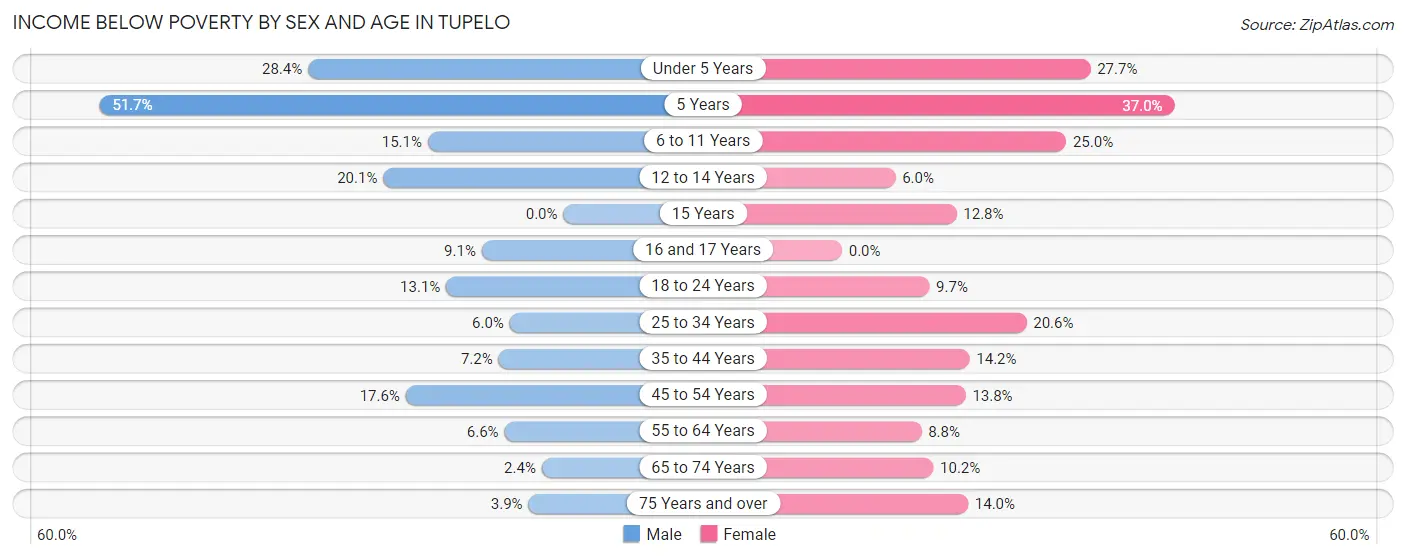
Income Below Poverty by Sex and Age in Tupelo
With 11.8% poverty level for males and 15.0% for females among the residents of Tupelo, 5 year old males and 5 year old females are the most vulnerable to poverty, with 185 males (51.7%) and 80 females (37.0%) in their respective age groups living below the poverty level.
| Age Bracket | Male | Female |
| Under 5 Years | 317 (28.4%) | 376 (27.7%) |
| 5 Years | 185 (51.7%) | 80 (37.0%) |
| 6 to 11 Years | 227 (15.1%) | 445 (25.0%) |
| 12 to 14 Years | 128 (20.1%) | 39 (5.9%) |
| 15 Years | 0 (0.0%) | 31 (12.8%) |
| 16 and 17 Years | 50 (9.1%) | 0 (0.0%) |
| 18 to 24 Years | 165 (13.1%) | 174 (9.7%) |
| 25 to 34 Years | 141 (6.0%) | 539 (20.5%) |
| 35 to 44 Years | 172 (7.2%) | 380 (14.2%) |
| 45 to 54 Years | 395 (17.6%) | 339 (13.8%) |
| 55 to 64 Years | 122 (6.6%) | 229 (8.8%) |
| 65 to 74 Years | 32 (2.4%) | 168 (10.2%) |
| 75 Years and over | 40 (3.9%) | 230 (14.0%) |
| Total | 1,974 (11.8%) | 3,030 (15.0%) |
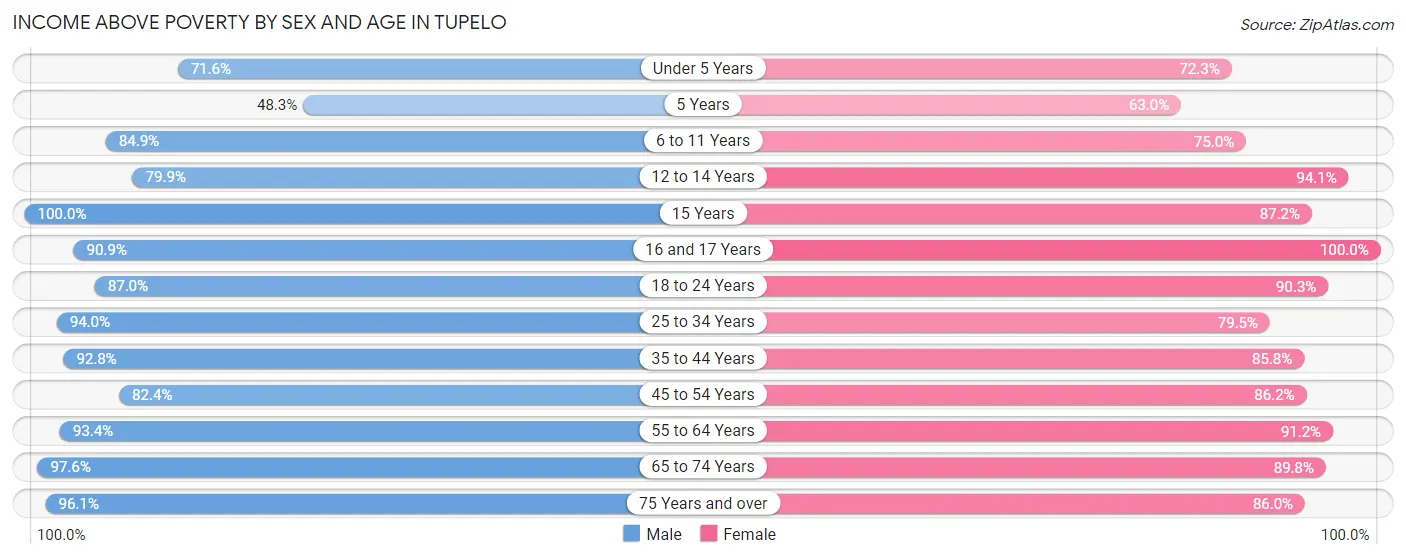
Income Above Poverty by Sex and Age in Tupelo
According to the poverty statistics in Tupelo, males aged 15 years and females aged 16 and 17 years are the age groups that are most secure financially, with 100.0% of males and 100.0% of females in these age groups living above the poverty line.
| Age Bracket | Male | Female |
| Under 5 Years | 798 (71.6%) | 983 (72.3%) |
| 5 Years | 173 (48.3%) | 136 (63.0%) |
| 6 to 11 Years | 1,276 (84.9%) | 1,337 (75.0%) |
| 12 to 14 Years | 510 (79.9%) | 617 (94.1%) |
| 15 Years | 124 (100.0%) | 212 (87.2%) |
| 16 and 17 Years | 500 (90.9%) | 553 (100.0%) |
| 18 to 24 Years | 1,099 (87.0%) | 1,614 (90.3%) |
| 25 to 34 Years | 2,218 (94.0%) | 2,084 (79.4%) |
| 35 to 44 Years | 2,209 (92.8%) | 2,295 (85.8%) |
| 45 to 54 Years | 1,854 (82.4%) | 2,123 (86.2%) |
| 55 to 64 Years | 1,739 (93.4%) | 2,362 (91.2%) |
| 65 to 74 Years | 1,298 (97.6%) | 1,484 (89.8%) |
| 75 Years and over | 987 (96.1%) | 1,408 (86.0%) |
| Total | 14,785 (88.2%) | 17,208 (85.0%) |
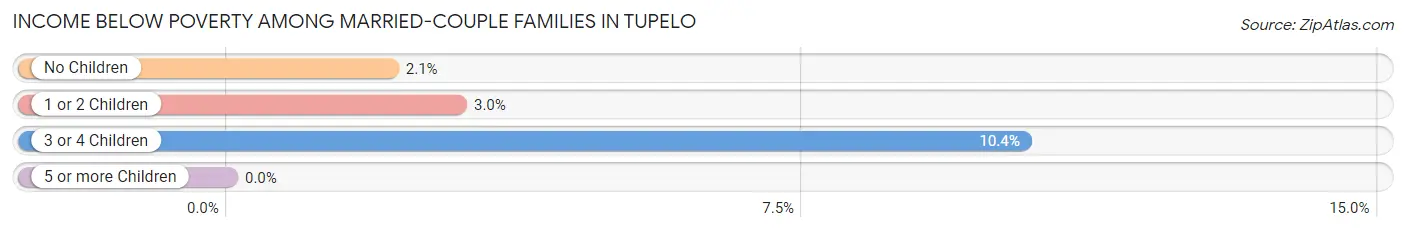
Income Below Poverty Among Married-Couple Families in Tupelo
The poverty statistics for married-couple families in Tupelo show that 3.0% or 209 of the total 6,951 families live below the poverty line. Families with 3 or 4 children have the highest poverty rate of 10.4%, comprising of 54 families. On the other hand, families with 5 or more children have the lowest poverty rate of 0.0%, which includes 0 families.
| Children | Above Poverty | Below Poverty |
| No Children | 4,019 (97.9%) | 86 (2.1%) |
| 1 or 2 Children | 2,242 (97.0%) | 69 (3.0%) |
| 3 or 4 Children | 467 (89.6%) | 54 (10.4%) |
| 5 or more Children | 14 (100.0%) | 0 (0.0%) |
| Total | 6,742 (97.0%) | 209 (3.0%) |
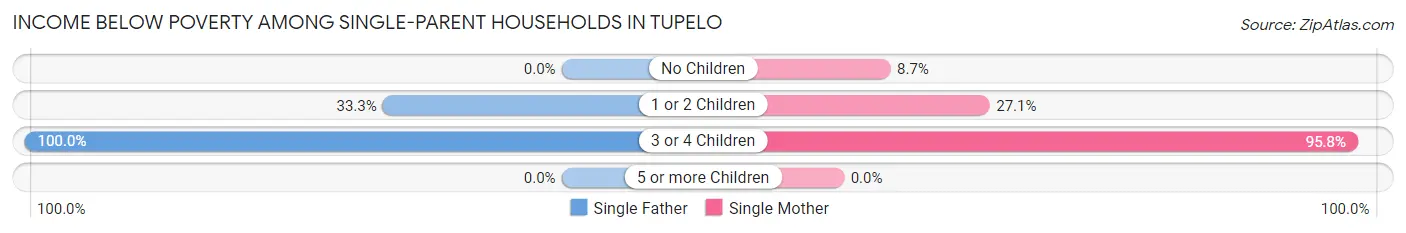
Income Below Poverty Among Single-Parent Households in Tupelo
According to the poverty data in Tupelo, 19.0% or 104 single-father households and 26.9% or 640 single-mother households are living below the poverty line. Among single-father households, those with 3 or 4 children have the highest poverty rate, with 10 households (100.0%) experiencing poverty. Likewise, among single-mother households, those with 3 or 4 children have the highest poverty rate, with 203 households (95.8%) falling below the poverty line.
| Children | Single Father | Single Mother |
| No Children | 0 (0.0%) | 69 (8.6%) |
| 1 or 2 Children | 94 (33.3%) | 368 (27.1%) |
| 3 or 4 Children | 10 (100.0%) | 203 (95.8%) |
| 5 or more Children | 0 (0.0%) | 0 (0.0%) |
| Total | 104 (19.0%) | 640 (26.9%) |
Income Below Poverty Among Married-Couple vs Single-Parent Households in Tupelo
The poverty data for Tupelo shows that 209 of the married-couple family households (3.0%) and 744 of the single-parent households (25.4%) are living below the poverty level. Within the married-couple family households, those with 3 or 4 children have the highest poverty rate, with 54 households (10.4%) falling below the poverty line. Among the single-parent households, those with 3 or 4 children have the highest poverty rate, with 213 household (96.0%) living below poverty.
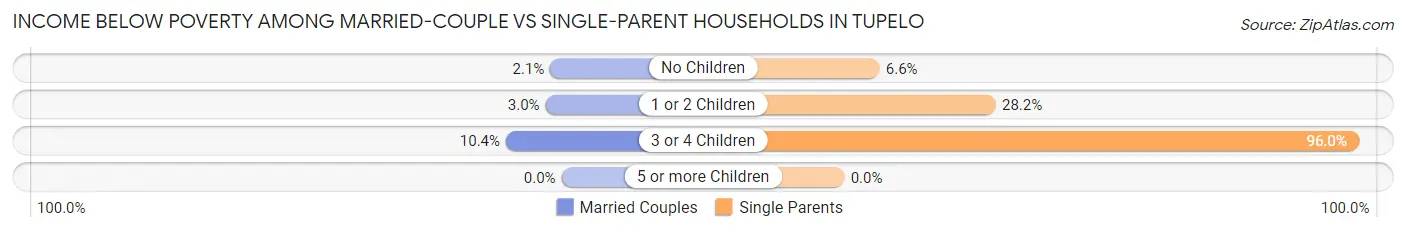
| Children | Married-Couple Families | Single-Parent Households |
| No Children | 86 (2.1%) | 69 (6.6%) |
| 1 or 2 Children | 69 (3.0%) | 462 (28.2%) |
| 3 or 4 Children | 54 (10.4%) | 213 (96.0%) |
| 5 or more Children | 0 (0.0%) | 0 (0.0%) |
| Total | 209 (3.0%) | 744 (25.4%) |
Race in Tupelo
The most populous races in Tupelo are White / Caucasian (20,868 | 55.0%), Black / African American (14,608 | 38.5%), and Hispanic or Latino (1,270 | 3.4%).
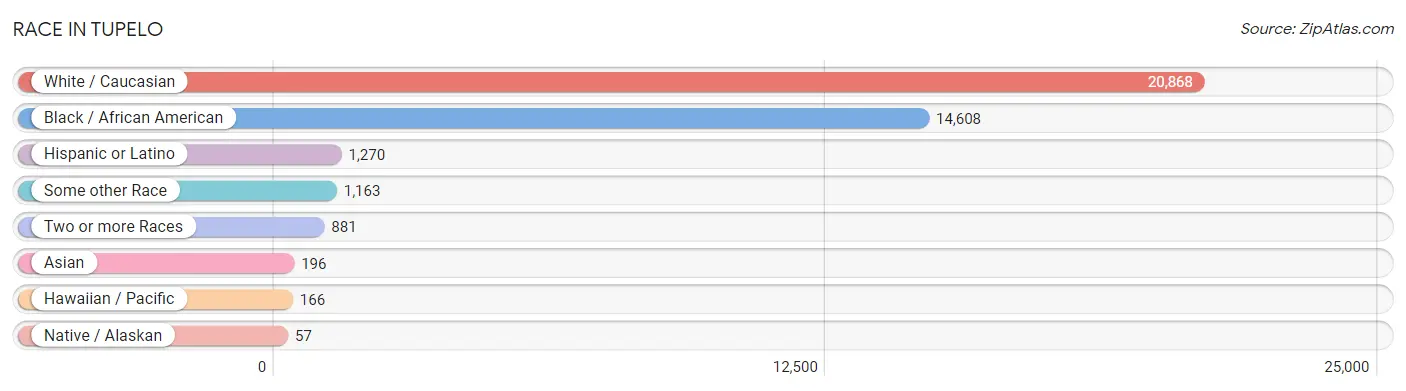
| Race | # Population | % Population |
| Asian | 196 | 0.5% |
| Black / African American | 14,608 | 38.5% |
| Hawaiian / Pacific | 166 | 0.4% |
| Hispanic or Latino | 1,270 | 3.4% |
| Native / Alaskan | 57 | 0.2% |
| White / Caucasian | 20,868 | 55.0% |
| Two or more Races | 881 | 2.3% |
| Some other Race | 1,163 | 3.1% |
| Total | 37,939 | 100.0% |
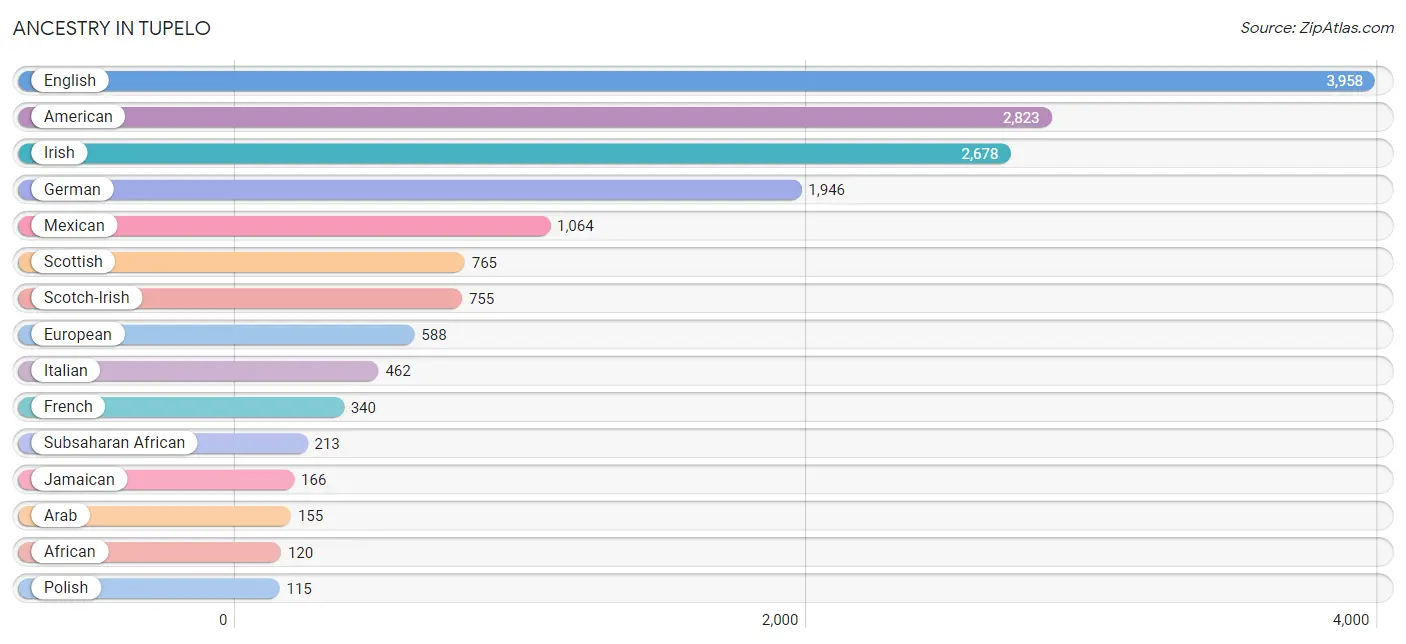
Ancestry in Tupelo
The most populous ancestries reported in Tupelo are English (3,958 | 10.4%), American (2,823 | 7.4%), Irish (2,678 | 7.1%), German (1,946 | 5.1%), and Mexican (1,064 | 2.8%), together accounting for 32.9% of all Tupelo residents.
| Ancestry | # Population | % Population |
| African | 120 | 0.3% |
| American | 2,823 | 7.4% |
| Arab | 155 | 0.4% |
| British | 99 | 0.3% |
| Burmese | 6 | 0.0% |
| Central American | 104 | 0.3% |
| Cherokee | 5 | 0.0% |
| Chickasaw | 54 | 0.1% |
| Choctaw | 17 | 0.0% |
| Creek | 8 | 0.0% |
| Cuban | 39 | 0.1% |
| Danish | 13 | 0.0% |
| Dutch | 66 | 0.2% |
| Eastern European | 9 | 0.0% |
| English | 3,958 | 10.4% |
| European | 588 | 1.5% |
| French | 340 | 0.9% |
| French American Indian | 4 | 0.0% |
| French Canadian | 25 | 0.1% |
| German | 1,946 | 5.1% |
| Greek | 25 | 0.1% |
| Guatemalan | 98 | 0.3% |
| Honduran | 6 | 0.0% |
| Houma | 22 | 0.1% |
| Hungarian | 10 | 0.0% |
| Indian (Asian) | 2 | 0.0% |
| Irish | 2,678 | 7.1% |
| Italian | 462 | 1.2% |
| Jamaican | 166 | 0.4% |
| Jordanian | 31 | 0.1% |
| Korean | 15 | 0.0% |
| Mexican | 1,064 | 2.8% |
| Native Hawaiian | 2 | 0.0% |
| Nigerian | 93 | 0.3% |
| Northern European | 31 | 0.1% |
| Pakistani | 101 | 0.3% |
| Pennsylvania German | 24 | 0.1% |
| Polish | 115 | 0.3% |
| Puerto Rican | 6 | 0.0% |
| Russian | 29 | 0.1% |
| Samoan | 2 | 0.0% |
| Scandinavian | 70 | 0.2% |
| Scotch-Irish | 755 | 2.0% |
| Scottish | 765 | 2.0% |
| Spaniard | 17 | 0.0% |
| Spanish | 30 | 0.1% |
| Sri Lankan | 2 | 0.0% |
| Subsaharan African | 213 | 0.6% |
| Swedish | 26 | 0.1% |
| Swiss | 11 | 0.0% |
| Thai | 51 | 0.1% |
| Welsh | 92 | 0.2% | View All 52 Rows |
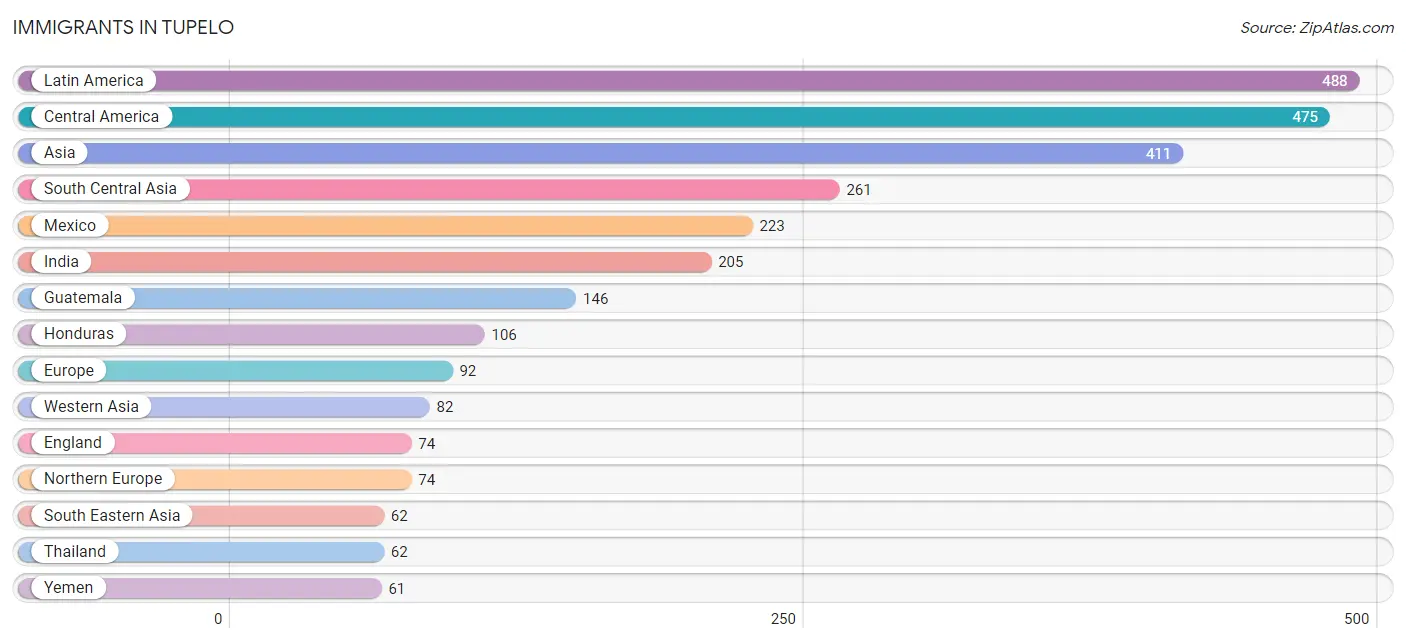
Immigrants in Tupelo
The most numerous immigrant groups reported in Tupelo came from Latin America (488 | 1.3%), Central America (475 | 1.3%), Asia (411 | 1.1%), South Central Asia (261 | 0.7%), and Mexico (223 | 0.6%), together accounting for 4.9% of all Tupelo residents.
| Immigration Origin | # Population | % Population |
| Africa | 42 | 0.1% |
| Argentina | 8 | 0.0% |
| Asia | 411 | 1.1% |
| Australia | 9 | 0.0% |
| Central America | 475 | 1.3% |
| Colombia | 5 | 0.0% |
| Congo | 19 | 0.1% |
| Eastern Asia | 6 | 0.0% |
| England | 74 | 0.2% |
| Europe | 92 | 0.2% |
| Germany | 18 | 0.1% |
| Guatemala | 146 | 0.4% |
| Honduras | 106 | 0.3% |
| India | 205 | 0.5% |
| Jordan | 21 | 0.1% |
| Korea | 6 | 0.0% |
| Latin America | 488 | 1.3% |
| Mexico | 223 | 0.6% |
| Middle Africa | 19 | 0.1% |
| Northern Europe | 74 | 0.2% |
| Oceania | 9 | 0.0% |
| Pakistan | 56 | 0.2% |
| Senegal | 23 | 0.1% |
| South America | 13 | 0.0% |
| South Central Asia | 261 | 0.7% |
| South Eastern Asia | 62 | 0.2% |
| Thailand | 62 | 0.2% |
| Western Africa | 23 | 0.1% |
| Western Asia | 82 | 0.2% |
| Western Europe | 18 | 0.1% |
| Yemen | 61 | 0.2% | View All 31 Rows |
Sex and Age in Tupelo
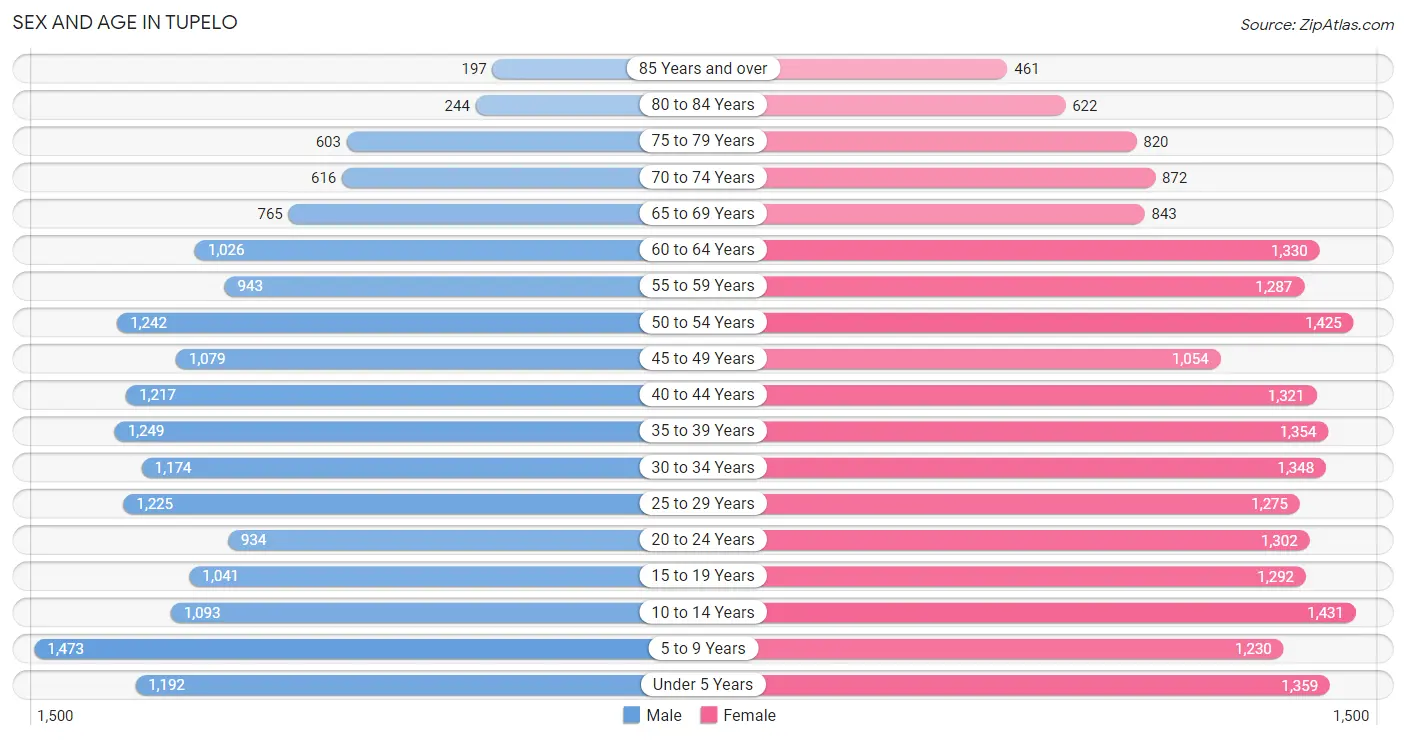
Sex and Age in Tupelo
The most populous age groups in Tupelo are 5 to 9 Years (1,473 | 8.5%) for men and 10 to 14 Years (1,431 | 6.9%) for women.
| Age Bracket | Male | Female |
| Under 5 Years | 1,192 (6.9%) | 1,359 (6.6%) |
| 5 to 9 Years | 1,473 (8.5%) | 1,230 (6.0%) |
| 10 to 14 Years | 1,093 (6.3%) | 1,431 (6.9%) |
| 15 to 19 Years | 1,041 (6.0%) | 1,292 (6.3%) |
| 20 to 24 Years | 934 (5.4%) | 1,302 (6.3%) |
| 25 to 29 Years | 1,225 (7.1%) | 1,275 (6.2%) |
| 30 to 34 Years | 1,174 (6.8%) | 1,348 (6.5%) |
| 35 to 39 Years | 1,249 (7.2%) | 1,354 (6.6%) |
| 40 to 44 Years | 1,217 (7.0%) | 1,321 (6.4%) |
| 45 to 49 Years | 1,079 (6.2%) | 1,054 (5.1%) |
| 50 to 54 Years | 1,242 (7.2%) | 1,425 (6.9%) |
| 55 to 59 Years | 943 (5.4%) | 1,287 (6.2%) |
| 60 to 64 Years | 1,026 (5.9%) | 1,330 (6.5%) |
| 65 to 69 Years | 765 (4.4%) | 843 (4.1%) |
| 70 to 74 Years | 616 (3.6%) | 872 (4.2%) |
| 75 to 79 Years | 603 (3.5%) | 820 (4.0%) |
| 80 to 84 Years | 244 (1.4%) | 622 (3.0%) |
| 85 Years and over | 197 (1.1%) | 461 (2.2%) |
| Total | 17,313 (100.0%) | 20,626 (100.0%) |
Families and Households in Tupelo
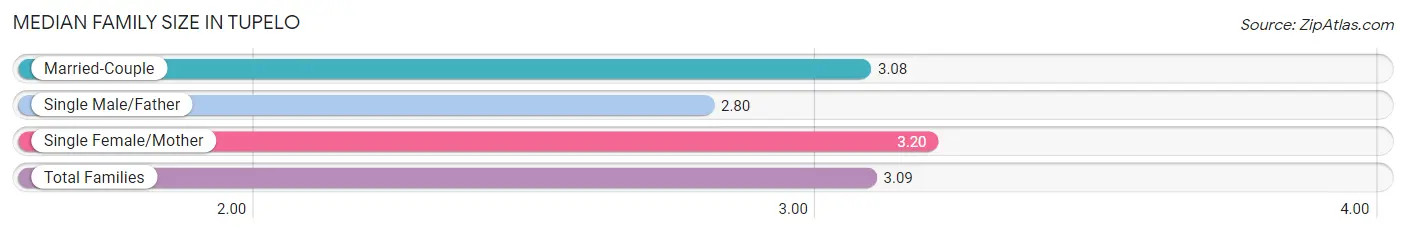
Median Family Size in Tupelo
The median family size in Tupelo is 3.09 persons per family, with single female/mother families (2,384 | 24.1%) accounting for the largest median family size of 3.2 persons per family. On the other hand, single male/father families (547 | 5.5%) represent the smallest median family size with 2.80 persons per family.
| Family Type | # Families | Family Size |
| Married-Couple | 6,951 (70.3%) | 3.08 |
| Single Male/Father | 547 (5.5%) | 2.80 |
| Single Female/Mother | 2,384 (24.1%) | 3.20 |
| Total Families | 9,882 (100.0%) | 3.09 |
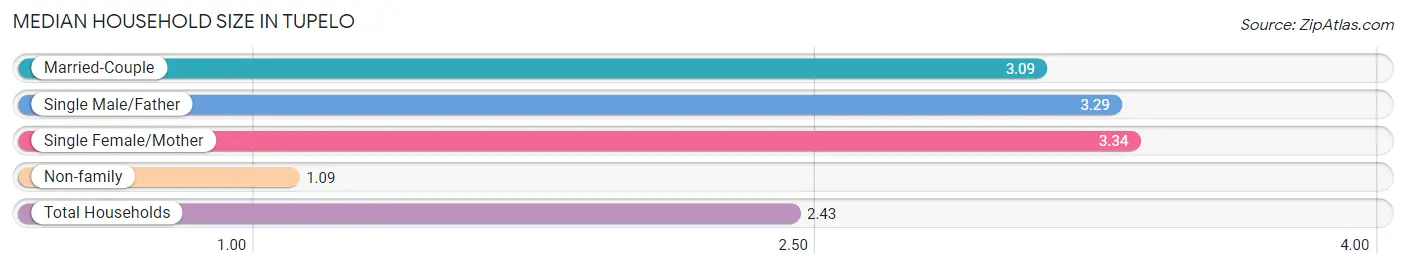
Median Household Size in Tupelo
The median household size in Tupelo is 2.43 persons per household, with single female/mother households (2,384 | 15.6%) accounting for the largest median household size of 3.34 persons per household. non-family households (5,400 | 35.3%) represent the smallest median household size with 1.09 persons per household.
| Household Type | # Households | Household Size |
| Married-Couple | 6,951 (45.5%) | 3.09 |
| Single Male/Father | 547 (3.6%) | 3.29 |
| Single Female/Mother | 2,384 (15.6%) | 3.34 |
| Non-family | 5,400 (35.3%) | 1.09 |
| Total Households | 15,282 (100.0%) | 2.43 |
Household Size by Marriage Status in Tupelo
Out of a total of 15,282 households in Tupelo, 9,882 (64.7%) are family households, while 5,400 (35.3%) are nonfamily households. The most numerous type of family households are 2-person households, comprising 4,670, and the most common type of nonfamily households are 1-person households, comprising 5,121.

| Household Size | Family Households | Nonfamily Households |
| 1-Person Households | - | 5,121 (33.5%) |
| 2-Person Households | 4,670 (30.6%) | 216 (1.4%) |
| 3-Person Households | 2,339 (15.3%) | 37 (0.2%) |
| 4-Person Households | 1,800 (11.8%) | 0 (0.0%) |
| 5-Person Households | 729 (4.8%) | 26 (0.2%) |
| 6-Person Households | 295 (1.9%) | 0 (0.0%) |
| 7+ Person Households | 49 (0.3%) | 0 (0.0%) |
| Total | 9,882 (64.7%) | 5,400 (35.3%) |
Female Fertility in Tupelo
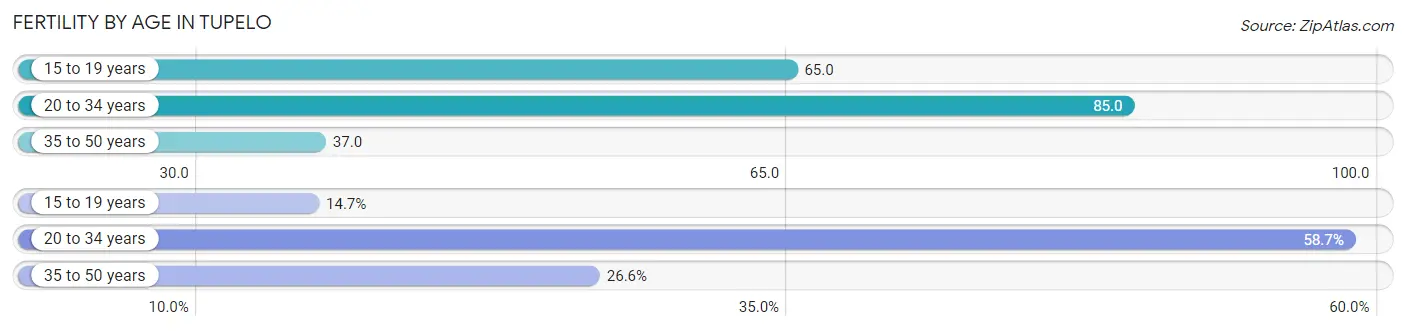
Fertility by Age in Tupelo
Average fertility rate in Tupelo is 61.0 births per 1,000 women. Women in the age bracket of 20 to 34 years have the highest fertility rate with 85.0 births per 1,000 women. Women in the age bracket of 20 to 34 years acount for 58.7% of all women with births.
| Age Bracket | Women with Births | Births / 1,000 Women |
| 15 to 19 years | 84 (14.7%) | 65.0 |
| 20 to 34 years | 335 (58.7%) | 85.0 |
| 35 to 50 years | 152 (26.6%) | 37.0 |
| Total | 571 (100.0%) | 61.0 |
Fertility by Age by Marriage Status in Tupelo
70.1% of women with births (571) in Tupelo are married. The highest percentage of unmarried women with births falls into 15 to 19 years age bracket with 100.0% of them unmarried at the time of birth, while the lowest percentage of unmarried women with births belong to 35 to 50 years age bracket with 6.6% of them unmarried.
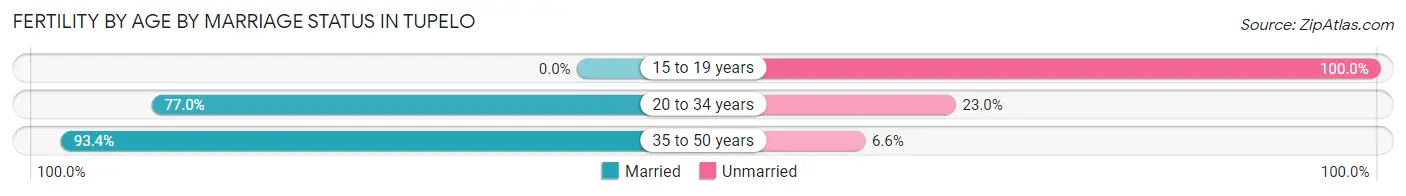
| Age Bracket | Married | Unmarried |
| 15 to 19 years | 0 (0.0%) | 84 (100.0%) |
| 20 to 34 years | 258 (77.0%) | 77 (23.0%) |
| 35 to 50 years | 142 (93.4%) | 10 (6.6%) |
| Total | 400 (70.1%) | 171 (29.9%) |
Fertility by Education in Tupelo
Average fertility rate in Tupelo is 61.0 births per 1,000 women. Women with the education attainment of high school diploma have the highest fertility rate of 152.0 births per 1,000 women, while women with the education attainment of less than high school have the lowest fertility at 21.0 births per 1,000 women. Women with the education attainment of high school diploma represent 39.1% of all women with births.
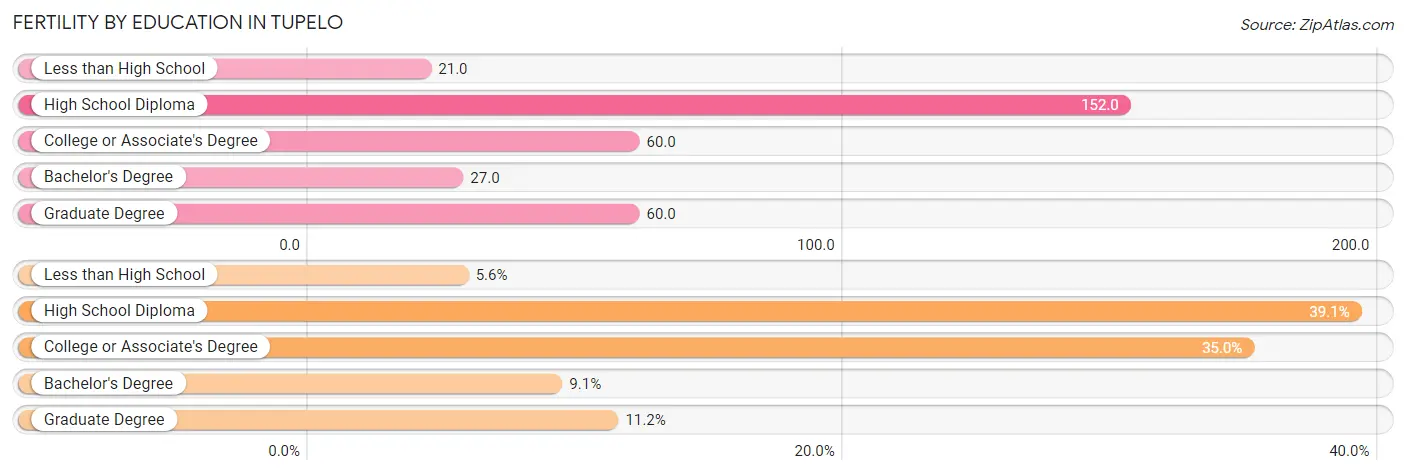
| Educational Attainment | Women with Births | Births / 1,000 Women |
| Less than High School | 32 (5.6%) | 21.0 |
| High School Diploma | 223 (39.1%) | 152.0 |
| College or Associate's Degree | 200 (35.0%) | 60.0 |
| Bachelor's Degree | 52 (9.1%) | 27.0 |
| Graduate Degree | 64 (11.2%) | 60.0 |
| Total | 571 (100.0%) | 61.0 |
Fertility by Education by Marriage Status in Tupelo
29.9% of women with births in Tupelo are unmarried. Women with the educational attainment of less than high school are most likely to be married with 100.0% of them married at childbirth, while women with the educational attainment of high school diploma are least likely to be married with 61.9% of them unmarried at childbirth.
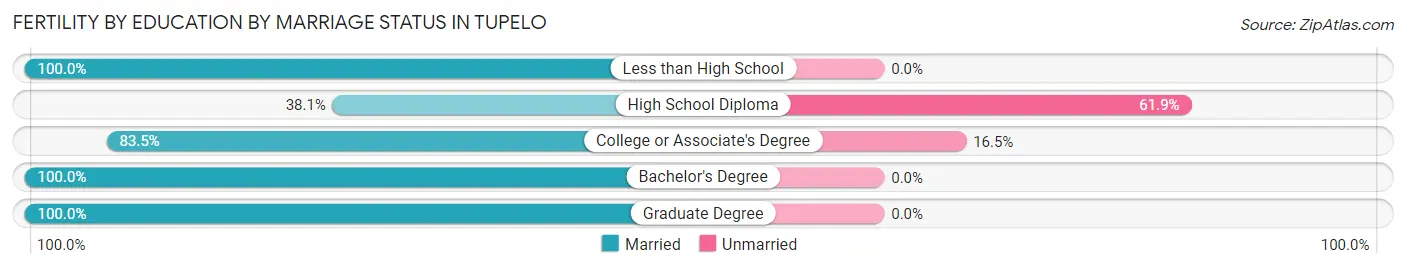
| Educational Attainment | Married | Unmarried |
| Less than High School | 32 (100.0%) | 0 (0.0%) |
| High School Diploma | 85 (38.1%) | 138 (61.9%) |
| College or Associate's Degree | 167 (83.5%) | 33 (16.5%) |
| Bachelor's Degree | 52 (100.0%) | 0 (0.0%) |
| Graduate Degree | 64 (100.0%) | 0 (0.0%) |
| Total | 400 (70.1%) | 171 (29.9%) |
Employment Characteristics in Tupelo
Employment by Class of Employer in Tupelo
Among the 17,743 employed individuals in Tupelo, private company employees (12,476 | 70.3%), not-for-profit organizations (1,610 | 9.1%), and self-employed (not incorporated) (1,040 | 5.9%) make up the most common classes of employment.
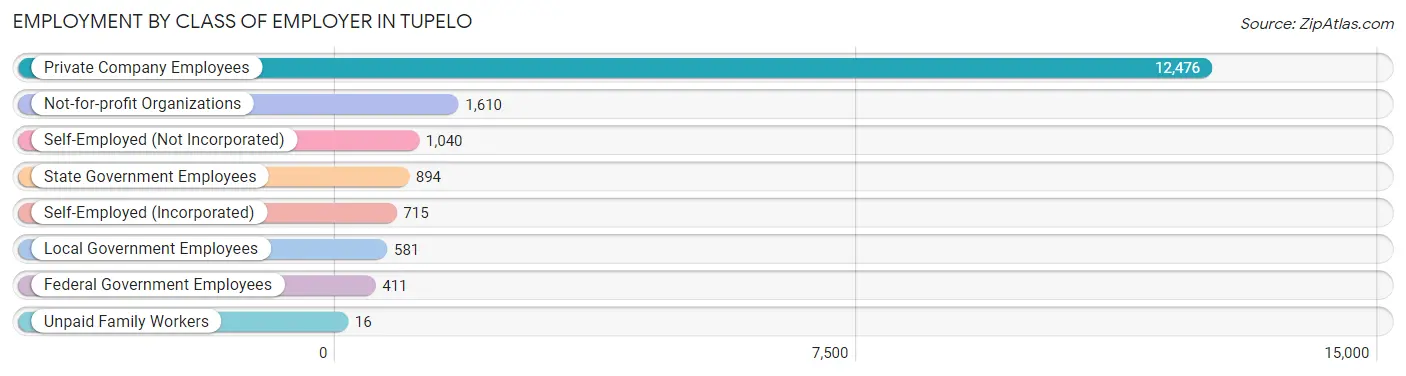
| Employer Class | # Employees | % Employees |
| Private Company Employees | 12,476 | 70.3% |
| Self-Employed (Incorporated) | 715 | 4.0% |
| Self-Employed (Not Incorporated) | 1,040 | 5.9% |
| Not-for-profit Organizations | 1,610 | 9.1% |
| Local Government Employees | 581 | 3.3% |
| State Government Employees | 894 | 5.0% |
| Federal Government Employees | 411 | 2.3% |
| Unpaid Family Workers | 16 | 0.1% |
| Total | 17,743 | 100.0% |
Employment Status by Age in Tupelo
According to the labor force statistics for Tupelo, out of the total population over 16 years of age (29,786), 64.0% or 19,063 individuals are in the labor force, with 5.1% or 972 of them unemployed. The age group with the highest labor force participation rate is 25 to 29 years, with 88.2% or 2,205 individuals in the labor force. Within the labor force, the 25 to 29 years age range has the highest percentage of unemployed individuals, with 12.0% or 265 of them being unemployed.
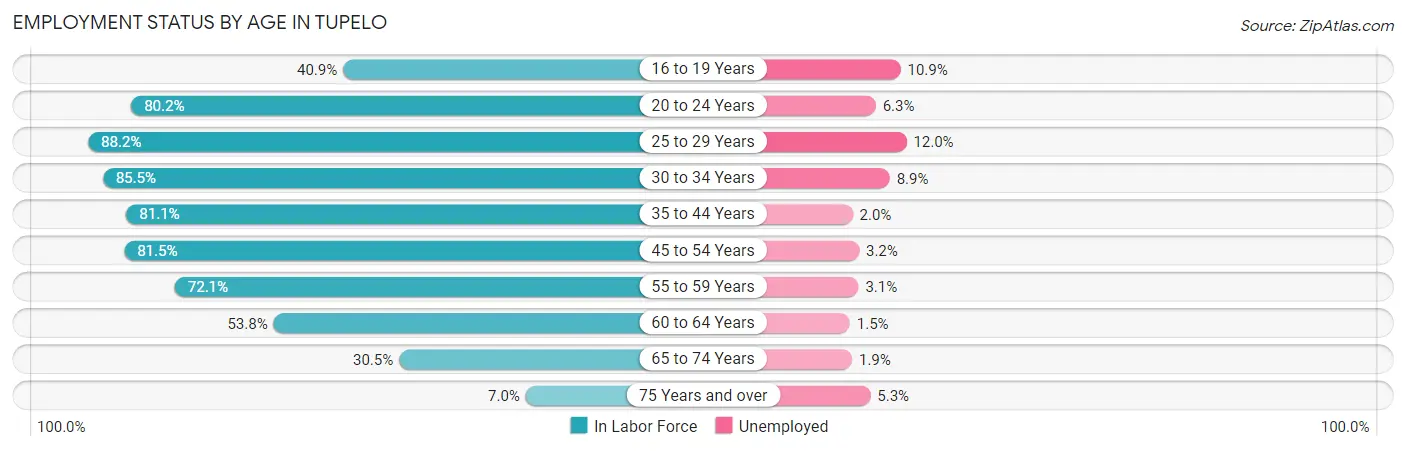
| Age Bracket | In Labor Force | Unemployed |
| 16 to 19 Years | 801 (40.9%) | 87 (10.9%) |
| 20 to 24 Years | 1,793 (80.2%) | 113 (6.3%) |
| 25 to 29 Years | 2,205 (88.2%) | 265 (12.0%) |
| 30 to 34 Years | 2,156 (85.5%) | 192 (8.9%) |
| 35 to 44 Years | 4,169 (81.1%) | 83 (2.0%) |
| 45 to 54 Years | 3,912 (81.5%) | 125 (3.2%) |
| 55 to 59 Years | 1,608 (72.1%) | 50 (3.1%) |
| 60 to 64 Years | 1,268 (53.8%) | 19 (1.5%) |
| 65 to 74 Years | 944 (30.5%) | 18 (1.9%) |
| 75 Years and over | 206 (7.0%) | 11 (5.3%) |
| Total | 19,063 (64.0%) | 972 (5.1%) |
Employment Status by Educational Attainment in Tupelo
According to labor force statistics for Tupelo, 78.4% of individuals (15,326) out of the total population between 25 and 64 years of age (19,549) are in the labor force, with 4.8% or 736 of them being unemployed. The group with the highest labor force participation rate are those with the educational attainment of bachelor's degree or higher, with 86.7% or 6,366 individuals in the labor force. Within the labor force, individuals with less than high school education have the highest percentage of unemployment, with 8.8% or 91 of them being unemployed.
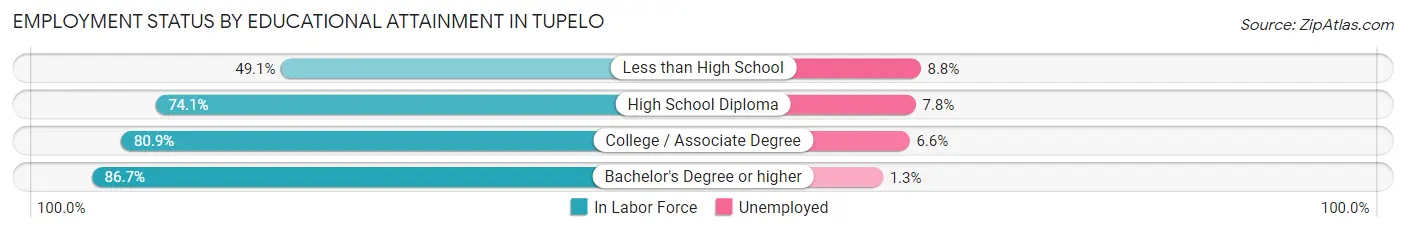
| Educational Attainment | In Labor Force | Unemployed |
| Less than High School | 1,031 (49.1%) | 185 (8.8%) |
| High School Diploma | 2,833 (74.1%) | 298 (7.8%) |
| College / Associate Degree | 5,085 (80.9%) | 415 (6.6%) |
| Bachelor's Degree or higher | 6,366 (86.7%) | 95 (1.3%) |
| Total | 15,326 (78.4%) | 938 (4.8%) |
Employment Occupations by Sex in Tupelo
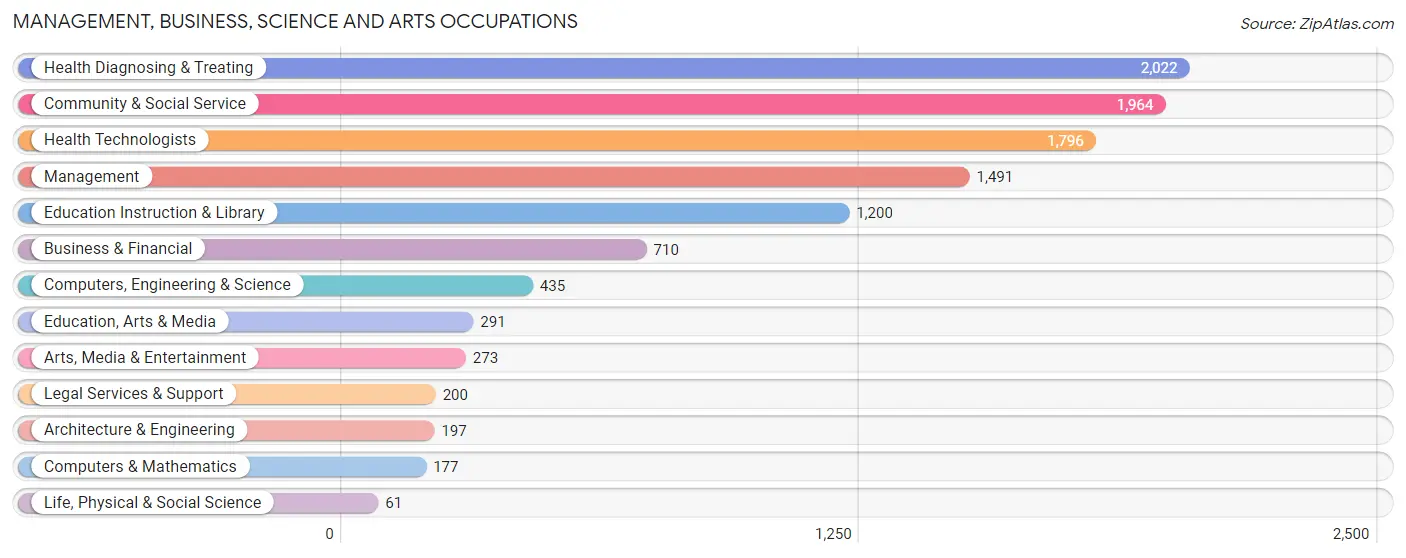
Management, Business, Science and Arts Occupations
The most common Management, Business, Science and Arts occupations in Tupelo are Health Diagnosing & Treating (2,022 | 11.3%), Community & Social Service (1,964 | 11.0%), Health Technologists (1,796 | 10.0%), Management (1,491 | 8.3%), and Education Instruction & Library (1,200 | 6.7%).
Management, Business, Science and Arts Occupations by Sex
Within the Management, Business, Science and Arts occupations in Tupelo, the most male-oriented occupations are Architecture & Engineering (93.4%), Computers, Engineering & Science (80.7%), and Computers & Mathematics (72.9%), while the most female-oriented occupations are Education Instruction & Library (89.7%), Education, Arts & Media (82.1%), and Community & Social Service (79.9%).
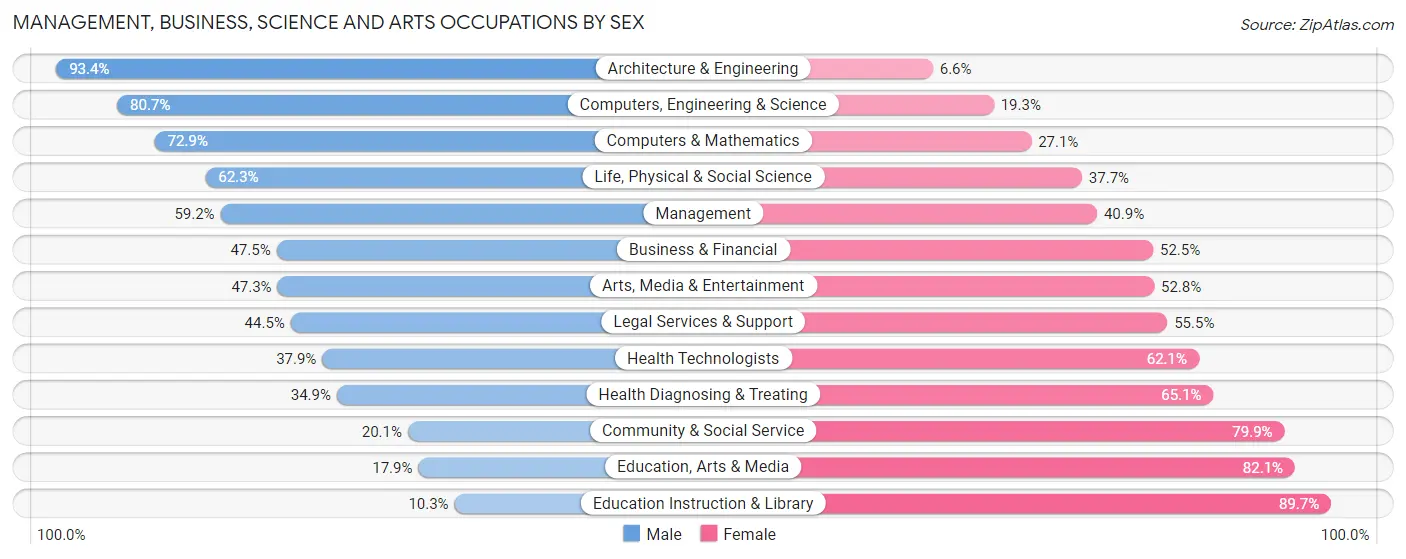
| Occupation | Male | Female |
| Management | 882 (59.2%) | 609 (40.8%) |
| Business & Financial | 337 (47.5%) | 373 (52.5%) |
| Computers, Engineering & Science | 351 (80.7%) | 84 (19.3%) |
| Computers & Mathematics | 129 (72.9%) | 48 (27.1%) |
| Architecture & Engineering | 184 (93.4%) | 13 (6.6%) |
| Life, Physical & Social Science | 38 (62.3%) | 23 (37.7%) |
| Community & Social Service | 394 (20.1%) | 1,570 (79.9%) |
| Education, Arts & Media | 52 (17.9%) | 239 (82.1%) |
| Legal Services & Support | 89 (44.5%) | 111 (55.5%) |
| Education Instruction & Library | 124 (10.3%) | 1,076 (89.7%) |
| Arts, Media & Entertainment | 129 (47.2%) | 144 (52.7%) |
| Health Diagnosing & Treating | 705 (34.9%) | 1,317 (65.1%) |
| Health Technologists | 681 (37.9%) | 1,115 (62.1%) |
| Total (Category) | 2,669 (40.3%) | 3,953 (59.7%) |
| Total (Overall) | 8,766 (48.9%) | 9,165 (51.1%) |
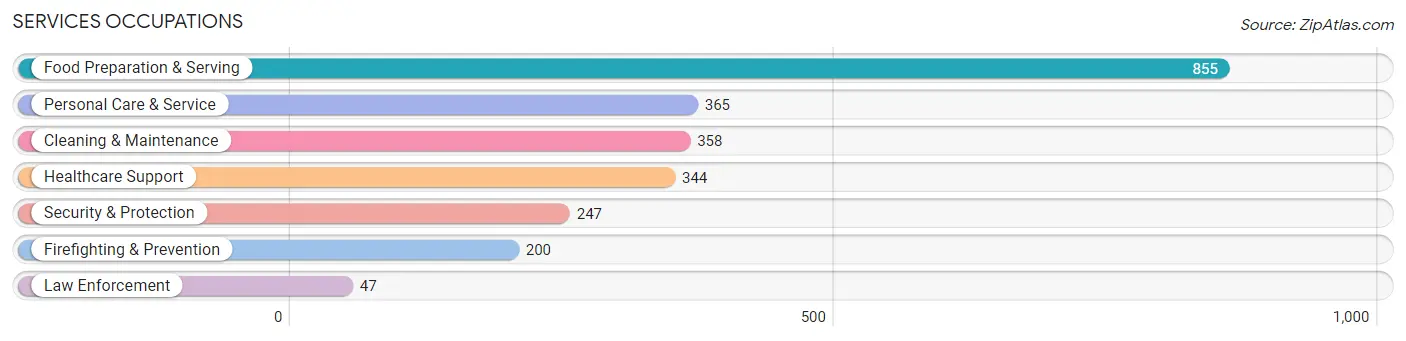
Services Occupations
The most common Services occupations in Tupelo are Food Preparation & Serving (855 | 4.8%), Personal Care & Service (365 | 2.0%), Cleaning & Maintenance (358 | 2.0%), Healthcare Support (344 | 1.9%), and Security & Protection (247 | 1.4%).
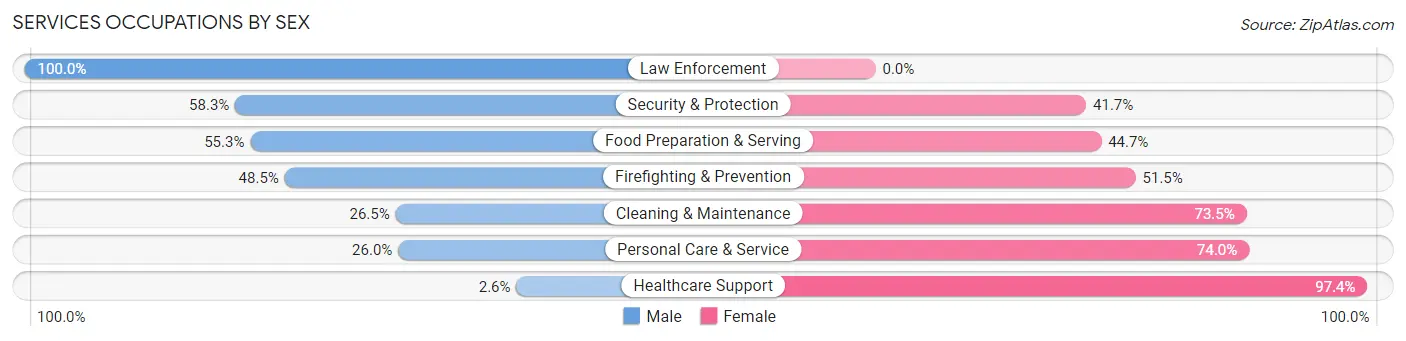
Services Occupations by Sex
Within the Services occupations in Tupelo, the most male-oriented occupations are Law Enforcement (100.0%), Security & Protection (58.3%), and Food Preparation & Serving (55.3%), while the most female-oriented occupations are Healthcare Support (97.4%), Personal Care & Service (74.0%), and Cleaning & Maintenance (73.5%).
| Occupation | Male | Female |
| Healthcare Support | 9 (2.6%) | 335 (97.4%) |
| Security & Protection | 144 (58.3%) | 103 (41.7%) |
| Firefighting & Prevention | 97 (48.5%) | 103 (51.5%) |
| Law Enforcement | 47 (100.0%) | 0 (0.0%) |
| Food Preparation & Serving | 473 (55.3%) | 382 (44.7%) |
| Cleaning & Maintenance | 95 (26.5%) | 263 (73.5%) |
| Personal Care & Service | 95 (26.0%) | 270 (74.0%) |
| Total (Category) | 816 (37.6%) | 1,353 (62.4%) |
| Total (Overall) | 8,766 (48.9%) | 9,165 (51.1%) |
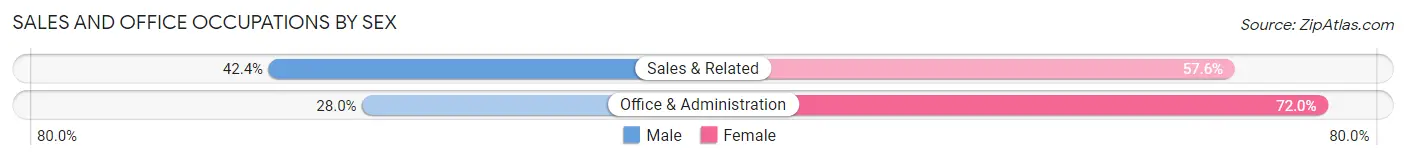
Sales and Office Occupations
The most common Sales and Office occupations in Tupelo are Sales & Related (2,509 | 14.0%), and Office & Administration (1,773 | 9.9%).

Sales and Office Occupations by Sex
| Occupation | Male | Female |
| Sales & Related | 1,064 (42.4%) | 1,445 (57.6%) |
| Office & Administration | 497 (28.0%) | 1,276 (72.0%) |
| Total (Category) | 1,561 (36.4%) | 2,721 (63.5%) |
| Total (Overall) | 8,766 (48.9%) | 9,165 (51.1%) |
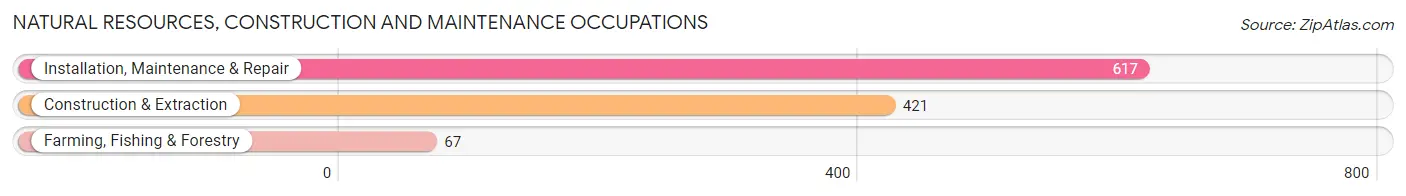
Natural Resources, Construction and Maintenance Occupations
The most common Natural Resources, Construction and Maintenance occupations in Tupelo are Installation, Maintenance & Repair (617 | 3.4%), Construction & Extraction (421 | 2.4%), and Farming, Fishing & Forestry (67 | 0.4%).
Natural Resources, Construction and Maintenance Occupations by Sex
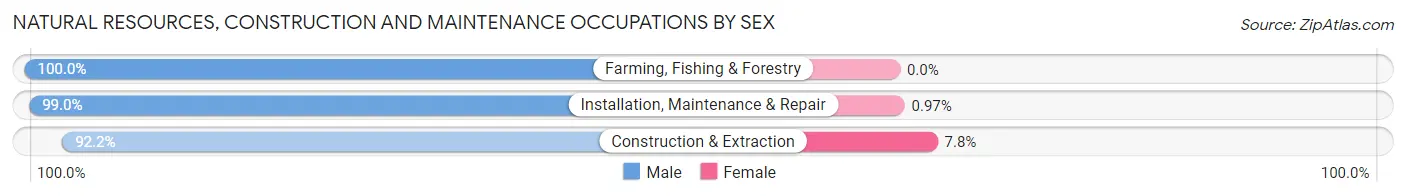
| Occupation | Male | Female |
| Farming, Fishing & Forestry | 67 (100.0%) | 0 (0.0%) |
| Construction & Extraction | 388 (92.2%) | 33 (7.8%) |
| Installation, Maintenance & Repair | 611 (99.0%) | 6 (1.0%) |
| Total (Category) | 1,066 (96.5%) | 39 (3.5%) |
| Total (Overall) | 8,766 (48.9%) | 9,165 (51.1%) |
Production, Transportation and Moving Occupations
The most common Production, Transportation and Moving occupations in Tupelo are Production (1,932 | 10.8%), Transportation (997 | 5.6%), and Material Moving (824 | 4.6%).
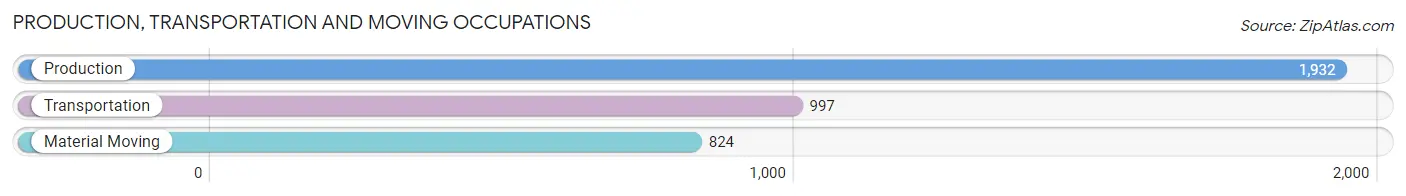
Production, Transportation and Moving Occupations by Sex
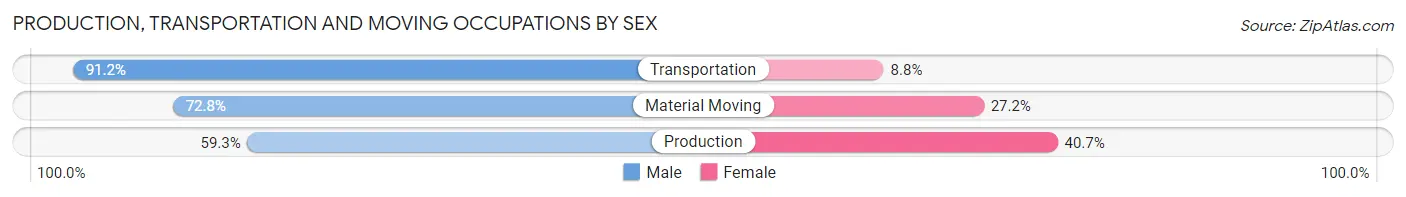
| Occupation | Male | Female |
| Production | 1,145 (59.3%) | 787 (40.7%) |
| Transportation | 909 (91.2%) | 88 (8.8%) |
| Material Moving | 600 (72.8%) | 224 (27.2%) |
| Total (Category) | 2,654 (70.7%) | 1,099 (29.3%) |
| Total (Overall) | 8,766 (48.9%) | 9,165 (51.1%) |
Employment Industries by Sex in Tupelo
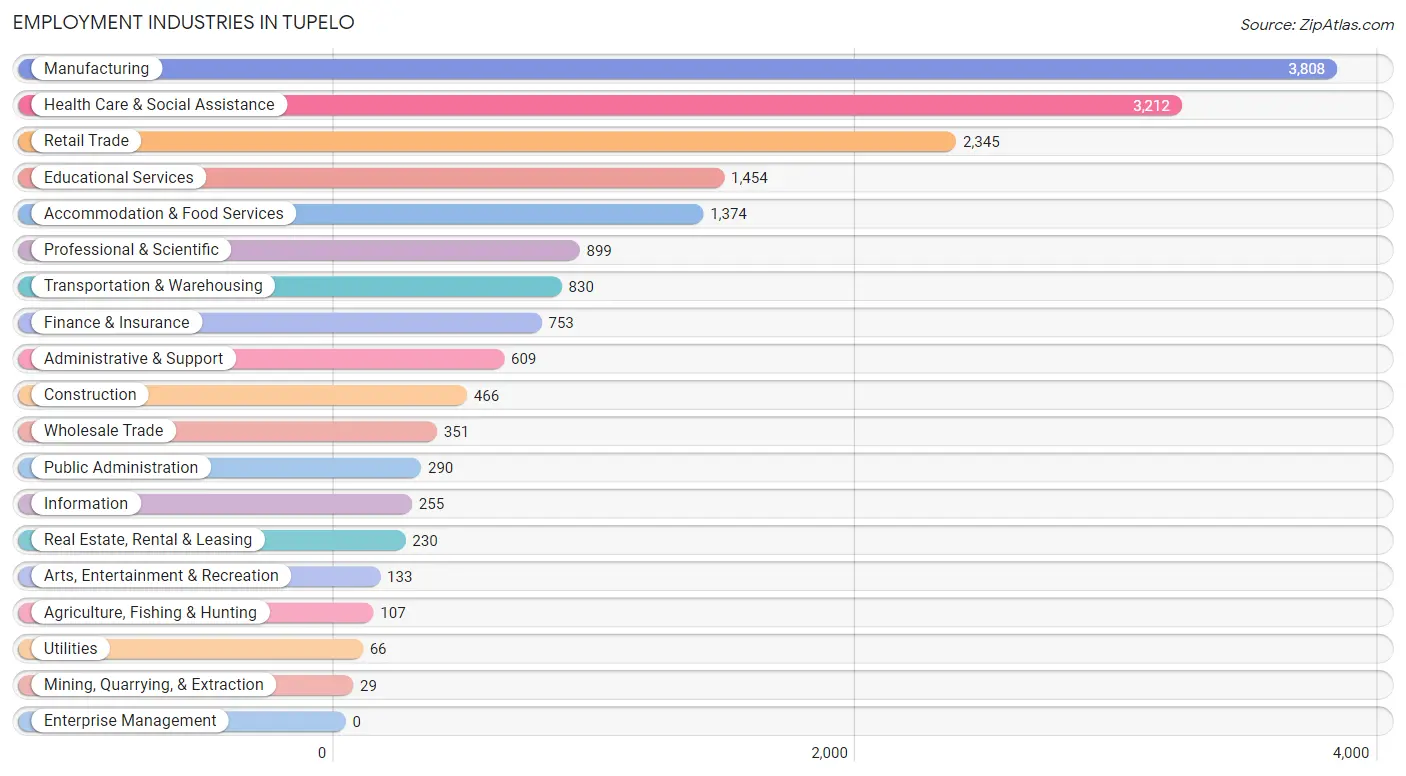
Employment Industries in Tupelo
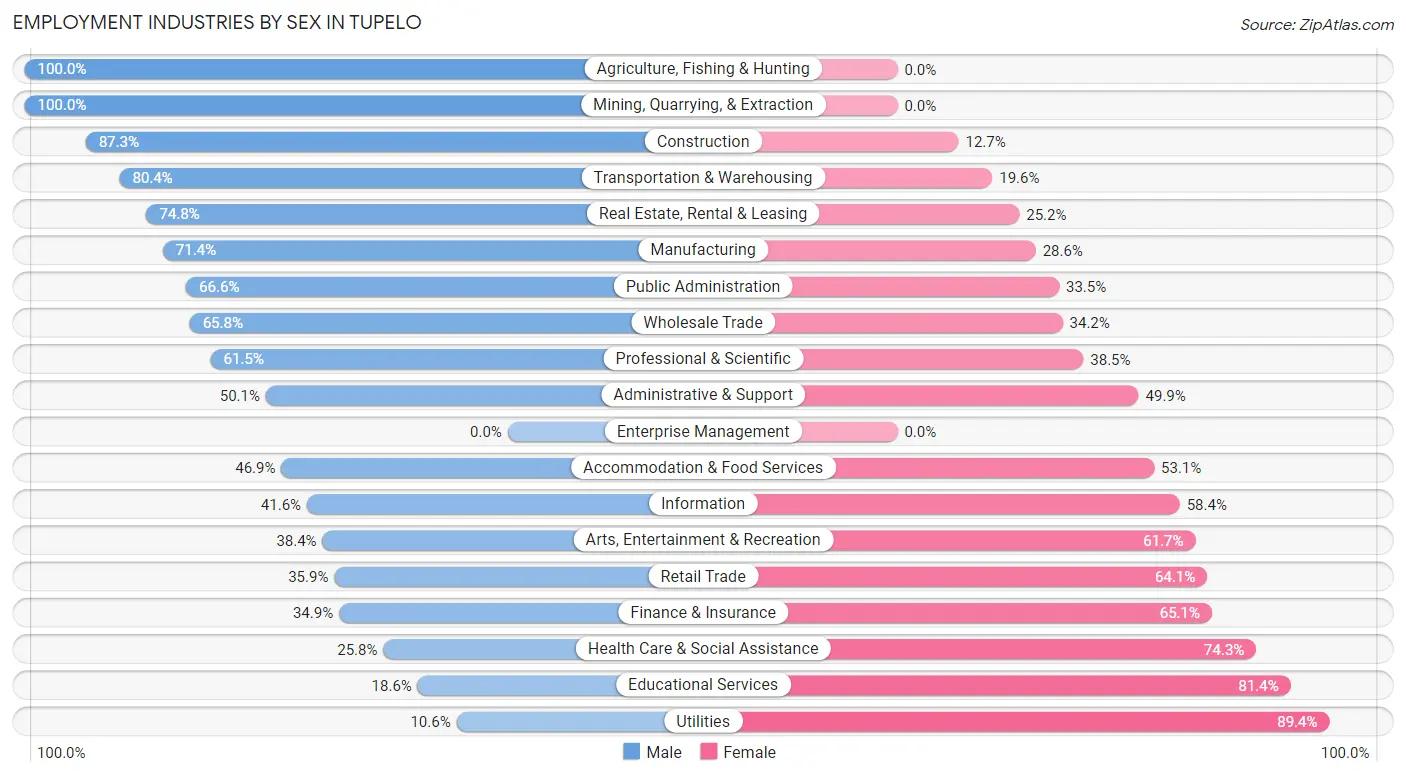
The major employment industries in Tupelo include Manufacturing (3,808 | 21.2%), Health Care & Social Assistance (3,212 | 17.9%), Retail Trade (2,345 | 13.1%), Educational Services (1,454 | 8.1%), and Accommodation & Food Services (1,374 | 7.7%).
Employment Industries by Sex in Tupelo
The Tupelo industries that see more men than women are Agriculture, Fishing & Hunting (100.0%), Mining, Quarrying, & Extraction (100.0%), and Construction (87.3%), whereas the industries that tend to have a higher number of women are Utilities (89.4%), Educational Services (81.4%), and Health Care & Social Assistance (74.3%).
| Industry | Male | Female |
| Agriculture, Fishing & Hunting | 107 (100.0%) | 0 (0.0%) |
| Mining, Quarrying, & Extraction | 29 (100.0%) | 0 (0.0%) |
| Construction | 407 (87.3%) | 59 (12.7%) |
| Manufacturing | 2,718 (71.4%) | 1,090 (28.6%) |
| Wholesale Trade | 231 (65.8%) | 120 (34.2%) |
| Retail Trade | 842 (35.9%) | 1,503 (64.1%) |
| Transportation & Warehousing | 667 (80.4%) | 163 (19.6%) |
| Utilities | 7 (10.6%) | 59 (89.4%) |
| Information | 106 (41.6%) | 149 (58.4%) |
| Finance & Insurance | 263 (34.9%) | 490 (65.1%) |
| Real Estate, Rental & Leasing | 172 (74.8%) | 58 (25.2%) |
| Professional & Scientific | 553 (61.5%) | 346 (38.5%) |
| Enterprise Management | 0 (0.0%) | 0 (0.0%) |
| Administrative & Support | 305 (50.1%) | 304 (49.9%) |
| Educational Services | 271 (18.6%) | 1,183 (81.4%) |
| Health Care & Social Assistance | 827 (25.8%) | 2,385 (74.3%) |
| Arts, Entertainment & Recreation | 51 (38.4%) | 82 (61.7%) |
| Accommodation & Food Services | 644 (46.9%) | 730 (53.1%) |
| Public Administration | 193 (66.5%) | 97 (33.5%) |
| Total | 8,766 (48.9%) | 9,165 (51.1%) |
Education in Tupelo
School Enrollment in Tupelo
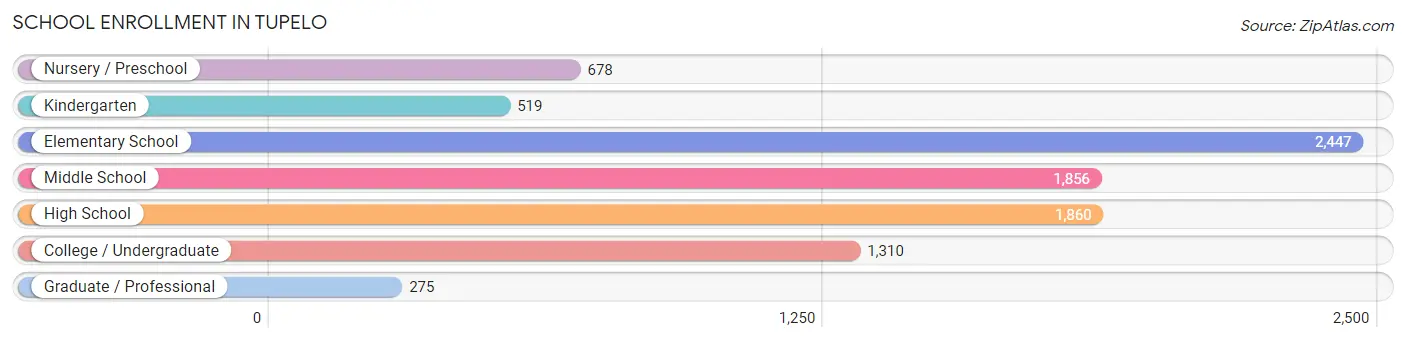
The most common levels of schooling among the 8,945 students in Tupelo are elementary school (2,447 | 27.4%), high school (1,860 | 20.8%), and middle school (1,856 | 20.7%).
| School Level | # Students | % Students |
| Nursery / Preschool | 678 | 7.6% |
| Kindergarten | 519 | 5.8% |
| Elementary School | 2,447 | 27.4% |
| Middle School | 1,856 | 20.7% |
| High School | 1,860 | 20.8% |
| College / Undergraduate | 1,310 | 14.6% |
| Graduate / Professional | 275 | 3.1% |
| Total | 8,945 | 100.0% |
School Enrollment by Age by Funding Source in Tupelo
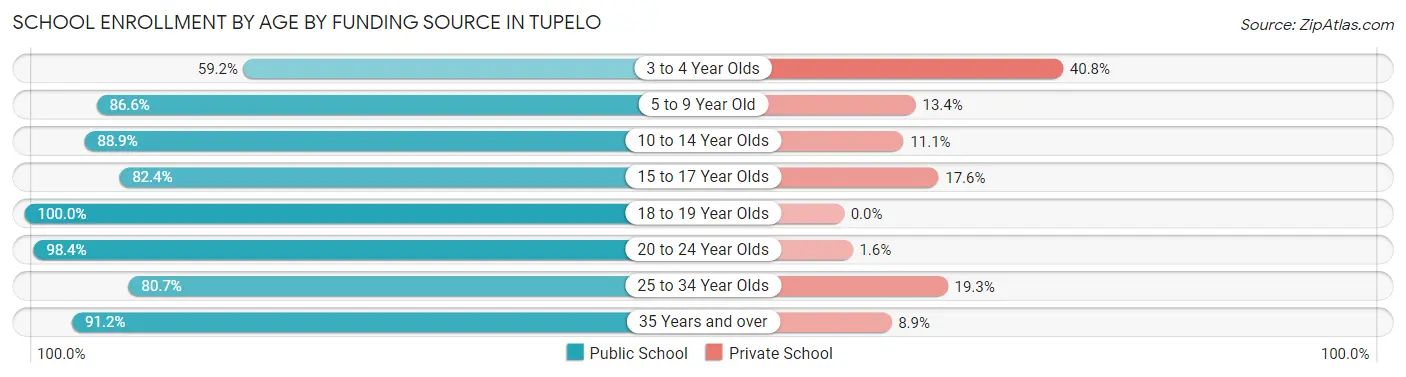
Out of a total of 8,945 students who are enrolled in schools in Tupelo, 1,190 (13.3%) attend a private institution, while the remaining 7,755 (86.7%) are enrolled in public schools. The age group of 3 to 4 year olds has the highest likelihood of being enrolled in private schools, with 225 (40.8% in the age bracket) enrolled. Conversely, the age group of 18 to 19 year olds has the lowest likelihood of being enrolled in a private school, with 569 (100.0% in the age bracket) attending a public institution.
| Age Bracket | Public School | Private School |
| 3 to 4 Year Olds | 326 (59.2%) | 225 (40.8%) |
| 5 to 9 Year Old | 2,251 (86.6%) | 348 (13.4%) |
| 10 to 14 Year Olds | 2,235 (88.9%) | 280 (11.1%) |
| 15 to 17 Year Olds | 1,168 (82.4%) | 250 (17.6%) |
| 18 to 19 Year Olds | 569 (100.0%) | 0 (0.0%) |
| 20 to 24 Year Olds | 783 (98.4%) | 13 (1.6%) |
| 25 to 34 Year Olds | 246 (80.7%) | 59 (19.3%) |
| 35 Years and over | 175 (91.1%) | 17 (8.8%) |
| Total | 7,755 (86.7%) | 1,190 (13.3%) |
Educational Attainment by Field of Study in Tupelo
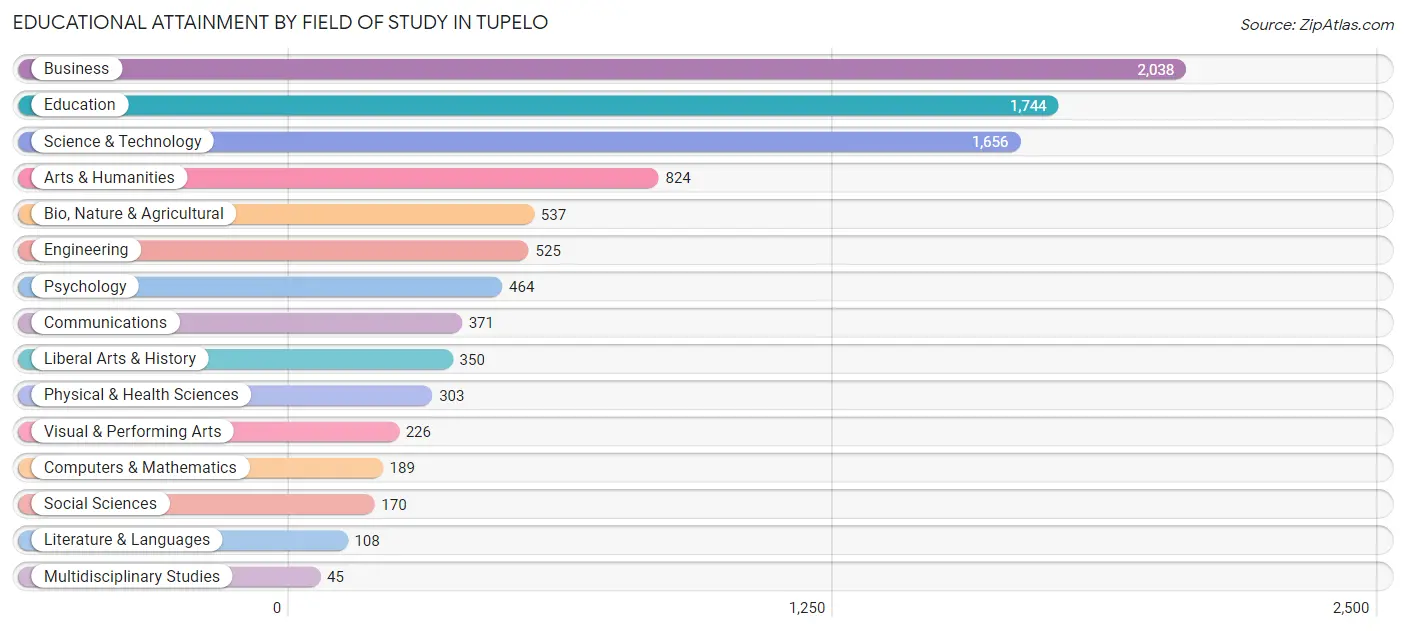
Business (2,038 | 21.3%), education (1,744 | 18.3%), science & technology (1,656 | 17.3%), arts & humanities (824 | 8.6%), and bio, nature & agricultural (537 | 5.6%) are the most common fields of study among 9,550 individuals in Tupelo who have obtained a bachelor's degree or higher.
| Field of Study | # Graduates | % Graduates |
| Computers & Mathematics | 189 | 2.0% |
| Bio, Nature & Agricultural | 537 | 5.6% |
| Physical & Health Sciences | 303 | 3.2% |
| Psychology | 464 | 4.9% |
| Social Sciences | 170 | 1.8% |
| Engineering | 525 | 5.5% |
| Multidisciplinary Studies | 45 | 0.5% |
| Science & Technology | 1,656 | 17.3% |
| Business | 2,038 | 21.3% |
| Education | 1,744 | 18.3% |
| Literature & Languages | 108 | 1.1% |
| Liberal Arts & History | 350 | 3.7% |
| Visual & Performing Arts | 226 | 2.4% |
| Communications | 371 | 3.9% |
| Arts & Humanities | 824 | 8.6% |
| Total | 9,550 | 100.0% |
Transportation & Commute in Tupelo
Vehicle Availability by Sex in Tupelo
The most prevalent vehicle ownership categories in Tupelo are males with 2 vehicles (4,018, accounting for 45.3%) and females with 2 vehicles (3,770, making up 45.2%).
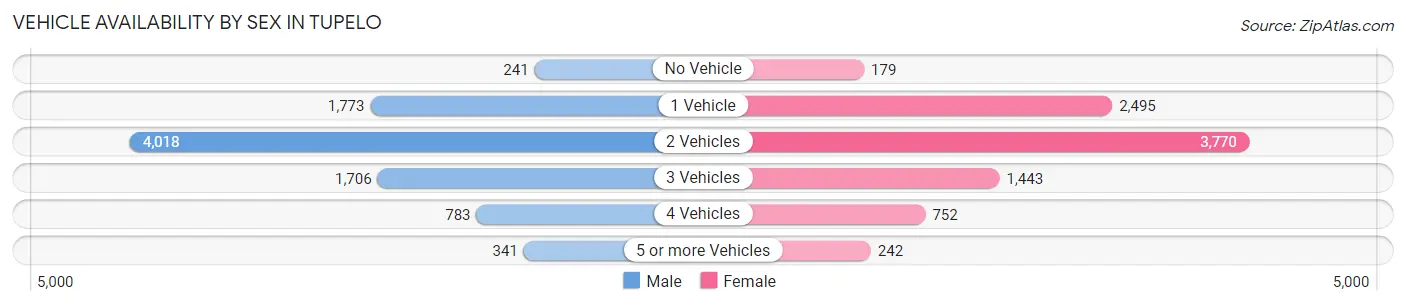
| Vehicles Available | Male | Female |
| No Vehicle | 241 (2.7%) | 179 (2.0%) |
| 1 Vehicle | 1,773 (20.0%) | 2,495 (28.1%) |
| 2 Vehicles | 4,018 (45.3%) | 3,770 (42.4%) |
| 3 Vehicles | 1,706 (19.3%) | 1,443 (16.3%) |
| 4 Vehicles | 783 (8.8%) | 752 (8.5%) |
| 5 or more Vehicles | 341 (3.8%) | 242 (2.7%) |
| Total | 8,862 (100.0%) | 8,881 (100.0%) |
Commute Time in Tupelo
The most frequently occuring commute durations in Tupelo are 10 to 14 minutes (4,886 commuters, 28.9%), 15 to 19 minutes (4,208 commuters, 24.9%), and 20 to 24 minutes (2,097 commuters, 12.4%).
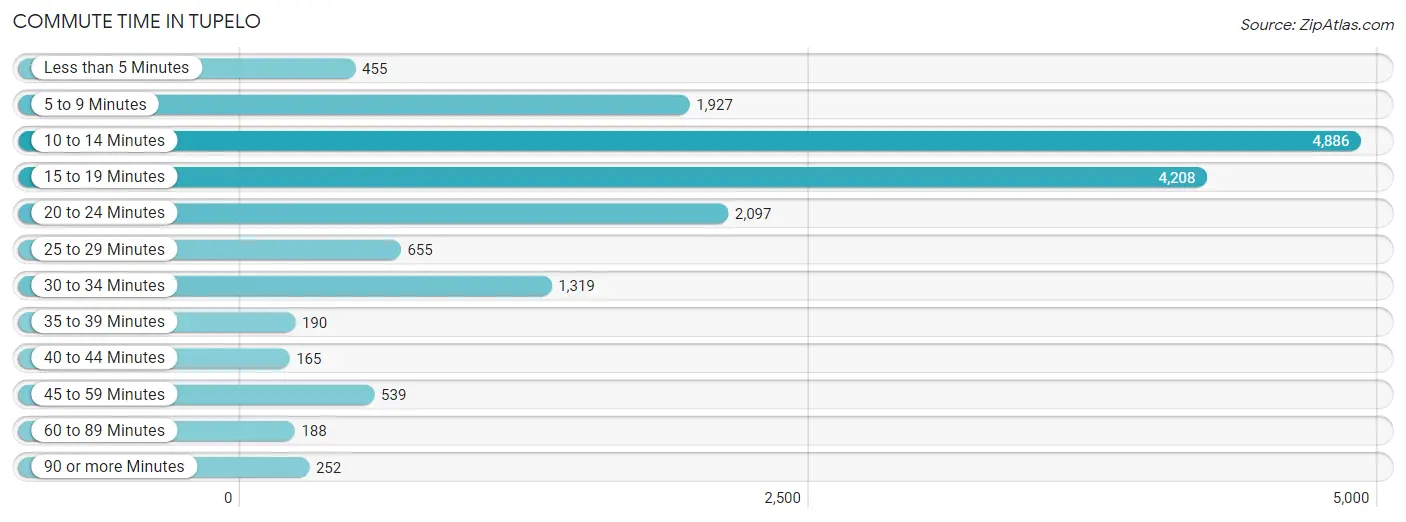
| Commute Time | # Commuters | % Commuters |
| Less than 5 Minutes | 455 | 2.7% |
| 5 to 9 Minutes | 1,927 | 11.4% |
| 10 to 14 Minutes | 4,886 | 28.9% |
| 15 to 19 Minutes | 4,208 | 24.9% |
| 20 to 24 Minutes | 2,097 | 12.4% |
| 25 to 29 Minutes | 655 | 3.9% |
| 30 to 34 Minutes | 1,319 | 7.8% |
| 35 to 39 Minutes | 190 | 1.1% |
| 40 to 44 Minutes | 165 | 1.0% |
| 45 to 59 Minutes | 539 | 3.2% |
| 60 to 89 Minutes | 188 | 1.1% |
| 90 or more Minutes | 252 | 1.5% |
Commute Time by Sex in Tupelo
The most common commute times in Tupelo are 10 to 14 minutes (2,274 commuters, 26.7%) for males and 10 to 14 minutes (2,612 commuters, 31.2%) for females.
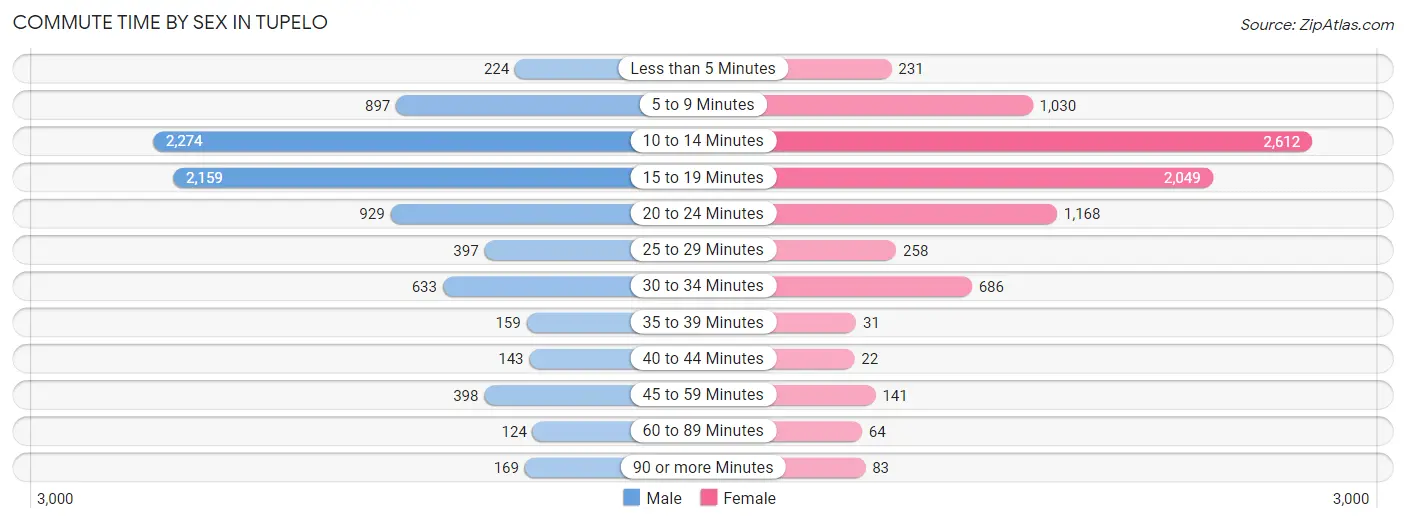
| Commute Time | Male | Female |
| Less than 5 Minutes | 224 (2.6%) | 231 (2.8%) |
| 5 to 9 Minutes | 897 (10.5%) | 1,030 (12.3%) |
| 10 to 14 Minutes | 2,274 (26.7%) | 2,612 (31.2%) |
| 15 to 19 Minutes | 2,159 (25.4%) | 2,049 (24.5%) |
| 20 to 24 Minutes | 929 (10.9%) | 1,168 (14.0%) |
| 25 to 29 Minutes | 397 (4.7%) | 258 (3.1%) |
| 30 to 34 Minutes | 633 (7.4%) | 686 (8.2%) |
| 35 to 39 Minutes | 159 (1.9%) | 31 (0.4%) |
| 40 to 44 Minutes | 143 (1.7%) | 22 (0.3%) |
| 45 to 59 Minutes | 398 (4.7%) | 141 (1.7%) |
| 60 to 89 Minutes | 124 (1.5%) | 64 (0.8%) |
| 90 or more Minutes | 169 (2.0%) | 83 (1.0%) |
Time of Departure to Work by Sex in Tupelo
The most frequent times of departure to work in Tupelo are 7:00 AM to 7:29 AM (1,640, 19.3%) for males and 7:30 AM to 7:59 AM (1,594, 19.0%) for females.
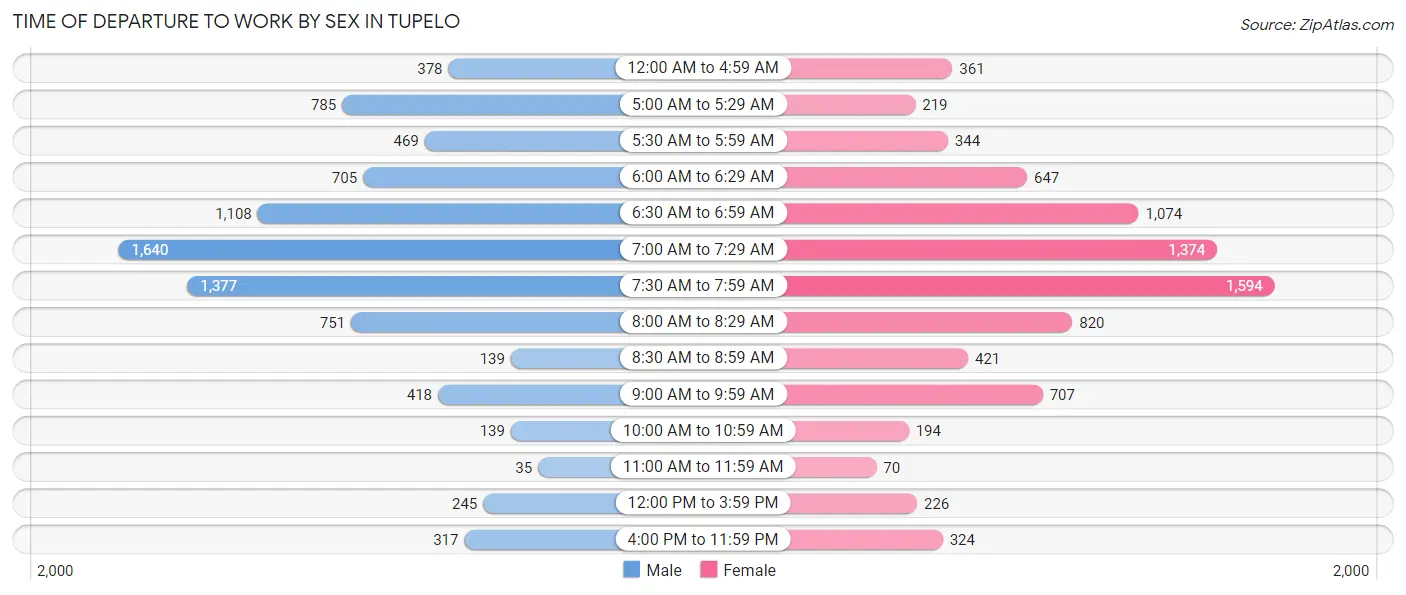
| Time of Departure | Male | Female |
| 12:00 AM to 4:59 AM | 378 (4.4%) | 361 (4.3%) |
| 5:00 AM to 5:29 AM | 785 (9.2%) | 219 (2.6%) |
| 5:30 AM to 5:59 AM | 469 (5.5%) | 344 (4.1%) |
| 6:00 AM to 6:29 AM | 705 (8.3%) | 647 (7.7%) |
| 6:30 AM to 6:59 AM | 1,108 (13.0%) | 1,074 (12.8%) |
| 7:00 AM to 7:29 AM | 1,640 (19.3%) | 1,374 (16.4%) |
| 7:30 AM to 7:59 AM | 1,377 (16.2%) | 1,594 (19.0%) |
| 8:00 AM to 8:29 AM | 751 (8.8%) | 820 (9.8%) |
| 8:30 AM to 8:59 AM | 139 (1.6%) | 421 (5.0%) |
| 9:00 AM to 9:59 AM | 418 (4.9%) | 707 (8.4%) |
| 10:00 AM to 10:59 AM | 139 (1.6%) | 194 (2.3%) |
| 11:00 AM to 11:59 AM | 35 (0.4%) | 70 (0.8%) |
| 12:00 PM to 3:59 PM | 245 (2.9%) | 226 (2.7%) |
| 4:00 PM to 11:59 PM | 317 (3.7%) | 324 (3.9%) |
| Total | 8,506 (100.0%) | 8,375 (100.0%) |
Housing Occupancy in Tupelo
Occupancy by Ownership in Tupelo
Of the total 15,282 dwellings in Tupelo, owner-occupied units account for 9,466 (61.9%), while renter-occupied units make up 5,816 (38.1%).
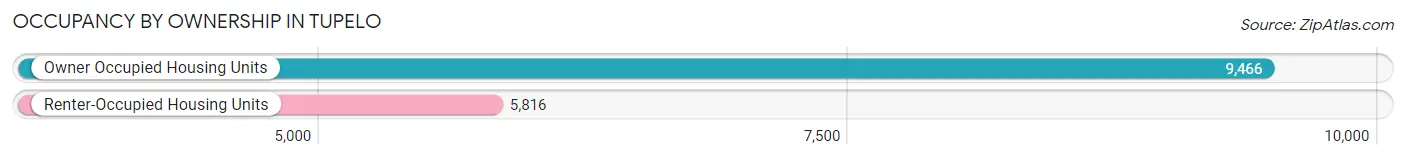
| Occupancy | # Housing Units | % Housing Units |
| Owner Occupied Housing Units | 9,466 | 61.9% |
| Renter-Occupied Housing Units | 5,816 | 38.1% |
| Total Occupied Housing Units | 15,282 | 100.0% |
Occupancy by Household Size in Tupelo
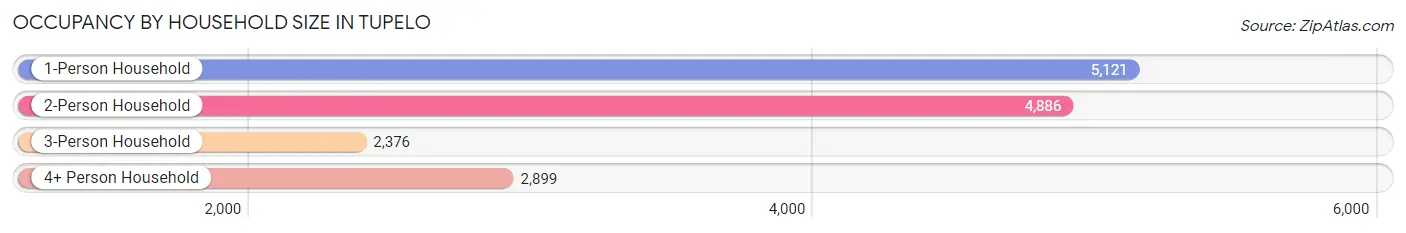
| Household Size | # Housing Units | % Housing Units |
| 1-Person Household | 5,121 | 33.5% |
| 2-Person Household | 4,886 | 32.0% |
| 3-Person Household | 2,376 | 15.5% |
| 4+ Person Household | 2,899 | 19.0% |
| Total Housing Units | 15,282 | 100.0% |
Occupancy by Ownership by Household Size in Tupelo
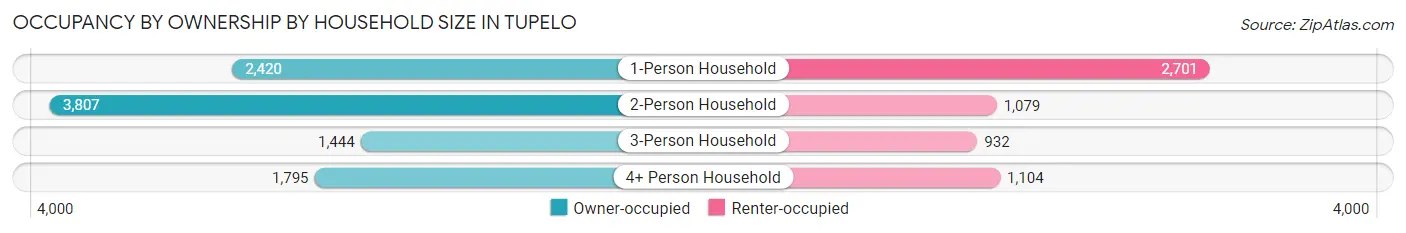
| Household Size | Owner-occupied | Renter-occupied |
| 1-Person Household | 2,420 (47.3%) | 2,701 (52.7%) |
| 2-Person Household | 3,807 (77.9%) | 1,079 (22.1%) |
| 3-Person Household | 1,444 (60.8%) | 932 (39.2%) |
| 4+ Person Household | 1,795 (61.9%) | 1,104 (38.1%) |
| Total Housing Units | 9,466 (61.9%) | 5,816 (38.1%) |
Occupancy by Educational Attainment in Tupelo
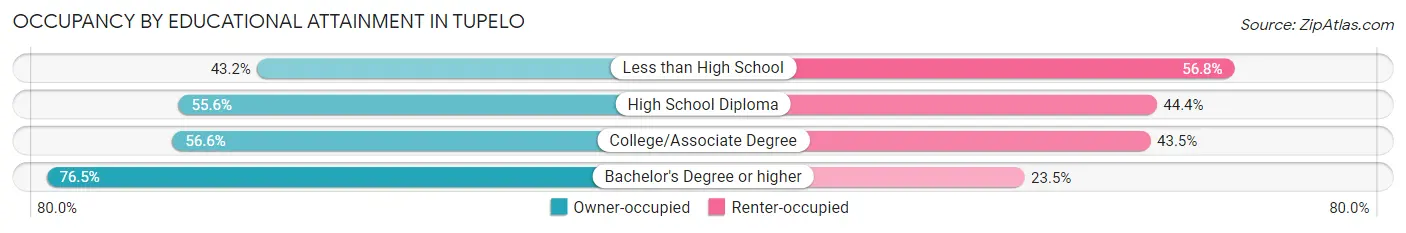
| Household Size | Owner-occupied | Renter-occupied |
| Less than High School | 701 (43.2%) | 922 (56.8%) |
| High School Diploma | 1,719 (55.6%) | 1,375 (44.4%) |
| College/Associate Degree | 2,943 (56.6%) | 2,261 (43.4%) |
| Bachelor's Degree or higher | 4,103 (76.5%) | 1,258 (23.5%) |
Occupancy by Age of Householder in Tupelo
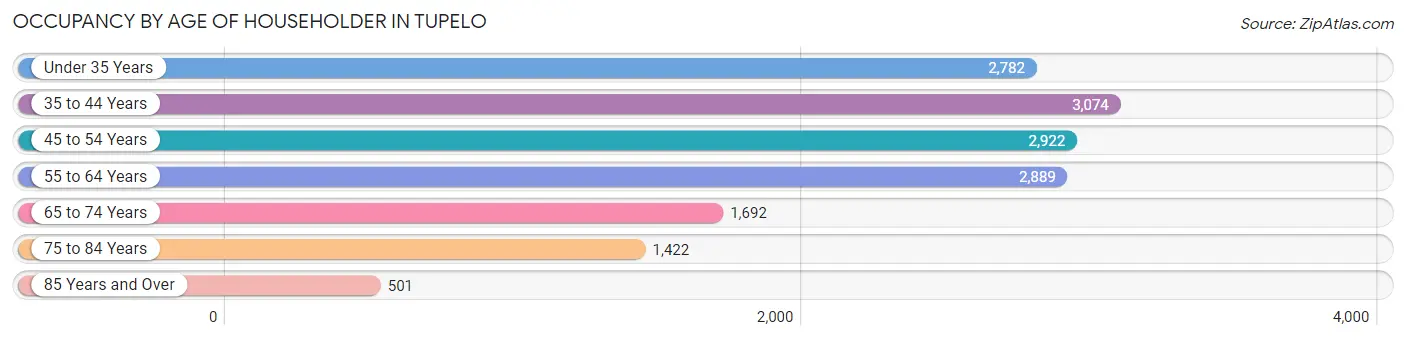
| Age Bracket | # Households | % Households |
| Under 35 Years | 2,782 | 18.2% |
| 35 to 44 Years | 3,074 | 20.1% |
| 45 to 54 Years | 2,922 | 19.1% |
| 55 to 64 Years | 2,889 | 18.9% |
| 65 to 74 Years | 1,692 | 11.1% |
| 75 to 84 Years | 1,422 | 9.3% |
| 85 Years and Over | 501 | 3.3% |
| Total | 15,282 | 100.0% |
Housing Finances in Tupelo
Median Income by Occupancy in Tupelo
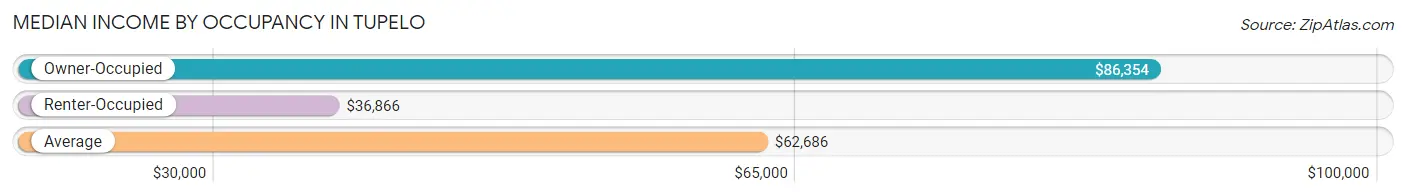
| Occupancy Type | # Households | Median Income |
| Owner-Occupied | 9,466 (61.9%) | $86,354 |
| Renter-Occupied | 5,816 (38.1%) | $36,866 |
| Average | 15,282 (100.0%) | $62,686 |
Occupancy by Householder Income Bracket in Tupelo
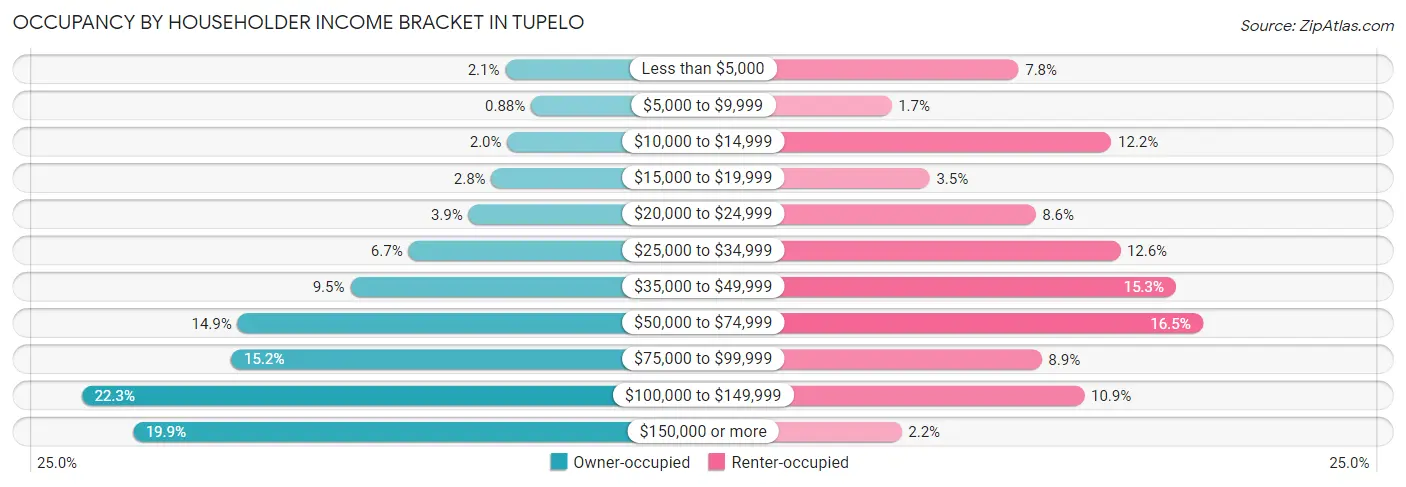
| Income Bracket | Owner-occupied | Renter-occupied |
| Less than $5,000 | 200 (2.1%) | 451 (7.7%) |
| $5,000 to $9,999 | 83 (0.9%) | 99 (1.7%) |
| $10,000 to $14,999 | 190 (2.0%) | 708 (12.2%) |
| $15,000 to $19,999 | 262 (2.8%) | 205 (3.5%) |
| $20,000 to $24,999 | 365 (3.9%) | 498 (8.6%) |
| $25,000 to $34,999 | 636 (6.7%) | 732 (12.6%) |
| $35,000 to $49,999 | 898 (9.5%) | 887 (15.2%) |
| $50,000 to $74,999 | 1,407 (14.9%) | 961 (16.5%) |
| $75,000 to $99,999 | 1,436 (15.2%) | 515 (8.8%) |
| $100,000 to $149,999 | 2,110 (22.3%) | 633 (10.9%) |
| $150,000 or more | 1,879 (19.9%) | 127 (2.2%) |
| Total | 9,466 (100.0%) | 5,816 (100.0%) |
Monthly Housing Cost Tiers in Tupelo
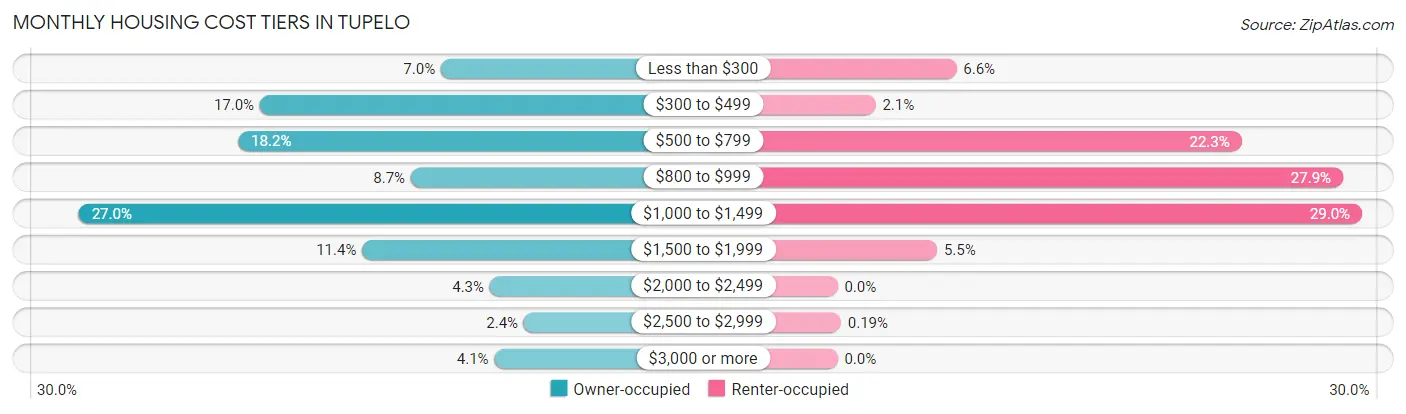
| Monthly Cost | Owner-occupied | Renter-occupied |
| Less than $300 | 663 (7.0%) | 382 (6.6%) |
| $300 to $499 | 1,609 (17.0%) | 122 (2.1%) |
| $500 to $799 | 1,724 (18.2%) | 1,298 (22.3%) |
| $800 to $999 | 820 (8.7%) | 1,624 (27.9%) |
| $1,000 to $1,499 | 2,557 (27.0%) | 1,685 (29.0%) |
| $1,500 to $1,999 | 1,074 (11.4%) | 320 (5.5%) |
| $2,000 to $2,499 | 407 (4.3%) | 0 (0.0%) |
| $2,500 to $2,999 | 229 (2.4%) | 11 (0.2%) |
| $3,000 or more | 383 (4.1%) | 0 (0.0%) |
| Total | 9,466 (100.0%) | 5,816 (100.0%) |
Physical Housing Characteristics in Tupelo
Housing Structures in Tupelo
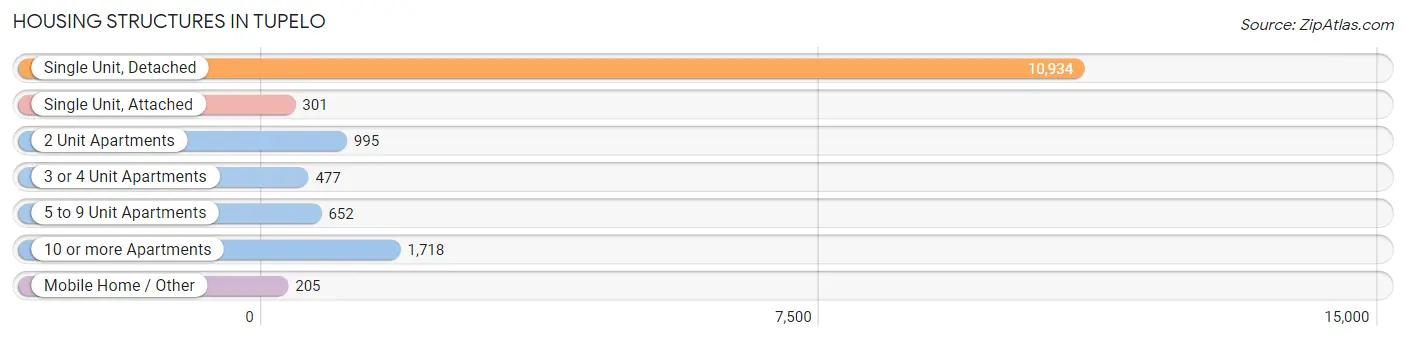
| Structure Type | # Housing Units | % Housing Units |
| Single Unit, Detached | 10,934 | 71.6% |
| Single Unit, Attached | 301 | 2.0% |
| 2 Unit Apartments | 995 | 6.5% |
| 3 or 4 Unit Apartments | 477 | 3.1% |
| 5 to 9 Unit Apartments | 652 | 4.3% |
| 10 or more Apartments | 1,718 | 11.2% |
| Mobile Home / Other | 205 | 1.3% |
| Total | 15,282 | 100.0% |
Housing Structures by Occupancy in Tupelo
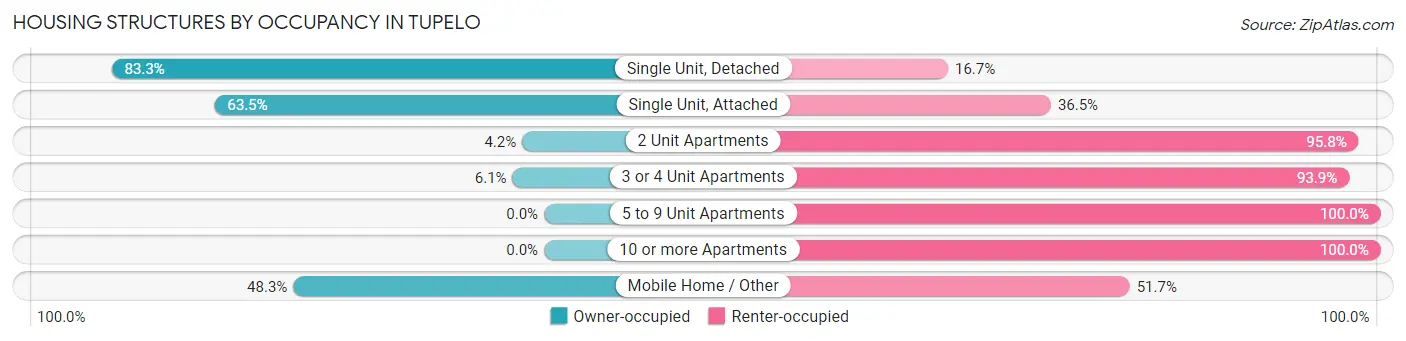
| Structure Type | Owner-occupied | Renter-occupied |
| Single Unit, Detached | 9,105 (83.3%) | 1,829 (16.7%) |
| Single Unit, Attached | 191 (63.5%) | 110 (36.5%) |
| 2 Unit Apartments | 42 (4.2%) | 953 (95.8%) |
| 3 or 4 Unit Apartments | 29 (6.1%) | 448 (93.9%) |
| 5 to 9 Unit Apartments | 0 (0.0%) | 652 (100.0%) |
| 10 or more Apartments | 0 (0.0%) | 1,718 (100.0%) |
| Mobile Home / Other | 99 (48.3%) | 106 (51.7%) |
| Total | 9,466 (61.9%) | 5,816 (38.1%) |
Housing Structures by Number of Rooms in Tupelo
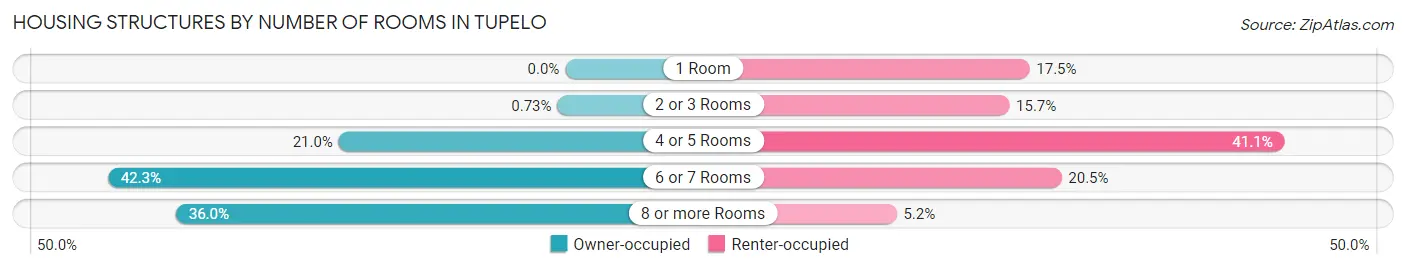
| Number of Rooms | Owner-occupied | Renter-occupied |
| 1 Room | 0 (0.0%) | 1,019 (17.5%) |
| 2 or 3 Rooms | 69 (0.7%) | 910 (15.7%) |
| 4 or 5 Rooms | 1,983 (20.9%) | 2,392 (41.1%) |
| 6 or 7 Rooms | 4,005 (42.3%) | 1,191 (20.5%) |
| 8 or more Rooms | 3,409 (36.0%) | 304 (5.2%) |
| Total | 9,466 (100.0%) | 5,816 (100.0%) |
Housing Structure by Heating Type in Tupelo
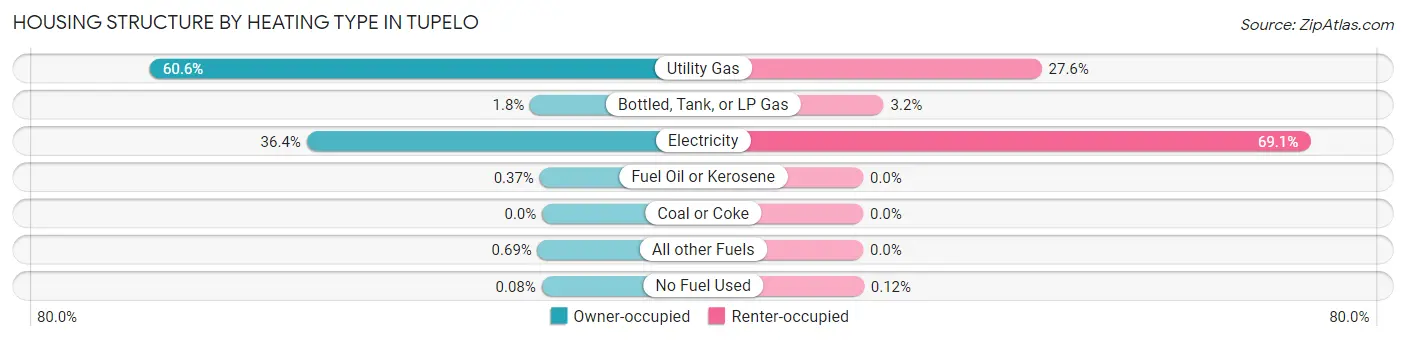
| Heating Type | Owner-occupied | Renter-occupied |
| Utility Gas | 5,738 (60.6%) | 1,605 (27.6%) |
| Bottled, Tank, or LP Gas | 174 (1.8%) | 185 (3.2%) |
| Electricity | 3,446 (36.4%) | 4,019 (69.1%) |
| Fuel Oil or Kerosene | 35 (0.4%) | 0 (0.0%) |
| Coal or Coke | 0 (0.0%) | 0 (0.0%) |
| All other Fuels | 65 (0.7%) | 0 (0.0%) |
| No Fuel Used | 8 (0.1%) | 7 (0.1%) |
| Total | 9,466 (100.0%) | 5,816 (100.0%) |
Household Vehicle Usage in Tupelo
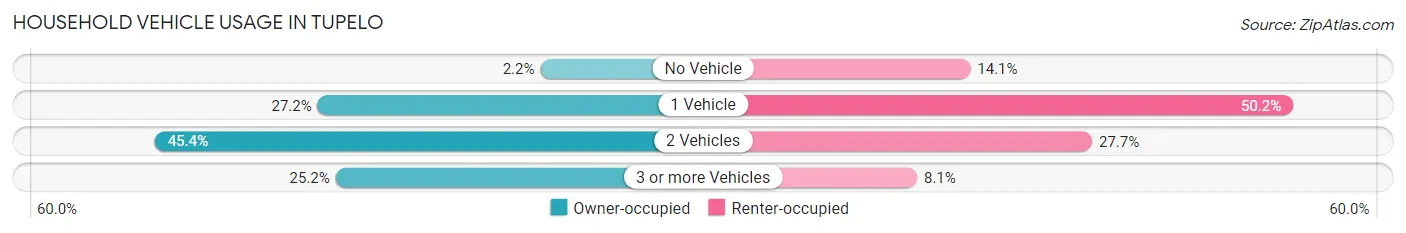
| Vehicles per Household | Owner-occupied | Renter-occupied |
| No Vehicle | 211 (2.2%) | 817 (14.1%) |
| 1 Vehicle | 2,573 (27.2%) | 2,919 (50.2%) |
| 2 Vehicles | 4,299 (45.4%) | 1,610 (27.7%) |
| 3 or more Vehicles | 2,383 (25.2%) | 470 (8.1%) |
| Total | 9,466 (100.0%) | 5,816 (100.0%) |
Real Estate & Mortgages in Tupelo
Real Estate and Mortgage Overview in Tupelo
| Characteristic | Without Mortgage | With Mortgage |
| Housing Units | 3,513 | 5,953 |
| Median Property Value | $195,500 | $181,100 |
| Median Household Income | $76,106 | $1,347 |
| Monthly Housing Costs | $455 | $383 |
| Real Estate Taxes | $1,474 | $571 |
Property Value by Mortgage Status in Tupelo
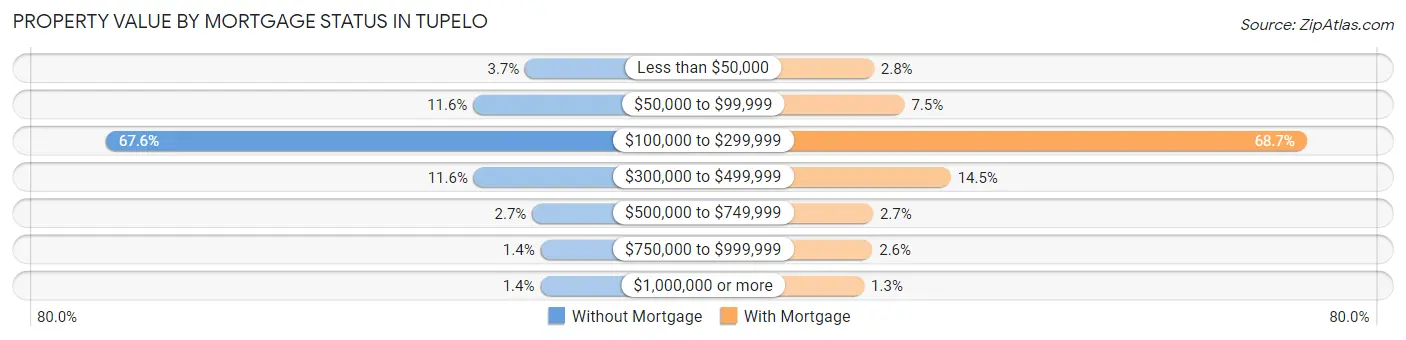
| Property Value | Without Mortgage | With Mortgage |
| Less than $50,000 | 131 (3.7%) | 166 (2.8%) |
| $50,000 to $99,999 | 409 (11.6%) | 444 (7.5%) |
| $100,000 to $299,999 | 2,375 (67.6%) | 4,092 (68.7%) |
| $300,000 to $499,999 | 406 (11.6%) | 863 (14.5%) |
| $500,000 to $749,999 | 93 (2.6%) | 158 (2.6%) |
| $750,000 to $999,999 | 49 (1.4%) | 152 (2.5%) |
| $1,000,000 or more | 50 (1.4%) | 78 (1.3%) |
| Total | 3,513 (100.0%) | 5,953 (100.0%) |
Household Income by Mortgage Status in Tupelo
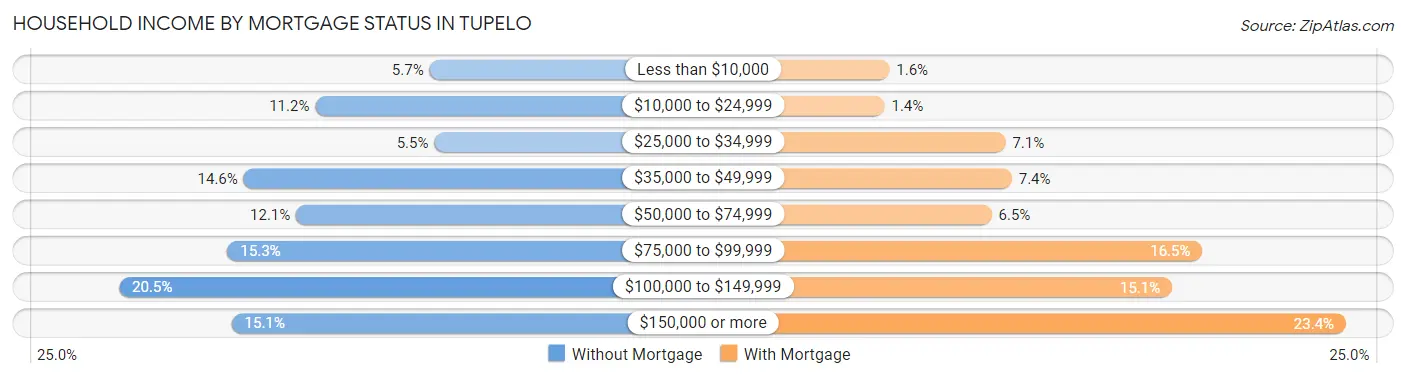
| Household Income | Without Mortgage | With Mortgage |
| Less than $10,000 | 201 (5.7%) | 96 (1.6%) |
| $10,000 to $24,999 | 392 (11.2%) | 82 (1.4%) |
| $25,000 to $34,999 | 193 (5.5%) | 425 (7.1%) |
| $35,000 to $49,999 | 512 (14.6%) | 443 (7.4%) |
| $50,000 to $74,999 | 424 (12.1%) | 386 (6.5%) |
| $75,000 to $99,999 | 539 (15.3%) | 983 (16.5%) |
| $100,000 to $149,999 | 720 (20.5%) | 897 (15.1%) |
| $150,000 or more | 532 (15.1%) | 1,390 (23.4%) |
| Total | 3,513 (100.0%) | 5,953 (100.0%) |
Property Value to Household Income Ratio in Tupelo
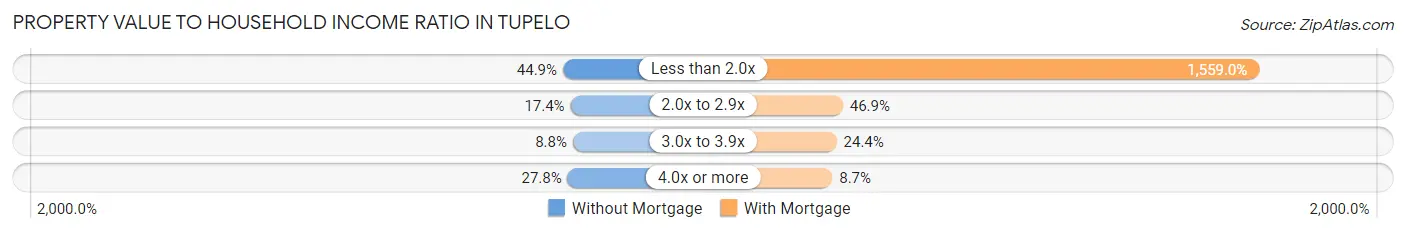
| Value-to-Income Ratio | Without Mortgage | With Mortgage |
| Less than 2.0x | 1,577 (44.9%) | 92,809 (1,559.0%) |
| 2.0x to 2.9x | 612 (17.4%) | 2,790 (46.9%) |
| 3.0x to 3.9x | 310 (8.8%) | 1,451 (24.4%) |
| 4.0x or more | 978 (27.8%) | 515 (8.6%) |
| Total | 3,513 (100.0%) | 5,953 (100.0%) |
Real Estate Taxes by Mortgage Status in Tupelo
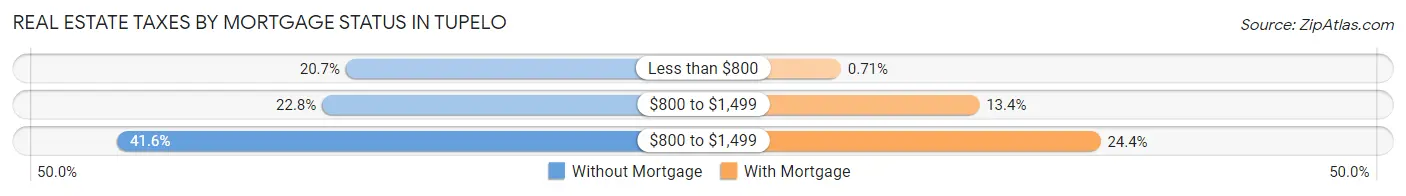
| Property Taxes | Without Mortgage | With Mortgage |
| Less than $800 | 726 (20.7%) | 42 (0.7%) |
| $800 to $1,499 | 802 (22.8%) | 795 (13.4%) |
| $800 to $1,499 | 1,460 (41.6%) | 1,454 (24.4%) |
| Total | 3,513 (100.0%) | 5,953 (100.0%) |
Health & Disability in Tupelo
Health Insurance Coverage by Age in Tupelo
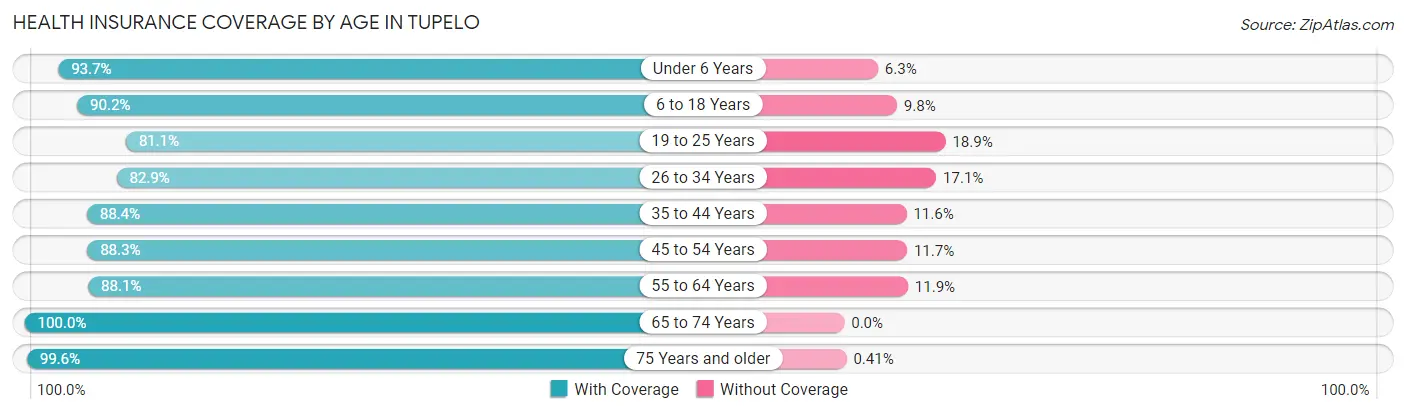
| Age Bracket | With Coverage | Without Coverage |
| Under 6 Years | 2,929 (93.7%) | 196 (6.3%) |
| 6 to 18 Years | 5,804 (90.2%) | 631 (9.8%) |
| 19 to 25 Years | 2,688 (81.1%) | 625 (18.9%) |
| 26 to 34 Years | 3,637 (82.9%) | 752 (17.1%) |
| 35 to 44 Years | 4,335 (88.4%) | 569 (11.6%) |
| 45 to 54 Years | 4,153 (88.3%) | 550 (11.7%) |
| 55 to 64 Years | 3,924 (88.1%) | 528 (11.9%) |
| 65 to 74 Years | 2,982 (100.0%) | 0 (0.0%) |
| 75 Years and older | 2,654 (99.6%) | 11 (0.4%) |
| Total | 33,106 (89.5%) | 3,862 (10.4%) |
Health Insurance Coverage by Citizenship Status in Tupelo
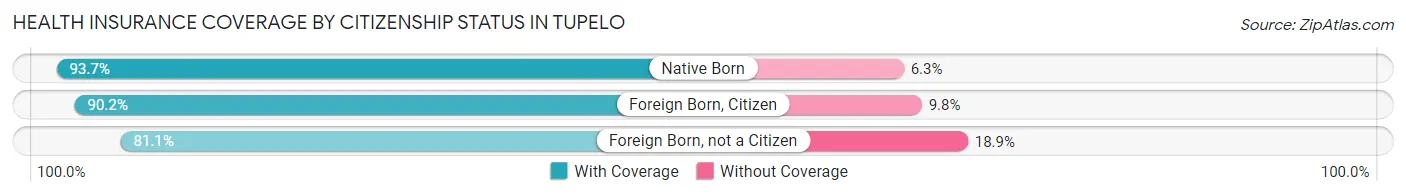
| Citizenship Status | With Coverage | Without Coverage |
| Native Born | 2,929 (93.7%) | 196 (6.3%) |
| Foreign Born, Citizen | 5,804 (90.2%) | 631 (9.8%) |
| Foreign Born, not a Citizen | 2,688 (81.1%) | 625 (18.9%) |
Health Insurance Coverage by Household Income in Tupelo
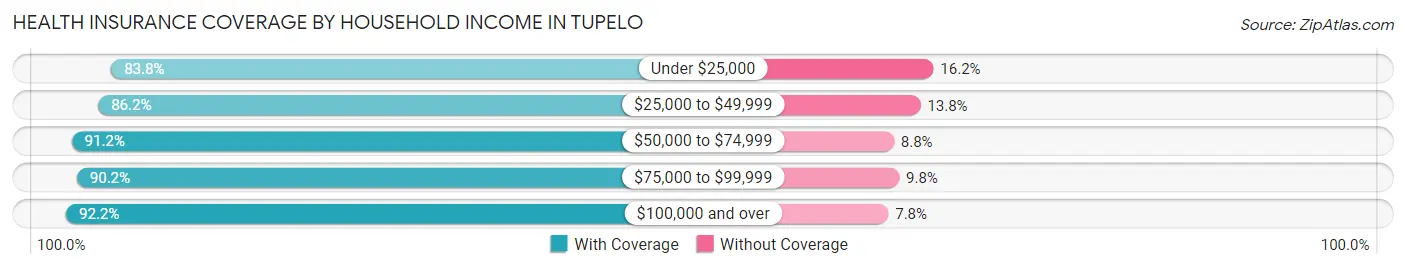
| Household Income | With Coverage | Without Coverage |
| Under $25,000 | 4,222 (83.8%) | 818 (16.2%) |
| $25,000 to $49,999 | 5,479 (86.2%) | 877 (13.8%) |
| $50,000 to $74,999 | 5,686 (91.2%) | 549 (8.8%) |
| $75,000 to $99,999 | 4,933 (90.2%) | 536 (9.8%) |
| $100,000 and over | 12,755 (92.2%) | 1,074 (7.8%) |
Public vs Private Health Insurance Coverage by Age in Tupelo
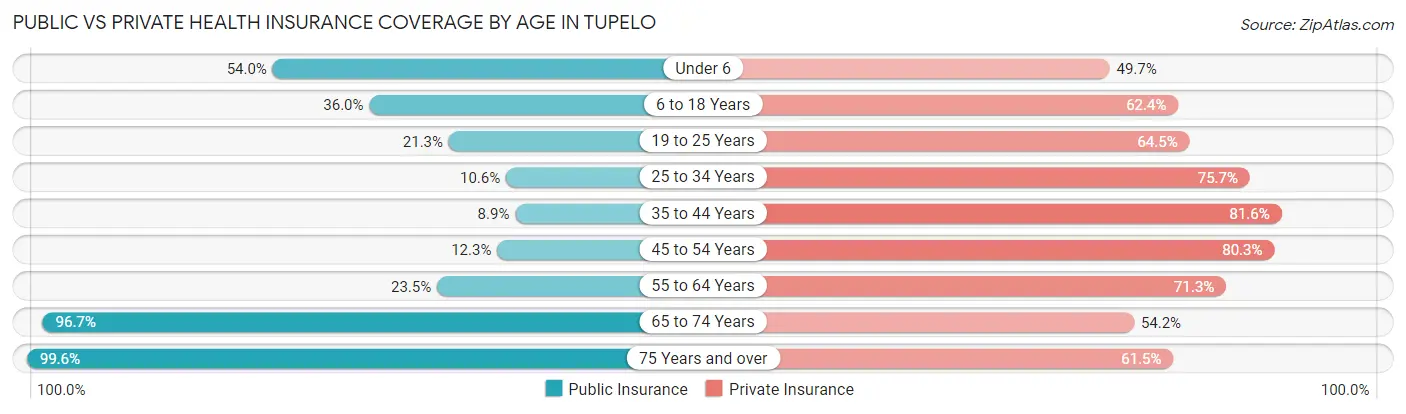
| Age Bracket | Public Insurance | Private Insurance |
| Under 6 | 1,686 (53.9%) | 1,553 (49.7%) |
| 6 to 18 Years | 2,317 (36.0%) | 4,018 (62.4%) |
| 19 to 25 Years | 704 (21.2%) | 2,138 (64.5%) |
| 25 to 34 Years | 467 (10.6%) | 3,324 (75.7%) |
| 35 to 44 Years | 438 (8.9%) | 4,002 (81.6%) |
| 45 to 54 Years | 577 (12.3%) | 3,775 (80.3%) |
| 55 to 64 Years | 1,044 (23.4%) | 3,176 (71.3%) |
| 65 to 74 Years | 2,882 (96.7%) | 1,617 (54.2%) |
| 75 Years and over | 2,654 (99.6%) | 1,640 (61.5%) |
| Total | 12,769 (34.5%) | 25,243 (68.3%) |
Disability Status by Sex by Age in Tupelo
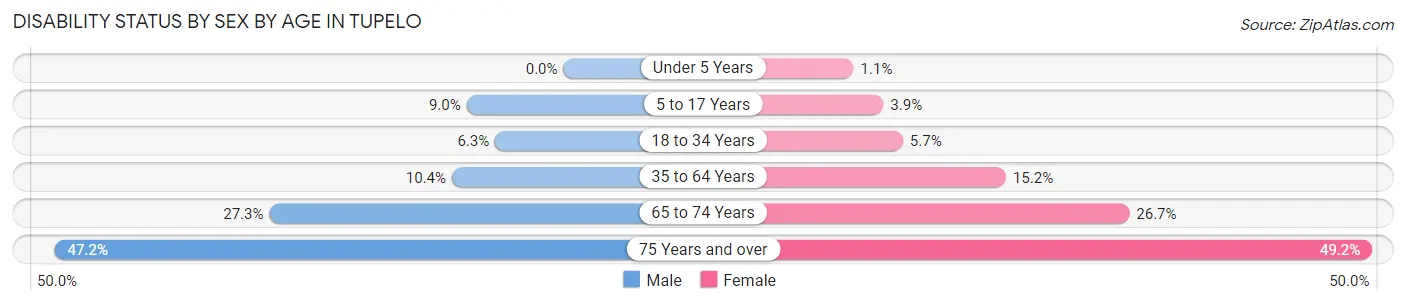
| Age Bracket | Male | Female |
| Under 5 Years | 0 (0.0%) | 15 (1.1%) |
| 5 to 17 Years | 291 (9.0%) | 133 (3.9%) |
| 18 to 34 Years | 229 (6.3%) | 250 (5.7%) |
| 35 to 64 Years | 655 (10.3%) | 1,178 (15.2%) |
| 65 to 74 Years | 363 (27.3%) | 441 (26.7%) |
| 75 Years and over | 485 (47.2%) | 806 (49.2%) |
Disability Class by Sex by Age in Tupelo
Disability Class: Hearing Difficulty
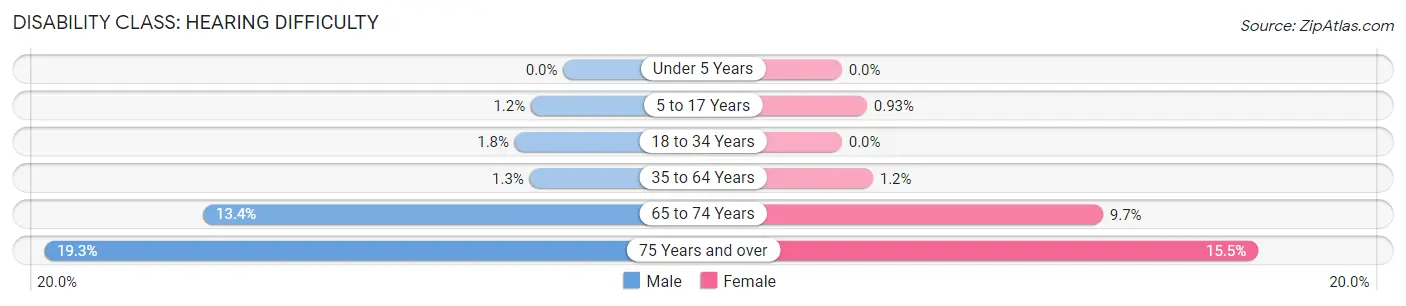
| Age Bracket | Male | Female |
| Under 5 Years | 0 (0.0%) | 0 (0.0%) |
| 5 to 17 Years | 39 (1.2%) | 32 (0.9%) |
| 18 to 34 Years | 65 (1.8%) | 0 (0.0%) |
| 35 to 64 Years | 79 (1.3%) | 89 (1.1%) |
| 65 to 74 Years | 178 (13.4%) | 160 (9.7%) |
| 75 Years and over | 198 (19.3%) | 253 (15.4%) |
Disability Class: Vision Difficulty
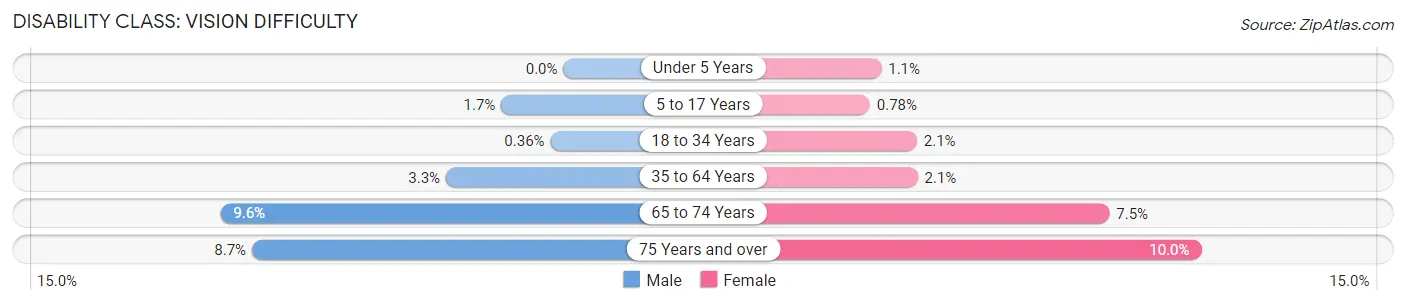
| Age Bracket | Male | Female |
| Under 5 Years | 0 (0.0%) | 15 (1.1%) |
| 5 to 17 Years | 56 (1.7%) | 27 (0.8%) |
| 18 to 34 Years | 13 (0.4%) | 92 (2.1%) |
| 35 to 64 Years | 207 (3.3%) | 163 (2.1%) |
| 65 to 74 Years | 127 (9.6%) | 123 (7.4%) |
| 75 Years and over | 89 (8.7%) | 164 (10.0%) |
Disability Class: Cognitive Difficulty
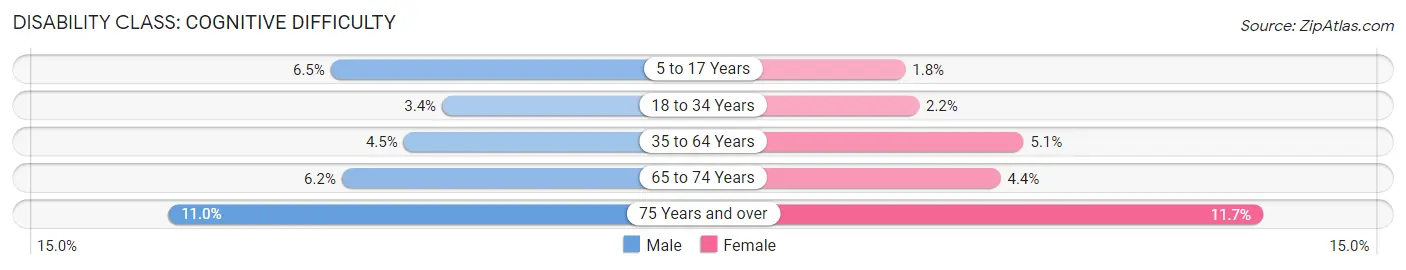
| Age Bracket | Male | Female |
| 5 to 17 Years | 210 (6.5%) | 61 (1.8%) |
| 18 to 34 Years | 122 (3.4%) | 95 (2.1%) |
| 35 to 64 Years | 282 (4.4%) | 391 (5.1%) |
| 65 to 74 Years | 82 (6.2%) | 73 (4.4%) |
| 75 Years and over | 113 (11.0%) | 192 (11.7%) |
Disability Class: Ambulatory Difficulty
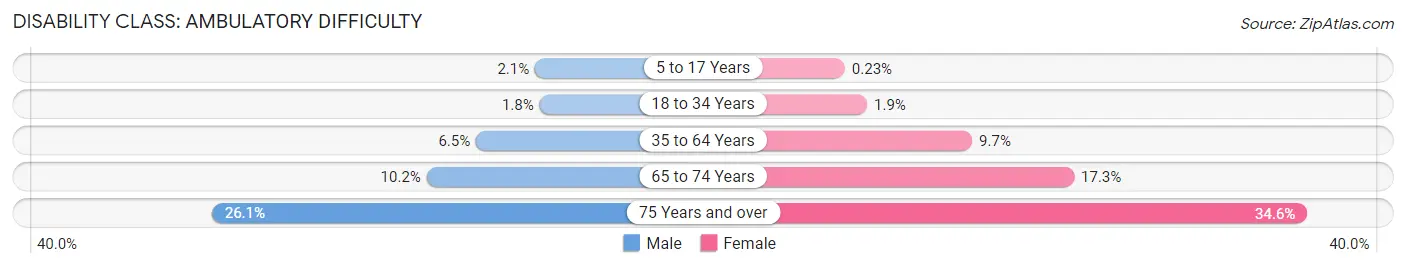
| Age Bracket | Male | Female |
| 5 to 17 Years | 68 (2.1%) | 8 (0.2%) |
| 18 to 34 Years | 64 (1.8%) | 83 (1.9%) |
| 35 to 64 Years | 410 (6.5%) | 748 (9.7%) |
| 65 to 74 Years | 135 (10.2%) | 285 (17.2%) |
| 75 Years and over | 268 (26.1%) | 566 (34.5%) |
Disability Class: Self-Care Difficulty
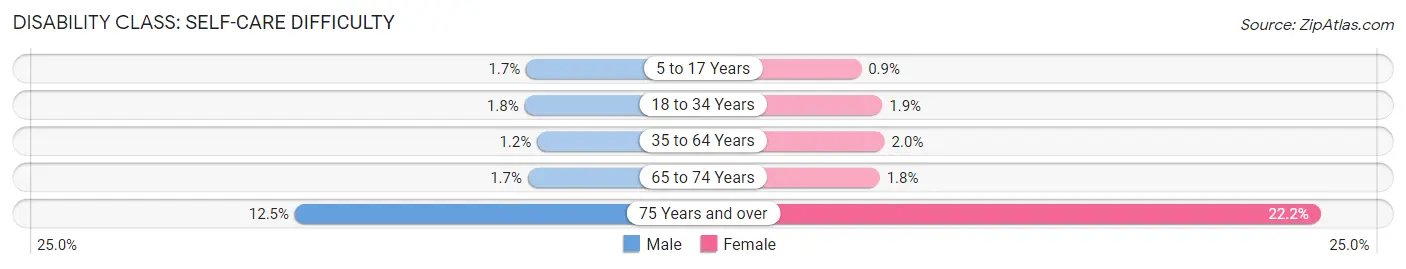
| Age Bracket | Male | Female |
| 5 to 17 Years | 56 (1.7%) | 31 (0.9%) |
| 18 to 34 Years | 65 (1.8%) | 83 (1.9%) |
| 35 to 64 Years | 77 (1.2%) | 154 (2.0%) |
| 65 to 74 Years | 22 (1.7%) | 29 (1.8%) |
| 75 Years and over | 128 (12.5%) | 364 (22.2%) |
Technology Access in Tupelo
Computing Device Access in Tupelo
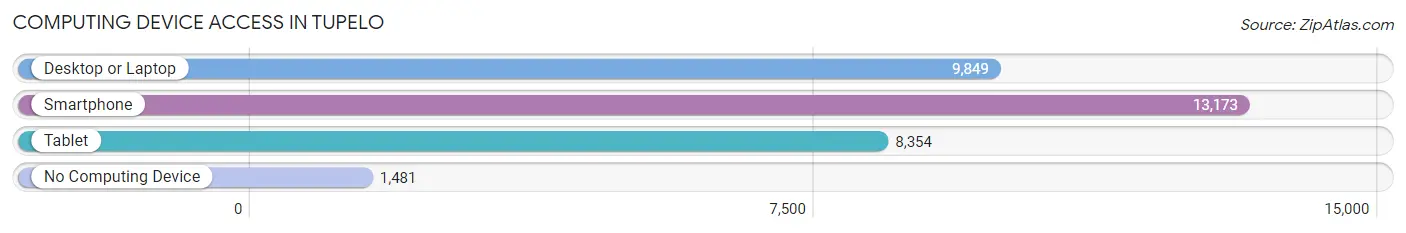
| Device Type | # Households | % Households |
| Desktop or Laptop | 9,849 | 64.4% |
| Smartphone | 13,173 | 86.2% |
| Tablet | 8,354 | 54.7% |
| No Computing Device | 1,481 | 9.7% |
| Total | 15,282 | 100.0% |
Internet Access in Tupelo
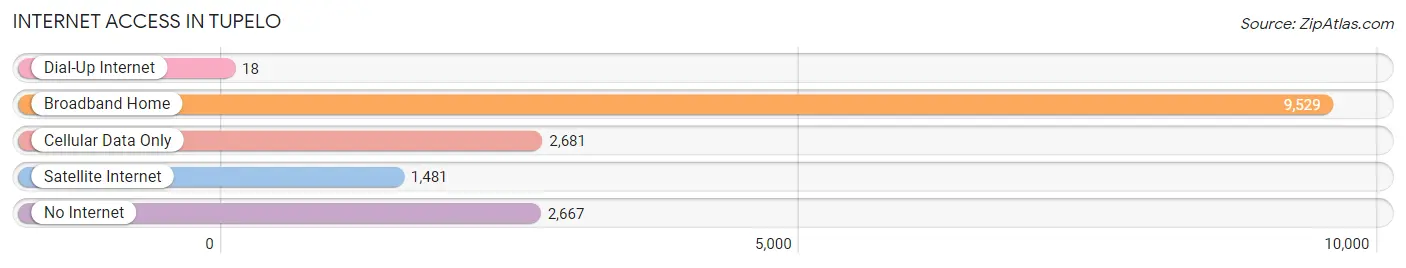
| Internet Type | # Households | % Households |
| Dial-Up Internet | 18 | 0.1% |
| Broadband Home | 9,529 | 62.4% |
| Cellular Data Only | 2,681 | 17.5% |
| Satellite Internet | 1,481 | 9.7% |
| No Internet | 2,667 | 17.4% |
| Total | 15,282 | 100.0% |
Tupelo Summary
Tupelo, Mississippi is a city located in Lee County, Mississippi, United States. It is the county seat of Lee County and the seventh-largest city in the state. The population of Tupelo was 34,546 at the 2010 census, with an estimated population of 38,114 in 2019. Tupelo is the birthplace of Elvis Presley and is the home of the Tupelo Automobile Museum.
History
Tupelo was founded in 1867 by Captain Abner McGehee, a Confederate veteran. The city was named after a creek of the same name, which was named for the tupelo trees that grew along its banks. The city was incorporated in 1870 and became the county seat of Lee County in 1871.
Tupelo was a major center of activity during the Civil War. Confederate forces under General Nathan Bedford Forrest occupied the city in 1862 and 1863. The city was the site of the Battle of Tupelo in 1864, which resulted in a Confederate victory.
Tupelo was also the site of a major tornado in 1936, which killed 216 people and destroyed much of the city. The city was rebuilt and has since become a major industrial center in the region.
Geography
Tupelo is located in northeastern Mississippi, approximately 90 miles southeast of Memphis, Tennessee. The city is situated in the foothills of the Appalachian Mountains and is surrounded by rolling hills and forests. The city is located at the intersection of U.S. Routes 45 and 78.
The city has a total area of 33.2 square miles, of which 33.1 square miles is land and 0.1 square miles is water. The city is located in the Tombigbee River watershed.
Economy
Tupelo is a major industrial center in the region. The city is home to several major employers, including Cooper Tire & Rubber Company, North Mississippi Medical Center, and the Tupelo Furniture Market. The city is also home to several major retail stores, including Walmart, Target, and Lowe's.
The city is also home to several major tourist attractions, including the Elvis Presley Birthplace and Museum, the Tupelo Automobile Museum, and the Tupelo National Battlefield.
Demographics
As of the 2010 census, there were 34,546 people, 13,845 households, and 8,845 families residing in the city. The population density was 1,037.2 people per square mile. The racial makeup of the city was 63.2% White, 34.2% African American, 0.3% Native American, 0.7% Asian, 0.1% Pacific Islander, 0.7% from other races, and 0.9% from two or more races. Hispanic or Latino of any race were 1.7% of the population.
The median income for a household in the city was $35,945, and the median income for a family was $45,945. The per capita income for the city was $20,945. About 17.2% of families and 20.7% of the population were below the poverty line, including 28.3% of those under age 18 and 16.2% of those age 65 or over.
Common Questions
What is Per Capita Income in Tupelo?
Per Capita income in Tupelo is $37,884.
What is the Median Family Income in Tupelo?
Median Family Income in Tupelo is $86,732.
What is the Median Household income in Tupelo?
Median Household Income in Tupelo is $62,686.
What is Income or Wage Gap in Tupelo?
Income or Wage Gap in Tupelo is 37.8%.
Women in Tupelo earn 62.2 cents for every dollar earned by a man.
What is Family Income Deficit in Tupelo?
Family Income Deficit in Tupelo is $8,468.
Families that are below poverty line in Tupelo earn $8,468 less on average than the poverty threshold level.
What is Inequality or Gini Index in Tupelo?
Inequality or Gini Index in Tupelo is 0.50.
What is the Total Population of Tupelo?
Total Population of Tupelo is 37,939.
What is the Total Male Population of Tupelo?
Total Male Population of Tupelo is 17,313.
What is the Total Female Population of Tupelo?
Total Female Population of Tupelo is 20,626.
What is the Ratio of Males per 100 Females in Tupelo?
There are 83.94 Males per 100 Females in Tupelo.
What is the Ratio of Females per 100 Males in Tupelo?
There are 119.14 Females per 100 Males in Tupelo.
What is the Median Population Age in Tupelo?
Median Population Age in Tupelo is 38.3 Years.
What is the Average Family Size in Tupelo
Average Family Size in Tupelo is 3.1 People.
What is the Average Household Size in Tupelo
Average Household Size in Tupelo is 2.4 People.
How Large is the Labor Force in Tupelo?
There are 19,063 People in the Labor Forcein in Tupelo.
What is the Percentage of People in the Labor Force in Tupelo?
64.0% of People are in the Labor Force in Tupelo.
What is the Unemployment Rate in Tupelo?
Unemployment Rate in Tupelo is 5.1%.