Collinsville, MS Map & Demographics
Collinsville Map
Collinsville Overview
$34,864
PER CAPITA INCOME
$84,914
AVG FAMILY INCOME
$72,574
AVG HOUSEHOLD INCOME
21.4%
WAGE / INCOME GAP [ % ]
78.6¢/ $1
WAGE / INCOME GAP [ $ ]
0.46
INEQUALITY / GINI INDEX
1,783
TOTAL POPULATION
791
MALE POPULATION
992
FEMALE POPULATION
79.74
MALES / 100 FEMALES
125.41
FEMALES / 100 MALES
55.9
MEDIAN AGE
2.7
AVG FAMILY SIZE
2.2
AVG HOUSEHOLD SIZE
825
LABOR FORCE [ PEOPLE ]
49.2%
PERCENT IN LABOR FORCE
Collinsville Zip Codes
Income in Collinsville
Income Overview in Collinsville
Per Capita Income in Collinsville is $34,864, while median incomes of families and households are $84,914 and $72,574 respectively.
| Characteristic | Number | Measure |
| Per Capita Income | 1,783 | $34,864 |
| Median Family Income | 584 | $84,914 |
| Mean Family Income | 584 | $99,302 |
| Median Household Income | 814 | $72,574 |
| Mean Household Income | 814 | $78,069 |
| Income Deficit | 584 | $0 |
| Wage / Income Gap (%) | 1,783 | 21.38% |
| Wage / Income Gap ($) | 1,783 | 78.62¢ per $1 |
| Gini / Inequality Index | 1,783 | 0.46 |
Earnings by Sex in Collinsville
Average Earnings in Collinsville are $39,397, $48,469 for men and $38,104 for women, a difference of 21.4%.
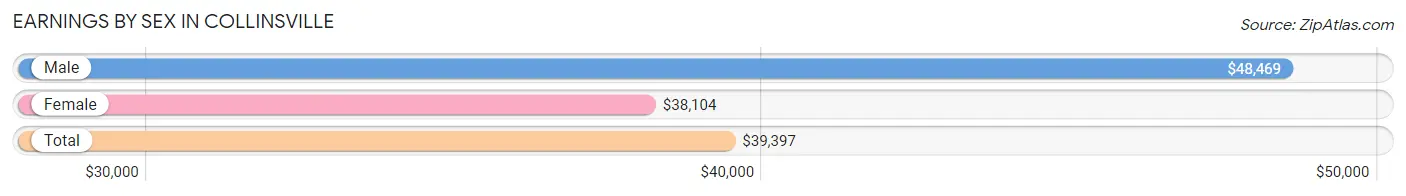
| Sex | Number | Average Earnings |
| Male | 423 (44.9%) | $48,469 |
| Female | 520 (55.1%) | $38,104 |
| Total | 943 (100.0%) | $39,397 |
Earnings by Sex by Income Bracket in Collinsville
The most common earnings brackets in Collinsville are $100,000+ for men (118 | 27.9%) and $35,000 to $39,999 for women (179 | 34.4%).
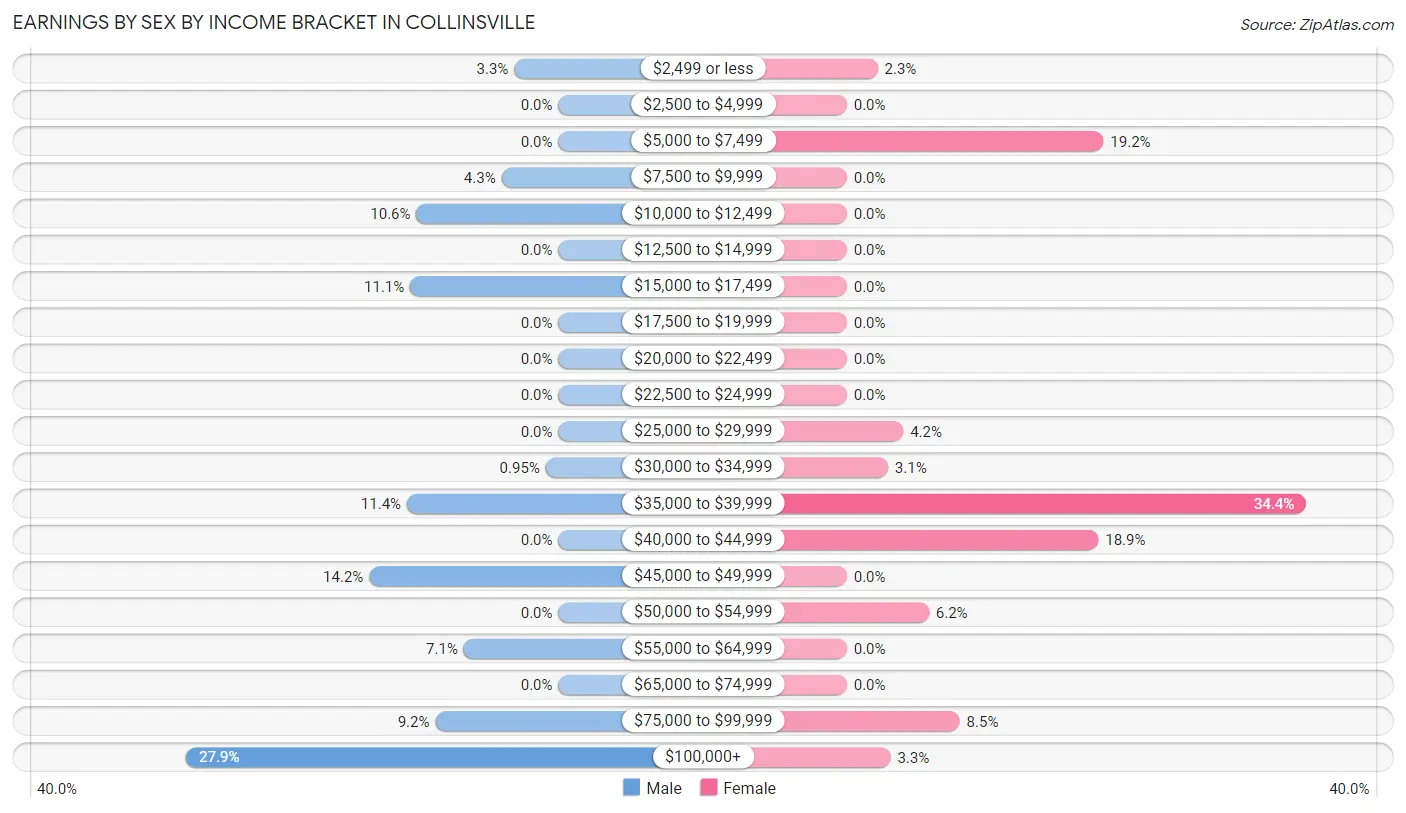
| Income | Male | Female |
| $2,499 or less | 14 (3.3%) | 12 (2.3%) |
| $2,500 to $4,999 | 0 (0.0%) | 0 (0.0%) |
| $5,000 to $7,499 | 0 (0.0%) | 100 (19.2%) |
| $7,500 to $9,999 | 18 (4.3%) | 0 (0.0%) |
| $10,000 to $12,499 | 45 (10.6%) | 0 (0.0%) |
| $12,500 to $14,999 | 0 (0.0%) | 0 (0.0%) |
| $15,000 to $17,499 | 47 (11.1%) | 0 (0.0%) |
| $17,500 to $19,999 | 0 (0.0%) | 0 (0.0%) |
| $20,000 to $22,499 | 0 (0.0%) | 0 (0.0%) |
| $22,500 to $24,999 | 0 (0.0%) | 0 (0.0%) |
| $25,000 to $29,999 | 0 (0.0%) | 22 (4.2%) |
| $30,000 to $34,999 | 4 (0.9%) | 16 (3.1%) |
| $35,000 to $39,999 | 48 (11.4%) | 179 (34.4%) |
| $40,000 to $44,999 | 0 (0.0%) | 98 (18.9%) |
| $45,000 to $49,999 | 60 (14.2%) | 0 (0.0%) |
| $50,000 to $54,999 | 0 (0.0%) | 32 (6.1%) |
| $55,000 to $64,999 | 30 (7.1%) | 0 (0.0%) |
| $65,000 to $74,999 | 0 (0.0%) | 0 (0.0%) |
| $75,000 to $99,999 | 39 (9.2%) | 44 (8.5%) |
| $100,000+ | 118 (27.9%) | 17 (3.3%) |
| Total | 423 (100.0%) | 520 (100.0%) |
Earnings by Sex by Educational Attainment in Collinsville
Average earnings in Collinsville are $56,442 for men and $38,214 for women, a difference of 32.3%. Men with an educational attainment of college or associate's degree enjoy the highest average annual earnings of $56,635, while those with high school diploma education earn the least with $48,103. Women with an educational attainment of bachelor's degree earn the most with the average annual earnings of $41,382, while those with bachelor's degree education have the smallest earnings of $41,382.
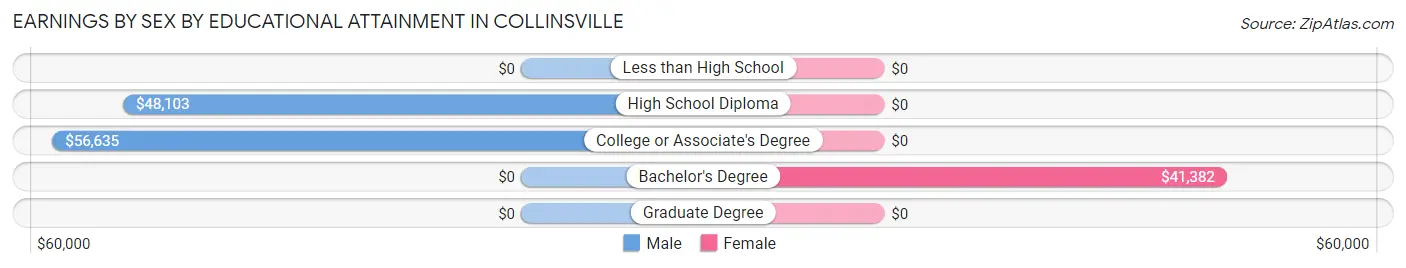
| Educational Attainment | Male Income | Female Income |
| Less than High School | - | - |
| High School Diploma | $48,103 | $0 |
| College or Associate's Degree | $56,635 | $0 |
| Bachelor's Degree | - | - |
| Graduate Degree | - | - |
| Total | $56,442 | $38,214 |
Family Income in Collinsville
Family Income Brackets in Collinsville
According to the Collinsville family income data, there are 139 families falling into the $100,000 to $149,999 income range, which is the most common income bracket and makes up 23.8% of all families. Conversely, the $25,000 to $34,999 income bracket is the least frequent group with only 10 families (1.7%) belonging to this category.
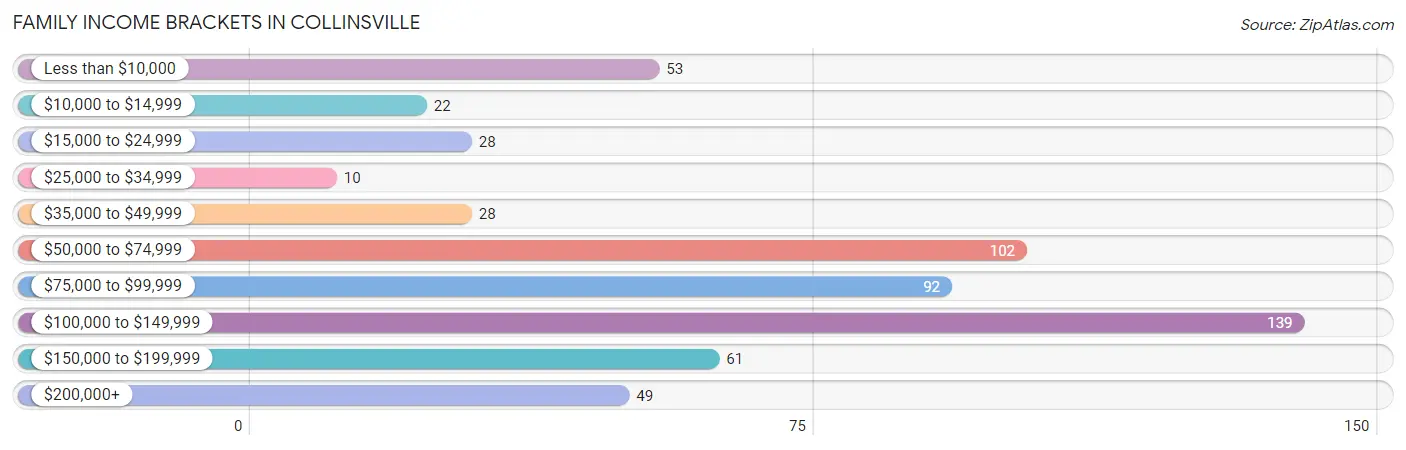
| Income Bracket | # Families | % Families |
| Less than $10,000 | 53 | 9.1% |
| $10,000 to $14,999 | 22 | 3.8% |
| $15,000 to $24,999 | 28 | 4.8% |
| $25,000 to $34,999 | 10 | 1.7% |
| $35,000 to $49,999 | 28 | 4.8% |
| $50,000 to $74,999 | 102 | 17.5% |
| $75,000 to $99,999 | 92 | 15.8% |
| $100,000 to $149,999 | 139 | 23.8% |
| $150,000 to $199,999 | 61 | 10.4% |
| $200,000+ | 49 | 8.4% |
Family Income by Famaliy Size in Collinsville
4-person families (63 | 10.8%) account for the highest median family income in Collinsville with $235,313 per family, while 4-person families (63 | 10.8%) have the highest median income of $58,828 per family member.
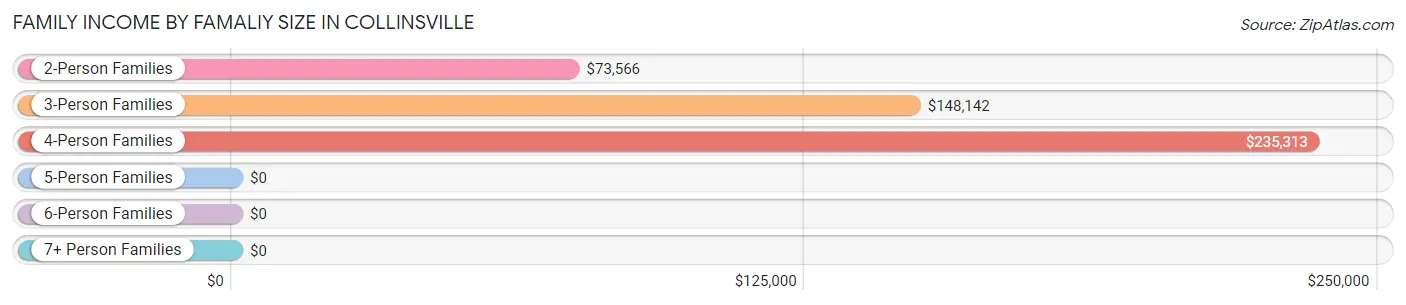
| Income Bracket | # Families | Median Income |
| 2-Person Families | 408 (69.9%) | $73,566 |
| 3-Person Families | 77 (13.2%) | $148,142 |
| 4-Person Families | 63 (10.8%) | $235,313 |
| 5-Person Families | 0 (0.0%) | $0 |
| 6-Person Families | 0 (0.0%) | $0 |
| 7+ Person Families | 36 (6.2%) | $0 |
| Total | 584 (100.0%) | $84,914 |
Family Income by Number of Earners in Collinsville
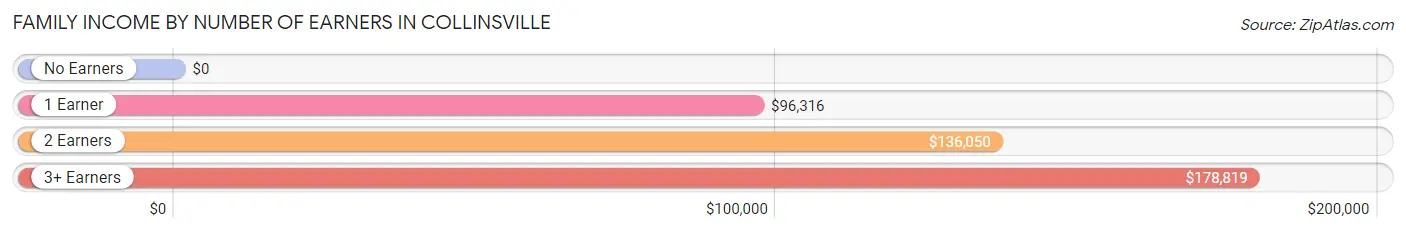
| Number of Earners | # Families | Median Income |
| No Earners | 205 (35.1%) | $0 |
| 1 Earner | 116 (19.9%) | $96,316 |
| 2 Earners | 203 (34.8%) | $136,050 |
| 3+ Earners | 60 (10.3%) | $178,819 |
| Total | 584 (100.0%) | $84,914 |
Household Income in Collinsville
Household Income Brackets in Collinsville
With 148 households falling in the category, the $10,000 to $14,999 income range is the most frequent in Collinsville, accounting for 18.2% of all households. In contrast, only 19 households (2.3%) fall into the $25,000 to $34,999 income bracket, making it the least populous group.
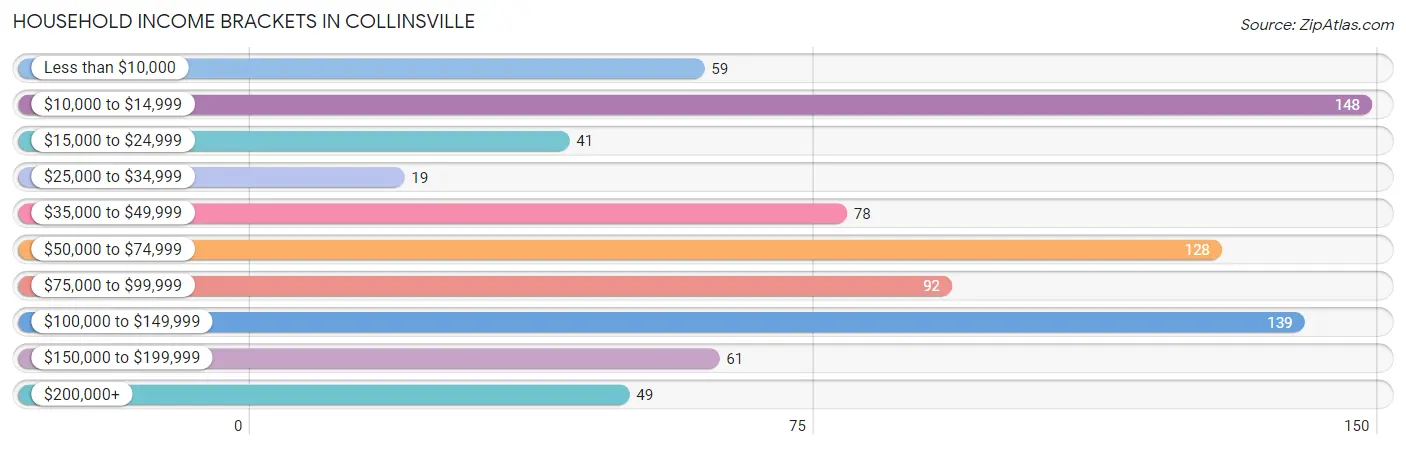
| Income Bracket | # Households | % Households |
| Less than $10,000 | 59 | 7.2% |
| $10,000 to $14,999 | 148 | 18.2% |
| $15,000 to $24,999 | 41 | 5.0% |
| $25,000 to $34,999 | 19 | 2.3% |
| $35,000 to $49,999 | 78 | 9.6% |
| $50,000 to $74,999 | 128 | 15.7% |
| $75,000 to $99,999 | 92 | 11.3% |
| $100,000 to $149,999 | 139 | 17.1% |
| $150,000 to $199,999 | 61 | 7.5% |
| $200,000+ | 49 | 6.0% |
Household Income by Householder Age in Collinsville
The median household income in Collinsville is $72,574, with the highest median household income of $235,139 found in the 25 to 44 years age bracket for the primary householder. A total of 68 households (8.4%) fall into this category.
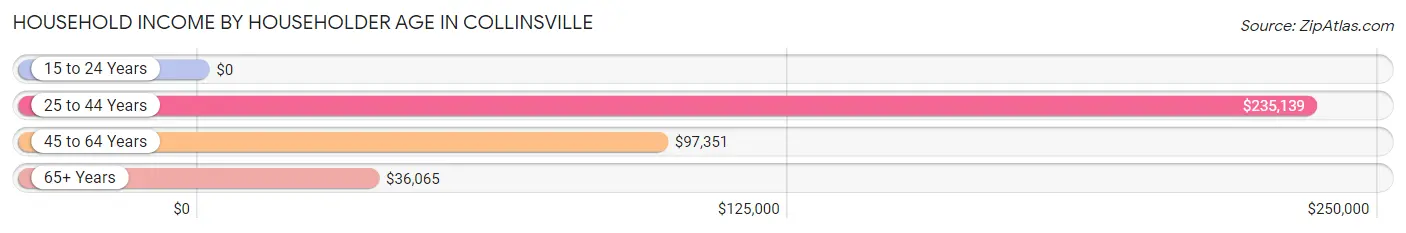
| Income Bracket | # Households | Median Income |
| 15 to 24 Years | 0 (0.0%) | $0 |
| 25 to 44 Years | 68 (8.4%) | $235,139 |
| 45 to 64 Years | 319 (39.2%) | $97,351 |
| 65+ Years | 427 (52.5%) | $36,065 |
| Total | 814 (100.0%) | $72,574 |
Poverty in Collinsville
Income Below Poverty by Sex and Age in Collinsville
With 5.7% poverty level for males and 25.8% for females among the residents of Collinsville, 75 year old and over males and 65 to 74 year old females are the most vulnerable to poverty, with 12 males (19.7%) and 141 females (62.4%) in their respective age groups living below the poverty level.
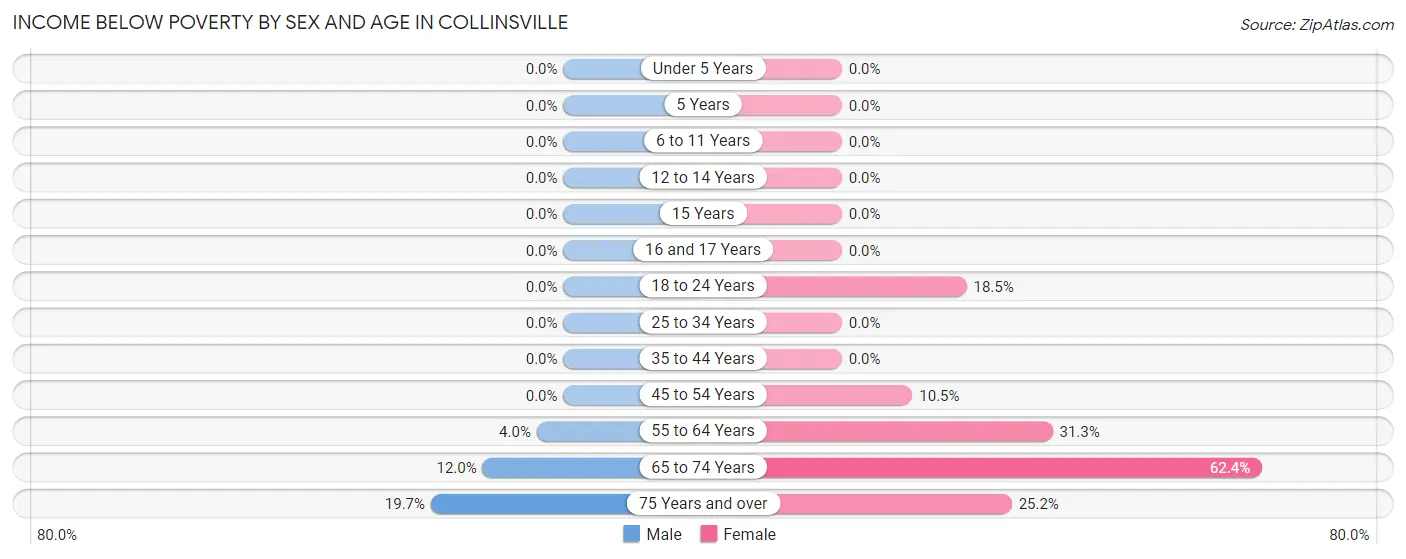
| Age Bracket | Male | Female |
| Under 5 Years | 0 (0.0%) | 0 (0.0%) |
| 5 Years | 0 (0.0%) | 0 (0.0%) |
| 6 to 11 Years | 0 (0.0%) | 0 (0.0%) |
| 12 to 14 Years | 0 (0.0%) | 0 (0.0%) |
| 15 Years | 0 (0.0%) | 0 (0.0%) |
| 16 and 17 Years | 0 (0.0%) | 0 (0.0%) |
| 18 to 24 Years | 0 (0.0%) | 20 (18.5%) |
| 25 to 34 Years | 0 (0.0%) | 0 (0.0%) |
| 35 to 44 Years | 0 (0.0%) | 0 (0.0%) |
| 45 to 54 Years | 0 (0.0%) | 22 (10.5%) |
| 55 to 64 Years | 6 (4.0%) | 46 (31.3%) |
| 65 to 74 Years | 27 (12.0%) | 141 (62.4%) |
| 75 Years and over | 12 (19.7%) | 27 (25.2%) |
| Total | 45 (5.7%) | 256 (25.8%) |
Income Above Poverty by Sex and Age in Collinsville
According to the poverty statistics in Collinsville, males aged 15 years and females aged 12 to 14 years are the age groups that are most secure financially, with 100.0% of males and 100.0% of females in these age groups living above the poverty line.
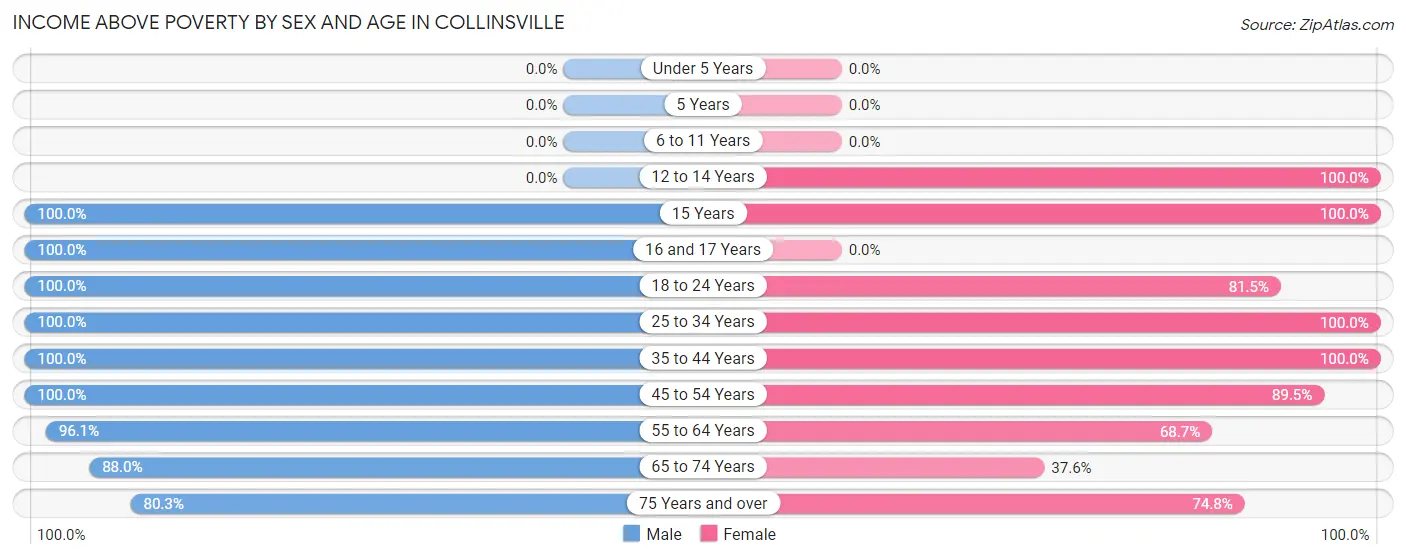
| Age Bracket | Male | Female |
| Under 5 Years | 0 (0.0%) | 0 (0.0%) |
| 5 Years | 0 (0.0%) | 0 (0.0%) |
| 6 to 11 Years | 0 (0.0%) | 0 (0.0%) |
| 12 to 14 Years | 0 (0.0%) | 42 (100.0%) |
| 15 Years | 30 (100.0%) | 34 (100.0%) |
| 16 and 17 Years | 14 (100.0%) | 0 (0.0%) |
| 18 to 24 Years | 65 (100.0%) | 88 (81.5%) |
| 25 to 34 Years | 21 (100.0%) | 58 (100.0%) |
| 35 to 44 Years | 47 (100.0%) | 60 (100.0%) |
| 45 to 54 Years | 176 (100.0%) | 188 (89.5%) |
| 55 to 64 Years | 146 (96.1%) | 101 (68.7%) |
| 65 to 74 Years | 198 (88.0%) | 85 (37.6%) |
| 75 Years and over | 49 (80.3%) | 80 (74.8%) |
| Total | 746 (94.3%) | 736 (74.2%) |
Income Below Poverty Among Married-Couple Families in Collinsville
The poverty statistics for married-couple families in Collinsville show that 10.3% or 53 of the total 513 families live below the poverty line. Families with no children have the highest poverty rate of 12.6%, comprising of 53 families. On the other hand, families with 1 or 2 children have the lowest poverty rate of 0.0%, which includes 0 families.
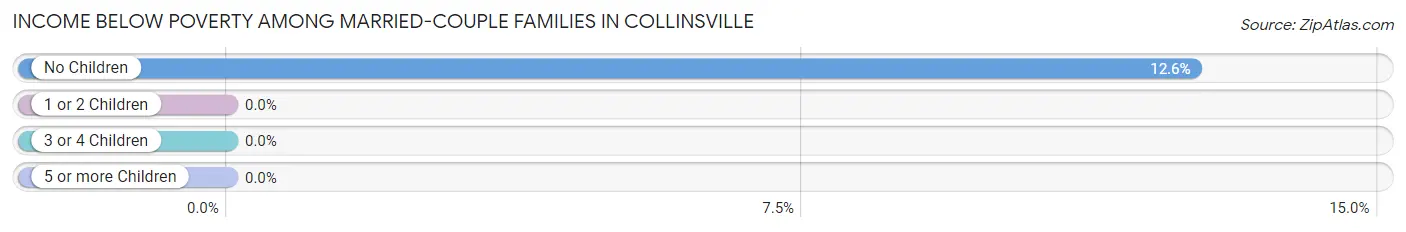
| Children | Above Poverty | Below Poverty |
| No Children | 368 (87.4%) | 53 (12.6%) |
| 1 or 2 Children | 92 (100.0%) | 0 (0.0%) |
| 3 or 4 Children | 0 (0.0%) | 0 (0.0%) |
| 5 or more Children | 0 (0.0%) | 0 (0.0%) |
| Total | 460 (89.7%) | 53 (10.3%) |
Income Below Poverty Among Single-Parent Households in Collinsville
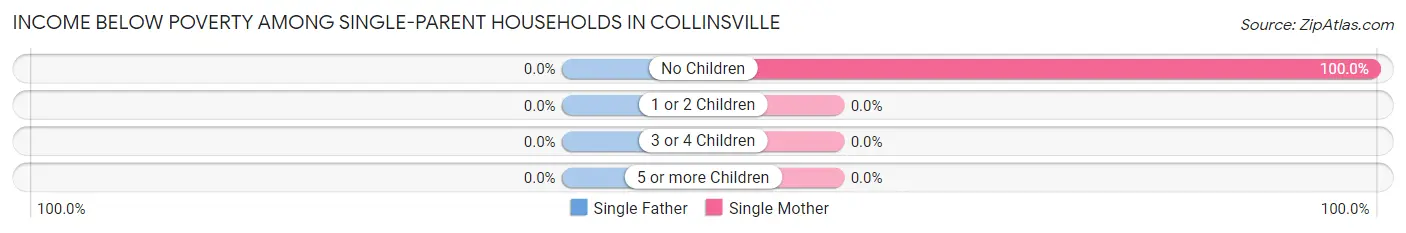
| Children | Single Father | Single Mother |
| No Children | 0 (0.0%) | 37 (100.0%) |
| 1 or 2 Children | 0 (0.0%) | 0 (0.0%) |
| 3 or 4 Children | 0 (0.0%) | 0 (0.0%) |
| 5 or more Children | 0 (0.0%) | 0 (0.0%) |
| Total | 0 (0.0%) | 37 (100.0%) |
Income Below Poverty Among Married-Couple vs Single-Parent Households in Collinsville
The poverty data for Collinsville shows that 53 of the married-couple family households (10.3%) and 37 of the single-parent households (52.1%) are living below the poverty level. Within the married-couple family households, those with no children have the highest poverty rate, with 53 households (12.6%) falling below the poverty line. Among the single-parent households, those with no children have the highest poverty rate, with 37 household (52.1%) living below poverty.
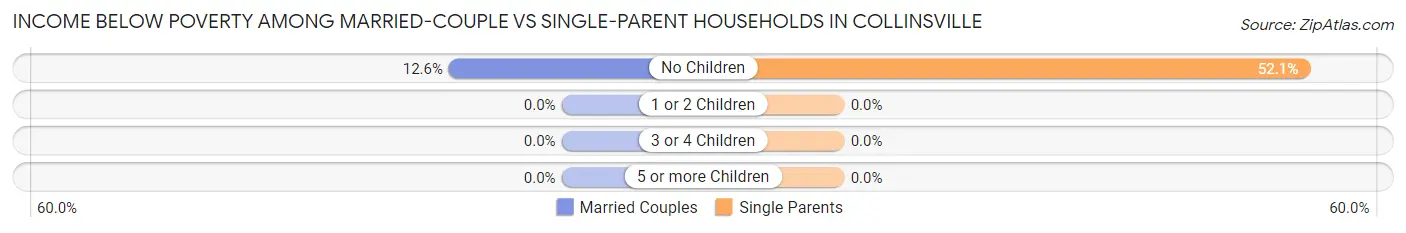
| Children | Married-Couple Families | Single-Parent Households |
| No Children | 53 (12.6%) | 37 (52.1%) |
| 1 or 2 Children | 0 (0.0%) | 0 (0.0%) |
| 3 or 4 Children | 0 (0.0%) | 0 (0.0%) |
| 5 or more Children | 0 (0.0%) | 0 (0.0%) |
| Total | 53 (10.3%) | 37 (52.1%) |
Race in Collinsville
The most populous races in Collinsville are White / Caucasian (1,474 | 82.7%), Black / African American (288 | 16.2%), and Asian (14 | 0.8%).
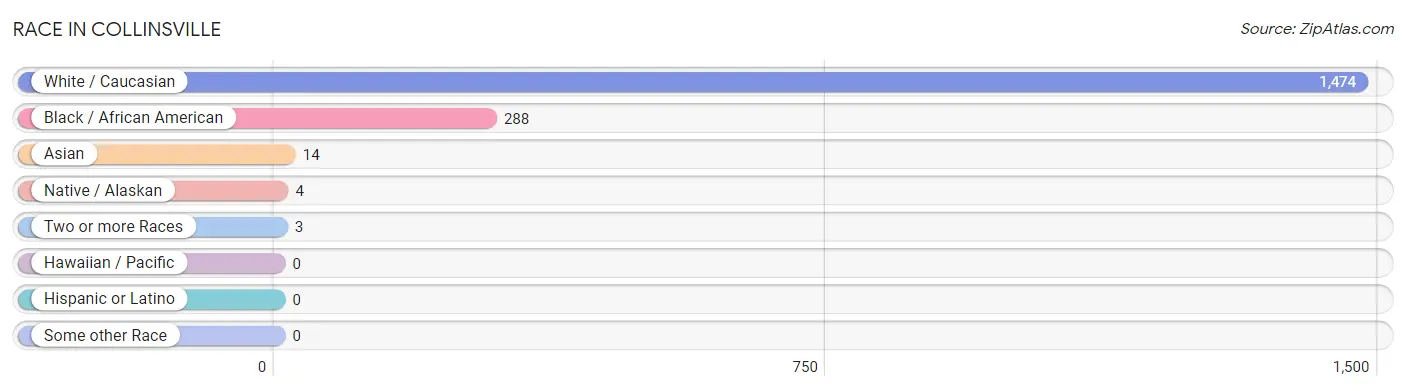
| Race | # Population | % Population |
| Asian | 14 | 0.8% |
| Black / African American | 288 | 16.2% |
| Hawaiian / Pacific | 0 | 0.0% |
| Hispanic or Latino | 0 | 0.0% |
| Native / Alaskan | 4 | 0.2% |
| White / Caucasian | 1,474 | 82.7% |
| Two or more Races | 3 | 0.2% |
| Some other Race | 0 | 0.0% |
| Total | 1,783 | 100.0% |
Ancestry in Collinsville
The most populous ancestries reported in Collinsville are American (125 | 7.0%), English (100 | 5.6%), Irish (89 | 5.0%), Italian (68 | 3.8%), and French (32 | 1.8%), together accounting for 23.2% of all Collinsville residents.
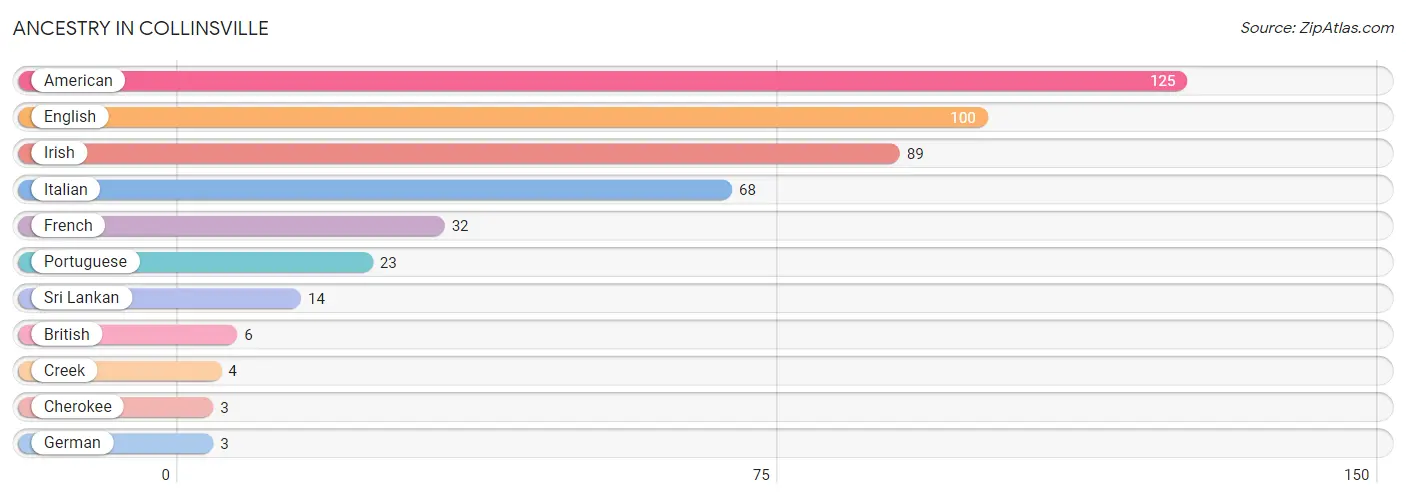
| Ancestry | # Population | % Population |
| American | 125 | 7.0% |
| British | 6 | 0.3% |
| Cherokee | 3 | 0.2% |
| Creek | 4 | 0.2% |
| English | 100 | 5.6% |
| French | 32 | 1.8% |
| German | 3 | 0.2% |
| Irish | 89 | 5.0% |
| Italian | 68 | 3.8% |
| Portuguese | 23 | 1.3% |
| Sri Lankan | 14 | 0.8% | View All 11 Rows |
Immigrants in Collinsville
The most numerous immigrant groups reported in Collinsville came from Asia (14 | 0.8%), South Eastern Asia (14 | 0.8%), and Vietnam (14 | 0.8%), together accounting for 2.4% of all Collinsville residents.
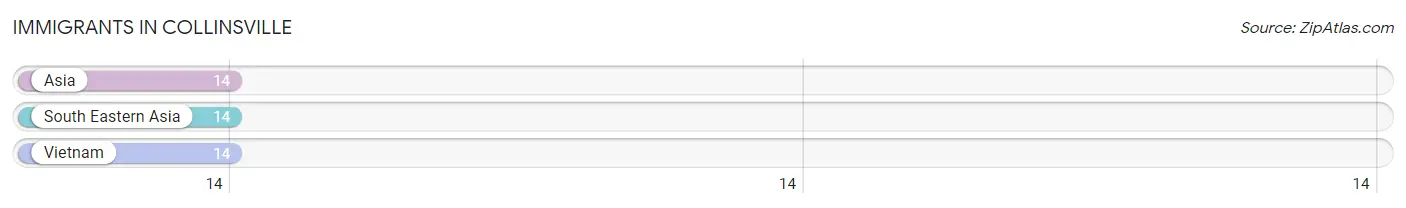
| Immigration Origin | # Population | % Population |
| Asia | 14 | 0.8% |
| South Eastern Asia | 14 | 0.8% |
| Vietnam | 14 | 0.8% | View All 3 Rows |
Sex and Age in Collinsville
Sex and Age in Collinsville
The most populous age groups in Collinsville are 70 to 74 Years (145 | 18.3%) for men and 65 to 69 Years (125 | 12.6%) for women.
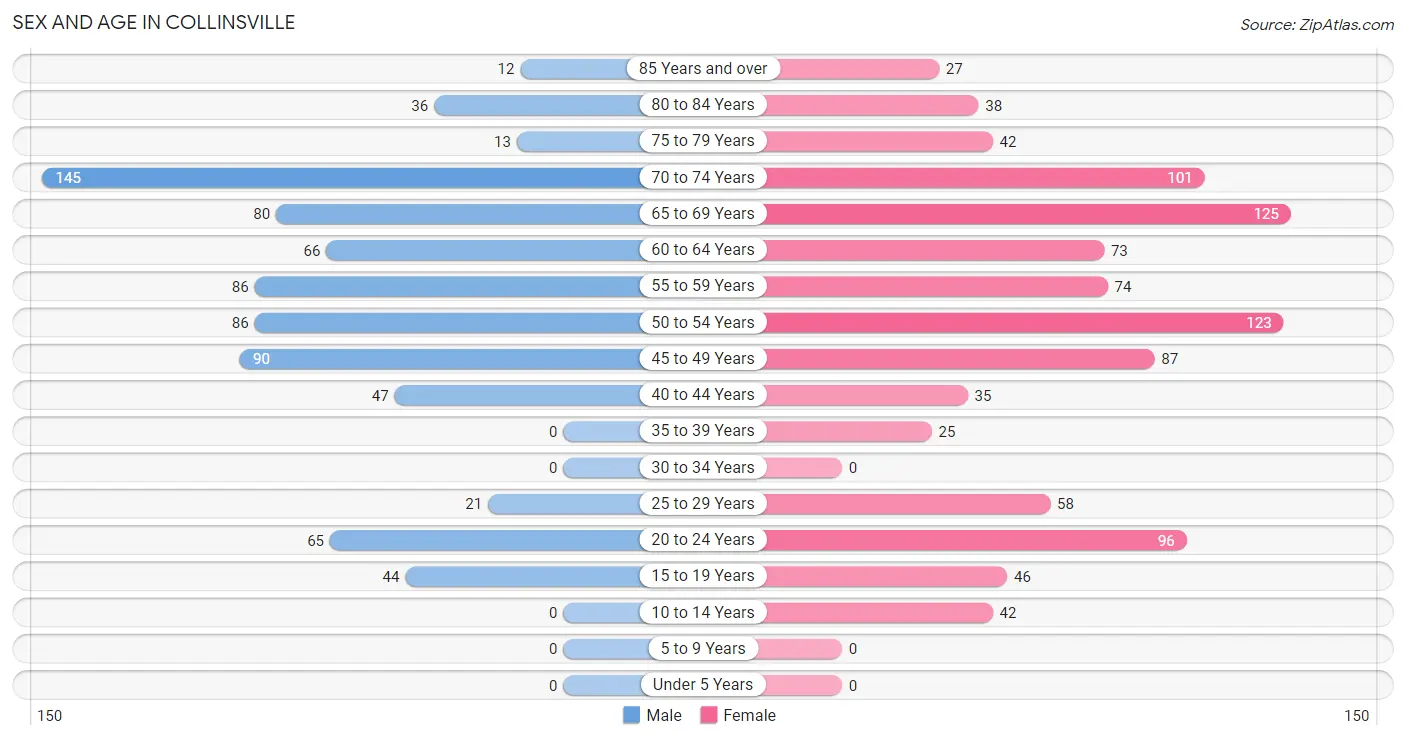
| Age Bracket | Male | Female |
| Under 5 Years | 0 (0.0%) | 0 (0.0%) |
| 5 to 9 Years | 0 (0.0%) | 0 (0.0%) |
| 10 to 14 Years | 0 (0.0%) | 42 (4.2%) |
| 15 to 19 Years | 44 (5.6%) | 46 (4.6%) |
| 20 to 24 Years | 65 (8.2%) | 96 (9.7%) |
| 25 to 29 Years | 21 (2.6%) | 58 (5.9%) |
| 30 to 34 Years | 0 (0.0%) | 0 (0.0%) |
| 35 to 39 Years | 0 (0.0%) | 25 (2.5%) |
| 40 to 44 Years | 47 (5.9%) | 35 (3.5%) |
| 45 to 49 Years | 90 (11.4%) | 87 (8.8%) |
| 50 to 54 Years | 86 (10.9%) | 123 (12.4%) |
| 55 to 59 Years | 86 (10.9%) | 74 (7.5%) |
| 60 to 64 Years | 66 (8.3%) | 73 (7.4%) |
| 65 to 69 Years | 80 (10.1%) | 125 (12.6%) |
| 70 to 74 Years | 145 (18.3%) | 101 (10.2%) |
| 75 to 79 Years | 13 (1.6%) | 42 (4.2%) |
| 80 to 84 Years | 36 (4.5%) | 38 (3.8%) |
| 85 Years and over | 12 (1.5%) | 27 (2.7%) |
| Total | 791 (100.0%) | 992 (100.0%) |
Families and Households in Collinsville
Median Family Size in Collinsville
The median family size in Collinsville is 2.66 persons per family, with married-couple families (513 | 87.8%) accounting for the largest median family size of 2.73 persons per family. On the other hand, single male/father families (34 | 5.8%) represent the smallest median family size with 2.12 persons per family.
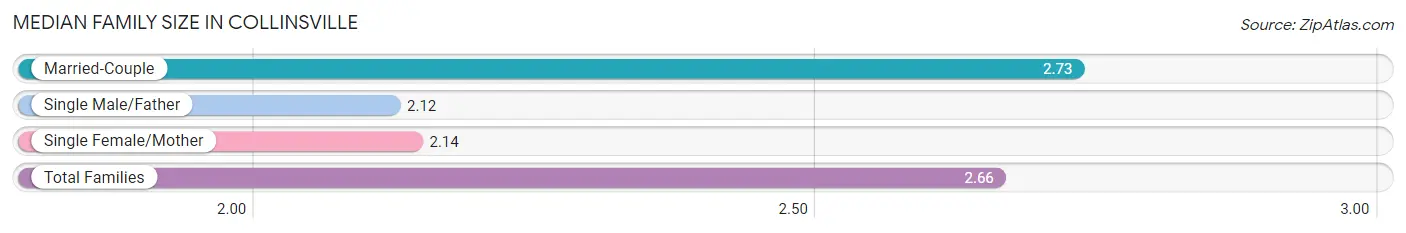
| Family Type | # Families | Family Size |
| Married-Couple | 513 (87.8%) | 2.73 |
| Single Male/Father | 34 (5.8%) | 2.12 |
| Single Female/Mother | 37 (6.3%) | 2.14 |
| Total Families | 584 (100.0%) | 2.66 |
Median Household Size in Collinsville
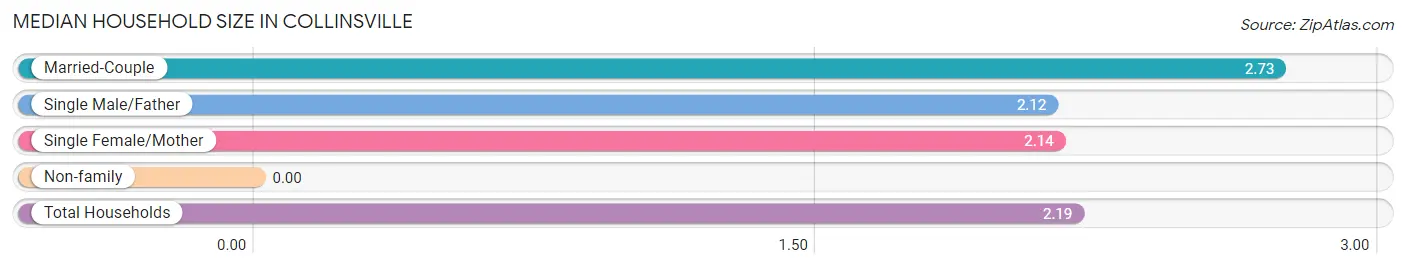
| Household Type | # Households | Household Size |
| Married-Couple | 513 (63.0%) | 2.73 |
| Single Male/Father | 34 (4.2%) | 2.12 |
| Single Female/Mother | 37 (4.5%) | 2.14 |
| Non-family | 230 (28.3%) | - |
| Total Households | 814 (100.0%) | 2.19 |
Household Size by Marriage Status in Collinsville
Out of a total of 814 households in Collinsville, 584 (71.7%) are family households, while 230 (28.3%) are nonfamily households. The most numerous type of family households are 2-person households, comprising 408, and the most common type of nonfamily households are 1-person households, comprising 230.
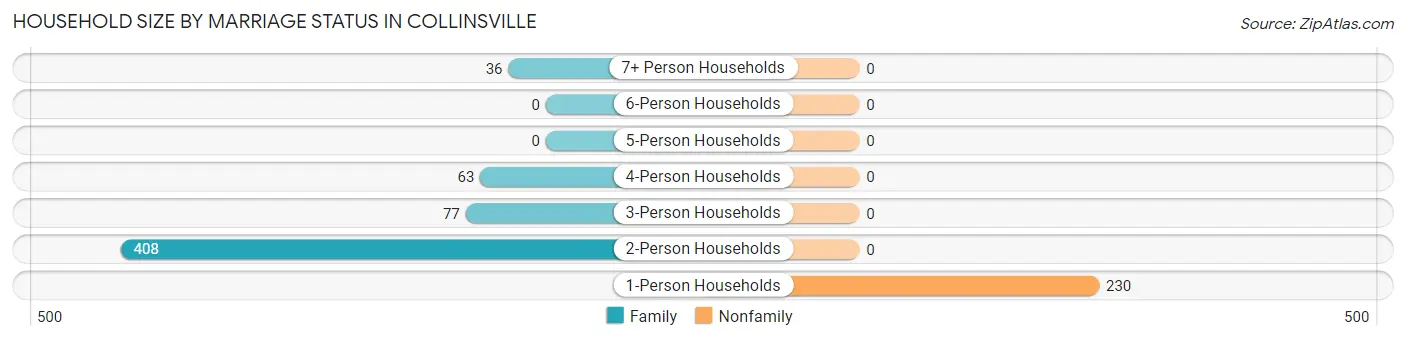
| Household Size | Family Households | Nonfamily Households |
| 1-Person Households | - | 230 (28.3%) |
| 2-Person Households | 408 (50.1%) | 0 (0.0%) |
| 3-Person Households | 77 (9.5%) | 0 (0.0%) |
| 4-Person Households | 63 (7.7%) | 0 (0.0%) |
| 5-Person Households | 0 (0.0%) | 0 (0.0%) |
| 6-Person Households | 0 (0.0%) | 0 (0.0%) |
| 7+ Person Households | 36 (4.4%) | 0 (0.0%) |
| Total | 584 (71.7%) | 230 (28.3%) |
Female Fertility in Collinsville
Fertility by Age in Collinsville
| Age Bracket | Women with Births | Births / 1,000 Women |
| 15 to 19 years | 0 (0.0%) | 0.0 |
| 20 to 34 years | 0 (0.0%) | 0.0 |
| 35 to 50 years | 0 (0.0%) | 0.0 |
| Total | 0 (0.0%) | 0.0 |
Fertility by Age by Marriage Status in Collinsville
| Age Bracket | Married | Unmarried |
| 15 to 19 years | 0 (0.0%) | 0 (0.0%) |
| 20 to 34 years | 0 (0.0%) | 0 (0.0%) |
| 35 to 50 years | 0 (0.0%) | 0 (0.0%) |
| Total | 0 (0.0%) | 0 (0.0%) |
Fertility by Education in Collinsville
| Educational Attainment | Women with Births | Births / 1,000 Women |
| Less than High School | 0 (0.0%) | 0.0 |
| High School Diploma | 0 (0.0%) | 0.0 |
| College or Associate's Degree | 0 (0.0%) | 0.0 |
| Bachelor's Degree | 0 (0.0%) | 0.0 |
| Graduate Degree | 0 (0.0%) | 0.0 |
| Total | 0 (0.0%) | 0.0 |
Fertility by Education by Marriage Status in Collinsville
| Educational Attainment | Married | Unmarried |
| Less than High School | 0 (0.0%) | 0 (0.0%) |
| High School Diploma | 0 (0.0%) | 0 (0.0%) |
| College or Associate's Degree | 0 (0.0%) | 0 (0.0%) |
| Bachelor's Degree | 0 (0.0%) | 0 (0.0%) |
| Graduate Degree | 0 (0.0%) | 0 (0.0%) |
| Total | 0 (0.0%) | 0 (0.0%) |
Employment Characteristics in Collinsville
Employment by Class of Employer in Collinsville
Among the 825 employed individuals in Collinsville, private company employees (355 | 43.0%), state government employees (130 | 15.8%), and self-employed (incorporated) (101 | 12.2%) make up the most common classes of employment.
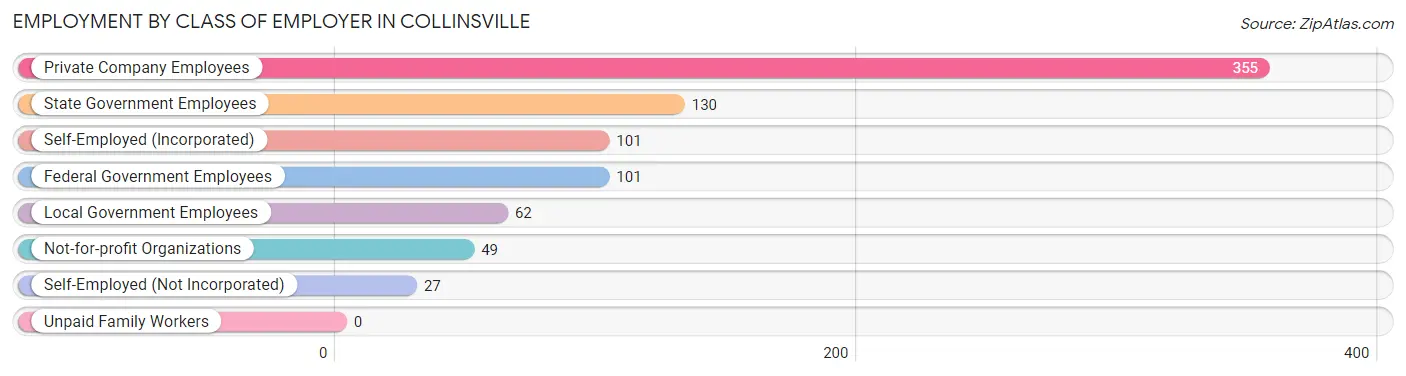
| Employer Class | # Employees | % Employees |
| Private Company Employees | 355 | 43.0% |
| Self-Employed (Incorporated) | 101 | 12.2% |
| Self-Employed (Not Incorporated) | 27 | 3.3% |
| Not-for-profit Organizations | 49 | 5.9% |
| Local Government Employees | 62 | 7.5% |
| State Government Employees | 130 | 15.8% |
| Federal Government Employees | 101 | 12.2% |
| Unpaid Family Workers | 0 | 0.0% |
| Total | 825 | 100.0% |
Employment Status by Age in Collinsville
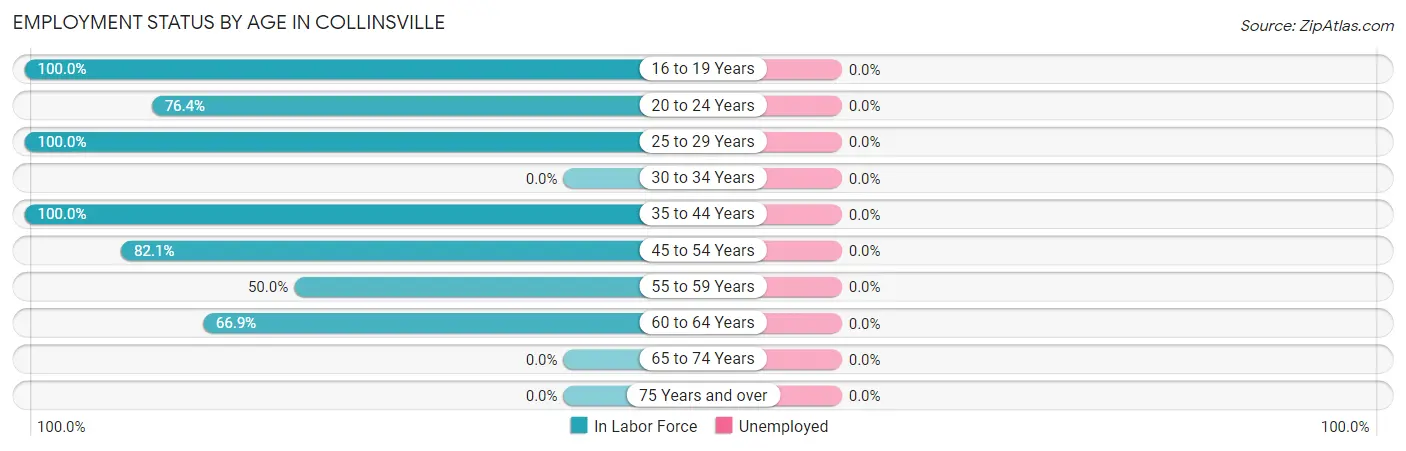
| Age Bracket | In Labor Force | Unemployed |
| 16 to 19 Years | 26 (100.0%) | 0 (0.0%) |
| 20 to 24 Years | 123 (76.4%) | 0 (0.0%) |
| 25 to 29 Years | 79 (100.0%) | 0 (0.0%) |
| 30 to 34 Years | 0 (0.0%) | 0 (0.0%) |
| 35 to 44 Years | 107 (100.0%) | 0 (0.0%) |
| 45 to 54 Years | 317 (82.1%) | 0 (0.0%) |
| 55 to 59 Years | 80 (50.0%) | 0 (0.0%) |
| 60 to 64 Years | 93 (66.9%) | 0 (0.0%) |
| 65 to 74 Years | 0 (0.0%) | 0 (0.0%) |
| 75 Years and over | 0 (0.0%) | 0 (0.0%) |
| Total | 825 (49.2%) | 0 (0.0%) |
Employment Status by Educational Attainment in Collinsville
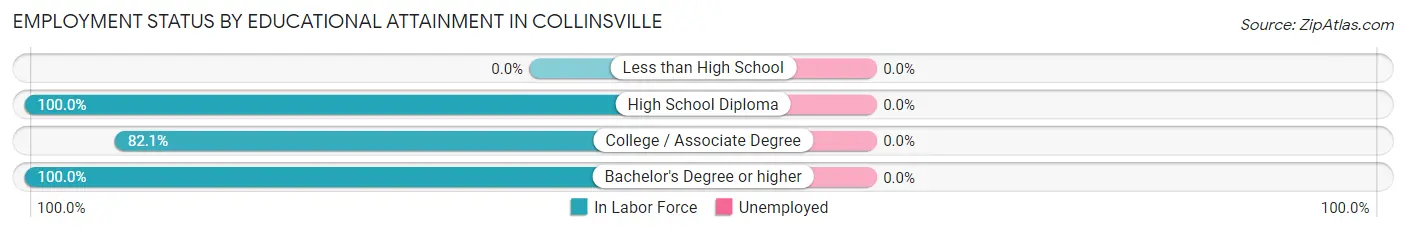
| Educational Attainment | In Labor Force | Unemployed |
| Less than High School | 0 (0.0%) | 0 (0.0%) |
| High School Diploma | 185 (100.0%) | 0 (0.0%) |
| College / Associate Degree | 238 (82.1%) | 0 (0.0%) |
| Bachelor's Degree or higher | 253 (100.0%) | 0 (0.0%) |
| Total | 676 (77.6%) | 0 (0.0%) |
Employment Occupations by Sex in Collinsville
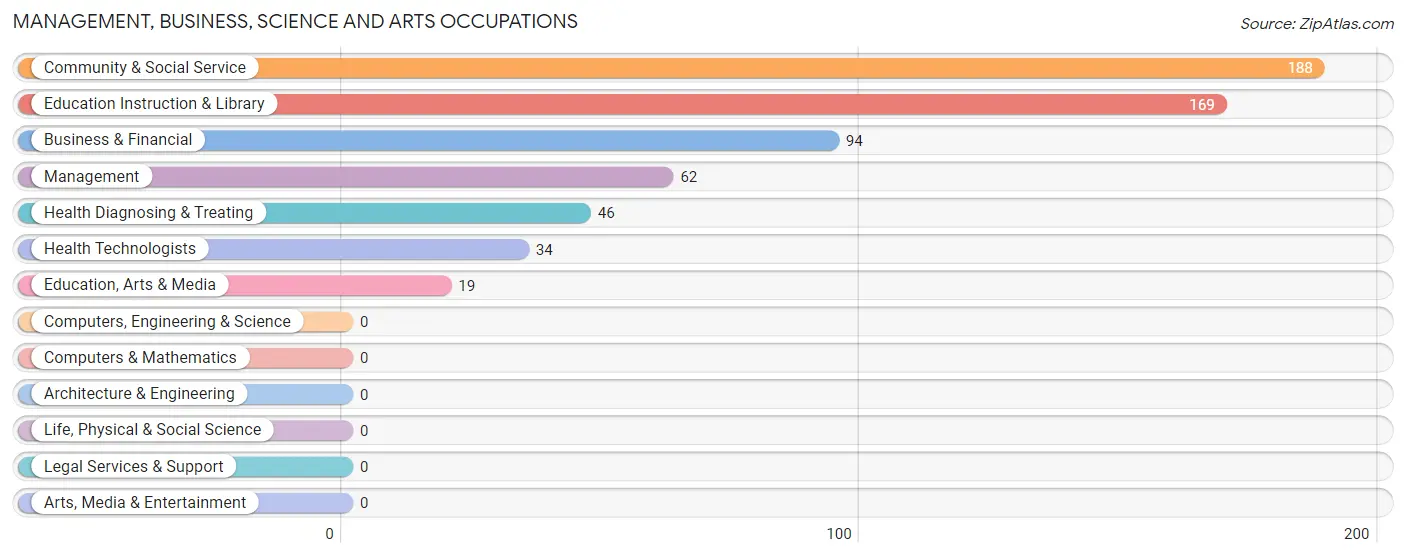
Management, Business, Science and Arts Occupations
The most common Management, Business, Science and Arts occupations in Collinsville are Community & Social Service (188 | 23.2%), Education Instruction & Library (169 | 20.8%), Business & Financial (94 | 11.6%), Management (62 | 7.6%), and Health Diagnosing & Treating (46 | 5.7%).
Management, Business, Science and Arts Occupations by Sex
Within the Management, Business, Science and Arts occupations in Collinsville, the most male-oriented occupations are Management (87.1%), Education Instruction & Library (27.2%), and Community & Social Service (24.5%), while the most female-oriented occupations are Education, Arts & Media (100.0%), Health Diagnosing & Treating (100.0%), and Health Technologists (100.0%).
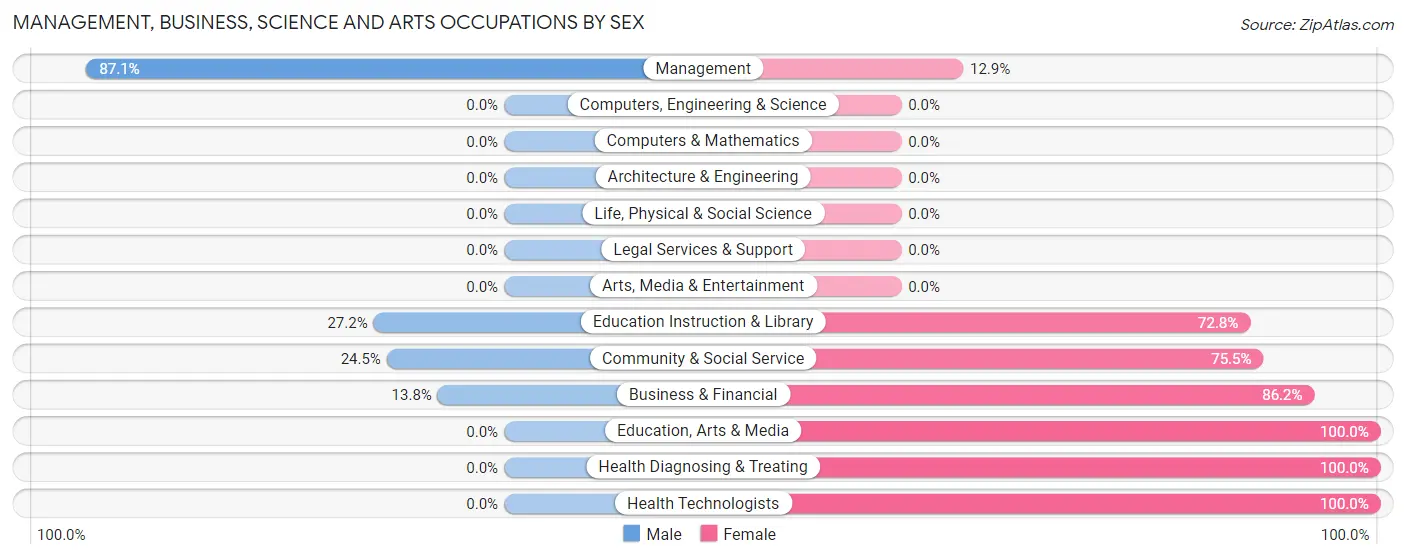
| Occupation | Male | Female |
| Management | 54 (87.1%) | 8 (12.9%) |
| Business & Financial | 13 (13.8%) | 81 (86.2%) |
| Computers, Engineering & Science | 0 (0.0%) | 0 (0.0%) |
| Computers & Mathematics | 0 (0.0%) | 0 (0.0%) |
| Architecture & Engineering | 0 (0.0%) | 0 (0.0%) |
| Life, Physical & Social Science | 0 (0.0%) | 0 (0.0%) |
| Community & Social Service | 46 (24.5%) | 142 (75.5%) |
| Education, Arts & Media | 0 (0.0%) | 19 (100.0%) |
| Legal Services & Support | 0 (0.0%) | 0 (0.0%) |
| Education Instruction & Library | 46 (27.2%) | 123 (72.8%) |
| Arts, Media & Entertainment | 0 (0.0%) | 0 (0.0%) |
| Health Diagnosing & Treating | 0 (0.0%) | 46 (100.0%) |
| Health Technologists | 0 (0.0%) | 34 (100.0%) |
| Total (Category) | 113 (29.0%) | 277 (71.0%) |
| Total (Overall) | 391 (48.2%) | 420 (51.8%) |
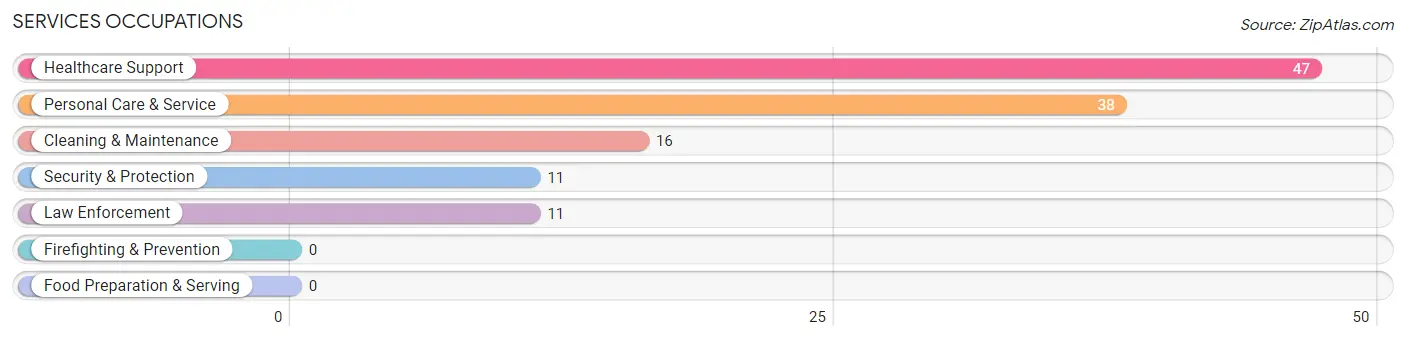
Services Occupations
The most common Services occupations in Collinsville are Healthcare Support (47 | 5.8%), Personal Care & Service (38 | 4.7%), Cleaning & Maintenance (16 | 2.0%), Security & Protection (11 | 1.4%), and Law Enforcement (11 | 1.4%).
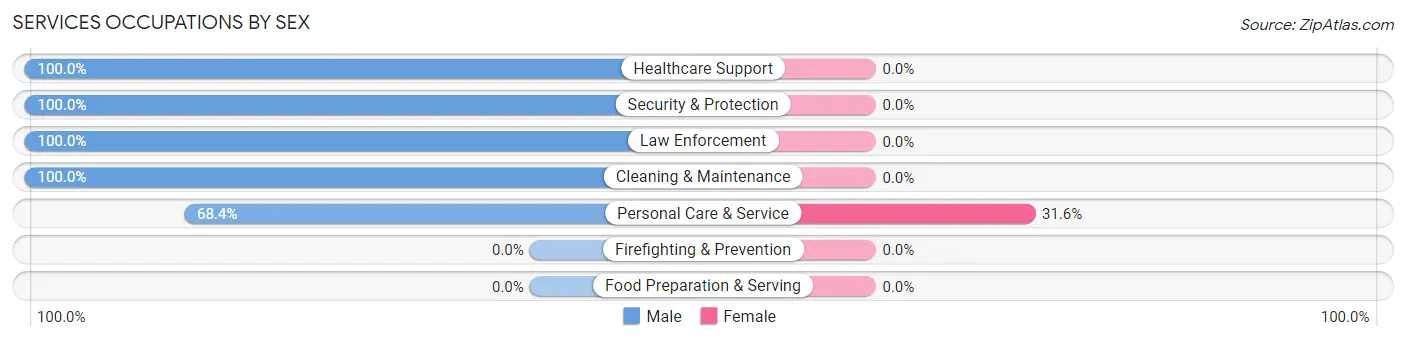
Services Occupations by Sex
| Occupation | Male | Female |
| Healthcare Support | 47 (100.0%) | 0 (0.0%) |
| Security & Protection | 11 (100.0%) | 0 (0.0%) |
| Firefighting & Prevention | 0 (0.0%) | 0 (0.0%) |
| Law Enforcement | 11 (100.0%) | 0 (0.0%) |
| Food Preparation & Serving | 0 (0.0%) | 0 (0.0%) |
| Cleaning & Maintenance | 16 (100.0%) | 0 (0.0%) |
| Personal Care & Service | 26 (68.4%) | 12 (31.6%) |
| Total (Category) | 100 (89.3%) | 12 (10.7%) |
| Total (Overall) | 391 (48.2%) | 420 (51.8%) |
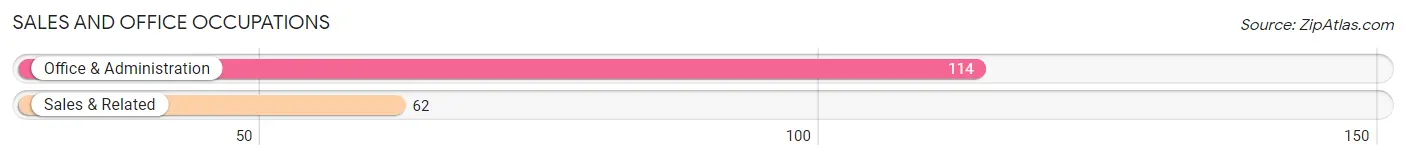
Sales and Office Occupations
The most common Sales and Office occupations in Collinsville are Office & Administration (114 | 14.1%), and Sales & Related (62 | 7.6%).
Sales and Office Occupations by Sex
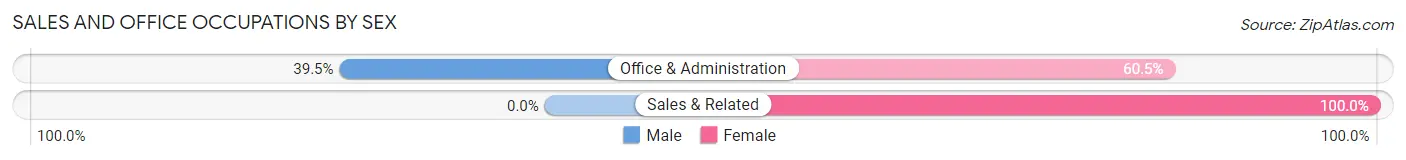
| Occupation | Male | Female |
| Sales & Related | 0 (0.0%) | 62 (100.0%) |
| Office & Administration | 45 (39.5%) | 69 (60.5%) |
| Total (Category) | 45 (25.6%) | 131 (74.4%) |
| Total (Overall) | 391 (48.2%) | 420 (51.8%) |
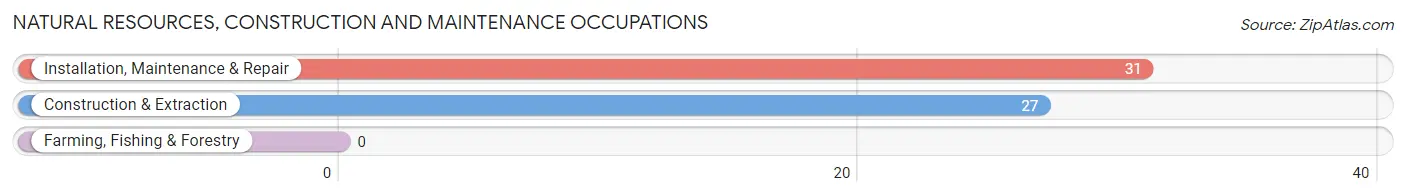
Natural Resources, Construction and Maintenance Occupations
The most common Natural Resources, Construction and Maintenance occupations in Collinsville are Installation, Maintenance & Repair (31 | 3.8%), and Construction & Extraction (27 | 3.3%).
Natural Resources, Construction and Maintenance Occupations by Sex
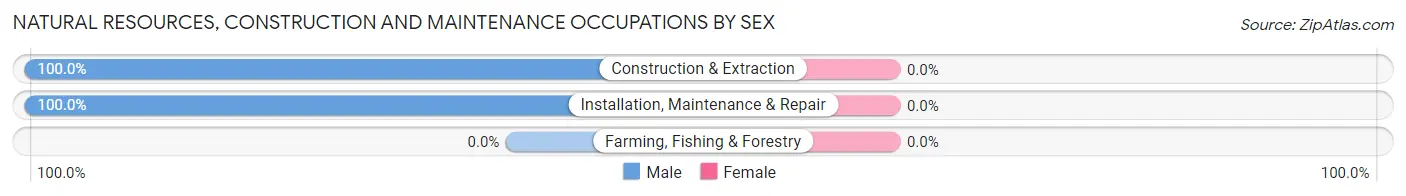
| Occupation | Male | Female |
| Farming, Fishing & Forestry | 0 (0.0%) | 0 (0.0%) |
| Construction & Extraction | 27 (100.0%) | 0 (0.0%) |
| Installation, Maintenance & Repair | 31 (100.0%) | 0 (0.0%) |
| Total (Category) | 58 (100.0%) | 0 (0.0%) |
| Total (Overall) | 391 (48.2%) | 420 (51.8%) |
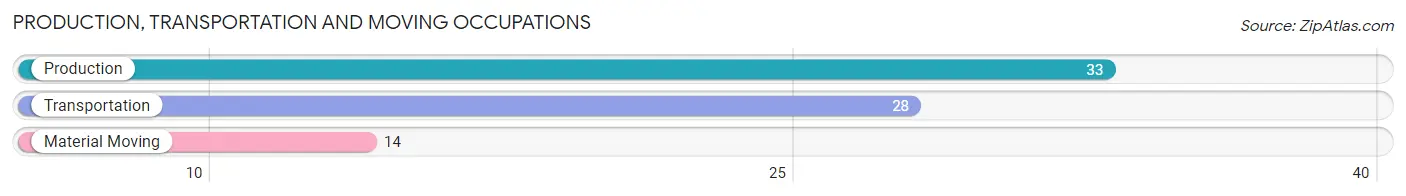
Production, Transportation and Moving Occupations
The most common Production, Transportation and Moving occupations in Collinsville are Production (33 | 4.1%), Transportation (28 | 3.5%), and Material Moving (14 | 1.7%).
Production, Transportation and Moving Occupations by Sex
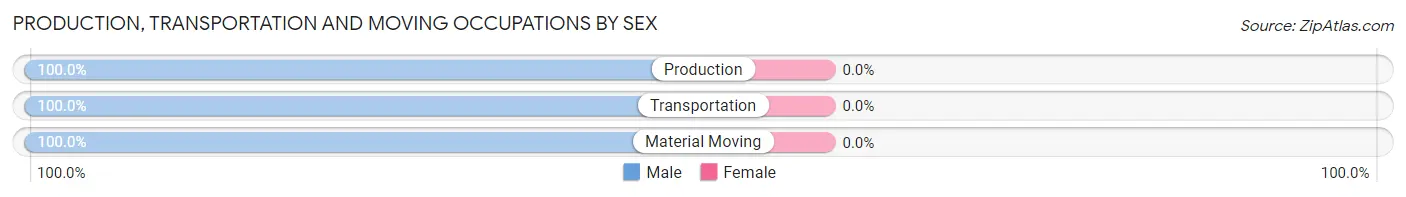
| Occupation | Male | Female |
| Production | 33 (100.0%) | 0 (0.0%) |
| Transportation | 28 (100.0%) | 0 (0.0%) |
| Material Moving | 14 (100.0%) | 0 (0.0%) |
| Total (Category) | 75 (100.0%) | 0 (0.0%) |
| Total (Overall) | 391 (48.2%) | 420 (51.8%) |
Employment Industries by Sex in Collinsville
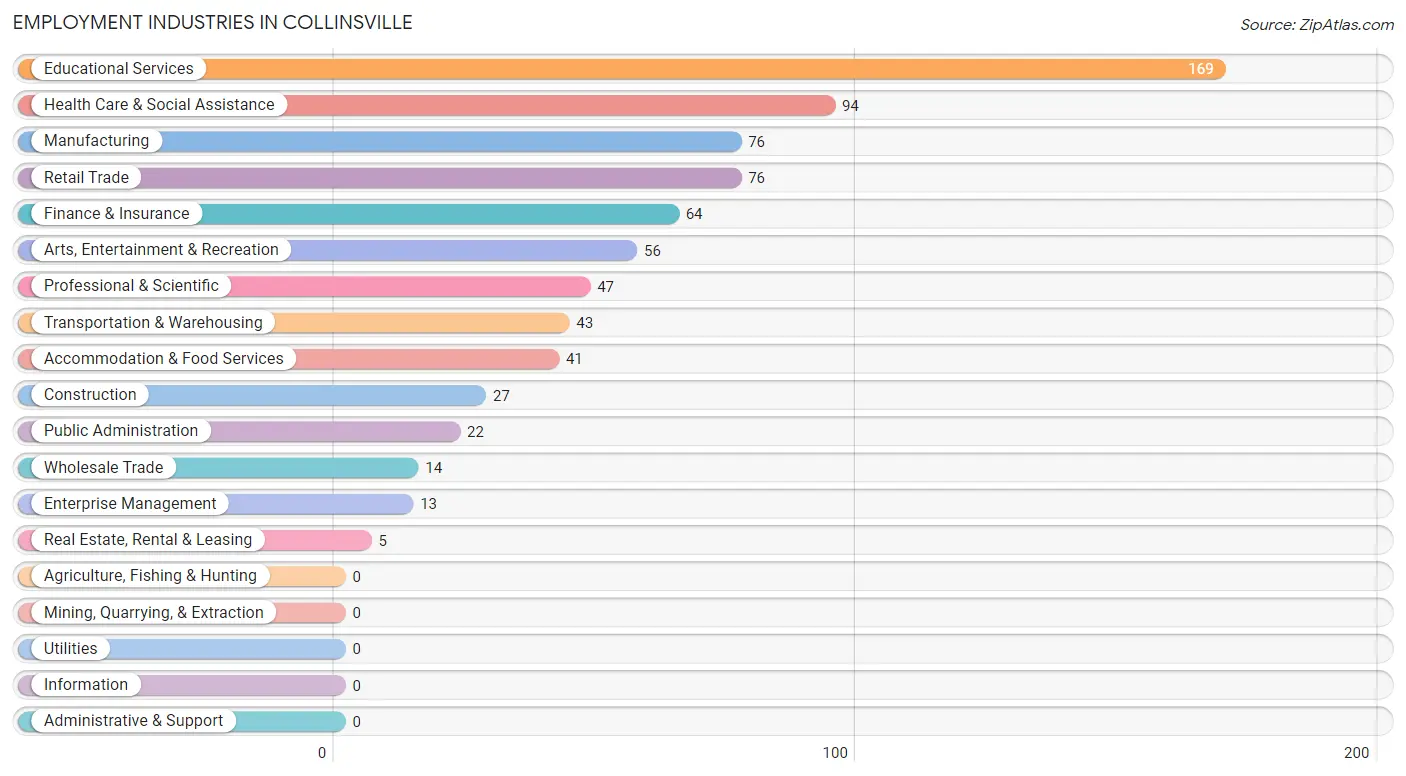
Employment Industries in Collinsville
The major employment industries in Collinsville include Educational Services (169 | 20.8%), Health Care & Social Assistance (94 | 11.6%), Manufacturing (76 | 9.4%), Retail Trade (76 | 9.4%), and Finance & Insurance (64 | 7.9%).
Employment Industries by Sex in Collinsville
The Collinsville industries that see more men than women are Construction (100.0%), Wholesale Trade (100.0%), and Professional & Scientific (100.0%), whereas the industries that tend to have a higher number of women are Real Estate, Rental & Leasing (100.0%), Arts, Entertainment & Recreation (100.0%), and Retail Trade (81.6%).
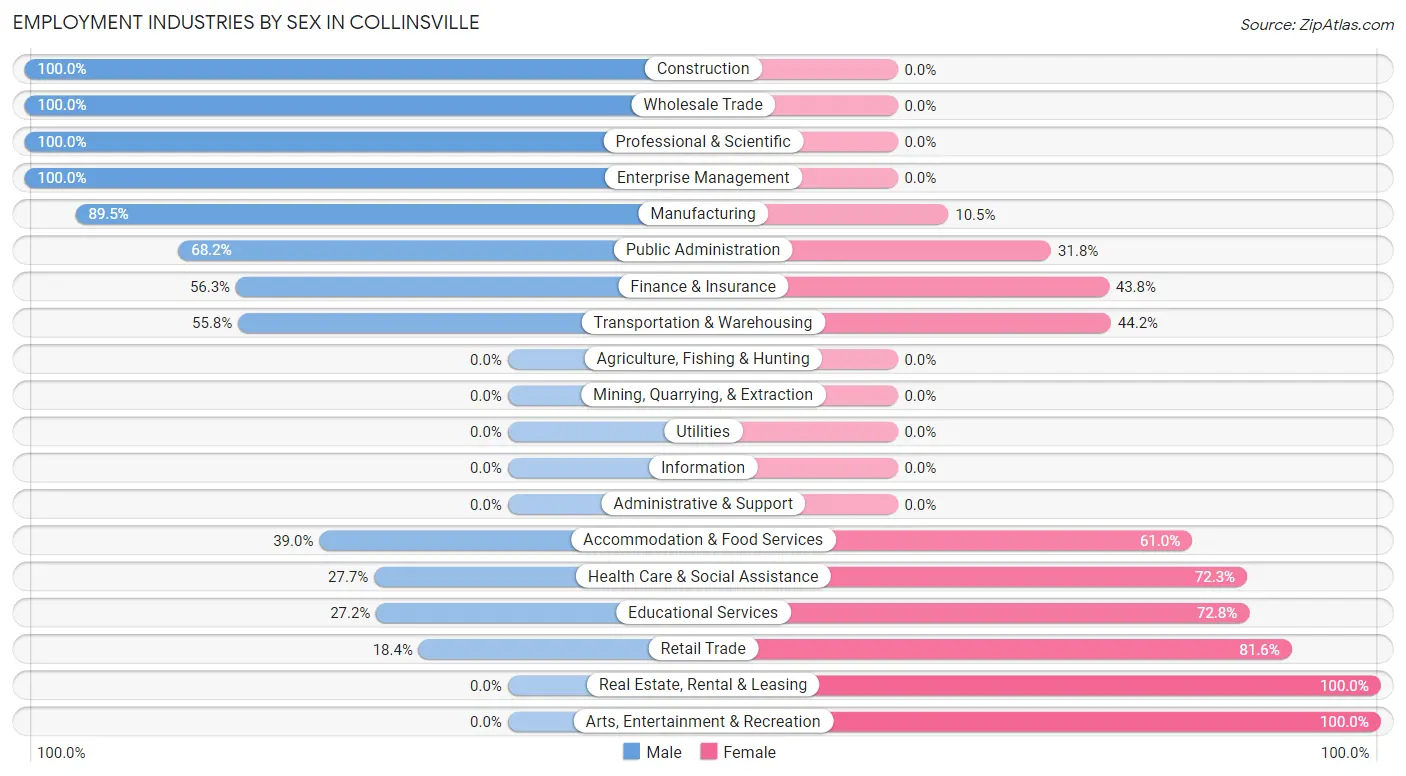
| Industry | Male | Female |
| Agriculture, Fishing & Hunting | 0 (0.0%) | 0 (0.0%) |
| Mining, Quarrying, & Extraction | 0 (0.0%) | 0 (0.0%) |
| Construction | 27 (100.0%) | 0 (0.0%) |
| Manufacturing | 68 (89.5%) | 8 (10.5%) |
| Wholesale Trade | 14 (100.0%) | 0 (0.0%) |
| Retail Trade | 14 (18.4%) | 62 (81.6%) |
| Transportation & Warehousing | 24 (55.8%) | 19 (44.2%) |
| Utilities | 0 (0.0%) | 0 (0.0%) |
| Information | 0 (0.0%) | 0 (0.0%) |
| Finance & Insurance | 36 (56.2%) | 28 (43.8%) |
| Real Estate, Rental & Leasing | 0 (0.0%) | 5 (100.0%) |
| Professional & Scientific | 47 (100.0%) | 0 (0.0%) |
| Enterprise Management | 13 (100.0%) | 0 (0.0%) |
| Administrative & Support | 0 (0.0%) | 0 (0.0%) |
| Educational Services | 46 (27.2%) | 123 (72.8%) |
| Health Care & Social Assistance | 26 (27.7%) | 68 (72.3%) |
| Arts, Entertainment & Recreation | 0 (0.0%) | 56 (100.0%) |
| Accommodation & Food Services | 16 (39.0%) | 25 (61.0%) |
| Public Administration | 15 (68.2%) | 7 (31.8%) |
| Total | 391 (48.2%) | 420 (51.8%) |
Education in Collinsville
School Enrollment in Collinsville
The most common levels of schooling among the 252 students in Collinsville are high school (90 | 35.7%), college / undergraduate (80 | 31.8%), and middle school (42 | 16.7%).
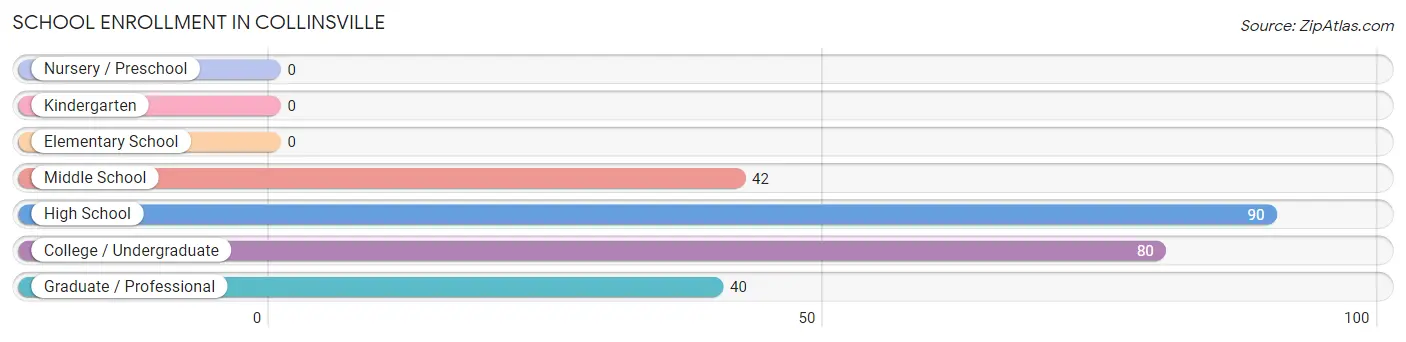
| School Level | # Students | % Students |
| Nursery / Preschool | 0 | 0.0% |
| Kindergarten | 0 | 0.0% |
| Elementary School | 0 | 0.0% |
| Middle School | 42 | 16.7% |
| High School | 90 | 35.7% |
| College / Undergraduate | 80 | 31.8% |
| Graduate / Professional | 40 | 15.9% |
| Total | 252 | 100.0% |
School Enrollment by Age by Funding Source in Collinsville
Out of a total of 252 students who are enrolled in schools in Collinsville, 19 (7.5%) attend a private institution, while the remaining 233 (92.5%) are enrolled in public schools. The age group of 25 to 34 year olds has the highest likelihood of being enrolled in private schools, with 19 (47.5% in the age bracket) enrolled. Conversely, the age group of 10 to 14 year olds has the lowest likelihood of being enrolled in a private school, with 42 (100.0% in the age bracket) attending a public institution.
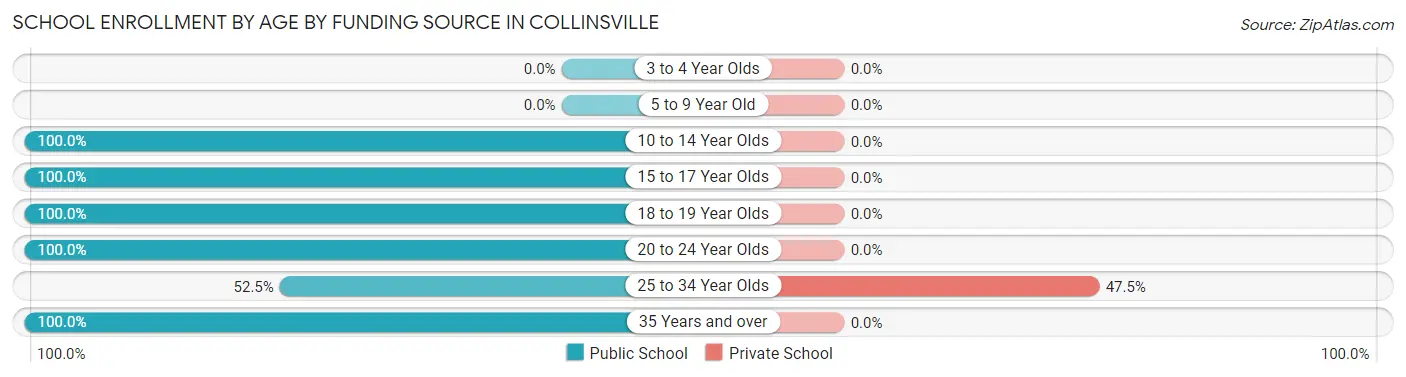
| Age Bracket | Public School | Private School |
| 3 to 4 Year Olds | 0 (0.0%) | 0 (0.0%) |
| 5 to 9 Year Old | 0 (0.0%) | 0 (0.0%) |
| 10 to 14 Year Olds | 42 (100.0%) | 0 (0.0%) |
| 15 to 17 Year Olds | 78 (100.0%) | 0 (0.0%) |
| 18 to 19 Year Olds | 12 (100.0%) | 0 (0.0%) |
| 20 to 24 Year Olds | 67 (100.0%) | 0 (0.0%) |
| 25 to 34 Year Olds | 21 (52.5%) | 19 (47.5%) |
| 35 Years and over | 13 (100.0%) | 0 (0.0%) |
| Total | 233 (92.5%) | 19 (7.5%) |
Educational Attainment by Field of Study in Collinsville
Business (165 | 41.0%), education (163 | 40.6%), computers & mathematics (25 | 6.2%), liberal arts & history (21 | 5.2%), and psychology (19 | 4.7%) are the most common fields of study among 402 individuals in Collinsville who have obtained a bachelor's degree or higher.
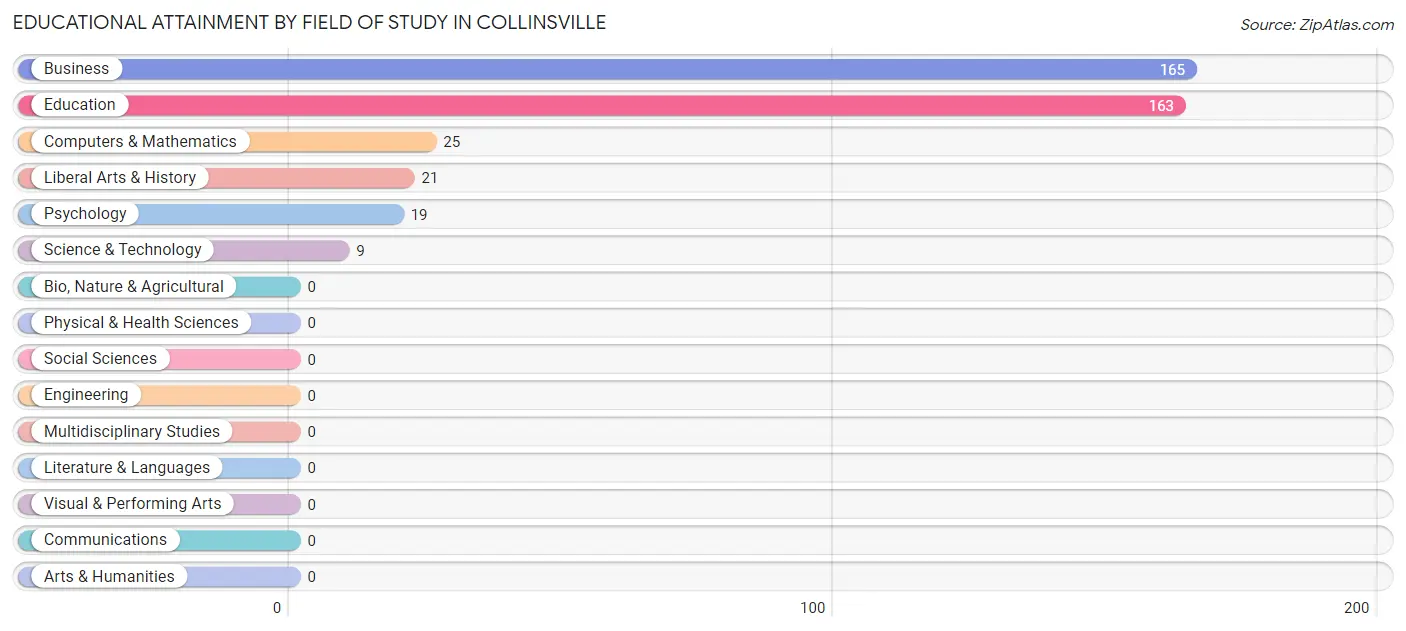
| Field of Study | # Graduates | % Graduates |
| Computers & Mathematics | 25 | 6.2% |
| Bio, Nature & Agricultural | 0 | 0.0% |
| Physical & Health Sciences | 0 | 0.0% |
| Psychology | 19 | 4.7% |
| Social Sciences | 0 | 0.0% |
| Engineering | 0 | 0.0% |
| Multidisciplinary Studies | 0 | 0.0% |
| Science & Technology | 9 | 2.2% |
| Business | 165 | 41.0% |
| Education | 163 | 40.6% |
| Literature & Languages | 0 | 0.0% |
| Liberal Arts & History | 21 | 5.2% |
| Visual & Performing Arts | 0 | 0.0% |
| Communications | 0 | 0.0% |
| Arts & Humanities | 0 | 0.0% |
| Total | 402 | 100.0% |
Transportation & Commute in Collinsville
Vehicle Availability by Sex in Collinsville
The most prevalent vehicle ownership categories in Collinsville are males with 2 vehicles (151, accounting for 37.3%) and females with 2 vehicles (144, making up 35.9%).
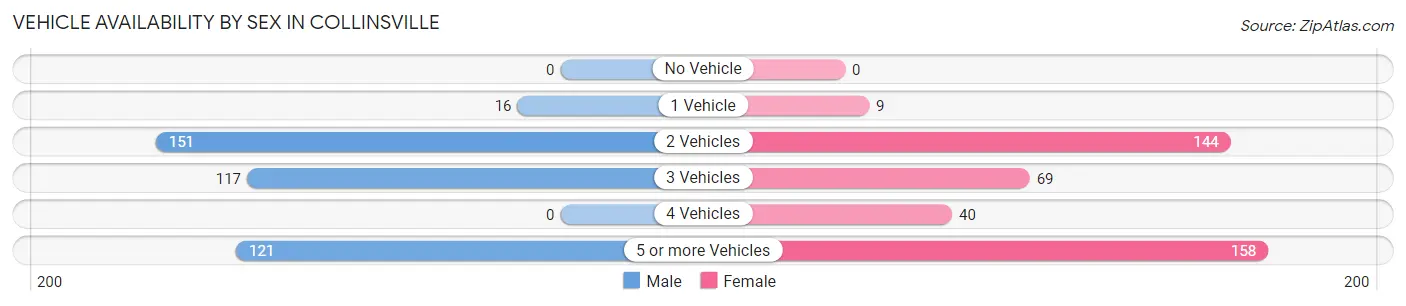
| Vehicles Available | Male | Female |
| No Vehicle | 0 (0.0%) | 0 (0.0%) |
| 1 Vehicle | 16 (4.0%) | 9 (2.1%) |
| 2 Vehicles | 151 (37.3%) | 144 (34.3%) |
| 3 Vehicles | 117 (28.9%) | 69 (16.4%) |
| 4 Vehicles | 0 (0.0%) | 40 (9.5%) |
| 5 or more Vehicles | 121 (29.9%) | 158 (37.6%) |
| Total | 405 (100.0%) | 420 (100.0%) |
Commute Time in Collinsville
The most frequently occuring commute durations in Collinsville are 30 to 34 minutes (206 commuters, 25.0%), 20 to 24 minutes (149 commuters, 18.1%), and 45 to 59 minutes (87 commuters, 10.5%).
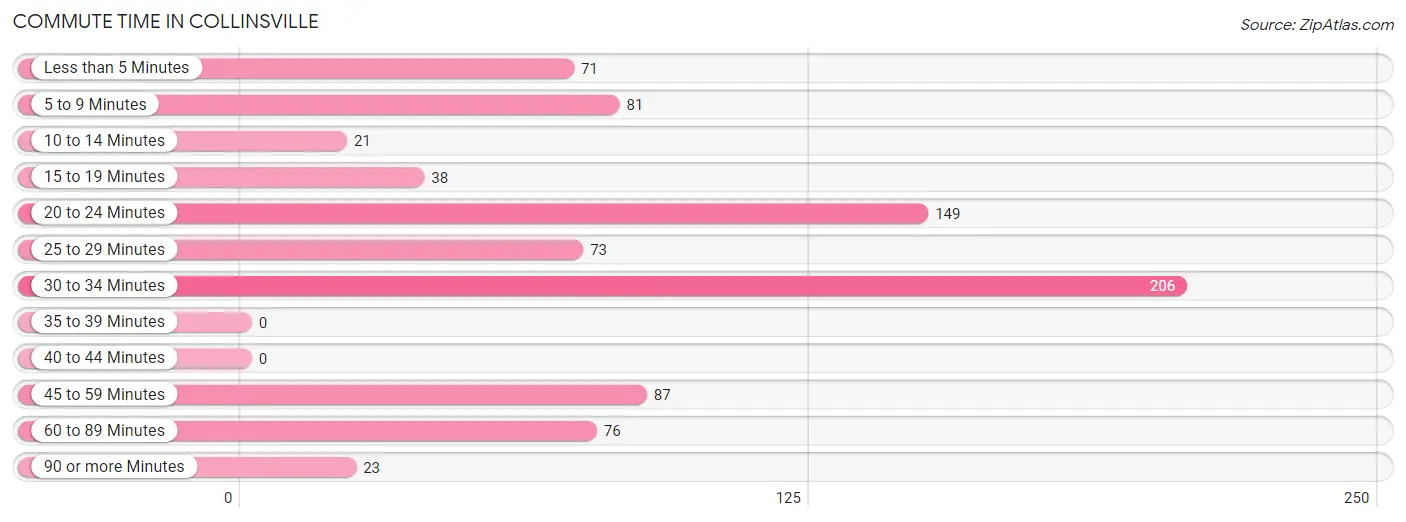
| Commute Time | # Commuters | % Commuters |
| Less than 5 Minutes | 71 | 8.6% |
| 5 to 9 Minutes | 81 | 9.8% |
| 10 to 14 Minutes | 21 | 2.5% |
| 15 to 19 Minutes | 38 | 4.6% |
| 20 to 24 Minutes | 149 | 18.1% |
| 25 to 29 Minutes | 73 | 8.8% |
| 30 to 34 Minutes | 206 | 25.0% |
| 35 to 39 Minutes | 0 | 0.0% |
| 40 to 44 Minutes | 0 | 0.0% |
| 45 to 59 Minutes | 87 | 10.5% |
| 60 to 89 Minutes | 76 | 9.2% |
| 90 or more Minutes | 23 | 2.8% |
Commute Time by Sex in Collinsville
The most common commute times in Collinsville are 60 to 89 minutes (76 commuters, 18.8%) for males and 30 to 34 minutes (150 commuters, 35.7%) for females.
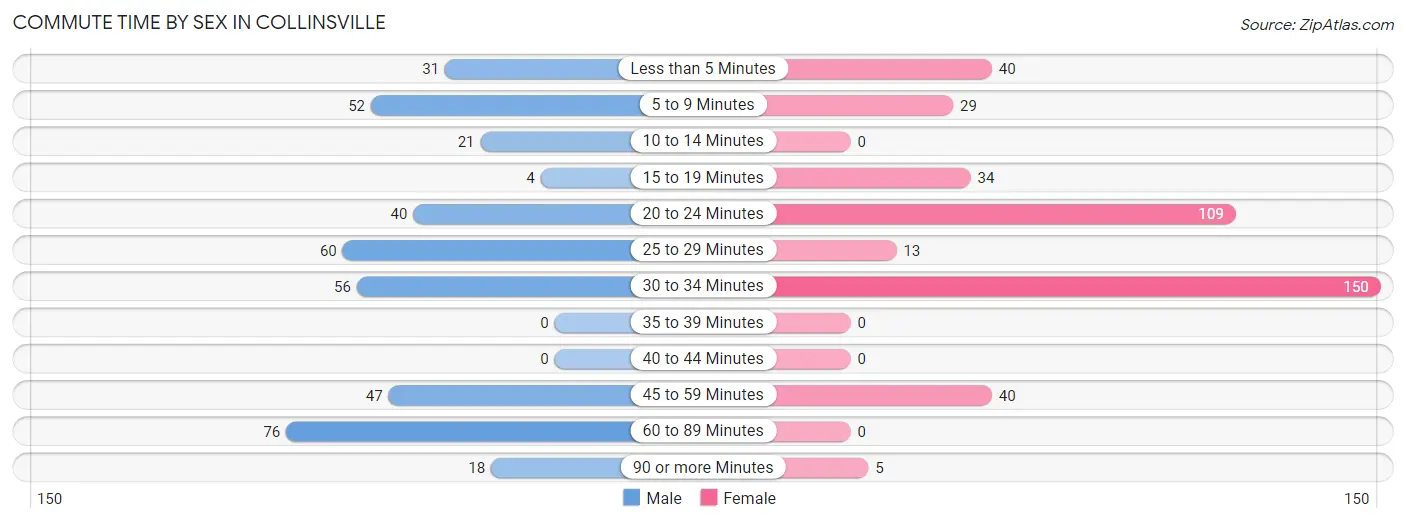
| Commute Time | Male | Female |
| Less than 5 Minutes | 31 (7.6%) | 40 (9.5%) |
| 5 to 9 Minutes | 52 (12.8%) | 29 (6.9%) |
| 10 to 14 Minutes | 21 (5.2%) | 0 (0.0%) |
| 15 to 19 Minutes | 4 (1.0%) | 34 (8.1%) |
| 20 to 24 Minutes | 40 (9.9%) | 109 (26.0%) |
| 25 to 29 Minutes | 60 (14.8%) | 13 (3.1%) |
| 30 to 34 Minutes | 56 (13.8%) | 150 (35.7%) |
| 35 to 39 Minutes | 0 (0.0%) | 0 (0.0%) |
| 40 to 44 Minutes | 0 (0.0%) | 0 (0.0%) |
| 45 to 59 Minutes | 47 (11.6%) | 40 (9.5%) |
| 60 to 89 Minutes | 76 (18.8%) | 0 (0.0%) |
| 90 or more Minutes | 18 (4.4%) | 5 (1.2%) |
Time of Departure to Work by Sex in Collinsville
The most frequent times of departure to work in Collinsville are 7:00 AM to 7:29 AM (82, 20.3%) for males and 7:30 AM to 7:59 AM (99, 23.6%) for females.
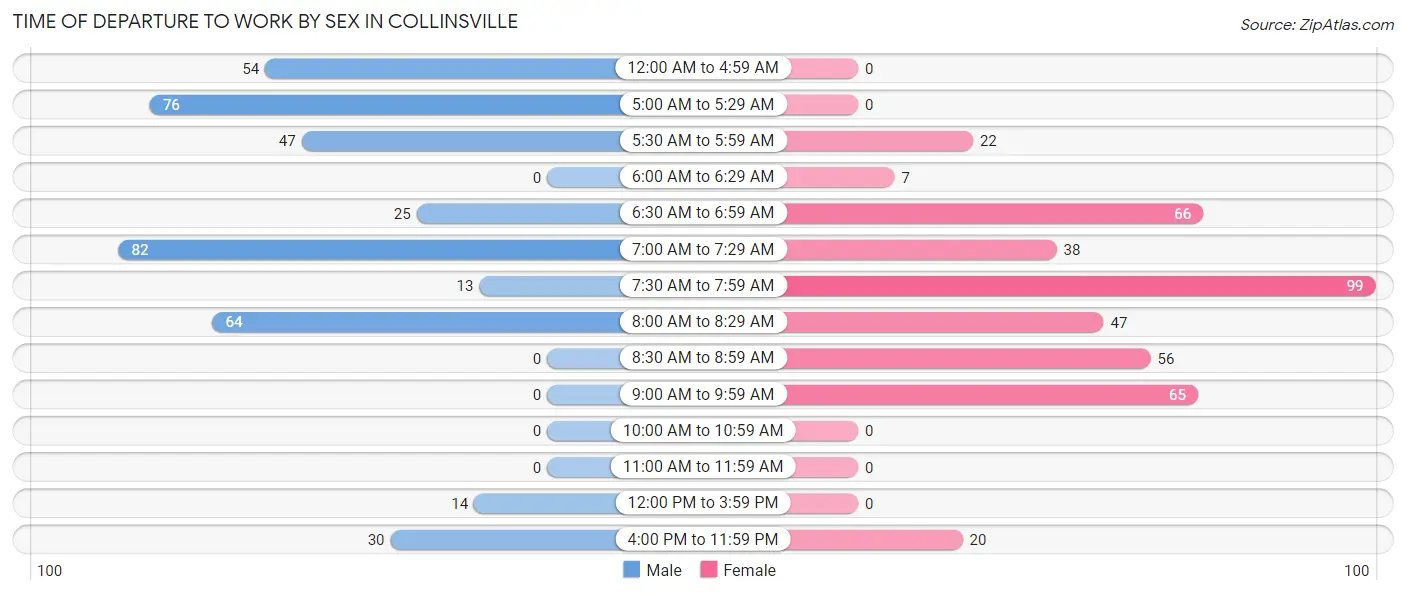
| Time of Departure | Male | Female |
| 12:00 AM to 4:59 AM | 54 (13.3%) | 0 (0.0%) |
| 5:00 AM to 5:29 AM | 76 (18.8%) | 0 (0.0%) |
| 5:30 AM to 5:59 AM | 47 (11.6%) | 22 (5.2%) |
| 6:00 AM to 6:29 AM | 0 (0.0%) | 7 (1.7%) |
| 6:30 AM to 6:59 AM | 25 (6.2%) | 66 (15.7%) |
| 7:00 AM to 7:29 AM | 82 (20.3%) | 38 (9.0%) |
| 7:30 AM to 7:59 AM | 13 (3.2%) | 99 (23.6%) |
| 8:00 AM to 8:29 AM | 64 (15.8%) | 47 (11.2%) |
| 8:30 AM to 8:59 AM | 0 (0.0%) | 56 (13.3%) |
| 9:00 AM to 9:59 AM | 0 (0.0%) | 65 (15.5%) |
| 10:00 AM to 10:59 AM | 0 (0.0%) | 0 (0.0%) |
| 11:00 AM to 11:59 AM | 0 (0.0%) | 0 (0.0%) |
| 12:00 PM to 3:59 PM | 14 (3.5%) | 0 (0.0%) |
| 4:00 PM to 11:59 PM | 30 (7.4%) | 20 (4.8%) |
| Total | 405 (100.0%) | 420 (100.0%) |
Housing Occupancy in Collinsville
Occupancy by Ownership in Collinsville
Of the total 814 dwellings in Collinsville, owner-occupied units account for 740 (90.9%), while renter-occupied units make up 74 (9.1%).
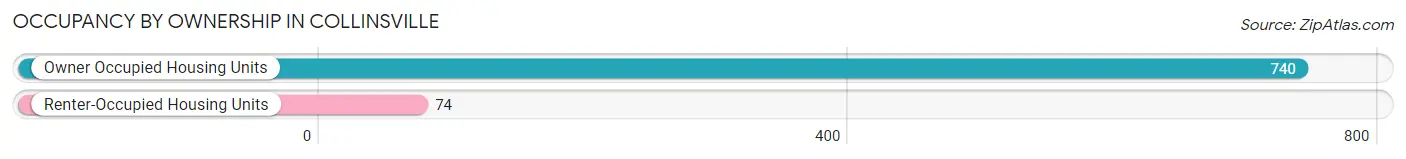
| Occupancy | # Housing Units | % Housing Units |
| Owner Occupied Housing Units | 740 | 90.9% |
| Renter-Occupied Housing Units | 74 | 9.1% |
| Total Occupied Housing Units | 814 | 100.0% |
Occupancy by Household Size in Collinsville
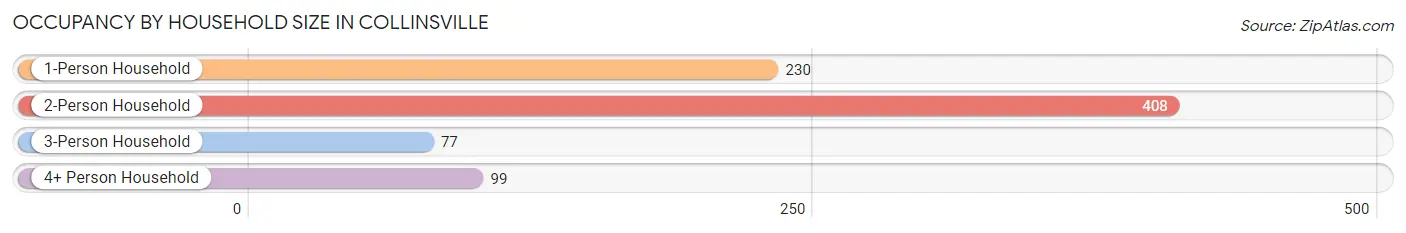
| Household Size | # Housing Units | % Housing Units |
| 1-Person Household | 230 | 28.3% |
| 2-Person Household | 408 | 50.1% |
| 3-Person Household | 77 | 9.5% |
| 4+ Person Household | 99 | 12.2% |
| Total Housing Units | 814 | 100.0% |
Occupancy by Ownership by Household Size in Collinsville
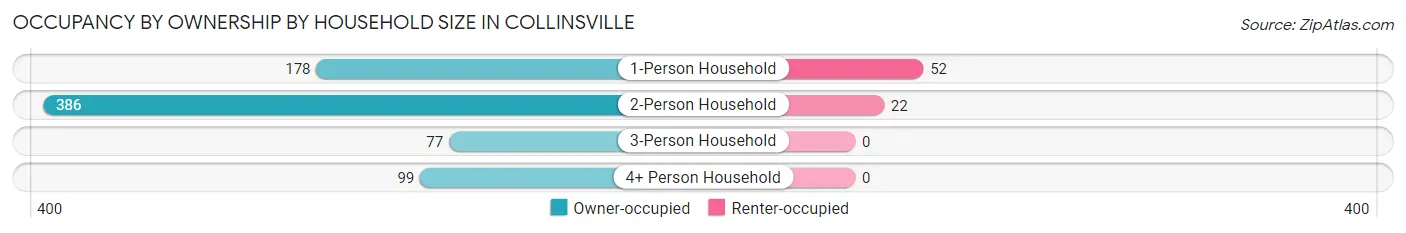
| Household Size | Owner-occupied | Renter-occupied |
| 1-Person Household | 178 (77.4%) | 52 (22.6%) |
| 2-Person Household | 386 (94.6%) | 22 (5.4%) |
| 3-Person Household | 77 (100.0%) | 0 (0.0%) |
| 4+ Person Household | 99 (100.0%) | 0 (0.0%) |
| Total Housing Units | 740 (90.9%) | 74 (9.1%) |
Occupancy by Educational Attainment in Collinsville
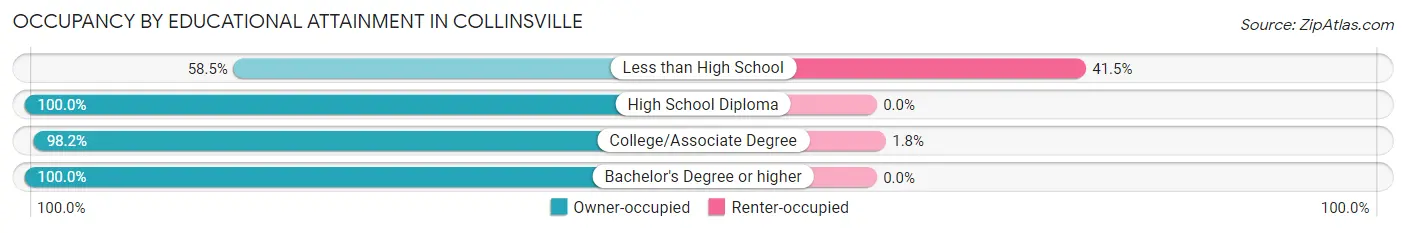
| Household Size | Owner-occupied | Renter-occupied |
| Less than High School | 96 (58.5%) | 68 (41.5%) |
| High School Diploma | 124 (100.0%) | 0 (0.0%) |
| College/Associate Degree | 325 (98.2%) | 6 (1.8%) |
| Bachelor's Degree or higher | 195 (100.0%) | 0 (0.0%) |
Occupancy by Age of Householder in Collinsville
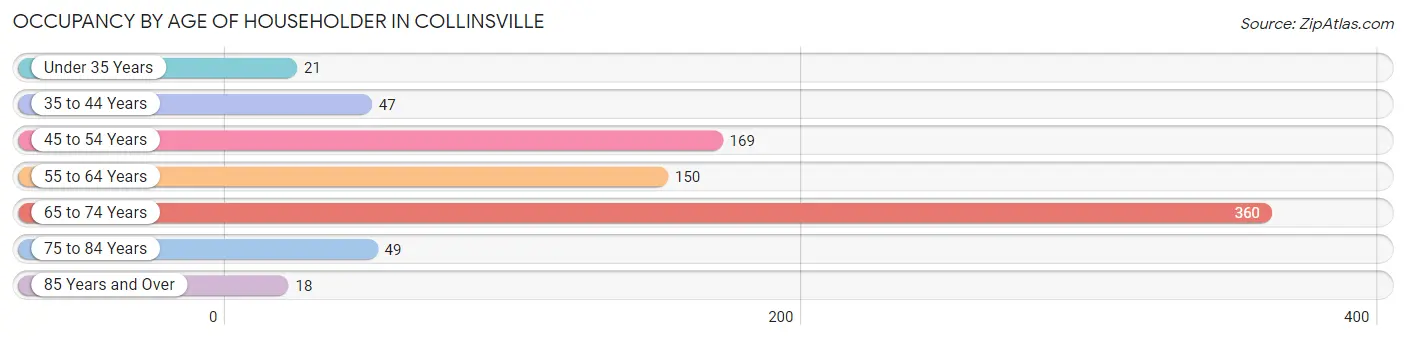
| Age Bracket | # Households | % Households |
| Under 35 Years | 21 | 2.6% |
| 35 to 44 Years | 47 | 5.8% |
| 45 to 54 Years | 169 | 20.8% |
| 55 to 64 Years | 150 | 18.4% |
| 65 to 74 Years | 360 | 44.2% |
| 75 to 84 Years | 49 | 6.0% |
| 85 Years and Over | 18 | 2.2% |
| Total | 814 | 100.0% |
Housing Finances in Collinsville
Median Income by Occupancy in Collinsville
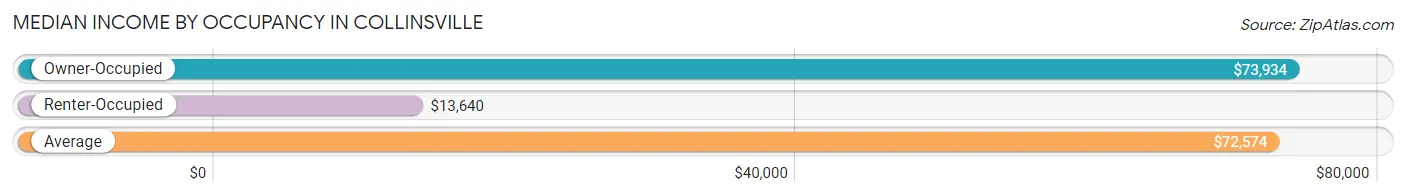
| Occupancy Type | # Households | Median Income |
| Owner-Occupied | 740 (90.9%) | $73,934 |
| Renter-Occupied | 74 (9.1%) | $13,640 |
| Average | 814 (100.0%) | $72,574 |
Occupancy by Householder Income Bracket in Collinsville
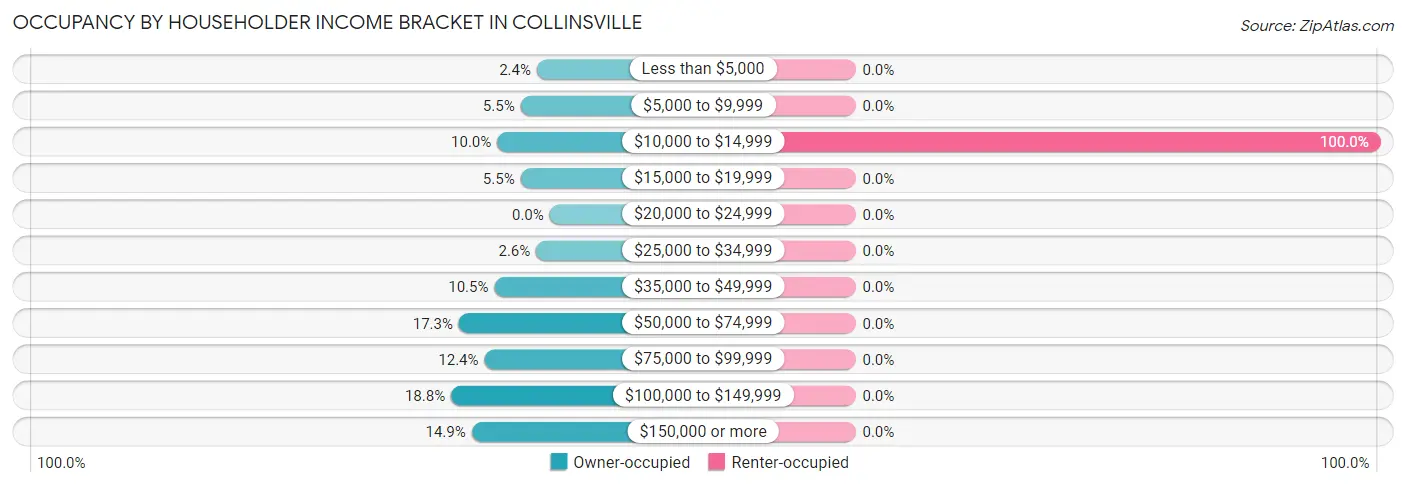
| Income Bracket | Owner-occupied | Renter-occupied |
| Less than $5,000 | 18 (2.4%) | 0 (0.0%) |
| $5,000 to $9,999 | 41 (5.5%) | 0 (0.0%) |
| $10,000 to $14,999 | 74 (10.0%) | 74 (100.0%) |
| $15,000 to $19,999 | 41 (5.5%) | 0 (0.0%) |
| $20,000 to $24,999 | 0 (0.0%) | 0 (0.0%) |
| $25,000 to $34,999 | 19 (2.6%) | 0 (0.0%) |
| $35,000 to $49,999 | 78 (10.5%) | 0 (0.0%) |
| $50,000 to $74,999 | 128 (17.3%) | 0 (0.0%) |
| $75,000 to $99,999 | 92 (12.4%) | 0 (0.0%) |
| $100,000 to $149,999 | 139 (18.8%) | 0 (0.0%) |
| $150,000 or more | 110 (14.9%) | 0 (0.0%) |
| Total | 740 (100.0%) | 74 (100.0%) |
Monthly Housing Cost Tiers in Collinsville
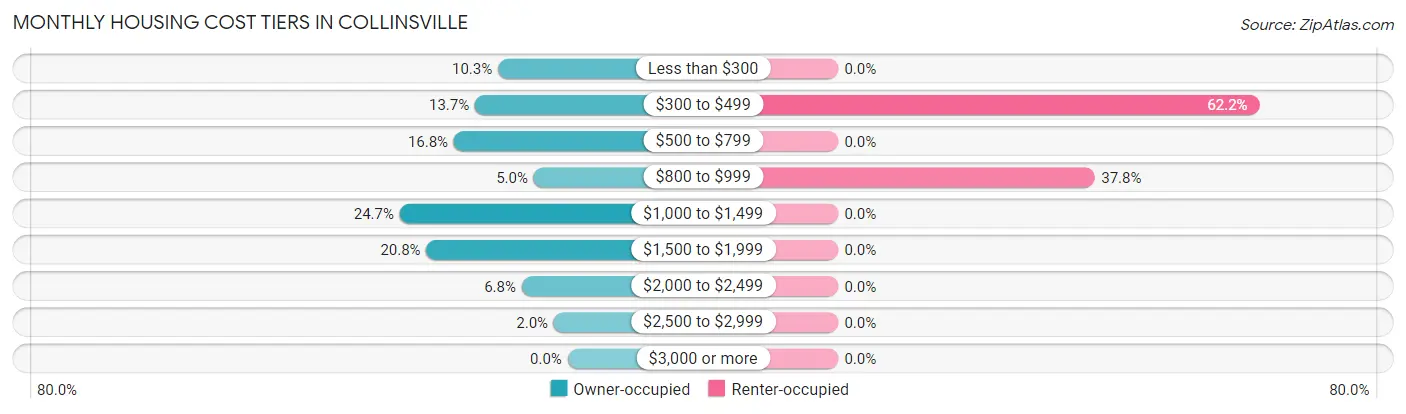
| Monthly Cost | Owner-occupied | Renter-occupied |
| Less than $300 | 76 (10.3%) | 0 (0.0%) |
| $300 to $499 | 101 (13.7%) | 46 (62.2%) |
| $500 to $799 | 124 (16.8%) | 0 (0.0%) |
| $800 to $999 | 37 (5.0%) | 28 (37.8%) |
| $1,000 to $1,499 | 183 (24.7%) | 0 (0.0%) |
| $1,500 to $1,999 | 154 (20.8%) | 0 (0.0%) |
| $2,000 to $2,499 | 50 (6.8%) | 0 (0.0%) |
| $2,500 to $2,999 | 15 (2.0%) | 0 (0.0%) |
| $3,000 or more | 0 (0.0%) | 0 (0.0%) |
| Total | 740 (100.0%) | 74 (100.0%) |
Physical Housing Characteristics in Collinsville
Housing Structures in Collinsville
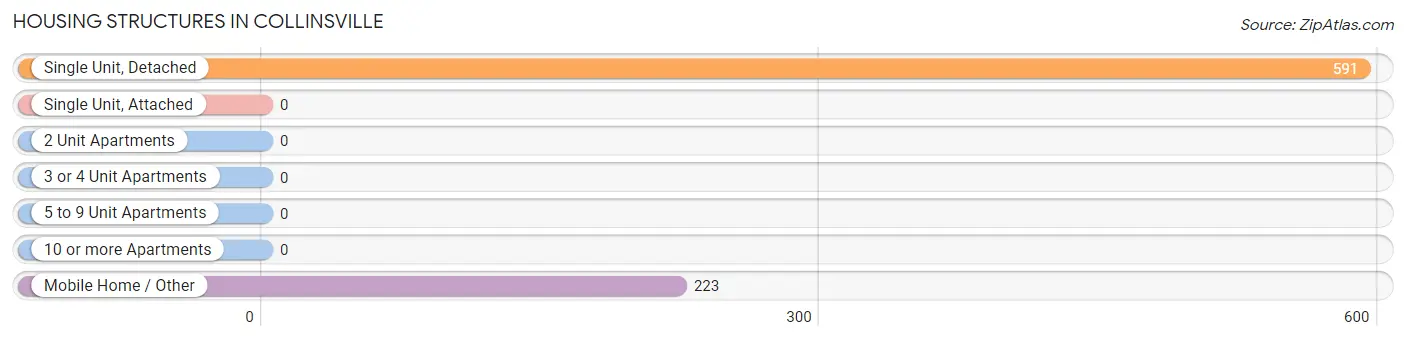
| Structure Type | # Housing Units | % Housing Units |
| Single Unit, Detached | 591 | 72.6% |
| Single Unit, Attached | 0 | 0.0% |
| 2 Unit Apartments | 0 | 0.0% |
| 3 or 4 Unit Apartments | 0 | 0.0% |
| 5 to 9 Unit Apartments | 0 | 0.0% |
| 10 or more Apartments | 0 | 0.0% |
| Mobile Home / Other | 223 | 27.4% |
| Total | 814 | 100.0% |
Housing Structures by Occupancy in Collinsville
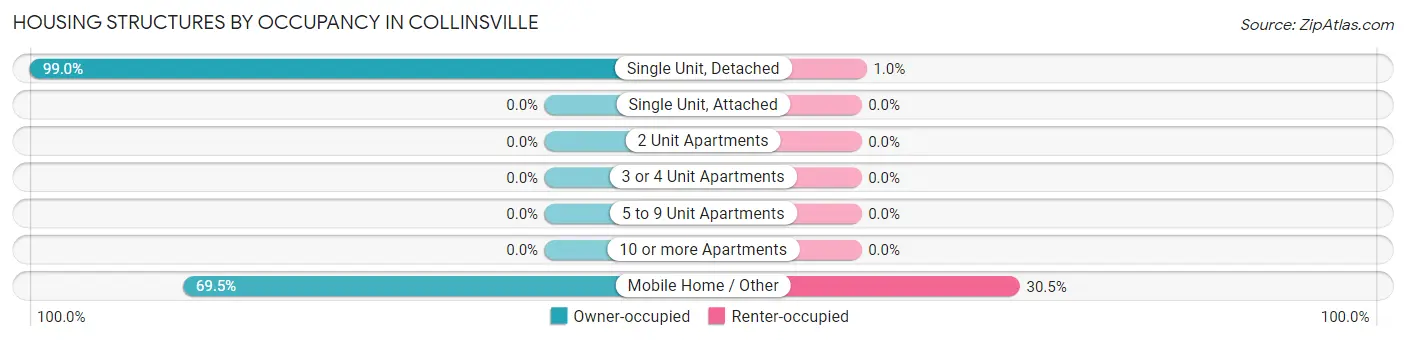
| Structure Type | Owner-occupied | Renter-occupied |
| Single Unit, Detached | 585 (99.0%) | 6 (1.0%) |
| Single Unit, Attached | 0 (0.0%) | 0 (0.0%) |
| 2 Unit Apartments | 0 (0.0%) | 0 (0.0%) |
| 3 or 4 Unit Apartments | 0 (0.0%) | 0 (0.0%) |
| 5 to 9 Unit Apartments | 0 (0.0%) | 0 (0.0%) |
| 10 or more Apartments | 0 (0.0%) | 0 (0.0%) |
| Mobile Home / Other | 155 (69.5%) | 68 (30.5%) |
| Total | 740 (90.9%) | 74 (9.1%) |
Housing Structures by Number of Rooms in Collinsville
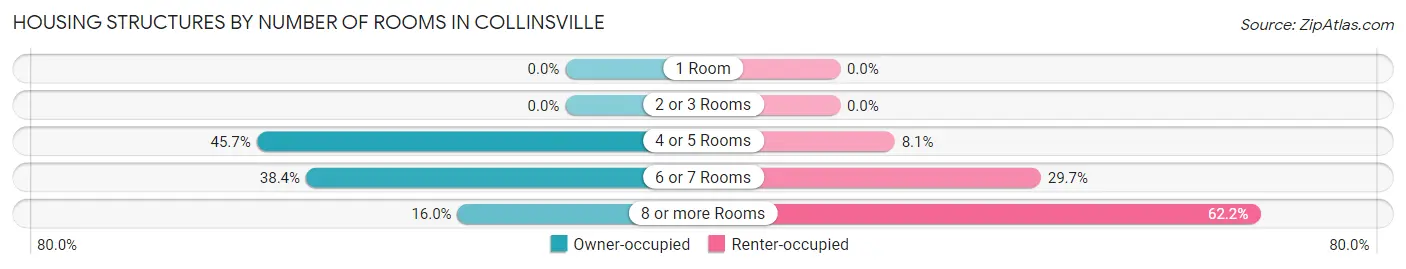
| Number of Rooms | Owner-occupied | Renter-occupied |
| 1 Room | 0 (0.0%) | 0 (0.0%) |
| 2 or 3 Rooms | 0 (0.0%) | 0 (0.0%) |
| 4 or 5 Rooms | 338 (45.7%) | 6 (8.1%) |
| 6 or 7 Rooms | 284 (38.4%) | 22 (29.7%) |
| 8 or more Rooms | 118 (16.0%) | 46 (62.2%) |
| Total | 740 (100.0%) | 74 (100.0%) |
Housing Structure by Heating Type in Collinsville
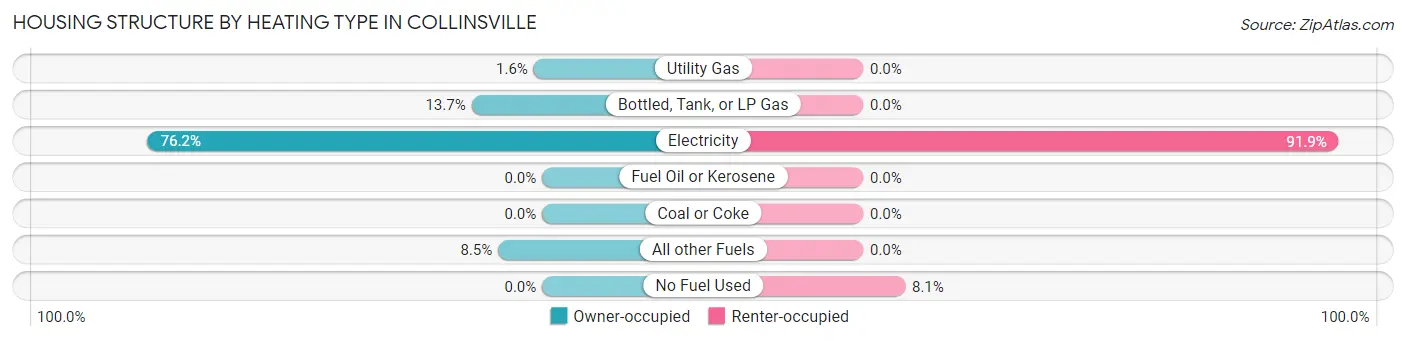
| Heating Type | Owner-occupied | Renter-occupied |
| Utility Gas | 12 (1.6%) | 0 (0.0%) |
| Bottled, Tank, or LP Gas | 101 (13.7%) | 0 (0.0%) |
| Electricity | 564 (76.2%) | 68 (91.9%) |
| Fuel Oil or Kerosene | 0 (0.0%) | 0 (0.0%) |
| Coal or Coke | 0 (0.0%) | 0 (0.0%) |
| All other Fuels | 63 (8.5%) | 0 (0.0%) |
| No Fuel Used | 0 (0.0%) | 6 (8.1%) |
| Total | 740 (100.0%) | 74 (100.0%) |
Household Vehicle Usage in Collinsville
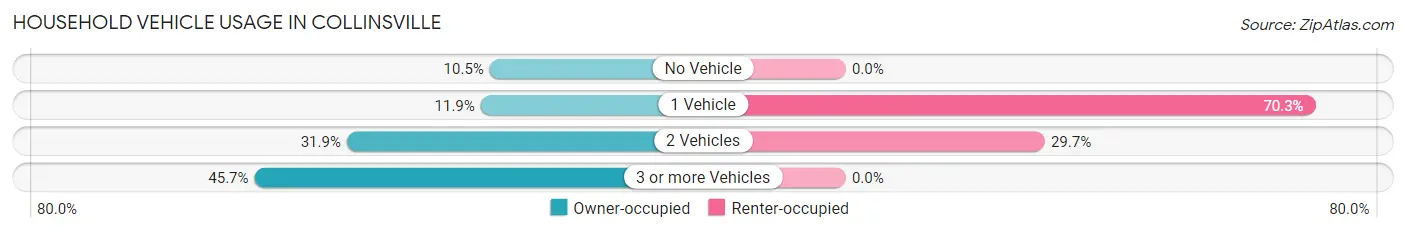
| Vehicles per Household | Owner-occupied | Renter-occupied |
| No Vehicle | 78 (10.5%) | 0 (0.0%) |
| 1 Vehicle | 88 (11.9%) | 52 (70.3%) |
| 2 Vehicles | 236 (31.9%) | 22 (29.7%) |
| 3 or more Vehicles | 338 (45.7%) | 0 (0.0%) |
| Total | 740 (100.0%) | 74 (100.0%) |
Real Estate & Mortgages in Collinsville
Real Estate and Mortgage Overview in Collinsville
| Characteristic | Without Mortgage | With Mortgage |
| Housing Units | 244 | 496 |
| Median Property Value | $113,400 | $202,800 |
| Median Household Income | $38,261 | $110 |
| Monthly Housing Costs | $405 | $0 |
| Real Estate Taxes | $911 | $78 |
Property Value by Mortgage Status in Collinsville
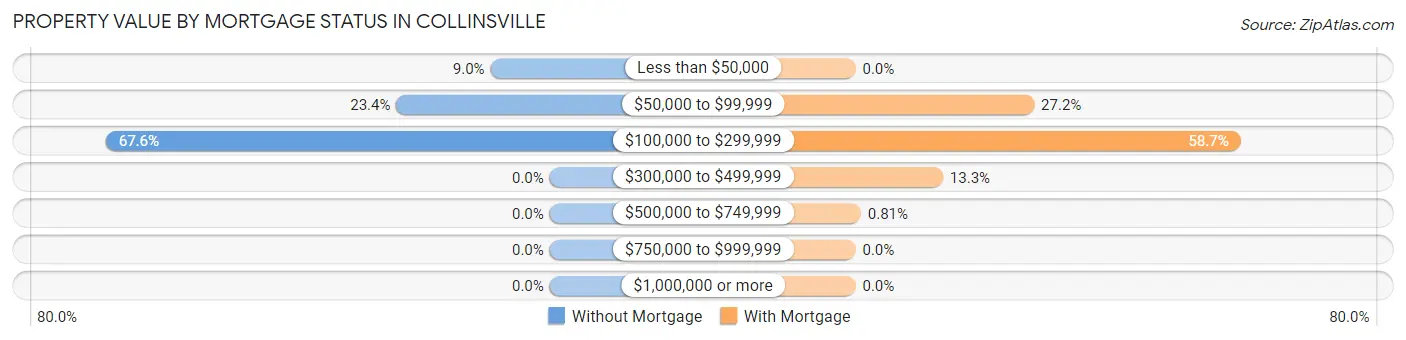
| Property Value | Without Mortgage | With Mortgage |
| Less than $50,000 | 22 (9.0%) | 0 (0.0%) |
| $50,000 to $99,999 | 57 (23.4%) | 135 (27.2%) |
| $100,000 to $299,999 | 165 (67.6%) | 291 (58.7%) |
| $300,000 to $499,999 | 0 (0.0%) | 66 (13.3%) |
| $500,000 to $749,999 | 0 (0.0%) | 4 (0.8%) |
| $750,000 to $999,999 | 0 (0.0%) | 0 (0.0%) |
| $1,000,000 or more | 0 (0.0%) | 0 (0.0%) |
| Total | 244 (100.0%) | 496 (100.0%) |
Household Income by Mortgage Status in Collinsville
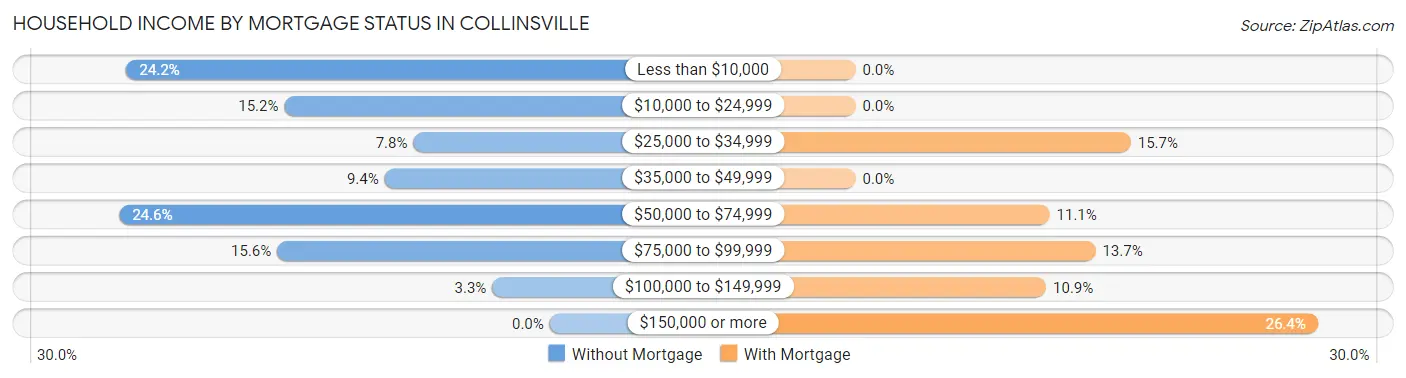
| Household Income | Without Mortgage | With Mortgage |
| Less than $10,000 | 59 (24.2%) | 0 (0.0%) |
| $10,000 to $24,999 | 37 (15.2%) | 0 (0.0%) |
| $25,000 to $34,999 | 19 (7.8%) | 78 (15.7%) |
| $35,000 to $49,999 | 23 (9.4%) | 0 (0.0%) |
| $50,000 to $74,999 | 60 (24.6%) | 55 (11.1%) |
| $75,000 to $99,999 | 38 (15.6%) | 68 (13.7%) |
| $100,000 to $149,999 | 8 (3.3%) | 54 (10.9%) |
| $150,000 or more | 0 (0.0%) | 131 (26.4%) |
| Total | 244 (100.0%) | 496 (100.0%) |
Property Value to Household Income Ratio in Collinsville
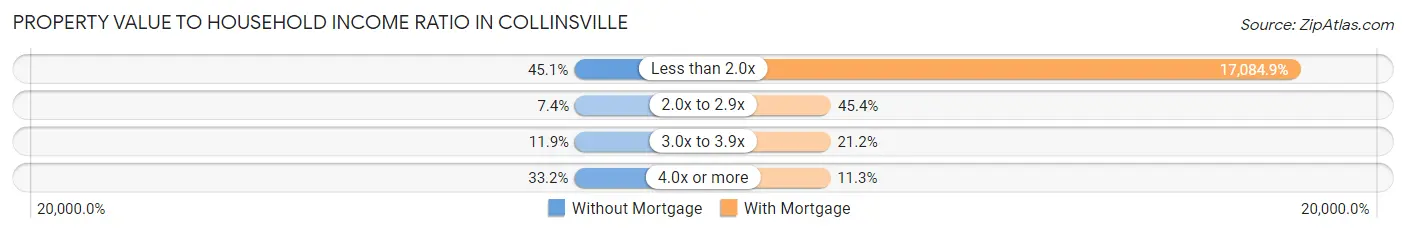
| Value-to-Income Ratio | Without Mortgage | With Mortgage |
| Less than 2.0x | 110 (45.1%) | 84,741 (17,084.9%) |
| 2.0x to 2.9x | 18 (7.4%) | 225 (45.4%) |
| 3.0x to 3.9x | 29 (11.9%) | 105 (21.2%) |
| 4.0x or more | 81 (33.2%) | 56 (11.3%) |
| Total | 244 (100.0%) | 496 (100.0%) |
Real Estate Taxes by Mortgage Status in Collinsville
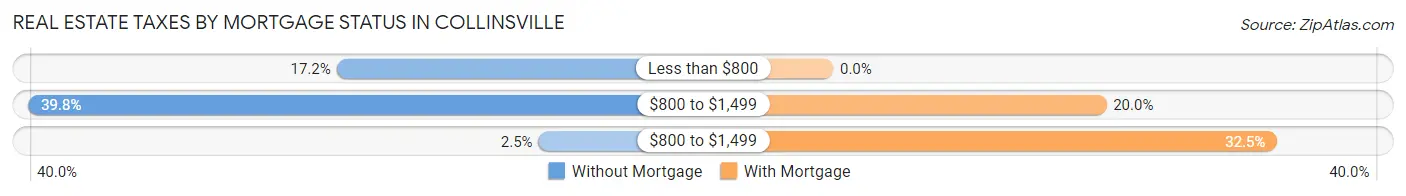
| Property Taxes | Without Mortgage | With Mortgage |
| Less than $800 | 42 (17.2%) | 0 (0.0%) |
| $800 to $1,499 | 97 (39.8%) | 99 (20.0%) |
| $800 to $1,499 | 6 (2.5%) | 161 (32.5%) |
| Total | 244 (100.0%) | 496 (100.0%) |
Health & Disability in Collinsville
Health Insurance Coverage by Age in Collinsville
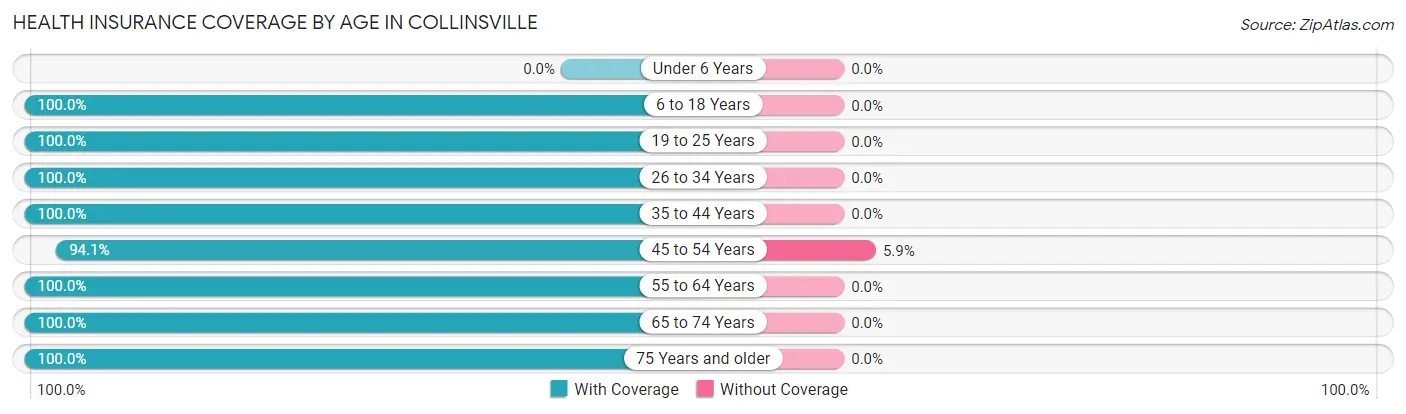
| Age Bracket | With Coverage | Without Coverage |
| Under 6 Years | 0 (0.0%) | 0 (0.0%) |
| 6 to 18 Years | 120 (100.0%) | 0 (0.0%) |
| 19 to 25 Years | 192 (100.0%) | 0 (0.0%) |
| 26 to 34 Years | 60 (100.0%) | 0 (0.0%) |
| 35 to 44 Years | 107 (100.0%) | 0 (0.0%) |
| 45 to 54 Years | 350 (94.1%) | 22 (5.9%) |
| 55 to 64 Years | 299 (100.0%) | 0 (0.0%) |
| 65 to 74 Years | 451 (100.0%) | 0 (0.0%) |
| 75 Years and older | 168 (100.0%) | 0 (0.0%) |
| Total | 1,747 (98.8%) | 22 (1.2%) |
Health Insurance Coverage by Citizenship Status in Collinsville
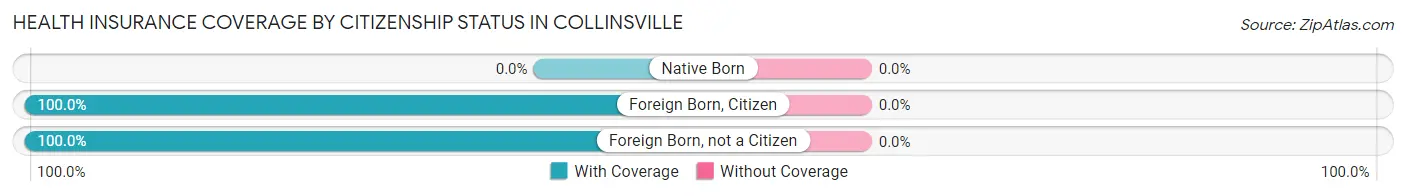
| Citizenship Status | With Coverage | Without Coverage |
| Native Born | 0 (0.0%) | 0 (0.0%) |
| Foreign Born, Citizen | 120 (100.0%) | 0 (0.0%) |
| Foreign Born, not a Citizen | 192 (100.0%) | 0 (0.0%) |
Health Insurance Coverage by Household Income in Collinsville
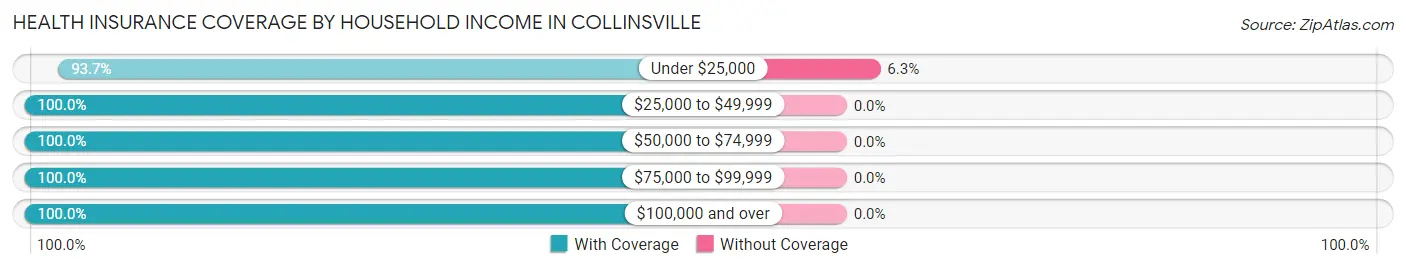
| Household Income | With Coverage | Without Coverage |
| Under $25,000 | 327 (93.7%) | 22 (6.3%) |
| $25,000 to $49,999 | 151 (100.0%) | 0 (0.0%) |
| $50,000 to $74,999 | 181 (100.0%) | 0 (0.0%) |
| $75,000 to $99,999 | 216 (100.0%) | 0 (0.0%) |
| $100,000 and over | 872 (100.0%) | 0 (0.0%) |
Public vs Private Health Insurance Coverage by Age in Collinsville
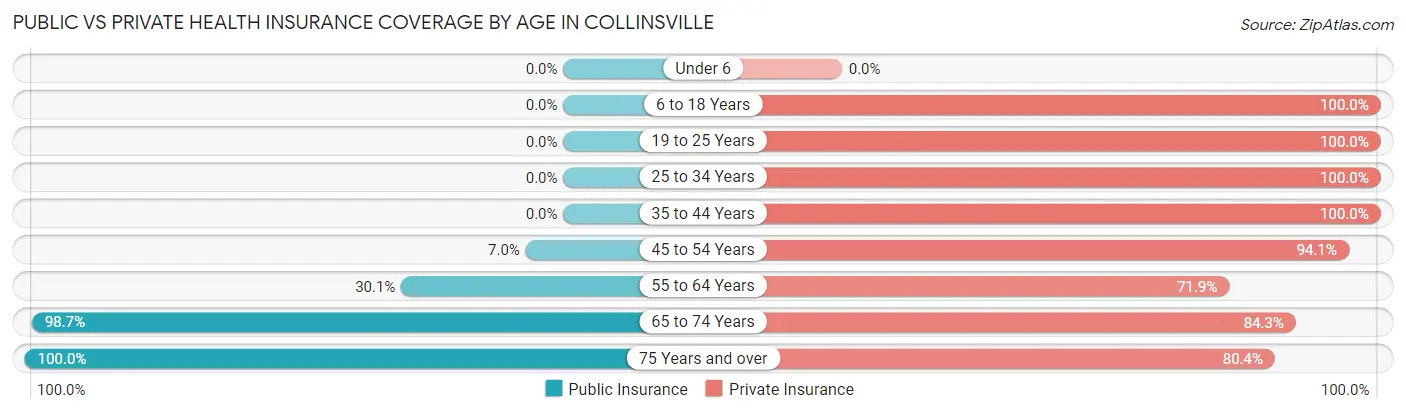
| Age Bracket | Public Insurance | Private Insurance |
| Under 6 | 0 (0.0%) | 0 (0.0%) |
| 6 to 18 Years | 0 (0.0%) | 120 (100.0%) |
| 19 to 25 Years | 0 (0.0%) | 192 (100.0%) |
| 25 to 34 Years | 0 (0.0%) | 60 (100.0%) |
| 35 to 44 Years | 0 (0.0%) | 107 (100.0%) |
| 45 to 54 Years | 26 (7.0%) | 350 (94.1%) |
| 55 to 64 Years | 90 (30.1%) | 215 (71.9%) |
| 65 to 74 Years | 445 (98.7%) | 380 (84.3%) |
| 75 Years and over | 168 (100.0%) | 135 (80.4%) |
| Total | 729 (41.2%) | 1,559 (88.1%) |
Disability Status by Sex by Age in Collinsville
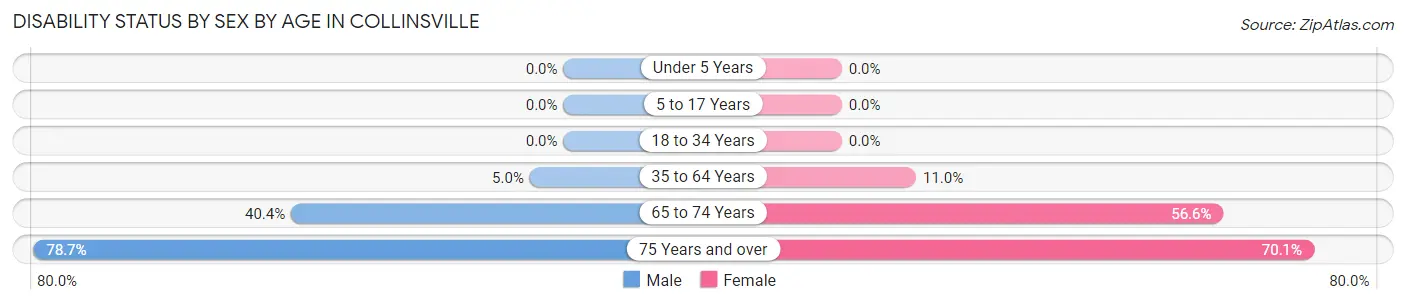
| Age Bracket | Male | Female |
| Under 5 Years | 0 (0.0%) | 0 (0.0%) |
| 5 to 17 Years | 0 (0.0%) | 0 (0.0%) |
| 18 to 34 Years | 0 (0.0%) | 0 (0.0%) |
| 35 to 64 Years | 18 (5.0%) | 46 (11.0%) |
| 65 to 74 Years | 91 (40.4%) | 128 (56.6%) |
| 75 Years and over | 48 (78.7%) | 75 (70.1%) |
Disability Class by Sex by Age in Collinsville
Disability Class: Hearing Difficulty
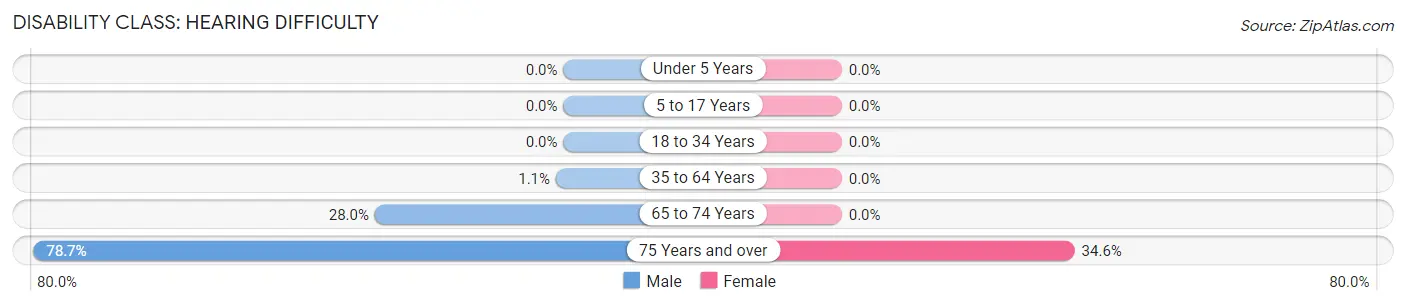
| Age Bracket | Male | Female |
| Under 5 Years | 0 (0.0%) | 0 (0.0%) |
| 5 to 17 Years | 0 (0.0%) | 0 (0.0%) |
| 18 to 34 Years | 0 (0.0%) | 0 (0.0%) |
| 35 to 64 Years | 4 (1.1%) | 0 (0.0%) |
| 65 to 74 Years | 63 (28.0%) | 0 (0.0%) |
| 75 Years and over | 48 (78.7%) | 37 (34.6%) |
Disability Class: Vision Difficulty
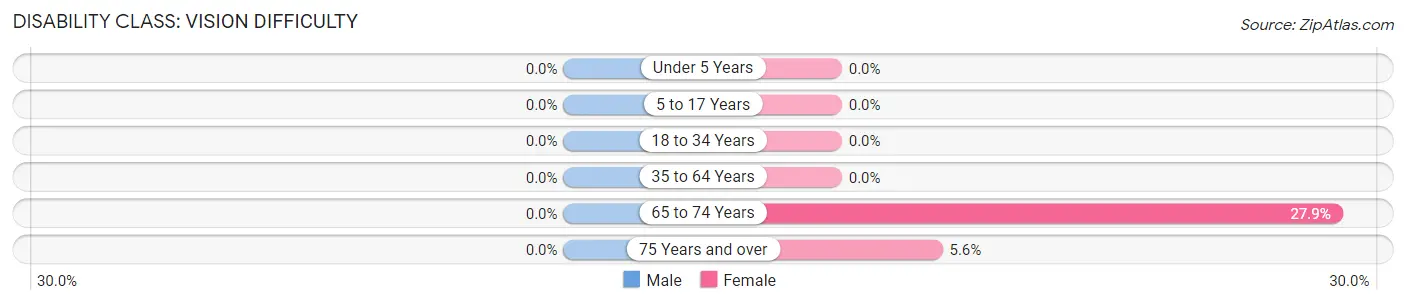
| Age Bracket | Male | Female |
| Under 5 Years | 0 (0.0%) | 0 (0.0%) |
| 5 to 17 Years | 0 (0.0%) | 0 (0.0%) |
| 18 to 34 Years | 0 (0.0%) | 0 (0.0%) |
| 35 to 64 Years | 0 (0.0%) | 0 (0.0%) |
| 65 to 74 Years | 0 (0.0%) | 63 (27.9%) |
| 75 Years and over | 0 (0.0%) | 6 (5.6%) |
Disability Class: Cognitive Difficulty
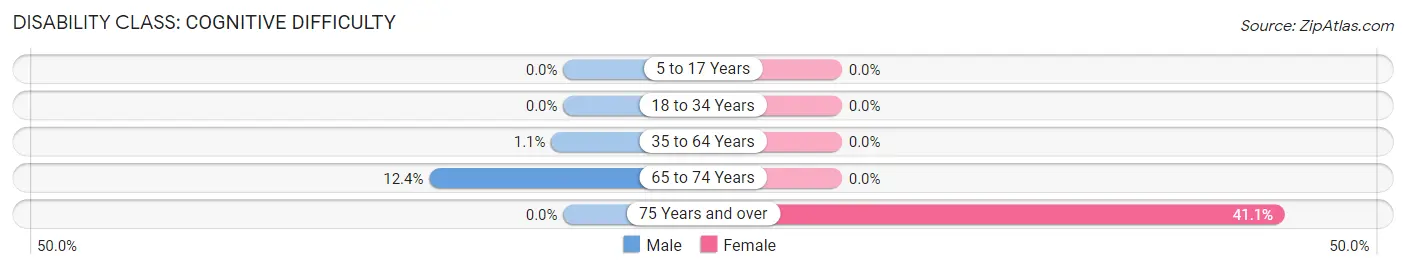
| Age Bracket | Male | Female |
| 5 to 17 Years | 0 (0.0%) | 0 (0.0%) |
| 18 to 34 Years | 0 (0.0%) | 0 (0.0%) |
| 35 to 64 Years | 4 (1.1%) | 0 (0.0%) |
| 65 to 74 Years | 28 (12.4%) | 0 (0.0%) |
| 75 Years and over | 0 (0.0%) | 44 (41.1%) |
Disability Class: Ambulatory Difficulty
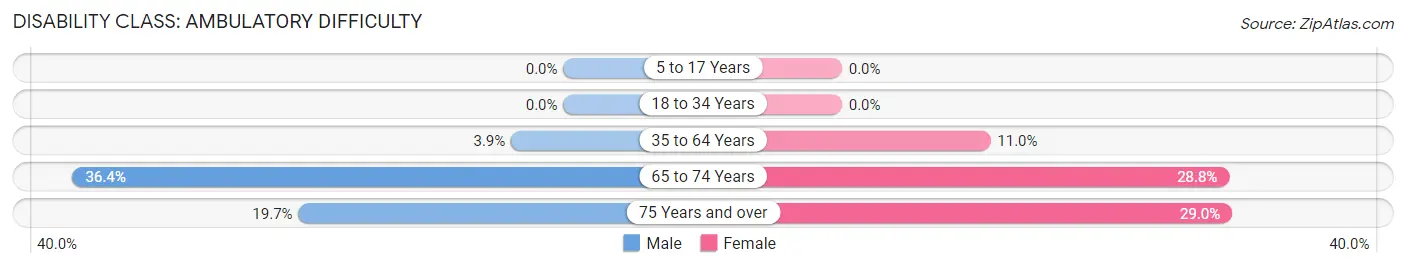
| Age Bracket | Male | Female |
| 5 to 17 Years | 0 (0.0%) | 0 (0.0%) |
| 18 to 34 Years | 0 (0.0%) | 0 (0.0%) |
| 35 to 64 Years | 14 (3.9%) | 46 (11.0%) |
| 65 to 74 Years | 82 (36.4%) | 65 (28.8%) |
| 75 Years and over | 12 (19.7%) | 31 (29.0%) |
Disability Class: Self-Care Difficulty
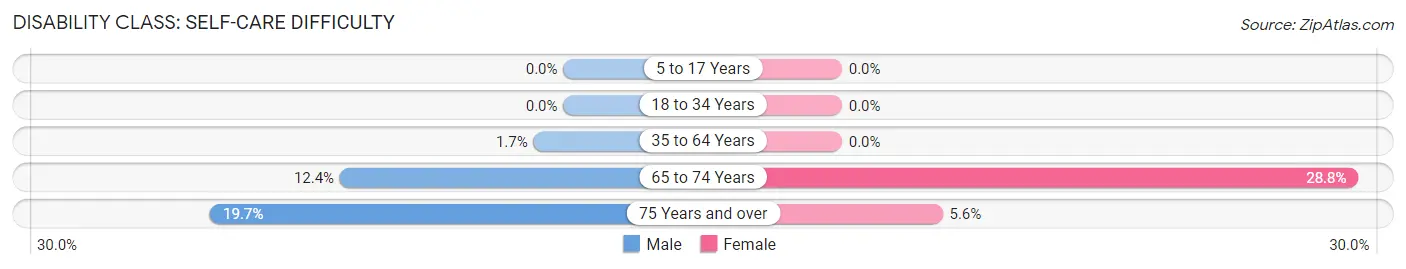
| Age Bracket | Male | Female |
| 5 to 17 Years | 0 (0.0%) | 0 (0.0%) |
| 18 to 34 Years | 0 (0.0%) | 0 (0.0%) |
| 35 to 64 Years | 6 (1.7%) | 0 (0.0%) |
| 65 to 74 Years | 28 (12.4%) | 65 (28.8%) |
| 75 Years and over | 12 (19.7%) | 6 (5.6%) |
Technology Access in Collinsville
Computing Device Access in Collinsville
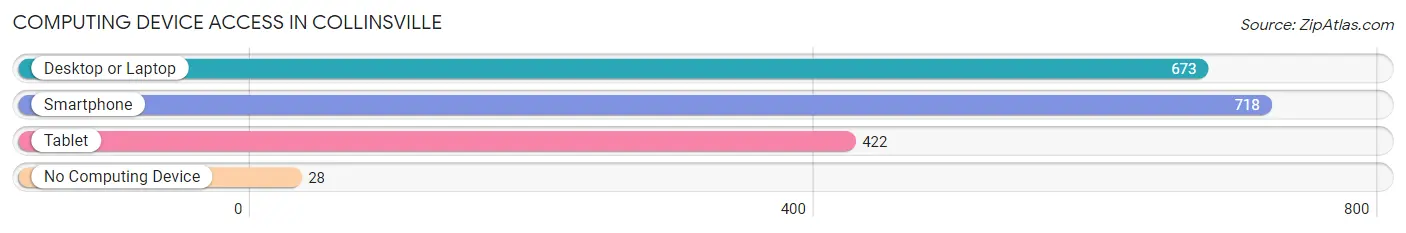
| Device Type | # Households | % Households |
| Desktop or Laptop | 673 | 82.7% |
| Smartphone | 718 | 88.2% |
| Tablet | 422 | 51.8% |
| No Computing Device | 28 | 3.4% |
| Total | 814 | 100.0% |
Internet Access in Collinsville
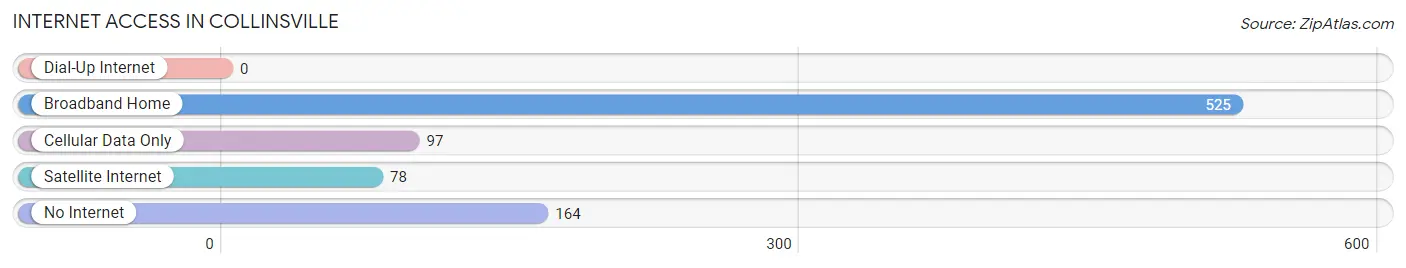
| Internet Type | # Households | % Households |
| Dial-Up Internet | 0 | 0.0% |
| Broadband Home | 525 | 64.5% |
| Cellular Data Only | 97 | 11.9% |
| Satellite Internet | 78 | 9.6% |
| No Internet | 164 | 20.2% |
| Total | 814 | 100.0% |
Collinsville Summary
History
The town of Collinsville, Mississippi is located in the northern part of the state, in the county of Leake. It is situated on the banks of the Pearl River, and is part of the Jackson Metropolitan Statistical Area. The town was founded in 1837 by William Collins, a former slave who had purchased his freedom. He named the town after himself, and it quickly became a thriving community.
The town was a major stop on the Mississippi Central Railroad, which connected Jackson to Meridian. This allowed the town to become a major hub for the cotton industry, as well as a center for trade and commerce. The town was also home to several churches, schools, and businesses.
In the late 19th century, the town was home to a large African-American population, and was a major stop on the Underground Railroad. During the Civil War, the town was occupied by Union forces, and many of the town’s buildings were destroyed. After the war, the town slowly began to rebuild, and by the early 20th century, it had become a thriving community once again.
Geography
Collinsville is located in the northern part of Mississippi, in the county of Leake. It is situated on the banks of the Pearl River, and is part of the Jackson Metropolitan Statistical Area. The town is located in a rural area, and is surrounded by rolling hills and forests. The town is located about 40 miles north of Jackson, and is about an hour’s drive from the state capital.
The town has a total area of 1.2 square miles, all of which is land. The town has a humid subtropical climate, with hot, humid summers and mild winters. The average annual temperature is around 70 degrees Fahrenheit, and the average annual precipitation is around 50 inches.
Economy
The economy of Collinsville is largely based on agriculture and manufacturing. The town is home to several large farms, which produce cotton, soybeans, corn, and other crops. The town is also home to several manufacturing plants, which produce a variety of products, including furniture, clothing, and automotive parts.
The town is also home to several small businesses, including restaurants, shops, and other services. The town is also home to several banks, which provide financial services to the local community.
Demographics
As of the 2010 census, the population of Collinsville was 1,845. The racial makeup of the town was 79.3% White, 18.2% African American, 0.3% Native American, 0.2% Asian, 0.1% Pacific Islander, 0.7% from other races, and 1.4% from two or more races. Hispanic or Latino of any race were 1.7% of the population.
The median income for a household in the town was $30,938, and the median income for a family was $37,917. The per capita income for the town was $15,945. About 17.2% of families and 20.2% of the population were below the poverty line, including 28.3% of those under age 18 and 15.2% of those age 65 or over.
Common Questions
What is Per Capita Income in Collinsville?
Per Capita income in Collinsville is $34,864.
What is the Median Family Income in Collinsville?
Median Family Income in Collinsville is $84,914.
What is the Median Household income in Collinsville?
Median Household Income in Collinsville is $72,574.
What is Income or Wage Gap in Collinsville?
Income or Wage Gap in Collinsville is 21.4%.
Women in Collinsville earn 78.6 cents for every dollar earned by a man.
What is Inequality or Gini Index in Collinsville?
Inequality or Gini Index in Collinsville is 0.46.
What is the Total Population of Collinsville?
Total Population of Collinsville is 1,783.
What is the Total Male Population of Collinsville?
Total Male Population of Collinsville is 791.
What is the Total Female Population of Collinsville?
Total Female Population of Collinsville is 992.
What is the Ratio of Males per 100 Females in Collinsville?
There are 79.74 Males per 100 Females in Collinsville.
What is the Ratio of Females per 100 Males in Collinsville?
There are 125.41 Females per 100 Males in Collinsville.
What is the Median Population Age in Collinsville?
Median Population Age in Collinsville is 55.9 Years.
What is the Average Family Size in Collinsville
Average Family Size in Collinsville is 2.7 People.
What is the Average Household Size in Collinsville
Average Household Size in Collinsville is 2.2 People.
How Large is the Labor Force in Collinsville?
There are 825 People in the Labor Forcein in Collinsville.
What is the Percentage of People in the Labor Force in Collinsville?
49.2% of People are in the Labor Force in Collinsville.