Mccomb, MS Map & Demographics
Mccomb Map
Mccomb Overview
$19,123
PER CAPITA INCOME
$39,630
AVG FAMILY INCOME
$37,288
AVG HOUSEHOLD INCOME
27.1%
WAGE / INCOME GAP [ % ]
72.9¢/ $1
WAGE / INCOME GAP [ $ ]
$12,947
FAMILY INCOME DEFICIT
0.46
INEQUALITY / GINI INDEX
12,295
TOTAL POPULATION
5,337
MALE POPULATION
6,958
FEMALE POPULATION
76.70
MALES / 100 FEMALES
130.37
FEMALES / 100 MALES
36.8
MEDIAN AGE
3.6
AVG FAMILY SIZE
2.4
AVG HOUSEHOLD SIZE
4,669
LABOR FORCE [ PEOPLE ]
50.2%
PERCENT IN LABOR FORCE
5.8%
UNEMPLOYMENT RATE
Mccomb Zip Codes
Income in Mccomb
Income Overview in Mccomb
Per Capita Income in Mccomb is $19,123, while median incomes of families and households are $39,630 and $37,288 respectively.
| Characteristic | Number | Measure |
| Per Capita Income | 12,295 | $19,123 |
| Median Family Income | 2,573 | $39,630 |
| Mean Family Income | 2,573 | $52,007 |
| Median Household Income | 5,024 | $37,288 |
| Mean Household Income | 5,024 | $43,982 |
| Income Deficit | 2,573 | $12,947 |
| Wage / Income Gap (%) | 12,295 | 27.06% |
| Wage / Income Gap ($) | 12,295 | 72.94¢ per $1 |
| Gini / Inequality Index | 12,295 | 0.46 |
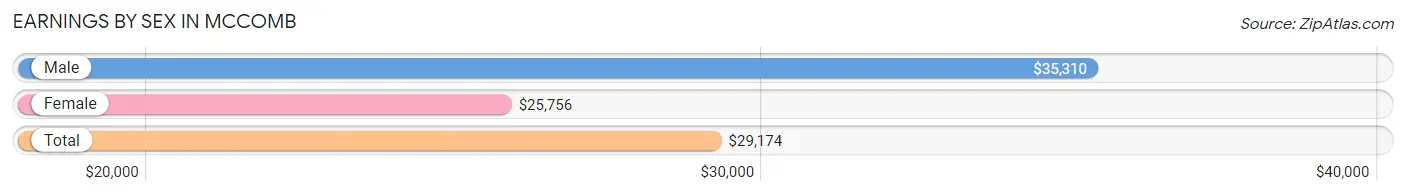
Earnings by Sex in Mccomb
Average Earnings in Mccomb are $29,174, $35,310 for men and $25,756 for women, a difference of 27.1%.
| Sex | Number | Average Earnings |
| Male | 1,982 (41.9%) | $35,310 |
| Female | 2,751 (58.1%) | $25,756 |
| Total | 4,733 (100.0%) | $29,174 |
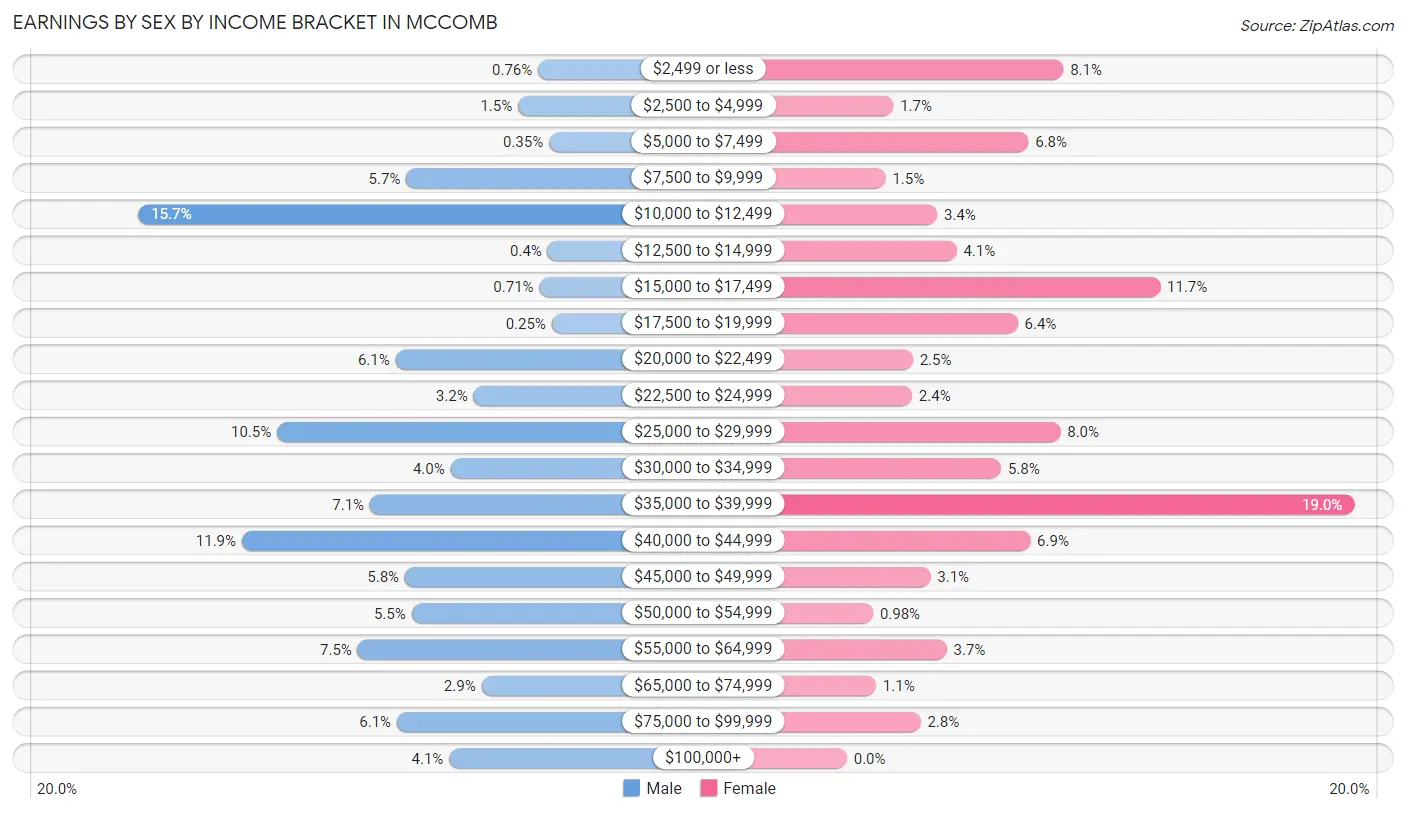
Earnings by Sex by Income Bracket in Mccomb
The most common earnings brackets in Mccomb are $10,000 to $12,499 for men (312 | 15.7%) and $35,000 to $39,999 for women (523 | 19.0%).
| Income | Male | Female |
| $2,499 or less | 15 (0.8%) | 223 (8.1%) |
| $2,500 to $4,999 | 30 (1.5%) | 48 (1.7%) |
| $5,000 to $7,499 | 7 (0.4%) | 187 (6.8%) |
| $7,500 to $9,999 | 113 (5.7%) | 40 (1.5%) |
| $10,000 to $12,499 | 312 (15.7%) | 93 (3.4%) |
| $12,500 to $14,999 | 8 (0.4%) | 113 (4.1%) |
| $15,000 to $17,499 | 14 (0.7%) | 323 (11.7%) |
| $17,500 to $19,999 | 5 (0.3%) | 176 (6.4%) |
| $20,000 to $22,499 | 121 (6.1%) | 68 (2.5%) |
| $22,500 to $24,999 | 63 (3.2%) | 67 (2.4%) |
| $25,000 to $29,999 | 209 (10.5%) | 220 (8.0%) |
| $30,000 to $34,999 | 80 (4.0%) | 159 (5.8%) |
| $35,000 to $39,999 | 140 (7.1%) | 523 (19.0%) |
| $40,000 to $44,999 | 235 (11.9%) | 189 (6.9%) |
| $45,000 to $49,999 | 114 (5.8%) | 86 (3.1%) |
| $50,000 to $54,999 | 109 (5.5%) | 27 (1.0%) |
| $55,000 to $64,999 | 149 (7.5%) | 103 (3.7%) |
| $65,000 to $74,999 | 57 (2.9%) | 30 (1.1%) |
| $75,000 to $99,999 | 120 (6.0%) | 76 (2.8%) |
| $100,000+ | 81 (4.1%) | 0 (0.0%) |
| Total | 1,982 (100.0%) | 2,751 (100.0%) |
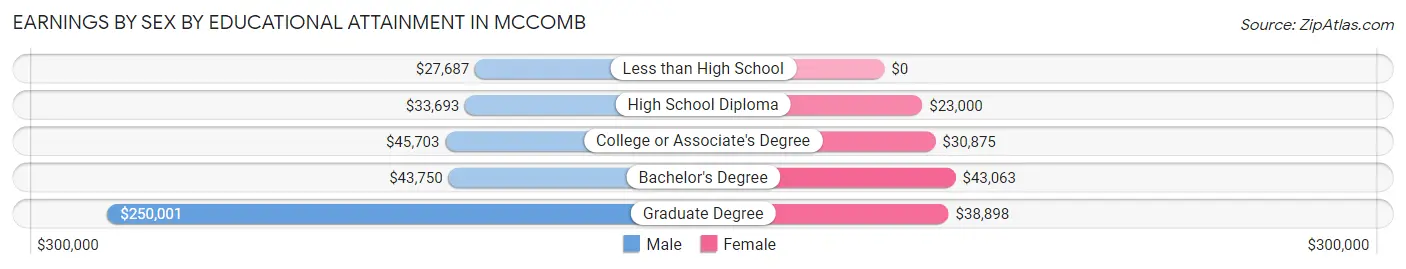
Earnings by Sex by Educational Attainment in Mccomb
Average earnings in Mccomb are $37,013 for men and $29,063 for women, a difference of 21.5%. Men with an educational attainment of graduate degree enjoy the highest average annual earnings of $250,001, while those with less than high school education earn the least with $27,687. Women with an educational attainment of bachelor's degree earn the most with the average annual earnings of $43,063, while those with high school diploma education have the smallest earnings of $23,000.
| Educational Attainment | Male Income | Female Income |
| Less than High School | $27,687 | $0 |
| High School Diploma | $33,693 | $23,000 |
| College or Associate's Degree | $45,703 | $30,875 |
| Bachelor's Degree | $43,750 | $43,063 |
| Graduate Degree | $250,001 | $38,898 |
| Total | $37,013 | $29,063 |
Family Income in Mccomb
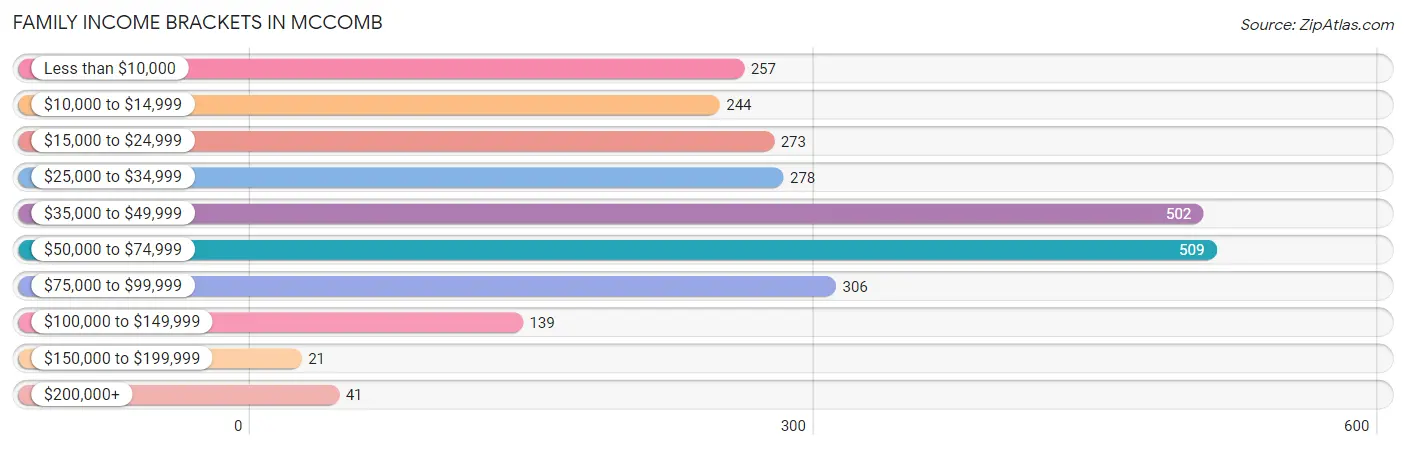
Family Income Brackets in Mccomb
According to the Mccomb family income data, there are 509 families falling into the $50,000 to $74,999 income range, which is the most common income bracket and makes up 19.8% of all families. Conversely, the $150,000 to $199,999 income bracket is the least frequent group with only 21 families (0.8%) belonging to this category.
| Income Bracket | # Families | % Families |
| Less than $10,000 | 257 | 10.0% |
| $10,000 to $14,999 | 244 | 9.5% |
| $15,000 to $24,999 | 273 | 10.6% |
| $25,000 to $34,999 | 278 | 10.8% |
| $35,000 to $49,999 | 502 | 19.5% |
| $50,000 to $74,999 | 509 | 19.8% |
| $75,000 to $99,999 | 306 | 11.9% |
| $100,000 to $149,999 | 139 | 5.4% |
| $150,000 to $199,999 | 21 | 0.8% |
| $200,000+ | 41 | 1.6% |
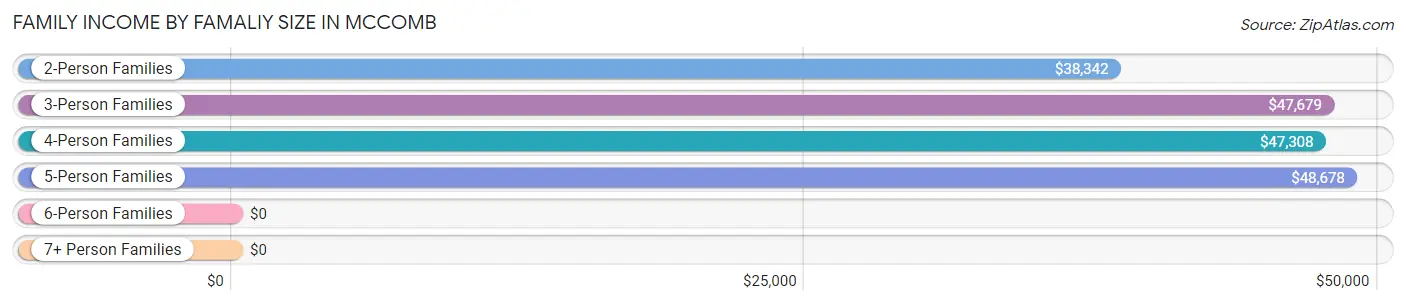
Family Income by Famaliy Size in Mccomb
5-person families (169 | 6.6%) account for the highest median family income in Mccomb with $48,678 per family, while 2-person families (1,510 | 58.7%) have the highest median income of $19,171 per family member.
| Income Bracket | # Families | Median Income |
| 2-Person Families | 1,510 (58.7%) | $38,342 |
| 3-Person Families | 515 (20.0%) | $47,679 |
| 4-Person Families | 270 (10.5%) | $47,308 |
| 5-Person Families | 169 (6.6%) | $48,678 |
| 6-Person Families | 37 (1.4%) | $0 |
| 7+ Person Families | 72 (2.8%) | $0 |
| Total | 2,573 (100.0%) | $39,630 |
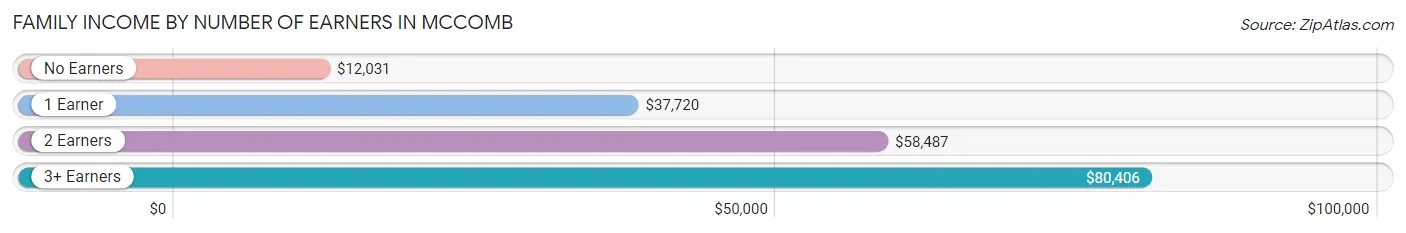
Family Income by Number of Earners in Mccomb
The median family income in Mccomb is $39,630, with families comprising 3+ earners (207) having the highest median family income of $80,406, while families with no earners (682) have the lowest median family income of $12,031, accounting for 8.1% and 26.5% of families, respectively.
| Number of Earners | # Families | Median Income |
| No Earners | 682 (26.5%) | $12,031 |
| 1 Earner | 1,032 (40.1%) | $37,720 |
| 2 Earners | 652 (25.3%) | $58,487 |
| 3+ Earners | 207 (8.1%) | $80,406 |
| Total | 2,573 (100.0%) | $39,630 |
Household Income in Mccomb
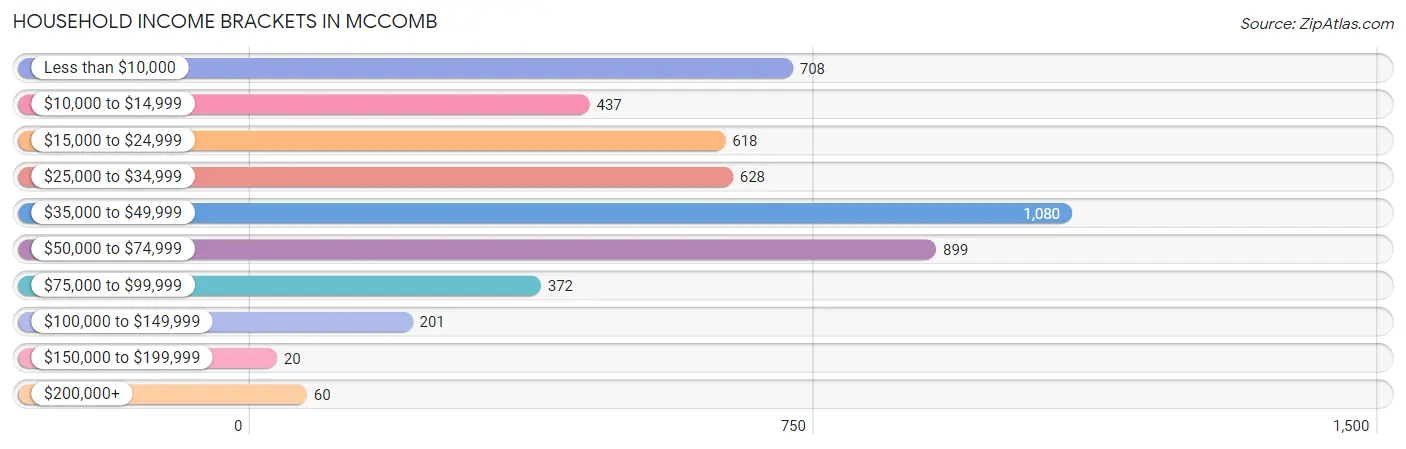
Household Income Brackets in Mccomb
With 1,080 households falling in the category, the $35,000 to $49,999 income range is the most frequent in Mccomb, accounting for 21.5% of all households. In contrast, only 20 households (0.4%) fall into the $150,000 to $199,999 income bracket, making it the least populous group.
| Income Bracket | # Households | % Households |
| Less than $10,000 | 708 | 14.1% |
| $10,000 to $14,999 | 437 | 8.7% |
| $15,000 to $24,999 | 618 | 12.3% |
| $25,000 to $34,999 | 628 | 12.5% |
| $35,000 to $49,999 | 1,080 | 21.5% |
| $50,000 to $74,999 | 899 | 17.9% |
| $75,000 to $99,999 | 372 | 7.4% |
| $100,000 to $149,999 | 201 | 4.0% |
| $150,000 to $199,999 | 20 | 0.4% |
| $200,000+ | 60 | 1.2% |
Household Income by Householder Age in Mccomb
The median household income in Mccomb is $37,288, with the highest median household income of $52,600 found in the 45 to 64 years age bracket for the primary householder. A total of 1,730 households (34.4%) fall into this category. Meanwhile, the 15 to 24 years age bracket for the primary householder has the lowest median household income of $0, with 147 households (2.9%) in this group.
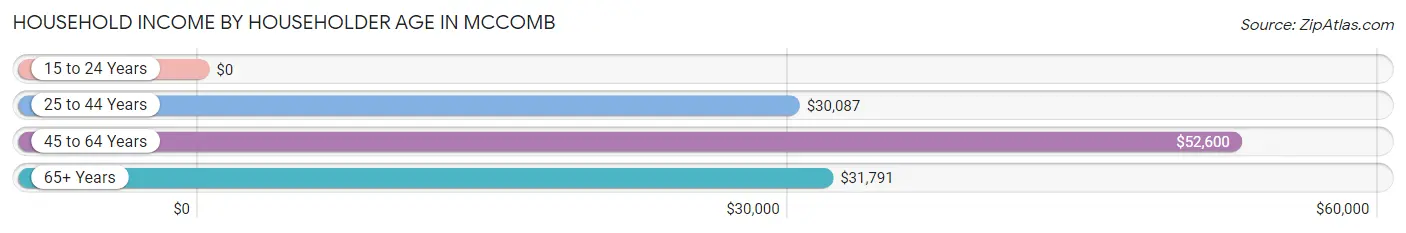
| Income Bracket | # Households | Median Income |
| 15 to 24 Years | 147 (2.9%) | $0 |
| 25 to 44 Years | 1,647 (32.8%) | $30,087 |
| 45 to 64 Years | 1,730 (34.4%) | $52,600 |
| 65+ Years | 1,500 (29.9%) | $31,791 |
| Total | 5,024 (100.0%) | $37,288 |
Poverty in Mccomb
Income Below Poverty by Sex and Age in Mccomb
With 29.7% poverty level for males and 33.7% for females among the residents of Mccomb, 5 year old males and 12 to 14 year old females are the most vulnerable to poverty, with 75 males (100.0%) and 219 females (70.4%) in their respective age groups living below the poverty level.
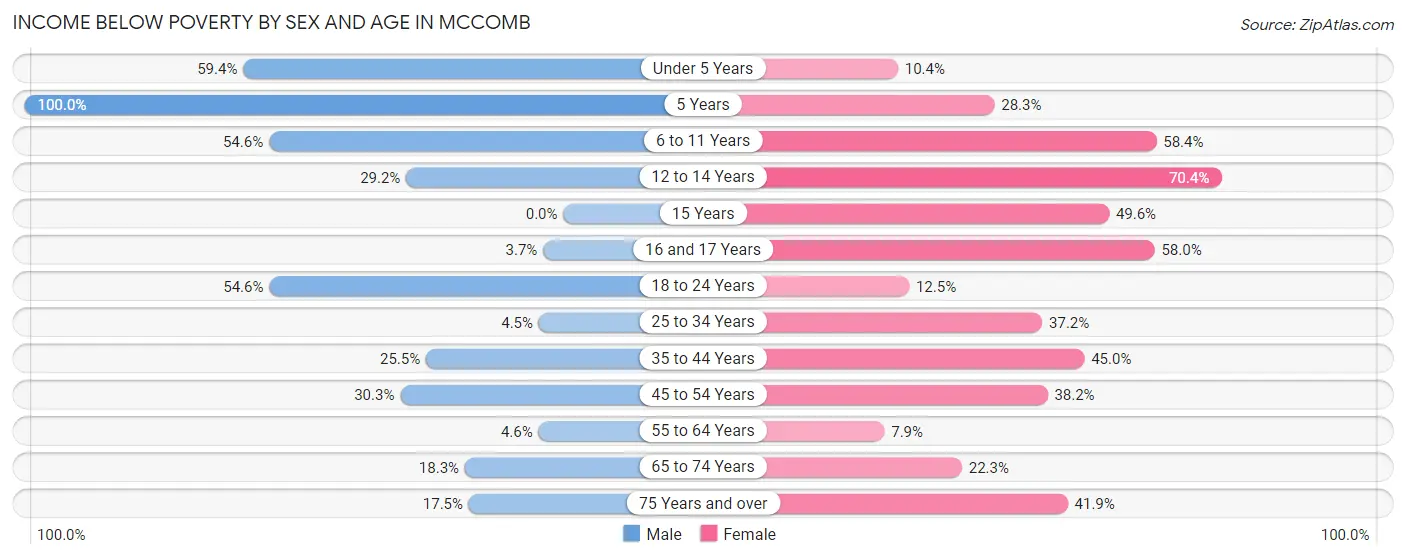
| Age Bracket | Male | Female |
| Under 5 Years | 205 (59.4%) | 53 (10.4%) |
| 5 Years | 75 (100.0%) | 15 (28.3%) |
| 6 to 11 Years | 418 (54.6%) | 383 (58.4%) |
| 12 to 14 Years | 35 (29.2%) | 219 (70.4%) |
| 15 Years | 0 (0.0%) | 61 (49.6%) |
| 16 and 17 Years | 4 (3.7%) | 65 (58.0%) |
| 18 to 24 Years | 286 (54.6%) | 62 (12.5%) |
| 25 to 34 Years | 23 (4.5%) | 374 (37.2%) |
| 35 to 44 Years | 160 (25.5%) | 324 (45.0%) |
| 45 to 54 Years | 132 (30.3%) | 313 (38.2%) |
| 55 to 64 Years | 35 (4.6%) | 63 (7.9%) |
| 65 to 74 Years | 93 (18.3%) | 151 (22.3%) |
| 75 Years and over | 50 (17.5%) | 184 (41.9%) |
| Total | 1,516 (29.7%) | 2,267 (33.7%) |
Income Above Poverty by Sex and Age in Mccomb
According to the poverty statistics in Mccomb, males aged 15 years and females aged 55 to 64 years are the age groups that are most secure financially, with 100.0% of males and 92.1% of females in these age groups living above the poverty line.
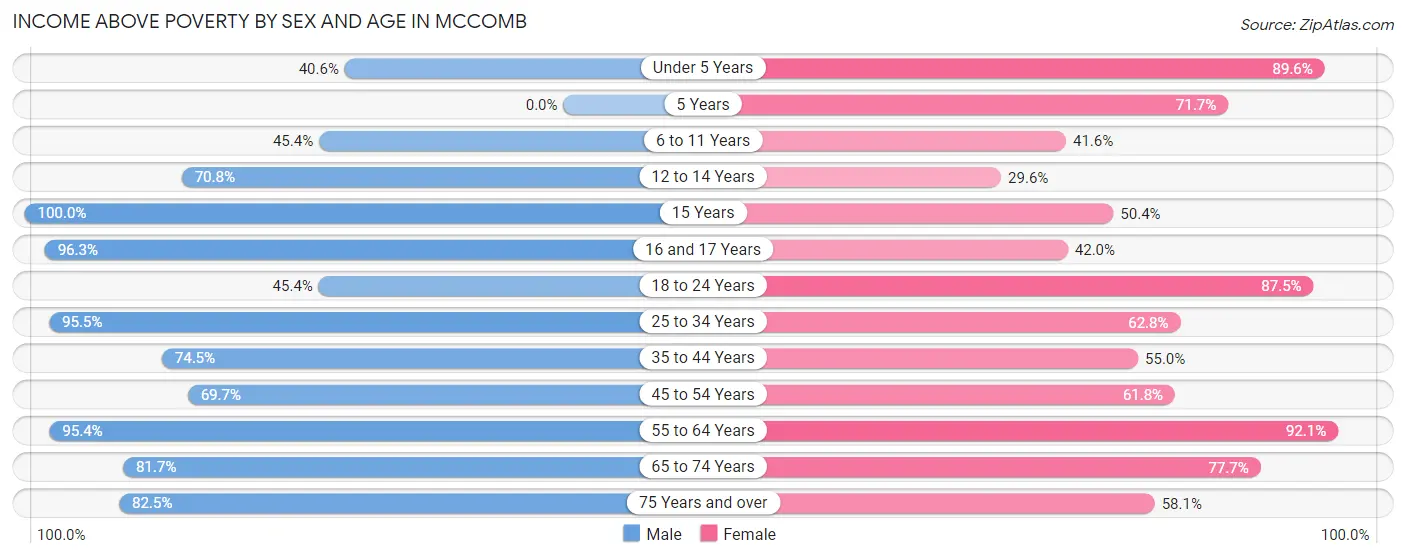
| Age Bracket | Male | Female |
| Under 5 Years | 140 (40.6%) | 457 (89.6%) |
| 5 Years | 0 (0.0%) | 38 (71.7%) |
| 6 to 11 Years | 347 (45.4%) | 273 (41.6%) |
| 12 to 14 Years | 85 (70.8%) | 92 (29.6%) |
| 15 Years | 37 (100.0%) | 62 (50.4%) |
| 16 and 17 Years | 103 (96.3%) | 47 (42.0%) |
| 18 to 24 Years | 238 (45.4%) | 435 (87.5%) |
| 25 to 34 Years | 484 (95.5%) | 632 (62.8%) |
| 35 to 44 Years | 468 (74.5%) | 396 (55.0%) |
| 45 to 54 Years | 304 (69.7%) | 507 (61.8%) |
| 55 to 64 Years | 724 (95.4%) | 735 (92.1%) |
| 65 to 74 Years | 416 (81.7%) | 527 (77.7%) |
| 75 Years and over | 235 (82.5%) | 255 (58.1%) |
| Total | 3,581 (70.3%) | 4,456 (66.3%) |
Income Below Poverty Among Married-Couple Families in Mccomb
The poverty statistics for married-couple families in Mccomb show that 12.1% or 139 of the total 1,150 families live below the poverty line. Families with 1 or 2 children have the highest poverty rate of 21.5%, comprising of 82 families. On the other hand, families with 3 or 4 children have the lowest poverty rate of 0.0%, which includes 0 families.
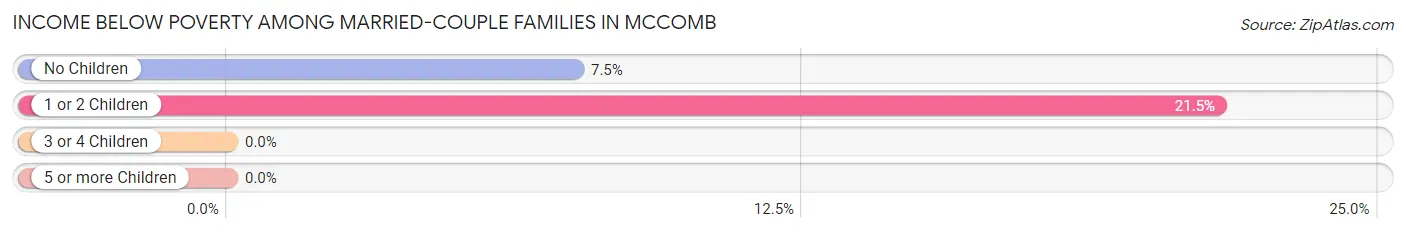
| Children | Above Poverty | Below Poverty |
| No Children | 700 (92.5%) | 57 (7.5%) |
| 1 or 2 Children | 299 (78.5%) | 82 (21.5%) |
| 3 or 4 Children | 12 (100.0%) | 0 (0.0%) |
| 5 or more Children | 0 (0.0%) | 0 (0.0%) |
| Total | 1,011 (87.9%) | 139 (12.1%) |
Income Below Poverty Among Single-Parent Households in Mccomb
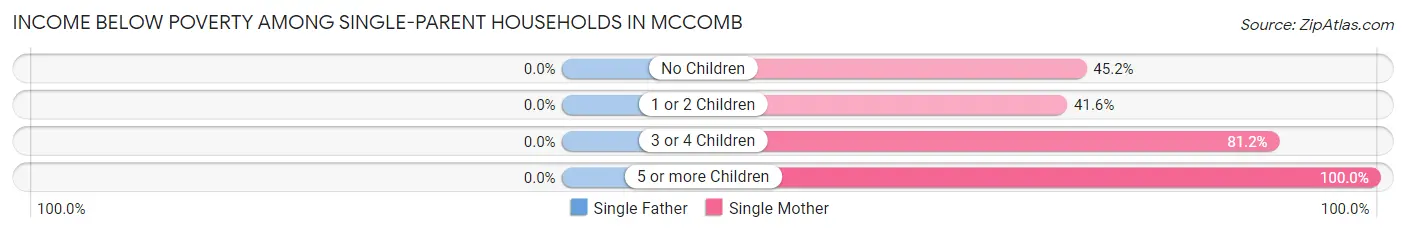
| Children | Single Father | Single Mother |
| No Children | 0 (0.0%) | 203 (45.2%) |
| 1 or 2 Children | 0 (0.0%) | 288 (41.6%) |
| 3 or 4 Children | 0 (0.0%) | 56 (81.2%) |
| 5 or more Children | 0 (0.0%) | 63 (100.0%) |
| Total | 0 (0.0%) | 610 (47.9%) |
Income Below Poverty Among Married-Couple vs Single-Parent Households in Mccomb
The poverty data for Mccomb shows that 139 of the married-couple family households (12.1%) and 610 of the single-parent households (42.9%) are living below the poverty level. Within the married-couple family households, those with 1 or 2 children have the highest poverty rate, with 82 households (21.5%) falling below the poverty line. Among the single-parent households, those with 5 or more children have the highest poverty rate, with 63 household (100.0%) living below poverty.
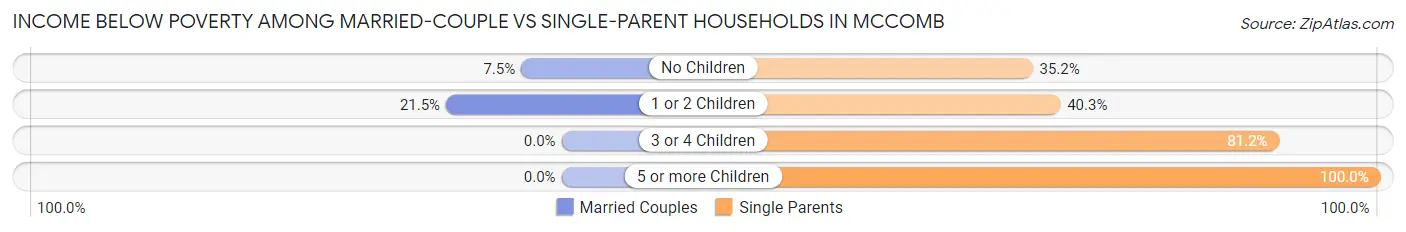
| Children | Married-Couple Families | Single-Parent Households |
| No Children | 57 (7.5%) | 203 (35.2%) |
| 1 or 2 Children | 82 (21.5%) | 288 (40.3%) |
| 3 or 4 Children | 0 (0.0%) | 56 (81.2%) |
| 5 or more Children | 0 (0.0%) | 63 (100.0%) |
| Total | 139 (12.1%) | 610 (42.9%) |
Race in Mccomb
The most populous races in Mccomb are Black / African American (9,063 | 73.7%), White / Caucasian (2,936 | 23.9%), and Hispanic or Latino (194 | 1.6%).
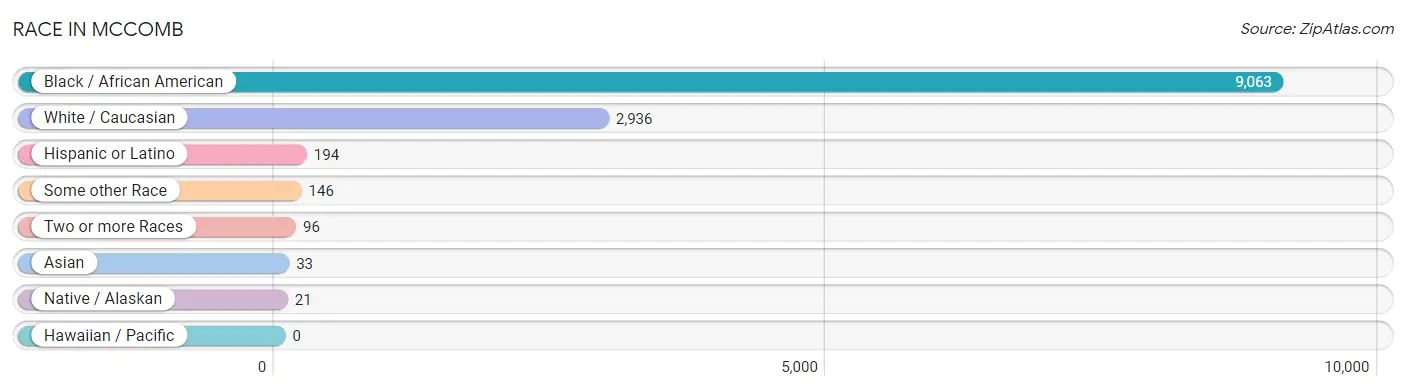
| Race | # Population | % Population |
| Asian | 33 | 0.3% |
| Black / African American | 9,063 | 73.7% |
| Hawaiian / Pacific | 0 | 0.0% |
| Hispanic or Latino | 194 | 1.6% |
| Native / Alaskan | 21 | 0.2% |
| White / Caucasian | 2,936 | 23.9% |
| Two or more Races | 96 | 0.8% |
| Some other Race | 146 | 1.2% |
| Total | 12,295 | 100.0% |
Ancestry in Mccomb
The most populous ancestries reported in Mccomb are Irish (675 | 5.5%), German (474 | 3.9%), American (459 | 3.7%), English (287 | 2.3%), and Scottish (198 | 1.6%), together accounting for 17.0% of all Mccomb residents.
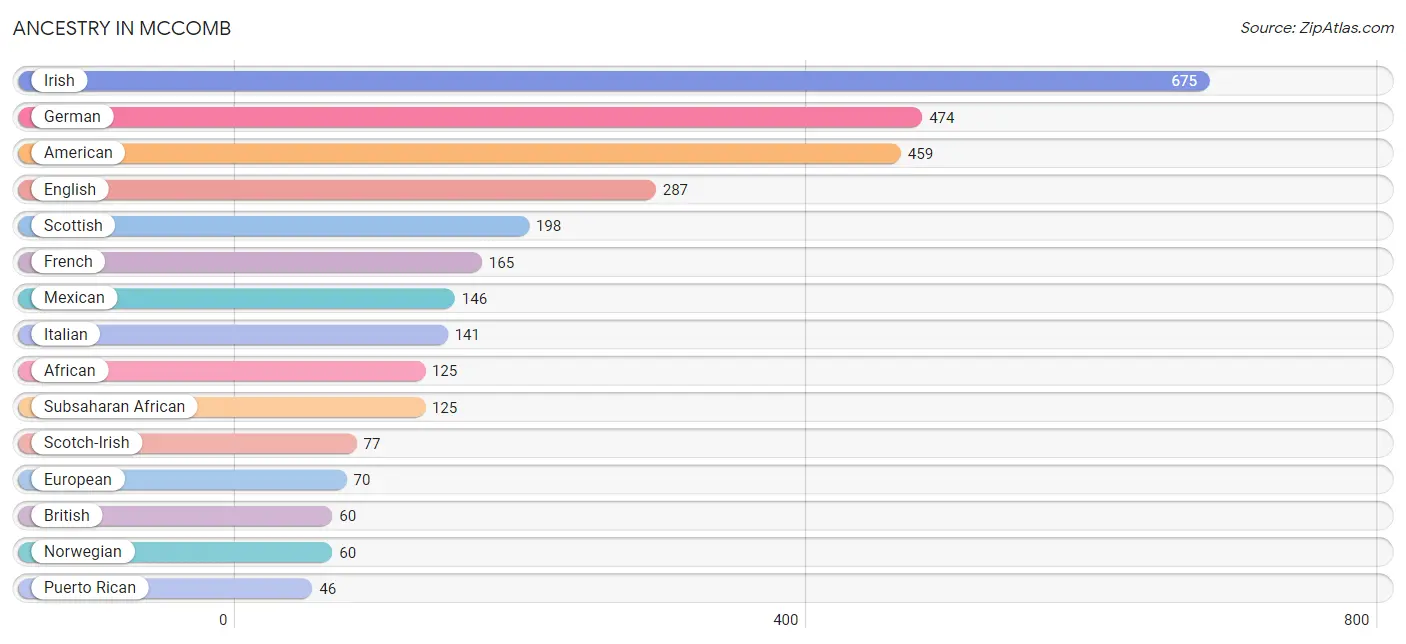
| Ancestry | # Population | % Population |
| African | 125 | 1.0% |
| American | 459 | 3.7% |
| British | 60 | 0.5% |
| Central American | 2 | 0.0% |
| Czech | 13 | 0.1% |
| Dutch | 21 | 0.2% |
| English | 287 | 2.3% |
| European | 70 | 0.6% |
| French | 165 | 1.3% |
| French Canadian | 20 | 0.2% |
| German | 474 | 3.9% |
| Guatemalan | 2 | 0.0% |
| Irish | 675 | 5.5% |
| Italian | 141 | 1.1% |
| Mexican | 146 | 1.2% |
| Norwegian | 60 | 0.5% |
| Polish | 22 | 0.2% |
| Puerto Rican | 46 | 0.4% |
| Scotch-Irish | 77 | 0.6% |
| Scottish | 198 | 1.6% |
| Sri Lankan | 18 | 0.2% |
| Subsaharan African | 125 | 1.0% |
| Thai | 15 | 0.1% |
| Welsh | 17 | 0.1% | View All 24 Rows |
Immigrants in Mccomb
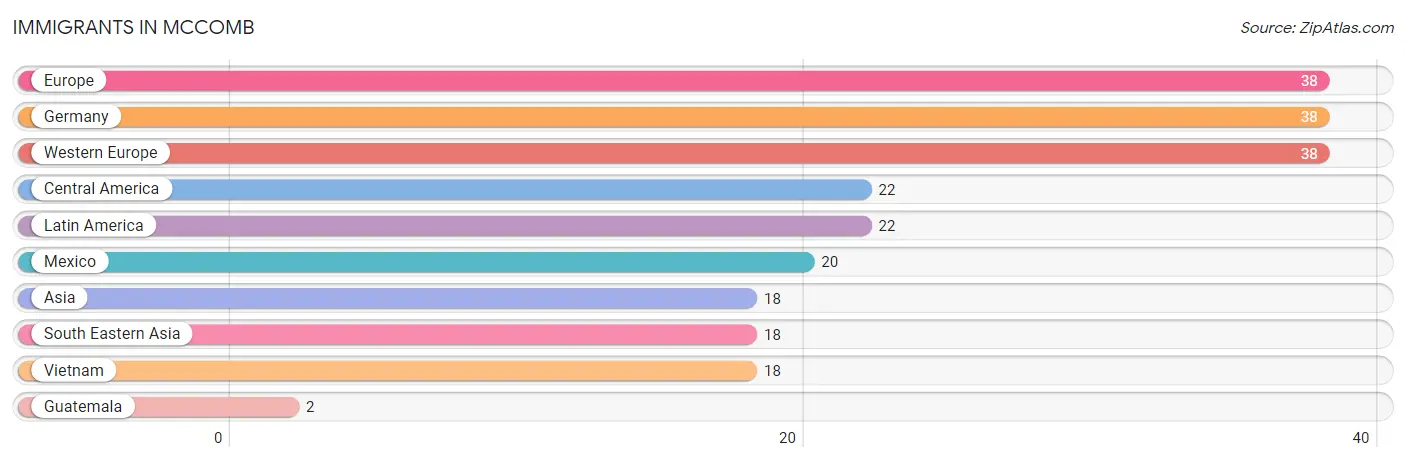
The most numerous immigrant groups reported in Mccomb came from Europe (38 | 0.3%), Germany (38 | 0.3%), Western Europe (38 | 0.3%), Central America (22 | 0.2%), and Latin America (22 | 0.2%), together accounting for 1.3% of all Mccomb residents.
| Immigration Origin | # Population | % Population |
| Asia | 18 | 0.2% |
| Central America | 22 | 0.2% |
| Europe | 38 | 0.3% |
| Germany | 38 | 0.3% |
| Guatemala | 2 | 0.0% |
| Latin America | 22 | 0.2% |
| Mexico | 20 | 0.2% |
| South Eastern Asia | 18 | 0.2% |
| Vietnam | 18 | 0.2% |
| Western Europe | 38 | 0.3% | View All 10 Rows |
Sex and Age in Mccomb
Sex and Age in Mccomb
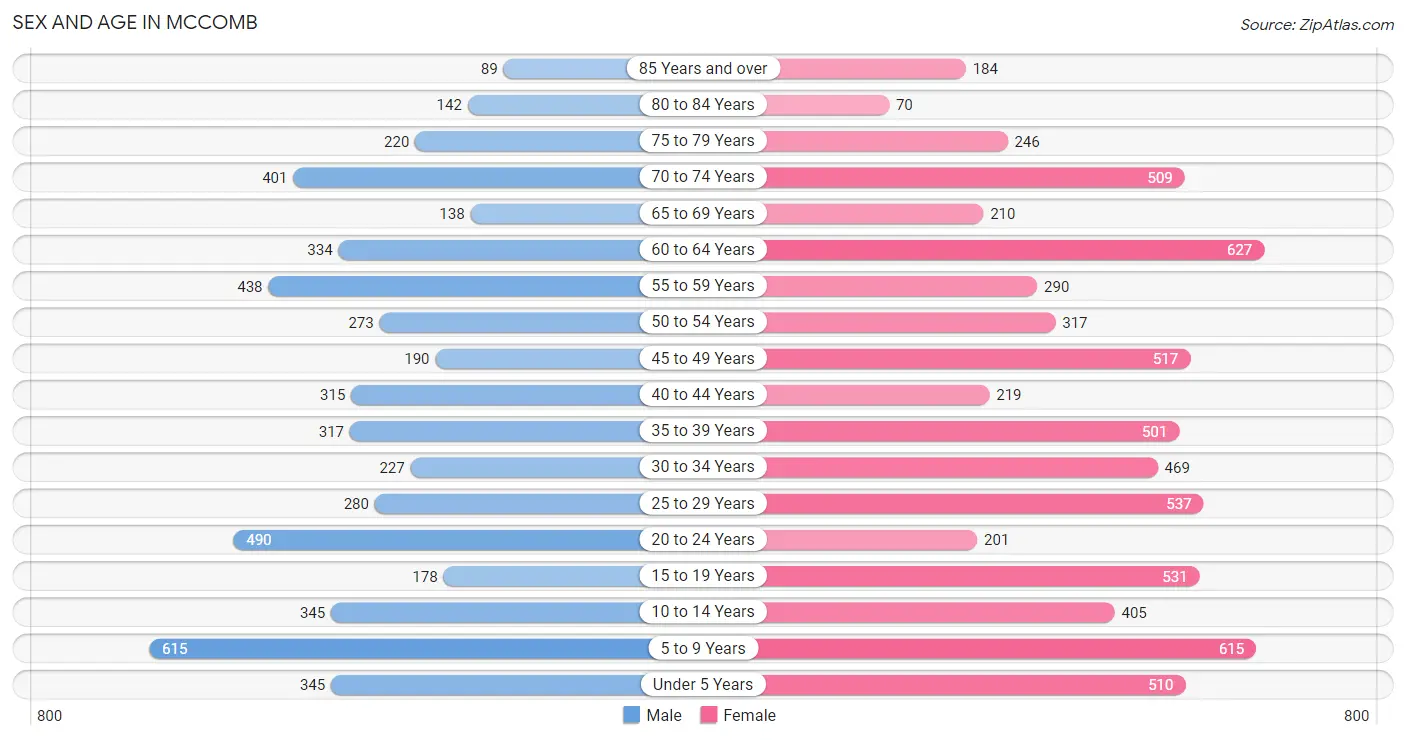
The most populous age groups in Mccomb are 5 to 9 Years (615 | 11.5%) for men and 60 to 64 Years (627 | 9.0%) for women.
| Age Bracket | Male | Female |
| Under 5 Years | 345 (6.5%) | 510 (7.3%) |
| 5 to 9 Years | 615 (11.5%) | 615 (8.8%) |
| 10 to 14 Years | 345 (6.5%) | 405 (5.8%) |
| 15 to 19 Years | 178 (3.3%) | 531 (7.6%) |
| 20 to 24 Years | 490 (9.2%) | 201 (2.9%) |
| 25 to 29 Years | 280 (5.2%) | 537 (7.7%) |
| 30 to 34 Years | 227 (4.3%) | 469 (6.7%) |
| 35 to 39 Years | 317 (5.9%) | 501 (7.2%) |
| 40 to 44 Years | 315 (5.9%) | 219 (3.2%) |
| 45 to 49 Years | 190 (3.6%) | 517 (7.4%) |
| 50 to 54 Years | 273 (5.1%) | 317 (4.6%) |
| 55 to 59 Years | 438 (8.2%) | 290 (4.2%) |
| 60 to 64 Years | 334 (6.3%) | 627 (9.0%) |
| 65 to 69 Years | 138 (2.6%) | 210 (3.0%) |
| 70 to 74 Years | 401 (7.5%) | 509 (7.3%) |
| 75 to 79 Years | 220 (4.1%) | 246 (3.5%) |
| 80 to 84 Years | 142 (2.7%) | 70 (1.0%) |
| 85 Years and over | 89 (1.7%) | 184 (2.6%) |
| Total | 5,337 (100.0%) | 6,958 (100.0%) |
Families and Households in Mccomb
Median Family Size in Mccomb
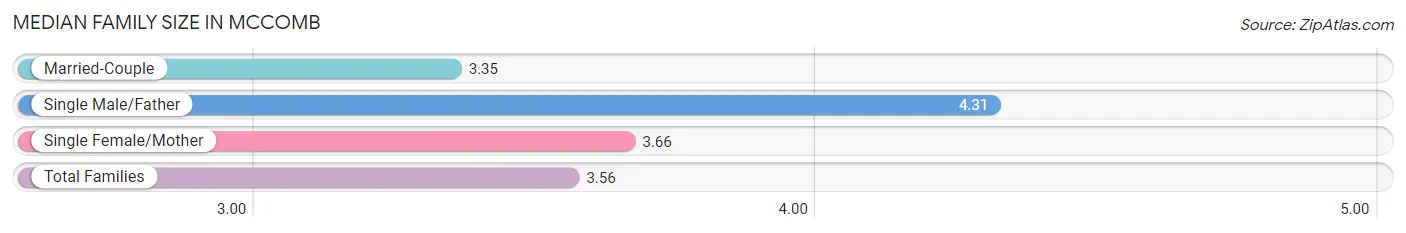
The median family size in Mccomb is 3.56 persons per family, with single male/father families (150 | 5.8%) accounting for the largest median family size of 4.31 persons per family. On the other hand, married-couple families (1,150 | 44.7%) represent the smallest median family size with 3.35 persons per family.
| Family Type | # Families | Family Size |
| Married-Couple | 1,150 (44.7%) | 3.35 |
| Single Male/Father | 150 (5.8%) | 4.31 |
| Single Female/Mother | 1,273 (49.5%) | 3.66 |
| Total Families | 2,573 (100.0%) | 3.56 |
Median Household Size in Mccomb
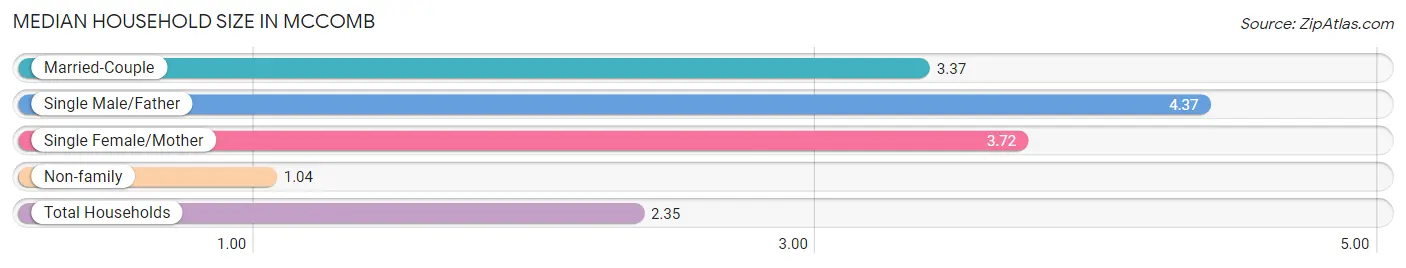
The median household size in Mccomb is 2.35 persons per household, with single male/father households (150 | 3.0%) accounting for the largest median household size of 4.37 persons per household. non-family households (2,451 | 48.8%) represent the smallest median household size with 1.04 persons per household.
| Household Type | # Households | Household Size |
| Married-Couple | 1,150 (22.9%) | 3.37 |
| Single Male/Father | 150 (3.0%) | 4.37 |
| Single Female/Mother | 1,273 (25.3%) | 3.72 |
| Non-family | 2,451 (48.8%) | 1.04 |
| Total Households | 5,024 (100.0%) | 2.35 |
Household Size by Marriage Status in Mccomb
Out of a total of 5,024 households in Mccomb, 2,573 (51.2%) are family households, while 2,451 (48.8%) are nonfamily households. The most numerous type of family households are 2-person households, comprising 1,496, and the most common type of nonfamily households are 1-person households, comprising 2,375.
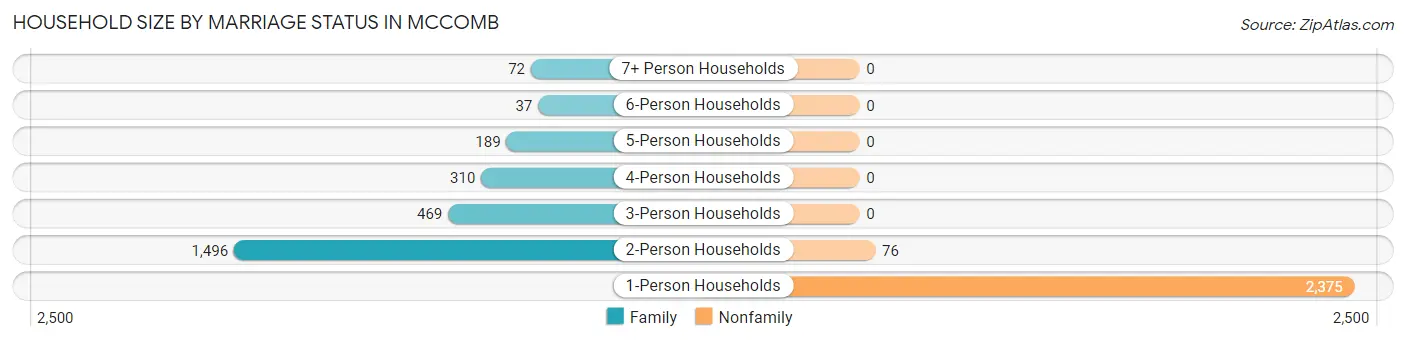
| Household Size | Family Households | Nonfamily Households |
| 1-Person Households | - | 2,375 (47.3%) |
| 2-Person Households | 1,496 (29.8%) | 76 (1.5%) |
| 3-Person Households | 469 (9.3%) | 0 (0.0%) |
| 4-Person Households | 310 (6.2%) | 0 (0.0%) |
| 5-Person Households | 189 (3.8%) | 0 (0.0%) |
| 6-Person Households | 37 (0.7%) | 0 (0.0%) |
| 7+ Person Households | 72 (1.4%) | 0 (0.0%) |
| Total | 2,573 (51.2%) | 2,451 (48.8%) |
Female Fertility in Mccomb
Fertility by Age in Mccomb
Average fertility rate in Mccomb is 150.0 births per 1,000 women. Women in the age bracket of 20 to 34 years have the highest fertility rate with 302.0 births per 1,000 women. Women in the age bracket of 20 to 34 years acount for 79.2% of all women with births.
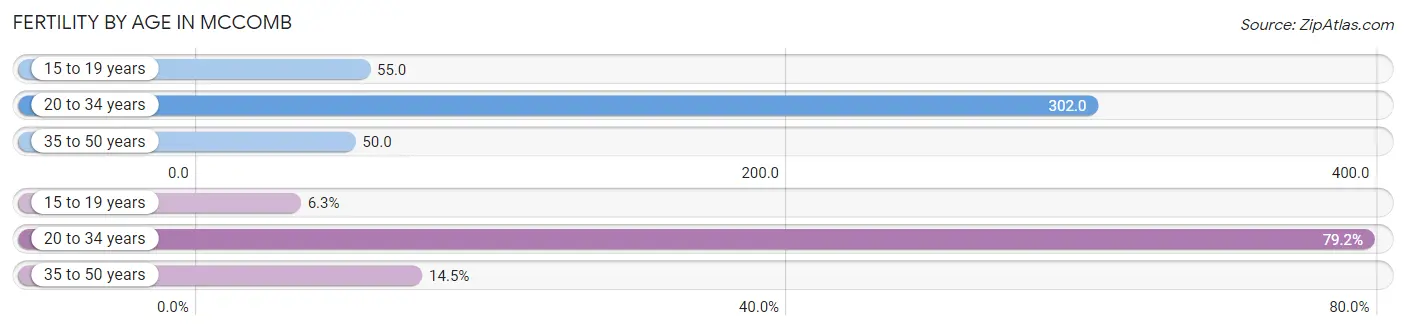
| Age Bracket | Women with Births | Births / 1,000 Women |
| 15 to 19 years | 29 (6.3%) | 55.0 |
| 20 to 34 years | 365 (79.2%) | 302.0 |
| 35 to 50 years | 67 (14.5%) | 50.0 |
| Total | 461 (100.0%) | 150.0 |
Fertility by Age by Marriage Status in Mccomb
6.3% of women with births (461) in Mccomb are married. The highest percentage of unmarried women with births falls into 15 to 19 years age bracket with 100.0% of them unmarried at the time of birth, while the lowest percentage of unmarried women with births belong to 35 to 50 years age bracket with 56.7% of them unmarried.
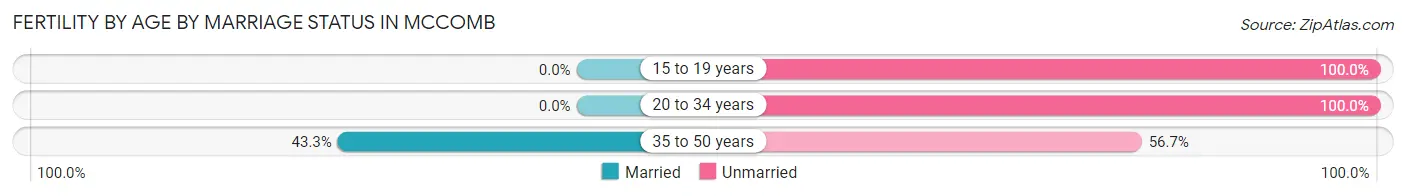
| Age Bracket | Married | Unmarried |
| 15 to 19 years | 0 (0.0%) | 29 (100.0%) |
| 20 to 34 years | 0 (0.0%) | 365 (100.0%) |
| 35 to 50 years | 29 (43.3%) | 38 (56.7%) |
| Total | 29 (6.3%) | 432 (93.7%) |
Fertility by Education in Mccomb
Average fertility rate in Mccomb is 150.0 births per 1,000 women. Women with the education attainment of graduate degree have the highest fertility rate of 250.0 births per 1,000 women, while women with the education attainment of high school diploma have the lowest fertility at 112.0 births per 1,000 women. Women with the education attainment of college or associate's degree represent 40.6% of all women with births.
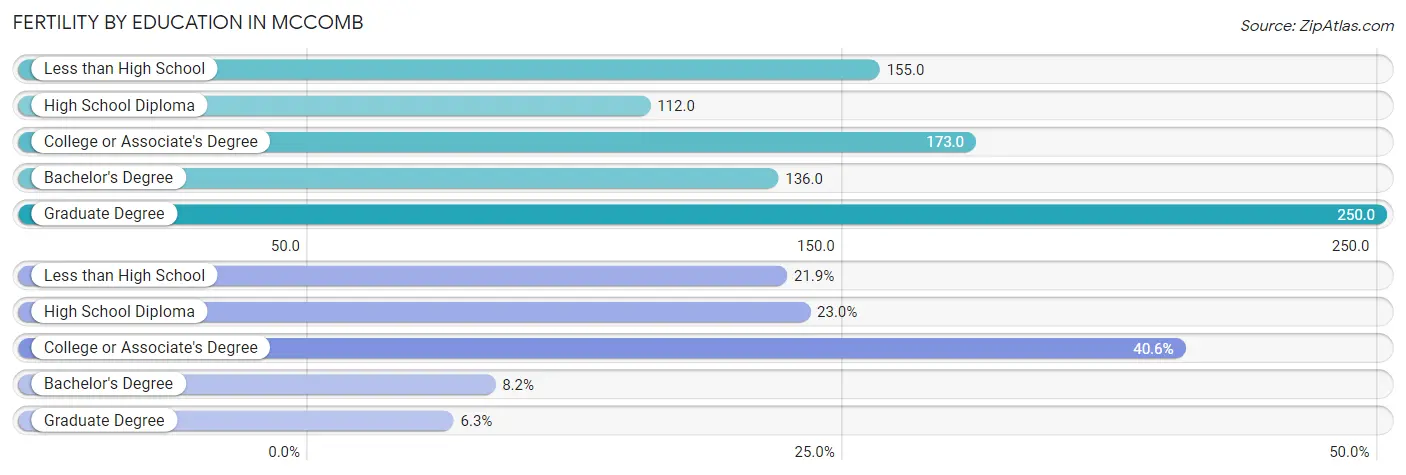
| Educational Attainment | Women with Births | Births / 1,000 Women |
| Less than High School | 101 (21.9%) | 155.0 |
| High School Diploma | 106 (23.0%) | 112.0 |
| College or Associate's Degree | 187 (40.6%) | 173.0 |
| Bachelor's Degree | 38 (8.2%) | 136.0 |
| Graduate Degree | 29 (6.3%) | 250.0 |
| Total | 461 (100.0%) | 150.0 |
Fertility by Education by Marriage Status in Mccomb
93.7% of women with births in Mccomb are unmarried. Women with the educational attainment of graduate degree are most likely to be married with 100.0% of them married at childbirth, while women with the educational attainment of less than high school are least likely to be married with 100.0% of them unmarried at childbirth.
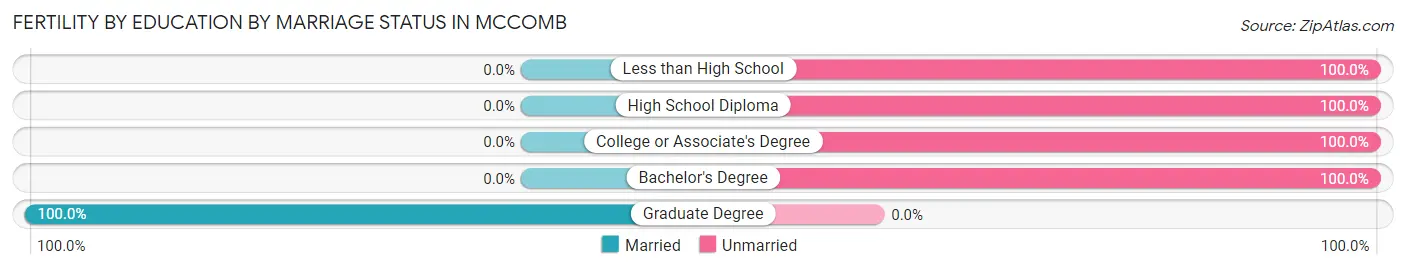
| Educational Attainment | Married | Unmarried |
| Less than High School | 0 (0.0%) | 101 (100.0%) |
| High School Diploma | 0 (0.0%) | 106 (100.0%) |
| College or Associate's Degree | 0 (0.0%) | 187 (100.0%) |
| Bachelor's Degree | 0 (0.0%) | 38 (100.0%) |
| Graduate Degree | 29 (100.0%) | 0 (0.0%) |
| Total | 29 (6.3%) | 432 (93.7%) |
Employment Characteristics in Mccomb
Employment by Class of Employer in Mccomb
Among the 4,352 employed individuals in Mccomb, private company employees (2,981 | 68.5%), not-for-profit organizations (418 | 9.6%), and state government employees (290 | 6.7%) make up the most common classes of employment.
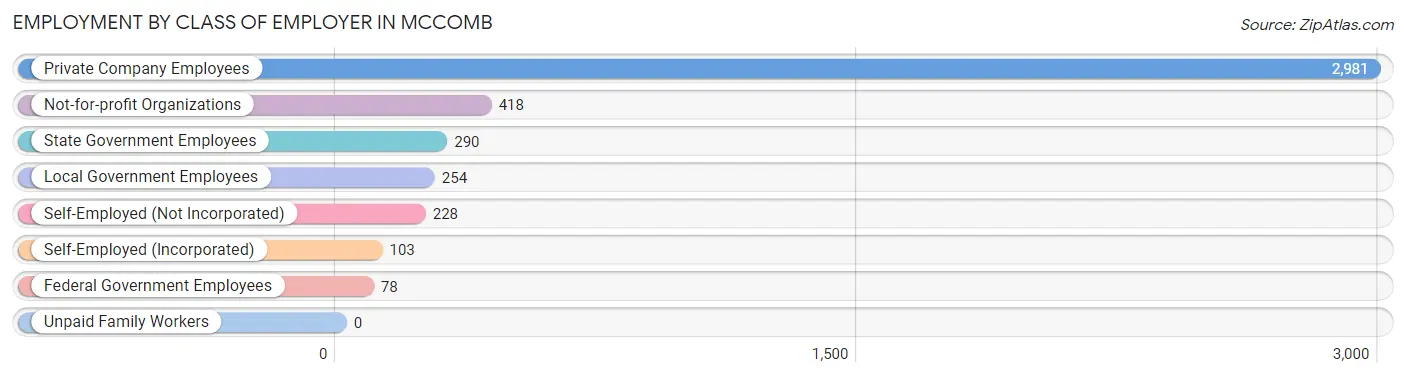
| Employer Class | # Employees | % Employees |
| Private Company Employees | 2,981 | 68.5% |
| Self-Employed (Incorporated) | 103 | 2.4% |
| Self-Employed (Not Incorporated) | 228 | 5.2% |
| Not-for-profit Organizations | 418 | 9.6% |
| Local Government Employees | 254 | 5.8% |
| State Government Employees | 290 | 6.7% |
| Federal Government Employees | 78 | 1.8% |
| Unpaid Family Workers | 0 | 0.0% |
| Total | 4,352 | 100.0% |
Employment Status by Age in Mccomb
According to the labor force statistics for Mccomb, out of the total population over 16 years of age (9,300), 50.2% or 4,669 individuals are in the labor force, with 5.8% or 271 of them unemployed. The age group with the highest labor force participation rate is 30 to 34 years, with 81.8% or 569 individuals in the labor force. Within the labor force, the 16 to 19 years age range has the highest percentage of unemployed individuals, with 22.8% or 62 of them being unemployed.
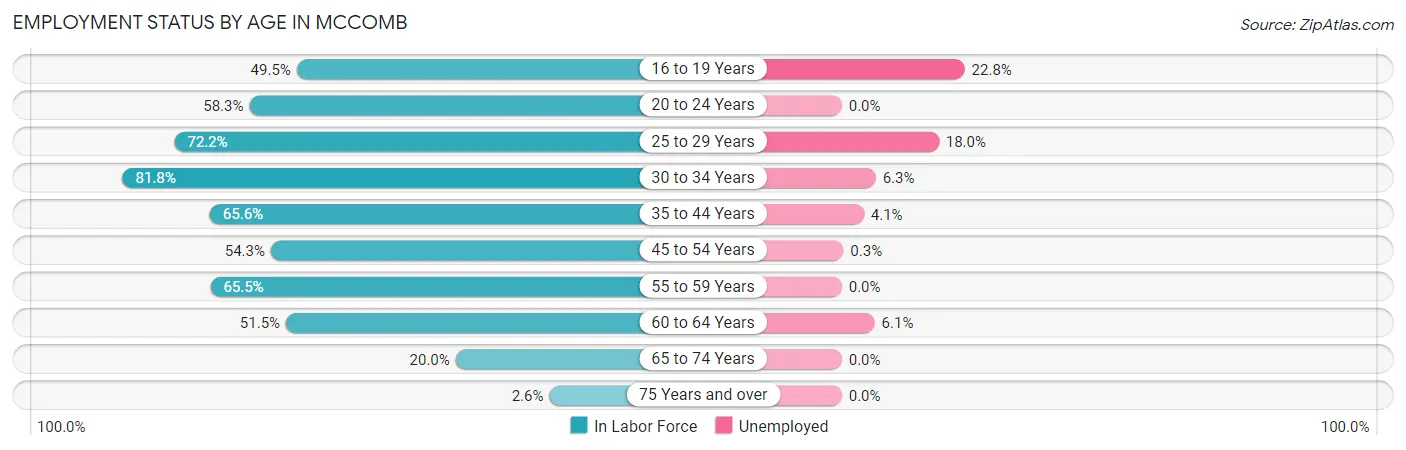
| Age Bracket | In Labor Force | Unemployed |
| 16 to 19 Years | 272 (49.5%) | 62 (22.8%) |
| 20 to 24 Years | 403 (58.3%) | 0 (0.0%) |
| 25 to 29 Years | 590 (72.2%) | 106 (18.0%) |
| 30 to 34 Years | 569 (81.8%) | 36 (6.3%) |
| 35 to 44 Years | 887 (65.6%) | 36 (4.1%) |
| 45 to 54 Years | 704 (54.3%) | 2 (0.3%) |
| 55 to 59 Years | 477 (65.5%) | 0 (0.0%) |
| 60 to 64 Years | 495 (51.5%) | 30 (6.1%) |
| 65 to 74 Years | 252 (20.0%) | 0 (0.0%) |
| 75 Years and over | 25 (2.6%) | 0 (0.0%) |
| Total | 4,669 (50.2%) | 271 (5.8%) |
Employment Status by Educational Attainment in Mccomb
According to labor force statistics for Mccomb, 63.6% of individuals (3,721) out of the total population between 25 and 64 years of age (5,851) are in the labor force, with 5.6% or 208 of them being unemployed. The group with the highest labor force participation rate are those with the educational attainment of bachelor's degree or higher, with 74.4% or 761 individuals in the labor force. Within the labor force, individuals with less than high school education have the highest percentage of unemployment, with 23.8% or 76 of them being unemployed.
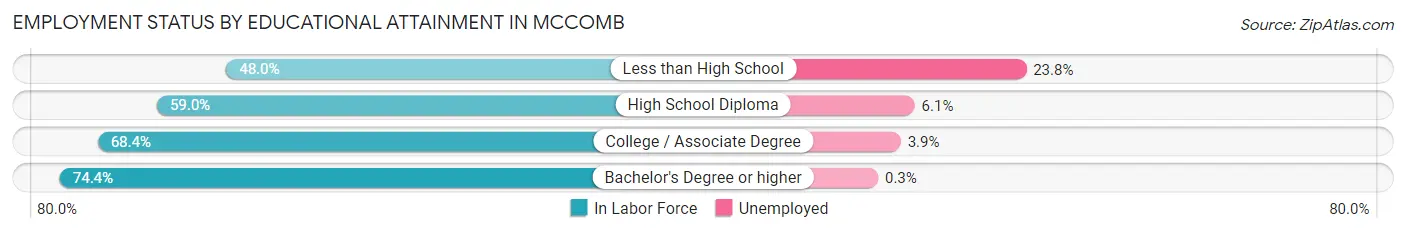
| Educational Attainment | In Labor Force | Unemployed |
| Less than High School | 319 (48.0%) | 158 (23.8%) |
| High School Diploma | 1,305 (59.0%) | 135 (6.1%) |
| College / Associate Degree | 1,335 (68.4%) | 76 (3.9%) |
| Bachelor's Degree or higher | 761 (74.4%) | 3 (0.3%) |
| Total | 3,721 (63.6%) | 328 (5.6%) |
Employment Occupations by Sex in Mccomb
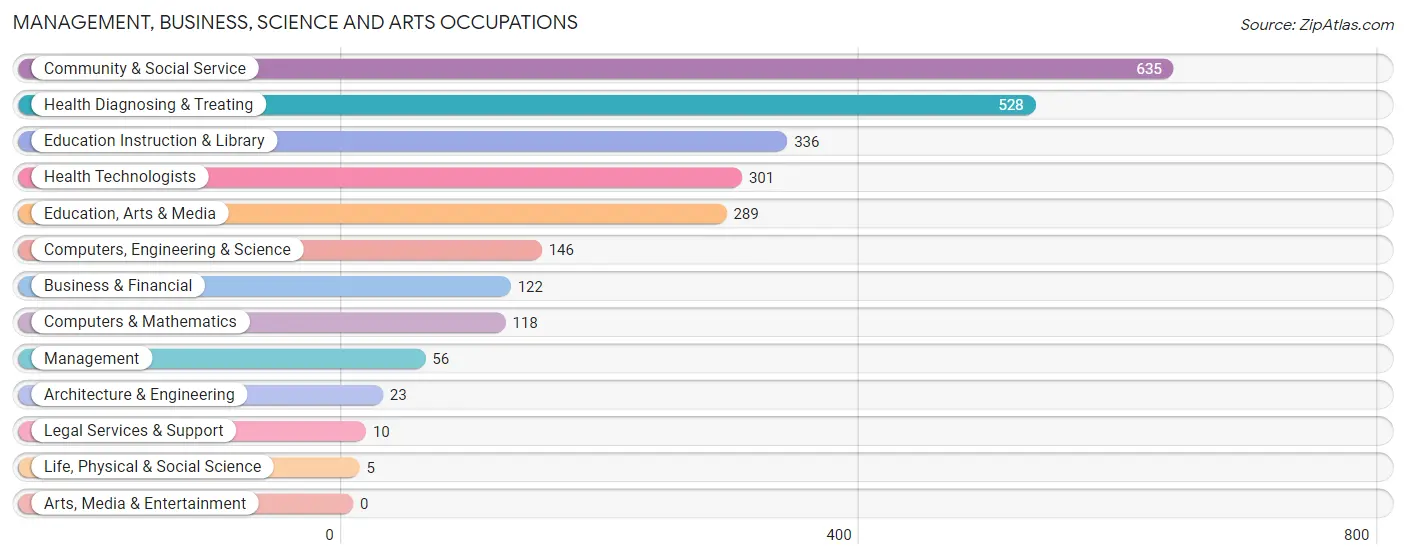
Management, Business, Science and Arts Occupations
The most common Management, Business, Science and Arts occupations in Mccomb are Community & Social Service (635 | 14.4%), Health Diagnosing & Treating (528 | 12.0%), Education Instruction & Library (336 | 7.6%), Health Technologists (301 | 6.8%), and Education, Arts & Media (289 | 6.6%).
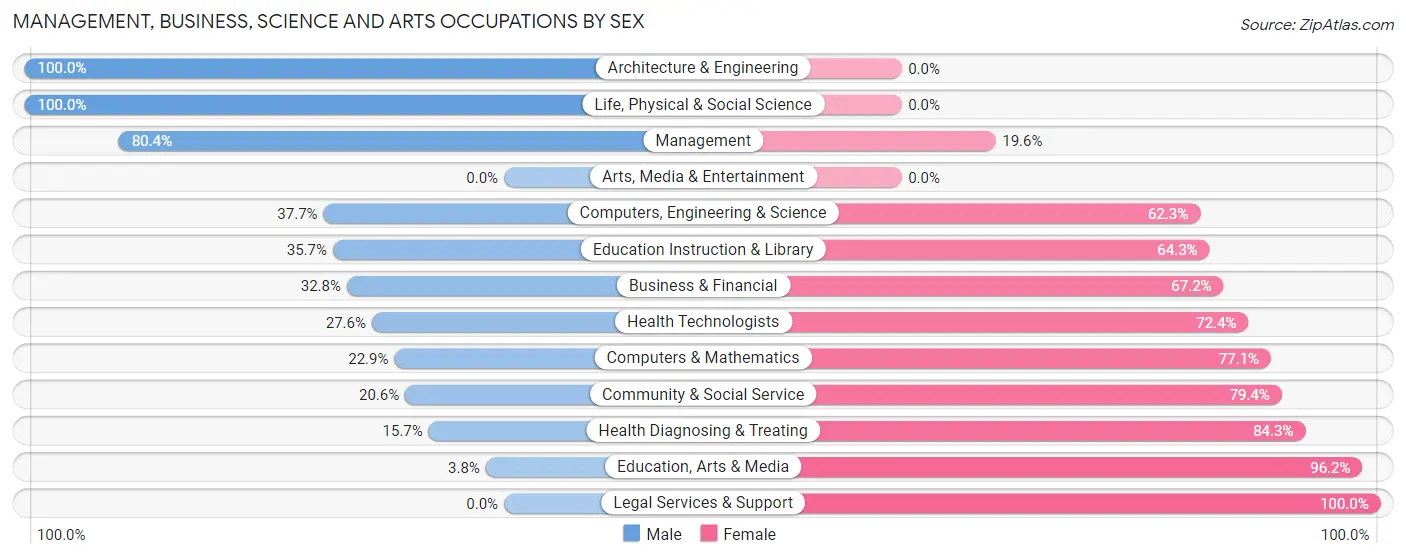
Management, Business, Science and Arts Occupations by Sex
Within the Management, Business, Science and Arts occupations in Mccomb, the most male-oriented occupations are Architecture & Engineering (100.0%), Life, Physical & Social Science (100.0%), and Management (80.4%), while the most female-oriented occupations are Legal Services & Support (100.0%), Education, Arts & Media (96.2%), and Health Diagnosing & Treating (84.3%).
| Occupation | Male | Female |
| Management | 45 (80.4%) | 11 (19.6%) |
| Business & Financial | 40 (32.8%) | 82 (67.2%) |
| Computers, Engineering & Science | 55 (37.7%) | 91 (62.3%) |
| Computers & Mathematics | 27 (22.9%) | 91 (77.1%) |
| Architecture & Engineering | 23 (100.0%) | 0 (0.0%) |
| Life, Physical & Social Science | 5 (100.0%) | 0 (0.0%) |
| Community & Social Service | 131 (20.6%) | 504 (79.4%) |
| Education, Arts & Media | 11 (3.8%) | 278 (96.2%) |
| Legal Services & Support | 0 (0.0%) | 10 (100.0%) |
| Education Instruction & Library | 120 (35.7%) | 216 (64.3%) |
| Arts, Media & Entertainment | 0 (0.0%) | 0 (0.0%) |
| Health Diagnosing & Treating | 83 (15.7%) | 445 (84.3%) |
| Health Technologists | 83 (27.6%) | 218 (72.4%) |
| Total (Category) | 354 (23.8%) | 1,133 (76.2%) |
| Total (Overall) | 1,862 (42.3%) | 2,539 (57.7%) |
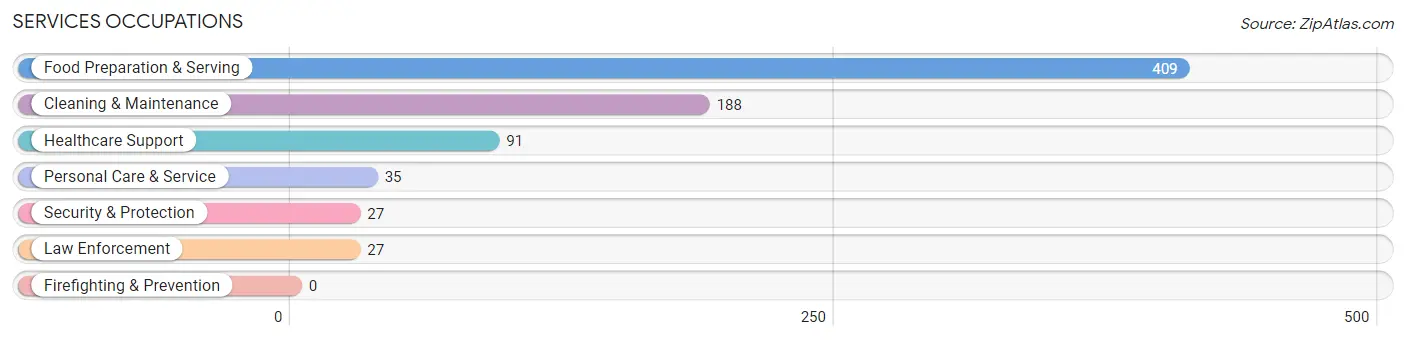
Services Occupations
The most common Services occupations in Mccomb are Food Preparation & Serving (409 | 9.3%), Cleaning & Maintenance (188 | 4.3%), Healthcare Support (91 | 2.1%), Personal Care & Service (35 | 0.8%), and Security & Protection (27 | 0.6%).
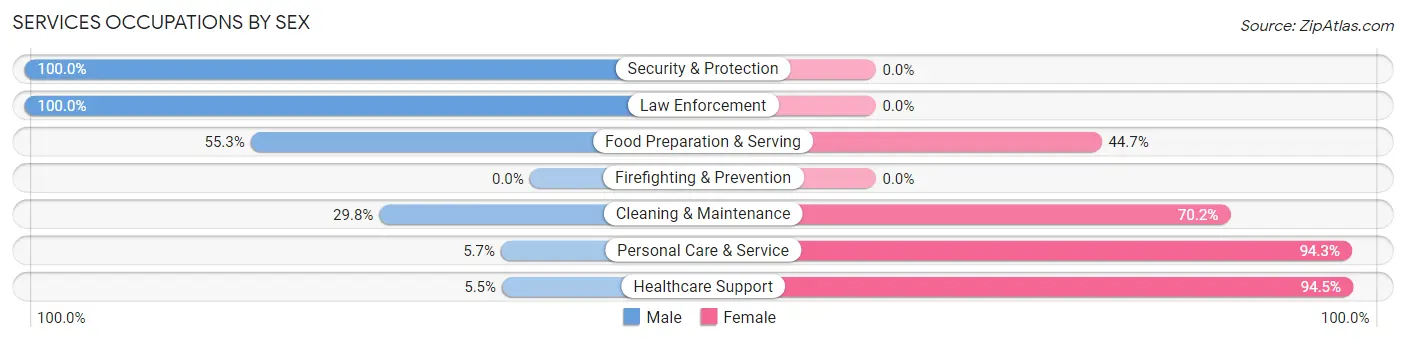
Services Occupations by Sex
Within the Services occupations in Mccomb, the most male-oriented occupations are Security & Protection (100.0%), Law Enforcement (100.0%), and Food Preparation & Serving (55.3%), while the most female-oriented occupations are Healthcare Support (94.5%), Personal Care & Service (94.3%), and Cleaning & Maintenance (70.2%).
| Occupation | Male | Female |
| Healthcare Support | 5 (5.5%) | 86 (94.5%) |
| Security & Protection | 27 (100.0%) | 0 (0.0%) |
| Firefighting & Prevention | 0 (0.0%) | 0 (0.0%) |
| Law Enforcement | 27 (100.0%) | 0 (0.0%) |
| Food Preparation & Serving | 226 (55.3%) | 183 (44.7%) |
| Cleaning & Maintenance | 56 (29.8%) | 132 (70.2%) |
| Personal Care & Service | 2 (5.7%) | 33 (94.3%) |
| Total (Category) | 316 (42.1%) | 434 (57.9%) |
| Total (Overall) | 1,862 (42.3%) | 2,539 (57.7%) |
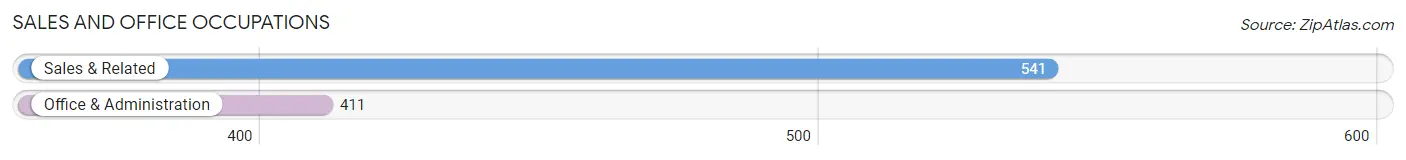
Sales and Office Occupations
The most common Sales and Office occupations in Mccomb are Sales & Related (541 | 12.3%), and Office & Administration (411 | 9.3%).
Sales and Office Occupations by Sex
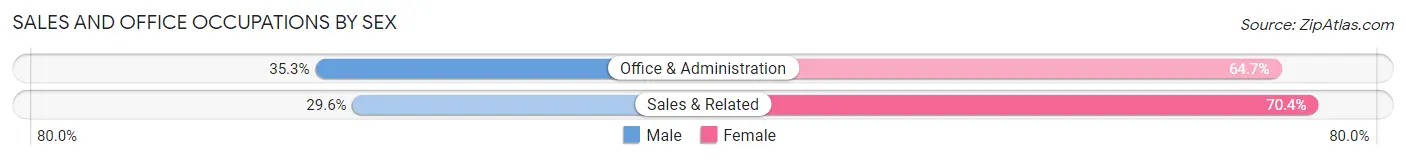
| Occupation | Male | Female |
| Sales & Related | 160 (29.6%) | 381 (70.4%) |
| Office & Administration | 145 (35.3%) | 266 (64.7%) |
| Total (Category) | 305 (32.0%) | 647 (68.0%) |
| Total (Overall) | 1,862 (42.3%) | 2,539 (57.7%) |
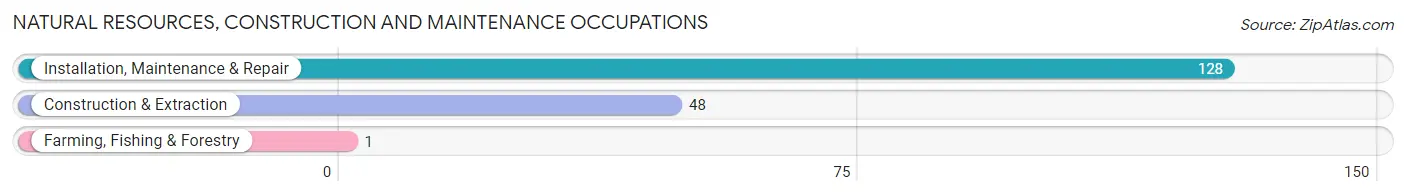
Natural Resources, Construction and Maintenance Occupations
The most common Natural Resources, Construction and Maintenance occupations in Mccomb are Installation, Maintenance & Repair (128 | 2.9%), Construction & Extraction (48 | 1.1%), and Farming, Fishing & Forestry (1 | 0.0%).
Natural Resources, Construction and Maintenance Occupations by Sex
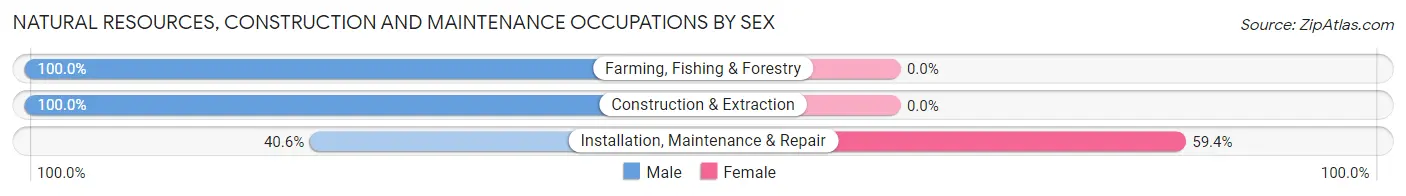
| Occupation | Male | Female |
| Farming, Fishing & Forestry | 1 (100.0%) | 0 (0.0%) |
| Construction & Extraction | 48 (100.0%) | 0 (0.0%) |
| Installation, Maintenance & Repair | 52 (40.6%) | 76 (59.4%) |
| Total (Category) | 101 (57.1%) | 76 (42.9%) |
| Total (Overall) | 1,862 (42.3%) | 2,539 (57.7%) |
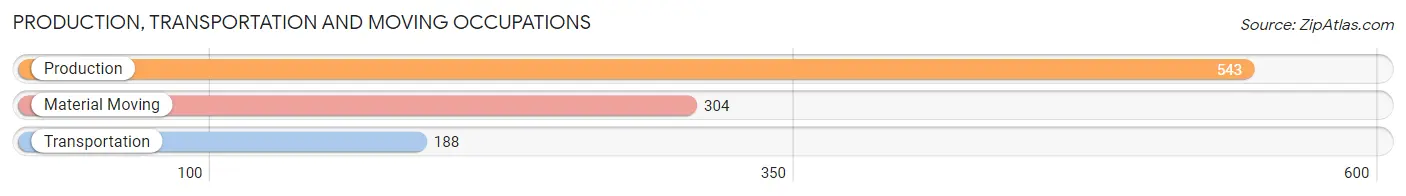
Production, Transportation and Moving Occupations
The most common Production, Transportation and Moving occupations in Mccomb are Production (543 | 12.3%), Material Moving (304 | 6.9%), and Transportation (188 | 4.3%).
Production, Transportation and Moving Occupations by Sex
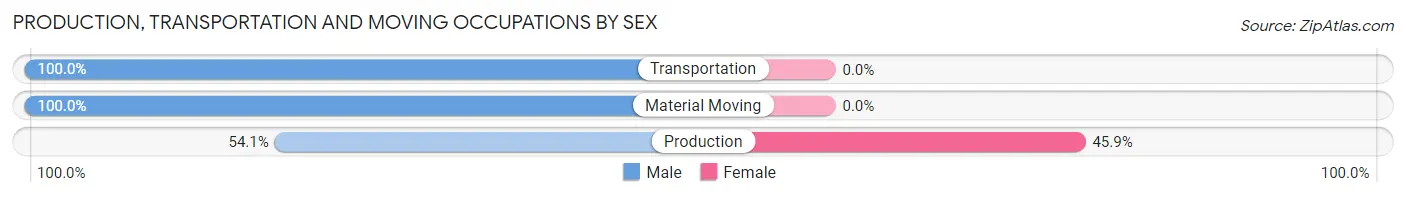
| Occupation | Male | Female |
| Production | 294 (54.1%) | 249 (45.9%) |
| Transportation | 188 (100.0%) | 0 (0.0%) |
| Material Moving | 304 (100.0%) | 0 (0.0%) |
| Total (Category) | 786 (75.9%) | 249 (24.1%) |
| Total (Overall) | 1,862 (42.3%) | 2,539 (57.7%) |
Employment Industries by Sex in Mccomb
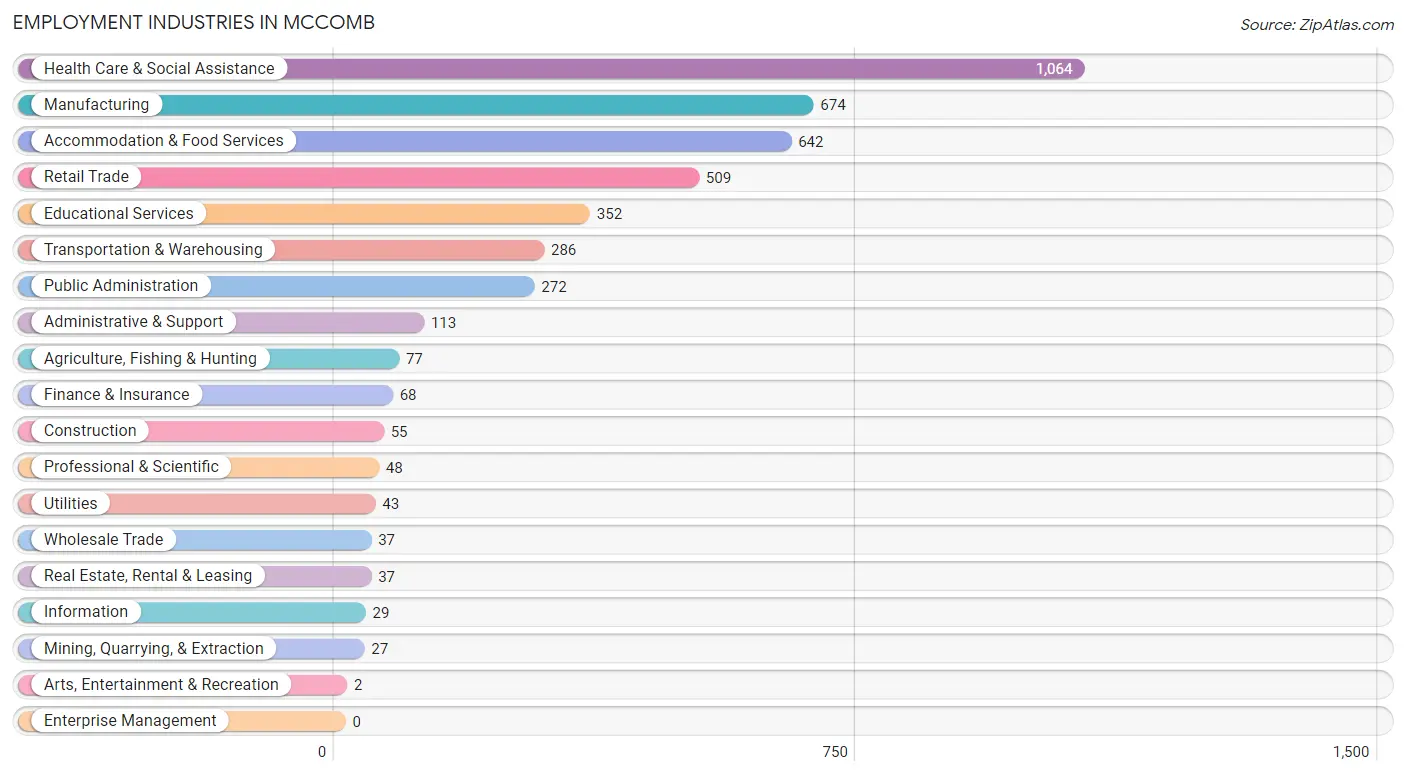
Employment Industries in Mccomb
The major employment industries in Mccomb include Health Care & Social Assistance (1,064 | 24.2%), Manufacturing (674 | 15.3%), Accommodation & Food Services (642 | 14.6%), Retail Trade (509 | 11.6%), and Educational Services (352 | 8.0%).
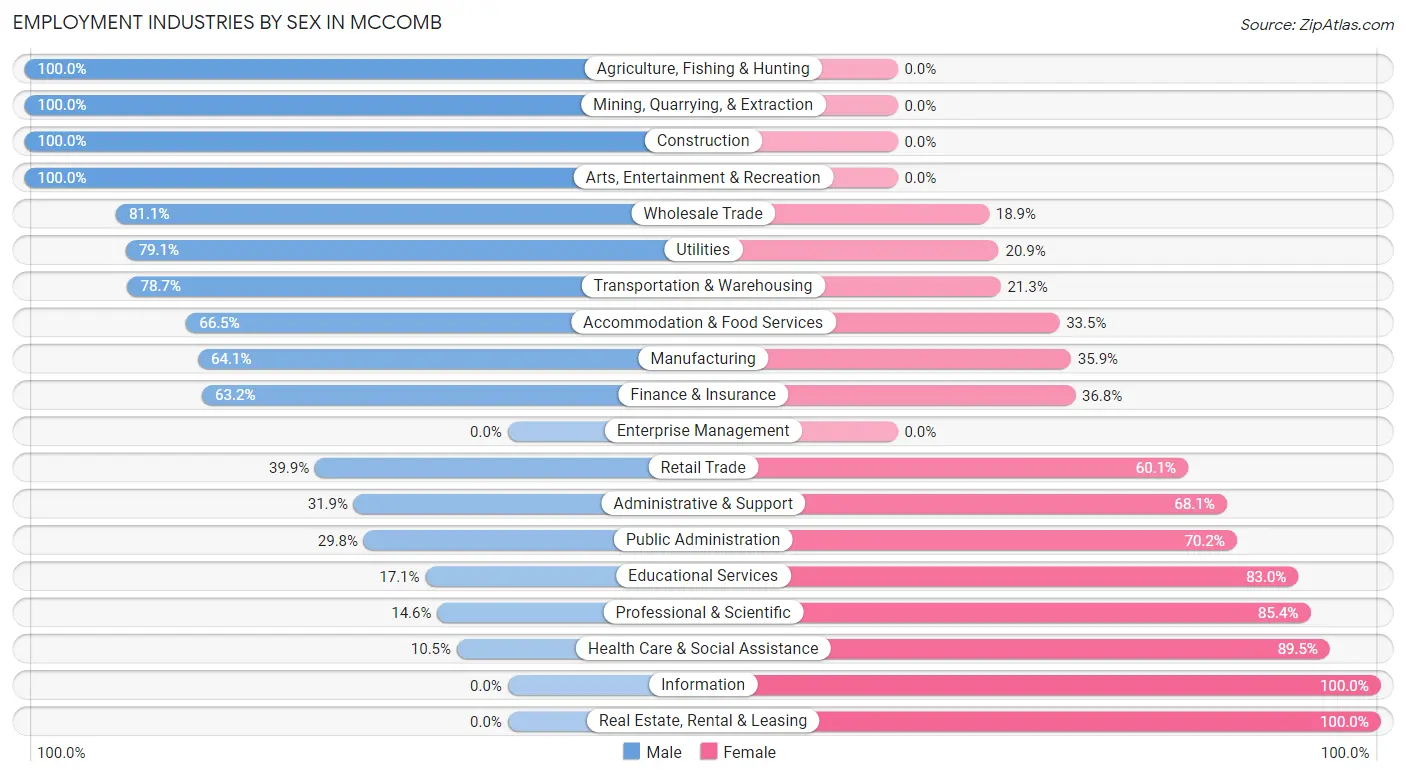
Employment Industries by Sex in Mccomb
The Mccomb industries that see more men than women are Agriculture, Fishing & Hunting (100.0%), Mining, Quarrying, & Extraction (100.0%), and Construction (100.0%), whereas the industries that tend to have a higher number of women are Information (100.0%), Real Estate, Rental & Leasing (100.0%), and Health Care & Social Assistance (89.5%).
| Industry | Male | Female |
| Agriculture, Fishing & Hunting | 77 (100.0%) | 0 (0.0%) |
| Mining, Quarrying, & Extraction | 27 (100.0%) | 0 (0.0%) |
| Construction | 55 (100.0%) | 0 (0.0%) |
| Manufacturing | 432 (64.1%) | 242 (35.9%) |
| Wholesale Trade | 30 (81.1%) | 7 (18.9%) |
| Retail Trade | 203 (39.9%) | 306 (60.1%) |
| Transportation & Warehousing | 225 (78.7%) | 61 (21.3%) |
| Utilities | 34 (79.1%) | 9 (20.9%) |
| Information | 0 (0.0%) | 29 (100.0%) |
| Finance & Insurance | 43 (63.2%) | 25 (36.8%) |
| Real Estate, Rental & Leasing | 0 (0.0%) | 37 (100.0%) |
| Professional & Scientific | 7 (14.6%) | 41 (85.4%) |
| Enterprise Management | 0 (0.0%) | 0 (0.0%) |
| Administrative & Support | 36 (31.9%) | 77 (68.1%) |
| Educational Services | 60 (17.1%) | 292 (83.0%) |
| Health Care & Social Assistance | 112 (10.5%) | 952 (89.5%) |
| Arts, Entertainment & Recreation | 2 (100.0%) | 0 (0.0%) |
| Accommodation & Food Services | 427 (66.5%) | 215 (33.5%) |
| Public Administration | 81 (29.8%) | 191 (70.2%) |
| Total | 1,862 (42.3%) | 2,539 (57.7%) |
Education in Mccomb
School Enrollment in Mccomb
The most common levels of schooling among the 2,821 students in Mccomb are elementary school (1,118 | 39.6%), high school (543 | 19.3%), and middle school (516 | 18.3%).
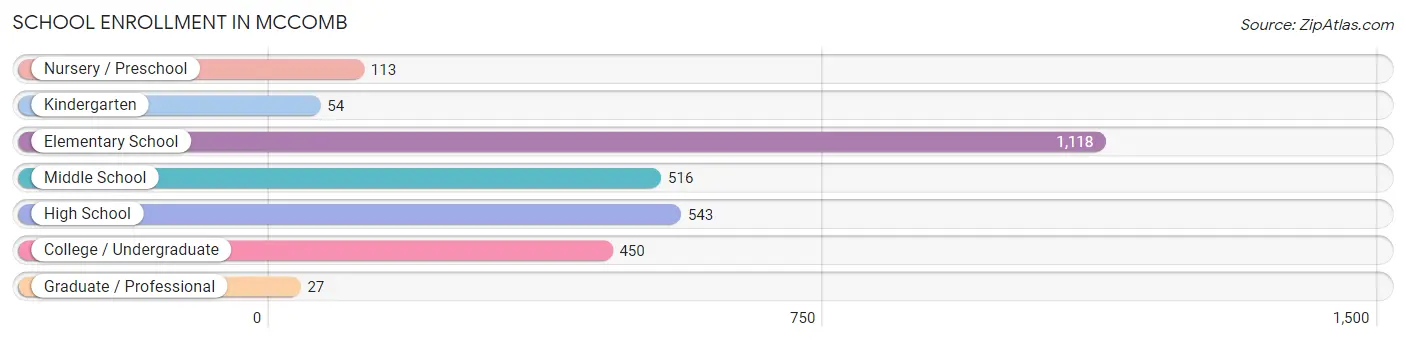
| School Level | # Students | % Students |
| Nursery / Preschool | 113 | 4.0% |
| Kindergarten | 54 | 1.9% |
| Elementary School | 1,118 | 39.6% |
| Middle School | 516 | 18.3% |
| High School | 543 | 19.3% |
| College / Undergraduate | 450 | 16.0% |
| Graduate / Professional | 27 | 1.0% |
| Total | 2,821 | 100.0% |
School Enrollment by Age by Funding Source in Mccomb
Out of a total of 2,821 students who are enrolled in schools in Mccomb, 251 (8.9%) attend a private institution, while the remaining 2,570 (91.1%) are enrolled in public schools. The age group of 18 to 19 year olds has the highest likelihood of being enrolled in private schools, with 84 (33.6% in the age bracket) enrolled. Conversely, the age group of 3 to 4 year olds has the lowest likelihood of being enrolled in a private school, with 82 (100.0% in the age bracket) attending a public institution.
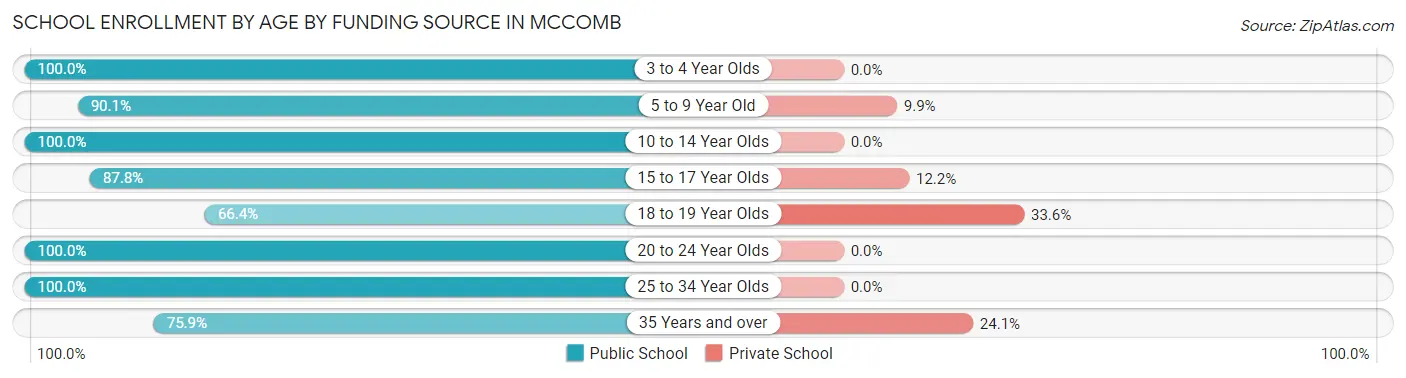
| Age Bracket | Public School | Private School |
| 3 to 4 Year Olds | 82 (100.0%) | 0 (0.0%) |
| 5 to 9 Year Old | 901 (90.1%) | 99 (9.9%) |
| 10 to 14 Year Olds | 750 (100.0%) | 0 (0.0%) |
| 15 to 17 Year Olds | 303 (87.8%) | 42 (12.2%) |
| 18 to 19 Year Olds | 166 (66.4%) | 84 (33.6%) |
| 20 to 24 Year Olds | 166 (100.0%) | 0 (0.0%) |
| 25 to 34 Year Olds | 120 (100.0%) | 0 (0.0%) |
| 35 Years and over | 82 (75.9%) | 26 (24.1%) |
| Total | 2,570 (91.1%) | 251 (8.9%) |
Educational Attainment by Field of Study in Mccomb
Business (244 | 16.0%), education (233 | 15.3%), arts & humanities (195 | 12.8%), science & technology (170 | 11.2%), and computers & mathematics (162 | 10.6%) are the most common fields of study among 1,524 individuals in Mccomb who have obtained a bachelor's degree or higher.
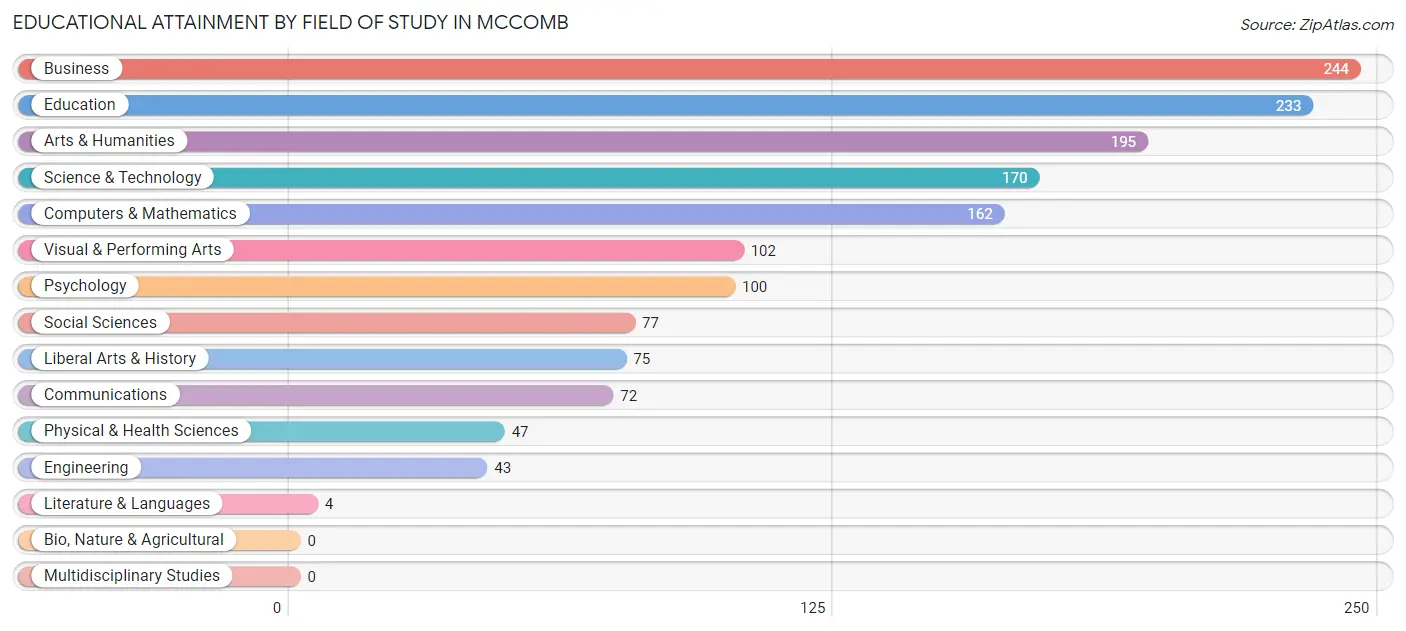
| Field of Study | # Graduates | % Graduates |
| Computers & Mathematics | 162 | 10.6% |
| Bio, Nature & Agricultural | 0 | 0.0% |
| Physical & Health Sciences | 47 | 3.1% |
| Psychology | 100 | 6.6% |
| Social Sciences | 77 | 5.1% |
| Engineering | 43 | 2.8% |
| Multidisciplinary Studies | 0 | 0.0% |
| Science & Technology | 170 | 11.2% |
| Business | 244 | 16.0% |
| Education | 233 | 15.3% |
| Literature & Languages | 4 | 0.3% |
| Liberal Arts & History | 75 | 4.9% |
| Visual & Performing Arts | 102 | 6.7% |
| Communications | 72 | 4.7% |
| Arts & Humanities | 195 | 12.8% |
| Total | 1,524 | 100.0% |
Transportation & Commute in Mccomb
Vehicle Availability by Sex in Mccomb
The most prevalent vehicle ownership categories in Mccomb are males with 2 vehicles (593, accounting for 31.9%) and females with 2 vehicles (552, making up 23.8%).
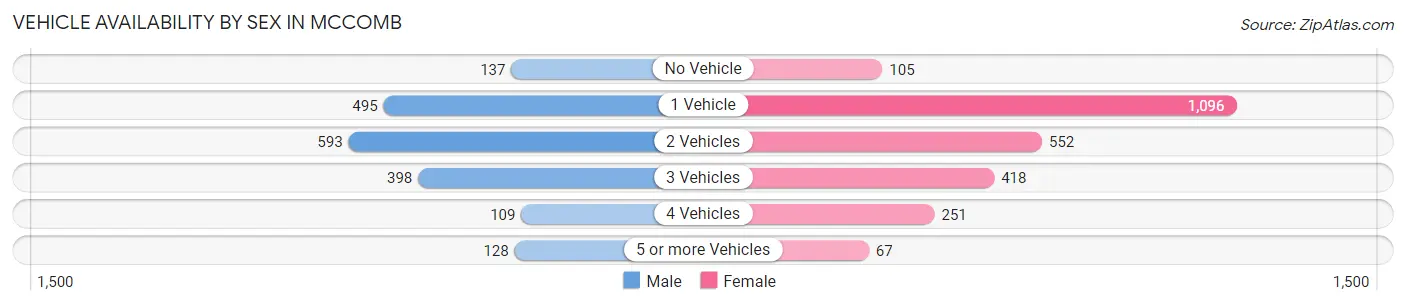
| Vehicles Available | Male | Female |
| No Vehicle | 137 (7.4%) | 105 (4.2%) |
| 1 Vehicle | 495 (26.6%) | 1,096 (44.0%) |
| 2 Vehicles | 593 (31.9%) | 552 (22.2%) |
| 3 Vehicles | 398 (21.4%) | 418 (16.8%) |
| 4 Vehicles | 109 (5.9%) | 251 (10.1%) |
| 5 or more Vehicles | 128 (6.9%) | 67 (2.7%) |
| Total | 1,860 (100.0%) | 2,489 (100.0%) |
Commute Time in Mccomb
The most frequently occuring commute durations in Mccomb are 5 to 9 minutes (1,193 commuters, 27.6%), 10 to 14 minutes (1,063 commuters, 24.6%), and less than 5 minutes (556 commuters, 12.9%).
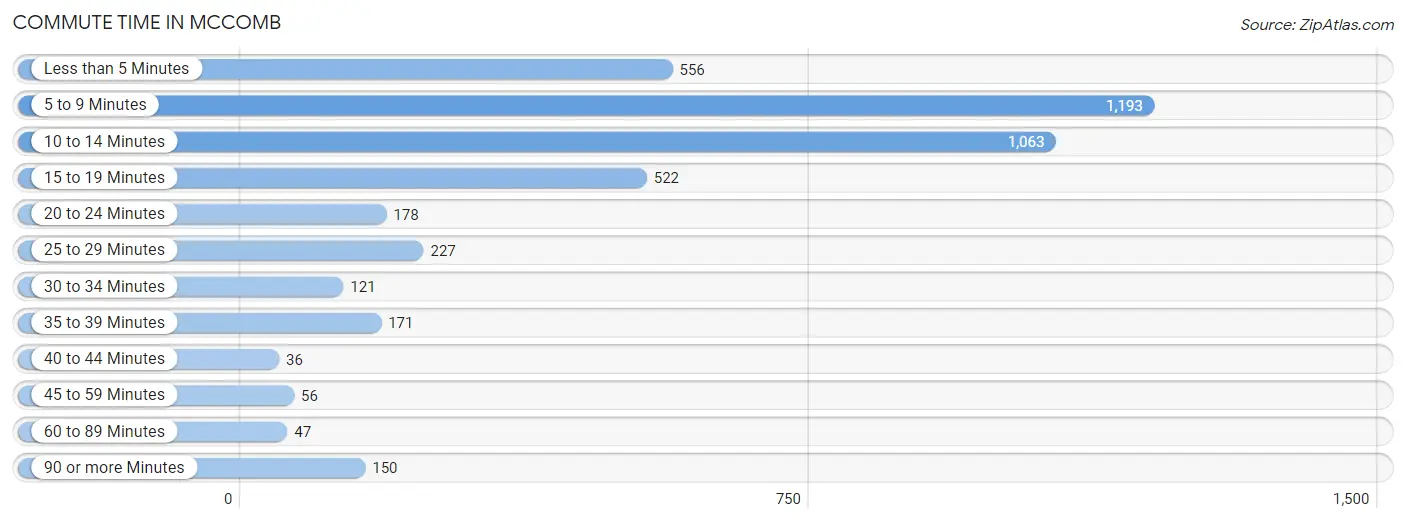
| Commute Time | # Commuters | % Commuters |
| Less than 5 Minutes | 556 | 12.9% |
| 5 to 9 Minutes | 1,193 | 27.6% |
| 10 to 14 Minutes | 1,063 | 24.6% |
| 15 to 19 Minutes | 522 | 12.1% |
| 20 to 24 Minutes | 178 | 4.1% |
| 25 to 29 Minutes | 227 | 5.2% |
| 30 to 34 Minutes | 121 | 2.8% |
| 35 to 39 Minutes | 171 | 4.0% |
| 40 to 44 Minutes | 36 | 0.8% |
| 45 to 59 Minutes | 56 | 1.3% |
| 60 to 89 Minutes | 47 | 1.1% |
| 90 or more Minutes | 150 | 3.5% |
Commute Time by Sex in Mccomb
The most common commute times in Mccomb are 10 to 14 minutes (444 commuters, 24.1%) for males and 5 to 9 minutes (837 commuters, 33.8%) for females.
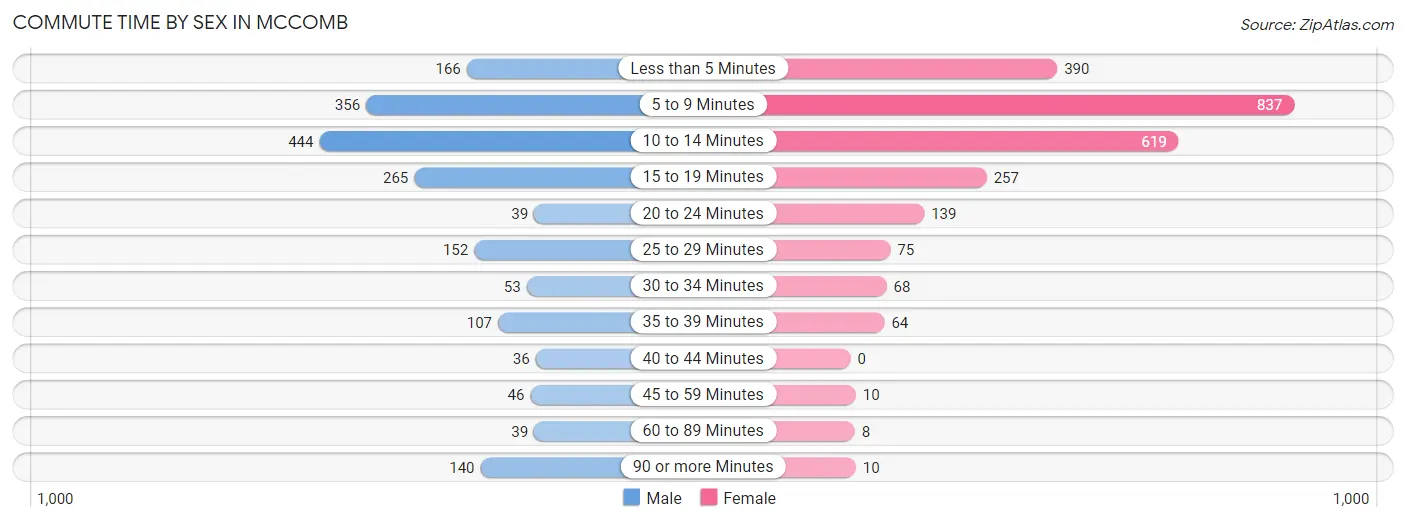
| Commute Time | Male | Female |
| Less than 5 Minutes | 166 (9.0%) | 390 (15.7%) |
| 5 to 9 Minutes | 356 (19.3%) | 837 (33.8%) |
| 10 to 14 Minutes | 444 (24.1%) | 619 (25.0%) |
| 15 to 19 Minutes | 265 (14.4%) | 257 (10.4%) |
| 20 to 24 Minutes | 39 (2.1%) | 139 (5.6%) |
| 25 to 29 Minutes | 152 (8.3%) | 75 (3.0%) |
| 30 to 34 Minutes | 53 (2.9%) | 68 (2.8%) |
| 35 to 39 Minutes | 107 (5.8%) | 64 (2.6%) |
| 40 to 44 Minutes | 36 (1.9%) | 0 (0.0%) |
| 45 to 59 Minutes | 46 (2.5%) | 10 (0.4%) |
| 60 to 89 Minutes | 39 (2.1%) | 8 (0.3%) |
| 90 or more Minutes | 140 (7.6%) | 10 (0.4%) |
Time of Departure to Work by Sex in Mccomb
The most frequent times of departure to work in Mccomb are 12:00 AM to 4:59 AM (376, 20.4%) for males and 7:00 AM to 7:29 AM (405, 16.4%) for females.
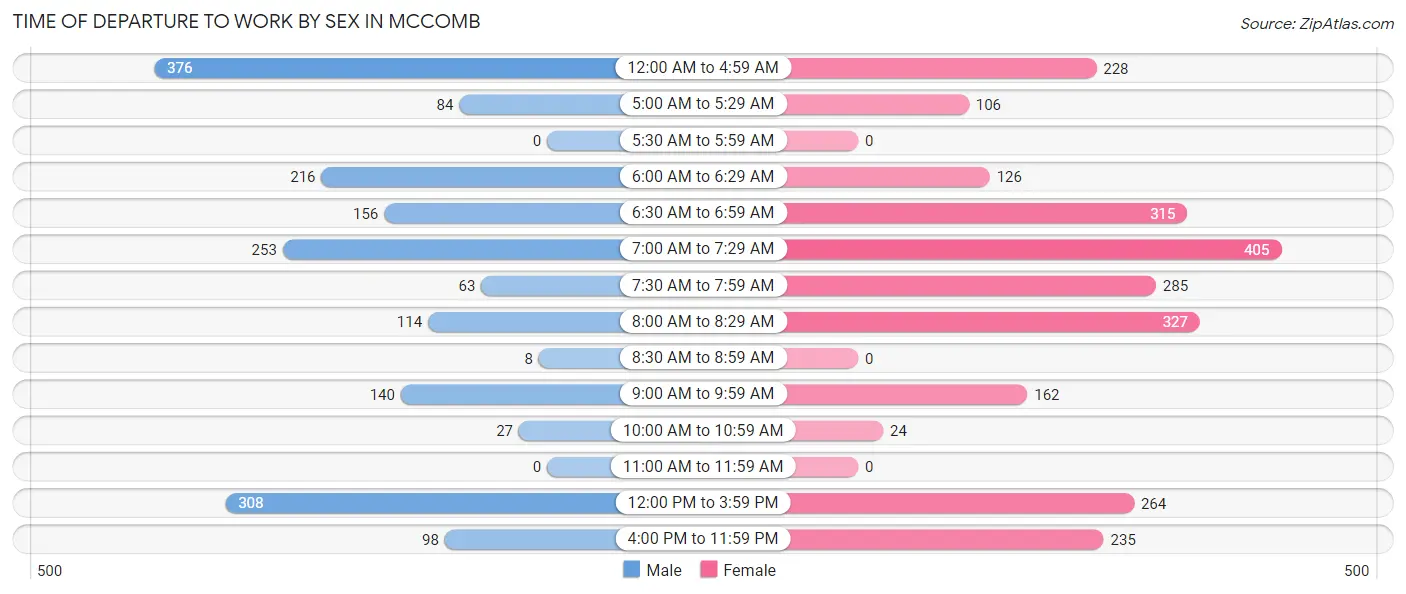
| Time of Departure | Male | Female |
| 12:00 AM to 4:59 AM | 376 (20.4%) | 228 (9.2%) |
| 5:00 AM to 5:29 AM | 84 (4.6%) | 106 (4.3%) |
| 5:30 AM to 5:59 AM | 0 (0.0%) | 0 (0.0%) |
| 6:00 AM to 6:29 AM | 216 (11.7%) | 126 (5.1%) |
| 6:30 AM to 6:59 AM | 156 (8.5%) | 315 (12.7%) |
| 7:00 AM to 7:29 AM | 253 (13.7%) | 405 (16.4%) |
| 7:30 AM to 7:59 AM | 63 (3.4%) | 285 (11.5%) |
| 8:00 AM to 8:29 AM | 114 (6.2%) | 327 (13.2%) |
| 8:30 AM to 8:59 AM | 8 (0.4%) | 0 (0.0%) |
| 9:00 AM to 9:59 AM | 140 (7.6%) | 162 (6.5%) |
| 10:00 AM to 10:59 AM | 27 (1.5%) | 24 (1.0%) |
| 11:00 AM to 11:59 AM | 0 (0.0%) | 0 (0.0%) |
| 12:00 PM to 3:59 PM | 308 (16.7%) | 264 (10.7%) |
| 4:00 PM to 11:59 PM | 98 (5.3%) | 235 (9.5%) |
| Total | 1,843 (100.0%) | 2,477 (100.0%) |
Housing Occupancy in Mccomb
Occupancy by Ownership in Mccomb
Of the total 5,024 dwellings in Mccomb, owner-occupied units account for 2,303 (45.8%), while renter-occupied units make up 2,721 (54.2%).
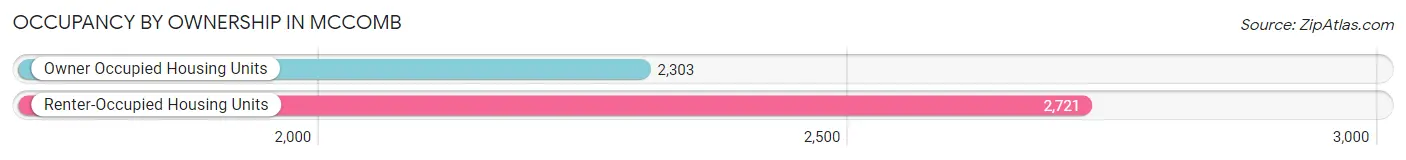
| Occupancy | # Housing Units | % Housing Units |
| Owner Occupied Housing Units | 2,303 | 45.8% |
| Renter-Occupied Housing Units | 2,721 | 54.2% |
| Total Occupied Housing Units | 5,024 | 100.0% |
Occupancy by Household Size in Mccomb
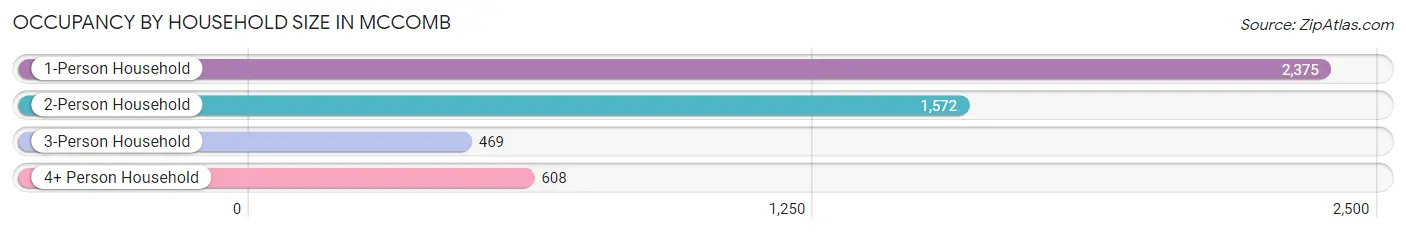
| Household Size | # Housing Units | % Housing Units |
| 1-Person Household | 2,375 | 47.3% |
| 2-Person Household | 1,572 | 31.3% |
| 3-Person Household | 469 | 9.3% |
| 4+ Person Household | 608 | 12.1% |
| Total Housing Units | 5,024 | 100.0% |
Occupancy by Ownership by Household Size in Mccomb
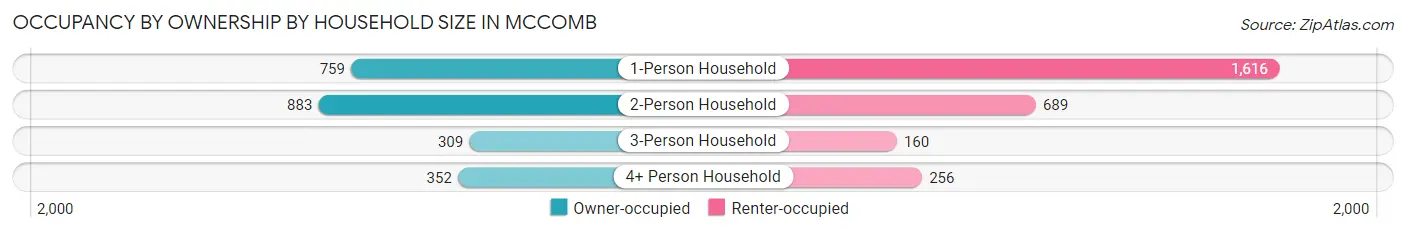
| Household Size | Owner-occupied | Renter-occupied |
| 1-Person Household | 759 (32.0%) | 1,616 (68.0%) |
| 2-Person Household | 883 (56.2%) | 689 (43.8%) |
| 3-Person Household | 309 (65.9%) | 160 (34.1%) |
| 4+ Person Household | 352 (57.9%) | 256 (42.1%) |
| Total Housing Units | 2,303 (45.8%) | 2,721 (54.2%) |
Occupancy by Educational Attainment in Mccomb
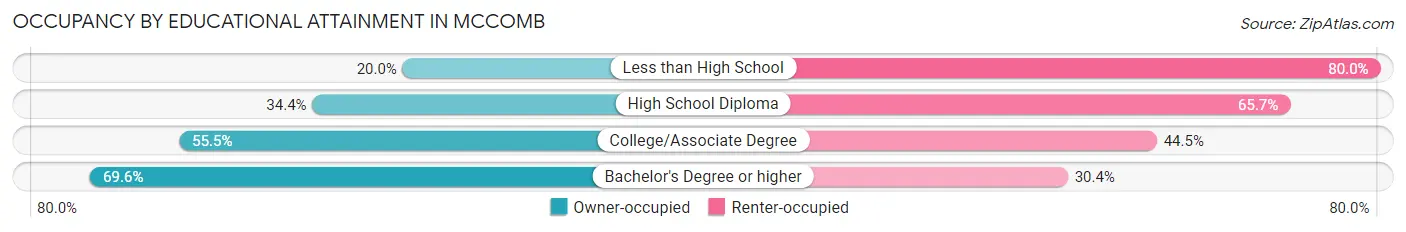
| Household Size | Owner-occupied | Renter-occupied |
| Less than High School | 136 (20.0%) | 543 (80.0%) |
| High School Diploma | 607 (34.4%) | 1,160 (65.6%) |
| College/Associate Degree | 923 (55.5%) | 740 (44.5%) |
| Bachelor's Degree or higher | 637 (69.6%) | 278 (30.4%) |
Occupancy by Age of Householder in Mccomb
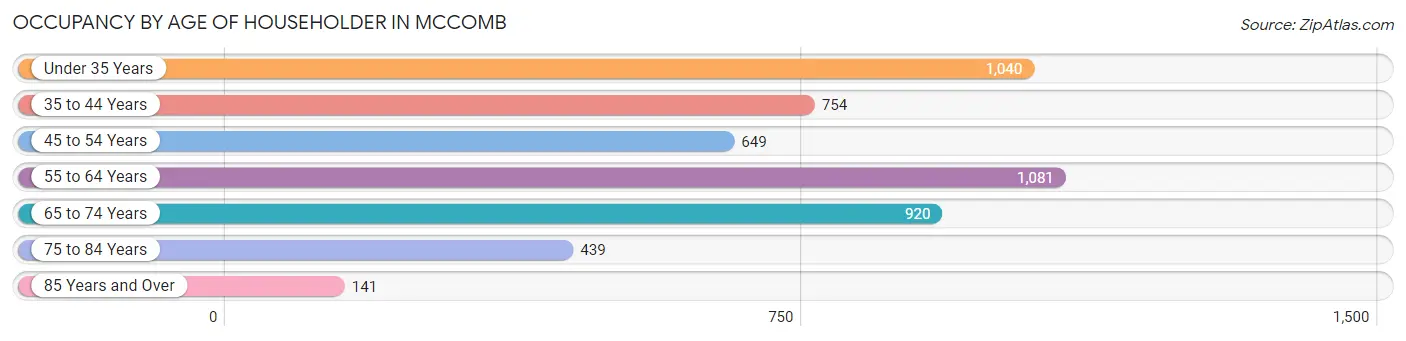
| Age Bracket | # Households | % Households |
| Under 35 Years | 1,040 | 20.7% |
| 35 to 44 Years | 754 | 15.0% |
| 45 to 54 Years | 649 | 12.9% |
| 55 to 64 Years | 1,081 | 21.5% |
| 65 to 74 Years | 920 | 18.3% |
| 75 to 84 Years | 439 | 8.7% |
| 85 Years and Over | 141 | 2.8% |
| Total | 5,024 | 100.0% |
Housing Finances in Mccomb
Median Income by Occupancy in Mccomb
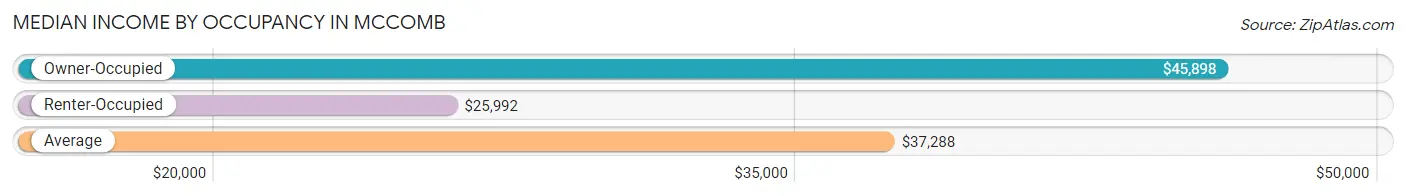
| Occupancy Type | # Households | Median Income |
| Owner-Occupied | 2,303 (45.8%) | $45,898 |
| Renter-Occupied | 2,721 (54.2%) | $25,992 |
| Average | 5,024 (100.0%) | $37,288 |
Occupancy by Householder Income Bracket in Mccomb
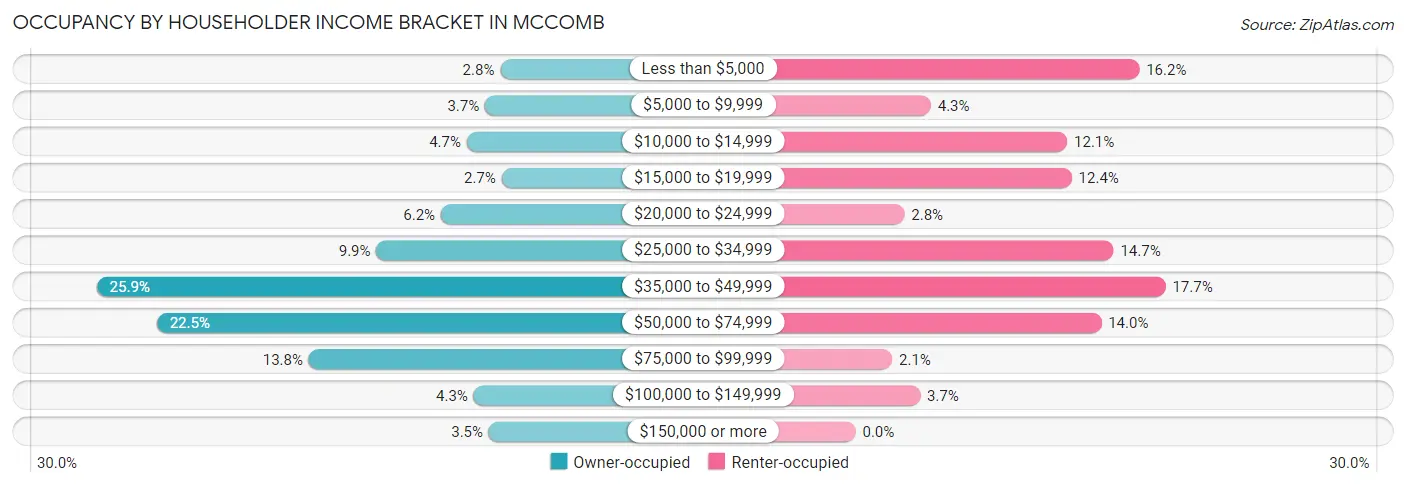
| Income Bracket | Owner-occupied | Renter-occupied |
| Less than $5,000 | 65 (2.8%) | 441 (16.2%) |
| $5,000 to $9,999 | 85 (3.7%) | 117 (4.3%) |
| $10,000 to $14,999 | 109 (4.7%) | 329 (12.1%) |
| $15,000 to $19,999 | 63 (2.7%) | 336 (12.3%) |
| $20,000 to $24,999 | 143 (6.2%) | 76 (2.8%) |
| $25,000 to $34,999 | 228 (9.9%) | 401 (14.7%) |
| $35,000 to $49,999 | 596 (25.9%) | 482 (17.7%) |
| $50,000 to $74,999 | 517 (22.5%) | 382 (14.0%) |
| $75,000 to $99,999 | 317 (13.8%) | 57 (2.1%) |
| $100,000 to $149,999 | 100 (4.3%) | 100 (3.7%) |
| $150,000 or more | 80 (3.5%) | 0 (0.0%) |
| Total | 2,303 (100.0%) | 2,721 (100.0%) |
Monthly Housing Cost Tiers in Mccomb
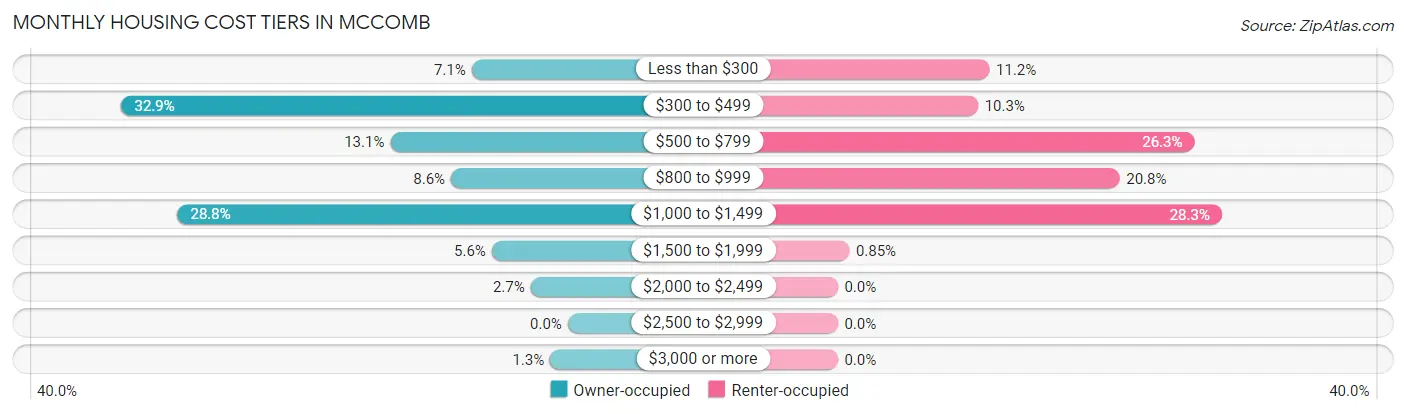
| Monthly Cost | Owner-occupied | Renter-occupied |
| Less than $300 | 163 (7.1%) | 304 (11.2%) |
| $300 to $499 | 757 (32.9%) | 281 (10.3%) |
| $500 to $799 | 301 (13.1%) | 715 (26.3%) |
| $800 to $999 | 198 (8.6%) | 565 (20.8%) |
| $1,000 to $1,499 | 662 (28.7%) | 770 (28.3%) |
| $1,500 to $1,999 | 129 (5.6%) | 23 (0.9%) |
| $2,000 to $2,499 | 63 (2.7%) | 0 (0.0%) |
| $2,500 to $2,999 | 0 (0.0%) | 0 (0.0%) |
| $3,000 or more | 30 (1.3%) | 0 (0.0%) |
| Total | 2,303 (100.0%) | 2,721 (100.0%) |
Physical Housing Characteristics in Mccomb
Housing Structures in Mccomb
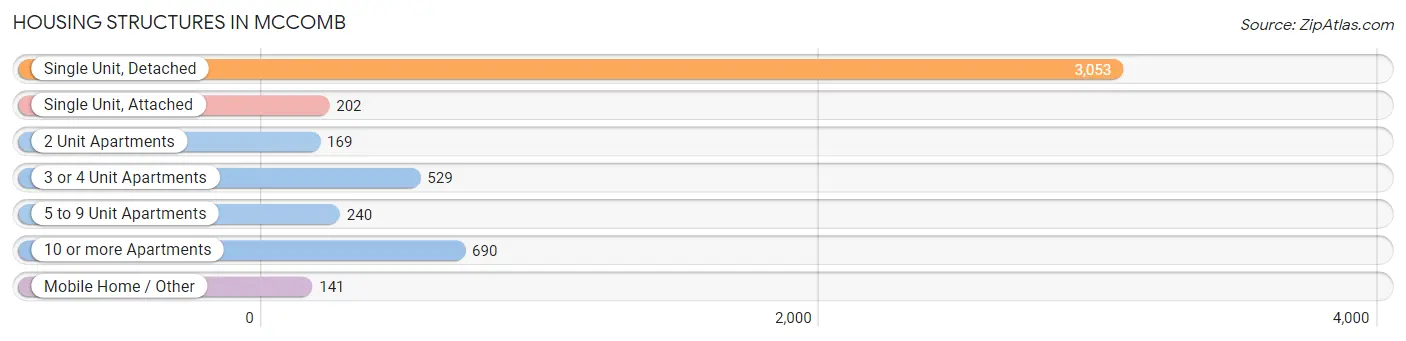
| Structure Type | # Housing Units | % Housing Units |
| Single Unit, Detached | 3,053 | 60.8% |
| Single Unit, Attached | 202 | 4.0% |
| 2 Unit Apartments | 169 | 3.4% |
| 3 or 4 Unit Apartments | 529 | 10.5% |
| 5 to 9 Unit Apartments | 240 | 4.8% |
| 10 or more Apartments | 690 | 13.7% |
| Mobile Home / Other | 141 | 2.8% |
| Total | 5,024 | 100.0% |
Housing Structures by Occupancy in Mccomb
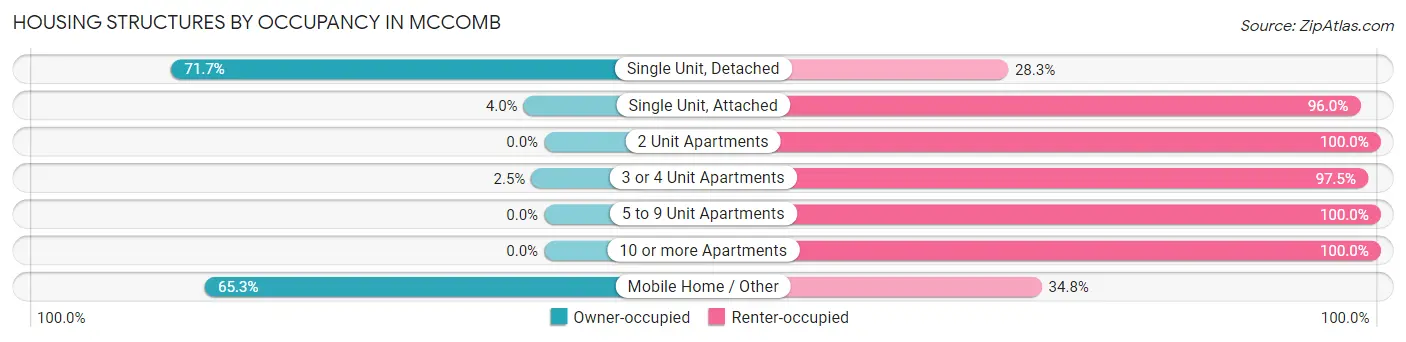
| Structure Type | Owner-occupied | Renter-occupied |
| Single Unit, Detached | 2,190 (71.7%) | 863 (28.3%) |
| Single Unit, Attached | 8 (4.0%) | 194 (96.0%) |
| 2 Unit Apartments | 0 (0.0%) | 169 (100.0%) |
| 3 or 4 Unit Apartments | 13 (2.5%) | 516 (97.5%) |
| 5 to 9 Unit Apartments | 0 (0.0%) | 240 (100.0%) |
| 10 or more Apartments | 0 (0.0%) | 690 (100.0%) |
| Mobile Home / Other | 92 (65.2%) | 49 (34.7%) |
| Total | 2,303 (45.8%) | 2,721 (54.2%) |
Housing Structures by Number of Rooms in Mccomb
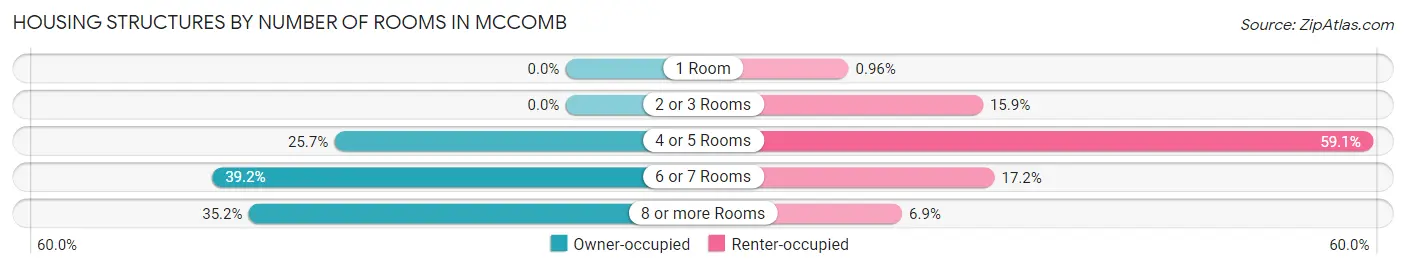
| Number of Rooms | Owner-occupied | Renter-occupied |
| 1 Room | 0 (0.0%) | 26 (1.0%) |
| 2 or 3 Rooms | 0 (0.0%) | 432 (15.9%) |
| 4 or 5 Rooms | 591 (25.7%) | 1,608 (59.1%) |
| 6 or 7 Rooms | 902 (39.2%) | 467 (17.2%) |
| 8 or more Rooms | 810 (35.2%) | 188 (6.9%) |
| Total | 2,303 (100.0%) | 2,721 (100.0%) |
Housing Structure by Heating Type in Mccomb
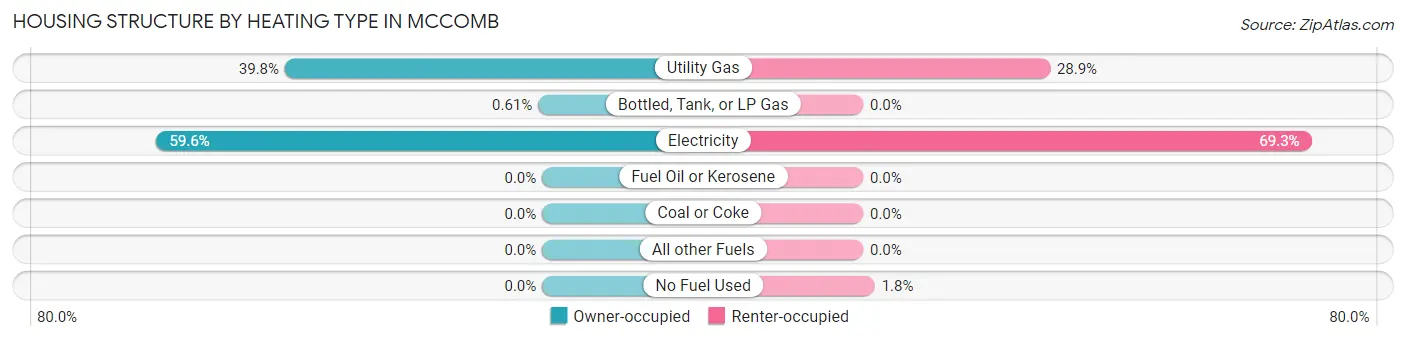
| Heating Type | Owner-occupied | Renter-occupied |
| Utility Gas | 916 (39.8%) | 786 (28.9%) |
| Bottled, Tank, or LP Gas | 14 (0.6%) | 0 (0.0%) |
| Electricity | 1,373 (59.6%) | 1,886 (69.3%) |
| Fuel Oil or Kerosene | 0 (0.0%) | 0 (0.0%) |
| Coal or Coke | 0 (0.0%) | 0 (0.0%) |
| All other Fuels | 0 (0.0%) | 0 (0.0%) |
| No Fuel Used | 0 (0.0%) | 49 (1.8%) |
| Total | 2,303 (100.0%) | 2,721 (100.0%) |
Household Vehicle Usage in Mccomb
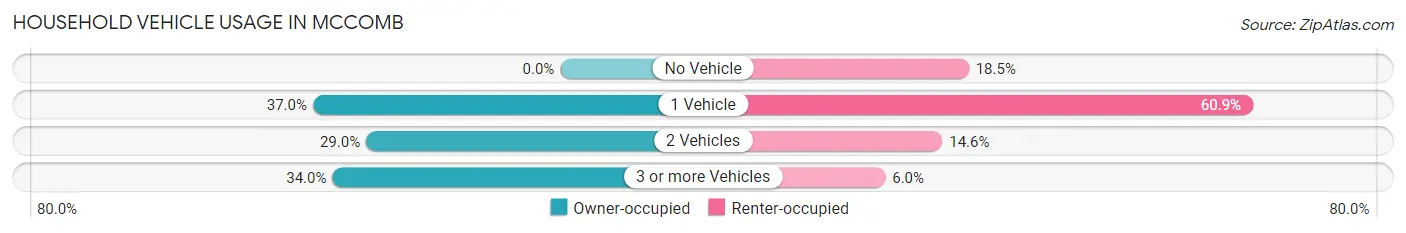
| Vehicles per Household | Owner-occupied | Renter-occupied |
| No Vehicle | 0 (0.0%) | 503 (18.5%) |
| 1 Vehicle | 851 (36.9%) | 1,658 (60.9%) |
| 2 Vehicles | 668 (29.0%) | 396 (14.5%) |
| 3 or more Vehicles | 784 (34.0%) | 164 (6.0%) |
| Total | 2,303 (100.0%) | 2,721 (100.0%) |
Real Estate & Mortgages in Mccomb
Real Estate and Mortgage Overview in Mccomb
| Characteristic | Without Mortgage | With Mortgage |
| Housing Units | 1,258 | 1,045 |
| Median Property Value | $96,200 | $116,500 |
| Median Household Income | $45,000 | $36 |
| Monthly Housing Costs | $412 | $18 |
| Real Estate Taxes | $1,289 | $148 |
Property Value by Mortgage Status in Mccomb
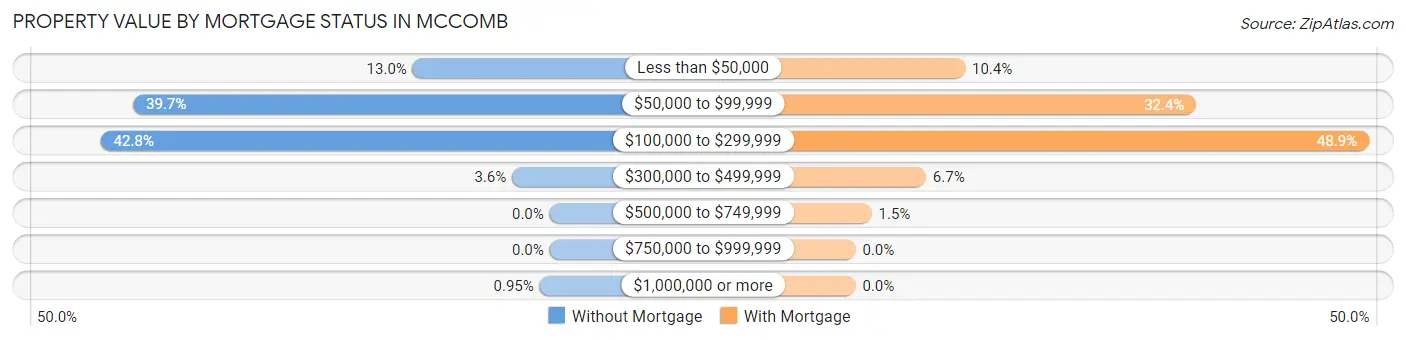
| Property Value | Without Mortgage | With Mortgage |
| Less than $50,000 | 164 (13.0%) | 109 (10.4%) |
| $50,000 to $99,999 | 499 (39.7%) | 339 (32.4%) |
| $100,000 to $299,999 | 538 (42.8%) | 511 (48.9%) |
| $300,000 to $499,999 | 45 (3.6%) | 70 (6.7%) |
| $500,000 to $749,999 | 0 (0.0%) | 16 (1.5%) |
| $750,000 to $999,999 | 0 (0.0%) | 0 (0.0%) |
| $1,000,000 or more | 12 (0.9%) | 0 (0.0%) |
| Total | 1,258 (100.0%) | 1,045 (100.0%) |
Household Income by Mortgage Status in Mccomb
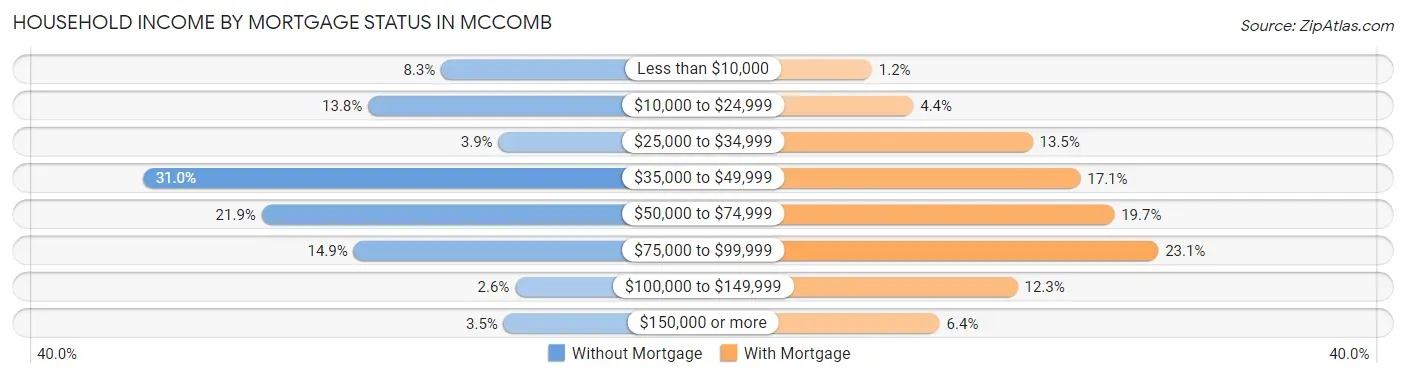
| Household Income | Without Mortgage | With Mortgage |
| Less than $10,000 | 104 (8.3%) | 13 (1.2%) |
| $10,000 to $24,999 | 174 (13.8%) | 46 (4.4%) |
| $25,000 to $34,999 | 49 (3.9%) | 141 (13.5%) |
| $35,000 to $49,999 | 390 (31.0%) | 179 (17.1%) |
| $50,000 to $74,999 | 276 (21.9%) | 206 (19.7%) |
| $75,000 to $99,999 | 188 (14.9%) | 241 (23.1%) |
| $100,000 to $149,999 | 33 (2.6%) | 129 (12.3%) |
| $150,000 or more | 44 (3.5%) | 67 (6.4%) |
| Total | 1,258 (100.0%) | 1,045 (100.0%) |
Property Value to Household Income Ratio in Mccomb
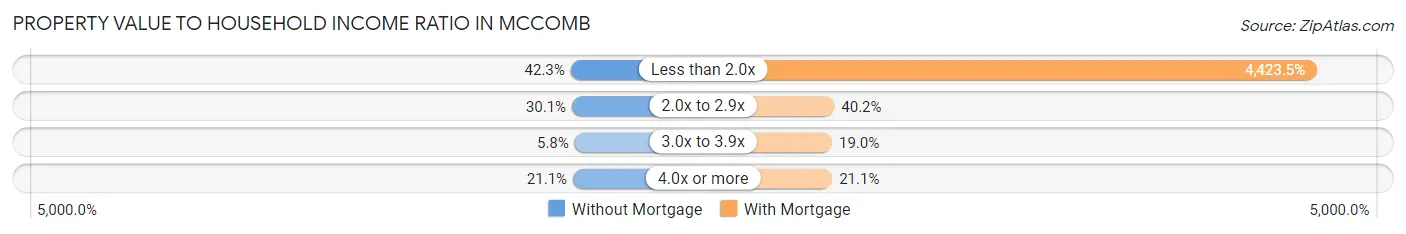
| Value-to-Income Ratio | Without Mortgage | With Mortgage |
| Less than 2.0x | 532 (42.3%) | 46,226 (4,423.5%) |
| 2.0x to 2.9x | 378 (30.0%) | 420 (40.2%) |
| 3.0x to 3.9x | 73 (5.8%) | 199 (19.0%) |
| 4.0x or more | 266 (21.1%) | 220 (21.0%) |
| Total | 1,258 (100.0%) | 1,045 (100.0%) |
Real Estate Taxes by Mortgage Status in Mccomb
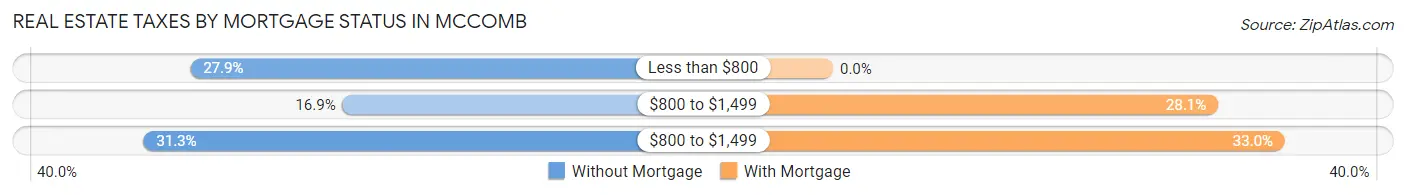
| Property Taxes | Without Mortgage | With Mortgage |
| Less than $800 | 351 (27.9%) | 0 (0.0%) |
| $800 to $1,499 | 212 (16.9%) | 294 (28.1%) |
| $800 to $1,499 | 394 (31.3%) | 345 (33.0%) |
| Total | 1,258 (100.0%) | 1,045 (100.0%) |
Health & Disability in Mccomb
Health Insurance Coverage by Age in Mccomb
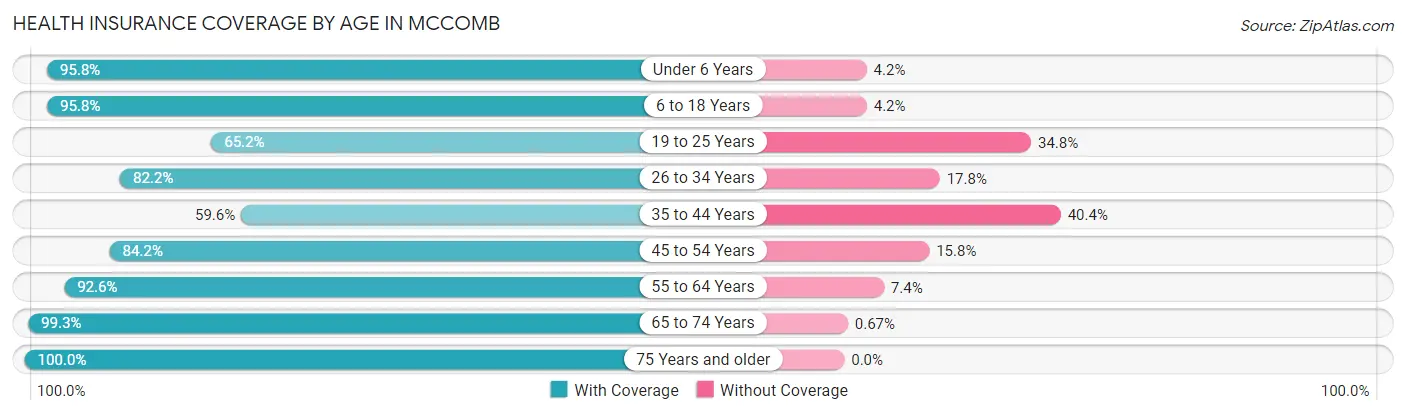
| Age Bracket | With Coverage | Without Coverage |
| Under 6 Years | 942 (95.8%) | 41 (4.2%) |
| 6 to 18 Years | 2,334 (95.8%) | 102 (4.2%) |
| 19 to 25 Years | 687 (65.2%) | 367 (34.8%) |
| 26 to 34 Years | 1,048 (82.2%) | 227 (17.8%) |
| 35 to 44 Years | 804 (59.6%) | 544 (40.4%) |
| 45 to 54 Years | 1,057 (84.2%) | 199 (15.8%) |
| 55 to 64 Years | 1,442 (92.6%) | 115 (7.4%) |
| 65 to 74 Years | 1,179 (99.3%) | 8 (0.7%) |
| 75 Years and older | 724 (100.0%) | 0 (0.0%) |
| Total | 10,217 (86.4%) | 1,603 (13.6%) |
Health Insurance Coverage by Citizenship Status in Mccomb
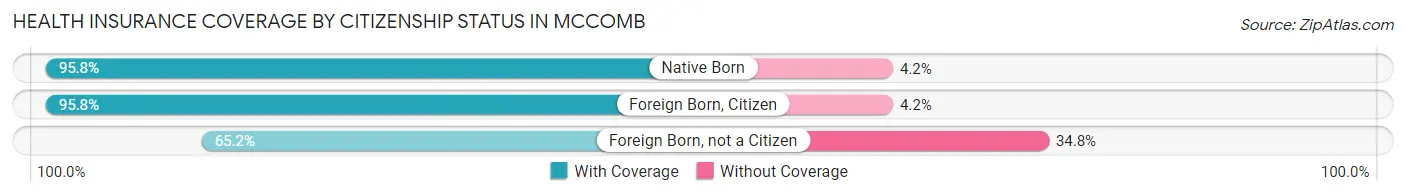
| Citizenship Status | With Coverage | Without Coverage |
| Native Born | 942 (95.8%) | 41 (4.2%) |
| Foreign Born, Citizen | 2,334 (95.8%) | 102 (4.2%) |
| Foreign Born, not a Citizen | 687 (65.2%) | 367 (34.8%) |
Health Insurance Coverage by Household Income in Mccomb
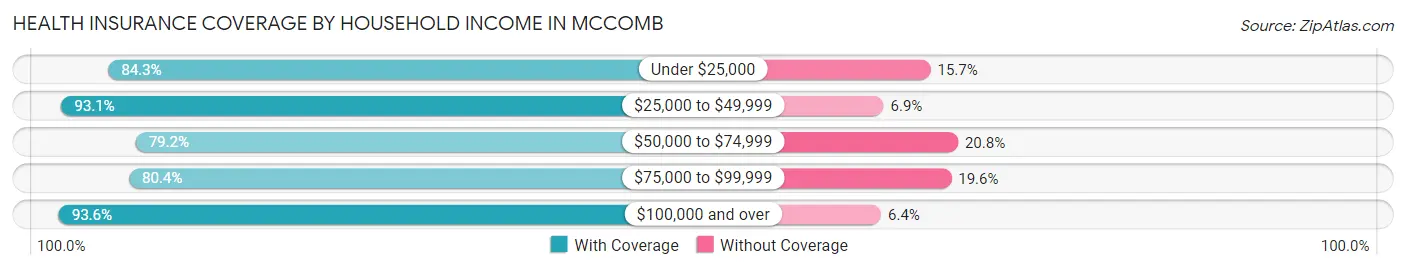
| Household Income | With Coverage | Without Coverage |
| Under $25,000 | 3,284 (84.3%) | 611 (15.7%) |
| $25,000 to $49,999 | 3,644 (93.1%) | 270 (6.9%) |
| $50,000 to $74,999 | 1,775 (79.2%) | 467 (20.8%) |
| $75,000 to $99,999 | 838 (80.4%) | 204 (19.6%) |
| $100,000 and over | 671 (93.6%) | 46 (6.4%) |
Public vs Private Health Insurance Coverage by Age in Mccomb
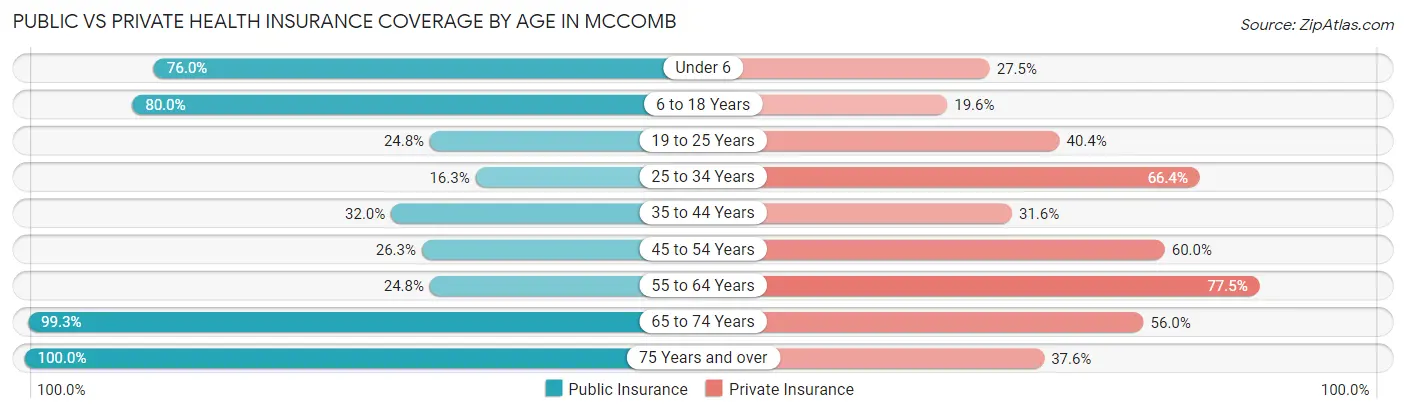
| Age Bracket | Public Insurance | Private Insurance |
| Under 6 | 747 (76.0%) | 270 (27.5%) |
| 6 to 18 Years | 1,949 (80.0%) | 477 (19.6%) |
| 19 to 25 Years | 261 (24.8%) | 426 (40.4%) |
| 25 to 34 Years | 208 (16.3%) | 847 (66.4%) |
| 35 to 44 Years | 431 (32.0%) | 426 (31.6%) |
| 45 to 54 Years | 330 (26.3%) | 753 (60.0%) |
| 55 to 64 Years | 386 (24.8%) | 1,207 (77.5%) |
| 65 to 74 Years | 1,179 (99.3%) | 665 (56.0%) |
| 75 Years and over | 724 (100.0%) | 272 (37.6%) |
| Total | 6,215 (52.6%) | 5,343 (45.2%) |
Disability Status by Sex by Age in Mccomb
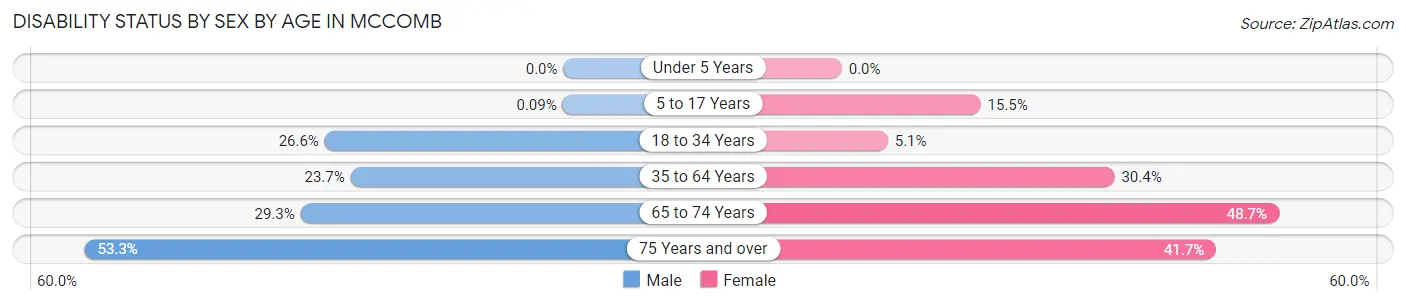
| Age Bracket | Male | Female |
| Under 5 Years | 0 (0.0%) | 0 (0.0%) |
| 5 to 17 Years | 1 (0.1%) | 194 (15.5%) |
| 18 to 34 Years | 274 (26.6%) | 77 (5.1%) |
| 35 to 64 Years | 432 (23.7%) | 710 (30.4%) |
| 65 to 74 Years | 149 (29.3%) | 330 (48.7%) |
| 75 Years and over | 152 (53.3%) | 183 (41.7%) |
Disability Class by Sex by Age in Mccomb
Disability Class: Hearing Difficulty
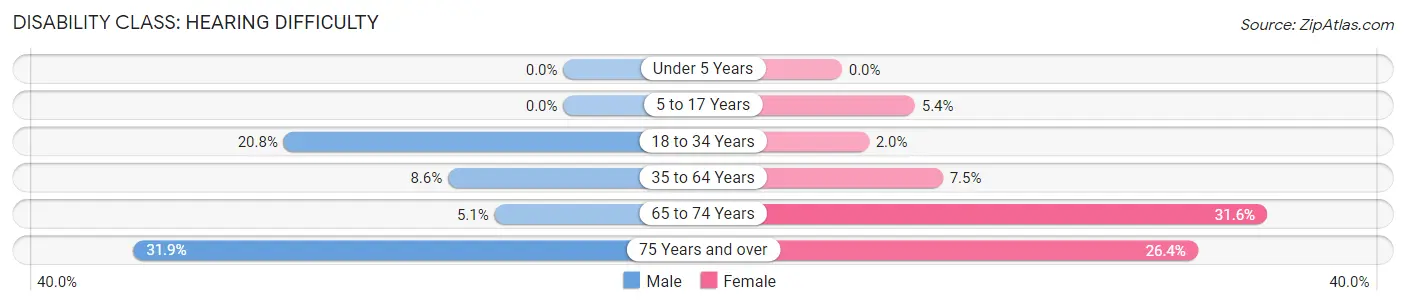
| Age Bracket | Male | Female |
| Under 5 Years | 0 (0.0%) | 0 (0.0%) |
| 5 to 17 Years | 0 (0.0%) | 68 (5.4%) |
| 18 to 34 Years | 214 (20.8%) | 30 (2.0%) |
| 35 to 64 Years | 156 (8.6%) | 175 (7.5%) |
| 65 to 74 Years | 26 (5.1%) | 214 (31.6%) |
| 75 Years and over | 91 (31.9%) | 116 (26.4%) |
Disability Class: Vision Difficulty
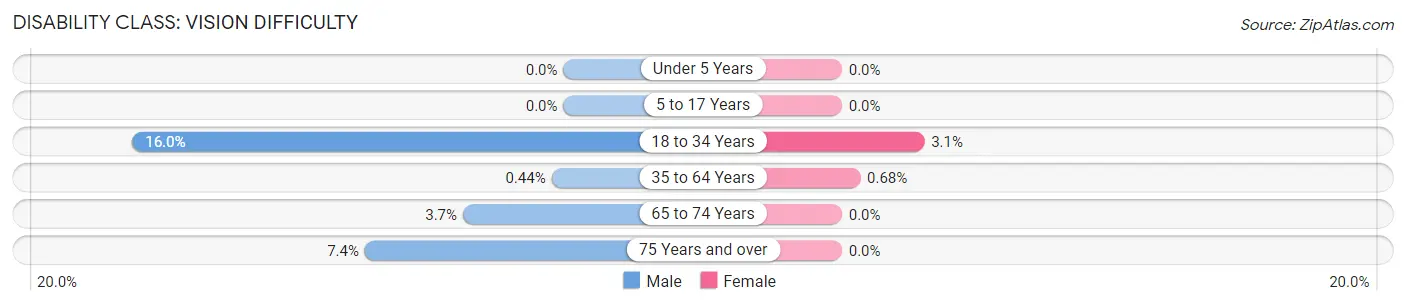
| Age Bracket | Male | Female |
| Under 5 Years | 0 (0.0%) | 0 (0.0%) |
| 5 to 17 Years | 0 (0.0%) | 0 (0.0%) |
| 18 to 34 Years | 165 (16.0%) | 46 (3.1%) |
| 35 to 64 Years | 8 (0.4%) | 16 (0.7%) |
| 65 to 74 Years | 19 (3.7%) | 0 (0.0%) |
| 75 Years and over | 21 (7.4%) | 0 (0.0%) |
Disability Class: Cognitive Difficulty
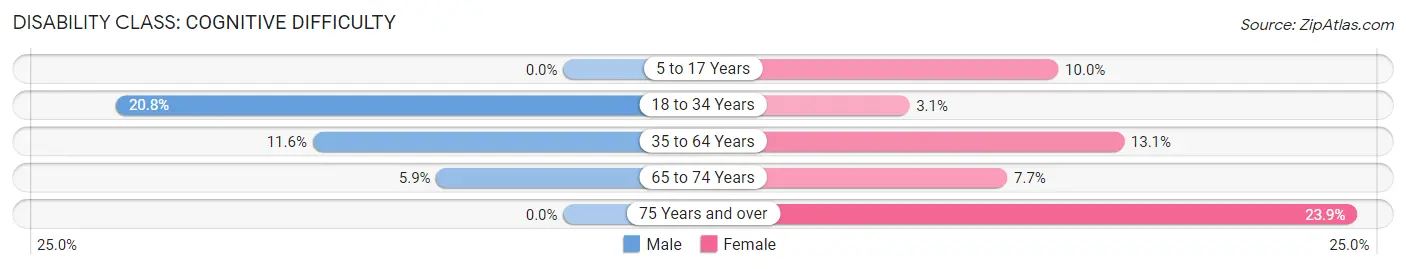
| Age Bracket | Male | Female |
| 5 to 17 Years | 0 (0.0%) | 126 (10.0%) |
| 18 to 34 Years | 214 (20.8%) | 47 (3.1%) |
| 35 to 64 Years | 212 (11.6%) | 306 (13.1%) |
| 65 to 74 Years | 30 (5.9%) | 52 (7.7%) |
| 75 Years and over | 0 (0.0%) | 105 (23.9%) |
Disability Class: Ambulatory Difficulty
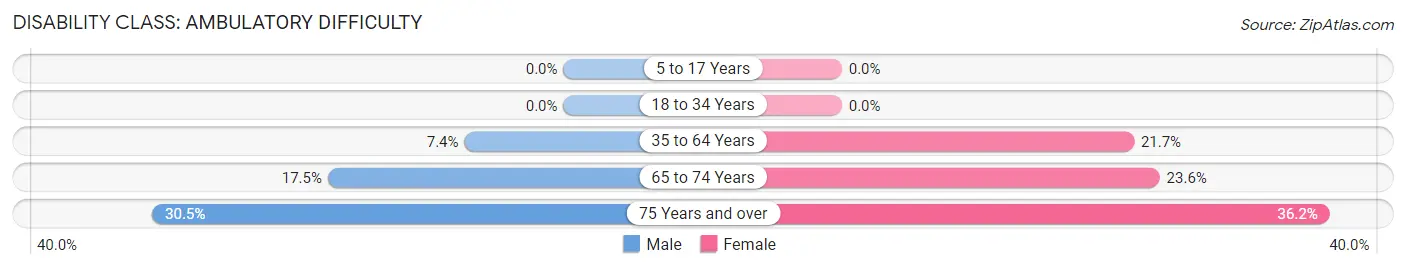
| Age Bracket | Male | Female |
| 5 to 17 Years | 0 (0.0%) | 0 (0.0%) |
| 18 to 34 Years | 0 (0.0%) | 0 (0.0%) |
| 35 to 64 Years | 134 (7.3%) | 507 (21.7%) |
| 65 to 74 Years | 89 (17.5%) | 160 (23.6%) |
| 75 Years and over | 87 (30.5%) | 159 (36.2%) |
Disability Class: Self-Care Difficulty
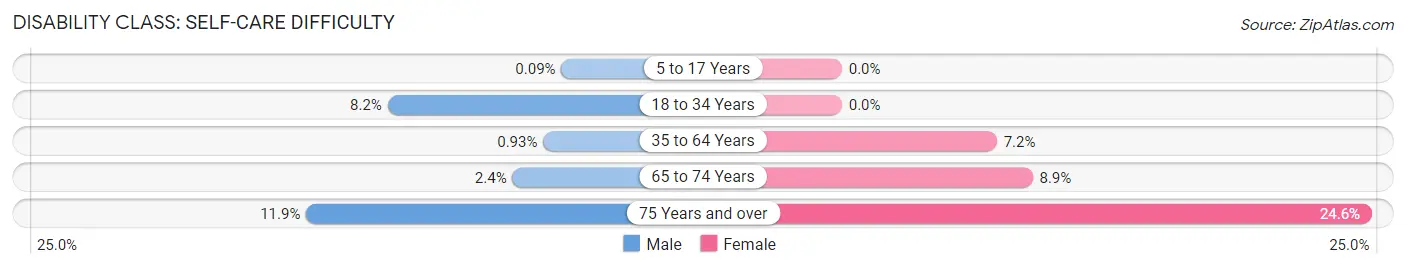
| Age Bracket | Male | Female |
| 5 to 17 Years | 1 (0.1%) | 0 (0.0%) |
| 18 to 34 Years | 84 (8.2%) | 0 (0.0%) |
| 35 to 64 Years | 17 (0.9%) | 168 (7.2%) |
| 65 to 74 Years | 12 (2.4%) | 60 (8.8%) |
| 75 Years and over | 34 (11.9%) | 108 (24.6%) |
Technology Access in Mccomb
Computing Device Access in Mccomb
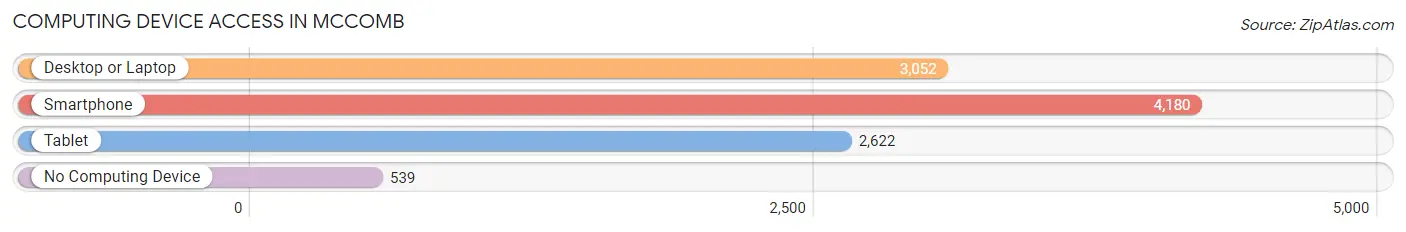
| Device Type | # Households | % Households |
| Desktop or Laptop | 3,052 | 60.8% |
| Smartphone | 4,180 | 83.2% |
| Tablet | 2,622 | 52.2% |
| No Computing Device | 539 | 10.7% |
| Total | 5,024 | 100.0% |
Internet Access in Mccomb
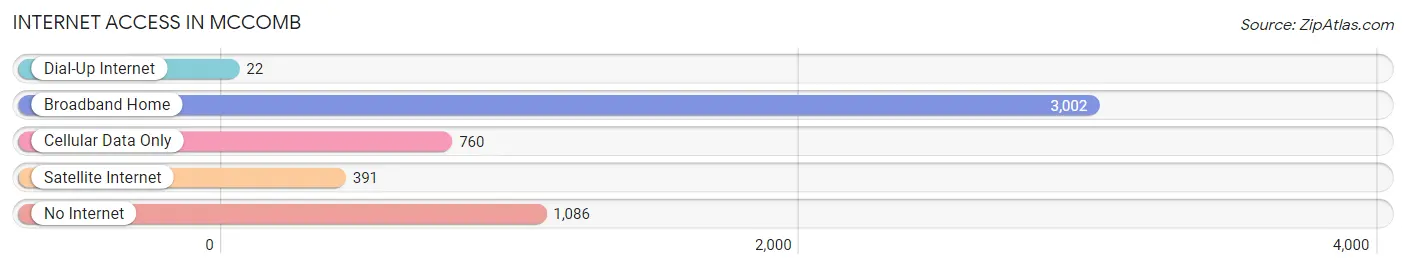
| Internet Type | # Households | % Households |
| Dial-Up Internet | 22 | 0.4% |
| Broadband Home | 3,002 | 59.8% |
| Cellular Data Only | 760 | 15.1% |
| Satellite Internet | 391 | 7.8% |
| No Internet | 1,086 | 21.6% |
| Total | 5,024 | 100.0% |
Mccomb Summary
Mccomb, Mississippi is a city located in Pike County, Mississippi. It is the county seat of Pike County and is located in the southeastern part of the state. The city is situated along the banks of the Bogue Chitto River and is part of the McComb, Mississippi Micropolitan Statistical Area. The city has a population of 13,644 as of the 2010 census.
History
Mccomb was founded in 1872 by Henry McComb, president of the Mississippi Central Railroad. The city was named after him and was incorporated in 1873. The city was originally a railroad town and was the site of the first railroad bridge across the Bogue Chitto River. The city grew rapidly in the late 19th century and early 20th century due to the railroad and the timber industry. The city was also the site of a major battle during the Civil War.
Geography
Mccomb is located at 31°14'N 90°30'W (31.23, -90.50). The city is situated along the banks of the Bogue Chitto River and is part of the McComb, Mississippi Micropolitan Statistical Area. The city has a total area of 8.3 square miles, of which 8.2 square miles is land and 0.1 square miles is water.
Economy
Mccomb’s economy is largely based on the timber industry, as well as manufacturing and healthcare. The city is home to several large timber companies, including Weyerhaeuser, Georgia-Pacific, and International Paper. The city is also home to several manufacturing companies, including McComb Industries, which produces automotive parts, and McComb Manufacturing, which produces furniture. The city is also home to several healthcare facilities, including Southwest Mississippi Regional Medical Center and McComb Community Hospital.
Demographics
As of the 2010 census, there were 13,644 people, 5,093 households, and 3,521 families residing in the city. The population density was 1,655.2 people per square mile. The racial makeup of the city was 57.2% African American, 40.2% White, 0.3% Native American, 0.5% Asian, 0.1% Pacific Islander, 0.7% from other races, and 1.0% from two or more races. Hispanic or Latino of any race were 1.7% of the population.
The median income for a household in the city was $27,945, and the median income for a family was $35,945. Males had a median income of $30,945 versus $21,945 for females. The per capita income for the city was $14,945. About 22.2% of families and 25.2% of the population were below the poverty line, including 36.2% of those under age 18 and 18.2% of those age 65 or over.
Mccomb is a diverse city with a rich history and a vibrant economy. The city is home to several large timber companies, manufacturing companies, and healthcare facilities, and is a major hub for the timber industry in the region. The city has a population of 13,644 as of the 2010 census and has a median income of $27,945. The city is also home to several cultural and recreational attractions, including the McComb Arts Center, the McComb Railroad Museum, and the McComb City Park.
Common Questions
What is Per Capita Income in Mccomb?
Per Capita income in Mccomb is $19,123.
What is the Median Family Income in Mccomb?
Median Family Income in Mccomb is $39,630.
What is the Median Household income in Mccomb?
Median Household Income in Mccomb is $37,288.
What is Income or Wage Gap in Mccomb?
Income or Wage Gap in Mccomb is 27.1%.
Women in Mccomb earn 72.9 cents for every dollar earned by a man.
What is Family Income Deficit in Mccomb?
Family Income Deficit in Mccomb is $12,947.
Families that are below poverty line in Mccomb earn $12,947 less on average than the poverty threshold level.
What is Inequality or Gini Index in Mccomb?
Inequality or Gini Index in Mccomb is 0.46.
What is the Total Population of Mccomb?
Total Population of Mccomb is 12,295.
What is the Total Male Population of Mccomb?
Total Male Population of Mccomb is 5,337.
What is the Total Female Population of Mccomb?
Total Female Population of Mccomb is 6,958.
What is the Ratio of Males per 100 Females in Mccomb?
There are 76.70 Males per 100 Females in Mccomb.
What is the Ratio of Females per 100 Males in Mccomb?
There are 130.37 Females per 100 Males in Mccomb.
What is the Median Population Age in Mccomb?
Median Population Age in Mccomb is 36.8 Years.
What is the Average Family Size in Mccomb
Average Family Size in Mccomb is 3.6 People.
What is the Average Household Size in Mccomb
Average Household Size in Mccomb is 2.4 People.
How Large is the Labor Force in Mccomb?
There are 4,669 People in the Labor Forcein in Mccomb.
What is the Percentage of People in the Labor Force in Mccomb?
50.2% of People are in the Labor Force in Mccomb.
What is the Unemployment Rate in Mccomb?
Unemployment Rate in Mccomb is 5.8%.