Long Beach, MS Map & Demographics
Long Beach Map
Long Beach Overview
$34,677
PER CAPITA INCOME
$84,284
AVG FAMILY INCOME
$66,573
AVG HOUSEHOLD INCOME
3.1%
WAGE / INCOME GAP [ % ]
96.9¢/ $1
WAGE / INCOME GAP [ $ ]
0.45
INEQUALITY / GINI INDEX
16,809
TOTAL POPULATION
7,831
MALE POPULATION
8,978
FEMALE POPULATION
87.22
MALES / 100 FEMALES
114.65
FEMALES / 100 MALES
41.0
MEDIAN AGE
3.2
AVG FAMILY SIZE
2.5
AVG HOUSEHOLD SIZE
8,104
LABOR FORCE [ PEOPLE ]
60.4%
PERCENT IN LABOR FORCE
5.8%
UNEMPLOYMENT RATE
Long Beach Zip Codes
Long Beach Area Codes
Income in Long Beach
Income Overview in Long Beach
Per Capita Income in Long Beach is $34,677, while median incomes of families and households are $84,284 and $66,573 respectively.
| Characteristic | Number | Measure |
| Per Capita Income | 16,809 | $34,677 |
| Median Family Income | 4,251 | $84,284 |
| Mean Family Income | 4,251 | $107,101 |
| Median Household Income | 6,708 | $66,573 |
| Mean Household Income | 6,708 | $86,224 |
| Income Deficit | 4,251 | $0 |
| Wage / Income Gap (%) | 16,809 | 3.11% |
| Wage / Income Gap ($) | 16,809 | 96.89¢ per $1 |
| Gini / Inequality Index | 16,809 | 0.45 |
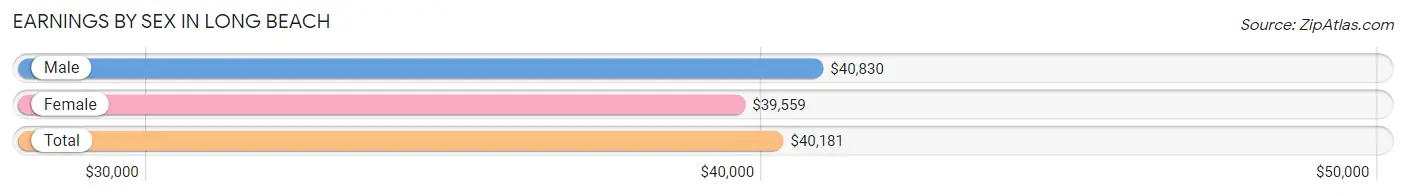
Earnings by Sex in Long Beach
Average Earnings in Long Beach are $40,181, $40,830 for men and $39,559 for women, a difference of 3.1%.
| Sex | Number | Average Earnings |
| Male | 4,179 (50.0%) | $40,830 |
| Female | 4,170 (49.9%) | $39,559 |
| Total | 8,349 (100.0%) | $40,181 |
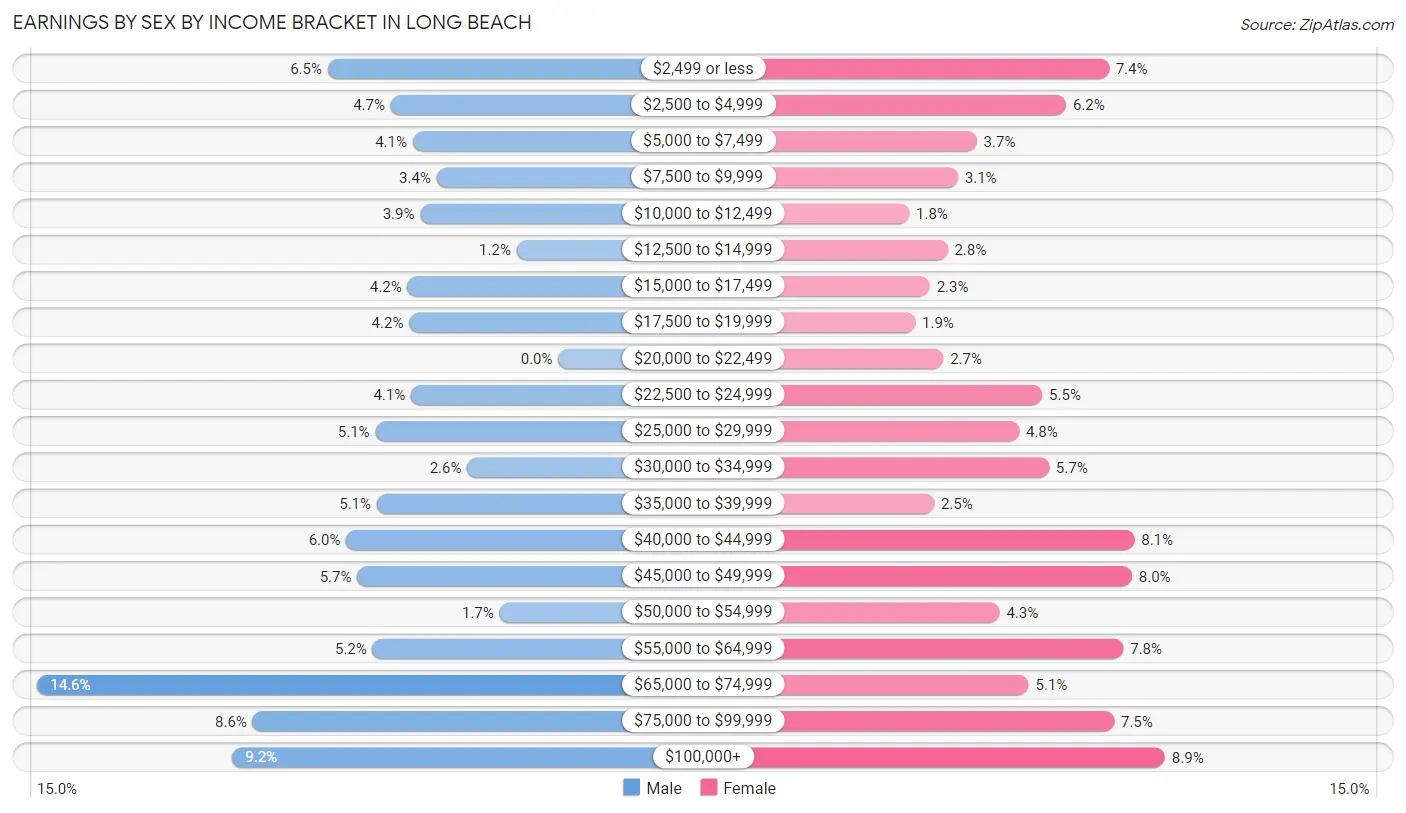
Earnings by Sex by Income Bracket in Long Beach
The most common earnings brackets in Long Beach are $65,000 to $74,999 for men (612 | 14.6%) and $100,000+ for women (373 | 8.9%).
| Income | Male | Female |
| $2,499 or less | 271 (6.5%) | 307 (7.4%) |
| $2,500 to $4,999 | 197 (4.7%) | 257 (6.2%) |
| $5,000 to $7,499 | 171 (4.1%) | 152 (3.6%) |
| $7,500 to $9,999 | 143 (3.4%) | 130 (3.1%) |
| $10,000 to $12,499 | 162 (3.9%) | 73 (1.8%) |
| $12,500 to $14,999 | 49 (1.2%) | 118 (2.8%) |
| $15,000 to $17,499 | 177 (4.2%) | 97 (2.3%) |
| $17,500 to $19,999 | 175 (4.2%) | 80 (1.9%) |
| $20,000 to $22,499 | 0 (0.0%) | 113 (2.7%) |
| $22,500 to $24,999 | 173 (4.1%) | 229 (5.5%) |
| $25,000 to $29,999 | 215 (5.1%) | 202 (4.8%) |
| $30,000 to $34,999 | 107 (2.6%) | 237 (5.7%) |
| $35,000 to $39,999 | 213 (5.1%) | 102 (2.5%) |
| $40,000 to $44,999 | 249 (6.0%) | 337 (8.1%) |
| $45,000 to $49,999 | 236 (5.7%) | 334 (8.0%) |
| $50,000 to $54,999 | 69 (1.7%) | 179 (4.3%) |
| $55,000 to $64,999 | 218 (5.2%) | 324 (7.8%) |
| $65,000 to $74,999 | 612 (14.6%) | 213 (5.1%) |
| $75,000 to $99,999 | 359 (8.6%) | 313 (7.5%) |
| $100,000+ | 383 (9.2%) | 373 (8.9%) |
| Total | 4,179 (100.0%) | 4,170 (100.0%) |
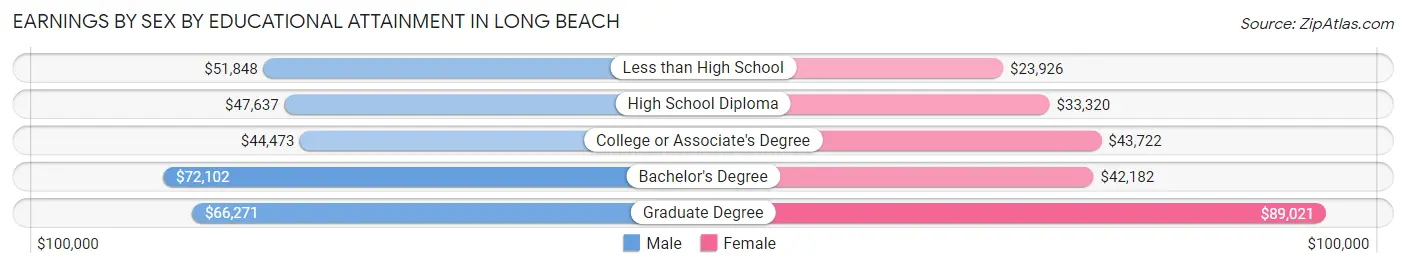
Earnings by Sex by Educational Attainment in Long Beach
Average earnings in Long Beach are $50,708 for men and $43,440 for women, a difference of 14.3%. Men with an educational attainment of bachelor's degree enjoy the highest average annual earnings of $72,102, while those with college or associate's degree education earn the least with $44,473. Women with an educational attainment of graduate degree earn the most with the average annual earnings of $89,021, while those with less than high school education have the smallest earnings of $23,926.
| Educational Attainment | Male Income | Female Income |
| Less than High School | $51,848 | $23,926 |
| High School Diploma | $47,637 | $33,320 |
| College or Associate's Degree | $44,473 | $43,722 |
| Bachelor's Degree | $72,102 | $42,182 |
| Graduate Degree | $66,271 | $89,021 |
| Total | $50,708 | $43,440 |
Family Income in Long Beach
Family Income Brackets in Long Beach
According to the Long Beach family income data, there are 1,054 families falling into the $100,000 to $149,999 income range, which is the most common income bracket and makes up 24.8% of all families. Conversely, the less than $10,000 income bracket is the least frequent group with only 64 families (1.5%) belonging to this category.
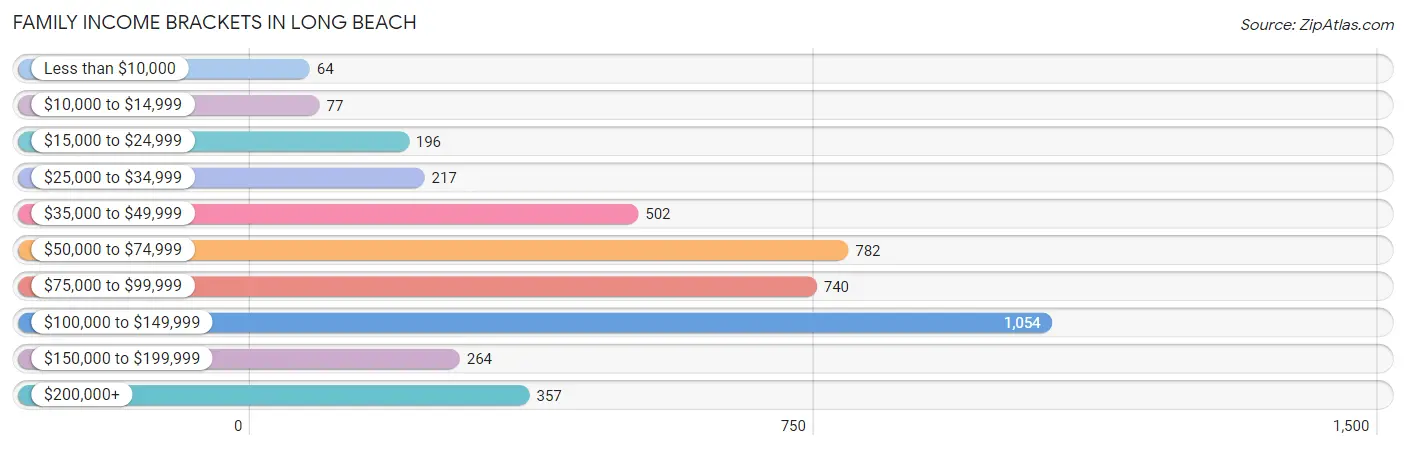
| Income Bracket | # Families | % Families |
| Less than $10,000 | 64 | 1.5% |
| $10,000 to $14,999 | 77 | 1.8% |
| $15,000 to $24,999 | 196 | 4.6% |
| $25,000 to $34,999 | 217 | 5.1% |
| $35,000 to $49,999 | 502 | 11.8% |
| $50,000 to $74,999 | 782 | 18.4% |
| $75,000 to $99,999 | 740 | 17.4% |
| $100,000 to $149,999 | 1,054 | 24.8% |
| $150,000 to $199,999 | 264 | 6.2% |
| $200,000+ | 357 | 8.4% |
Family Income by Famaliy Size in Long Beach
5-person families (333 | 7.8%) account for the highest median family income in Long Beach with $119,657 per family, while 2-person families (2,141 | 50.4%) have the highest median income of $35,458 per family member.
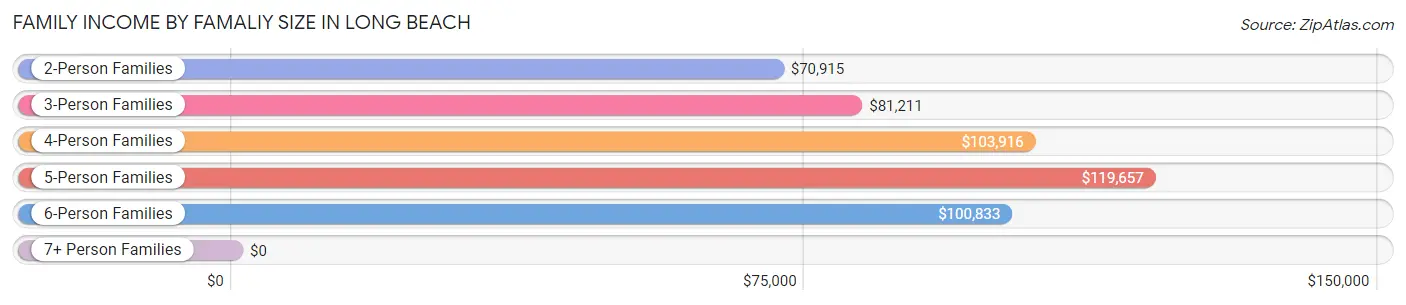
| Income Bracket | # Families | Median Income |
| 2-Person Families | 2,141 (50.4%) | $70,915 |
| 3-Person Families | 1,005 (23.6%) | $81,211 |
| 4-Person Families | 556 (13.1%) | $103,916 |
| 5-Person Families | 333 (7.8%) | $119,657 |
| 6-Person Families | 124 (2.9%) | $100,833 |
| 7+ Person Families | 92 (2.2%) | $0 |
| Total | 4,251 (100.0%) | $84,284 |
Family Income by Number of Earners in Long Beach
The median family income in Long Beach is $84,284, with families comprising 3+ earners (494) having the highest median family income of $152,647, while families with no earners (927) have the lowest median family income of $48,867, accounting for 11.6% and 21.8% of families, respectively.
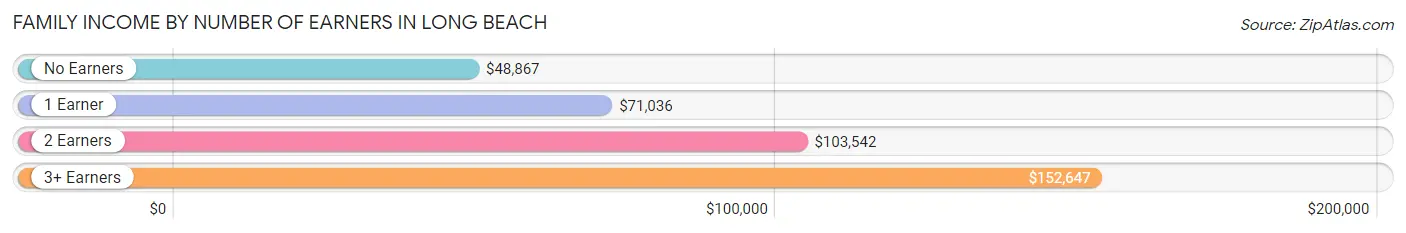
| Number of Earners | # Families | Median Income |
| No Earners | 927 (21.8%) | $48,867 |
| 1 Earner | 1,271 (29.9%) | $71,036 |
| 2 Earners | 1,559 (36.7%) | $103,542 |
| 3+ Earners | 494 (11.6%) | $152,647 |
| Total | 4,251 (100.0%) | $84,284 |
Household Income in Long Beach
Household Income Brackets in Long Beach
With 1,127 households falling in the category, the $35,000 to $49,999 income range is the most frequent in Long Beach, accounting for 16.8% of all households. In contrast, only 221 households (3.3%) fall into the less than $10,000 income bracket, making it the least populous group.
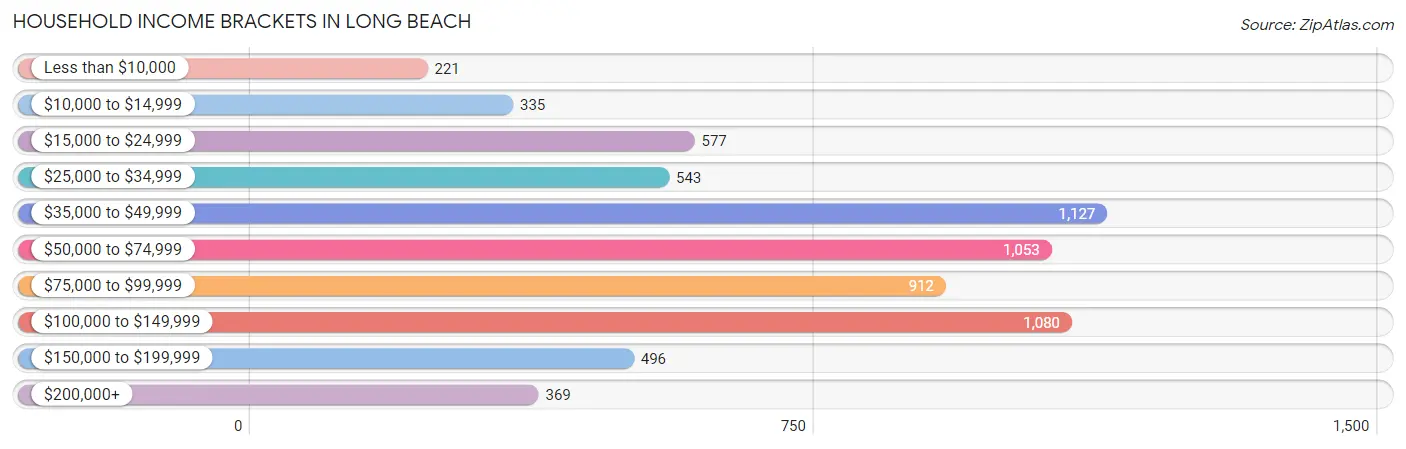
| Income Bracket | # Households | % Households |
| Less than $10,000 | 221 | 3.3% |
| $10,000 to $14,999 | 335 | 5.0% |
| $15,000 to $24,999 | 577 | 8.6% |
| $25,000 to $34,999 | 543 | 8.1% |
| $35,000 to $49,999 | 1,127 | 16.8% |
| $50,000 to $74,999 | 1,053 | 15.7% |
| $75,000 to $99,999 | 912 | 13.6% |
| $100,000 to $149,999 | 1,080 | 16.1% |
| $150,000 to $199,999 | 496 | 7.4% |
| $200,000+ | 369 | 5.5% |
Household Income by Householder Age in Long Beach
The median household income in Long Beach is $66,573, with the highest median household income of $76,990 found in the 25 to 44 years age bracket for the primary householder. A total of 1,738 households (25.9%) fall into this category. Meanwhile, the 15 to 24 years age bracket for the primary householder has the lowest median household income of $33,063, with 249 households (3.7%) in this group.
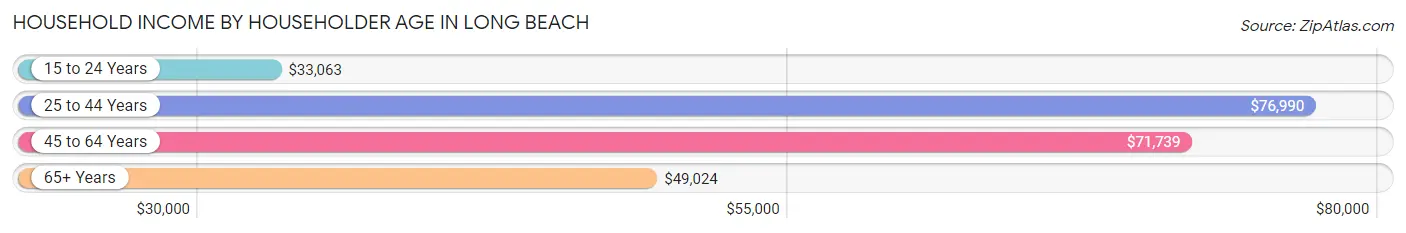
| Income Bracket | # Households | Median Income |
| 15 to 24 Years | 249 (3.7%) | $33,063 |
| 25 to 44 Years | 1,738 (25.9%) | $76,990 |
| 45 to 64 Years | 2,473 (36.9%) | $71,739 |
| 65+ Years | 2,248 (33.5%) | $49,024 |
| Total | 6,708 (100.0%) | $66,573 |
Poverty in Long Beach
Income Below Poverty by Sex and Age in Long Beach
With 11.3% poverty level for males and 7.5% for females among the residents of Long Beach, 15 year old males and 55 to 64 year old females are the most vulnerable to poverty, with 71 males (32.7%) and 205 females (18.0%) in their respective age groups living below the poverty level.
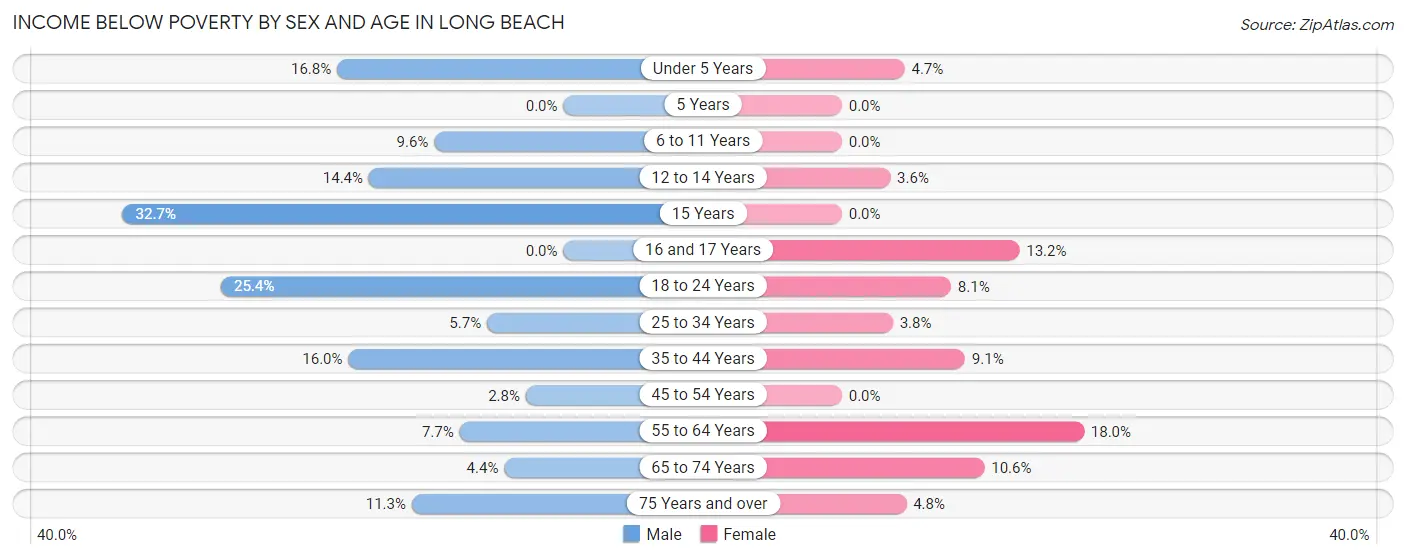
| Age Bracket | Male | Female |
| Under 5 Years | 83 (16.8%) | 18 (4.7%) |
| 5 Years | 0 (0.0%) | 0 (0.0%) |
| 6 to 11 Years | 54 (9.6%) | 0 (0.0%) |
| 12 to 14 Years | 66 (14.4%) | 13 (3.6%) |
| 15 Years | 71 (32.7%) | 0 (0.0%) |
| 16 and 17 Years | 0 (0.0%) | 39 (13.2%) |
| 18 to 24 Years | 218 (25.4%) | 50 (8.1%) |
| 25 to 34 Years | 42 (5.7%) | 34 (3.8%) |
| 35 to 44 Years | 169 (16.0%) | 92 (9.1%) |
| 45 to 54 Years | 19 (2.8%) | 0 (0.0%) |
| 55 to 64 Years | 82 (7.7%) | 205 (18.0%) |
| 65 to 74 Years | 42 (4.4%) | 192 (10.6%) |
| 75 Years and over | 35 (11.3%) | 29 (4.8%) |
| Total | 881 (11.3%) | 672 (7.5%) |
Income Above Poverty by Sex and Age in Long Beach
According to the poverty statistics in Long Beach, males aged 5 years and females aged 5 years are the age groups that are most secure financially, with 100.0% of males and 100.0% of females in these age groups living above the poverty line.
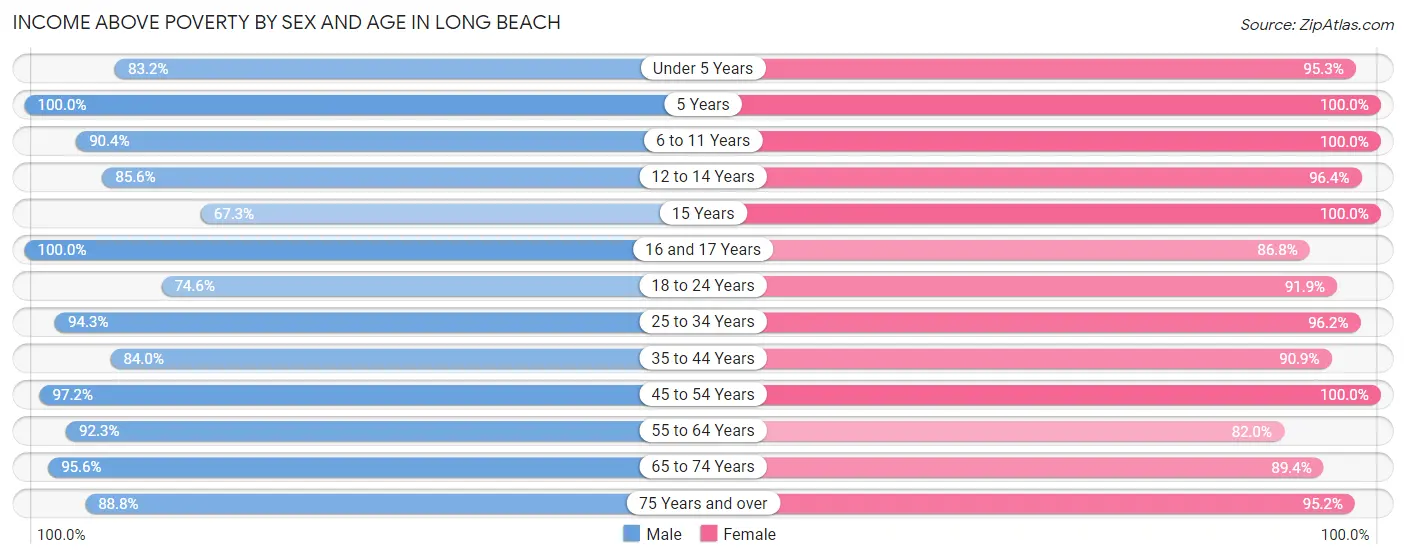
| Age Bracket | Male | Female |
| Under 5 Years | 411 (83.2%) | 368 (95.3%) |
| 5 Years | 119 (100.0%) | 61 (100.0%) |
| 6 to 11 Years | 509 (90.4%) | 598 (100.0%) |
| 12 to 14 Years | 391 (85.6%) | 349 (96.4%) |
| 15 Years | 146 (67.3%) | 134 (100.0%) |
| 16 and 17 Years | 307 (100.0%) | 257 (86.8%) |
| 18 to 24 Years | 640 (74.6%) | 567 (91.9%) |
| 25 to 34 Years | 699 (94.3%) | 866 (96.2%) |
| 35 to 44 Years | 890 (84.0%) | 915 (90.9%) |
| 45 to 54 Years | 663 (97.2%) | 1,054 (100.0%) |
| 55 to 64 Years | 981 (92.3%) | 936 (82.0%) |
| 65 to 74 Years | 914 (95.6%) | 1,623 (89.4%) |
| 75 Years and over | 276 (88.7%) | 578 (95.2%) |
| Total | 6,946 (88.7%) | 8,306 (92.5%) |
Income Below Poverty Among Married-Couple Families in Long Beach
The poverty statistics for married-couple families in Long Beach show that 2.6% or 76 of the total 2,972 families live below the poverty line. Families with no children have the highest poverty rate of 4.2%, comprising of 76 families. On the other hand, families with 1 or 2 children have the lowest poverty rate of 0.0%, which includes 0 families.
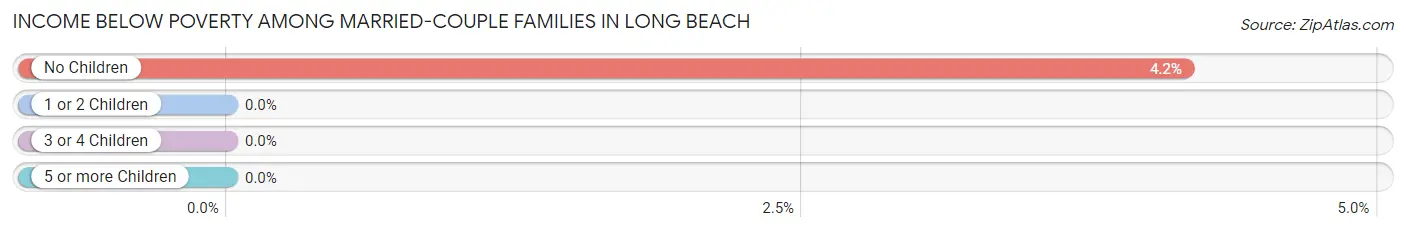
| Children | Above Poverty | Below Poverty |
| No Children | 1,753 (95.8%) | 76 (4.2%) |
| 1 or 2 Children | 875 (100.0%) | 0 (0.0%) |
| 3 or 4 Children | 236 (100.0%) | 0 (0.0%) |
| 5 or more Children | 32 (100.0%) | 0 (0.0%) |
| Total | 2,896 (97.4%) | 76 (2.6%) |
Income Below Poverty Among Single-Parent Households in Long Beach
According to the poverty data in Long Beach, 25.7% or 94 single-father households and 18.0% or 164 single-mother households are living below the poverty line. Among single-father households, those with 1 or 2 children have the highest poverty rate, with 63 households (33.0%) experiencing poverty. Likewise, among single-mother households, those with 3 or 4 children have the highest poverty rate, with 54 households (78.3%) falling below the poverty line.
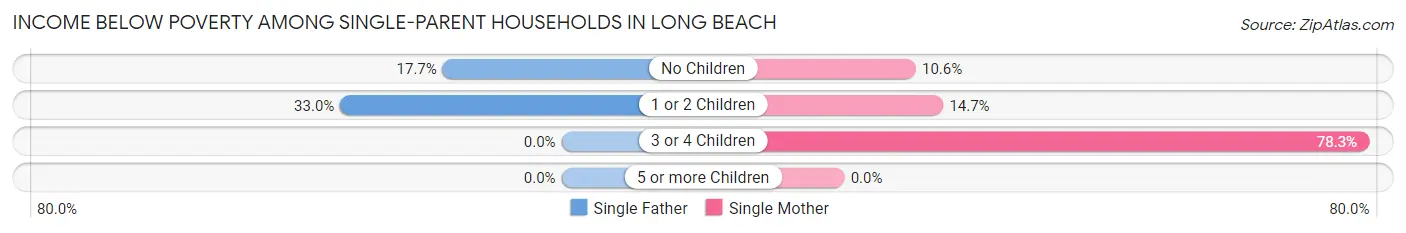
| Children | Single Father | Single Mother |
| No Children | 31 (17.7%) | 37 (10.6%) |
| 1 or 2 Children | 63 (33.0%) | 73 (14.7%) |
| 3 or 4 Children | 0 (0.0%) | 54 (78.3%) |
| 5 or more Children | 0 (0.0%) | 0 (0.0%) |
| Total | 94 (25.7%) | 164 (18.0%) |
Income Below Poverty Among Married-Couple vs Single-Parent Households in Long Beach
The poverty data for Long Beach shows that 76 of the married-couple family households (2.6%) and 258 of the single-parent households (20.2%) are living below the poverty level. Within the married-couple family households, those with no children have the highest poverty rate, with 76 households (4.2%) falling below the poverty line. Among the single-parent households, those with 3 or 4 children have the highest poverty rate, with 54 household (78.3%) living below poverty.
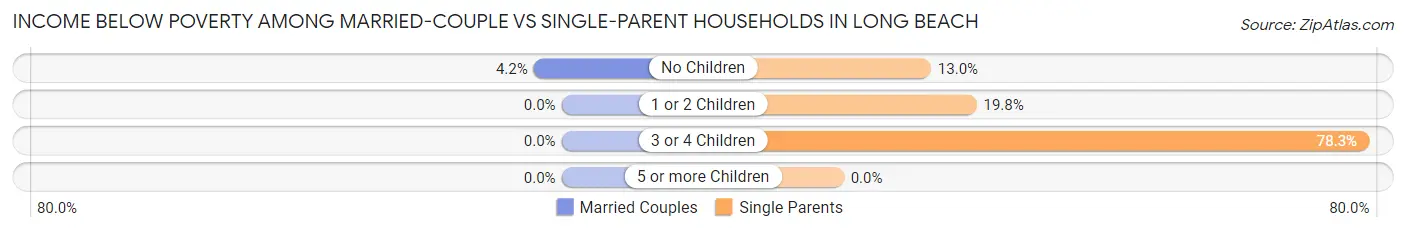
| Children | Married-Couple Families | Single-Parent Households |
| No Children | 76 (4.2%) | 68 (13.0%) |
| 1 or 2 Children | 0 (0.0%) | 136 (19.8%) |
| 3 or 4 Children | 0 (0.0%) | 54 (78.3%) |
| 5 or more Children | 0 (0.0%) | 0 (0.0%) |
| Total | 76 (2.6%) | 258 (20.2%) |
Race in Long Beach
The most populous races in Long Beach are White / Caucasian (14,102 | 83.9%), Black / African American (1,369 | 8.1%), and Two or more Races (918 | 5.5%).
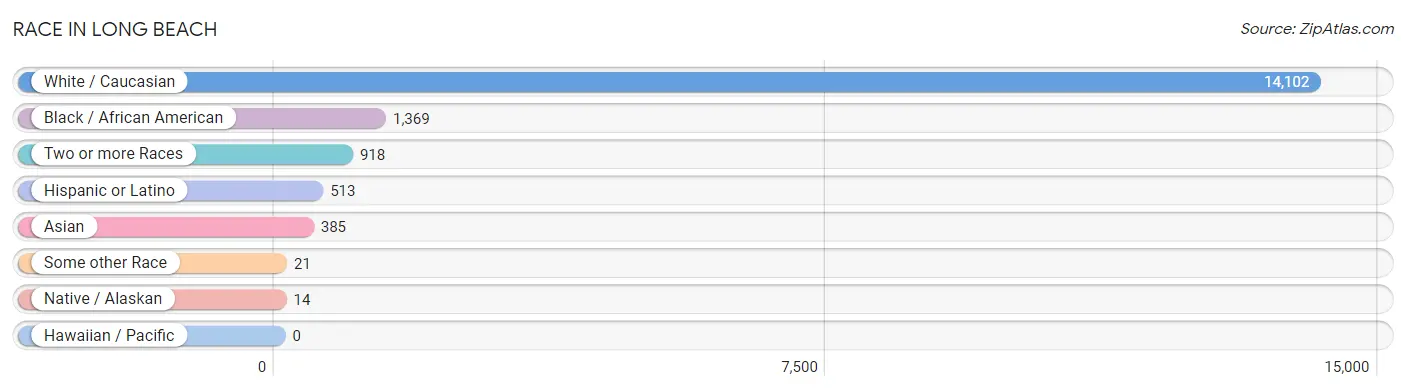
| Race | # Population | % Population |
| Asian | 385 | 2.3% |
| Black / African American | 1,369 | 8.1% |
| Hawaiian / Pacific | 0 | 0.0% |
| Hispanic or Latino | 513 | 3.0% |
| Native / Alaskan | 14 | 0.1% |
| White / Caucasian | 14,102 | 83.9% |
| Two or more Races | 918 | 5.5% |
| Some other Race | 21 | 0.1% |
| Total | 16,809 | 100.0% |
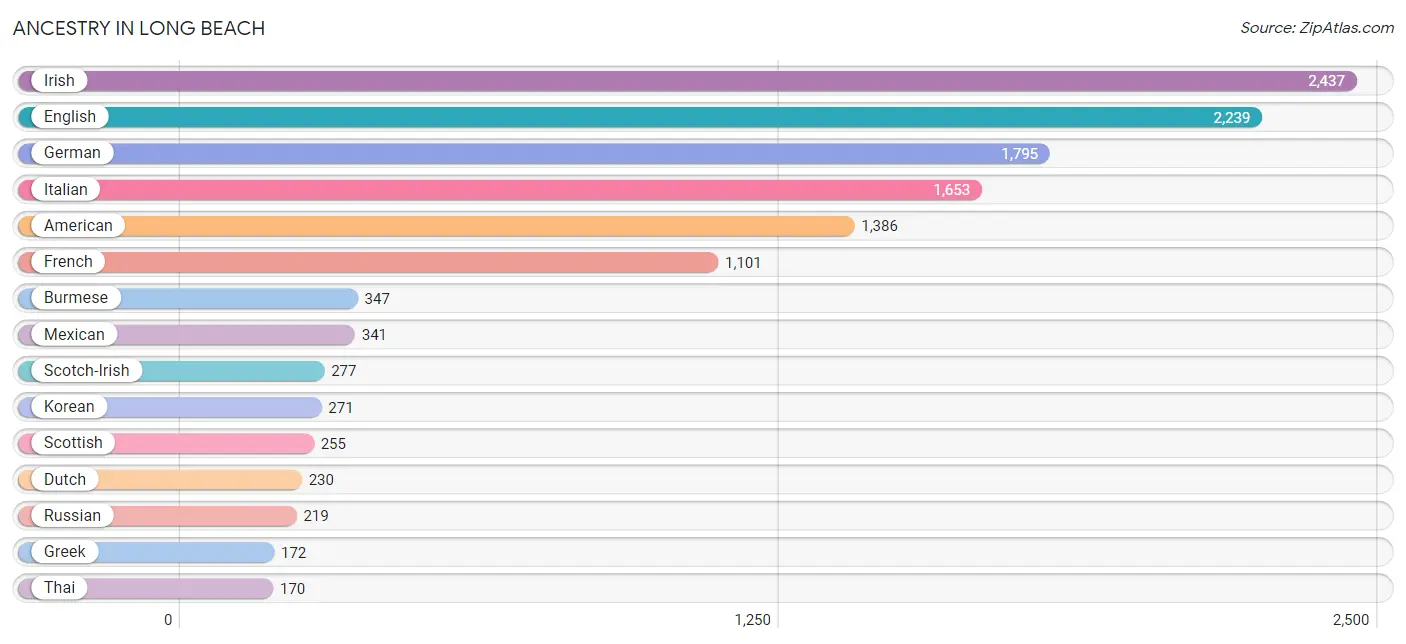
Ancestry in Long Beach
The most populous ancestries reported in Long Beach are Irish (2,437 | 14.5%), English (2,239 | 13.3%), German (1,795 | 10.7%), Italian (1,653 | 9.8%), and American (1,386 | 8.3%), together accounting for 56.6% of all Long Beach residents.
| Ancestry | # Population | % Population |
| African | 33 | 0.2% |
| American | 1,386 | 8.3% |
| Bhutanese | 1 | 0.0% |
| British | 111 | 0.7% |
| Burmese | 347 | 2.1% |
| Cajun | 7 | 0.0% |
| Canadian | 131 | 0.8% |
| Central American | 43 | 0.3% |
| Cherokee | 24 | 0.1% |
| Choctaw | 7 | 0.0% |
| Creek | 13 | 0.1% |
| Czech | 63 | 0.4% |
| Danish | 2 | 0.0% |
| Dutch | 230 | 1.4% |
| English | 2,239 | 13.3% |
| European | 159 | 0.9% |
| Finnish | 24 | 0.1% |
| French | 1,101 | 6.6% |
| French Canadian | 125 | 0.7% |
| German | 1,795 | 10.7% |
| Greek | 172 | 1.0% |
| Honduran | 11 | 0.1% |
| Indian (Asian) | 58 | 0.4% |
| Irish | 2,437 | 14.5% |
| Italian | 1,653 | 9.8% |
| Korean | 271 | 1.6% |
| Lithuanian | 12 | 0.1% |
| Maltese | 4 | 0.0% |
| Mexican | 341 | 2.0% |
| Nigerian | 55 | 0.3% |
| Northern European | 16 | 0.1% |
| Norwegian | 19 | 0.1% |
| Pakistani | 32 | 0.2% |
| Panamanian | 32 | 0.2% |
| Polish | 128 | 0.8% |
| Portuguese | 35 | 0.2% |
| Puerto Rican | 105 | 0.6% |
| Russian | 219 | 1.3% |
| Scandinavian | 99 | 0.6% |
| Scotch-Irish | 277 | 1.7% |
| Scottish | 255 | 1.5% |
| Spaniard | 19 | 0.1% |
| Spanish | 5 | 0.0% |
| Sri Lankan | 59 | 0.4% |
| Subsaharan African | 93 | 0.5% |
| Swedish | 136 | 0.8% |
| Swiss | 17 | 0.1% |
| Thai | 170 | 1.0% |
| Welsh | 115 | 0.7% |
| West Indian | 21 | 0.1% |
| Yugoslavian | 8 | 0.1% | View All 51 Rows |
Immigrants in Long Beach
The most numerous immigrant groups reported in Long Beach came from Asia (353 | 2.1%), Europe (291 | 1.7%), South Eastern Asia (276 | 1.6%), Philippines (201 | 1.2%), and Latin America (162 | 1.0%), together accounting for 7.6% of all Long Beach residents.
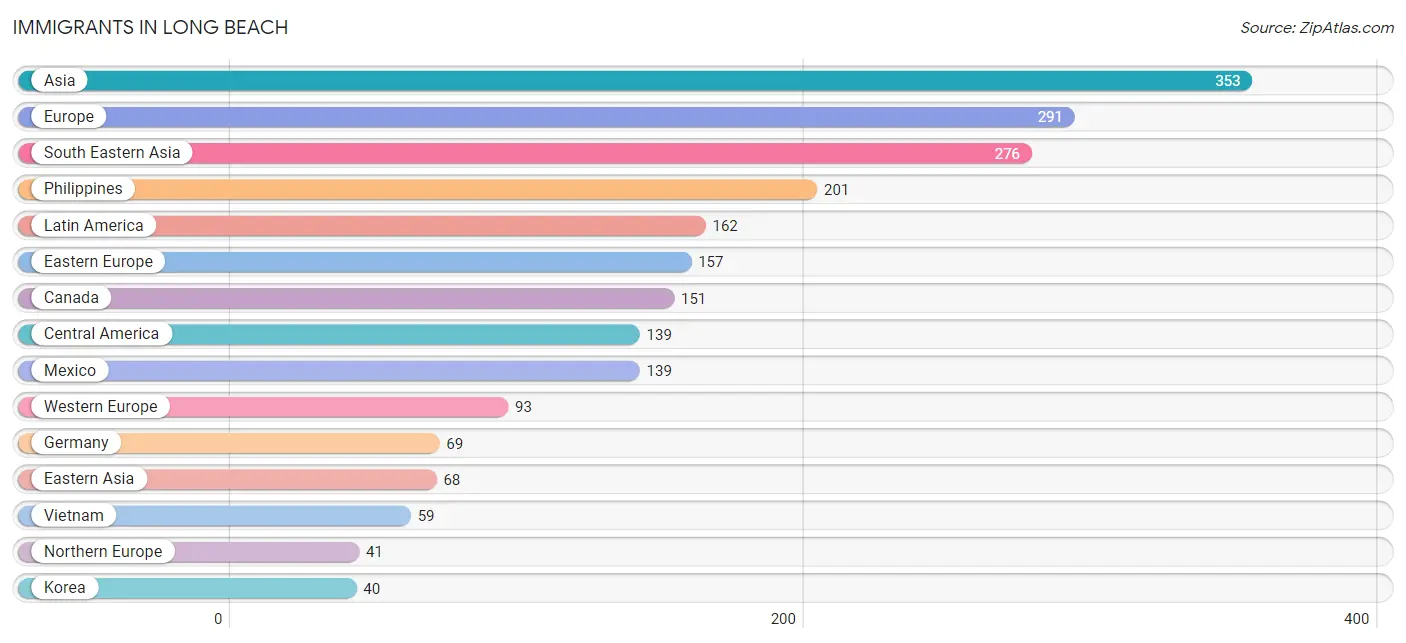
| Immigration Origin | # Population | % Population |
| Africa | 8 | 0.1% |
| Asia | 353 | 2.1% |
| Canada | 151 | 0.9% |
| Caribbean | 23 | 0.1% |
| Central America | 139 | 0.8% |
| China | 27 | 0.2% |
| Cuba | 2 | 0.0% |
| Eastern Asia | 68 | 0.4% |
| Eastern Europe | 157 | 0.9% |
| Egypt | 8 | 0.1% |
| Europe | 291 | 1.7% |
| Germany | 69 | 0.4% |
| Grenada | 21 | 0.1% |
| India | 9 | 0.1% |
| Japan | 1 | 0.0% |
| Korea | 40 | 0.2% |
| Latin America | 162 | 1.0% |
| Mexico | 139 | 0.8% |
| Netherlands | 24 | 0.1% |
| Northern Africa | 8 | 0.1% |
| Northern Europe | 41 | 0.2% |
| Philippines | 201 | 1.2% |
| Scotland | 16 | 0.1% |
| South Central Asia | 9 | 0.1% |
| South Eastern Asia | 276 | 1.6% |
| Thailand | 16 | 0.1% |
| Vietnam | 59 | 0.4% |
| Western Europe | 93 | 0.5% | View All 28 Rows |
Sex and Age in Long Beach
Sex and Age in Long Beach
The most populous age groups in Long Beach are 15 to 19 Years (763 | 9.7%) for men and 65 to 69 Years (1,151 | 12.8%) for women.
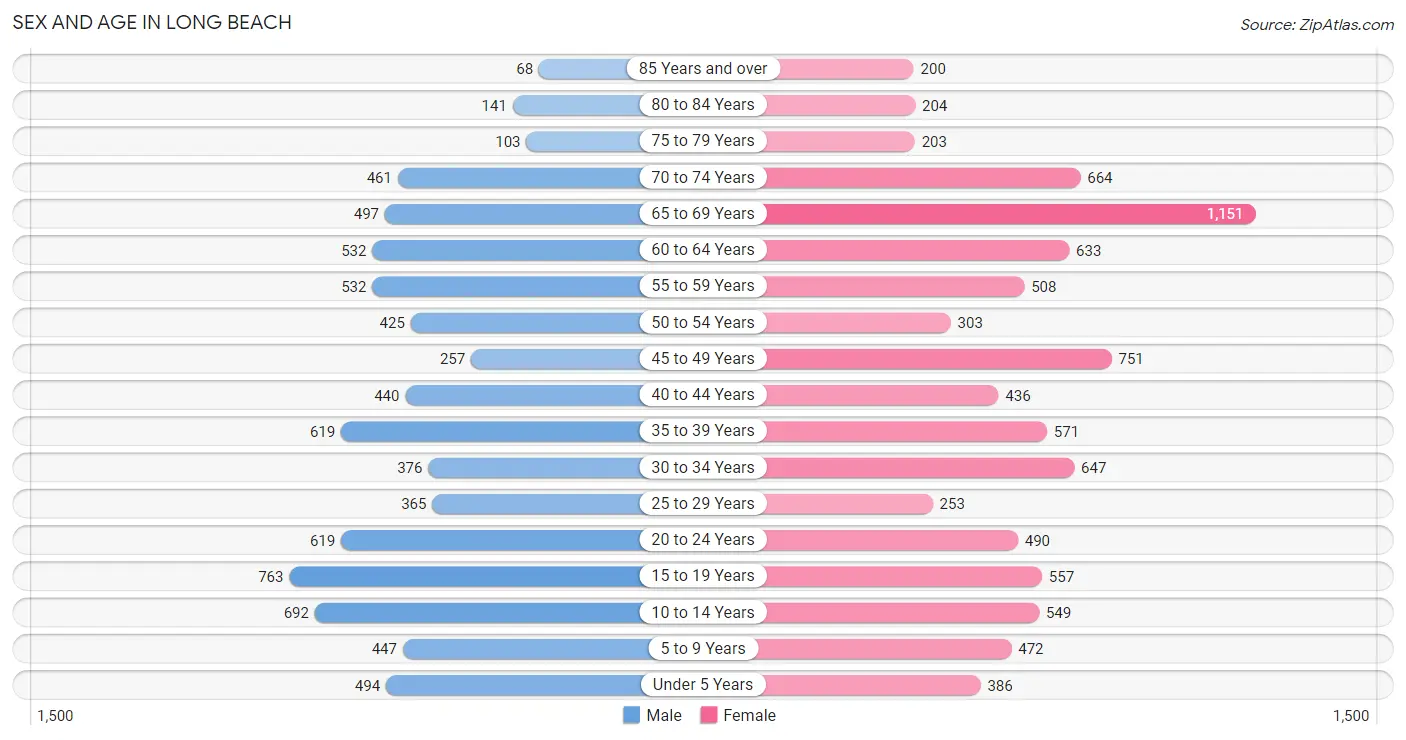
| Age Bracket | Male | Female |
| Under 5 Years | 494 (6.3%) | 386 (4.3%) |
| 5 to 9 Years | 447 (5.7%) | 472 (5.3%) |
| 10 to 14 Years | 692 (8.8%) | 549 (6.1%) |
| 15 to 19 Years | 763 (9.7%) | 557 (6.2%) |
| 20 to 24 Years | 619 (7.9%) | 490 (5.5%) |
| 25 to 29 Years | 365 (4.7%) | 253 (2.8%) |
| 30 to 34 Years | 376 (4.8%) | 647 (7.2%) |
| 35 to 39 Years | 619 (7.9%) | 571 (6.4%) |
| 40 to 44 Years | 440 (5.6%) | 436 (4.9%) |
| 45 to 49 Years | 257 (3.3%) | 751 (8.4%) |
| 50 to 54 Years | 425 (5.4%) | 303 (3.4%) |
| 55 to 59 Years | 532 (6.8%) | 508 (5.7%) |
| 60 to 64 Years | 532 (6.8%) | 633 (7.0%) |
| 65 to 69 Years | 497 (6.4%) | 1,151 (12.8%) |
| 70 to 74 Years | 461 (5.9%) | 664 (7.4%) |
| 75 to 79 Years | 103 (1.3%) | 203 (2.3%) |
| 80 to 84 Years | 141 (1.8%) | 204 (2.3%) |
| 85 Years and over | 68 (0.9%) | 200 (2.2%) |
| Total | 7,831 (100.0%) | 8,978 (100.0%) |
Families and Households in Long Beach
Median Family Size in Long Beach
The median family size in Long Beach is 3.19 persons per family, with single female/mother families (913 | 21.5%) accounting for the largest median family size of 3.45 persons per family. On the other hand, single male/father families (366 | 8.6%) represent the smallest median family size with 2.58 persons per family.
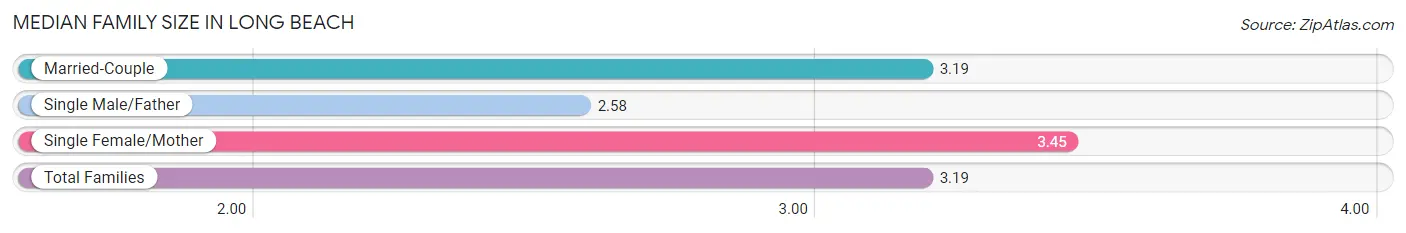
| Family Type | # Families | Family Size |
| Married-Couple | 2,972 (69.9%) | 3.19 |
| Single Male/Father | 366 (8.6%) | 2.58 |
| Single Female/Mother | 913 (21.5%) | 3.45 |
| Total Families | 4,251 (100.0%) | 3.19 |
Median Household Size in Long Beach
The median household size in Long Beach is 2.50 persons per household, with single female/mother households (913 | 13.6%) accounting for the largest median household size of 3.53 persons per household. non-family households (2,457 | 36.6%) represent the smallest median household size with 1.24 persons per household.
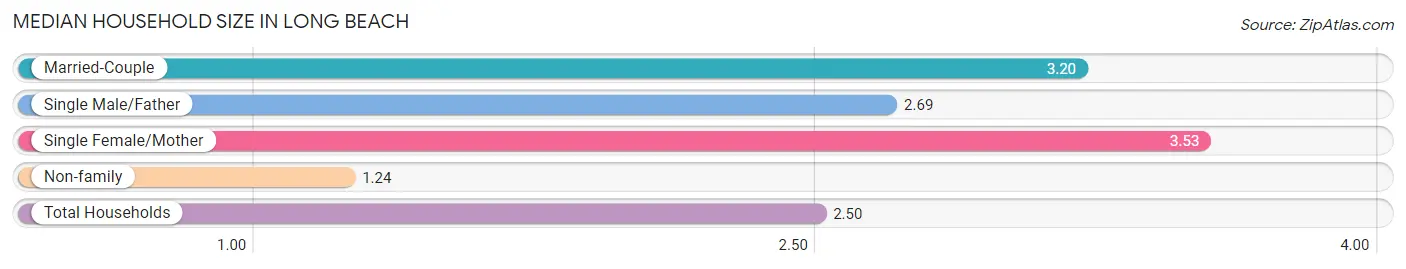
| Household Type | # Households | Household Size |
| Married-Couple | 2,972 (44.3%) | 3.20 |
| Single Male/Father | 366 (5.5%) | 2.69 |
| Single Female/Mother | 913 (13.6%) | 3.53 |
| Non-family | 2,457 (36.6%) | 1.24 |
| Total Households | 6,708 (100.0%) | 2.50 |
Household Size by Marriage Status in Long Beach
Out of a total of 6,708 households in Long Beach, 4,251 (63.4%) are family households, while 2,457 (36.6%) are nonfamily households. The most numerous type of family households are 2-person households, comprising 2,112, and the most common type of nonfamily households are 1-person households, comprising 1,943.
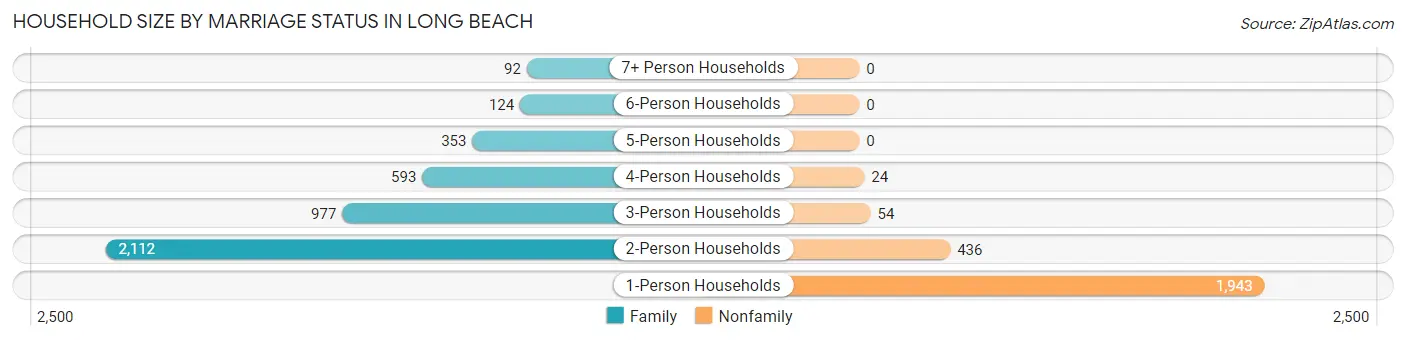
| Household Size | Family Households | Nonfamily Households |
| 1-Person Households | - | 1,943 (29.0%) |
| 2-Person Households | 2,112 (31.5%) | 436 (6.5%) |
| 3-Person Households | 977 (14.6%) | 54 (0.8%) |
| 4-Person Households | 593 (8.8%) | 24 (0.4%) |
| 5-Person Households | 353 (5.3%) | 0 (0.0%) |
| 6-Person Households | 124 (1.8%) | 0 (0.0%) |
| 7+ Person Households | 92 (1.4%) | 0 (0.0%) |
| Total | 4,251 (63.4%) | 2,457 (36.6%) |
Female Fertility in Long Beach
Fertility by Age in Long Beach
Average fertility rate in Long Beach is 47.0 births per 1,000 women. Women in the age bracket of 20 to 34 years have the highest fertility rate with 61.0 births per 1,000 women. Women in the age bracket of 35 to 50 years acount for 51.1% of all women with births.
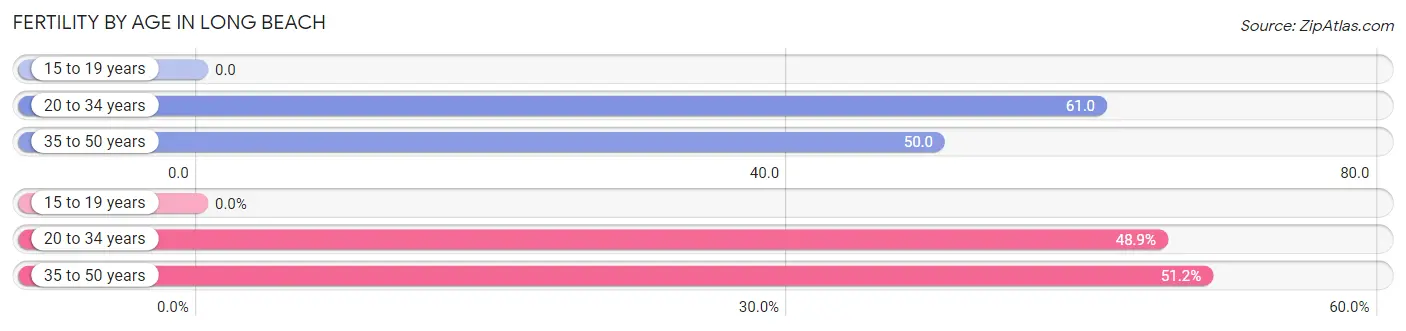
| Age Bracket | Women with Births | Births / 1,000 Women |
| 15 to 19 years | 0 (0.0%) | 0.0 |
| 20 to 34 years | 85 (48.8%) | 61.0 |
| 35 to 50 years | 89 (51.1%) | 50.0 |
| Total | 174 (100.0%) | 47.0 |
Fertility by Age by Marriage Status in Long Beach
96.0% of women with births (174) in Long Beach are married. The highest percentage of unmarried women with births falls into 20 to 34 years age bracket with 8.2% of them unmarried at the time of birth, while the lowest percentage of unmarried women with births belong to 35 to 50 years age bracket with 0.0% of them unmarried.
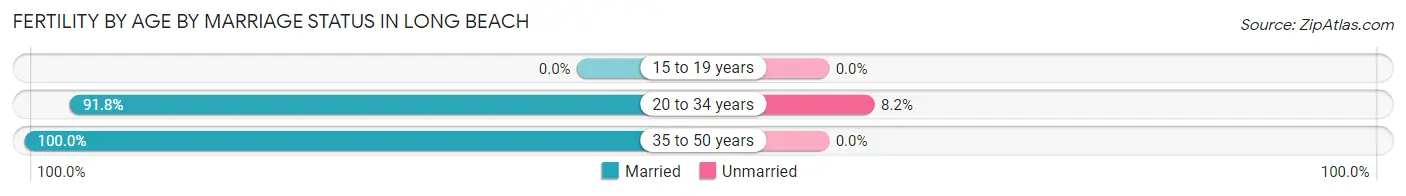
| Age Bracket | Married | Unmarried |
| 15 to 19 years | 0 (0.0%) | 0 (0.0%) |
| 20 to 34 years | 78 (91.8%) | 7 (8.2%) |
| 35 to 50 years | 89 (100.0%) | 0 (0.0%) |
| Total | 167 (96.0%) | 7 (4.0%) |
Fertility by Education in Long Beach
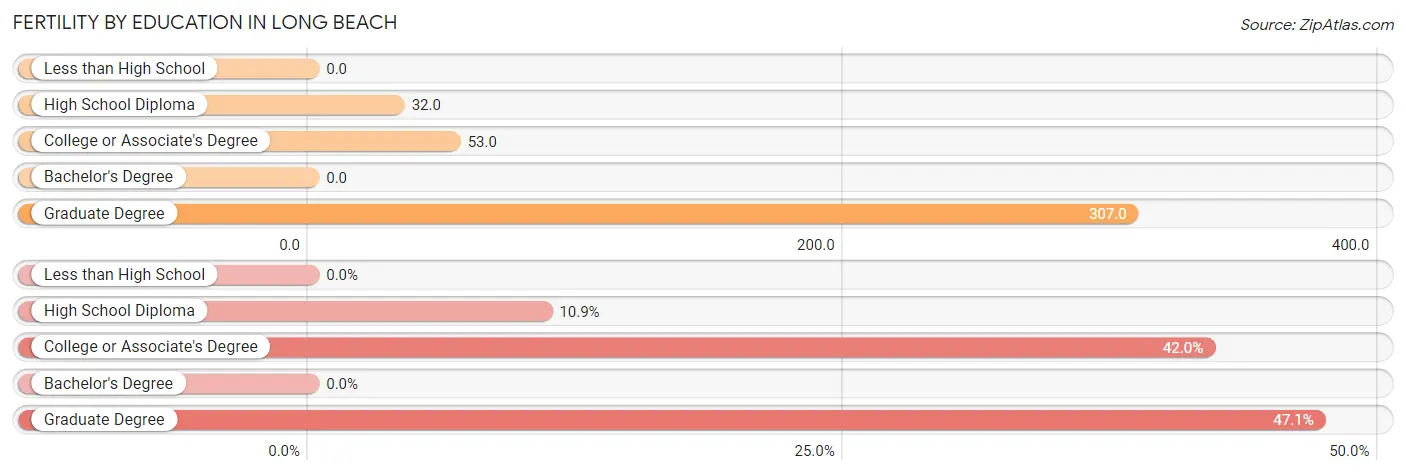
| Educational Attainment | Women with Births | Births / 1,000 Women |
| Less than High School | 0 (0.0%) | 0.0 |
| High School Diploma | 19 (10.9%) | 32.0 |
| College or Associate's Degree | 73 (41.9%) | 53.0 |
| Bachelor's Degree | 0 (0.0%) | 0.0 |
| Graduate Degree | 82 (47.1%) | 307.0 |
| Total | 174 (100.0%) | 47.0 |
Fertility by Education by Marriage Status in Long Beach
4.0% of women with births in Long Beach are unmarried. Women with the educational attainment of college or associate's degree are most likely to be married with 100.0% of them married at childbirth, while women with the educational attainment of high school diploma are least likely to be married with 36.8% of them unmarried at childbirth.
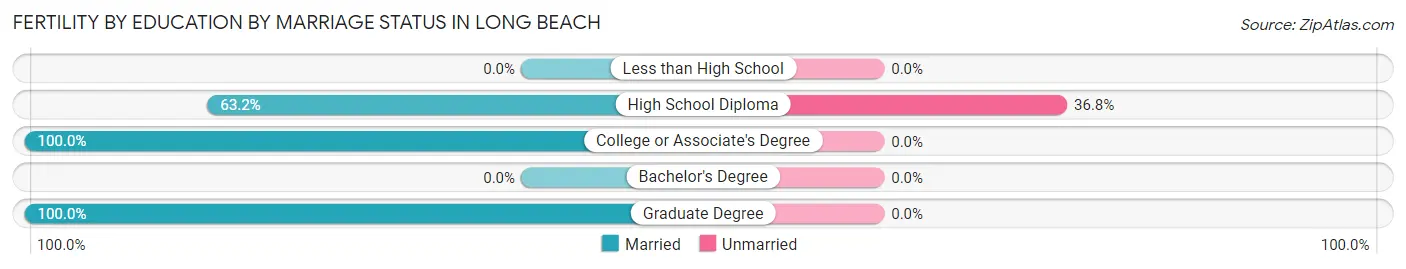
| Educational Attainment | Married | Unmarried |
| Less than High School | 0 (0.0%) | 0 (0.0%) |
| High School Diploma | 12 (63.2%) | 7 (36.8%) |
| College or Associate's Degree | 73 (100.0%) | 0 (0.0%) |
| Bachelor's Degree | 0 (0.0%) | 0 (0.0%) |
| Graduate Degree | 82 (100.0%) | 0 (0.0%) |
| Total | 167 (96.0%) | 7 (4.0%) |
Employment Characteristics in Long Beach
Employment by Class of Employer in Long Beach
Among the 7,554 employed individuals in Long Beach, private company employees (4,495 | 59.5%), not-for-profit organizations (737 | 9.8%), and local government employees (690 | 9.1%) make up the most common classes of employment.
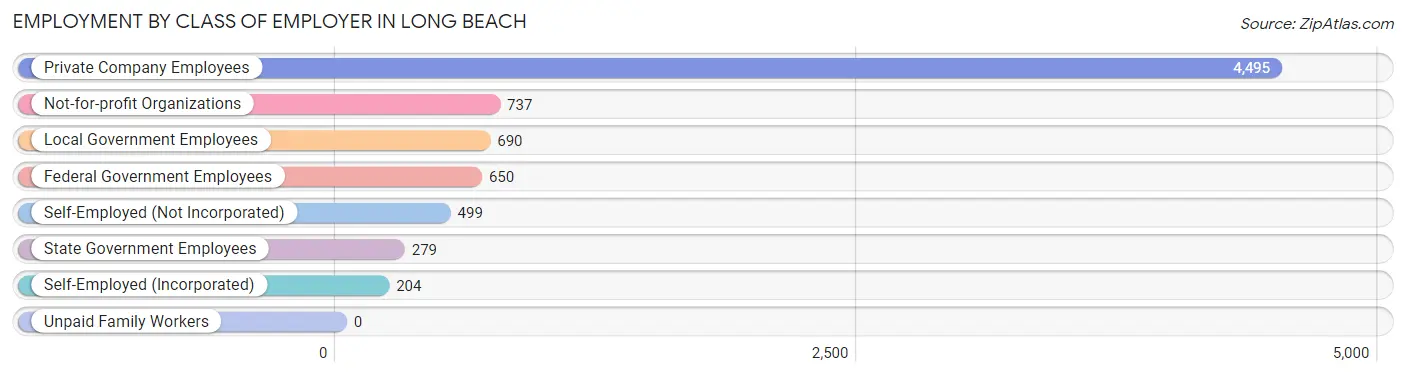
| Employer Class | # Employees | % Employees |
| Private Company Employees | 4,495 | 59.5% |
| Self-Employed (Incorporated) | 204 | 2.7% |
| Self-Employed (Not Incorporated) | 499 | 6.6% |
| Not-for-profit Organizations | 737 | 9.8% |
| Local Government Employees | 690 | 9.1% |
| State Government Employees | 279 | 3.7% |
| Federal Government Employees | 650 | 8.6% |
| Unpaid Family Workers | 0 | 0.0% |
| Total | 7,554 | 100.0% |
Employment Status by Age in Long Beach
According to the labor force statistics for Long Beach, out of the total population over 16 years of age (13,418), 60.4% or 8,104 individuals are in the labor force, with 5.8% or 470 of them unemployed. The age group with the highest labor force participation rate is 25 to 29 years, with 91.3% or 564 individuals in the labor force. Within the labor force, the 25 to 29 years age range has the highest percentage of unemployed individuals, with 16.7% or 94 of them being unemployed.
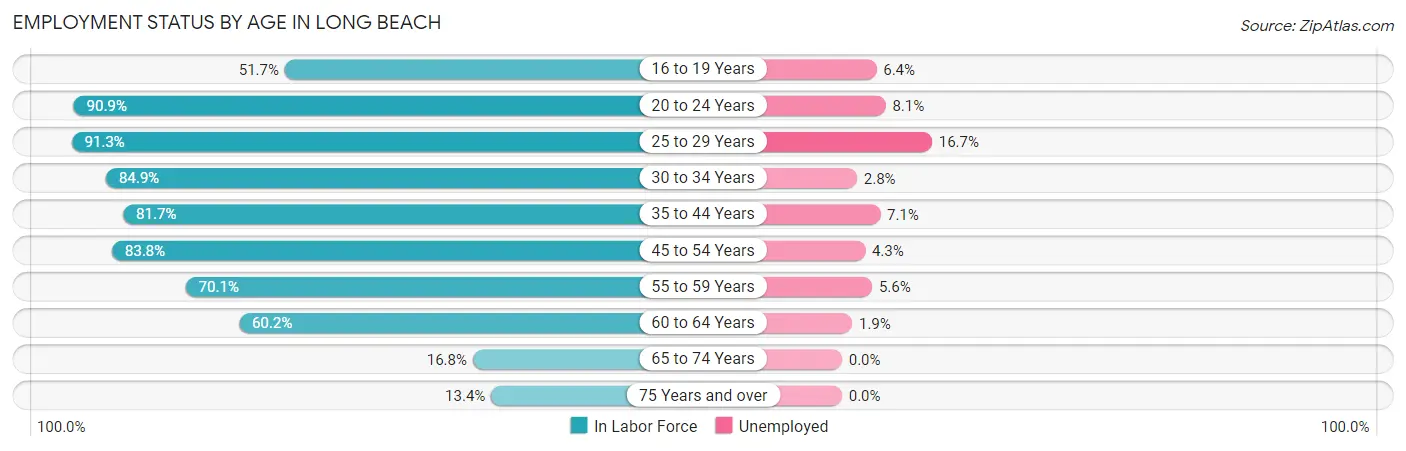
| Age Bracket | In Labor Force | Unemployed |
| 16 to 19 Years | 501 (51.7%) | 32 (6.4%) |
| 20 to 24 Years | 1,008 (90.9%) | 82 (8.1%) |
| 25 to 29 Years | 564 (91.3%) | 94 (16.7%) |
| 30 to 34 Years | 869 (84.9%) | 24 (2.8%) |
| 35 to 44 Years | 1,688 (81.7%) | 120 (7.1%) |
| 45 to 54 Years | 1,455 (83.8%) | 63 (4.3%) |
| 55 to 59 Years | 729 (70.1%) | 41 (5.6%) |
| 60 to 64 Years | 701 (60.2%) | 13 (1.9%) |
| 65 to 74 Years | 466 (16.8%) | 0 (0.0%) |
| 75 Years and over | 123 (13.4%) | 0 (0.0%) |
| Total | 8,104 (60.4%) | 470 (5.8%) |
Employment Status by Educational Attainment in Long Beach
According to labor force statistics for Long Beach, 78.5% of individuals (6,004) out of the total population between 25 and 64 years of age (7,648) are in the labor force, with 5.9% or 354 of them being unemployed. The group with the highest labor force participation rate are those with the educational attainment of bachelor's degree or higher, with 97.0% or 2,267 individuals in the labor force. Within the labor force, individuals with less than high school education have the highest percentage of unemployment, with 15.9% or 38 of them being unemployed.
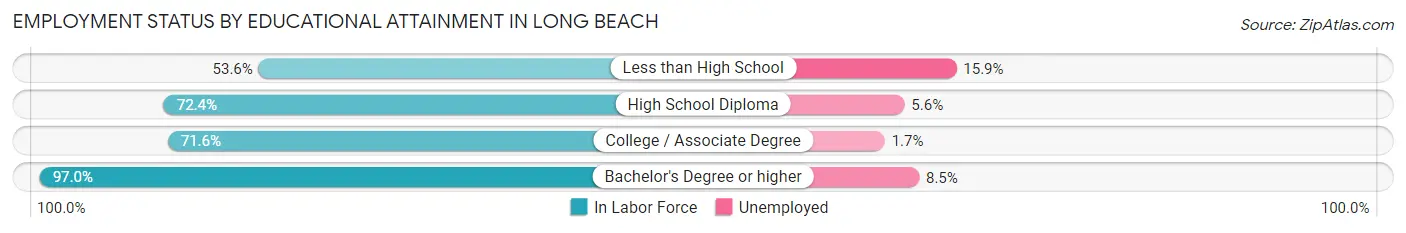
| Educational Attainment | In Labor Force | Unemployed |
| Less than High School | 239 (53.6%) | 71 (15.9%) |
| High School Diploma | 1,591 (72.4%) | 123 (5.6%) |
| College / Associate Degree | 1,910 (71.6%) | 45 (1.7%) |
| Bachelor's Degree or higher | 2,267 (97.0%) | 199 (8.5%) |
| Total | 6,004 (78.5%) | 451 (5.9%) |
Employment Occupations by Sex in Long Beach
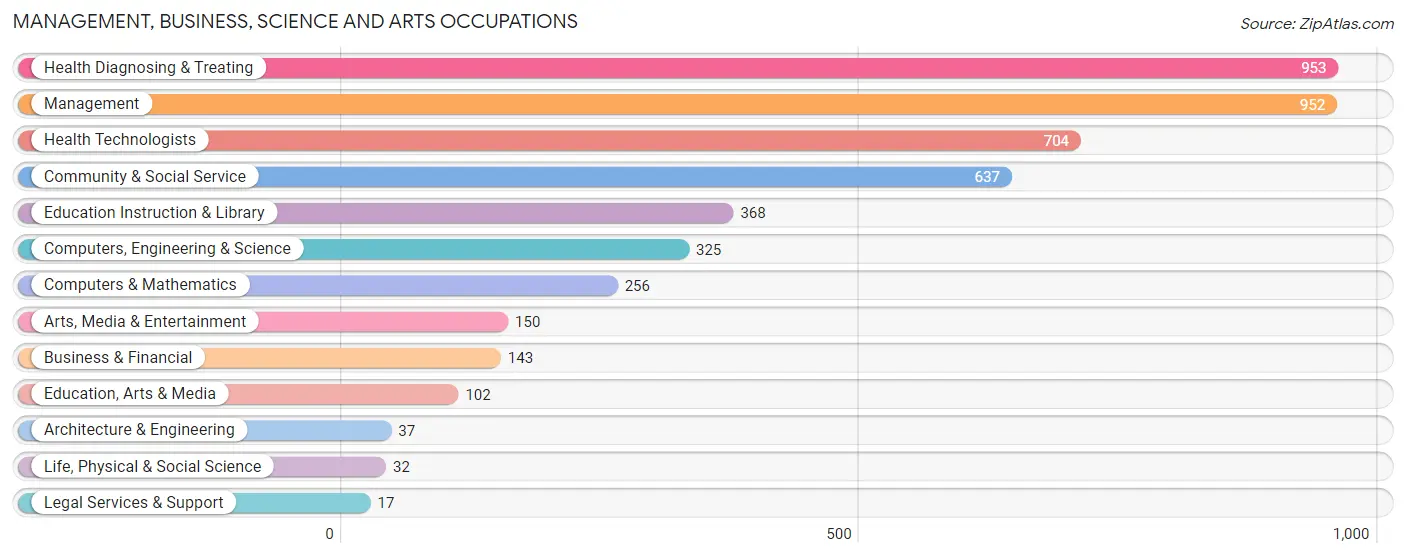
Management, Business, Science and Arts Occupations
The most common Management, Business, Science and Arts occupations in Long Beach are Health Diagnosing & Treating (953 | 12.8%), Management (952 | 12.8%), Health Technologists (704 | 9.5%), Community & Social Service (637 | 8.6%), and Education Instruction & Library (368 | 4.9%).
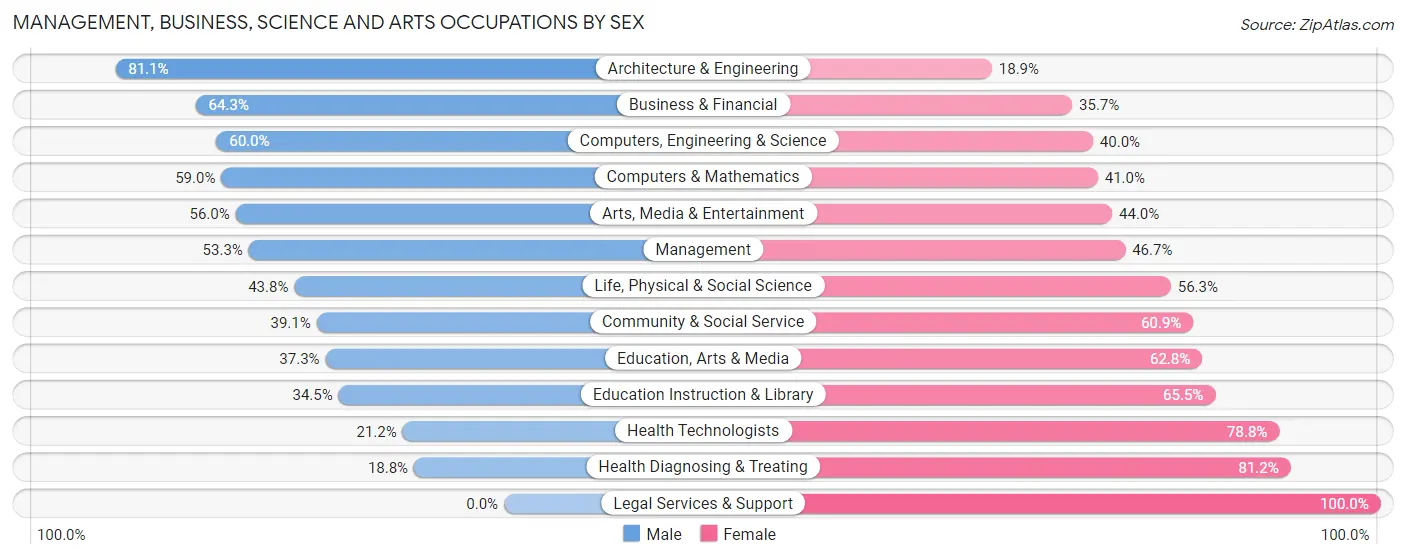
Management, Business, Science and Arts Occupations by Sex
Within the Management, Business, Science and Arts occupations in Long Beach, the most male-oriented occupations are Architecture & Engineering (81.1%), Business & Financial (64.3%), and Computers, Engineering & Science (60.0%), while the most female-oriented occupations are Legal Services & Support (100.0%), Health Diagnosing & Treating (81.2%), and Health Technologists (78.8%).
| Occupation | Male | Female |
| Management | 507 (53.3%) | 445 (46.7%) |
| Business & Financial | 92 (64.3%) | 51 (35.7%) |
| Computers, Engineering & Science | 195 (60.0%) | 130 (40.0%) |
| Computers & Mathematics | 151 (59.0%) | 105 (41.0%) |
| Architecture & Engineering | 30 (81.1%) | 7 (18.9%) |
| Life, Physical & Social Science | 14 (43.8%) | 18 (56.2%) |
| Community & Social Service | 249 (39.1%) | 388 (60.9%) |
| Education, Arts & Media | 38 (37.2%) | 64 (62.7%) |
| Legal Services & Support | 0 (0.0%) | 17 (100.0%) |
| Education Instruction & Library | 127 (34.5%) | 241 (65.5%) |
| Arts, Media & Entertainment | 84 (56.0%) | 66 (44.0%) |
| Health Diagnosing & Treating | 179 (18.8%) | 774 (81.2%) |
| Health Technologists | 149 (21.2%) | 555 (78.8%) |
| Total (Category) | 1,222 (40.6%) | 1,788 (59.4%) |
| Total (Overall) | 3,671 (49.3%) | 3,774 (50.7%) |
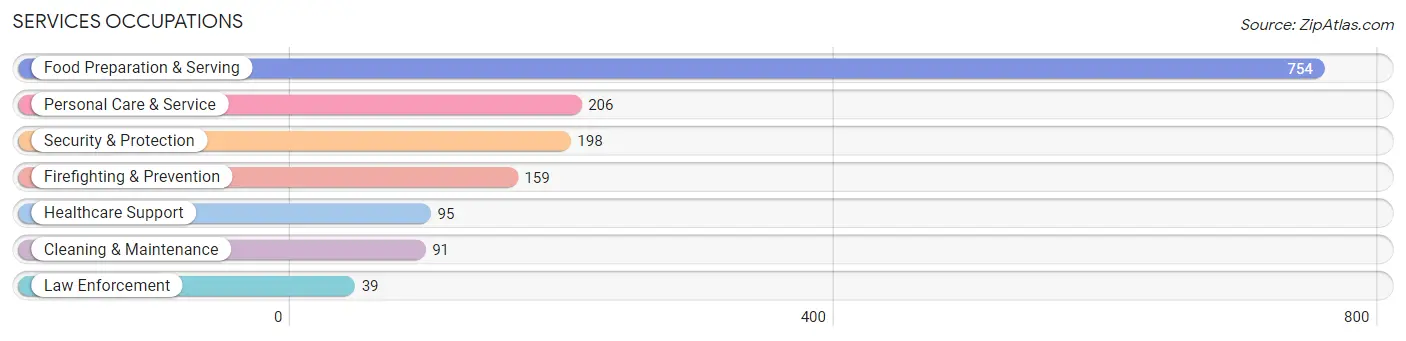
Services Occupations
The most common Services occupations in Long Beach are Food Preparation & Serving (754 | 10.1%), Personal Care & Service (206 | 2.8%), Security & Protection (198 | 2.7%), Firefighting & Prevention (159 | 2.1%), and Healthcare Support (95 | 1.3%).
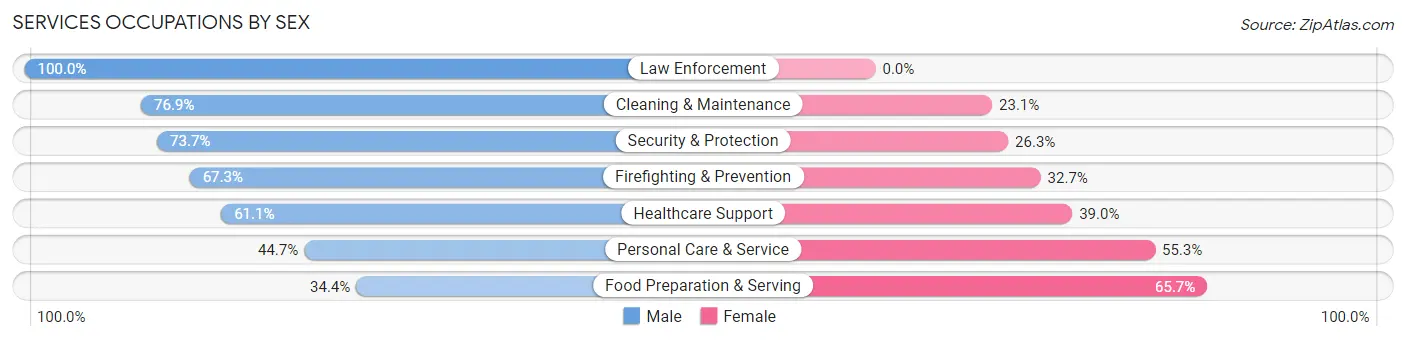
Services Occupations by Sex
Within the Services occupations in Long Beach, the most male-oriented occupations are Law Enforcement (100.0%), Cleaning & Maintenance (76.9%), and Security & Protection (73.7%), while the most female-oriented occupations are Food Preparation & Serving (65.6%), Personal Care & Service (55.3%), and Healthcare Support (39.0%).
| Occupation | Male | Female |
| Healthcare Support | 58 (61.1%) | 37 (39.0%) |
| Security & Protection | 146 (73.7%) | 52 (26.3%) |
| Firefighting & Prevention | 107 (67.3%) | 52 (32.7%) |
| Law Enforcement | 39 (100.0%) | 0 (0.0%) |
| Food Preparation & Serving | 259 (34.4%) | 495 (65.6%) |
| Cleaning & Maintenance | 70 (76.9%) | 21 (23.1%) |
| Personal Care & Service | 92 (44.7%) | 114 (55.3%) |
| Total (Category) | 625 (46.5%) | 719 (53.5%) |
| Total (Overall) | 3,671 (49.3%) | 3,774 (50.7%) |
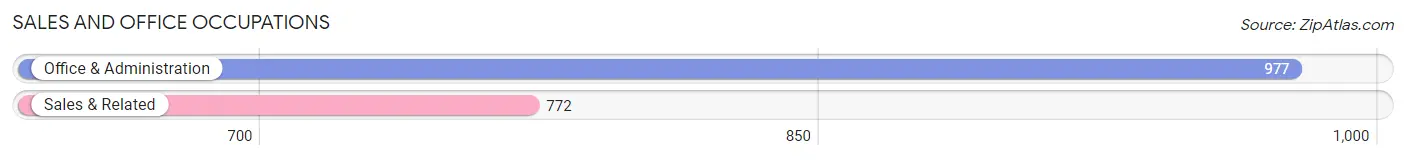
Sales and Office Occupations
The most common Sales and Office occupations in Long Beach are Office & Administration (977 | 13.1%), and Sales & Related (772 | 10.4%).
Sales and Office Occupations by Sex
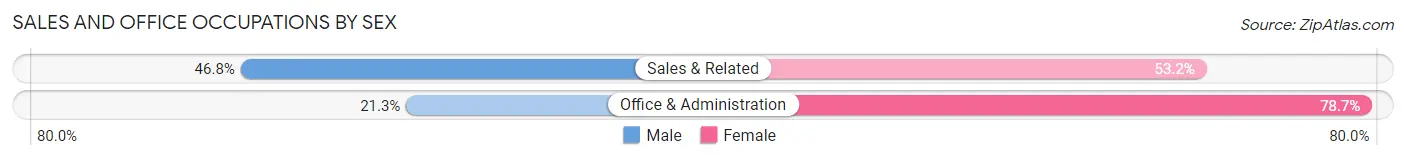
| Occupation | Male | Female |
| Sales & Related | 361 (46.8%) | 411 (53.2%) |
| Office & Administration | 208 (21.3%) | 769 (78.7%) |
| Total (Category) | 569 (32.5%) | 1,180 (67.5%) |
| Total (Overall) | 3,671 (49.3%) | 3,774 (50.7%) |
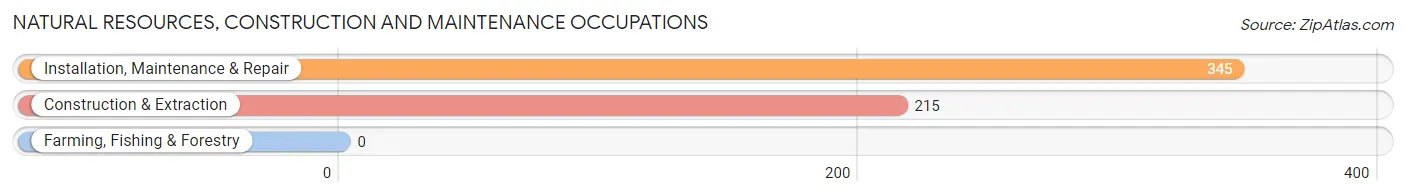
Natural Resources, Construction and Maintenance Occupations
The most common Natural Resources, Construction and Maintenance occupations in Long Beach are Installation, Maintenance & Repair (345 | 4.6%), and Construction & Extraction (215 | 2.9%).
Natural Resources, Construction and Maintenance Occupations by Sex
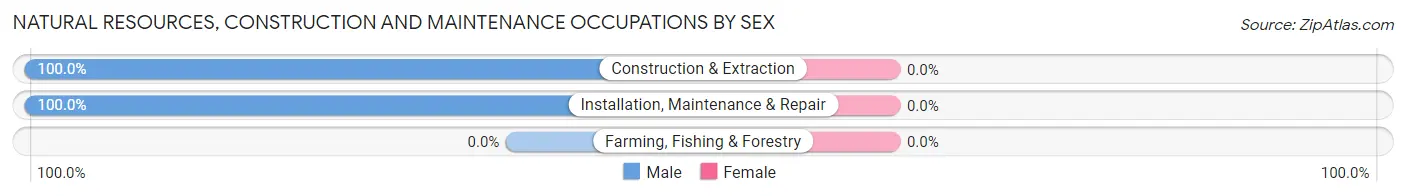
| Occupation | Male | Female |
| Farming, Fishing & Forestry | 0 (0.0%) | 0 (0.0%) |
| Construction & Extraction | 215 (100.0%) | 0 (0.0%) |
| Installation, Maintenance & Repair | 345 (100.0%) | 0 (0.0%) |
| Total (Category) | 560 (100.0%) | 0 (0.0%) |
| Total (Overall) | 3,671 (49.3%) | 3,774 (50.7%) |
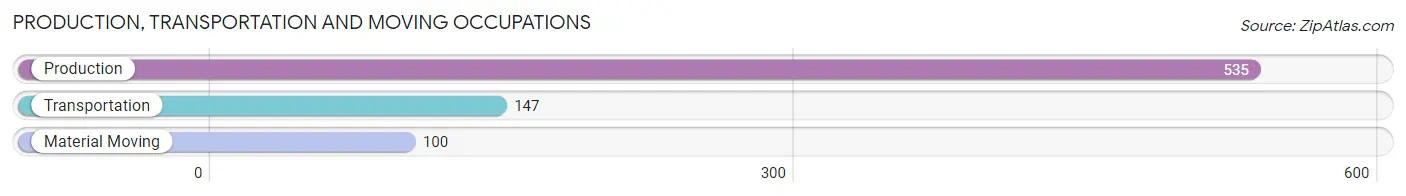
Production, Transportation and Moving Occupations
The most common Production, Transportation and Moving occupations in Long Beach are Production (535 | 7.2%), Transportation (147 | 2.0%), and Material Moving (100 | 1.3%).
Production, Transportation and Moving Occupations by Sex
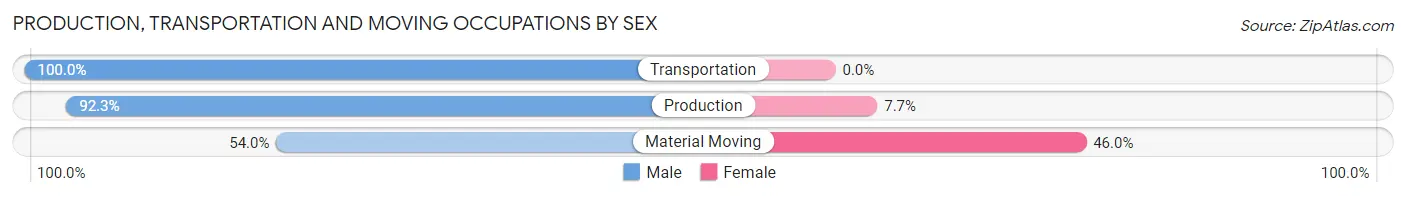
| Occupation | Male | Female |
| Production | 494 (92.3%) | 41 (7.7%) |
| Transportation | 147 (100.0%) | 0 (0.0%) |
| Material Moving | 54 (54.0%) | 46 (46.0%) |
| Total (Category) | 695 (88.9%) | 87 (11.1%) |
| Total (Overall) | 3,671 (49.3%) | 3,774 (50.7%) |
Employment Industries by Sex in Long Beach
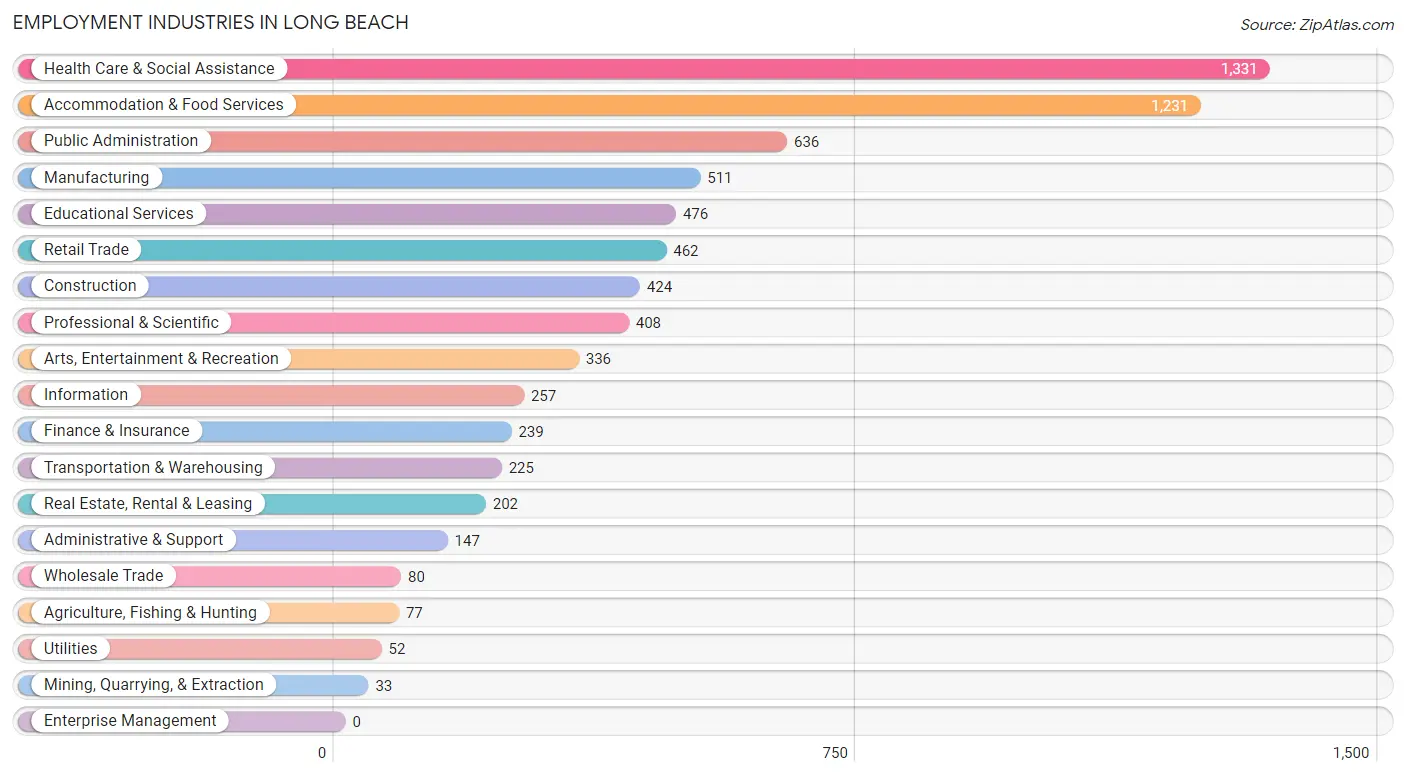
Employment Industries in Long Beach
The major employment industries in Long Beach include Health Care & Social Assistance (1,331 | 17.9%), Accommodation & Food Services (1,231 | 16.5%), Public Administration (636 | 8.5%), Manufacturing (511 | 6.9%), and Educational Services (476 | 6.4%).
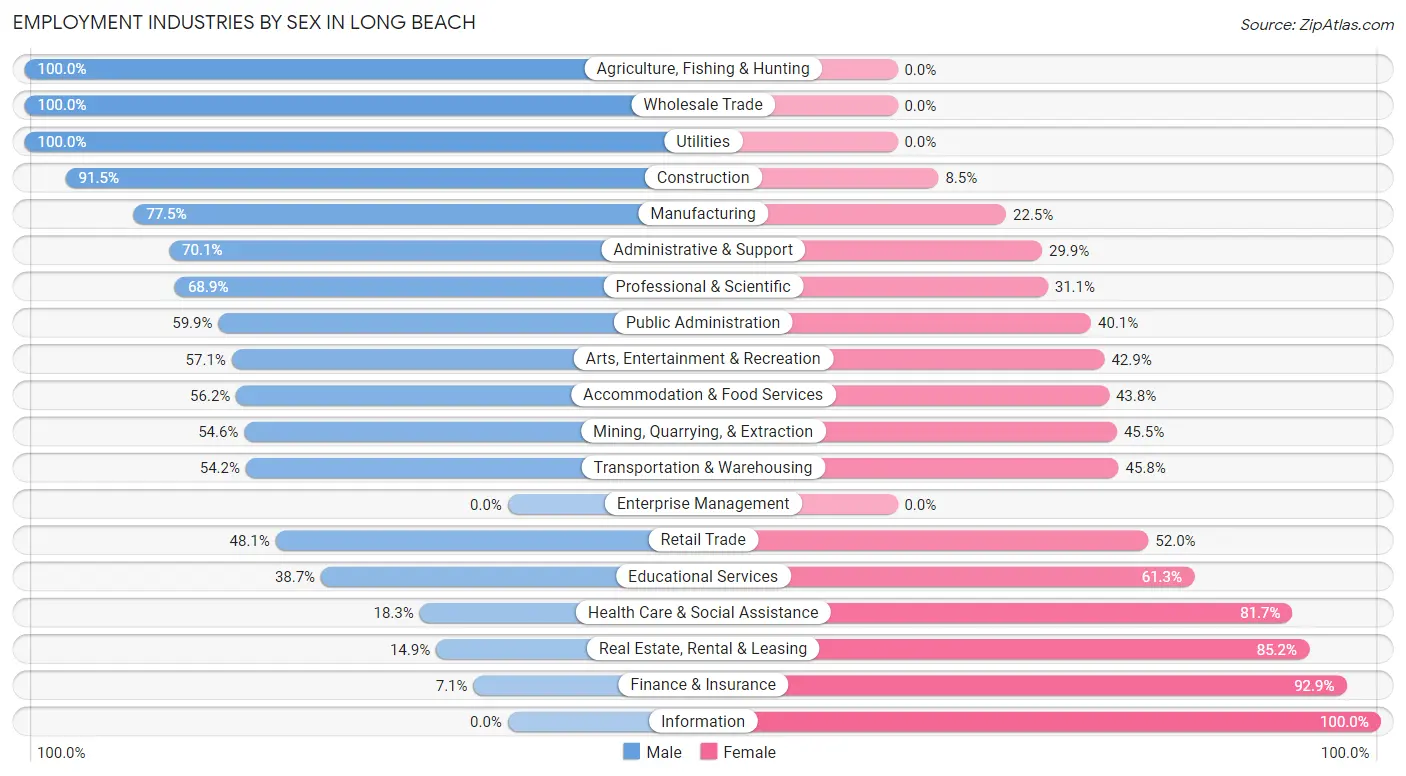
Employment Industries by Sex in Long Beach
The Long Beach industries that see more men than women are Agriculture, Fishing & Hunting (100.0%), Wholesale Trade (100.0%), and Utilities (100.0%), whereas the industries that tend to have a higher number of women are Information (100.0%), Finance & Insurance (92.9%), and Real Estate, Rental & Leasing (85.2%).
| Industry | Male | Female |
| Agriculture, Fishing & Hunting | 77 (100.0%) | 0 (0.0%) |
| Mining, Quarrying, & Extraction | 18 (54.5%) | 15 (45.5%) |
| Construction | 388 (91.5%) | 36 (8.5%) |
| Manufacturing | 396 (77.5%) | 115 (22.5%) |
| Wholesale Trade | 80 (100.0%) | 0 (0.0%) |
| Retail Trade | 222 (48.0%) | 240 (51.9%) |
| Transportation & Warehousing | 122 (54.2%) | 103 (45.8%) |
| Utilities | 52 (100.0%) | 0 (0.0%) |
| Information | 0 (0.0%) | 257 (100.0%) |
| Finance & Insurance | 17 (7.1%) | 222 (92.9%) |
| Real Estate, Rental & Leasing | 30 (14.8%) | 172 (85.2%) |
| Professional & Scientific | 281 (68.9%) | 127 (31.1%) |
| Enterprise Management | 0 (0.0%) | 0 (0.0%) |
| Administrative & Support | 103 (70.1%) | 44 (29.9%) |
| Educational Services | 184 (38.7%) | 292 (61.3%) |
| Health Care & Social Assistance | 243 (18.3%) | 1,088 (81.7%) |
| Arts, Entertainment & Recreation | 192 (57.1%) | 144 (42.9%) |
| Accommodation & Food Services | 692 (56.2%) | 539 (43.8%) |
| Public Administration | 381 (59.9%) | 255 (40.1%) |
| Total | 3,671 (49.3%) | 3,774 (50.7%) |
Education in Long Beach
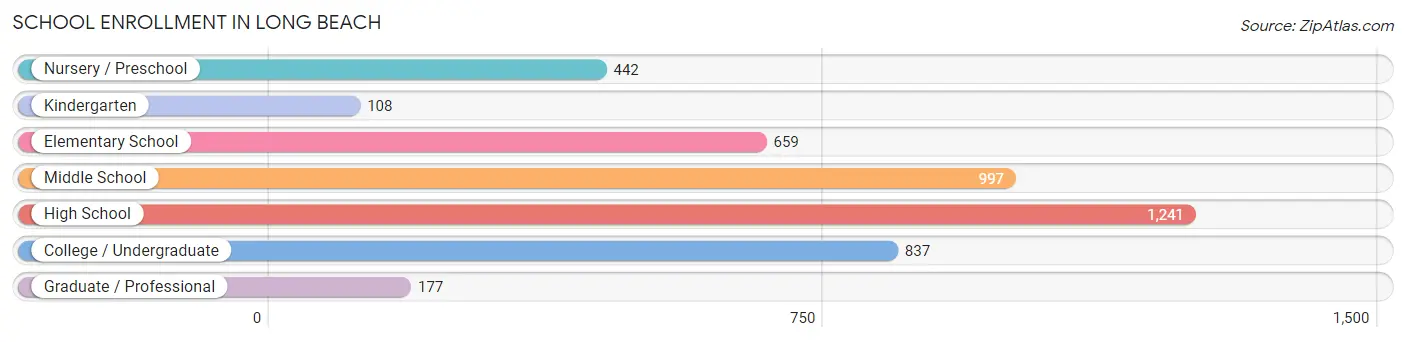
School Enrollment in Long Beach
The most common levels of schooling among the 4,461 students in Long Beach are high school (1,241 | 27.8%), middle school (997 | 22.4%), and college / undergraduate (837 | 18.8%).
| School Level | # Students | % Students |
| Nursery / Preschool | 442 | 9.9% |
| Kindergarten | 108 | 2.4% |
| Elementary School | 659 | 14.8% |
| Middle School | 997 | 22.4% |
| High School | 1,241 | 27.8% |
| College / Undergraduate | 837 | 18.8% |
| Graduate / Professional | 177 | 4.0% |
| Total | 4,461 | 100.0% |
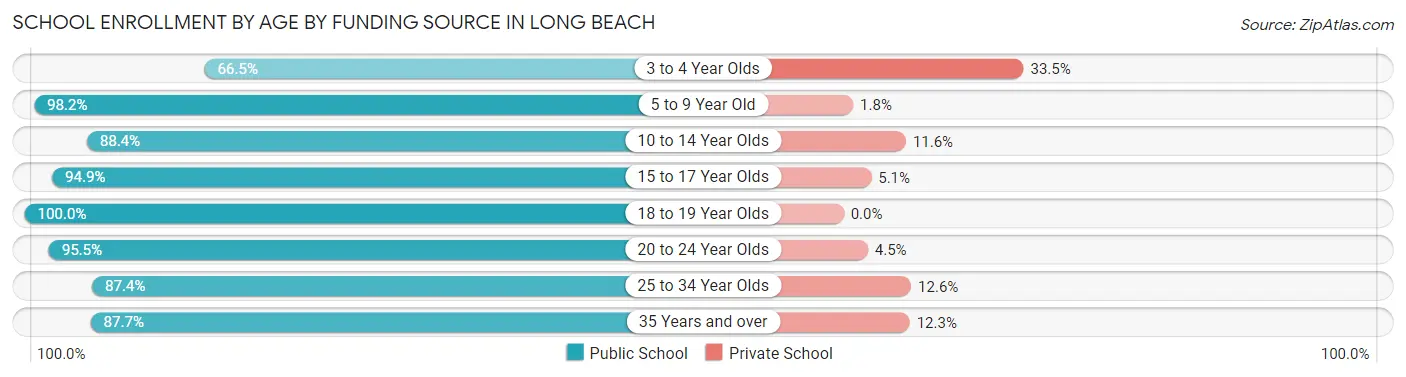
School Enrollment by Age by Funding Source in Long Beach
Out of a total of 4,461 students who are enrolled in schools in Long Beach, 415 (9.3%) attend a private institution, while the remaining 4,046 (90.7%) are enrolled in public schools. The age group of 3 to 4 year olds has the highest likelihood of being enrolled in private schools, with 124 (33.5% in the age bracket) enrolled. Conversely, the age group of 18 to 19 year olds has the lowest likelihood of being enrolled in a private school, with 218 (100.0% in the age bracket) attending a public institution.
| Age Bracket | Public School | Private School |
| 3 to 4 Year Olds | 246 (66.5%) | 124 (33.5%) |
| 5 to 9 Year Old | 720 (98.2%) | 13 (1.8%) |
| 10 to 14 Year Olds | 1,097 (88.4%) | 144 (11.6%) |
| 15 to 17 Year Olds | 905 (94.9%) | 49 (5.1%) |
| 18 to 19 Year Olds | 218 (100.0%) | 0 (0.0%) |
| 20 to 24 Year Olds | 402 (95.5%) | 19 (4.5%) |
| 25 to 34 Year Olds | 167 (87.4%) | 24 (12.6%) |
| 35 Years and over | 292 (87.7%) | 41 (12.3%) |
| Total | 4,046 (90.7%) | 415 (9.3%) |
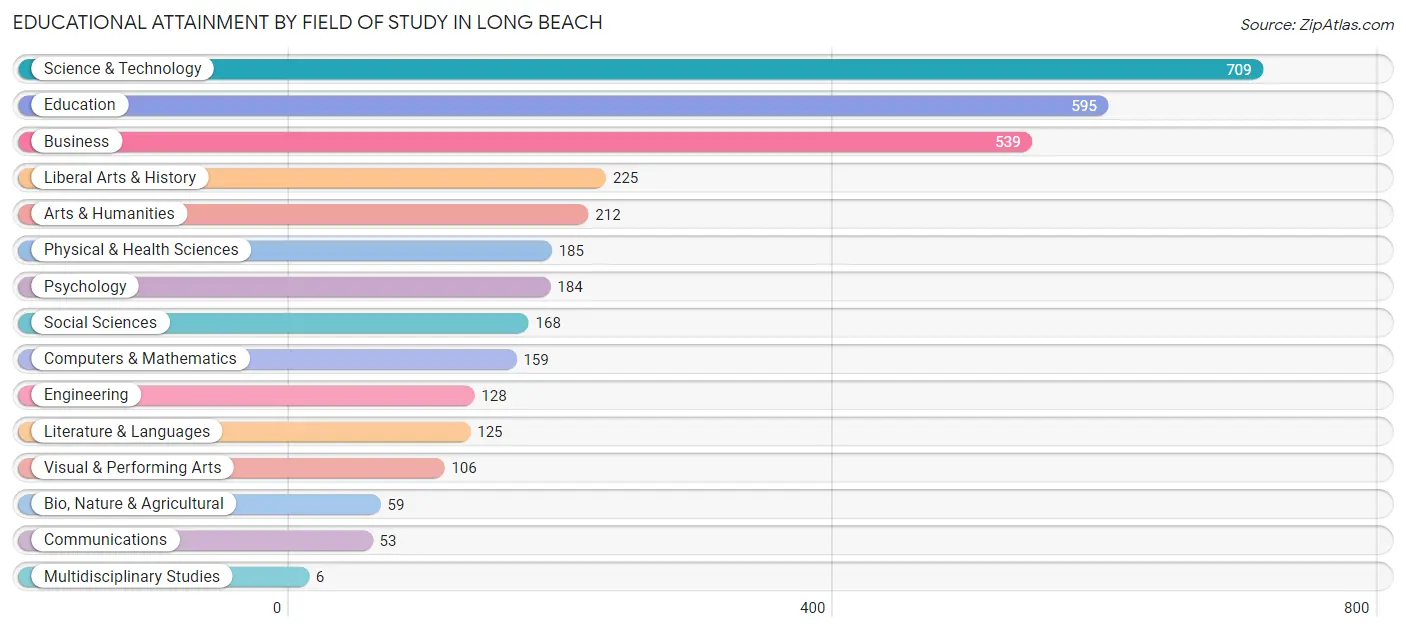
Educational Attainment by Field of Study in Long Beach
Science & technology (709 | 20.5%), education (595 | 17.2%), business (539 | 15.6%), liberal arts & history (225 | 6.5%), and arts & humanities (212 | 6.1%) are the most common fields of study among 3,453 individuals in Long Beach who have obtained a bachelor's degree or higher.
| Field of Study | # Graduates | % Graduates |
| Computers & Mathematics | 159 | 4.6% |
| Bio, Nature & Agricultural | 59 | 1.7% |
| Physical & Health Sciences | 185 | 5.4% |
| Psychology | 184 | 5.3% |
| Social Sciences | 168 | 4.9% |
| Engineering | 128 | 3.7% |
| Multidisciplinary Studies | 6 | 0.2% |
| Science & Technology | 709 | 20.5% |
| Business | 539 | 15.6% |
| Education | 595 | 17.2% |
| Literature & Languages | 125 | 3.6% |
| Liberal Arts & History | 225 | 6.5% |
| Visual & Performing Arts | 106 | 3.1% |
| Communications | 53 | 1.5% |
| Arts & Humanities | 212 | 6.1% |
| Total | 3,453 | 100.0% |
Transportation & Commute in Long Beach
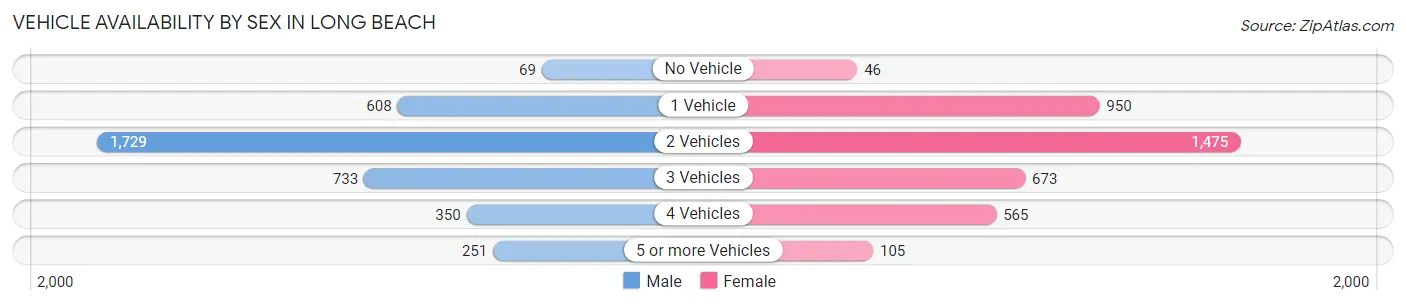
Vehicle Availability by Sex in Long Beach
The most prevalent vehicle ownership categories in Long Beach are males with 2 vehicles (1,729, accounting for 46.2%) and females with 2 vehicles (1,475, making up 45.3%).
| Vehicles Available | Male | Female |
| No Vehicle | 69 (1.8%) | 46 (1.2%) |
| 1 Vehicle | 608 (16.3%) | 950 (24.9%) |
| 2 Vehicles | 1,729 (46.2%) | 1,475 (38.7%) |
| 3 Vehicles | 733 (19.6%) | 673 (17.6%) |
| 4 Vehicles | 350 (9.4%) | 565 (14.8%) |
| 5 or more Vehicles | 251 (6.7%) | 105 (2.8%) |
| Total | 3,740 (100.0%) | 3,814 (100.0%) |
Commute Time in Long Beach
The most frequently occuring commute durations in Long Beach are 20 to 24 minutes (1,357 commuters, 18.8%), 10 to 14 minutes (1,101 commuters, 15.2%), and 5 to 9 minutes (1,081 commuters, 14.9%).
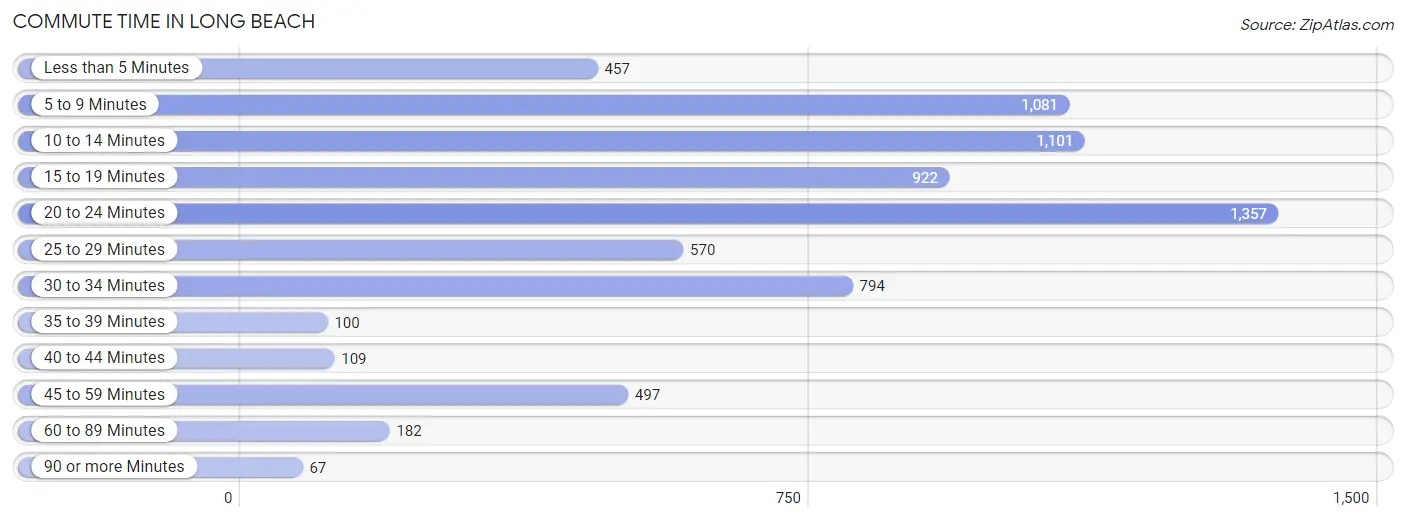
| Commute Time | # Commuters | % Commuters |
| Less than 5 Minutes | 457 | 6.3% |
| 5 to 9 Minutes | 1,081 | 14.9% |
| 10 to 14 Minutes | 1,101 | 15.2% |
| 15 to 19 Minutes | 922 | 12.7% |
| 20 to 24 Minutes | 1,357 | 18.8% |
| 25 to 29 Minutes | 570 | 7.9% |
| 30 to 34 Minutes | 794 | 11.0% |
| 35 to 39 Minutes | 100 | 1.4% |
| 40 to 44 Minutes | 109 | 1.5% |
| 45 to 59 Minutes | 497 | 6.9% |
| 60 to 89 Minutes | 182 | 2.5% |
| 90 or more Minutes | 67 | 0.9% |
Commute Time by Sex in Long Beach
The most common commute times in Long Beach are 20 to 24 minutes (574 commuters, 16.1%) for males and 20 to 24 minutes (783 commuters, 21.3%) for females.
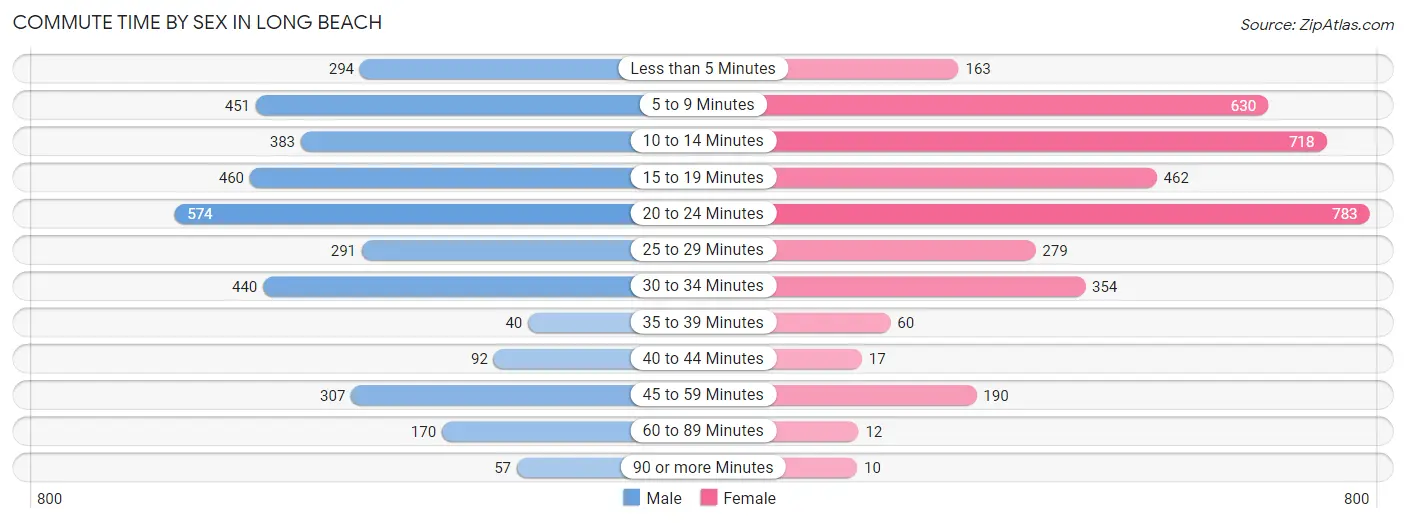
| Commute Time | Male | Female |
| Less than 5 Minutes | 294 (8.3%) | 163 (4.4%) |
| 5 to 9 Minutes | 451 (12.7%) | 630 (17.1%) |
| 10 to 14 Minutes | 383 (10.8%) | 718 (19.5%) |
| 15 to 19 Minutes | 460 (12.9%) | 462 (12.6%) |
| 20 to 24 Minutes | 574 (16.1%) | 783 (21.3%) |
| 25 to 29 Minutes | 291 (8.2%) | 279 (7.6%) |
| 30 to 34 Minutes | 440 (12.4%) | 354 (9.6%) |
| 35 to 39 Minutes | 40 (1.1%) | 60 (1.6%) |
| 40 to 44 Minutes | 92 (2.6%) | 17 (0.5%) |
| 45 to 59 Minutes | 307 (8.6%) | 190 (5.2%) |
| 60 to 89 Minutes | 170 (4.8%) | 12 (0.3%) |
| 90 or more Minutes | 57 (1.6%) | 10 (0.3%) |
Time of Departure to Work by Sex in Long Beach
The most frequent times of departure to work in Long Beach are 6:30 AM to 6:59 AM (578, 16.2%) for males and 7:00 AM to 7:29 AM (607, 16.5%) for females.
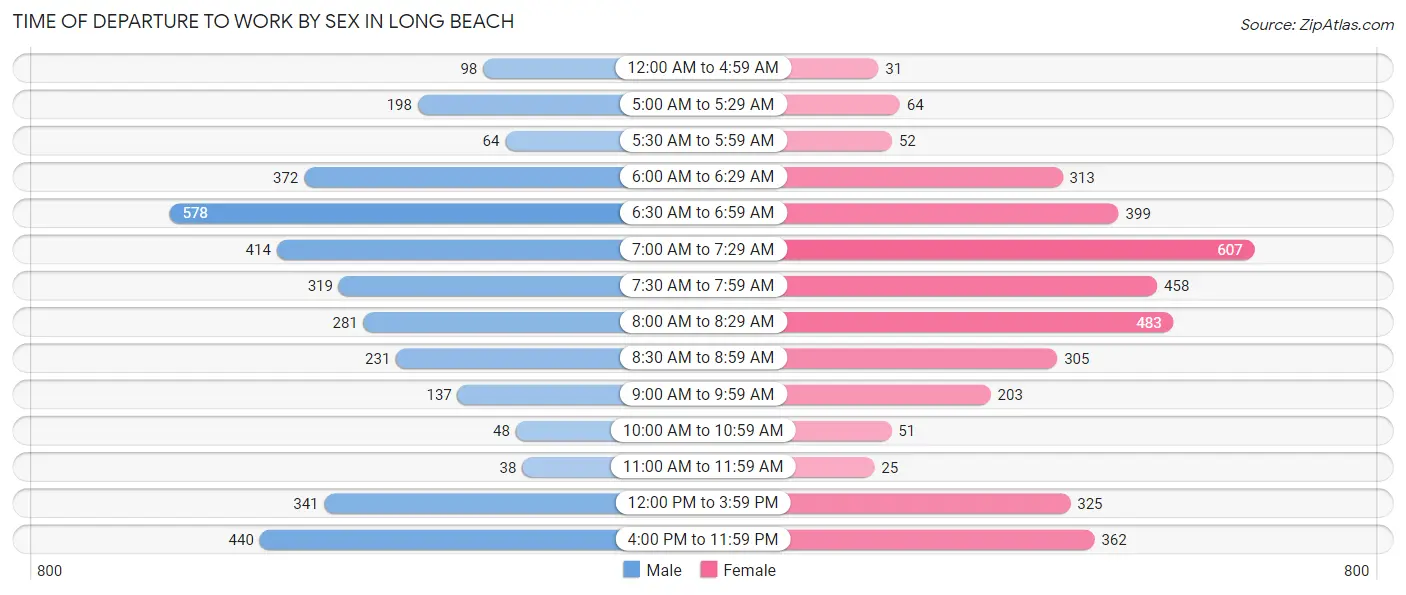
| Time of Departure | Male | Female |
| 12:00 AM to 4:59 AM | 98 (2.8%) | 31 (0.8%) |
| 5:00 AM to 5:29 AM | 198 (5.6%) | 64 (1.7%) |
| 5:30 AM to 5:59 AM | 64 (1.8%) | 52 (1.4%) |
| 6:00 AM to 6:29 AM | 372 (10.4%) | 313 (8.5%) |
| 6:30 AM to 6:59 AM | 578 (16.2%) | 399 (10.8%) |
| 7:00 AM to 7:29 AM | 414 (11.6%) | 607 (16.5%) |
| 7:30 AM to 7:59 AM | 319 (9.0%) | 458 (12.4%) |
| 8:00 AM to 8:29 AM | 281 (7.9%) | 483 (13.1%) |
| 8:30 AM to 8:59 AM | 231 (6.5%) | 305 (8.3%) |
| 9:00 AM to 9:59 AM | 137 (3.8%) | 203 (5.5%) |
| 10:00 AM to 10:59 AM | 48 (1.3%) | 51 (1.4%) |
| 11:00 AM to 11:59 AM | 38 (1.1%) | 25 (0.7%) |
| 12:00 PM to 3:59 PM | 341 (9.6%) | 325 (8.8%) |
| 4:00 PM to 11:59 PM | 440 (12.4%) | 362 (9.8%) |
| Total | 3,559 (100.0%) | 3,678 (100.0%) |
Housing Occupancy in Long Beach
Occupancy by Ownership in Long Beach
Of the total 6,708 dwellings in Long Beach, owner-occupied units account for 4,377 (65.2%), while renter-occupied units make up 2,331 (34.7%).
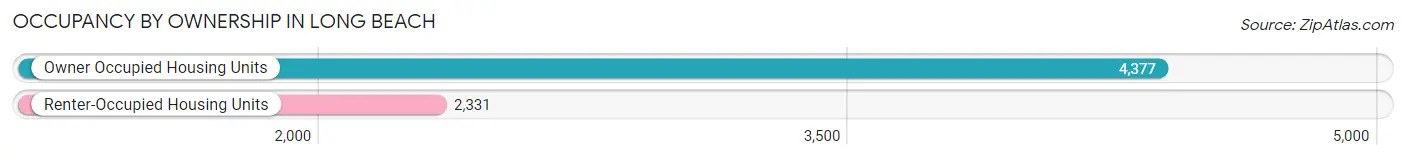
| Occupancy | # Housing Units | % Housing Units |
| Owner Occupied Housing Units | 4,377 | 65.2% |
| Renter-Occupied Housing Units | 2,331 | 34.7% |
| Total Occupied Housing Units | 6,708 | 100.0% |
Occupancy by Household Size in Long Beach
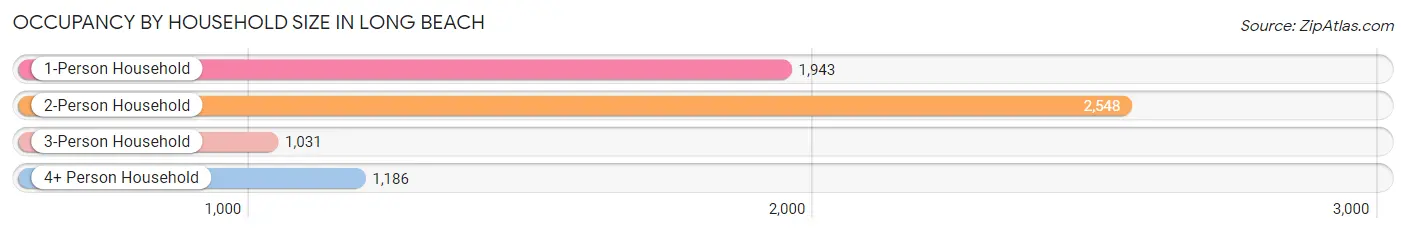
| Household Size | # Housing Units | % Housing Units |
| 1-Person Household | 1,943 | 29.0% |
| 2-Person Household | 2,548 | 38.0% |
| 3-Person Household | 1,031 | 15.4% |
| 4+ Person Household | 1,186 | 17.7% |
| Total Housing Units | 6,708 | 100.0% |
Occupancy by Ownership by Household Size in Long Beach
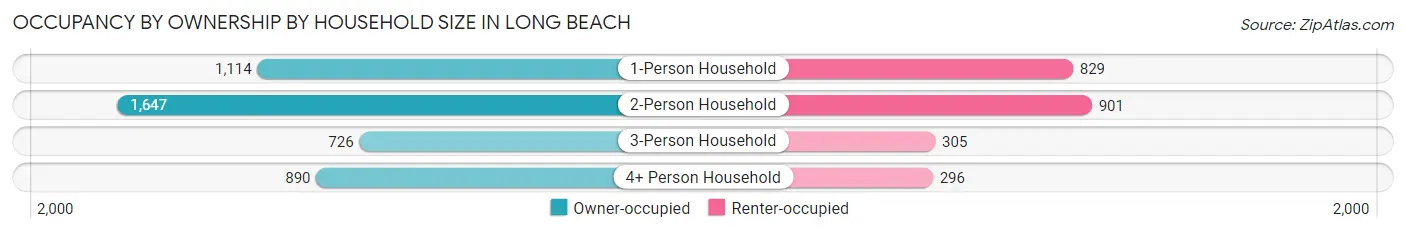
| Household Size | Owner-occupied | Renter-occupied |
| 1-Person Household | 1,114 (57.3%) | 829 (42.7%) |
| 2-Person Household | 1,647 (64.6%) | 901 (35.4%) |
| 3-Person Household | 726 (70.4%) | 305 (29.6%) |
| 4+ Person Household | 890 (75.0%) | 296 (25.0%) |
| Total Housing Units | 4,377 (65.2%) | 2,331 (34.7%) |
Occupancy by Educational Attainment in Long Beach
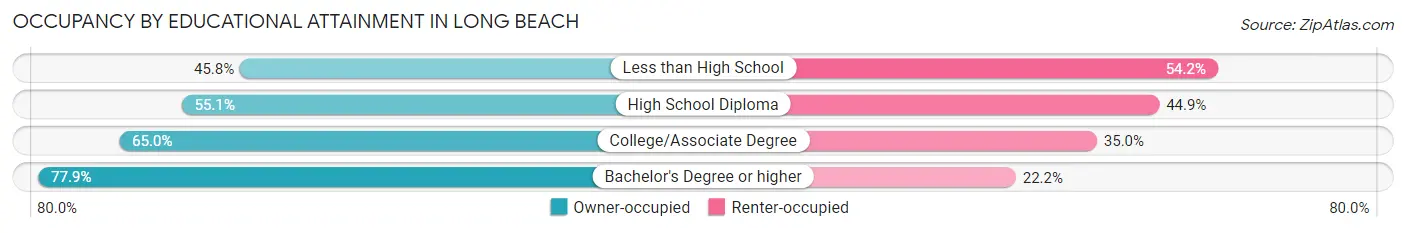
| Household Size | Owner-occupied | Renter-occupied |
| Less than High School | 154 (45.8%) | 182 (54.2%) |
| High School Diploma | 1,047 (55.1%) | 853 (44.9%) |
| College/Associate Degree | 1,545 (65.0%) | 832 (35.0%) |
| Bachelor's Degree or higher | 1,631 (77.8%) | 464 (22.2%) |
Occupancy by Age of Householder in Long Beach
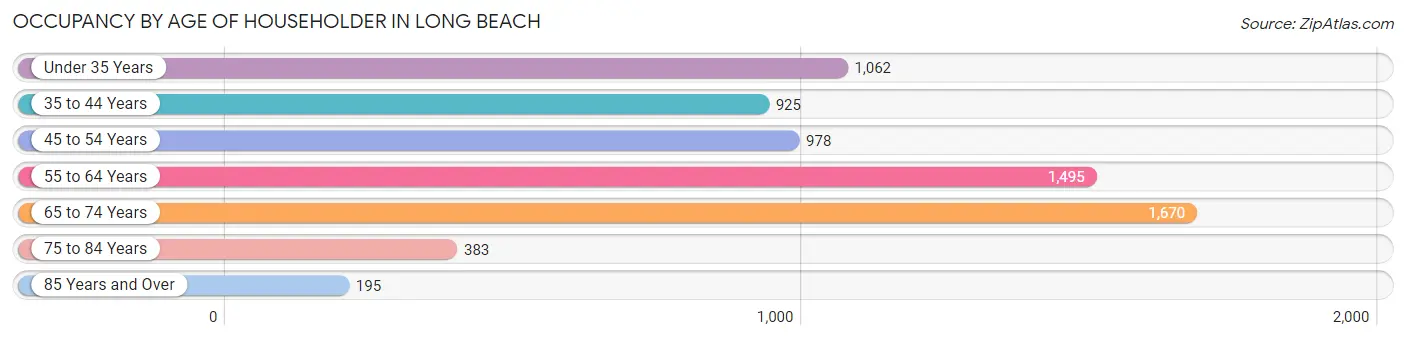
| Age Bracket | # Households | % Households |
| Under 35 Years | 1,062 | 15.8% |
| 35 to 44 Years | 925 | 13.8% |
| 45 to 54 Years | 978 | 14.6% |
| 55 to 64 Years | 1,495 | 22.3% |
| 65 to 74 Years | 1,670 | 24.9% |
| 75 to 84 Years | 383 | 5.7% |
| 85 Years and Over | 195 | 2.9% |
| Total | 6,708 | 100.0% |
Housing Finances in Long Beach
Median Income by Occupancy in Long Beach
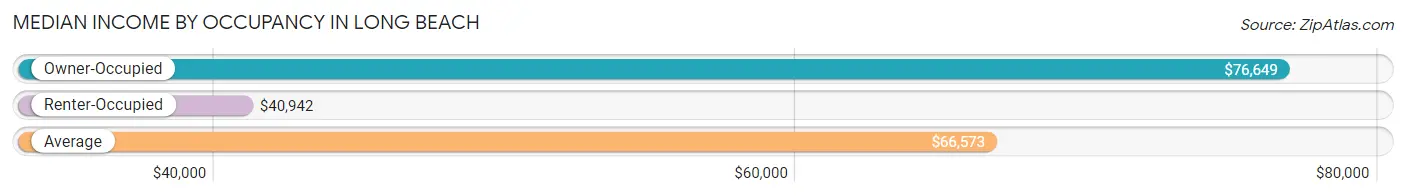
| Occupancy Type | # Households | Median Income |
| Owner-Occupied | 4,377 (65.2%) | $76,649 |
| Renter-Occupied | 2,331 (34.7%) | $40,942 |
| Average | 6,708 (100.0%) | $66,573 |
Occupancy by Householder Income Bracket in Long Beach
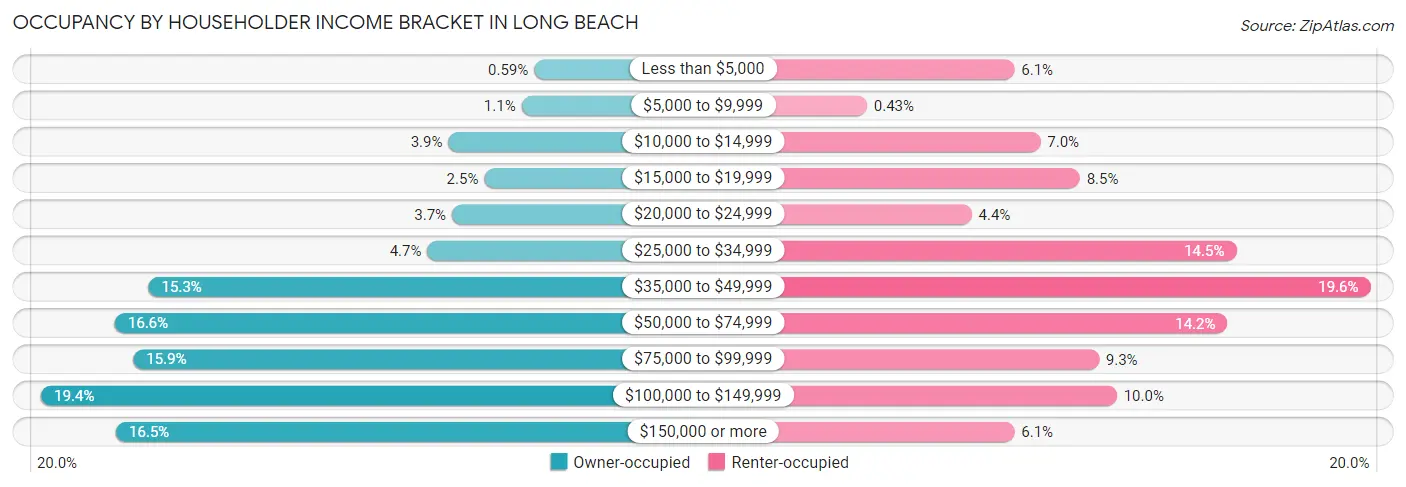
| Income Bracket | Owner-occupied | Renter-occupied |
| Less than $5,000 | 26 (0.6%) | 141 (6.0%) |
| $5,000 to $9,999 | 47 (1.1%) | 10 (0.4%) |
| $10,000 to $14,999 | 169 (3.9%) | 164 (7.0%) |
| $15,000 to $19,999 | 109 (2.5%) | 199 (8.5%) |
| $20,000 to $24,999 | 163 (3.7%) | 103 (4.4%) |
| $25,000 to $34,999 | 204 (4.7%) | 338 (14.5%) |
| $35,000 to $49,999 | 669 (15.3%) | 457 (19.6%) |
| $50,000 to $74,999 | 725 (16.6%) | 330 (14.2%) |
| $75,000 to $99,999 | 694 (15.9%) | 216 (9.3%) |
| $100,000 to $149,999 | 848 (19.4%) | 232 (10.0%) |
| $150,000 or more | 723 (16.5%) | 141 (6.0%) |
| Total | 4,377 (100.0%) | 2,331 (100.0%) |
Monthly Housing Cost Tiers in Long Beach
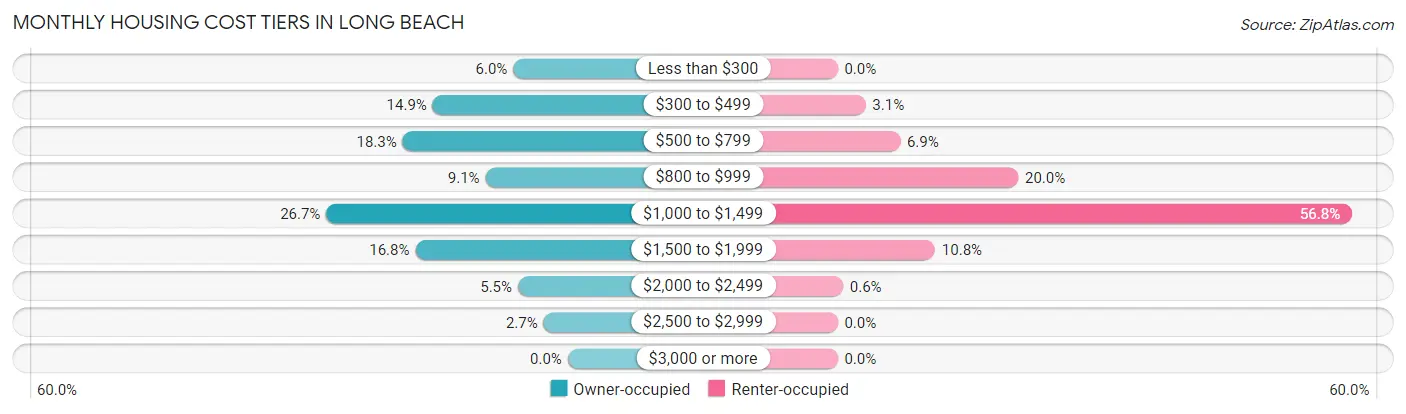
| Monthly Cost | Owner-occupied | Renter-occupied |
| Less than $300 | 264 (6.0%) | 0 (0.0%) |
| $300 to $499 | 653 (14.9%) | 72 (3.1%) |
| $500 to $799 | 799 (18.2%) | 161 (6.9%) |
| $800 to $999 | 398 (9.1%) | 465 (20.0%) |
| $1,000 to $1,499 | 1,168 (26.7%) | 1,325 (56.8%) |
| $1,500 to $1,999 | 737 (16.8%) | 251 (10.8%) |
| $2,000 to $2,499 | 241 (5.5%) | 14 (0.6%) |
| $2,500 to $2,999 | 117 (2.7%) | 0 (0.0%) |
| $3,000 or more | 0 (0.0%) | 0 (0.0%) |
| Total | 4,377 (100.0%) | 2,331 (100.0%) |
Physical Housing Characteristics in Long Beach
Housing Structures in Long Beach
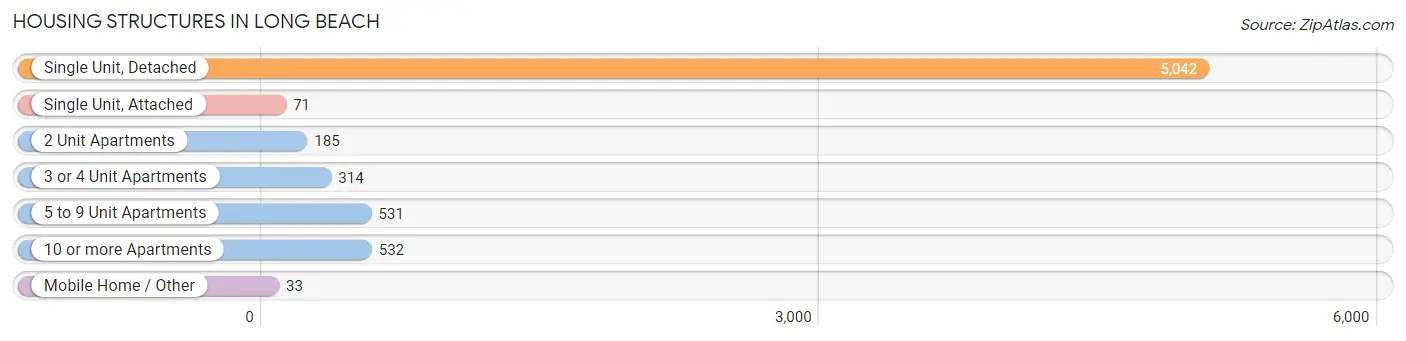
| Structure Type | # Housing Units | % Housing Units |
| Single Unit, Detached | 5,042 | 75.2% |
| Single Unit, Attached | 71 | 1.1% |
| 2 Unit Apartments | 185 | 2.8% |
| 3 or 4 Unit Apartments | 314 | 4.7% |
| 5 to 9 Unit Apartments | 531 | 7.9% |
| 10 or more Apartments | 532 | 7.9% |
| Mobile Home / Other | 33 | 0.5% |
| Total | 6,708 | 100.0% |
Housing Structures by Occupancy in Long Beach
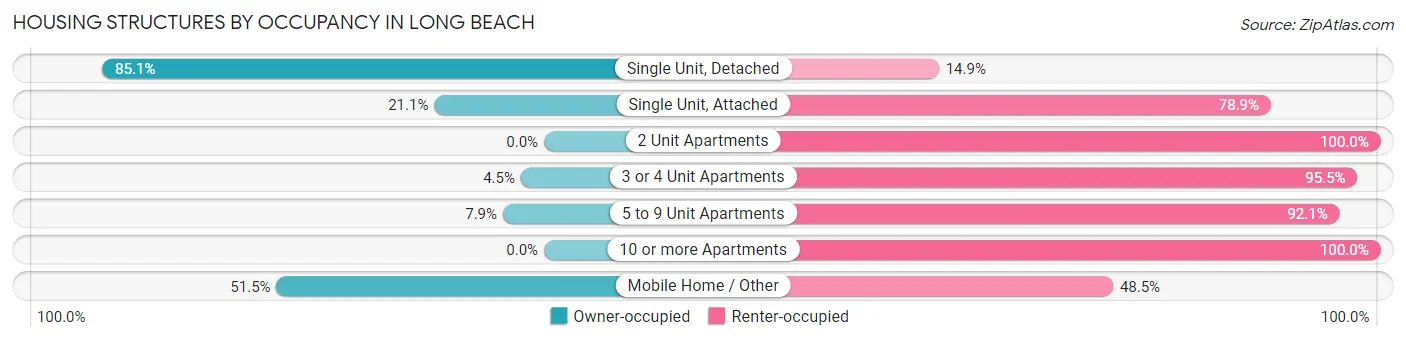
| Structure Type | Owner-occupied | Renter-occupied |
| Single Unit, Detached | 4,289 (85.1%) | 753 (14.9%) |
| Single Unit, Attached | 15 (21.1%) | 56 (78.9%) |
| 2 Unit Apartments | 0 (0.0%) | 185 (100.0%) |
| 3 or 4 Unit Apartments | 14 (4.5%) | 300 (95.5%) |
| 5 to 9 Unit Apartments | 42 (7.9%) | 489 (92.1%) |
| 10 or more Apartments | 0 (0.0%) | 532 (100.0%) |
| Mobile Home / Other | 17 (51.5%) | 16 (48.5%) |
| Total | 4,377 (65.2%) | 2,331 (34.7%) |
Housing Structures by Number of Rooms in Long Beach
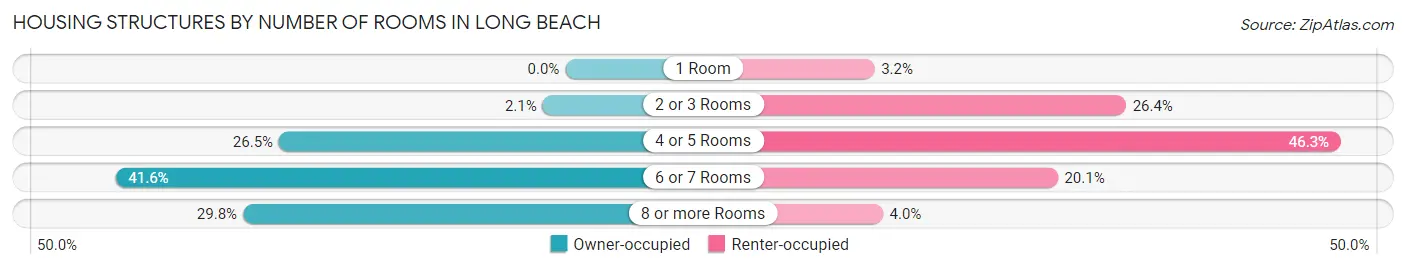
| Number of Rooms | Owner-occupied | Renter-occupied |
| 1 Room | 0 (0.0%) | 74 (3.2%) |
| 2 or 3 Rooms | 92 (2.1%) | 616 (26.4%) |
| 4 or 5 Rooms | 1,159 (26.5%) | 1,080 (46.3%) |
| 6 or 7 Rooms | 1,821 (41.6%) | 469 (20.1%) |
| 8 or more Rooms | 1,305 (29.8%) | 92 (4.0%) |
| Total | 4,377 (100.0%) | 2,331 (100.0%) |
Housing Structure by Heating Type in Long Beach
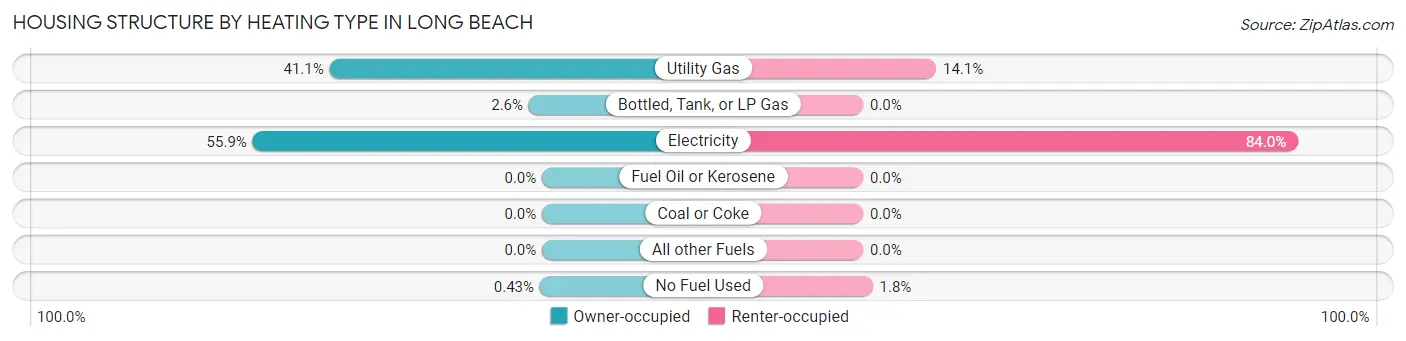
| Heating Type | Owner-occupied | Renter-occupied |
| Utility Gas | 1,798 (41.1%) | 329 (14.1%) |
| Bottled, Tank, or LP Gas | 112 (2.6%) | 0 (0.0%) |
| Electricity | 2,448 (55.9%) | 1,959 (84.0%) |
| Fuel Oil or Kerosene | 0 (0.0%) | 0 (0.0%) |
| Coal or Coke | 0 (0.0%) | 0 (0.0%) |
| All other Fuels | 0 (0.0%) | 0 (0.0%) |
| No Fuel Used | 19 (0.4%) | 43 (1.8%) |
| Total | 4,377 (100.0%) | 2,331 (100.0%) |
Household Vehicle Usage in Long Beach
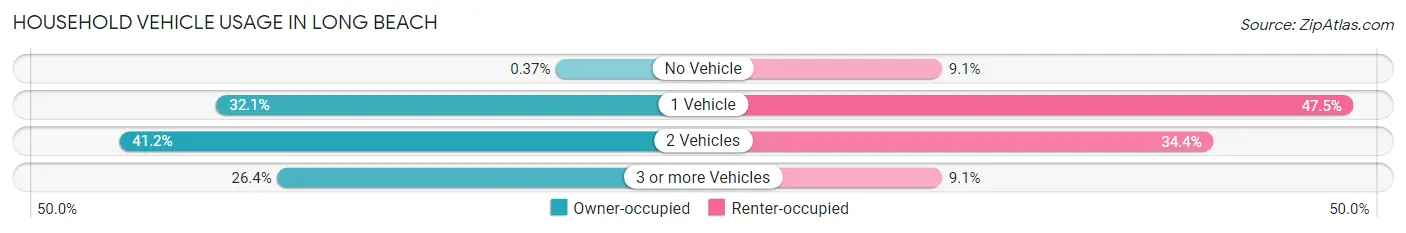
| Vehicles per Household | Owner-occupied | Renter-occupied |
| No Vehicle | 16 (0.4%) | 211 (9.0%) |
| 1 Vehicle | 1,405 (32.1%) | 1,107 (47.5%) |
| 2 Vehicles | 1,801 (41.1%) | 802 (34.4%) |
| 3 or more Vehicles | 1,155 (26.4%) | 211 (9.0%) |
| Total | 4,377 (100.0%) | 2,331 (100.0%) |
Real Estate & Mortgages in Long Beach
Real Estate and Mortgage Overview in Long Beach
| Characteristic | Without Mortgage | With Mortgage |
| Housing Units | 1,862 | 2,515 |
| Median Property Value | $186,000 | $188,200 |
| Median Household Income | $64,375 | $464 |
| Monthly Housing Costs | $516 | $0 |
| Real Estate Taxes | $1,256 | $351 |
Property Value by Mortgage Status in Long Beach
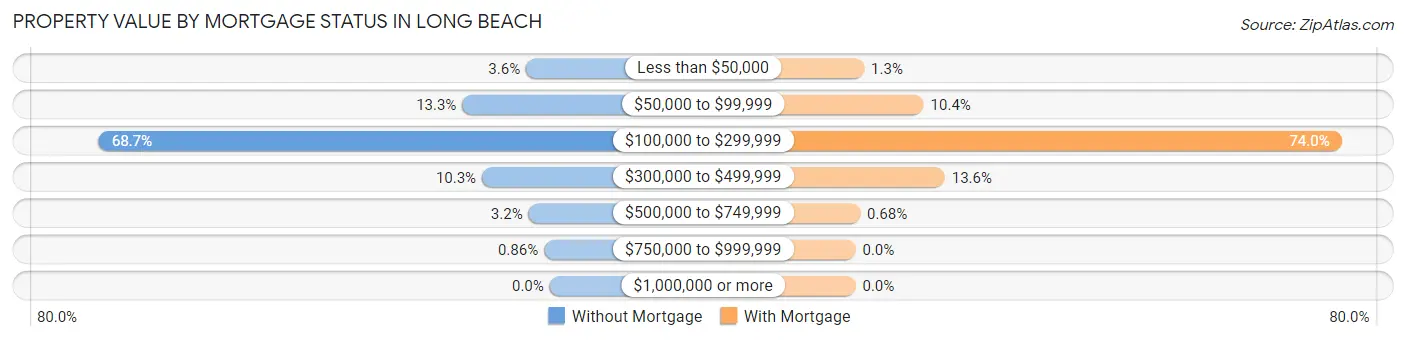
| Property Value | Without Mortgage | With Mortgage |
| Less than $50,000 | 67 (3.6%) | 33 (1.3%) |
| $50,000 to $99,999 | 248 (13.3%) | 261 (10.4%) |
| $100,000 to $299,999 | 1,279 (68.7%) | 1,862 (74.0%) |
| $300,000 to $499,999 | 192 (10.3%) | 342 (13.6%) |
| $500,000 to $749,999 | 60 (3.2%) | 17 (0.7%) |
| $750,000 to $999,999 | 16 (0.9%) | 0 (0.0%) |
| $1,000,000 or more | 0 (0.0%) | 0 (0.0%) |
| Total | 1,862 (100.0%) | 2,515 (100.0%) |
Household Income by Mortgage Status in Long Beach
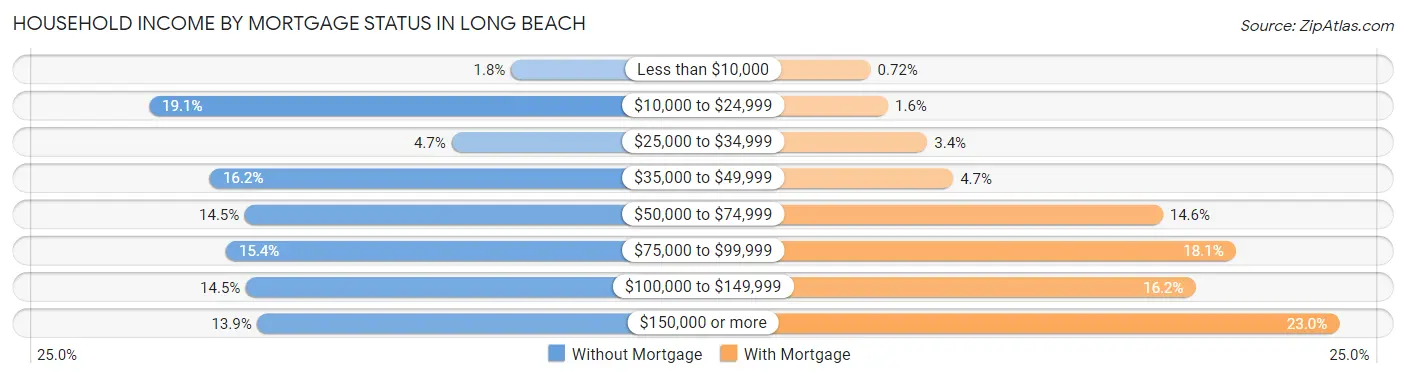
| Household Income | Without Mortgage | With Mortgage |
| Less than $10,000 | 34 (1.8%) | 18 (0.7%) |
| $10,000 to $24,999 | 355 (19.1%) | 39 (1.5%) |
| $25,000 to $34,999 | 87 (4.7%) | 86 (3.4%) |
| $35,000 to $49,999 | 301 (16.2%) | 117 (4.6%) |
| $50,000 to $74,999 | 270 (14.5%) | 368 (14.6%) |
| $75,000 to $99,999 | 287 (15.4%) | 455 (18.1%) |
| $100,000 to $149,999 | 269 (14.4%) | 407 (16.2%) |
| $150,000 or more | 259 (13.9%) | 579 (23.0%) |
| Total | 1,862 (100.0%) | 2,515 (100.0%) |
Property Value to Household Income Ratio in Long Beach
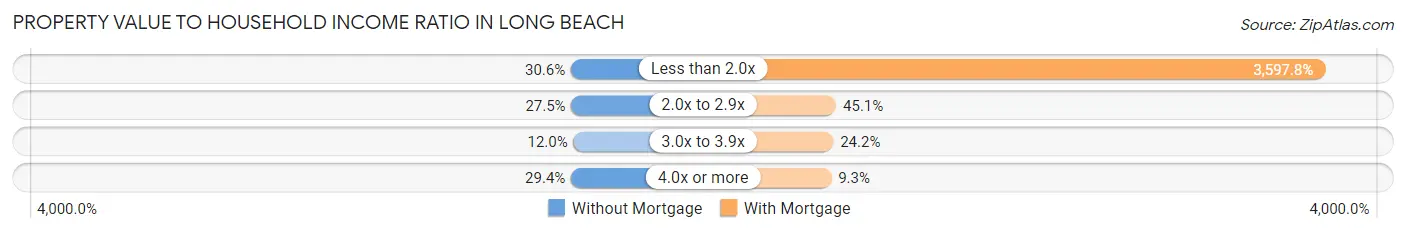
| Value-to-Income Ratio | Without Mortgage | With Mortgage |
| Less than 2.0x | 569 (30.6%) | 90,485 (3,597.8%) |
| 2.0x to 2.9x | 512 (27.5%) | 1,134 (45.1%) |
| 3.0x to 3.9x | 223 (12.0%) | 609 (24.2%) |
| 4.0x or more | 548 (29.4%) | 233 (9.3%) |
| Total | 1,862 (100.0%) | 2,515 (100.0%) |
Real Estate Taxes by Mortgage Status in Long Beach
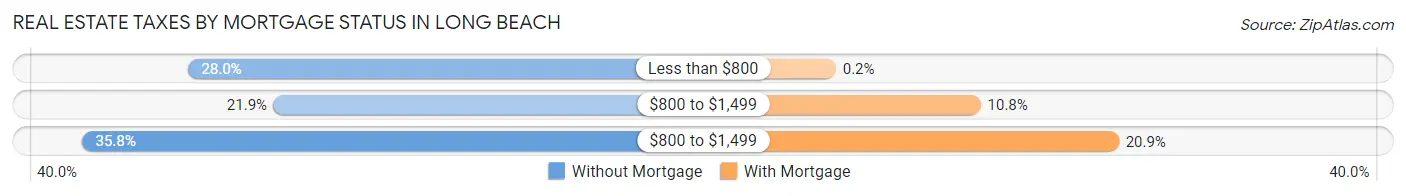
| Property Taxes | Without Mortgage | With Mortgage |
| Less than $800 | 522 (28.0%) | 5 (0.2%) |
| $800 to $1,499 | 407 (21.9%) | 271 (10.8%) |
| $800 to $1,499 | 666 (35.8%) | 525 (20.9%) |
| Total | 1,862 (100.0%) | 2,515 (100.0%) |
Health & Disability in Long Beach
Health Insurance Coverage by Age in Long Beach
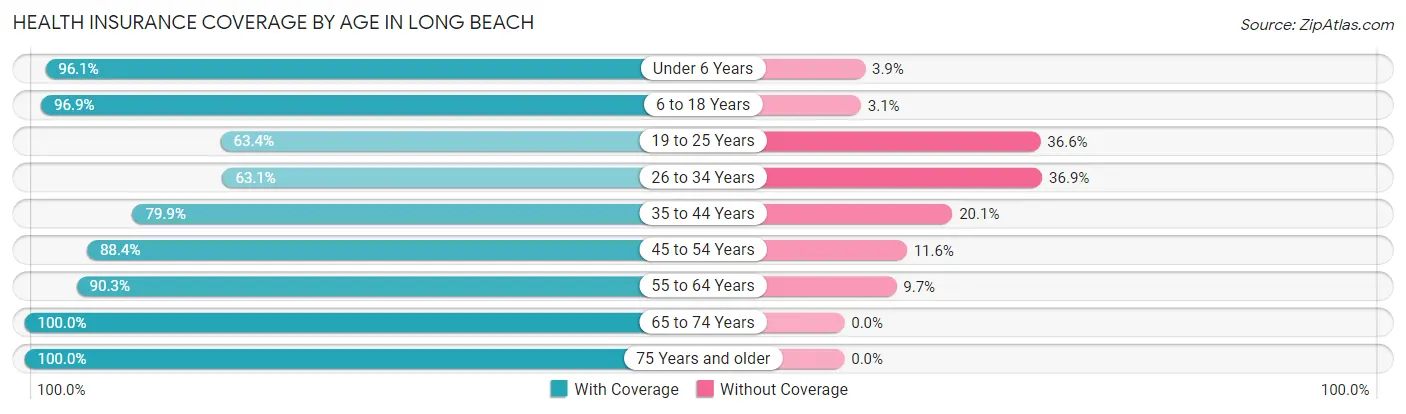
| Age Bracket | With Coverage | Without Coverage |
| Under 6 Years | 1,019 (96.1%) | 41 (3.9%) |
| 6 to 18 Years | 3,141 (96.9%) | 100 (3.1%) |
| 19 to 25 Years | 765 (63.4%) | 441 (36.6%) |
| 26 to 34 Years | 903 (63.1%) | 528 (36.9%) |
| 35 to 44 Years | 1,627 (79.9%) | 410 (20.1%) |
| 45 to 54 Years | 1,534 (88.4%) | 202 (11.6%) |
| 55 to 64 Years | 1,990 (90.3%) | 214 (9.7%) |
| 65 to 74 Years | 2,771 (100.0%) | 0 (0.0%) |
| 75 Years and older | 918 (100.0%) | 0 (0.0%) |
| Total | 14,668 (88.3%) | 1,936 (11.7%) |
Health Insurance Coverage by Citizenship Status in Long Beach
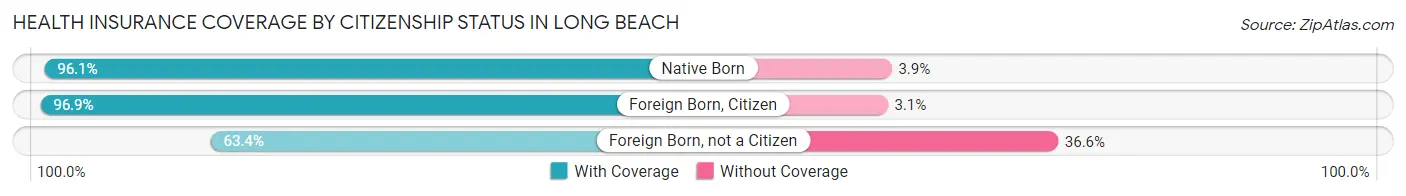
| Citizenship Status | With Coverage | Without Coverage |
| Native Born | 1,019 (96.1%) | 41 (3.9%) |
| Foreign Born, Citizen | 3,141 (96.9%) | 100 (3.1%) |
| Foreign Born, not a Citizen | 765 (63.4%) | 441 (36.6%) |
Health Insurance Coverage by Household Income in Long Beach
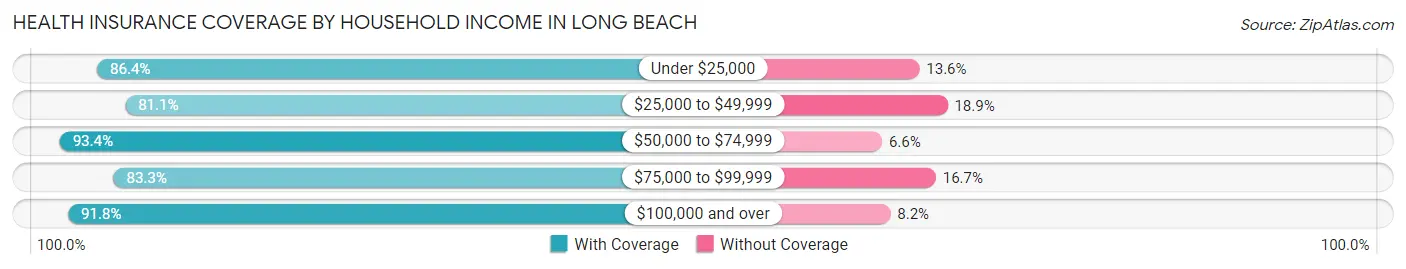
| Household Income | With Coverage | Without Coverage |
| Under $25,000 | 1,499 (86.4%) | 236 (13.6%) |
| $25,000 to $49,999 | 2,456 (81.1%) | 571 (18.9%) |
| $50,000 to $74,999 | 2,551 (93.4%) | 180 (6.6%) |
| $75,000 to $99,999 | 1,999 (83.3%) | 400 (16.7%) |
| $100,000 and over | 6,126 (91.8%) | 544 (8.2%) |
Public vs Private Health Insurance Coverage by Age in Long Beach
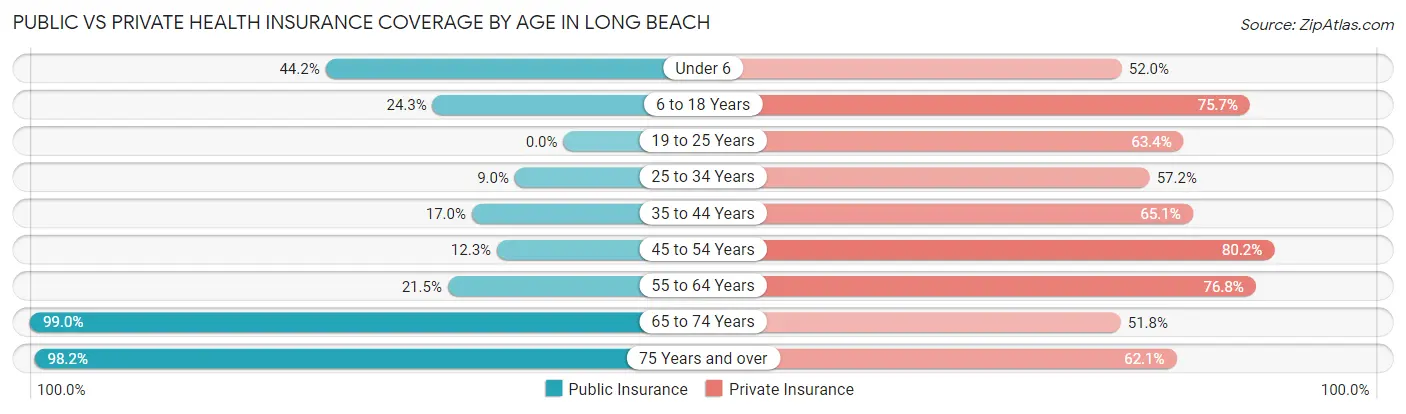
| Age Bracket | Public Insurance | Private Insurance |
| Under 6 | 468 (44.2%) | 551 (52.0%) |
| 6 to 18 Years | 787 (24.3%) | 2,454 (75.7%) |
| 19 to 25 Years | 0 (0.0%) | 765 (63.4%) |
| 25 to 34 Years | 129 (9.0%) | 818 (57.2%) |
| 35 to 44 Years | 346 (17.0%) | 1,326 (65.1%) |
| 45 to 54 Years | 214 (12.3%) | 1,393 (80.2%) |
| 55 to 64 Years | 473 (21.5%) | 1,693 (76.8%) |
| 65 to 74 Years | 2,743 (99.0%) | 1,435 (51.8%) |
| 75 Years and over | 901 (98.2%) | 570 (62.1%) |
| Total | 6,061 (36.5%) | 11,005 (66.3%) |
Disability Status by Sex by Age in Long Beach
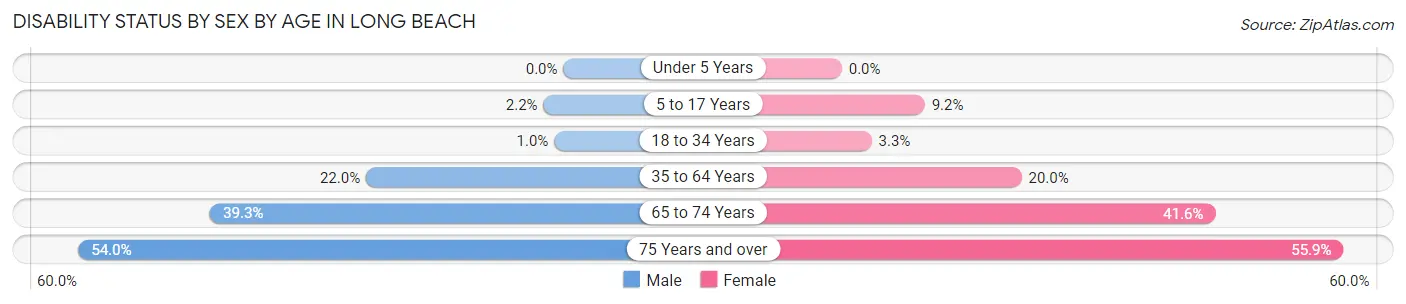
| Age Bracket | Male | Female |
| Under 5 Years | 0 (0.0%) | 0 (0.0%) |
| 5 to 17 Years | 37 (2.2%) | 134 (9.2%) |
| 18 to 34 Years | 15 (1.0%) | 49 (3.3%) |
| 35 to 64 Years | 610 (22.0%) | 641 (20.0%) |
| 65 to 74 Years | 376 (39.3%) | 755 (41.6%) |
| 75 Years and over | 168 (54.0%) | 339 (55.8%) |
Disability Class by Sex by Age in Long Beach
Disability Class: Hearing Difficulty
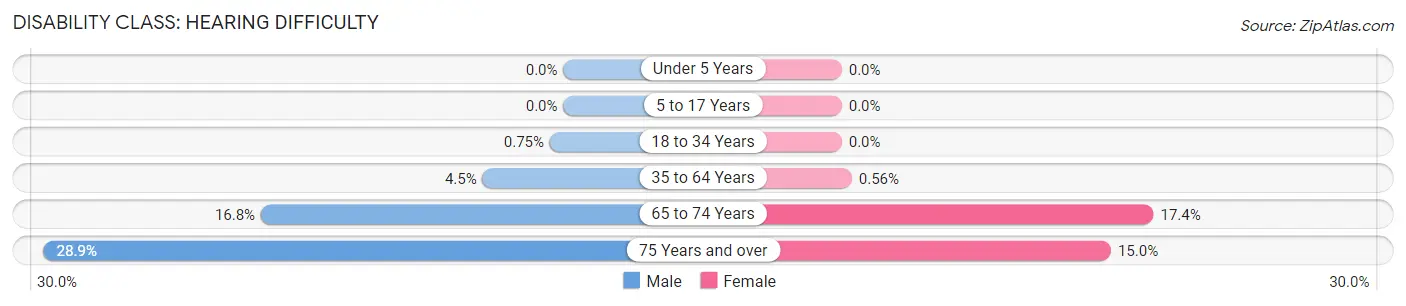
| Age Bracket | Male | Female |
| Under 5 Years | 0 (0.0%) | 0 (0.0%) |
| 5 to 17 Years | 0 (0.0%) | 0 (0.0%) |
| 18 to 34 Years | 11 (0.7%) | 0 (0.0%) |
| 35 to 64 Years | 125 (4.5%) | 18 (0.6%) |
| 65 to 74 Years | 161 (16.8%) | 315 (17.4%) |
| 75 Years and over | 90 (28.9%) | 91 (15.0%) |
Disability Class: Vision Difficulty
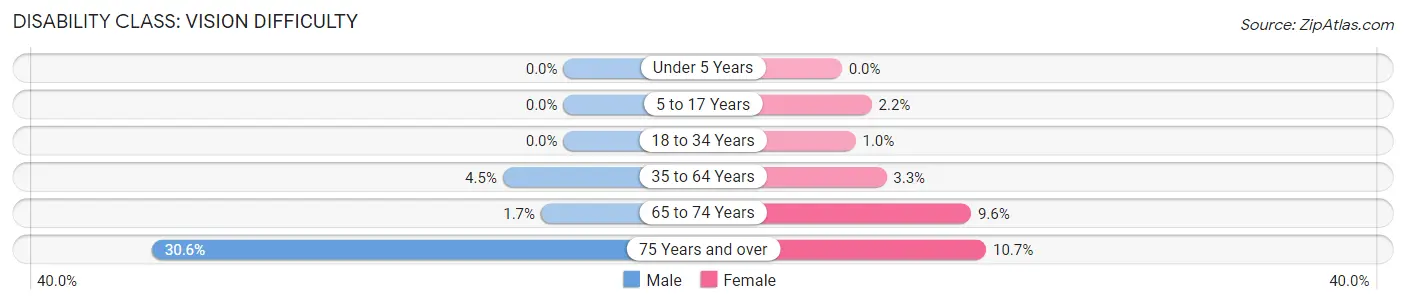
| Age Bracket | Male | Female |
| Under 5 Years | 0 (0.0%) | 0 (0.0%) |
| 5 to 17 Years | 0 (0.0%) | 32 (2.2%) |
| 18 to 34 Years | 0 (0.0%) | 15 (1.0%) |
| 35 to 64 Years | 125 (4.5%) | 106 (3.3%) |
| 65 to 74 Years | 16 (1.7%) | 174 (9.6%) |
| 75 Years and over | 95 (30.5%) | 65 (10.7%) |
Disability Class: Cognitive Difficulty
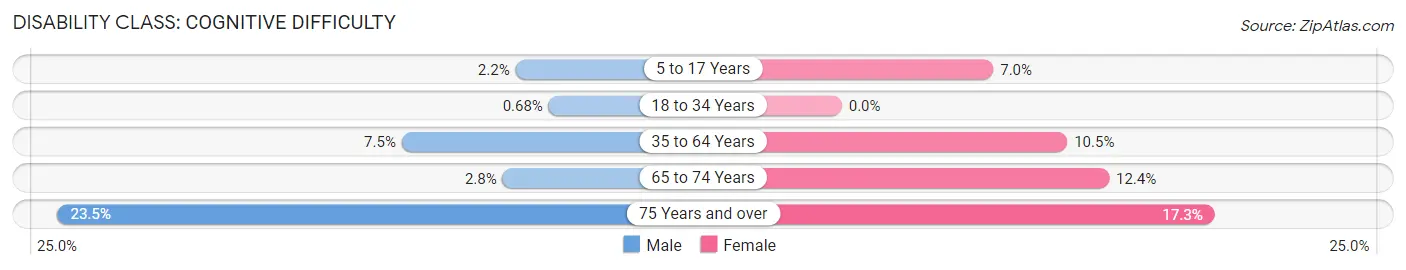
| Age Bracket | Male | Female |
| 5 to 17 Years | 37 (2.2%) | 102 (7.0%) |
| 18 to 34 Years | 10 (0.7%) | 0 (0.0%) |
| 35 to 64 Years | 208 (7.5%) | 335 (10.5%) |
| 65 to 74 Years | 27 (2.8%) | 225 (12.4%) |
| 75 Years and over | 73 (23.5%) | 105 (17.3%) |
Disability Class: Ambulatory Difficulty
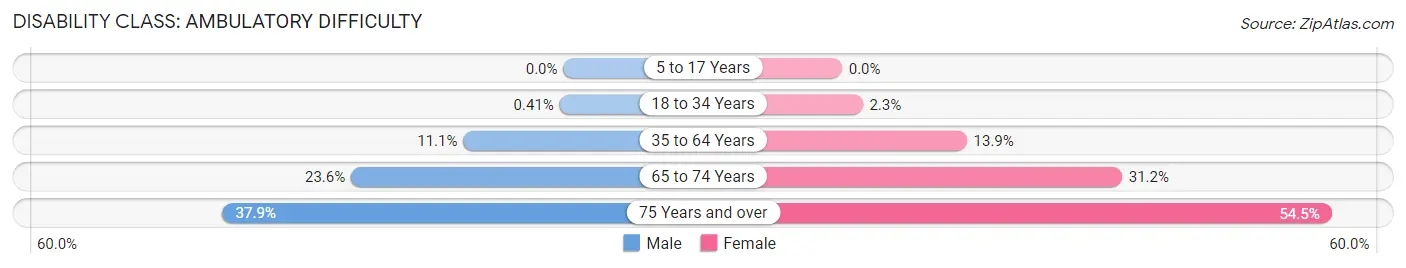
| Age Bracket | Male | Female |
| 5 to 17 Years | 0 (0.0%) | 0 (0.0%) |
| 18 to 34 Years | 6 (0.4%) | 34 (2.3%) |
| 35 to 64 Years | 309 (11.1%) | 445 (13.9%) |
| 65 to 74 Years | 226 (23.6%) | 566 (31.2%) |
| 75 Years and over | 118 (37.9%) | 331 (54.5%) |
Disability Class: Self-Care Difficulty
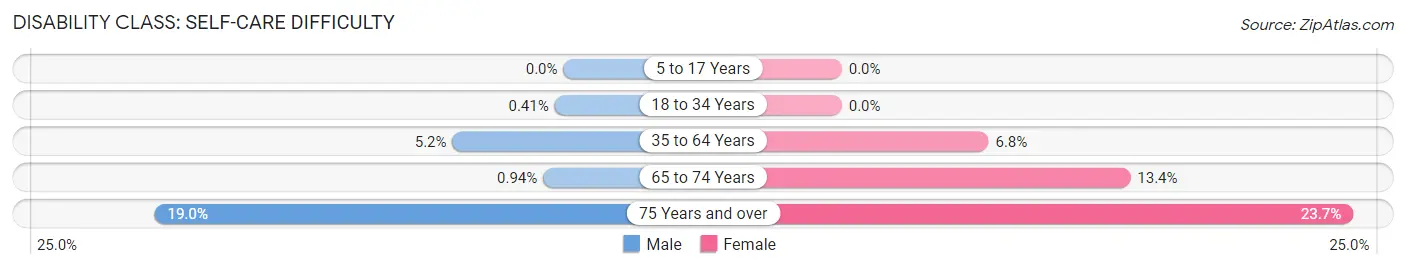
| Age Bracket | Male | Female |
| 5 to 17 Years | 0 (0.0%) | 0 (0.0%) |
| 18 to 34 Years | 6 (0.4%) | 0 (0.0%) |
| 35 to 64 Years | 143 (5.1%) | 218 (6.8%) |
| 65 to 74 Years | 9 (0.9%) | 243 (13.4%) |
| 75 Years and over | 59 (19.0%) | 144 (23.7%) |
Technology Access in Long Beach
Computing Device Access in Long Beach
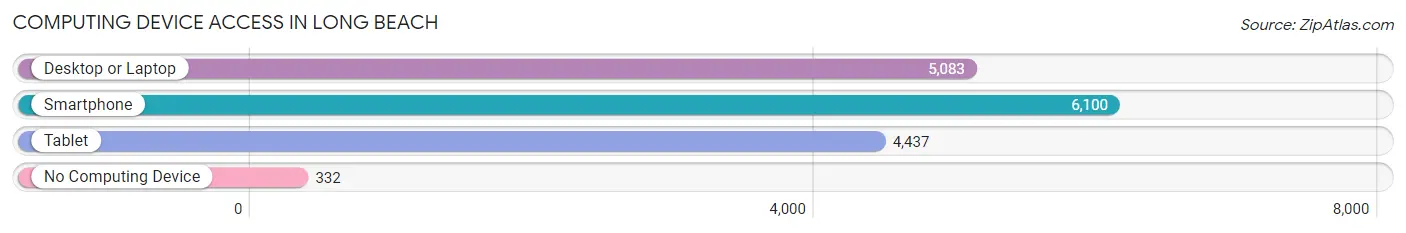
| Device Type | # Households | % Households |
| Desktop or Laptop | 5,083 | 75.8% |
| Smartphone | 6,100 | 90.9% |
| Tablet | 4,437 | 66.1% |
| No Computing Device | 332 | 5.0% |
| Total | 6,708 | 100.0% |
Internet Access in Long Beach
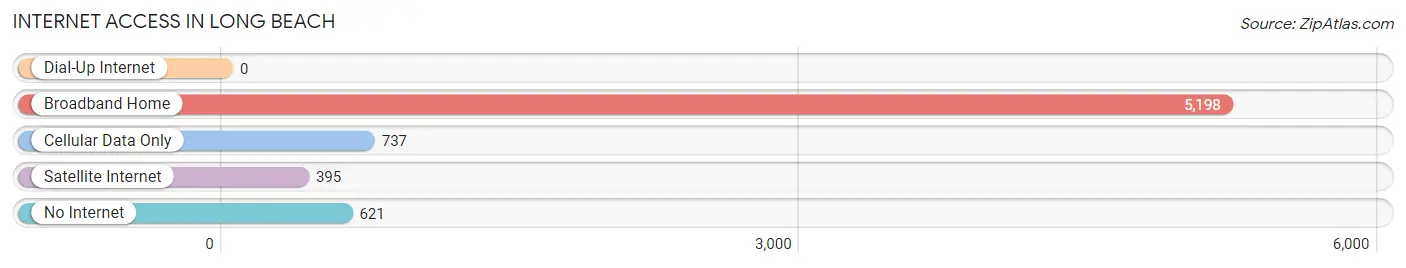
| Internet Type | # Households | % Households |
| Dial-Up Internet | 0 | 0.0% |
| Broadband Home | 5,198 | 77.5% |
| Cellular Data Only | 737 | 11.0% |
| Satellite Internet | 395 | 5.9% |
| No Internet | 621 | 9.3% |
| Total | 6,708 | 100.0% |
Long Beach Summary
Long Beach, Mississippi is a city located in Harrison County, Mississippi, United States. It is part of the Gulfport–Biloxi Metropolitan Statistical Area. The population was 14,792 at the 2010 census, up from 12,640 at the 2000 census.
History
Long Beach was founded in 1888 by William H. Hardy, a railroad contractor. The city was named after the long beach that stretches along the Gulf of Mexico. The city was incorporated in 1898.
Geography
Long Beach is located in southeastern Harrison County at 30°21'25" North, 89°7'25" West (30.356944, -89.123611). It is bordered to the north by the city of Gulfport and to the south by the city of Pass Christian.
According to the United States Census Bureau, the city has a total area of 16.2 square miles (41.9 km2), of which 15.9 square miles (41.2 km2) is land and 0.3 square miles (0.7 km2) (1.86%) is water.
Economy
Long Beach is a major tourist destination, with many attractions and activities for visitors. The city is home to several casinos, including the Island View Casino Resort, the Palace Casino Resort, and the Silver Slipper Casino. The city also has a variety of shopping and dining options, as well as a number of parks and beaches.
The city is also home to several major employers, including the Naval Construction Battalion Center, the Gulfport-Biloxi International Airport, and the Mississippi Power Company.
Demographics
As of the census of 2000, there were 12,640 people, 5,093 households, and 3,541 families residing in the city. The population density was 794.3 people per square mile (306.9/km2). There were 5,541 housing units at an average density of 347.3 per square mile (134.2/km2). The racial makeup of the city was 87.45% White, 8.90% African American, 0.30% Native American, 0.90% Asian, 0.02% Pacific Islander, 1.17% from other races, and 1.26% from two or more races. Hispanic or Latino of any race were 2.45% of the population.
There were 5,093 households, out of which 28.7% had children under the age of 18 living with them, 51.2% were married couples living together, 12.3% had a female householder with no husband present, and 33.2% were non-families. 28.2% of all households were made up of individuals, and 11.2% had someone living alone who was 65 years of age or older. The average household size was 2.41 and the average family size was 2.94.
In the city, the population was spread out, with 23.7% under the age of 18, 8.2% from 18 to 24, 28.2% from 25 to 44, 24.2% from 45 to 64, and 15.7% who were 65 years of age or older. The median age was 38 years. For every 100 females, there were 92.2 males. For every 100 females age 18 and over, there were 88.7 males.
The median income for a household in the city was $37,845, and the median income for a family was $45,945. Males had a median income of $35,945 versus $22,917 for females. The per capita income for the city was $20,945. About 8.2% of families and 10.7% of the population were below the poverty line, including 14.2% of those under age 18 and 8.2% of those age 65 or over.
Common Questions
What is Per Capita Income in Long Beach?
Per Capita income in Long Beach is $34,677.
What is the Median Family Income in Long Beach?
Median Family Income in Long Beach is $84,284.
What is the Median Household income in Long Beach?
Median Household Income in Long Beach is $66,573.
What is Income or Wage Gap in Long Beach?
Income or Wage Gap in Long Beach is 3.1%.
Women in Long Beach earn 96.9 cents for every dollar earned by a man.
What is Inequality or Gini Index in Long Beach?
Inequality or Gini Index in Long Beach is 0.45.
What is the Total Population of Long Beach?
Total Population of Long Beach is 16,809.
What is the Total Male Population of Long Beach?
Total Male Population of Long Beach is 7,831.
What is the Total Female Population of Long Beach?
Total Female Population of Long Beach is 8,978.
What is the Ratio of Males per 100 Females in Long Beach?
There are 87.22 Males per 100 Females in Long Beach.
What is the Ratio of Females per 100 Males in Long Beach?
There are 114.65 Females per 100 Males in Long Beach.
What is the Median Population Age in Long Beach?
Median Population Age in Long Beach is 41.0 Years.
What is the Average Family Size in Long Beach
Average Family Size in Long Beach is 3.2 People.
What is the Average Household Size in Long Beach
Average Household Size in Long Beach is 2.5 People.
How Large is the Labor Force in Long Beach?
There are 8,104 People in the Labor Forcein in Long Beach.
What is the Percentage of People in the Labor Force in Long Beach?
60.4% of People are in the Labor Force in Long Beach.
What is the Unemployment Rate in Long Beach?
Unemployment Rate in Long Beach is 5.8%.