Gloster, MS Map & Demographics
Gloster Map
Gloster Overview
$15,331
PER CAPITA INCOME
$36,813
AVG FAMILY INCOME
$22,131
AVG HOUSEHOLD INCOME
45.4%
WAGE / INCOME GAP [ % ]
54.6¢/ $1
WAGE / INCOME GAP [ $ ]
0.49
INEQUALITY / GINI INDEX
1,319
TOTAL POPULATION
667
MALE POPULATION
652
FEMALE POPULATION
102.30
MALES / 100 FEMALES
97.75
FEMALES / 100 MALES
42.5
MEDIAN AGE
3.5
AVG FAMILY SIZE
2.6
AVG HOUSEHOLD SIZE
402
LABOR FORCE [ PEOPLE ]
42.0%
PERCENT IN LABOR FORCE
10.9%
UNEMPLOYMENT RATE
Gloster Zip Codes
Income in Gloster
Income Overview in Gloster
Per Capita Income in Gloster is $15,331, while median incomes of families and households are $36,813 and $22,131 respectively.
| Characteristic | Number | Measure |
| Per Capita Income | 1,319 | $15,331 |
| Median Family Income | 299 | $36,813 |
| Mean Family Income | 299 | $42,467 |
| Median Household Income | 513 | $22,131 |
| Mean Household Income | 513 | $37,269 |
| Income Deficit | 299 | $0 |
| Wage / Income Gap (%) | 1,319 | 45.35% |
| Wage / Income Gap ($) | 1,319 | 54.65¢ per $1 |
| Gini / Inequality Index | 1,319 | 0.49 |
Earnings by Sex in Gloster
Average Earnings in Gloster are $26,365, $46,488 for men and $25,404 for women, a difference of 45.4%.
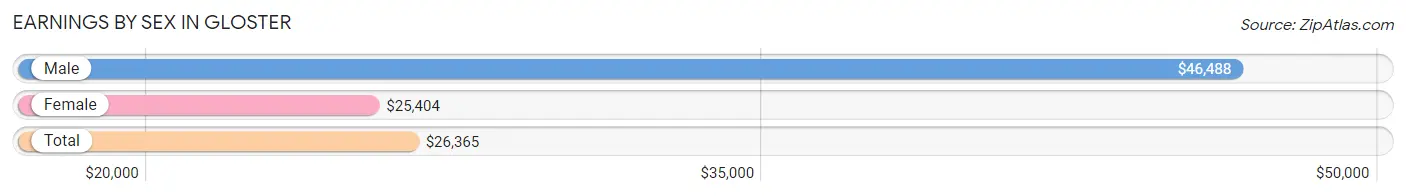
| Sex | Number | Average Earnings |
| Male | 206 (55.2%) | $46,488 |
| Female | 167 (44.8%) | $25,404 |
| Total | 373 (100.0%) | $26,365 |
Earnings by Sex by Income Bracket in Gloster
The most common earnings brackets in Gloster are $55,000 to $64,999 for men (52 | 25.2%) and $25,000 to $29,999 for women (65 | 38.9%).
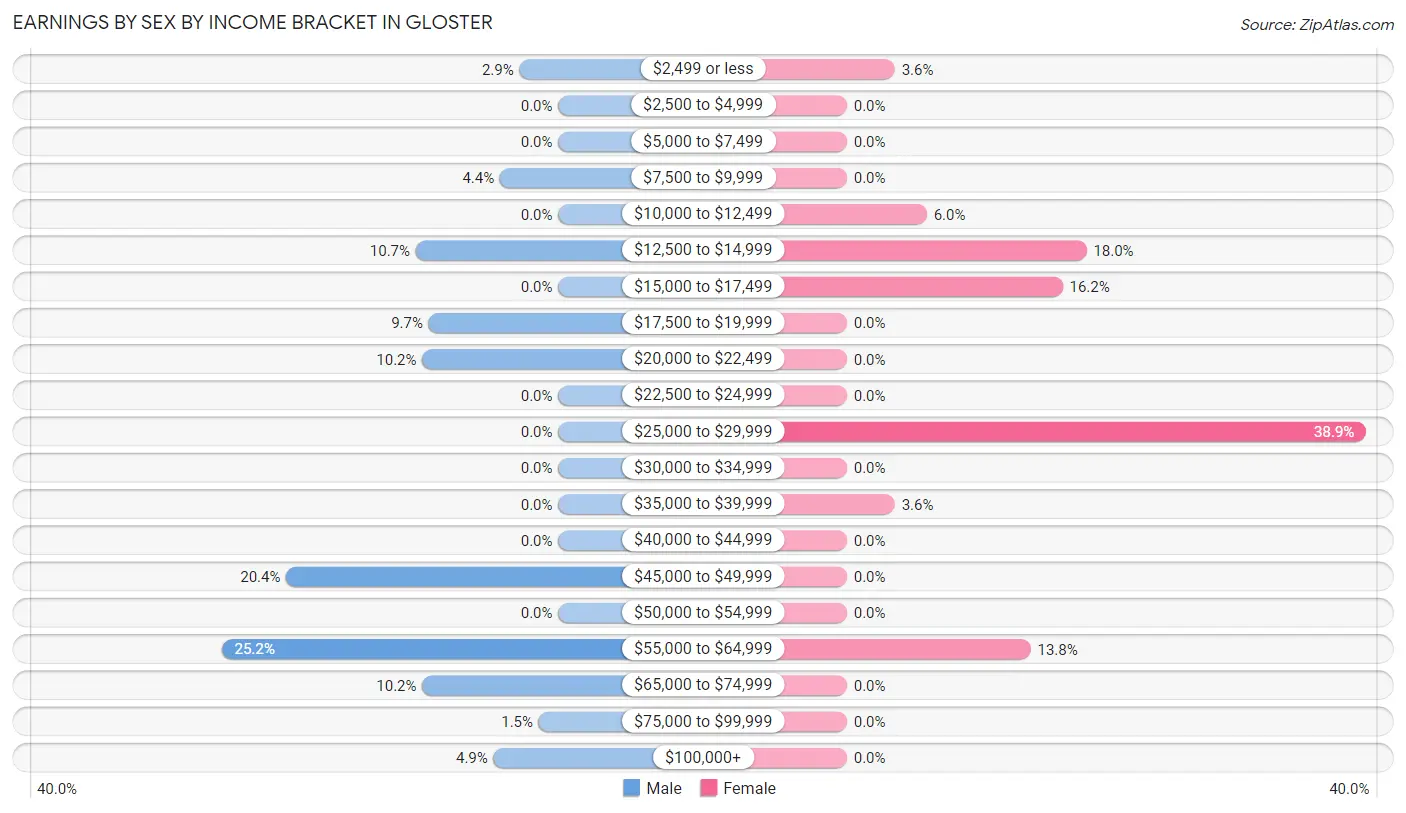
| Income | Male | Female |
| $2,499 or less | 6 (2.9%) | 6 (3.6%) |
| $2,500 to $4,999 | 0 (0.0%) | 0 (0.0%) |
| $5,000 to $7,499 | 0 (0.0%) | 0 (0.0%) |
| $7,500 to $9,999 | 9 (4.4%) | 0 (0.0%) |
| $10,000 to $12,499 | 0 (0.0%) | 10 (6.0%) |
| $12,500 to $14,999 | 22 (10.7%) | 30 (18.0%) |
| $15,000 to $17,499 | 0 (0.0%) | 27 (16.2%) |
| $17,500 to $19,999 | 20 (9.7%) | 0 (0.0%) |
| $20,000 to $22,499 | 21 (10.2%) | 0 (0.0%) |
| $22,500 to $24,999 | 0 (0.0%) | 0 (0.0%) |
| $25,000 to $29,999 | 0 (0.0%) | 65 (38.9%) |
| $30,000 to $34,999 | 0 (0.0%) | 0 (0.0%) |
| $35,000 to $39,999 | 0 (0.0%) | 6 (3.6%) |
| $40,000 to $44,999 | 0 (0.0%) | 0 (0.0%) |
| $45,000 to $49,999 | 42 (20.4%) | 0 (0.0%) |
| $50,000 to $54,999 | 0 (0.0%) | 0 (0.0%) |
| $55,000 to $64,999 | 52 (25.2%) | 23 (13.8%) |
| $65,000 to $74,999 | 21 (10.2%) | 0 (0.0%) |
| $75,000 to $99,999 | 3 (1.5%) | 0 (0.0%) |
| $100,000+ | 10 (4.9%) | 0 (0.0%) |
| Total | 206 (100.0%) | 167 (100.0%) |
Earnings by Sex by Educational Attainment in Gloster
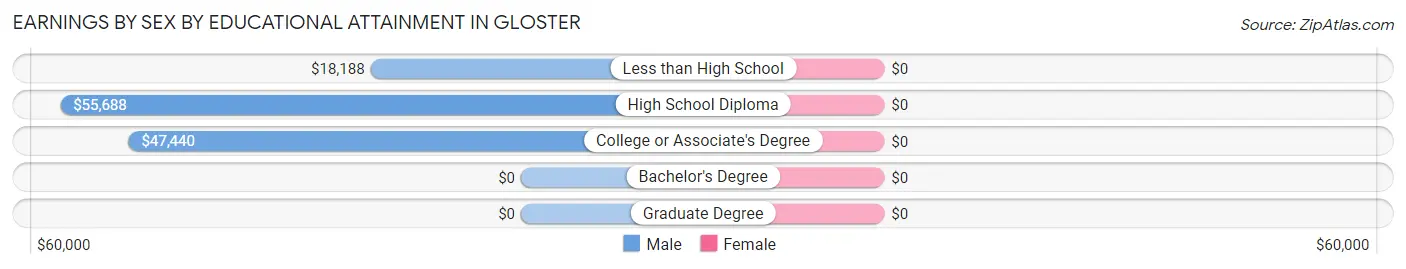
| Educational Attainment | Male Income | Female Income |
| Less than High School | $18,188 | $0 |
| High School Diploma | $55,688 | $0 |
| College or Associate's Degree | $47,440 | $0 |
| Bachelor's Degree | - | - |
| Graduate Degree | - | - |
| Total | $46,756 | $25,808 |
Family Income in Gloster
Family Income Brackets in Gloster
According to the Gloster family income data, there are 116 families falling into the $50,000 to $74,999 income range, which is the most common income bracket and makes up 38.8% of all families.
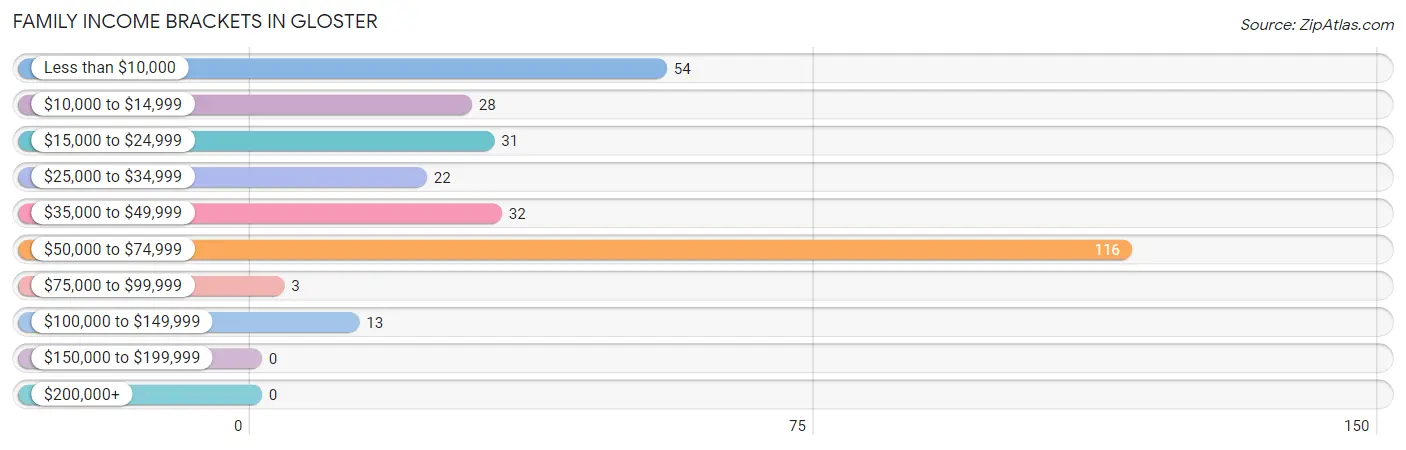
| Income Bracket | # Families | % Families |
| Less than $10,000 | 54 | 18.1% |
| $10,000 to $14,999 | 28 | 9.4% |
| $15,000 to $24,999 | 31 | 10.4% |
| $25,000 to $34,999 | 22 | 7.4% |
| $35,000 to $49,999 | 32 | 10.7% |
| $50,000 to $74,999 | 116 | 38.8% |
| $75,000 to $99,999 | 3 | 1.0% |
| $100,000 to $149,999 | 13 | 4.3% |
| $150,000 to $199,999 | 0 | 0.0% |
| $200,000+ | 0 | 0.0% |
Family Income by Famaliy Size in Gloster
2-person families (138 | 46.2%) account for the highest median family income in Gloster with $53,409 per family, while 2-person families (138 | 46.2%) have the highest median income of $26,704 per family member.
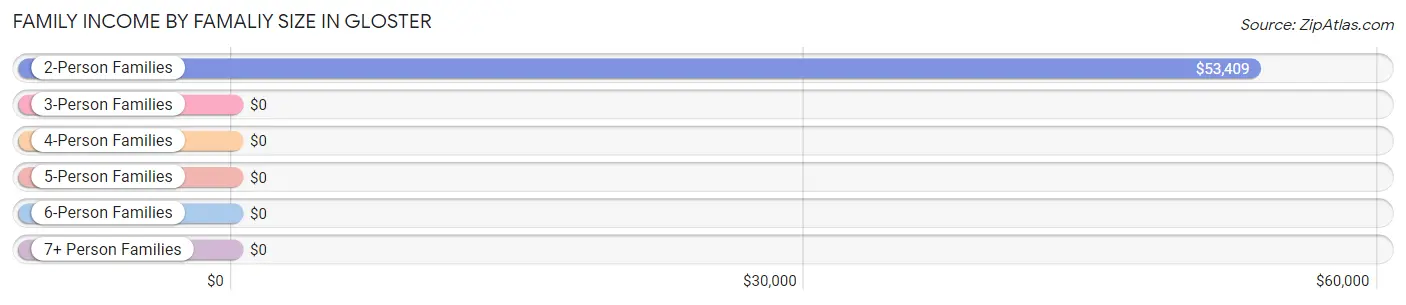
| Income Bracket | # Families | Median Income |
| 2-Person Families | 138 (46.2%) | $53,409 |
| 3-Person Families | 96 (32.1%) | $0 |
| 4-Person Families | 52 (17.4%) | $0 |
| 5-Person Families | 5 (1.7%) | $0 |
| 6-Person Families | 8 (2.7%) | $0 |
| 7+ Person Families | 0 (0.0%) | $0 |
| Total | 299 (100.0%) | $36,813 |
Family Income by Number of Earners in Gloster
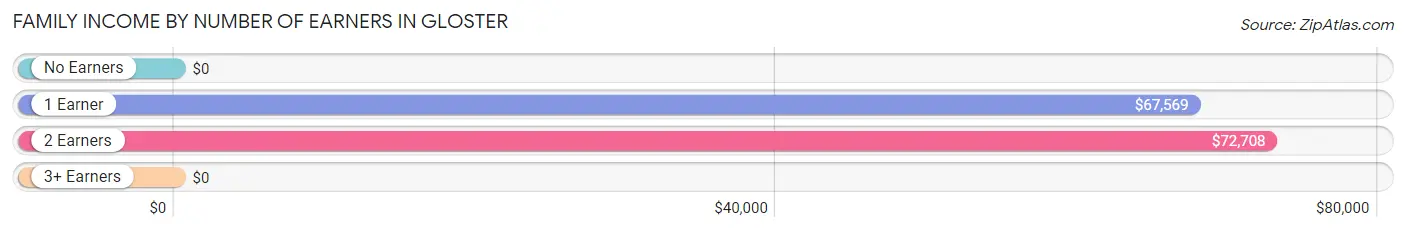
| Number of Earners | # Families | Median Income |
| No Earners | 133 (44.5%) | $0 |
| 1 Earner | 76 (25.4%) | $67,569 |
| 2 Earners | 77 (25.8%) | $72,708 |
| 3+ Earners | 13 (4.3%) | $0 |
| Total | 299 (100.0%) | $36,813 |
Household Income in Gloster
Household Income Brackets in Gloster
With 142 households falling in the category, the $50,000 to $74,999 income range is the most frequent in Gloster, accounting for 27.7% of all households.
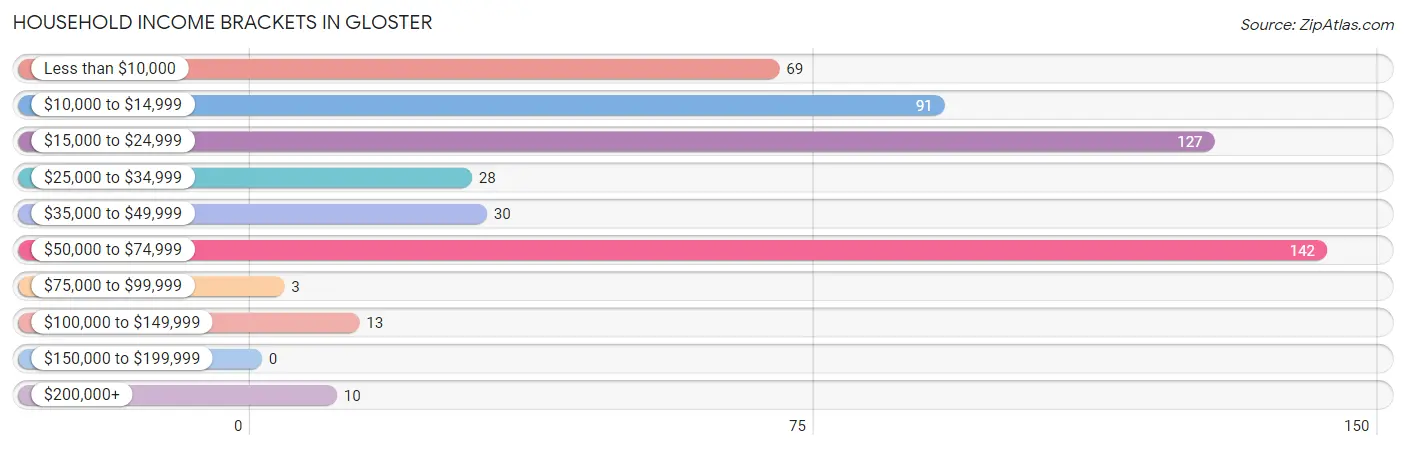
| Income Bracket | # Households | % Households |
| Less than $10,000 | 69 | 13.5% |
| $10,000 to $14,999 | 91 | 17.7% |
| $15,000 to $24,999 | 127 | 24.8% |
| $25,000 to $34,999 | 28 | 5.5% |
| $35,000 to $49,999 | 30 | 5.8% |
| $50,000 to $74,999 | 142 | 27.7% |
| $75,000 to $99,999 | 3 | 0.6% |
| $100,000 to $149,999 | 13 | 2.5% |
| $150,000 to $199,999 | 0 | 0.0% |
| $200,000+ | 10 | 1.9% |
Household Income by Householder Age in Gloster
The median household income in Gloster is $22,131, with the highest median household income of $21,429 found in the 65+ years age bracket for the primary householder. A total of 106 households (20.7%) fall into this category. Meanwhile, the 15 to 24 years age bracket for the primary householder has the lowest median household income of $0, with 40 households (7.8%) in this group.
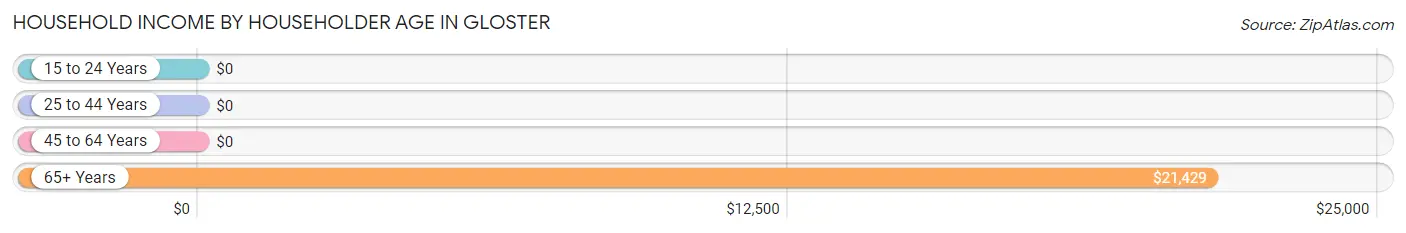
| Income Bracket | # Households | Median Income |
| 15 to 24 Years | 40 (7.8%) | $0 |
| 25 to 44 Years | 143 (27.9%) | $0 |
| 45 to 64 Years | 224 (43.7%) | $0 |
| 65+ Years | 106 (20.7%) | $21,429 |
| Total | 513 (100.0%) | $22,131 |
Poverty in Gloster
Income Below Poverty by Sex and Age in Gloster
With 38.5% poverty level for males and 38.7% for females among the residents of Gloster, 5 year old males and under 5 year old females are the most vulnerable to poverty, with 23 males (100.0%) and 24 females (100.0%) in their respective age groups living below the poverty level.
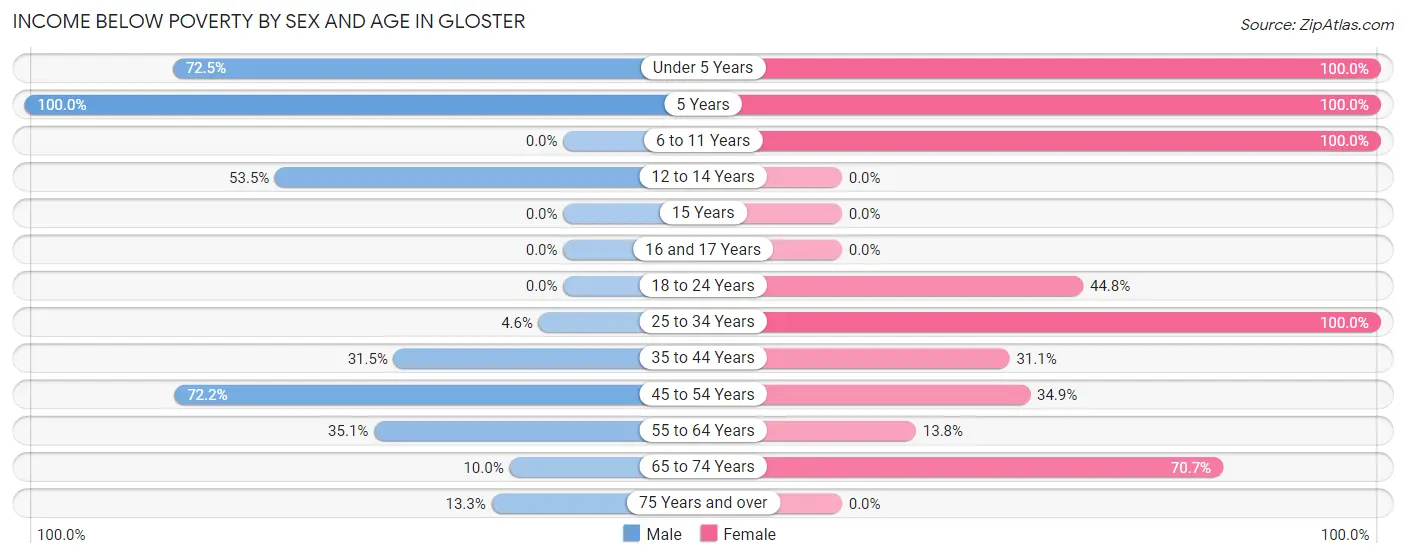
| Age Bracket | Male | Female |
| Under 5 Years | 58 (72.5%) | 24 (100.0%) |
| 5 Years | 23 (100.0%) | 5 (100.0%) |
| 6 to 11 Years | 0 (0.0%) | 51 (100.0%) |
| 12 to 14 Years | 23 (53.5%) | 0 (0.0%) |
| 15 Years | 0 (0.0%) | 0 (0.0%) |
| 16 and 17 Years | 0 (0.0%) | 0 (0.0%) |
| 18 to 24 Years | 0 (0.0%) | 30 (44.8%) |
| 25 to 34 Years | 4 (4.5%) | 40 (100.0%) |
| 35 to 44 Years | 17 (31.5%) | 33 (31.1%) |
| 45 to 54 Years | 65 (72.2%) | 29 (34.9%) |
| 55 to 64 Years | 59 (35.1%) | 11 (13.8%) |
| 65 to 74 Years | 4 (10.0%) | 29 (70.7%) |
| 75 Years and over | 4 (13.3%) | 0 (0.0%) |
| Total | 257 (38.5%) | 252 (38.7%) |
Income Above Poverty by Sex and Age in Gloster
According to the poverty statistics in Gloster, males aged 6 to 11 years and females aged 12 to 14 years are the age groups that are most secure financially, with 100.0% of males and 100.0% of females in these age groups living above the poverty line.
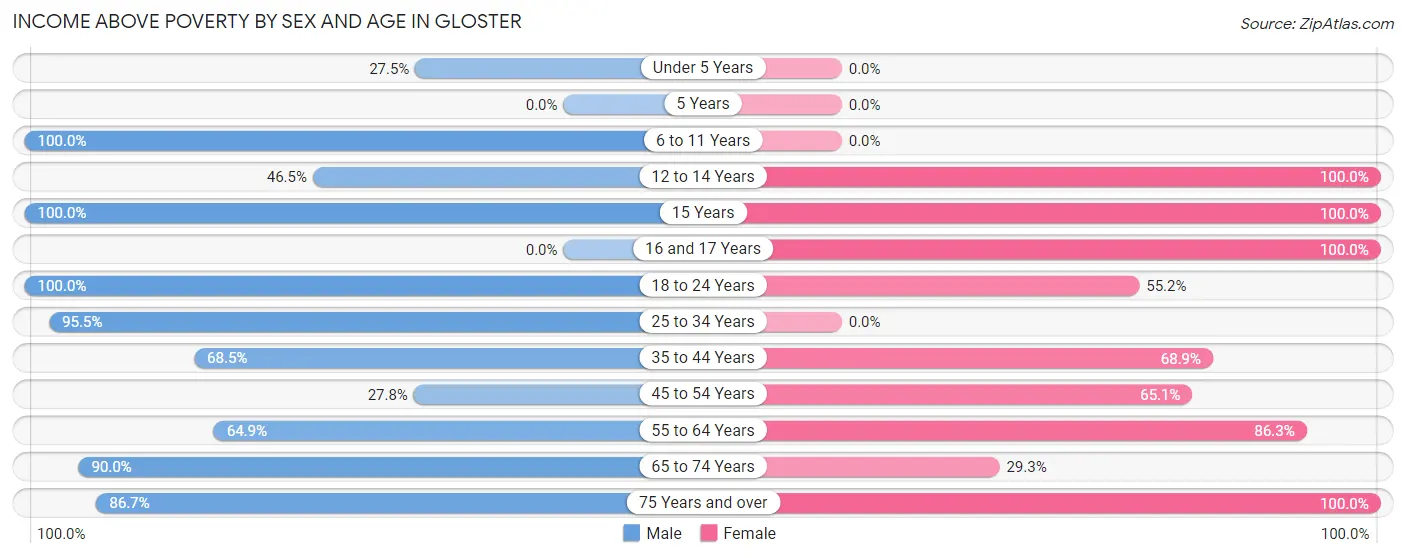
| Age Bracket | Male | Female |
| Under 5 Years | 22 (27.5%) | 0 (0.0%) |
| 5 Years | 0 (0.0%) | 0 (0.0%) |
| 6 to 11 Years | 8 (100.0%) | 0 (0.0%) |
| 12 to 14 Years | 20 (46.5%) | 89 (100.0%) |
| 15 Years | 24 (100.0%) | 14 (100.0%) |
| 16 and 17 Years | 0 (0.0%) | 6 (100.0%) |
| 18 to 24 Years | 19 (100.0%) | 37 (55.2%) |
| 25 to 34 Years | 84 (95.5%) | 0 (0.0%) |
| 35 to 44 Years | 37 (68.5%) | 73 (68.9%) |
| 45 to 54 Years | 25 (27.8%) | 54 (65.1%) |
| 55 to 64 Years | 109 (64.9%) | 69 (86.3%) |
| 65 to 74 Years | 36 (90.0%) | 12 (29.3%) |
| 75 Years and over | 26 (86.7%) | 46 (100.0%) |
| Total | 410 (61.5%) | 400 (61.4%) |
Income Below Poverty Among Married-Couple Families in Gloster
The poverty statistics for married-couple families in Gloster show that 2.2% or 4 of the total 180 families live below the poverty line. Families with 1 or 2 children have the highest poverty rate of 5.2%, comprising of 4 families. On the other hand, families with no children have the lowest poverty rate of 0.0%, which includes 0 families.
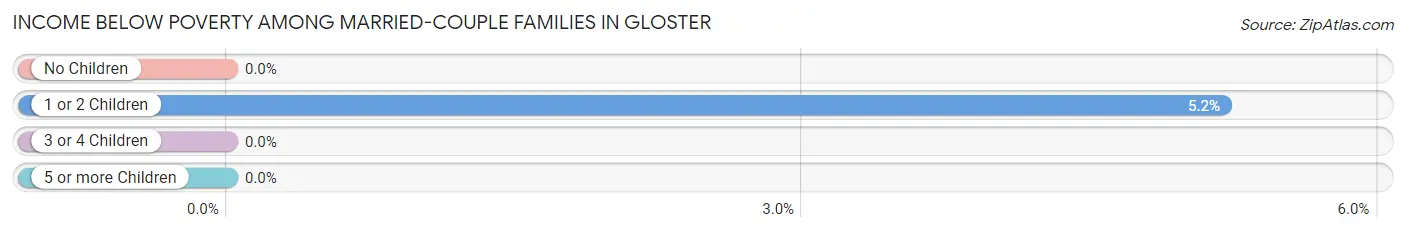
| Children | Above Poverty | Below Poverty |
| No Children | 103 (100.0%) | 0 (0.0%) |
| 1 or 2 Children | 73 (94.8%) | 4 (5.2%) |
| 3 or 4 Children | 0 (0.0%) | 0 (0.0%) |
| 5 or more Children | 0 (0.0%) | 0 (0.0%) |
| Total | 176 (97.8%) | 4 (2.2%) |
Income Below Poverty Among Single-Parent Households in Gloster
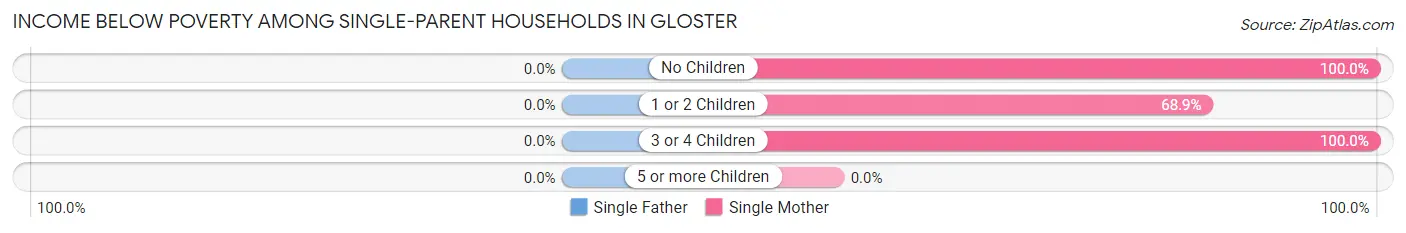
| Children | Single Father | Single Mother |
| No Children | 0 (0.0%) | 29 (100.0%) |
| 1 or 2 Children | 0 (0.0%) | 42 (68.9%) |
| 3 or 4 Children | 0 (0.0%) | 18 (100.0%) |
| 5 or more Children | 0 (0.0%) | 0 (0.0%) |
| Total | 0 (0.0%) | 89 (82.4%) |
Income Below Poverty Among Married-Couple vs Single-Parent Households in Gloster
The poverty data for Gloster shows that 4 of the married-couple family households (2.2%) and 89 of the single-parent households (74.8%) are living below the poverty level. Within the married-couple family households, those with 1 or 2 children have the highest poverty rate, with 4 households (5.2%) falling below the poverty line. Among the single-parent households, those with 3 or 4 children have the highest poverty rate, with 18 household (100.0%) living below poverty.
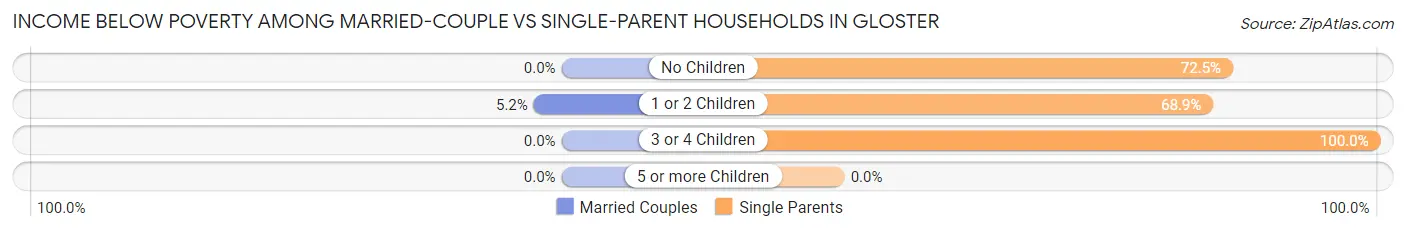
| Children | Married-Couple Families | Single-Parent Households |
| No Children | 0 (0.0%) | 29 (72.5%) |
| 1 or 2 Children | 4 (5.2%) | 42 (68.9%) |
| 3 or 4 Children | 0 (0.0%) | 18 (100.0%) |
| 5 or more Children | 0 (0.0%) | 0 (0.0%) |
| Total | 4 (2.2%) | 89 (74.8%) |
Race in Gloster
The most populous races in Gloster are Black / African American (999 | 75.7%), White / Caucasian (305 | 23.1%), and Hispanic or Latino (7 | 0.5%).
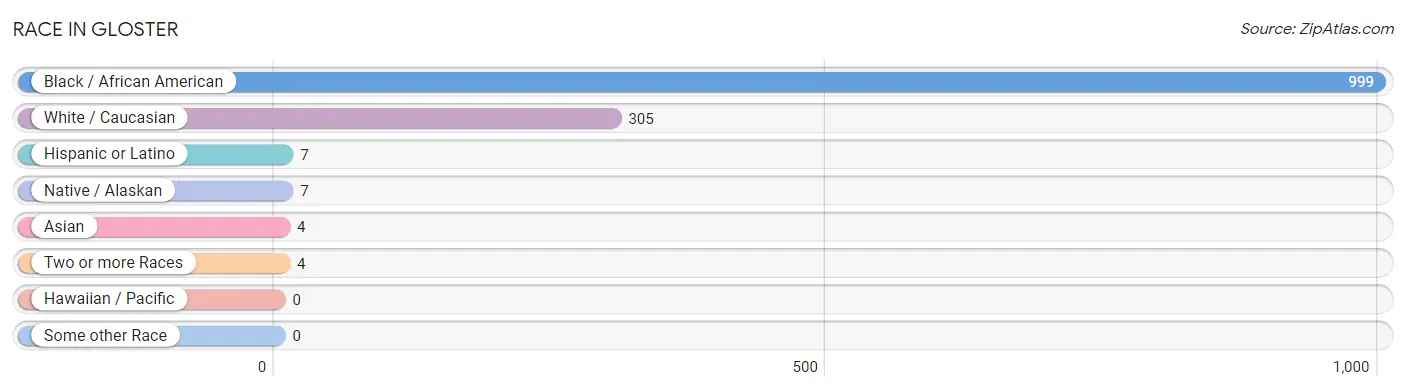
| Race | # Population | % Population |
| Asian | 4 | 0.3% |
| Black / African American | 999 | 75.7% |
| Hawaiian / Pacific | 0 | 0.0% |
| Hispanic or Latino | 7 | 0.5% |
| Native / Alaskan | 7 | 0.5% |
| White / Caucasian | 305 | 23.1% |
| Two or more Races | 4 | 0.3% |
| Some other Race | 0 | 0.0% |
| Total | 1,319 | 100.0% |
Ancestry in Gloster
The most populous ancestries reported in Gloster are Irish (75 | 5.7%), American (43 | 3.3%), French (42 | 3.2%), Scotch-Irish (26 | 2.0%), and German (20 | 1.5%), together accounting for 15.6% of all Gloster residents.
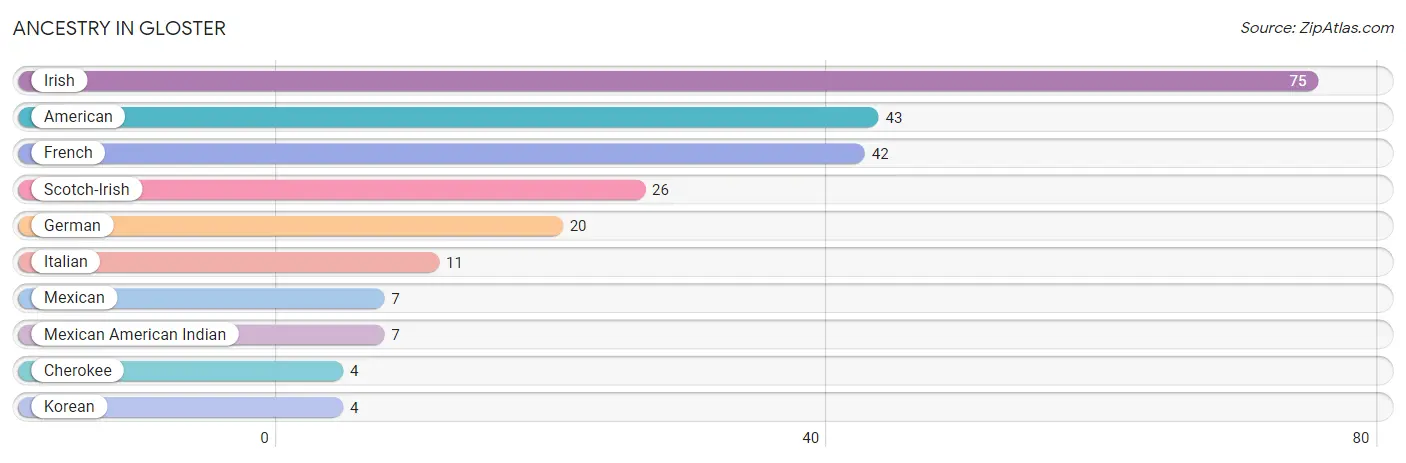
| Ancestry | # Population | % Population |
| American | 43 | 3.3% |
| Cherokee | 4 | 0.3% |
| French | 42 | 3.2% |
| German | 20 | 1.5% |
| Irish | 75 | 5.7% |
| Italian | 11 | 0.8% |
| Korean | 4 | 0.3% |
| Mexican | 7 | 0.5% |
| Mexican American Indian | 7 | 0.5% |
| Scotch-Irish | 26 | 2.0% | View All 10 Rows |
Immigrants in Gloster
The most numerous immigrant groups reported in Gloster came from Central America (7 | 0.5%), Latin America (7 | 0.5%), Mexico (7 | 0.5%), Asia (4 | 0.3%), and Philippines (4 | 0.3%), together accounting for 2.2% of all Gloster residents.
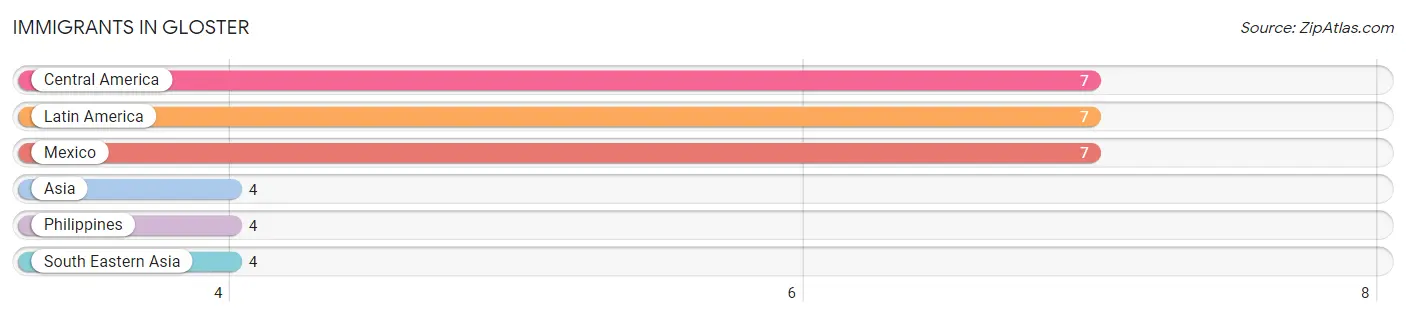
| Immigration Origin | # Population | % Population |
| Asia | 4 | 0.3% |
| Central America | 7 | 0.5% |
| Latin America | 7 | 0.5% |
| Mexico | 7 | 0.5% |
| Philippines | 4 | 0.3% |
| South Eastern Asia | 4 | 0.3% | View All 6 Rows |
Sex and Age in Gloster
Sex and Age in Gloster
The most populous age groups in Gloster are 55 to 59 Years (138 | 20.7%) for men and 10 to 14 Years (114 | 17.5%) for women.
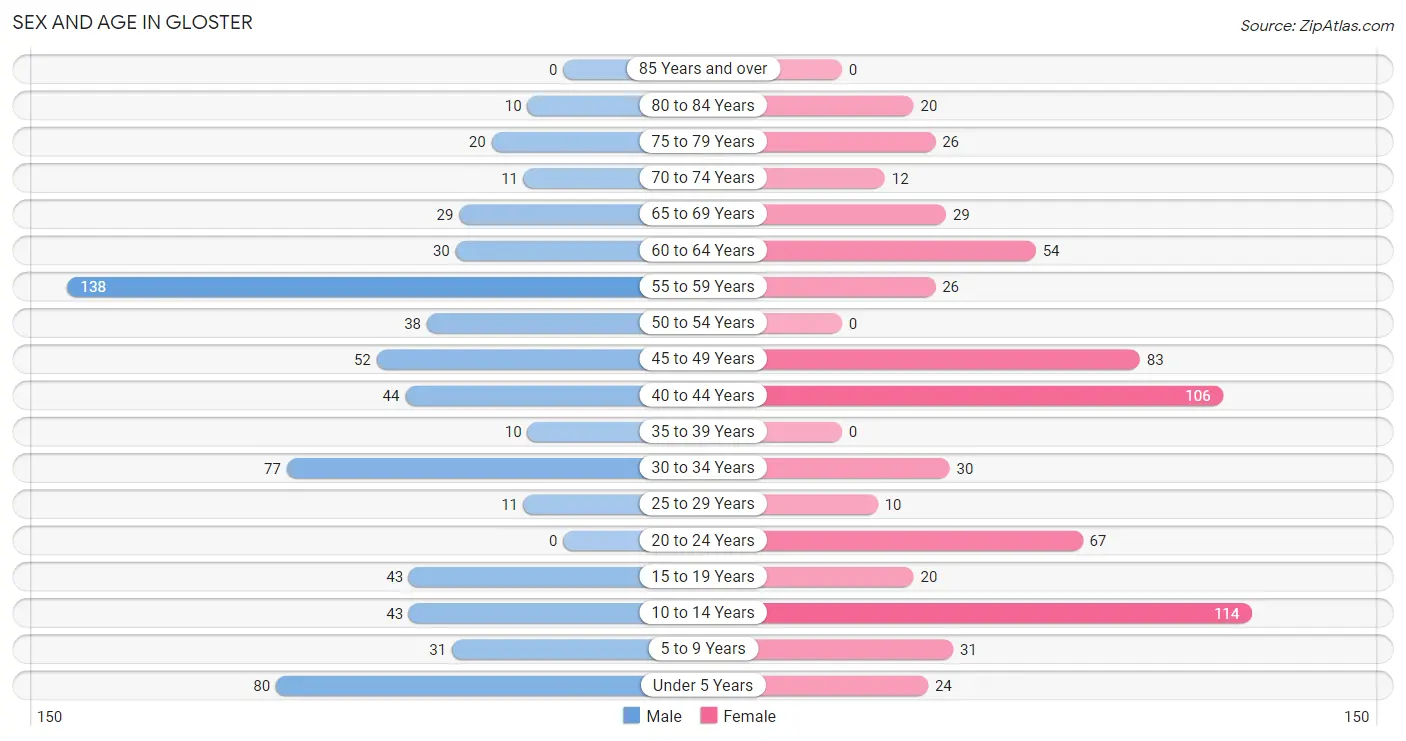
| Age Bracket | Male | Female |
| Under 5 Years | 80 (12.0%) | 24 (3.7%) |
| 5 to 9 Years | 31 (4.6%) | 31 (4.8%) |
| 10 to 14 Years | 43 (6.5%) | 114 (17.5%) |
| 15 to 19 Years | 43 (6.5%) | 20 (3.1%) |
| 20 to 24 Years | 0 (0.0%) | 67 (10.3%) |
| 25 to 29 Years | 11 (1.7%) | 10 (1.5%) |
| 30 to 34 Years | 77 (11.5%) | 30 (4.6%) |
| 35 to 39 Years | 10 (1.5%) | 0 (0.0%) |
| 40 to 44 Years | 44 (6.6%) | 106 (16.3%) |
| 45 to 49 Years | 52 (7.8%) | 83 (12.7%) |
| 50 to 54 Years | 38 (5.7%) | 0 (0.0%) |
| 55 to 59 Years | 138 (20.7%) | 26 (4.0%) |
| 60 to 64 Years | 30 (4.5%) | 54 (8.3%) |
| 65 to 69 Years | 29 (4.3%) | 29 (4.4%) |
| 70 to 74 Years | 11 (1.7%) | 12 (1.8%) |
| 75 to 79 Years | 20 (3.0%) | 26 (4.0%) |
| 80 to 84 Years | 10 (1.5%) | 20 (3.1%) |
| 85 Years and over | 0 (0.0%) | 0 (0.0%) |
| Total | 667 (100.0%) | 652 (100.0%) |
Families and Households in Gloster
Median Family Size in Gloster
The median family size in Gloster is 3.53 persons per family, with single female/mother families (108 | 36.1%) accounting for the largest median family size of 4.32 persons per family. On the other hand, single male/father families (11 | 3.7%) represent the smallest median family size with 2.82 persons per family.
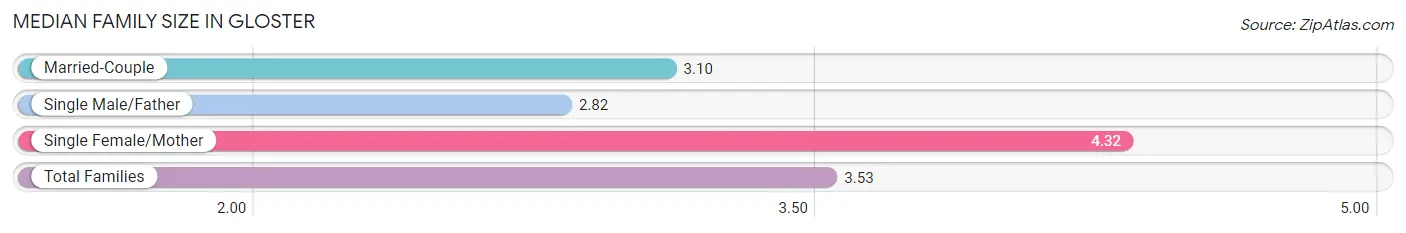
| Family Type | # Families | Family Size |
| Married-Couple | 180 (60.2%) | 3.10 |
| Single Male/Father | 11 (3.7%) | 2.82 |
| Single Female/Mother | 108 (36.1%) | 4.32 |
| Total Families | 299 (100.0%) | 3.53 |
Median Household Size in Gloster
The median household size in Gloster is 2.57 persons per household, with single female/mother households (108 | 21.0%) accounting for the largest median household size of 4.35 persons per household. non-family households (214 | 41.7%) represent the smallest median household size with 1.20 persons per household.
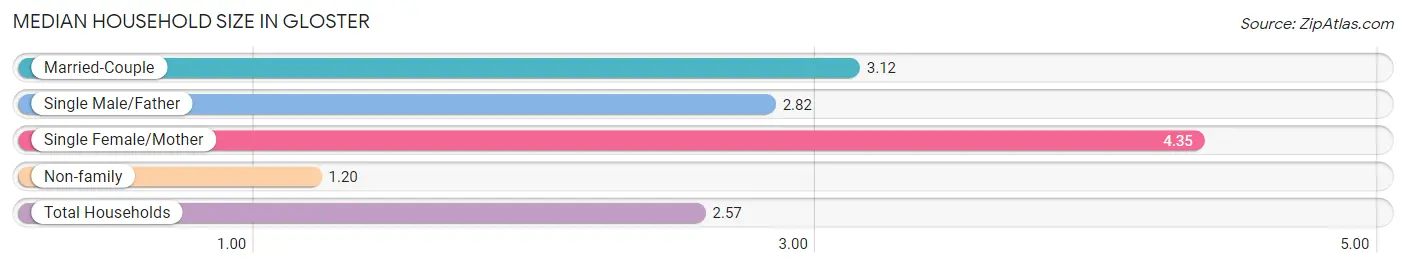
| Household Type | # Households | Household Size |
| Married-Couple | 180 (35.1%) | 3.12 |
| Single Male/Father | 11 (2.1%) | 2.82 |
| Single Female/Mother | 108 (21.0%) | 4.35 |
| Non-family | 214 (41.7%) | 1.20 |
| Total Households | 513 (100.0%) | 2.57 |
Household Size by Marriage Status in Gloster
Out of a total of 513 households in Gloster, 299 (58.3%) are family households, while 214 (41.7%) are nonfamily households. The most numerous type of family households are 2-person households, comprising 134, and the most common type of nonfamily households are 1-person households, comprising 138.
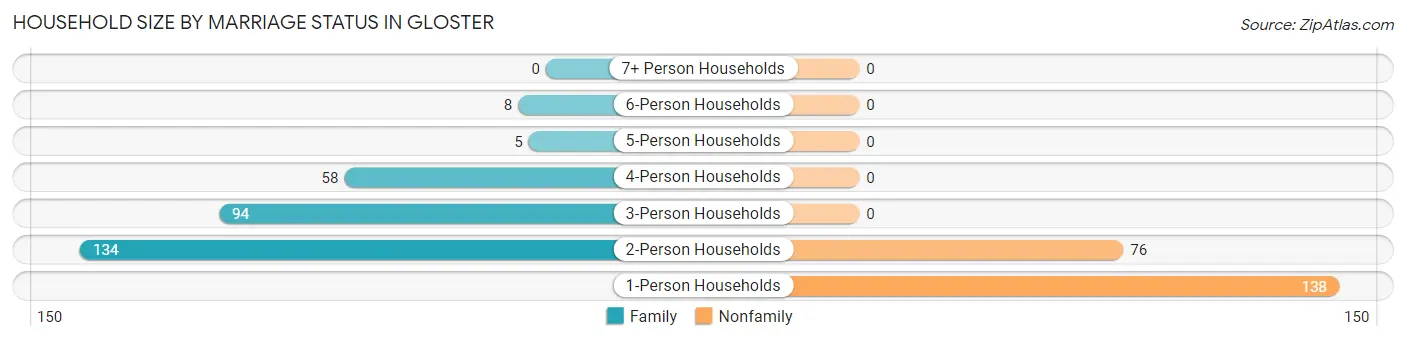
| Household Size | Family Households | Nonfamily Households |
| 1-Person Households | - | 138 (26.9%) |
| 2-Person Households | 134 (26.1%) | 76 (14.8%) |
| 3-Person Households | 94 (18.3%) | 0 (0.0%) |
| 4-Person Households | 58 (11.3%) | 0 (0.0%) |
| 5-Person Households | 5 (1.0%) | 0 (0.0%) |
| 6-Person Households | 8 (1.6%) | 0 (0.0%) |
| 7+ Person Households | 0 (0.0%) | 0 (0.0%) |
| Total | 299 (58.3%) | 214 (41.7%) |
Female Fertility in Gloster
Fertility by Age in Gloster
Average fertility rate in Gloster is 95.0 births per 1,000 women. Women in the age bracket of 20 to 34 years have the highest fertility rate with 280.0 births per 1,000 women. Women in the age bracket of 20 to 34 years acount for 100.0% of all women with births.
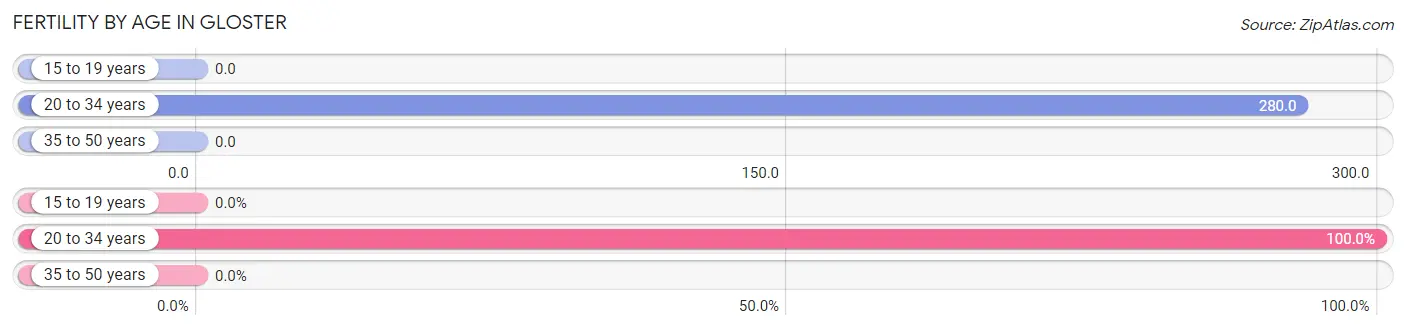
| Age Bracket | Women with Births | Births / 1,000 Women |
| 15 to 19 years | 0 (0.0%) | 0.0 |
| 20 to 34 years | 30 (100.0%) | 280.0 |
| 35 to 50 years | 0 (0.0%) | 0.0 |
| Total | 30 (100.0%) | 95.0 |
Fertility by Age by Marriage Status in Gloster
40.0% of women with births (30) in Gloster are married. The highest percentage of unmarried women with births falls into 20 to 34 years age bracket with 60.0% of them unmarried at the time of birth, while the lowest percentage of unmarried women with births belong to 20 to 34 years age bracket with 60.0% of them unmarried.
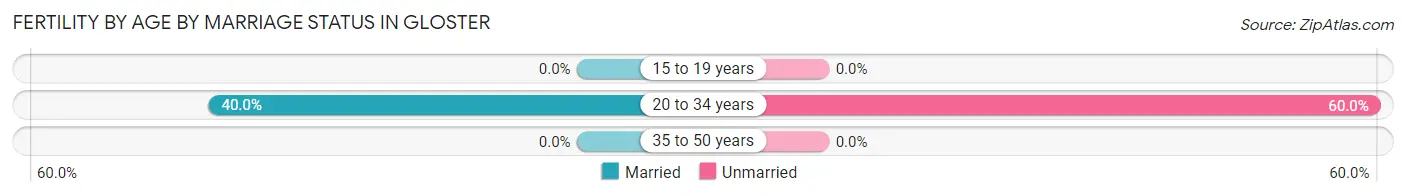
| Age Bracket | Married | Unmarried |
| 15 to 19 years | 0 (0.0%) | 0 (0.0%) |
| 20 to 34 years | 12 (40.0%) | 18 (60.0%) |
| 35 to 50 years | 0 (0.0%) | 0 (0.0%) |
| Total | 12 (40.0%) | 18 (60.0%) |
Fertility by Education in Gloster
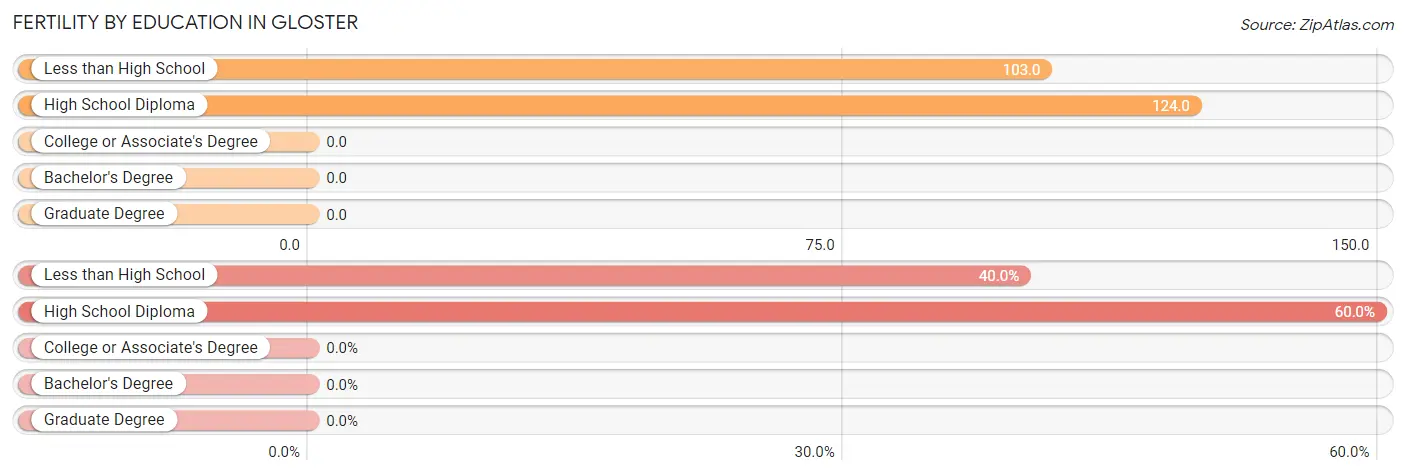
| Educational Attainment | Women with Births | Births / 1,000 Women |
| Less than High School | 12 (40.0%) | 103.0 |
| High School Diploma | 18 (60.0%) | 124.0 |
| College or Associate's Degree | 0 (0.0%) | 0.0 |
| Bachelor's Degree | 0 (0.0%) | 0.0 |
| Graduate Degree | 0 (0.0%) | 0.0 |
| Total | 30 (100.0%) | 95.0 |
Fertility by Education by Marriage Status in Gloster
60.0% of women with births in Gloster are unmarried. Women with the educational attainment of less than high school are most likely to be married with 100.0% of them married at childbirth, while women with the educational attainment of high school diploma are least likely to be married with 100.0% of them unmarried at childbirth.
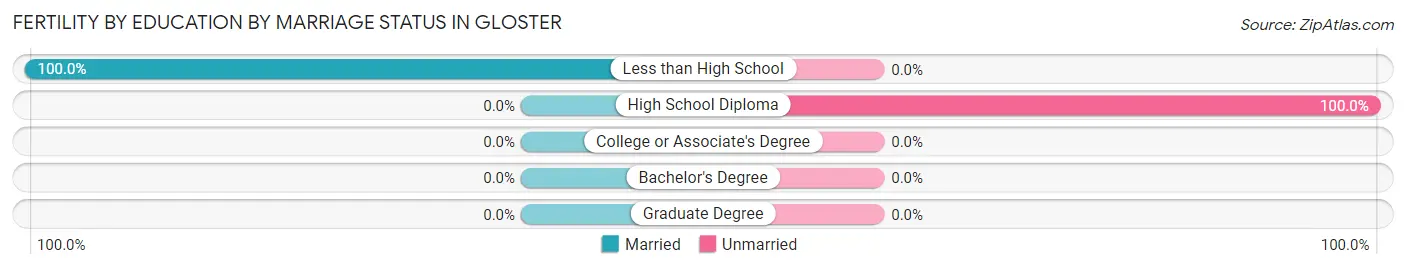
| Educational Attainment | Married | Unmarried |
| Less than High School | 12 (100.0%) | 0 (0.0%) |
| High School Diploma | 0 (0.0%) | 18 (100.0%) |
| College or Associate's Degree | 0 (0.0%) | 0 (0.0%) |
| Bachelor's Degree | 0 (0.0%) | 0 (0.0%) |
| Graduate Degree | 0 (0.0%) | 0 (0.0%) |
| Total | 12 (40.0%) | 18 (60.0%) |
Employment Characteristics in Gloster
Employment by Class of Employer in Gloster
Among the 338 employed individuals in Gloster, private company employees (210 | 62.1%), state government employees (96 | 28.4%), and self-employed (not incorporated) (11 | 3.3%) make up the most common classes of employment.
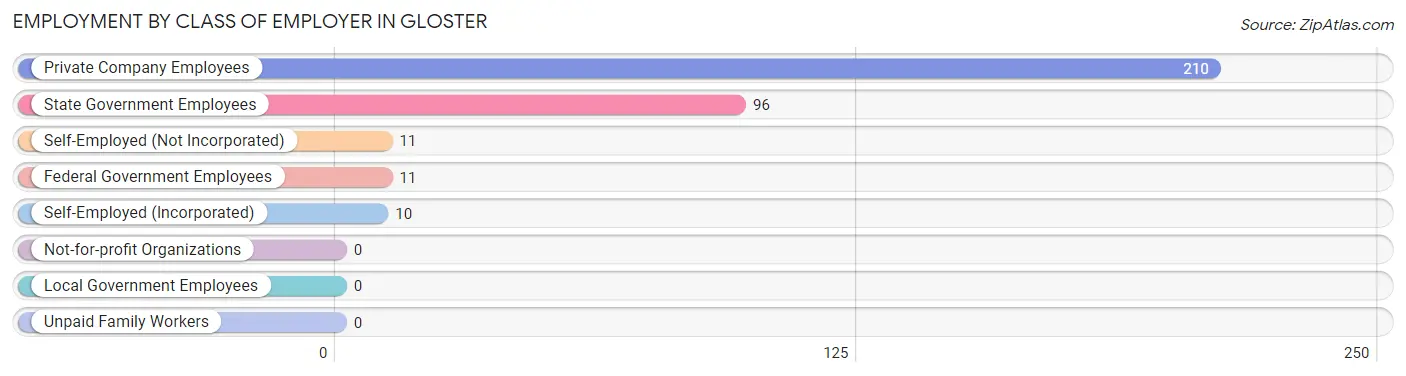
| Employer Class | # Employees | % Employees |
| Private Company Employees | 210 | 62.1% |
| Self-Employed (Incorporated) | 10 | 3.0% |
| Self-Employed (Not Incorporated) | 11 | 3.3% |
| Not-for-profit Organizations | 0 | 0.0% |
| Local Government Employees | 0 | 0.0% |
| State Government Employees | 96 | 28.4% |
| Federal Government Employees | 11 | 3.3% |
| Unpaid Family Workers | 0 | 0.0% |
| Total | 338 | 100.0% |
Employment Status by Age in Gloster
According to the labor force statistics for Gloster, out of the total population over 16 years of age (958), 42.0% or 402 individuals are in the labor force, with 10.9% or 44 of them unemployed. The age group with the highest labor force participation rate is 16 to 19 years, with 100.0% or 25 individuals in the labor force. Within the labor force, the 16 to 19 years age range has the highest percentage of unemployed individuals, with 64.0% or 16 of them being unemployed.
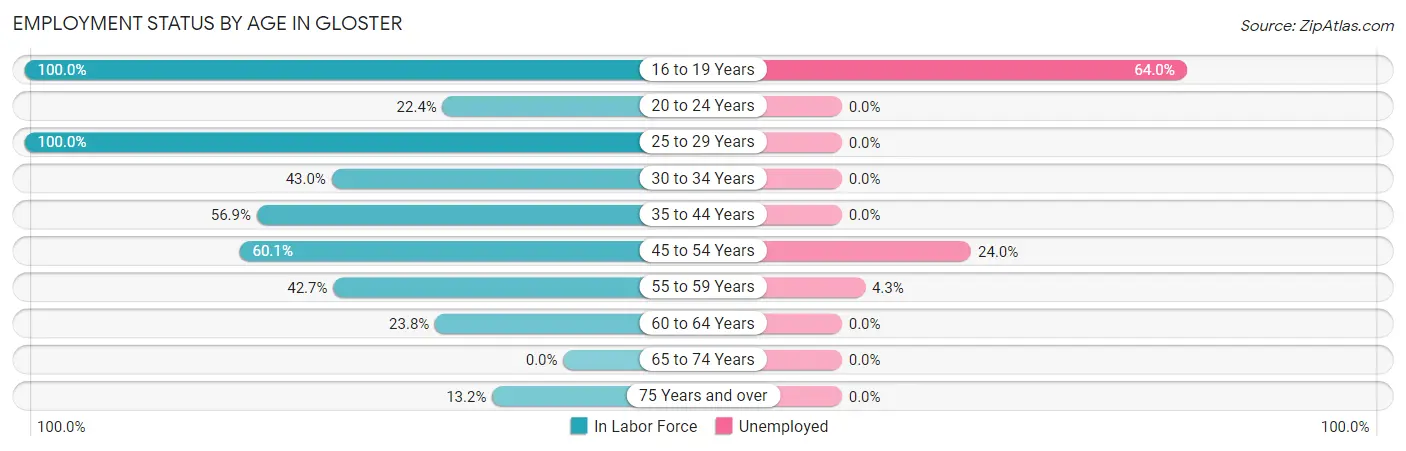
| Age Bracket | In Labor Force | Unemployed |
| 16 to 19 Years | 25 (100.0%) | 16 (64.0%) |
| 20 to 24 Years | 15 (22.4%) | 0 (0.0%) |
| 25 to 29 Years | 21 (100.0%) | 0 (0.0%) |
| 30 to 34 Years | 46 (43.0%) | 0 (0.0%) |
| 35 to 44 Years | 91 (56.9%) | 0 (0.0%) |
| 45 to 54 Years | 104 (60.1%) | 25 (24.0%) |
| 55 to 59 Years | 70 (42.7%) | 3 (4.3%) |
| 60 to 64 Years | 20 (23.8%) | 0 (0.0%) |
| 65 to 74 Years | 0 (0.0%) | 0 (0.0%) |
| 75 Years and over | 10 (13.2%) | 0 (0.0%) |
| Total | 402 (42.0%) | 44 (10.9%) |
Employment Status by Educational Attainment in Gloster
According to labor force statistics for Gloster, 49.6% of individuals (352) out of the total population between 25 and 64 years of age (709) are in the labor force, with 8.0% or 28 of them being unemployed. The group with the highest labor force participation rate are those with the educational attainment of bachelor's degree or higher, with 97.3% or 73 individuals in the labor force. Within the labor force, individuals with less than high school education have the highest percentage of unemployment, with 31.0% or 9 of them being unemployed.
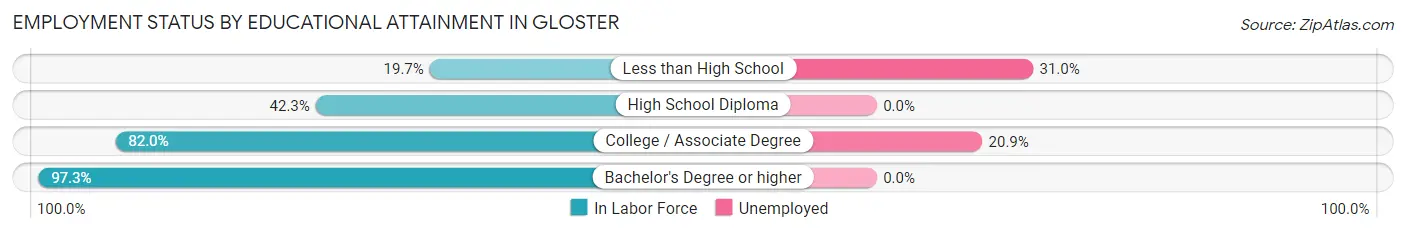
| Educational Attainment | In Labor Force | Unemployed |
| Less than High School | 29 (19.7%) | 46 (31.0%) |
| High School Diploma | 159 (42.3%) | 0 (0.0%) |
| College / Associate Degree | 91 (82.0%) | 23 (20.9%) |
| Bachelor's Degree or higher | 73 (97.3%) | 0 (0.0%) |
| Total | 352 (49.6%) | 57 (8.0%) |
Employment Occupations by Sex in Gloster
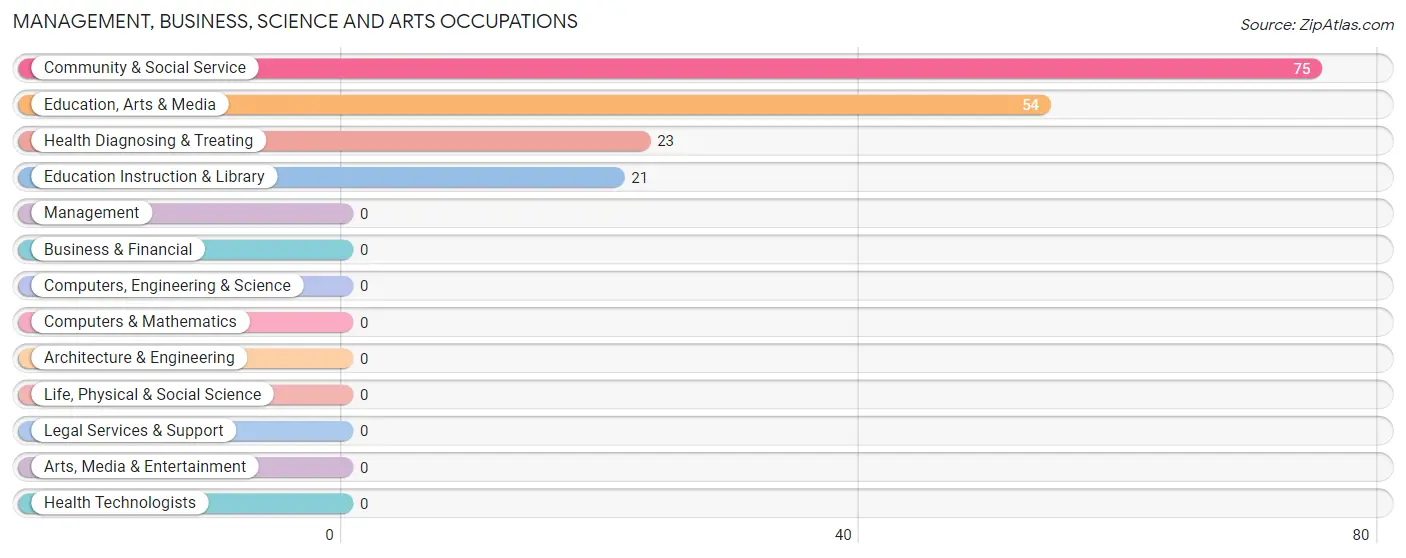
Management, Business, Science and Arts Occupations
The most common Management, Business, Science and Arts occupations in Gloster are Community & Social Service (75 | 20.9%), Education, Arts & Media (54 | 15.1%), Health Diagnosing & Treating (23 | 6.4%), and Education Instruction & Library (21 | 5.9%).
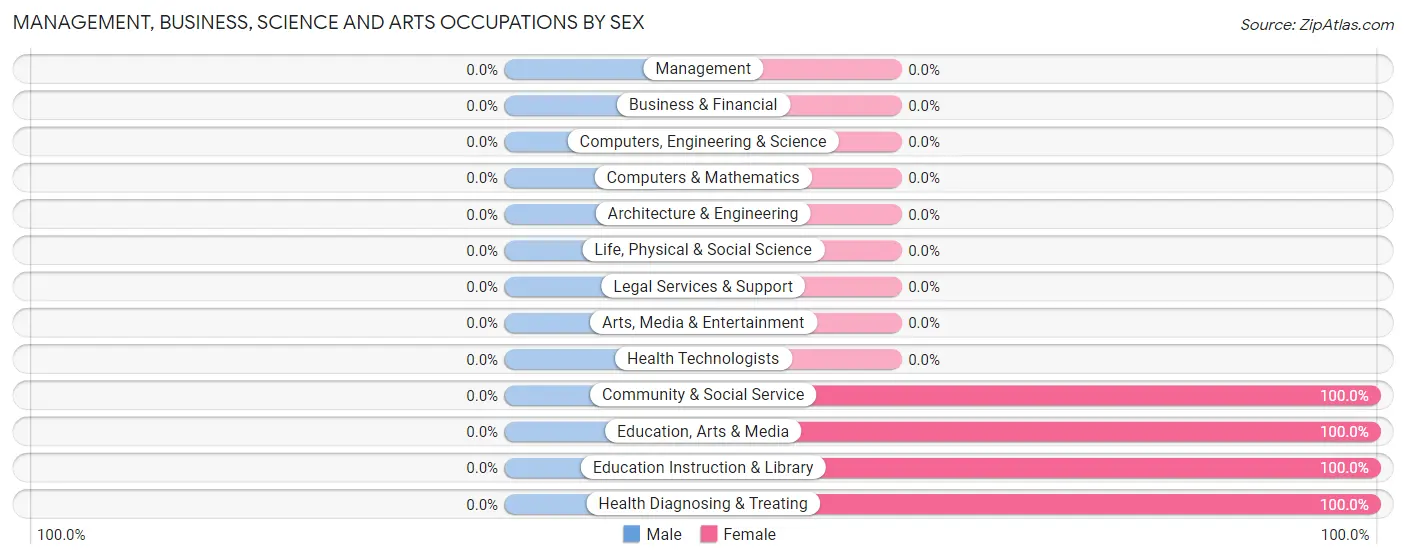
Management, Business, Science and Arts Occupations by Sex
| Occupation | Male | Female |
| Management | 0 (0.0%) | 0 (0.0%) |
| Business & Financial | 0 (0.0%) | 0 (0.0%) |
| Computers, Engineering & Science | 0 (0.0%) | 0 (0.0%) |
| Computers & Mathematics | 0 (0.0%) | 0 (0.0%) |
| Architecture & Engineering | 0 (0.0%) | 0 (0.0%) |
| Life, Physical & Social Science | 0 (0.0%) | 0 (0.0%) |
| Community & Social Service | 0 (0.0%) | 75 (100.0%) |
| Education, Arts & Media | 0 (0.0%) | 54 (100.0%) |
| Legal Services & Support | 0 (0.0%) | 0 (0.0%) |
| Education Instruction & Library | 0 (0.0%) | 21 (100.0%) |
| Arts, Media & Entertainment | 0 (0.0%) | 0 (0.0%) |
| Health Diagnosing & Treating | 0 (0.0%) | 23 (100.0%) |
| Health Technologists | 0 (0.0%) | 0 (0.0%) |
| Total (Category) | 0 (0.0%) | 98 (100.0%) |
| Total (Overall) | 197 (55.0%) | 161 (45.0%) |
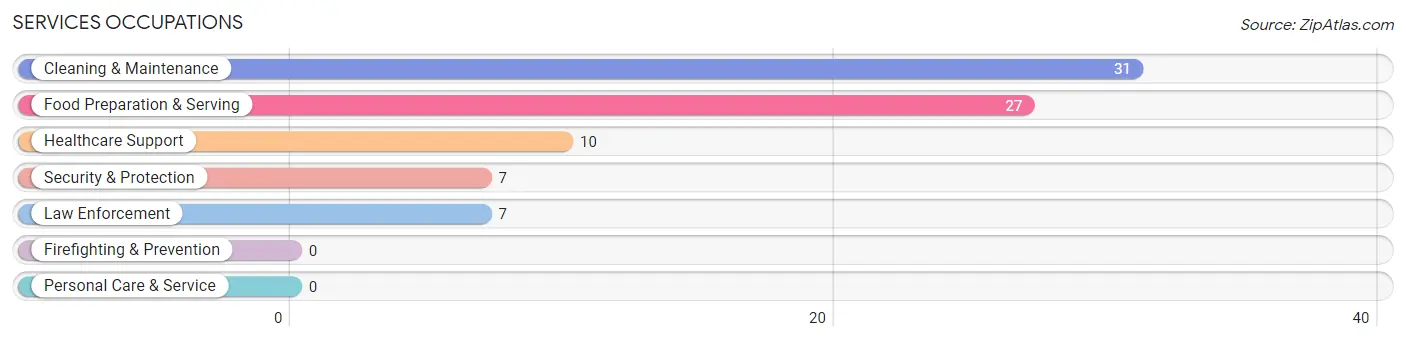
Services Occupations
The most common Services occupations in Gloster are Cleaning & Maintenance (31 | 8.7%), Food Preparation & Serving (27 | 7.5%), Healthcare Support (10 | 2.8%), Security & Protection (7 | 2.0%), and Law Enforcement (7 | 2.0%).
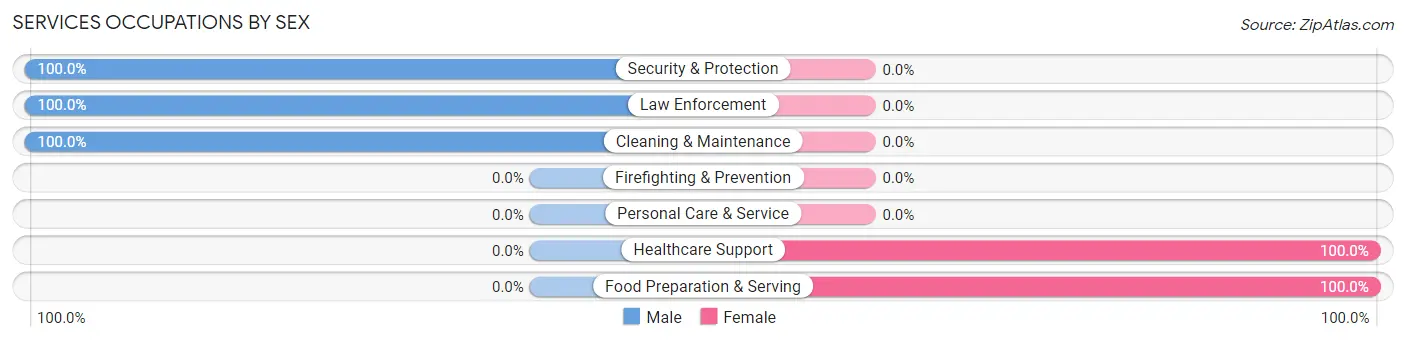
Services Occupations by Sex
Within the Services occupations in Gloster, the most male-oriented occupations are Security & Protection (100.0%), Law Enforcement (100.0%), and Cleaning & Maintenance (100.0%), while the most female-oriented occupations are Healthcare Support (100.0%), and Food Preparation & Serving (100.0%).
| Occupation | Male | Female |
| Healthcare Support | 0 (0.0%) | 10 (100.0%) |
| Security & Protection | 7 (100.0%) | 0 (0.0%) |
| Firefighting & Prevention | 0 (0.0%) | 0 (0.0%) |
| Law Enforcement | 7 (100.0%) | 0 (0.0%) |
| Food Preparation & Serving | 0 (0.0%) | 27 (100.0%) |
| Cleaning & Maintenance | 31 (100.0%) | 0 (0.0%) |
| Personal Care & Service | 0 (0.0%) | 0 (0.0%) |
| Total (Category) | 38 (50.7%) | 37 (49.3%) |
| Total (Overall) | 197 (55.0%) | 161 (45.0%) |
Sales and Office Occupations
The most common Sales and Office occupations in Gloster are Office & Administration (26 | 7.3%), and Sales & Related (25 | 7.0%).
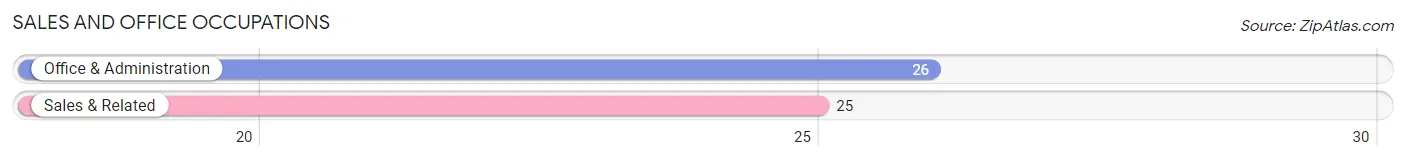
Sales and Office Occupations by Sex

| Occupation | Male | Female |
| Sales & Related | 25 (100.0%) | 0 (0.0%) |
| Office & Administration | 0 (0.0%) | 26 (100.0%) |
| Total (Category) | 25 (49.0%) | 26 (51.0%) |
| Total (Overall) | 197 (55.0%) | 161 (45.0%) |
Natural Resources, Construction and Maintenance Occupations
The most common Natural Resources, Construction and Maintenance occupations in Gloster are Construction & Extraction (11 | 3.1%), and Installation, Maintenance & Repair (5 | 1.4%).
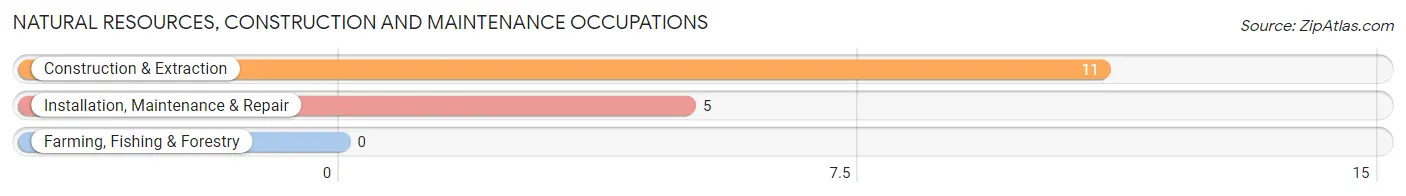
Natural Resources, Construction and Maintenance Occupations by Sex
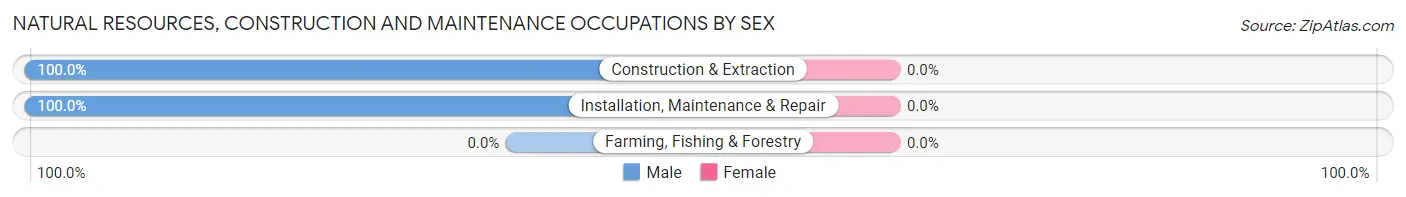
| Occupation | Male | Female |
| Farming, Fishing & Forestry | 0 (0.0%) | 0 (0.0%) |
| Construction & Extraction | 11 (100.0%) | 0 (0.0%) |
| Installation, Maintenance & Repair | 5 (100.0%) | 0 (0.0%) |
| Total (Category) | 16 (100.0%) | 0 (0.0%) |
| Total (Overall) | 197 (55.0%) | 161 (45.0%) |
Production, Transportation and Moving Occupations
The most common Production, Transportation and Moving occupations in Gloster are Material Moving (46 | 12.9%), Transportation (42 | 11.7%), and Production (30 | 8.4%).
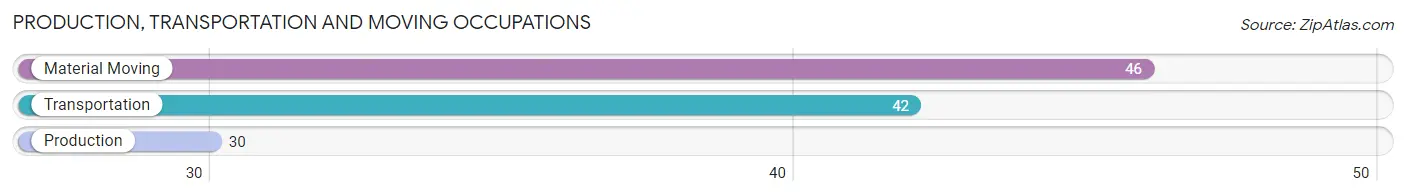
Production, Transportation and Moving Occupations by Sex
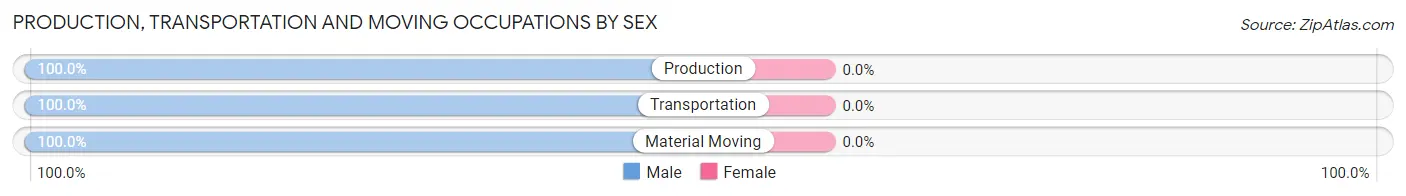
| Occupation | Male | Female |
| Production | 30 (100.0%) | 0 (0.0%) |
| Transportation | 42 (100.0%) | 0 (0.0%) |
| Material Moving | 46 (100.0%) | 0 (0.0%) |
| Total (Category) | 118 (100.0%) | 0 (0.0%) |
| Total (Overall) | 197 (55.0%) | 161 (45.0%) |
Employment Industries by Sex in Gloster
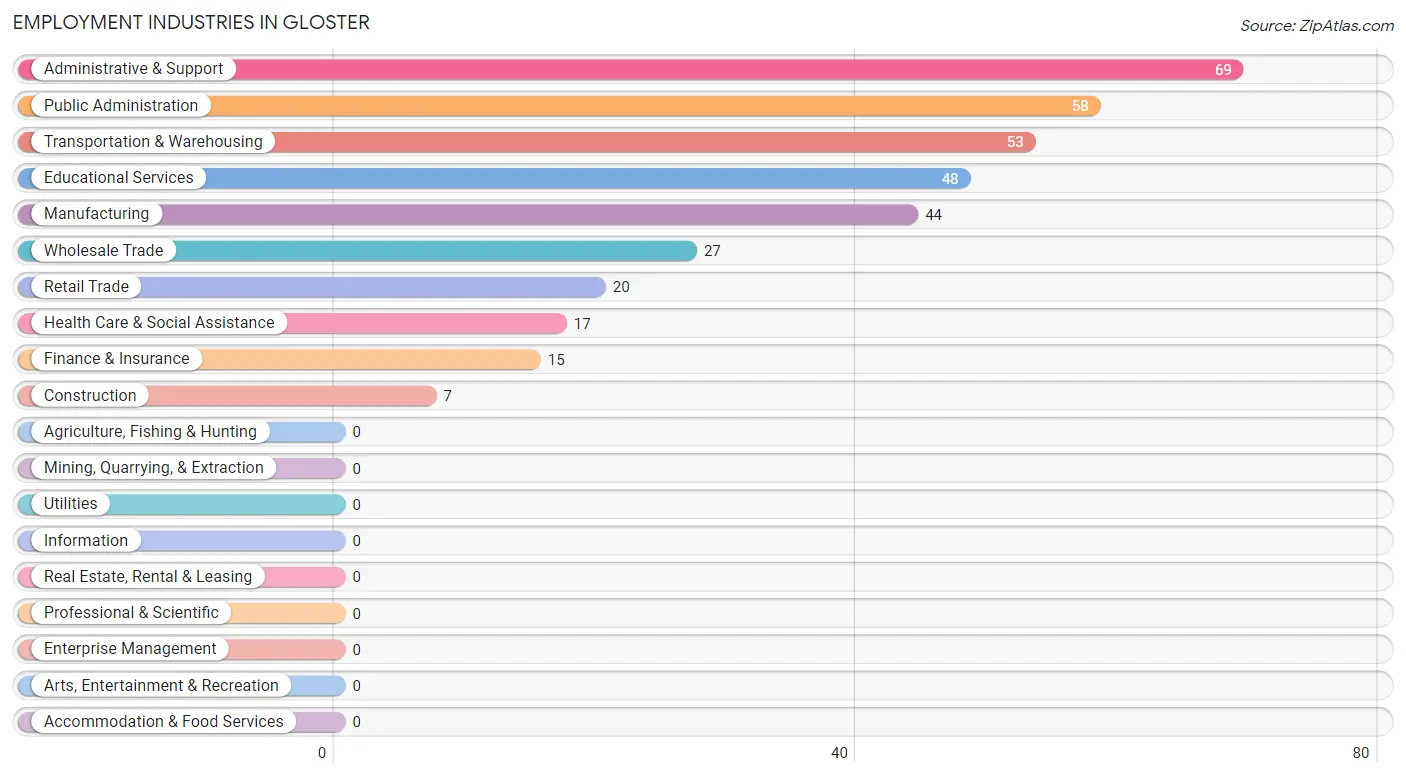
Employment Industries in Gloster
The major employment industries in Gloster include Administrative & Support (69 | 19.3%), Public Administration (58 | 16.2%), Transportation & Warehousing (53 | 14.8%), Educational Services (48 | 13.4%), and Manufacturing (44 | 12.3%).
Employment Industries by Sex in Gloster
The Gloster industries that see more men than women are Construction (100.0%), Manufacturing (100.0%), and Wholesale Trade (100.0%), whereas the industries that tend to have a higher number of women are Educational Services (100.0%), Administrative & Support (78.3%), and Public Administration (65.5%).
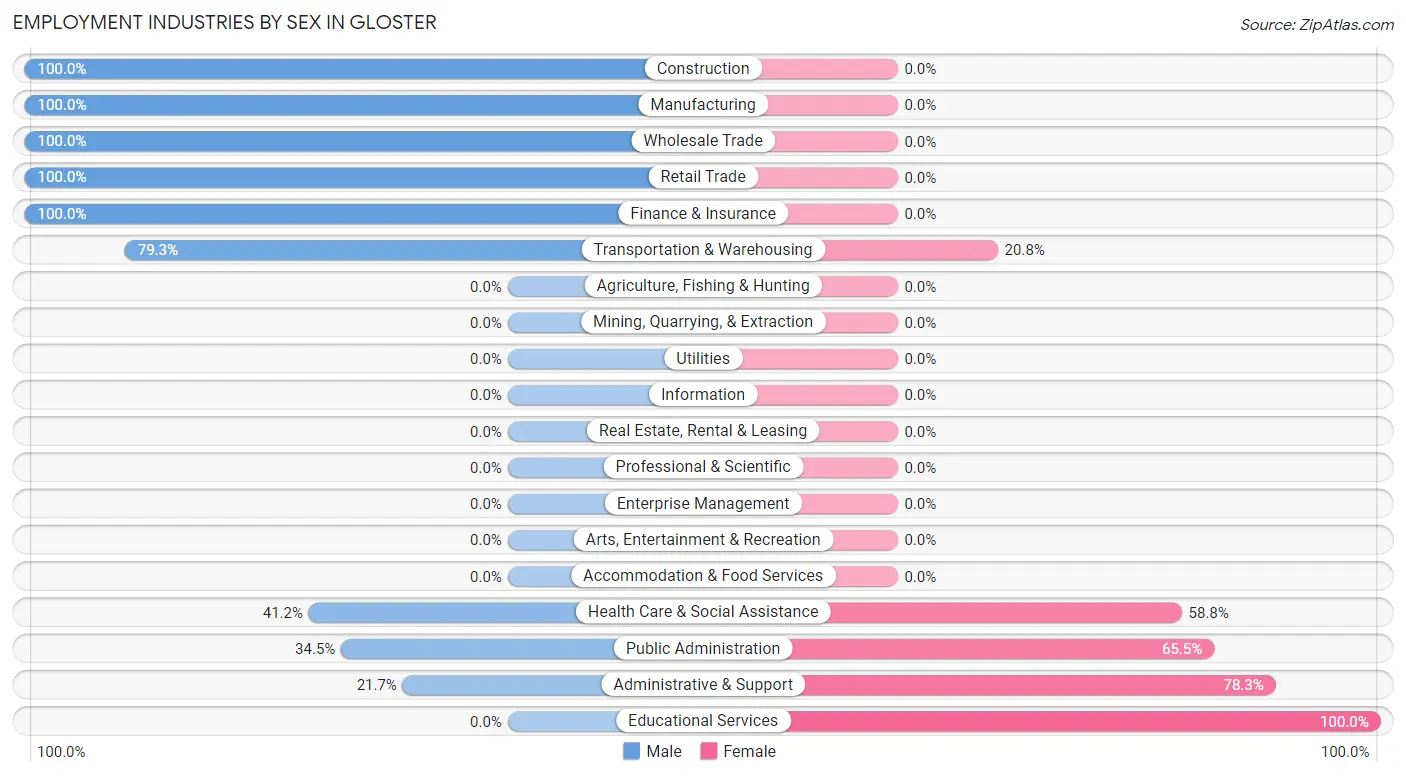
| Industry | Male | Female |
| Agriculture, Fishing & Hunting | 0 (0.0%) | 0 (0.0%) |
| Mining, Quarrying, & Extraction | 0 (0.0%) | 0 (0.0%) |
| Construction | 7 (100.0%) | 0 (0.0%) |
| Manufacturing | 44 (100.0%) | 0 (0.0%) |
| Wholesale Trade | 27 (100.0%) | 0 (0.0%) |
| Retail Trade | 20 (100.0%) | 0 (0.0%) |
| Transportation & Warehousing | 42 (79.2%) | 11 (20.7%) |
| Utilities | 0 (0.0%) | 0 (0.0%) |
| Information | 0 (0.0%) | 0 (0.0%) |
| Finance & Insurance | 15 (100.0%) | 0 (0.0%) |
| Real Estate, Rental & Leasing | 0 (0.0%) | 0 (0.0%) |
| Professional & Scientific | 0 (0.0%) | 0 (0.0%) |
| Enterprise Management | 0 (0.0%) | 0 (0.0%) |
| Administrative & Support | 15 (21.7%) | 54 (78.3%) |
| Educational Services | 0 (0.0%) | 48 (100.0%) |
| Health Care & Social Assistance | 7 (41.2%) | 10 (58.8%) |
| Arts, Entertainment & Recreation | 0 (0.0%) | 0 (0.0%) |
| Accommodation & Food Services | 0 (0.0%) | 0 (0.0%) |
| Public Administration | 20 (34.5%) | 38 (65.5%) |
| Total | 197 (55.0%) | 161 (45.0%) |
Education in Gloster
School Enrollment in Gloster
The most common levels of schooling among the 309 students in Gloster are middle school (157 | 50.8%), nursery / preschool (51 | 16.5%), and high school (44 | 14.2%).
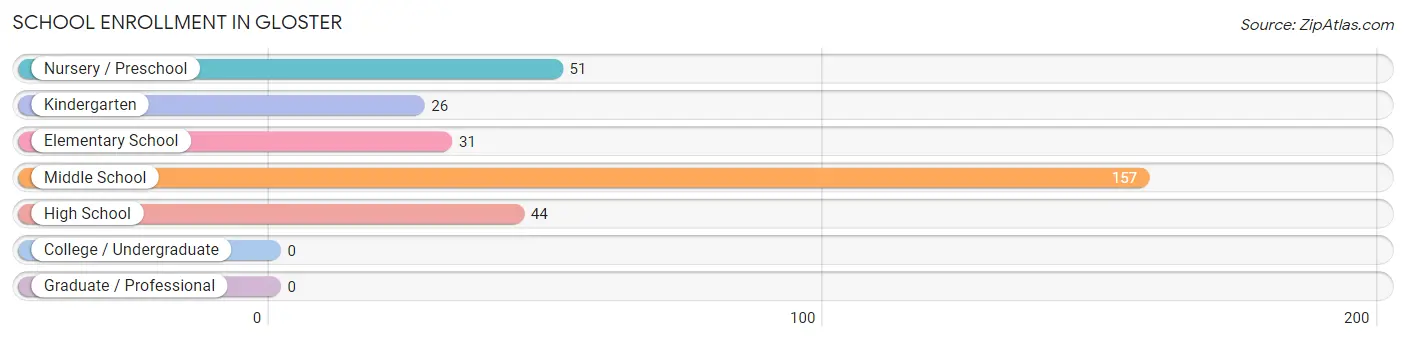
| School Level | # Students | % Students |
| Nursery / Preschool | 51 | 16.5% |
| Kindergarten | 26 | 8.4% |
| Elementary School | 31 | 10.0% |
| Middle School | 157 | 50.8% |
| High School | 44 | 14.2% |
| College / Undergraduate | 0 | 0.0% |
| Graduate / Professional | 0 | 0.0% |
| Total | 309 | 100.0% |
School Enrollment by Age by Funding Source in Gloster
Out of a total of 309 students who are enrolled in schools in Gloster, 3 (1.0%) attend a private institution, while the remaining 306 (99.0%) are enrolled in public schools. The age group of 5 to 9 year old has the highest likelihood of being enrolled in private schools, with 3 (5.3% in the age bracket) enrolled. Conversely, the age group of 3 to 4 year olds has the lowest likelihood of being enrolled in a private school, with 51 (100.0% in the age bracket) attending a public institution.
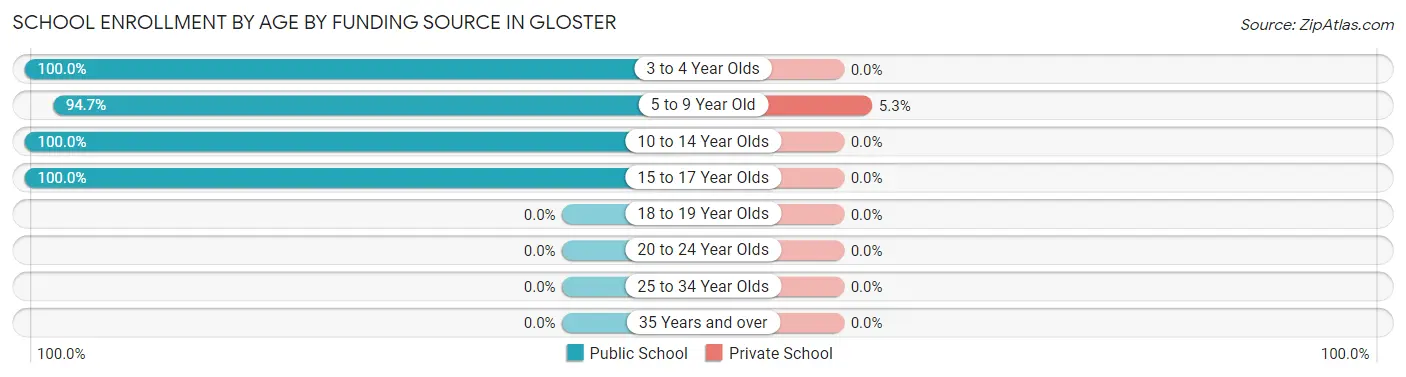
| Age Bracket | Public School | Private School |
| 3 to 4 Year Olds | 51 (100.0%) | 0 (0.0%) |
| 5 to 9 Year Old | 54 (94.7%) | 3 (5.3%) |
| 10 to 14 Year Olds | 157 (100.0%) | 0 (0.0%) |
| 15 to 17 Year Olds | 44 (100.0%) | 0 (0.0%) |
| 18 to 19 Year Olds | 0 (0.0%) | 0 (0.0%) |
| 20 to 24 Year Olds | 0 (0.0%) | 0 (0.0%) |
| 25 to 34 Year Olds | 0 (0.0%) | 0 (0.0%) |
| 35 Years and over | 0 (0.0%) | 0 (0.0%) |
| Total | 306 (99.0%) | 3 (1.0%) |
Educational Attainment by Field of Study in Gloster
Science & technology (54 | 61.4%), education (13 | 14.8%), business (12 | 13.6%), arts & humanities (7 | 8.0%), and literature & languages (2 | 2.3%) are the most common fields of study among 88 individuals in Gloster who have obtained a bachelor's degree or higher.
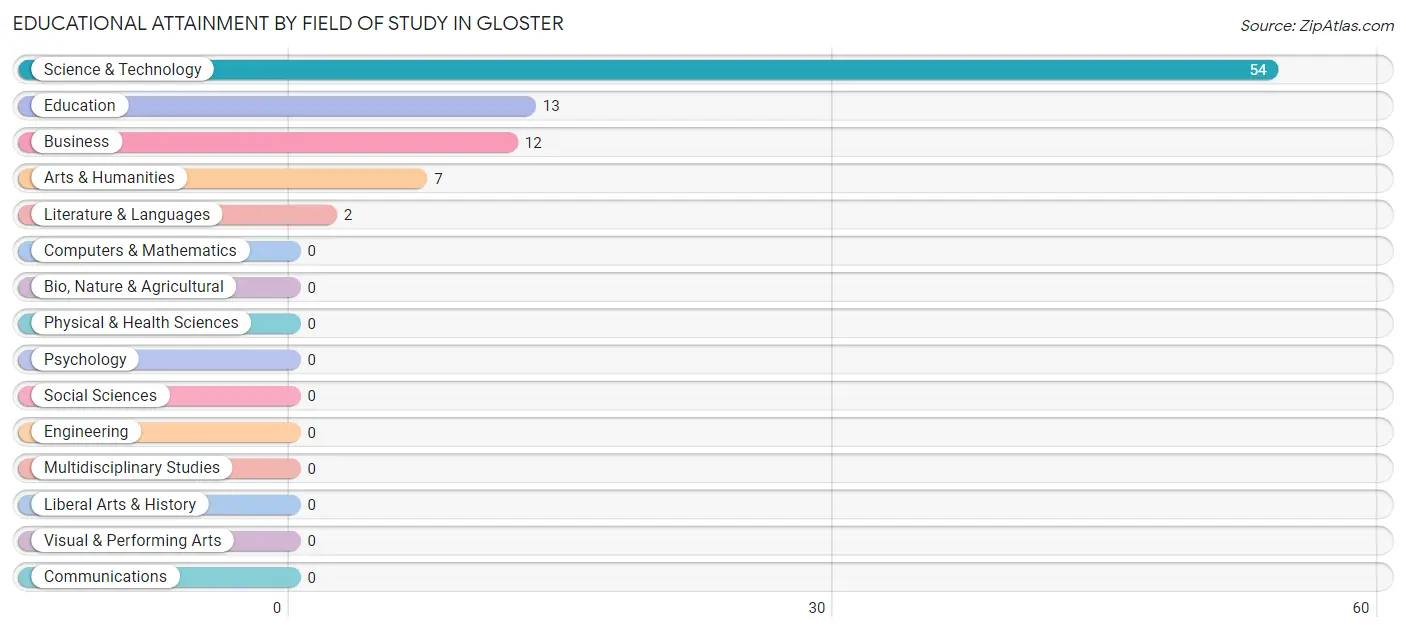
| Field of Study | # Graduates | % Graduates |
| Computers & Mathematics | 0 | 0.0% |
| Bio, Nature & Agricultural | 0 | 0.0% |
| Physical & Health Sciences | 0 | 0.0% |
| Psychology | 0 | 0.0% |
| Social Sciences | 0 | 0.0% |
| Engineering | 0 | 0.0% |
| Multidisciplinary Studies | 0 | 0.0% |
| Science & Technology | 54 | 61.4% |
| Business | 12 | 13.6% |
| Education | 13 | 14.8% |
| Literature & Languages | 2 | 2.3% |
| Liberal Arts & History | 0 | 0.0% |
| Visual & Performing Arts | 0 | 0.0% |
| Communications | 0 | 0.0% |
| Arts & Humanities | 7 | 8.0% |
| Total | 88 | 100.0% |
Transportation & Commute in Gloster
Vehicle Availability by Sex in Gloster
The most prevalent vehicle ownership categories in Gloster are males with 2 vehicles (83, accounting for 46.9%) and females with 2 vehicles (38, making up 51.5%).
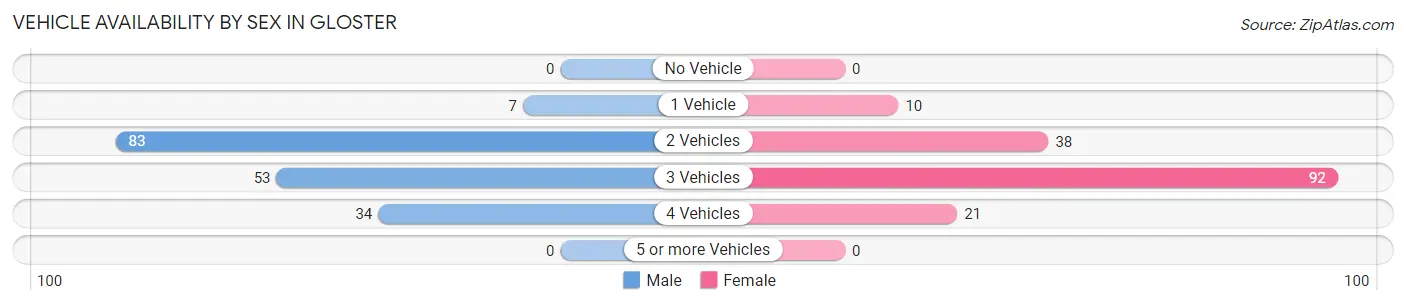
| Vehicles Available | Male | Female |
| No Vehicle | 0 (0.0%) | 0 (0.0%) |
| 1 Vehicle | 7 (4.0%) | 10 (6.2%) |
| 2 Vehicles | 83 (46.9%) | 38 (23.6%) |
| 3 Vehicles | 53 (29.9%) | 92 (57.1%) |
| 4 Vehicles | 34 (19.2%) | 21 (13.0%) |
| 5 or more Vehicles | 0 (0.0%) | 0 (0.0%) |
| Total | 177 (100.0%) | 161 (100.0%) |
Commute Time in Gloster
The most frequently occuring commute durations in Gloster are 60 to 89 minutes (81 commuters, 24.0%), 30 to 34 minutes (64 commuters, 18.9%), and 5 to 9 minutes (50 commuters, 14.8%).
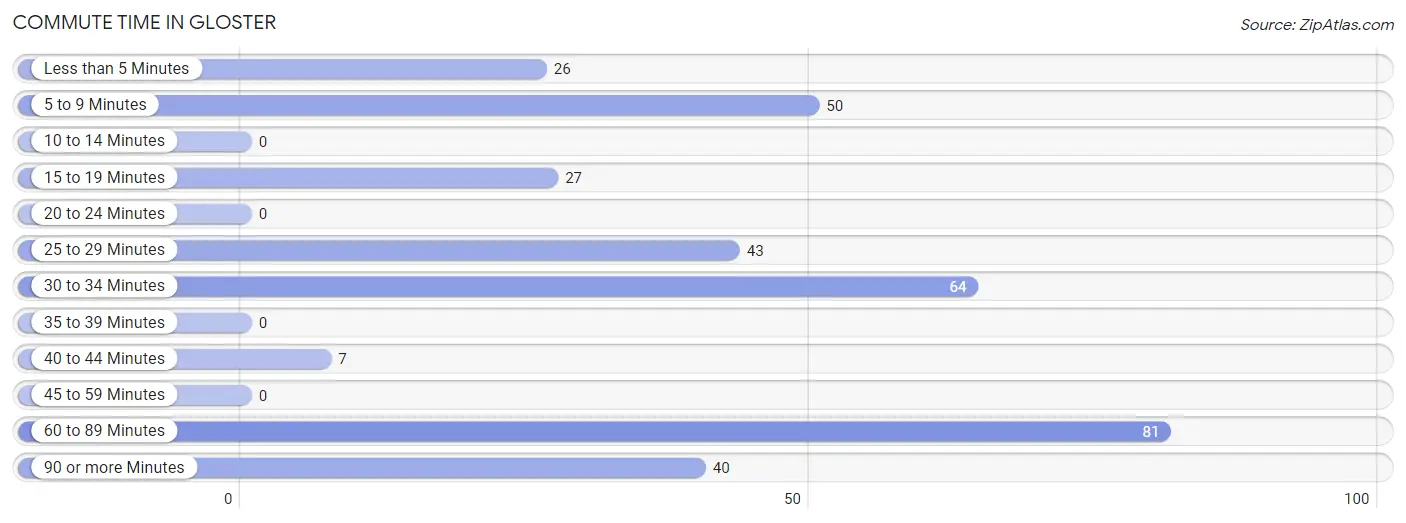
| Commute Time | # Commuters | % Commuters |
| Less than 5 Minutes | 26 | 7.7% |
| 5 to 9 Minutes | 50 | 14.8% |
| 10 to 14 Minutes | 0 | 0.0% |
| 15 to 19 Minutes | 27 | 8.0% |
| 20 to 24 Minutes | 0 | 0.0% |
| 25 to 29 Minutes | 43 | 12.7% |
| 30 to 34 Minutes | 64 | 18.9% |
| 35 to 39 Minutes | 0 | 0.0% |
| 40 to 44 Minutes | 7 | 2.1% |
| 45 to 59 Minutes | 0 | 0.0% |
| 60 to 89 Minutes | 81 | 24.0% |
| 90 or more Minutes | 40 | 11.8% |
Commute Time by Sex in Gloster
The most common commute times in Gloster are 60 to 89 minutes (75 commuters, 42.4%) for males and 30 to 34 minutes (54 commuters, 33.5%) for females.
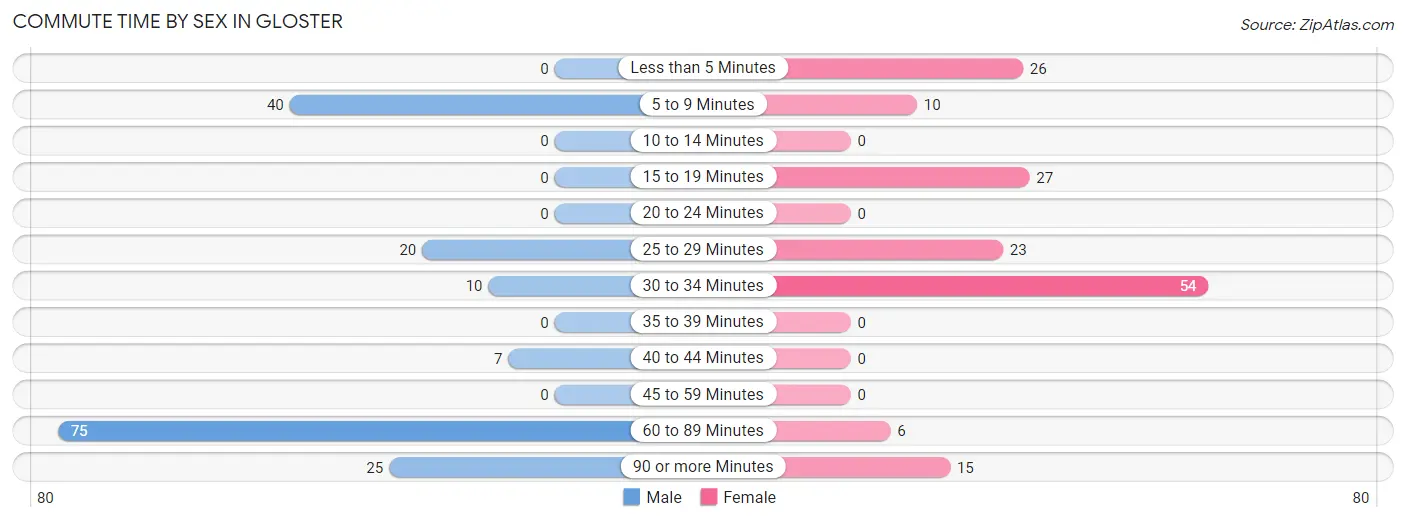
| Commute Time | Male | Female |
| Less than 5 Minutes | 0 (0.0%) | 26 (16.2%) |
| 5 to 9 Minutes | 40 (22.6%) | 10 (6.2%) |
| 10 to 14 Minutes | 0 (0.0%) | 0 (0.0%) |
| 15 to 19 Minutes | 0 (0.0%) | 27 (16.8%) |
| 20 to 24 Minutes | 0 (0.0%) | 0 (0.0%) |
| 25 to 29 Minutes | 20 (11.3%) | 23 (14.3%) |
| 30 to 34 Minutes | 10 (5.7%) | 54 (33.5%) |
| 35 to 39 Minutes | 0 (0.0%) | 0 (0.0%) |
| 40 to 44 Minutes | 7 (4.0%) | 0 (0.0%) |
| 45 to 59 Minutes | 0 (0.0%) | 0 (0.0%) |
| 60 to 89 Minutes | 75 (42.4%) | 6 (3.7%) |
| 90 or more Minutes | 25 (14.1%) | 15 (9.3%) |
Time of Departure to Work by Sex in Gloster
The most frequent times of departure to work in Gloster are 6:00 AM to 6:29 AM (81, 45.8%) for males and 7:00 AM to 7:29 AM (80, 49.7%) for females.
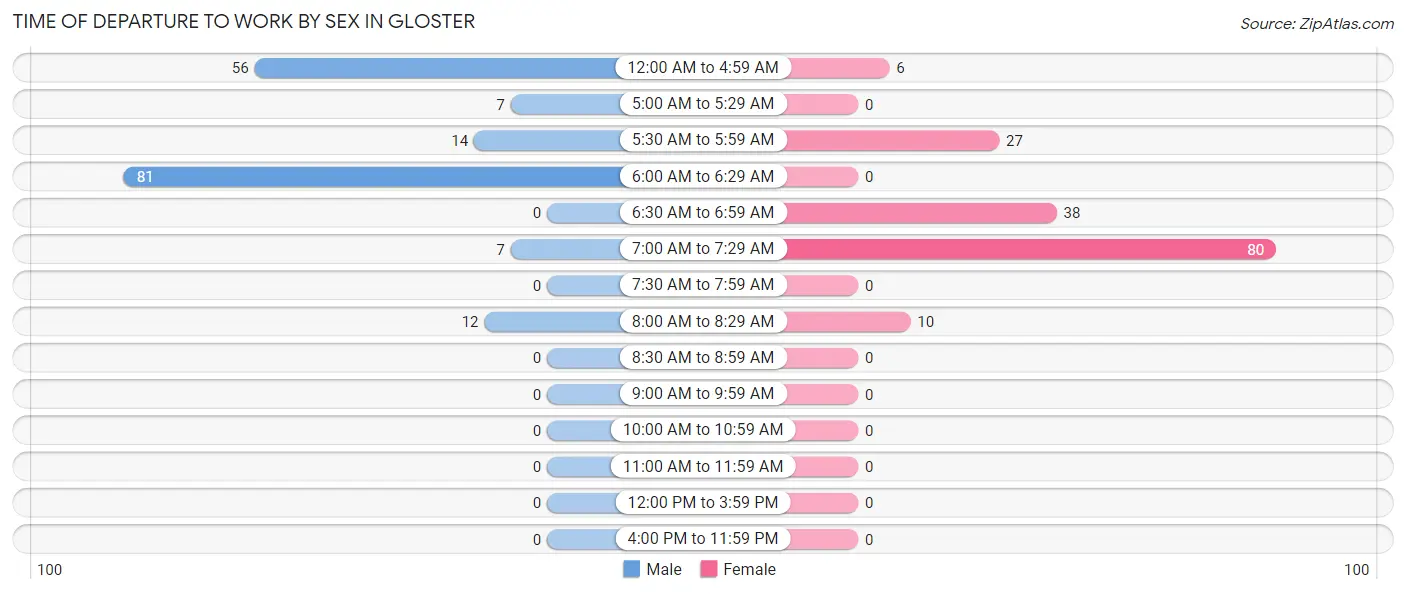
| Time of Departure | Male | Female |
| 12:00 AM to 4:59 AM | 56 (31.6%) | 6 (3.7%) |
| 5:00 AM to 5:29 AM | 7 (4.0%) | 0 (0.0%) |
| 5:30 AM to 5:59 AM | 14 (7.9%) | 27 (16.8%) |
| 6:00 AM to 6:29 AM | 81 (45.8%) | 0 (0.0%) |
| 6:30 AM to 6:59 AM | 0 (0.0%) | 38 (23.6%) |
| 7:00 AM to 7:29 AM | 7 (4.0%) | 80 (49.7%) |
| 7:30 AM to 7:59 AM | 0 (0.0%) | 0 (0.0%) |
| 8:00 AM to 8:29 AM | 12 (6.8%) | 10 (6.2%) |
| 8:30 AM to 8:59 AM | 0 (0.0%) | 0 (0.0%) |
| 9:00 AM to 9:59 AM | 0 (0.0%) | 0 (0.0%) |
| 10:00 AM to 10:59 AM | 0 (0.0%) | 0 (0.0%) |
| 11:00 AM to 11:59 AM | 0 (0.0%) | 0 (0.0%) |
| 12:00 PM to 3:59 PM | 0 (0.0%) | 0 (0.0%) |
| 4:00 PM to 11:59 PM | 0 (0.0%) | 0 (0.0%) |
| Total | 177 (100.0%) | 161 (100.0%) |
Housing Occupancy in Gloster
Occupancy by Ownership in Gloster
Of the total 513 dwellings in Gloster, owner-occupied units account for 217 (42.3%), while renter-occupied units make up 296 (57.7%).
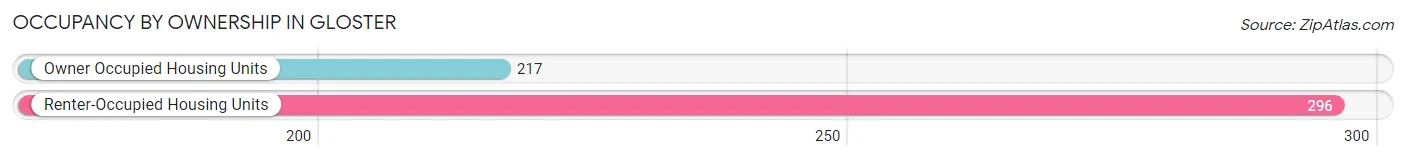
| Occupancy | # Housing Units | % Housing Units |
| Owner Occupied Housing Units | 217 | 42.3% |
| Renter-Occupied Housing Units | 296 | 57.7% |
| Total Occupied Housing Units | 513 | 100.0% |
Occupancy by Household Size in Gloster
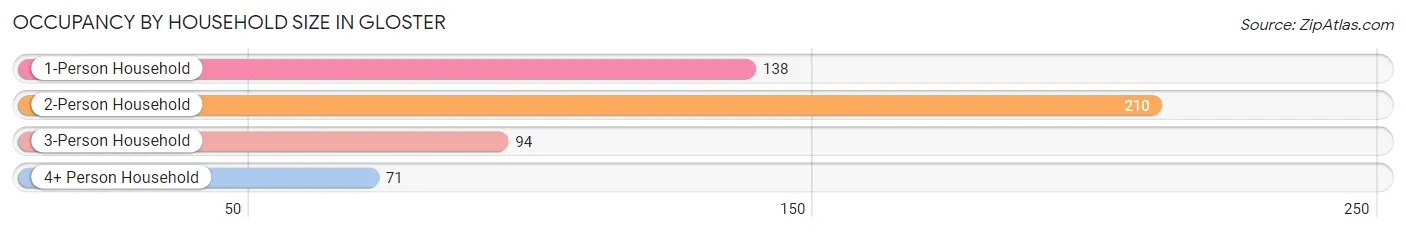
| Household Size | # Housing Units | % Housing Units |
| 1-Person Household | 138 | 26.9% |
| 2-Person Household | 210 | 40.9% |
| 3-Person Household | 94 | 18.3% |
| 4+ Person Household | 71 | 13.8% |
| Total Housing Units | 513 | 100.0% |
Occupancy by Ownership by Household Size in Gloster
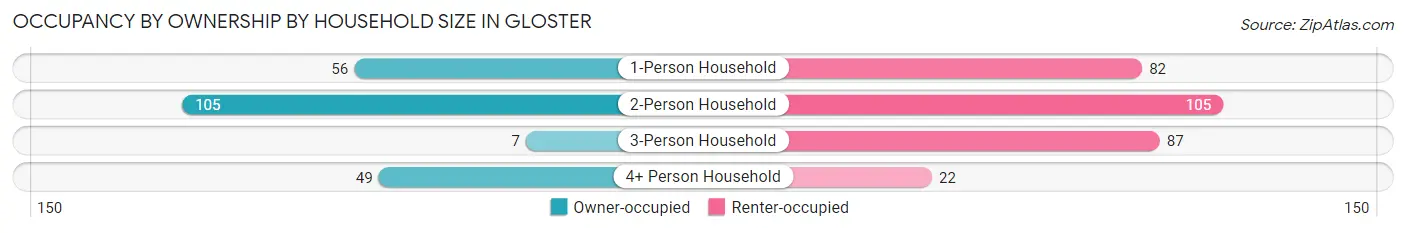
| Household Size | Owner-occupied | Renter-occupied |
| 1-Person Household | 56 (40.6%) | 82 (59.4%) |
| 2-Person Household | 105 (50.0%) | 105 (50.0%) |
| 3-Person Household | 7 (7.4%) | 87 (92.5%) |
| 4+ Person Household | 49 (69.0%) | 22 (31.0%) |
| Total Housing Units | 217 (42.3%) | 296 (57.7%) |
Occupancy by Educational Attainment in Gloster
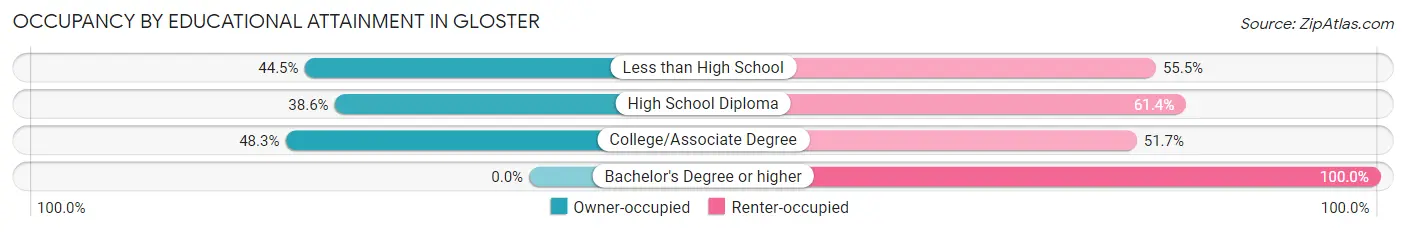
| Household Size | Owner-occupied | Renter-occupied |
| Less than High School | 61 (44.5%) | 76 (55.5%) |
| High School Diploma | 98 (38.6%) | 156 (61.4%) |
| College/Associate Degree | 58 (48.3%) | 62 (51.7%) |
| Bachelor's Degree or higher | 0 (0.0%) | 2 (100.0%) |
Occupancy by Age of Householder in Gloster
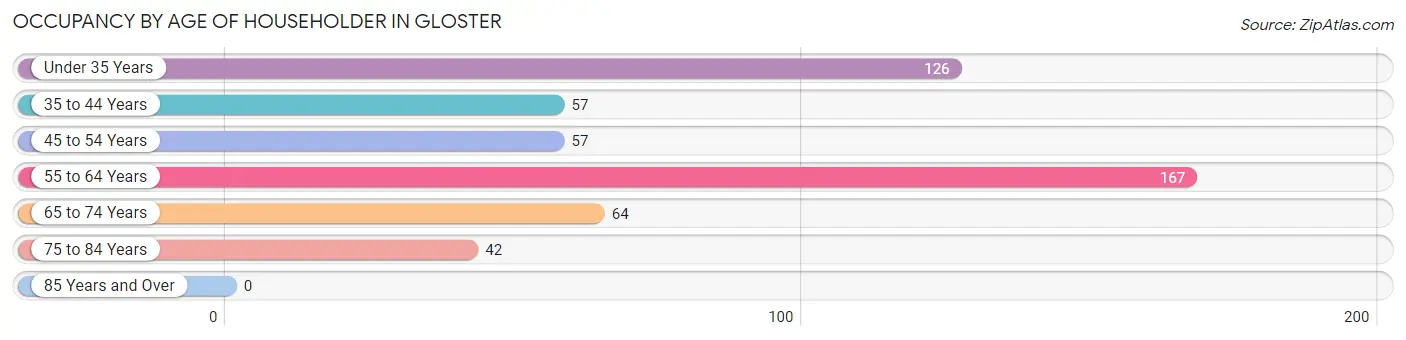
| Age Bracket | # Households | % Households |
| Under 35 Years | 126 | 24.6% |
| 35 to 44 Years | 57 | 11.1% |
| 45 to 54 Years | 57 | 11.1% |
| 55 to 64 Years | 167 | 32.6% |
| 65 to 74 Years | 64 | 12.5% |
| 75 to 84 Years | 42 | 8.2% |
| 85 Years and Over | 0 | 0.0% |
| Total | 513 | 100.0% |
Housing Finances in Gloster
Median Income by Occupancy in Gloster
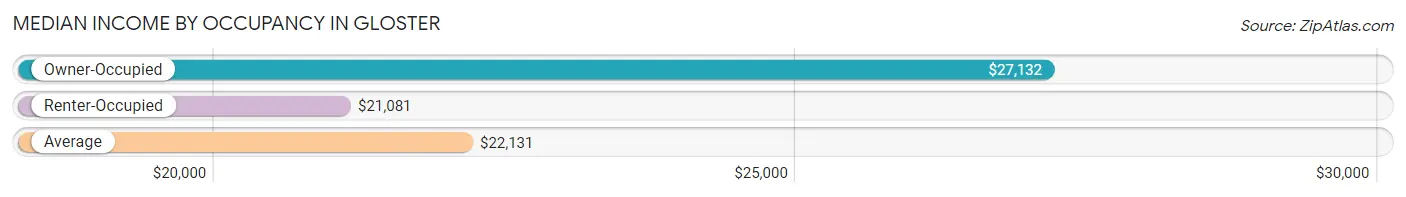
| Occupancy Type | # Households | Median Income |
| Owner-Occupied | 217 (42.3%) | $27,132 |
| Renter-Occupied | 296 (57.7%) | $21,081 |
| Average | 513 (100.0%) | $22,131 |
Occupancy by Householder Income Bracket in Gloster
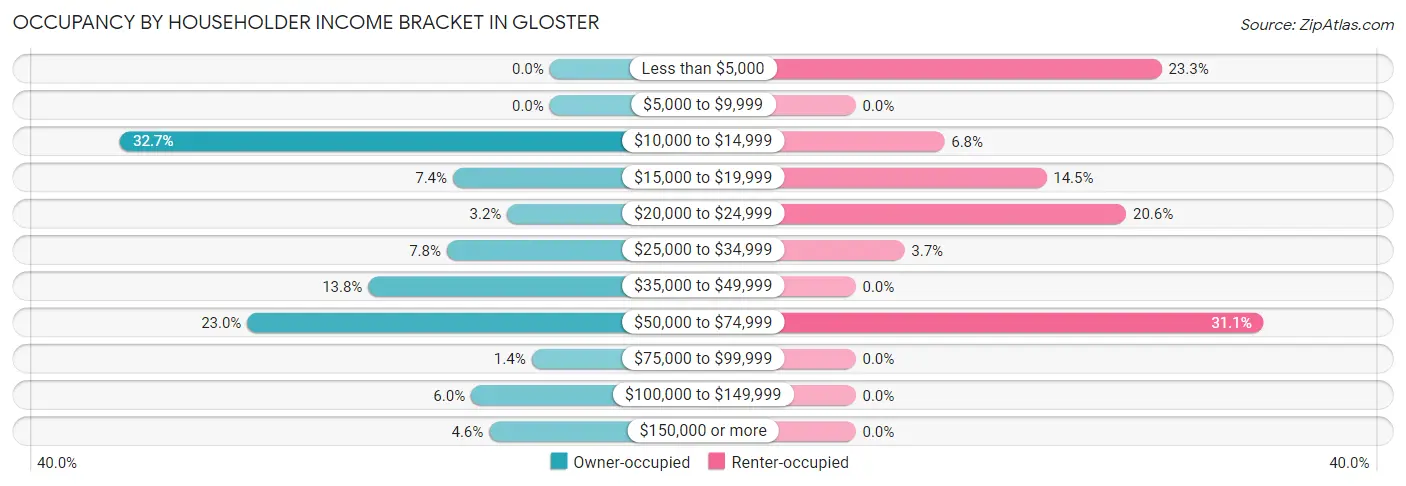
| Income Bracket | Owner-occupied | Renter-occupied |
| Less than $5,000 | 0 (0.0%) | 69 (23.3%) |
| $5,000 to $9,999 | 0 (0.0%) | 0 (0.0%) |
| $10,000 to $14,999 | 71 (32.7%) | 20 (6.8%) |
| $15,000 to $19,999 | 16 (7.4%) | 43 (14.5%) |
| $20,000 to $24,999 | 7 (3.2%) | 61 (20.6%) |
| $25,000 to $34,999 | 17 (7.8%) | 11 (3.7%) |
| $35,000 to $49,999 | 30 (13.8%) | 0 (0.0%) |
| $50,000 to $74,999 | 50 (23.0%) | 92 (31.1%) |
| $75,000 to $99,999 | 3 (1.4%) | 0 (0.0%) |
| $100,000 to $149,999 | 13 (6.0%) | 0 (0.0%) |
| $150,000 or more | 10 (4.6%) | 0 (0.0%) |
| Total | 217 (100.0%) | 296 (100.0%) |
Monthly Housing Cost Tiers in Gloster
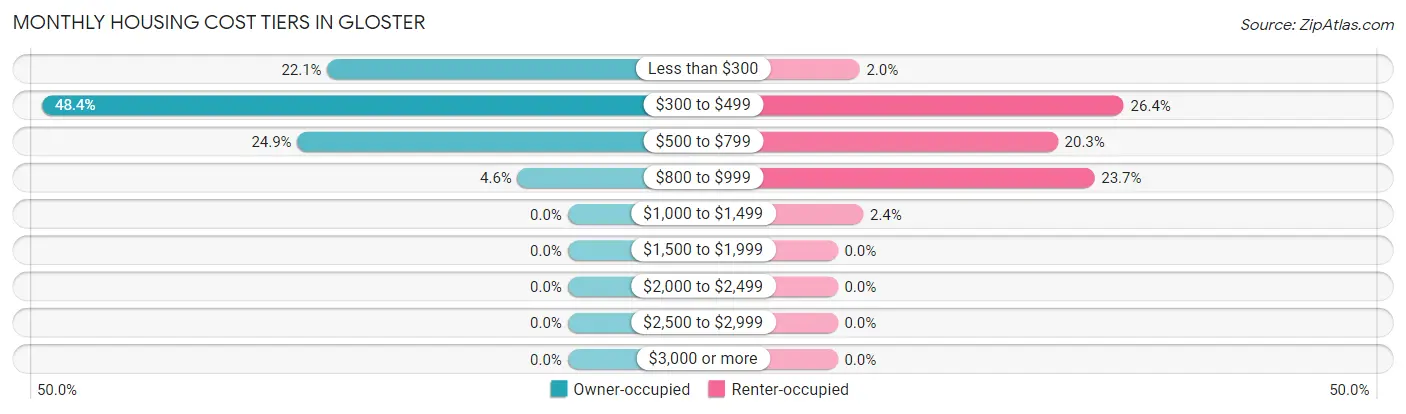
| Monthly Cost | Owner-occupied | Renter-occupied |
| Less than $300 | 48 (22.1%) | 6 (2.0%) |
| $300 to $499 | 105 (48.4%) | 78 (26.4%) |
| $500 to $799 | 54 (24.9%) | 60 (20.3%) |
| $800 to $999 | 10 (4.6%) | 70 (23.6%) |
| $1,000 to $1,499 | 0 (0.0%) | 7 (2.4%) |
| $1,500 to $1,999 | 0 (0.0%) | 0 (0.0%) |
| $2,000 to $2,499 | 0 (0.0%) | 0 (0.0%) |
| $2,500 to $2,999 | 0 (0.0%) | 0 (0.0%) |
| $3,000 or more | 0 (0.0%) | 0 (0.0%) |
| Total | 217 (100.0%) | 296 (100.0%) |
Physical Housing Characteristics in Gloster
Housing Structures in Gloster
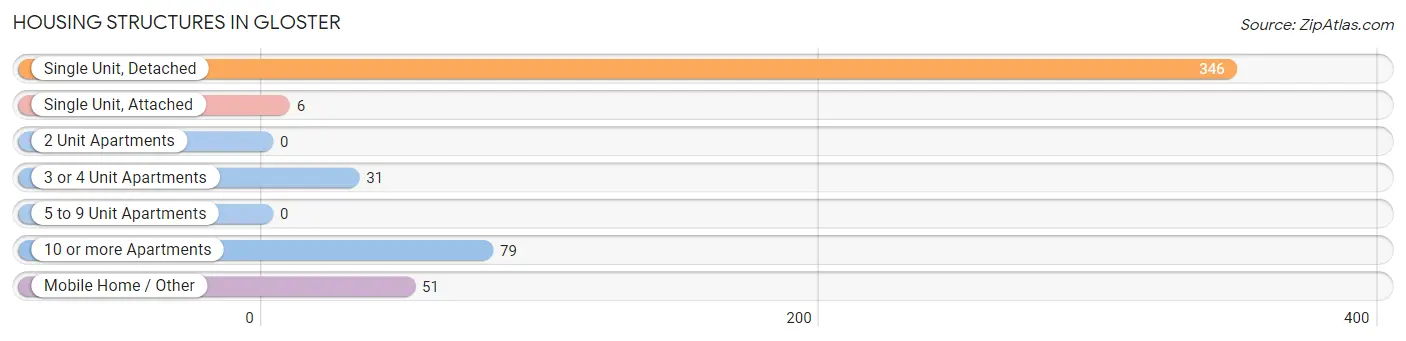
| Structure Type | # Housing Units | % Housing Units |
| Single Unit, Detached | 346 | 67.4% |
| Single Unit, Attached | 6 | 1.2% |
| 2 Unit Apartments | 0 | 0.0% |
| 3 or 4 Unit Apartments | 31 | 6.0% |
| 5 to 9 Unit Apartments | 0 | 0.0% |
| 10 or more Apartments | 79 | 15.4% |
| Mobile Home / Other | 51 | 9.9% |
| Total | 513 | 100.0% |
Housing Structures by Occupancy in Gloster
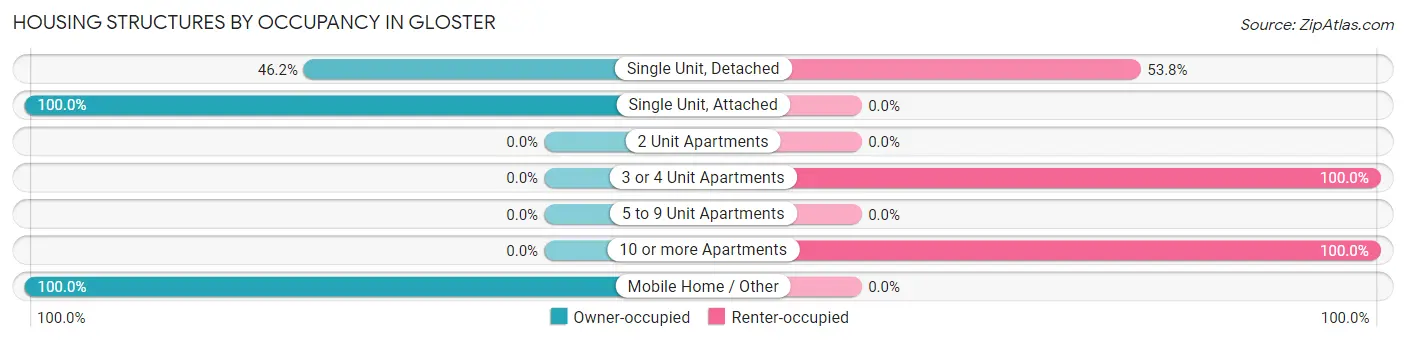
| Structure Type | Owner-occupied | Renter-occupied |
| Single Unit, Detached | 160 (46.2%) | 186 (53.8%) |
| Single Unit, Attached | 6 (100.0%) | 0 (0.0%) |
| 2 Unit Apartments | 0 (0.0%) | 0 (0.0%) |
| 3 or 4 Unit Apartments | 0 (0.0%) | 31 (100.0%) |
| 5 to 9 Unit Apartments | 0 (0.0%) | 0 (0.0%) |
| 10 or more Apartments | 0 (0.0%) | 79 (100.0%) |
| Mobile Home / Other | 51 (100.0%) | 0 (0.0%) |
| Total | 217 (42.3%) | 296 (57.7%) |
Housing Structures by Number of Rooms in Gloster
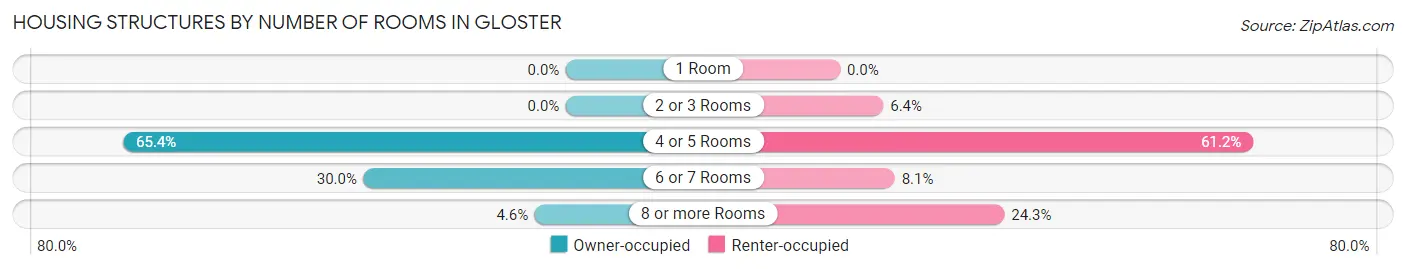
| Number of Rooms | Owner-occupied | Renter-occupied |
| 1 Room | 0 (0.0%) | 0 (0.0%) |
| 2 or 3 Rooms | 0 (0.0%) | 19 (6.4%) |
| 4 or 5 Rooms | 142 (65.4%) | 181 (61.2%) |
| 6 or 7 Rooms | 65 (29.9%) | 24 (8.1%) |
| 8 or more Rooms | 10 (4.6%) | 72 (24.3%) |
| Total | 217 (100.0%) | 296 (100.0%) |
Housing Structure by Heating Type in Gloster
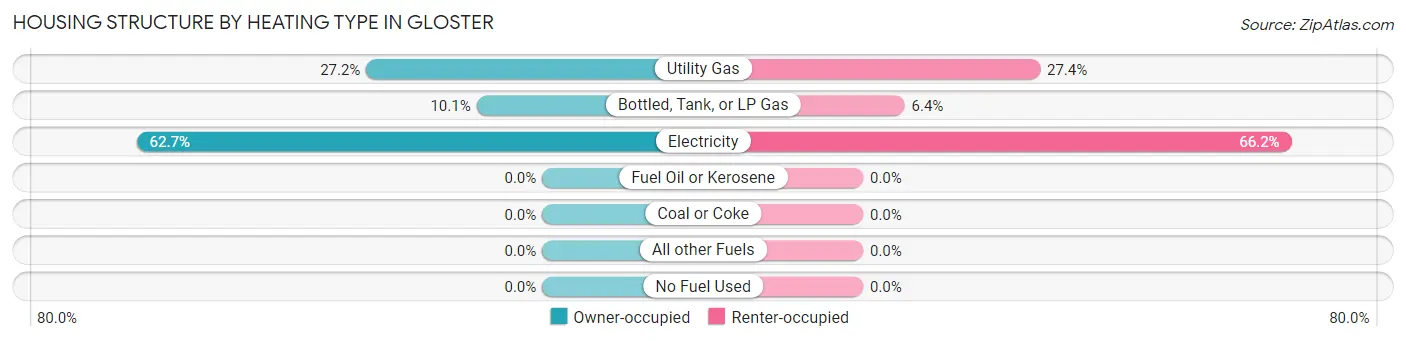
| Heating Type | Owner-occupied | Renter-occupied |
| Utility Gas | 59 (27.2%) | 81 (27.4%) |
| Bottled, Tank, or LP Gas | 22 (10.1%) | 19 (6.4%) |
| Electricity | 136 (62.7%) | 196 (66.2%) |
| Fuel Oil or Kerosene | 0 (0.0%) | 0 (0.0%) |
| Coal or Coke | 0 (0.0%) | 0 (0.0%) |
| All other Fuels | 0 (0.0%) | 0 (0.0%) |
| No Fuel Used | 0 (0.0%) | 0 (0.0%) |
| Total | 217 (100.0%) | 296 (100.0%) |
Household Vehicle Usage in Gloster
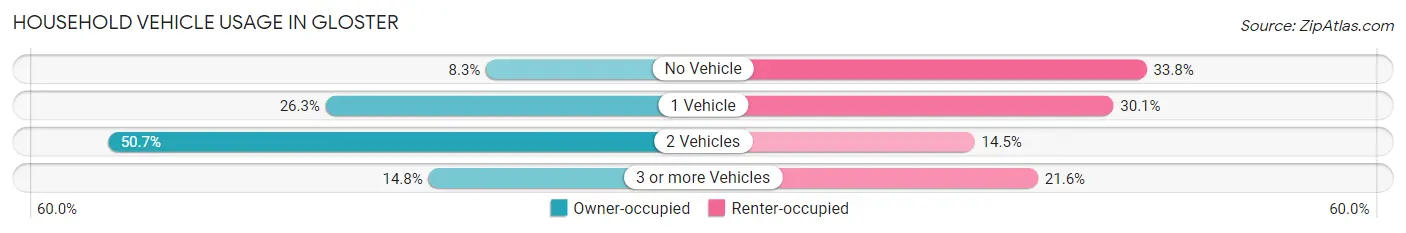
| Vehicles per Household | Owner-occupied | Renter-occupied |
| No Vehicle | 18 (8.3%) | 100 (33.8%) |
| 1 Vehicle | 57 (26.3%) | 89 (30.1%) |
| 2 Vehicles | 110 (50.7%) | 43 (14.5%) |
| 3 or more Vehicles | 32 (14.7%) | 64 (21.6%) |
| Total | 217 (100.0%) | 296 (100.0%) |
Real Estate & Mortgages in Gloster
Real Estate and Mortgage Overview in Gloster
| Characteristic | Without Mortgage | With Mortgage |
| Housing Units | 173 | 44 |
| Median Property Value | $63,800 | $78,100 |
| Median Household Income | $35,063 | $0 |
| Monthly Housing Costs | $352 | $0 |
| Real Estate Taxes | $199 | $21 |
Property Value by Mortgage Status in Gloster
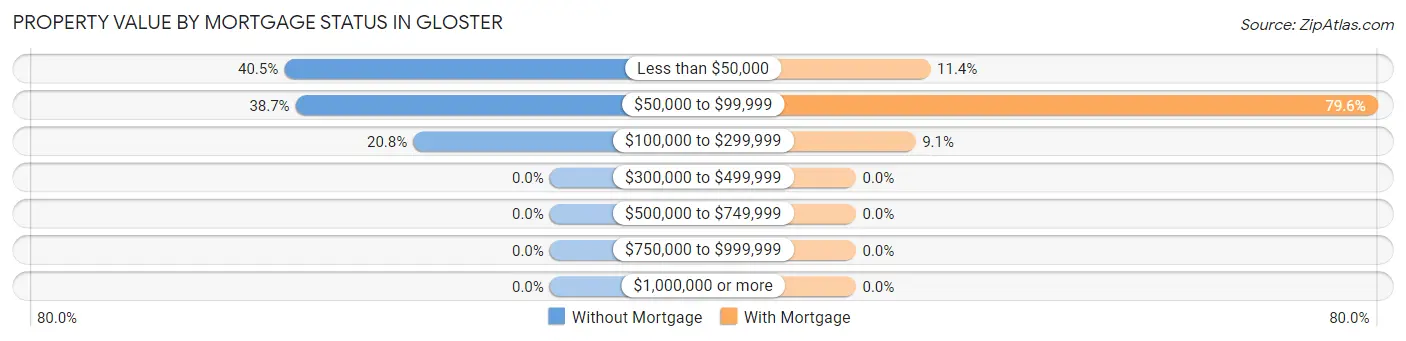
| Property Value | Without Mortgage | With Mortgage |
| Less than $50,000 | 70 (40.5%) | 5 (11.4%) |
| $50,000 to $99,999 | 67 (38.7%) | 35 (79.5%) |
| $100,000 to $299,999 | 36 (20.8%) | 4 (9.1%) |
| $300,000 to $499,999 | 0 (0.0%) | 0 (0.0%) |
| $500,000 to $749,999 | 0 (0.0%) | 0 (0.0%) |
| $750,000 to $999,999 | 0 (0.0%) | 0 (0.0%) |
| $1,000,000 or more | 0 (0.0%) | 0 (0.0%) |
| Total | 173 (100.0%) | 44 (100.0%) |
Household Income by Mortgage Status in Gloster
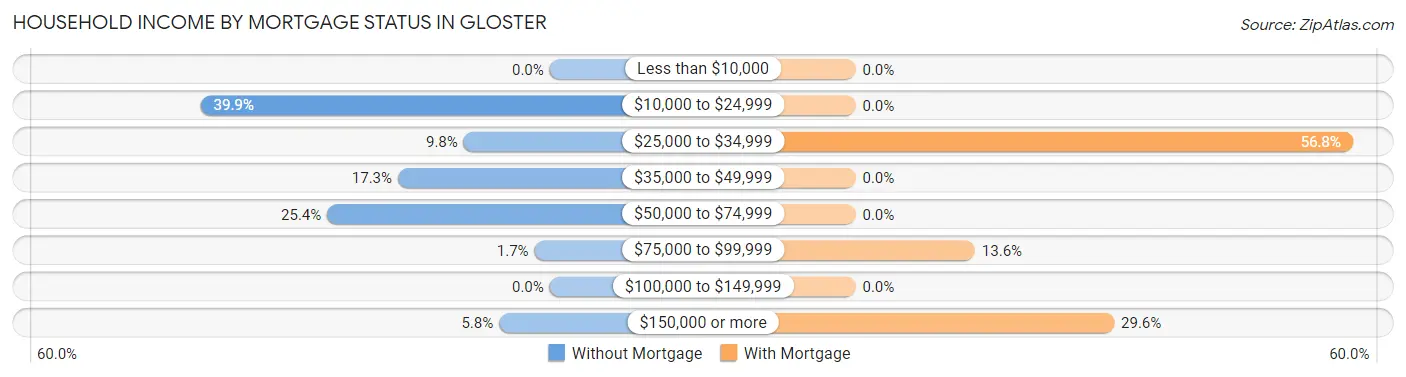
| Household Income | Without Mortgage | With Mortgage |
| Less than $10,000 | 0 (0.0%) | 0 (0.0%) |
| $10,000 to $24,999 | 69 (39.9%) | 0 (0.0%) |
| $25,000 to $34,999 | 17 (9.8%) | 25 (56.8%) |
| $35,000 to $49,999 | 30 (17.3%) | 0 (0.0%) |
| $50,000 to $74,999 | 44 (25.4%) | 0 (0.0%) |
| $75,000 to $99,999 | 3 (1.7%) | 6 (13.6%) |
| $100,000 to $149,999 | 0 (0.0%) | 0 (0.0%) |
| $150,000 or more | 10 (5.8%) | 13 (29.5%) |
| Total | 173 (100.0%) | 44 (100.0%) |
Property Value to Household Income Ratio in Gloster
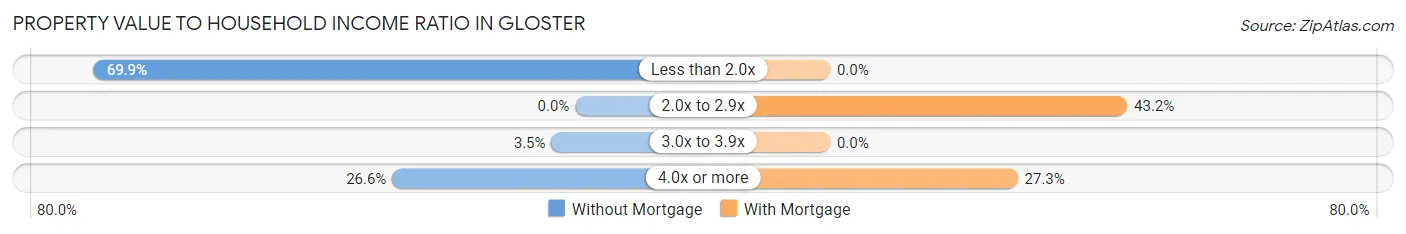
| Value-to-Income Ratio | Without Mortgage | With Mortgage |
| Less than 2.0x | 121 (69.9%) | 0 (0.0%) |
| 2.0x to 2.9x | 0 (0.0%) | 19 (43.2%) |
| 3.0x to 3.9x | 6 (3.5%) | 0 (0.0%) |
| 4.0x or more | 46 (26.6%) | 12 (27.3%) |
| Total | 173 (100.0%) | 44 (100.0%) |
Real Estate Taxes by Mortgage Status in Gloster
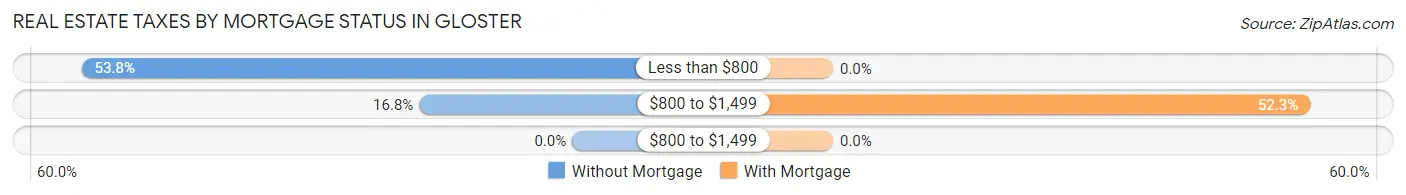
| Property Taxes | Without Mortgage | With Mortgage |
| Less than $800 | 93 (53.8%) | 0 (0.0%) |
| $800 to $1,499 | 29 (16.8%) | 23 (52.3%) |
| $800 to $1,499 | 0 (0.0%) | 0 (0.0%) |
| Total | 173 (100.0%) | 44 (100.0%) |
Health & Disability in Gloster
Health Insurance Coverage by Age in Gloster
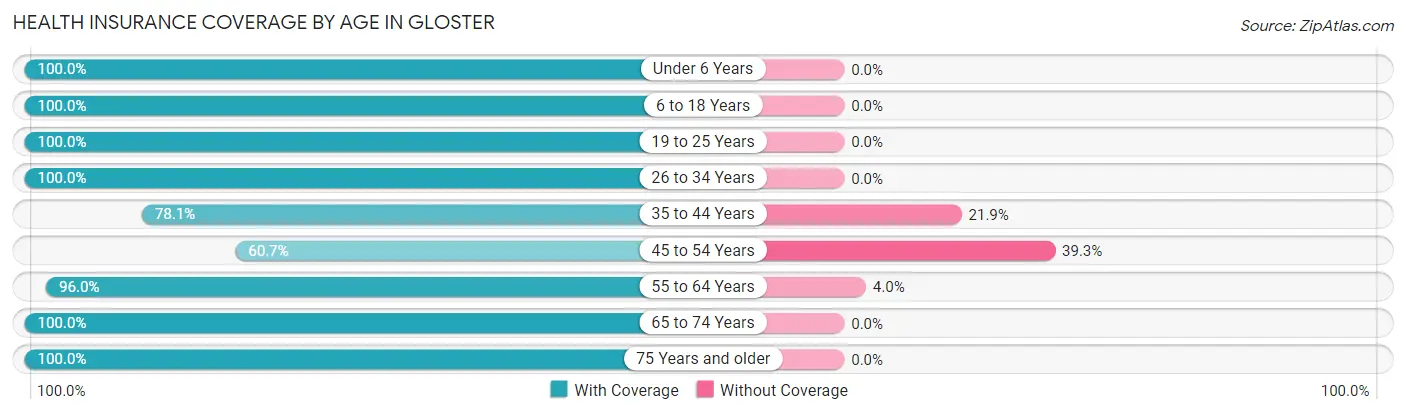
| Age Bracket | With Coverage | Without Coverage |
| Under 6 Years | 132 (100.0%) | 0 (0.0%) |
| 6 to 18 Years | 245 (100.0%) | 0 (0.0%) |
| 19 to 25 Years | 76 (100.0%) | 0 (0.0%) |
| 26 to 34 Years | 128 (100.0%) | 0 (0.0%) |
| 35 to 44 Years | 125 (78.1%) | 35 (21.9%) |
| 45 to 54 Years | 105 (60.7%) | 68 (39.3%) |
| 55 to 64 Years | 238 (96.0%) | 10 (4.0%) |
| 65 to 74 Years | 81 (100.0%) | 0 (0.0%) |
| 75 Years and older | 76 (100.0%) | 0 (0.0%) |
| Total | 1,206 (91.4%) | 113 (8.6%) |
Health Insurance Coverage by Citizenship Status in Gloster
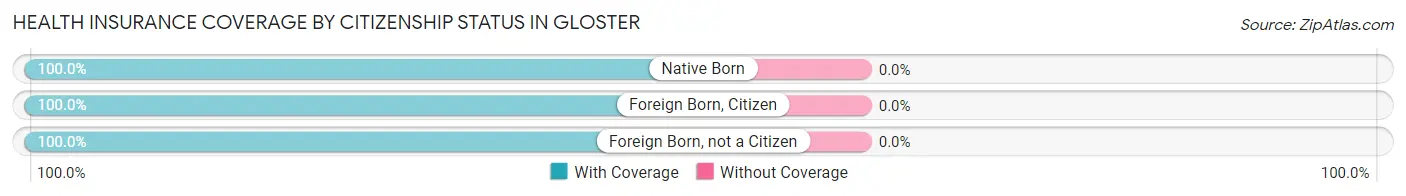
| Citizenship Status | With Coverage | Without Coverage |
| Native Born | 132 (100.0%) | 0 (0.0%) |
| Foreign Born, Citizen | 245 (100.0%) | 0 (0.0%) |
| Foreign Born, not a Citizen | 76 (100.0%) | 0 (0.0%) |
Health Insurance Coverage by Household Income in Gloster
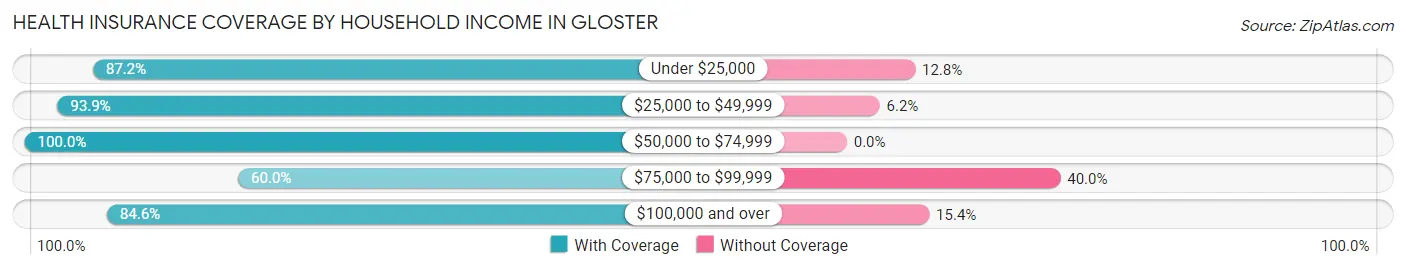
| Household Income | With Coverage | Without Coverage |
| Under $25,000 | 512 (87.2%) | 75 (12.8%) |
| $25,000 to $49,999 | 168 (93.9%) | 11 (6.1%) |
| $50,000 to $74,999 | 386 (100.0%) | 0 (0.0%) |
| $75,000 to $99,999 | 3 (60.0%) | 2 (40.0%) |
| $100,000 and over | 137 (84.6%) | 25 (15.4%) |
Public vs Private Health Insurance Coverage by Age in Gloster
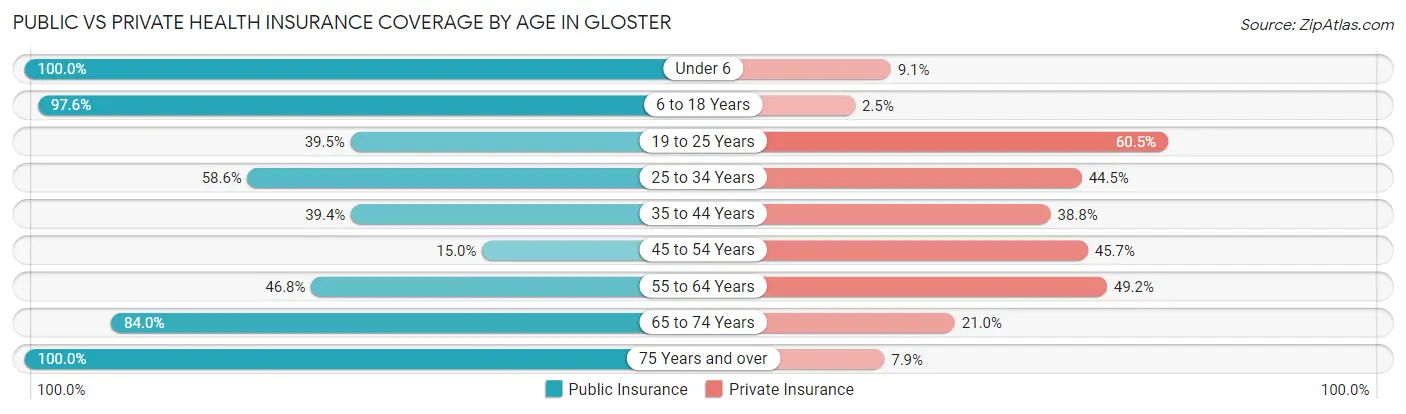
| Age Bracket | Public Insurance | Private Insurance |
| Under 6 | 132 (100.0%) | 12 (9.1%) |
| 6 to 18 Years | 239 (97.6%) | 6 (2.5%) |
| 19 to 25 Years | 30 (39.5%) | 46 (60.5%) |
| 25 to 34 Years | 75 (58.6%) | 57 (44.5%) |
| 35 to 44 Years | 63 (39.4%) | 62 (38.8%) |
| 45 to 54 Years | 26 (15.0%) | 79 (45.7%) |
| 55 to 64 Years | 116 (46.8%) | 122 (49.2%) |
| 65 to 74 Years | 68 (84.0%) | 17 (21.0%) |
| 75 Years and over | 76 (100.0%) | 6 (7.9%) |
| Total | 825 (62.5%) | 407 (30.9%) |
Disability Status by Sex by Age in Gloster
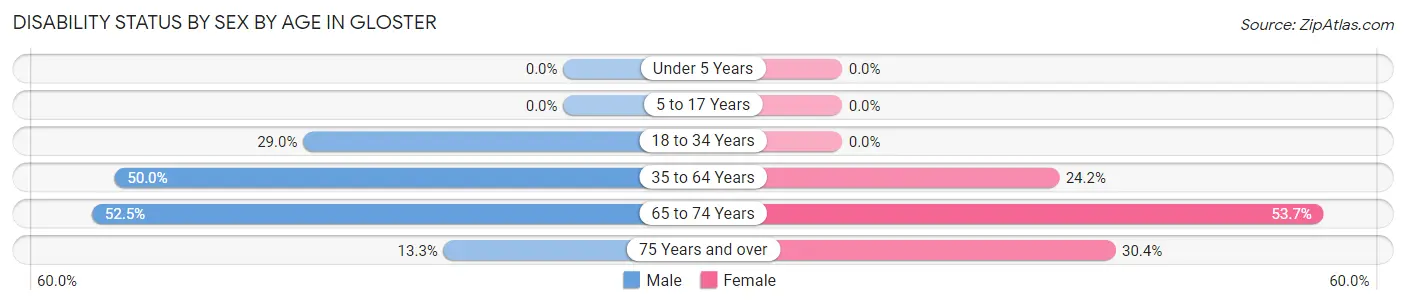
| Age Bracket | Male | Female |
| Under 5 Years | 0 (0.0%) | 0 (0.0%) |
| 5 to 17 Years | 0 (0.0%) | 0 (0.0%) |
| 18 to 34 Years | 31 (29.0%) | 0 (0.0%) |
| 35 to 64 Years | 156 (50.0%) | 65 (24.2%) |
| 65 to 74 Years | 21 (52.5%) | 22 (53.7%) |
| 75 Years and over | 4 (13.3%) | 14 (30.4%) |
Disability Class by Sex by Age in Gloster
Disability Class: Hearing Difficulty
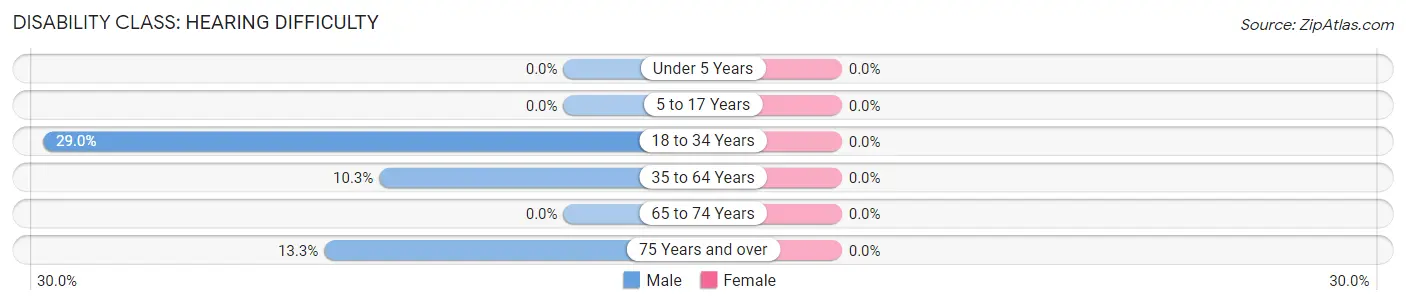
| Age Bracket | Male | Female |
| Under 5 Years | 0 (0.0%) | 0 (0.0%) |
| 5 to 17 Years | 0 (0.0%) | 0 (0.0%) |
| 18 to 34 Years | 31 (29.0%) | 0 (0.0%) |
| 35 to 64 Years | 32 (10.3%) | 0 (0.0%) |
| 65 to 74 Years | 0 (0.0%) | 0 (0.0%) |
| 75 Years and over | 4 (13.3%) | 0 (0.0%) |
Disability Class: Vision Difficulty
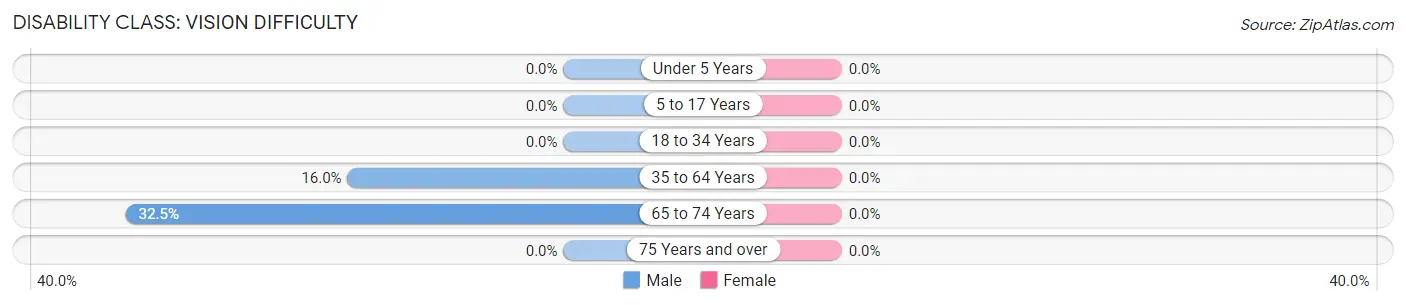
| Age Bracket | Male | Female |
| Under 5 Years | 0 (0.0%) | 0 (0.0%) |
| 5 to 17 Years | 0 (0.0%) | 0 (0.0%) |
| 18 to 34 Years | 0 (0.0%) | 0 (0.0%) |
| 35 to 64 Years | 50 (16.0%) | 0 (0.0%) |
| 65 to 74 Years | 13 (32.5%) | 0 (0.0%) |
| 75 Years and over | 0 (0.0%) | 0 (0.0%) |
Disability Class: Cognitive Difficulty
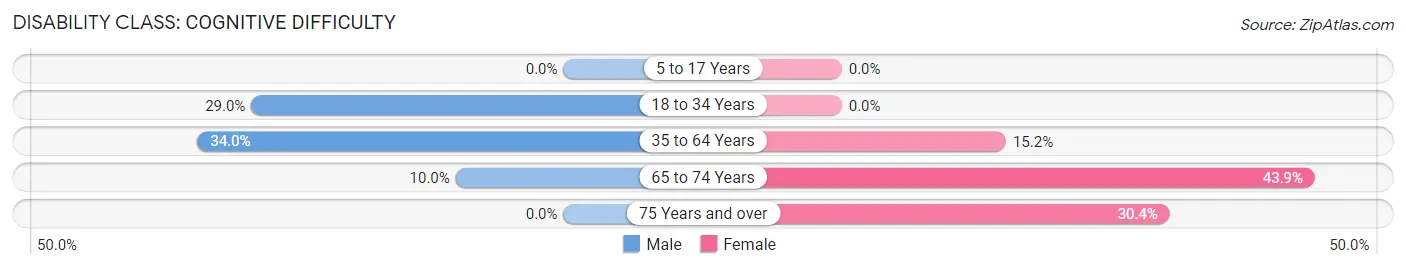
| Age Bracket | Male | Female |
| 5 to 17 Years | 0 (0.0%) | 0 (0.0%) |
| 18 to 34 Years | 31 (29.0%) | 0 (0.0%) |
| 35 to 64 Years | 106 (34.0%) | 41 (15.2%) |
| 65 to 74 Years | 4 (10.0%) | 18 (43.9%) |
| 75 Years and over | 0 (0.0%) | 14 (30.4%) |
Disability Class: Ambulatory Difficulty
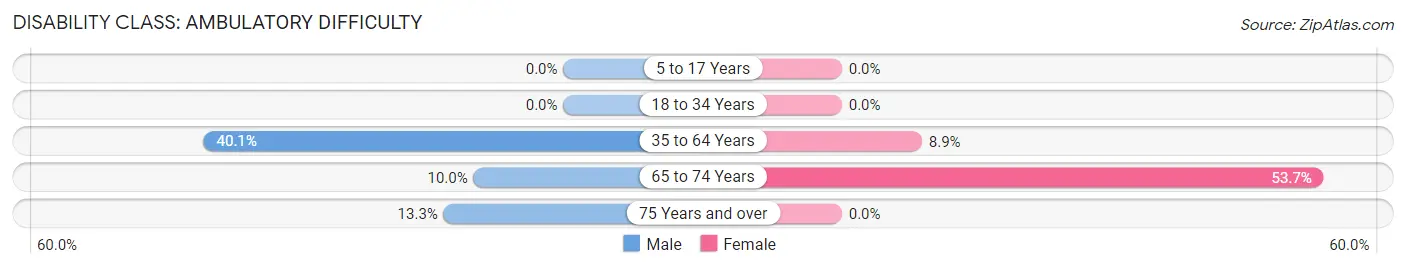
| Age Bracket | Male | Female |
| 5 to 17 Years | 0 (0.0%) | 0 (0.0%) |
| 18 to 34 Years | 0 (0.0%) | 0 (0.0%) |
| 35 to 64 Years | 125 (40.1%) | 24 (8.9%) |
| 65 to 74 Years | 4 (10.0%) | 22 (53.7%) |
| 75 Years and over | 4 (13.3%) | 0 (0.0%) |
Disability Class: Self-Care Difficulty
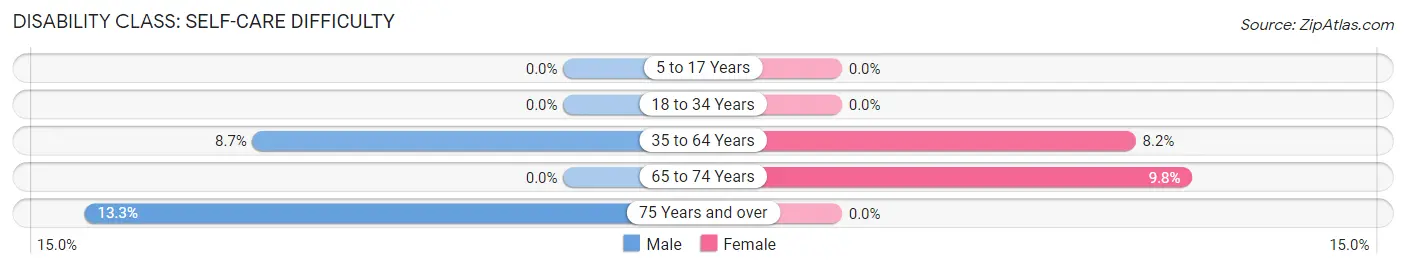
| Age Bracket | Male | Female |
| 5 to 17 Years | 0 (0.0%) | 0 (0.0%) |
| 18 to 34 Years | 0 (0.0%) | 0 (0.0%) |
| 35 to 64 Years | 27 (8.6%) | 22 (8.2%) |
| 65 to 74 Years | 0 (0.0%) | 4 (9.8%) |
| 75 Years and over | 4 (13.3%) | 0 (0.0%) |
Technology Access in Gloster
Computing Device Access in Gloster
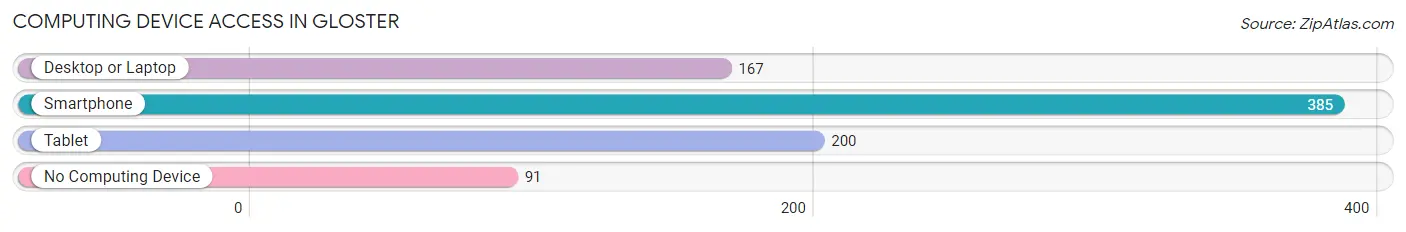
| Device Type | # Households | % Households |
| Desktop or Laptop | 167 | 32.6% |
| Smartphone | 385 | 75.0% |
| Tablet | 200 | 39.0% |
| No Computing Device | 91 | 17.7% |
| Total | 513 | 100.0% |
Internet Access in Gloster
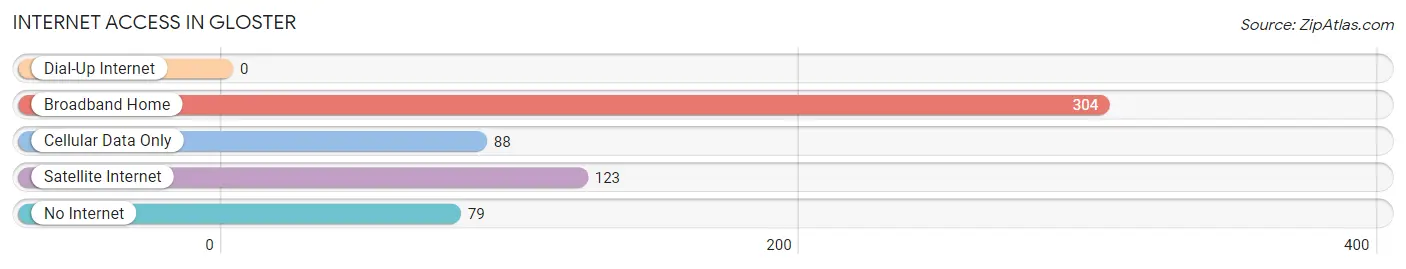
| Internet Type | # Households | % Households |
| Dial-Up Internet | 0 | 0.0% |
| Broadband Home | 304 | 59.3% |
| Cellular Data Only | 88 | 17.2% |
| Satellite Internet | 123 | 24.0% |
| No Internet | 79 | 15.4% |
| Total | 513 | 100.0% |
Gloster Summary
Gloster, Mississippi is a small town located in Amite County, Mississippi. It is situated in the southwestern part of the state, approximately 50 miles from the state capital of Jackson. The town has a population of 1,845 people, according to the 2010 census.
History
Gloster was founded in 1837 by a group of settlers from Georgia. The town was named after the Gloster family, who were among the first settlers. The town was incorporated in 1839 and was the county seat of Amite County until 1848, when the county seat was moved to Liberty.
In the late 19th century, Gloster was a thriving agricultural center, with cotton, corn, and other crops being grown in the area. The town also had a number of sawmills and gristmills, as well as a number of stores and other businesses.
In the early 20th century, Gloster was a popular tourist destination, with many people coming to the area to hunt and fish. The town also had a number of hotels and other businesses catering to tourists.
Geography
Gloster is located in southwestern Mississippi, approximately 50 miles from the state capital of Jackson. The town is situated in Amite County, which is bordered by Pike County to the north, Franklin County to the east, Wilkinson County to the south, and Walthall County to the west.
The town is situated on the banks of the Bogue Chitto River, which flows through the area. The town is also located near the Homochitto National Forest, which is a popular destination for outdoor activities such as camping, hiking, and fishing.
Economy
The economy of Gloster is largely based on agriculture. The town is home to a number of farms, which produce a variety of crops, including cotton, corn, soybeans, and wheat. The town also has a number of sawmills and gristmills, as well as a number of stores and other businesses.
The town is also home to a number of manufacturing companies, including a furniture factory and a woodworking plant. The town also has a number of restaurants and other businesses catering to tourists.
Demographics
According to the 2010 census, Gloster has a population of 1,845 people. The town has a median household income of $30,938, and the median age is 38.7 years. The town is predominantly white, with African Americans making up approximately 28% of the population.
Conclusion
Gloster, Mississippi is a small town located in Amite County, Mississippi. It is situated in the southwestern part of the state, approximately 50 miles from the state capital of Jackson. The town has a population of 1,845 people, according to the 2010 census. The town has a largely agricultural economy, with a number of farms, sawmills, and gristmills in the area. The town is also home to a number of manufacturing companies, restaurants, and other businesses catering to tourists. The town is predominantly white, with African Americans making up approximately 28% of the population.
Common Questions
What is Per Capita Income in Gloster?
Per Capita income in Gloster is $15,331.
What is the Median Family Income in Gloster?
Median Family Income in Gloster is $36,813.
What is the Median Household income in Gloster?
Median Household Income in Gloster is $22,131.
What is Income or Wage Gap in Gloster?
Income or Wage Gap in Gloster is 45.4%.
Women in Gloster earn 54.6 cents for every dollar earned by a man.
What is Inequality or Gini Index in Gloster?
Inequality or Gini Index in Gloster is 0.49.
What is the Total Population of Gloster?
Total Population of Gloster is 1,319.
What is the Total Male Population of Gloster?
Total Male Population of Gloster is 667.
What is the Total Female Population of Gloster?
Total Female Population of Gloster is 652.
What is the Ratio of Males per 100 Females in Gloster?
There are 102.30 Males per 100 Females in Gloster.
What is the Ratio of Females per 100 Males in Gloster?
There are 97.75 Females per 100 Males in Gloster.
What is the Median Population Age in Gloster?
Median Population Age in Gloster is 42.5 Years.
What is the Average Family Size in Gloster
Average Family Size in Gloster is 3.5 People.
What is the Average Household Size in Gloster
Average Household Size in Gloster is 2.6 People.
How Large is the Labor Force in Gloster?
There are 402 People in the Labor Forcein in Gloster.
What is the Percentage of People in the Labor Force in Gloster?
42.0% of People are in the Labor Force in Gloster.
What is the Unemployment Rate in Gloster?
Unemployment Rate in Gloster is 10.9%.