Oxford, MS Map & Demographics
Oxford Map
Oxford Overview
$36,979
PER CAPITA INCOME
$91,506
AVG FAMILY INCOME
$56,784
AVG HOUSEHOLD INCOME
33.6%
WAGE / INCOME GAP [ % ]
66.4¢/ $1
WAGE / INCOME GAP [ $ ]
0.58
INEQUALITY / GINI INDEX
25,713
TOTAL POPULATION
12,244
MALE POPULATION
13,469
FEMALE POPULATION
90.91
MALES / 100 FEMALES
110.00
FEMALES / 100 MALES
27.7
MEDIAN AGE
3.2
AVG FAMILY SIZE
2.5
AVG HOUSEHOLD SIZE
13,117
LABOR FORCE [ PEOPLE ]
60.0%
PERCENT IN LABOR FORCE
3.3%
UNEMPLOYMENT RATE
Oxford Zip Codes
Oxford Area Codes
Income in Oxford
Income Overview in Oxford
Per Capita Income in Oxford is $36,979, while median incomes of families and households are $91,506 and $56,784 respectively.
| Characteristic | Number | Measure |
| Per Capita Income | 25,713 | $36,979 |
| Median Family Income | 4,351 | $91,506 |
| Mean Family Income | 4,351 | $141,958 |
| Median Household Income | 9,773 | $56,784 |
| Mean Household Income | 9,773 | $92,067 |
| Income Deficit | 4,351 | $0 |
| Wage / Income Gap (%) | 25,713 | 33.59% |
| Wage / Income Gap ($) | 25,713 | 66.41¢ per $1 |
| Gini / Inequality Index | 25,713 | 0.58 |
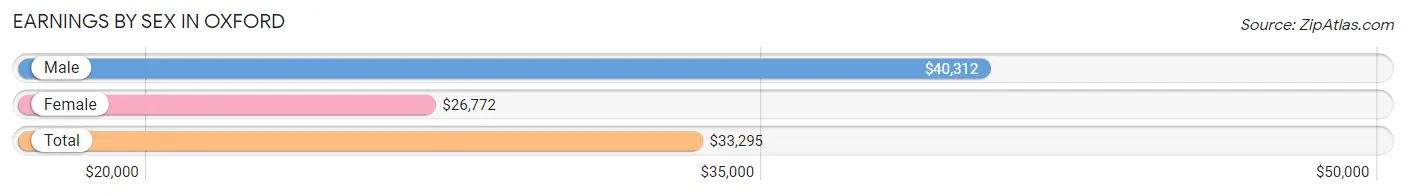
Earnings by Sex in Oxford
Average Earnings in Oxford are $33,295, $40,312 for men and $26,772 for women, a difference of 33.6%.
| Sex | Number | Average Earnings |
| Male | 6,400 (46.6%) | $40,312 |
| Female | 7,326 (53.4%) | $26,772 |
| Total | 13,726 (100.0%) | $33,295 |
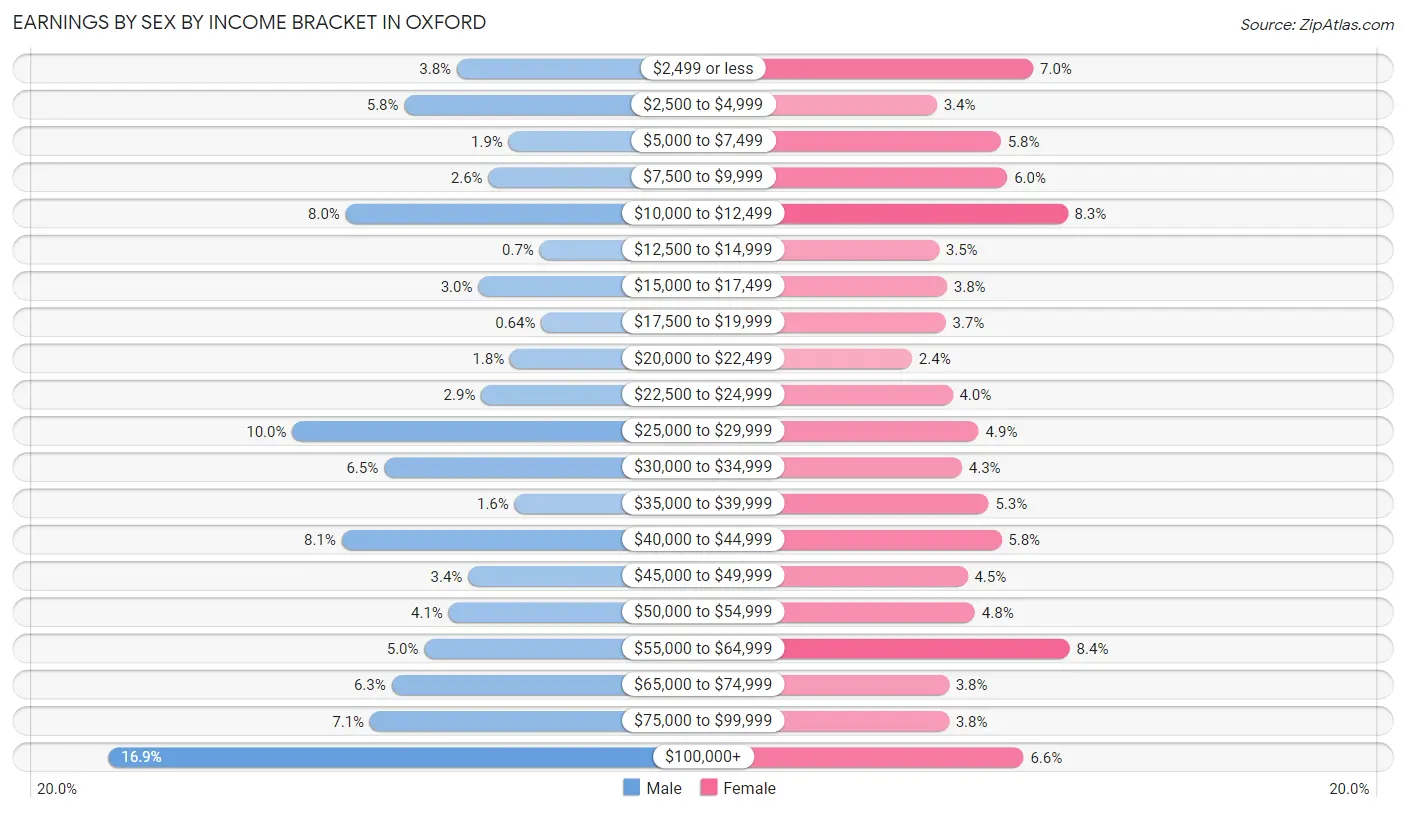
Earnings by Sex by Income Bracket in Oxford
The most common earnings brackets in Oxford are $100,000+ for men (1,079 | 16.9%) and $55,000 to $64,999 for women (612 | 8.4%).
| Income | Male | Female |
| $2,499 or less | 243 (3.8%) | 511 (7.0%) |
| $2,500 to $4,999 | 369 (5.8%) | 247 (3.4%) |
| $5,000 to $7,499 | 119 (1.9%) | 423 (5.8%) |
| $7,500 to $9,999 | 168 (2.6%) | 440 (6.0%) |
| $10,000 to $12,499 | 510 (8.0%) | 606 (8.3%) |
| $12,500 to $14,999 | 45 (0.7%) | 253 (3.5%) |
| $15,000 to $17,499 | 192 (3.0%) | 275 (3.7%) |
| $17,500 to $19,999 | 41 (0.6%) | 271 (3.7%) |
| $20,000 to $22,499 | 116 (1.8%) | 179 (2.4%) |
| $22,500 to $24,999 | 185 (2.9%) | 290 (4.0%) |
| $25,000 to $29,999 | 638 (10.0%) | 362 (4.9%) |
| $30,000 to $34,999 | 418 (6.5%) | 316 (4.3%) |
| $35,000 to $39,999 | 105 (1.6%) | 389 (5.3%) |
| $40,000 to $44,999 | 520 (8.1%) | 424 (5.8%) |
| $45,000 to $49,999 | 216 (3.4%) | 331 (4.5%) |
| $50,000 to $54,999 | 263 (4.1%) | 352 (4.8%) |
| $55,000 to $64,999 | 321 (5.0%) | 612 (8.4%) |
| $65,000 to $74,999 | 400 (6.2%) | 280 (3.8%) |
| $75,000 to $99,999 | 452 (7.1%) | 280 (3.8%) |
| $100,000+ | 1,079 (16.9%) | 485 (6.6%) |
| Total | 6,400 (100.0%) | 7,326 (100.0%) |
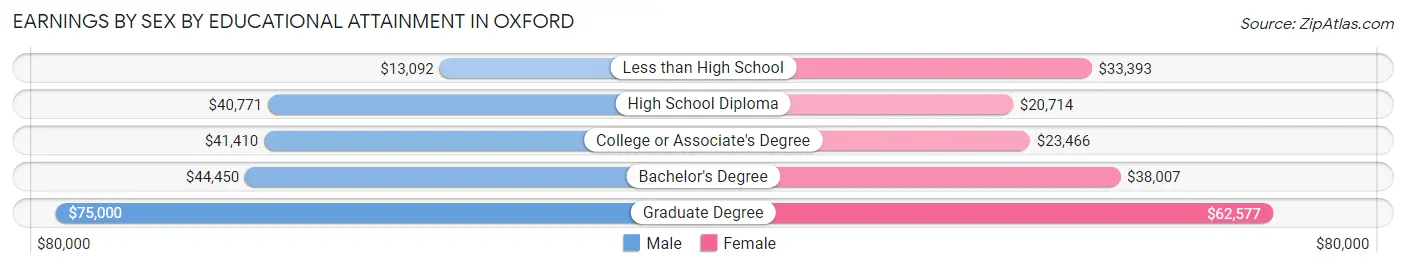
Earnings by Sex by Educational Attainment in Oxford
Average earnings in Oxford are $47,310 for men and $39,650 for women, a difference of 16.2%. Men with an educational attainment of graduate degree enjoy the highest average annual earnings of $75,000, while those with less than high school education earn the least with $13,092. Women with an educational attainment of graduate degree earn the most with the average annual earnings of $62,577, while those with high school diploma education have the smallest earnings of $20,714.
| Educational Attainment | Male Income | Female Income |
| Less than High School | $13,092 | $33,393 |
| High School Diploma | $40,771 | $20,714 |
| College or Associate's Degree | $41,410 | $23,466 |
| Bachelor's Degree | $44,450 | $38,007 |
| Graduate Degree | $75,000 | $62,577 |
| Total | $47,310 | $39,650 |
Family Income in Oxford
Family Income Brackets in Oxford
According to the Oxford family income data, there are 744 families falling into the $50,000 to $74,999 income range, which is the most common income bracket and makes up 17.1% of all families. Conversely, the $10,000 to $14,999 income bracket is the least frequent group with only 39 families (0.9%) belonging to this category.
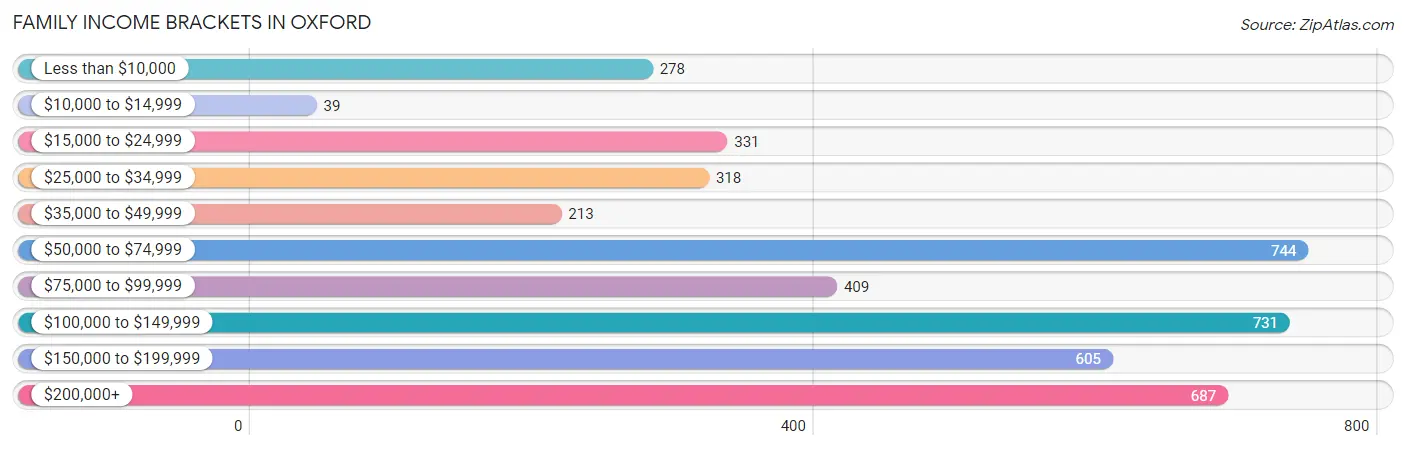
| Income Bracket | # Families | % Families |
| Less than $10,000 | 278 | 6.4% |
| $10,000 to $14,999 | 39 | 0.9% |
| $15,000 to $24,999 | 331 | 7.6% |
| $25,000 to $34,999 | 318 | 7.3% |
| $35,000 to $49,999 | 213 | 4.9% |
| $50,000 to $74,999 | 744 | 17.1% |
| $75,000 to $99,999 | 409 | 9.4% |
| $100,000 to $149,999 | 731 | 16.8% |
| $150,000 to $199,999 | 605 | 13.9% |
| $200,000+ | 687 | 15.8% |
Family Income by Famaliy Size in Oxford
6-person families (51 | 1.2%) account for the highest median family income in Oxford with $180,078 per family, while 2-person families (2,447 | 56.2%) have the highest median income of $45,414 per family member.
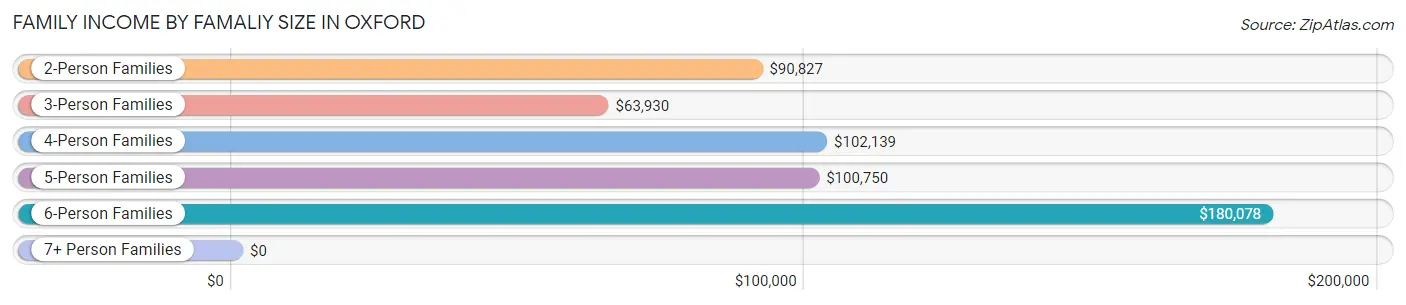
| Income Bracket | # Families | Median Income |
| 2-Person Families | 2,447 (56.2%) | $90,827 |
| 3-Person Families | 707 (16.3%) | $63,930 |
| 4-Person Families | 832 (19.1%) | $102,139 |
| 5-Person Families | 282 (6.5%) | $100,750 |
| 6-Person Families | 51 (1.2%) | $180,078 |
| 7+ Person Families | 32 (0.7%) | $0 |
| Total | 4,351 (100.0%) | $91,506 |
Family Income by Number of Earners in Oxford
The median family income in Oxford is $91,506, with families comprising 3+ earners (190) having the highest median family income of $180,708, while families with 1 earner (1,511) have the lowest median family income of $49,315, accounting for 4.4% and 34.7% of families, respectively.
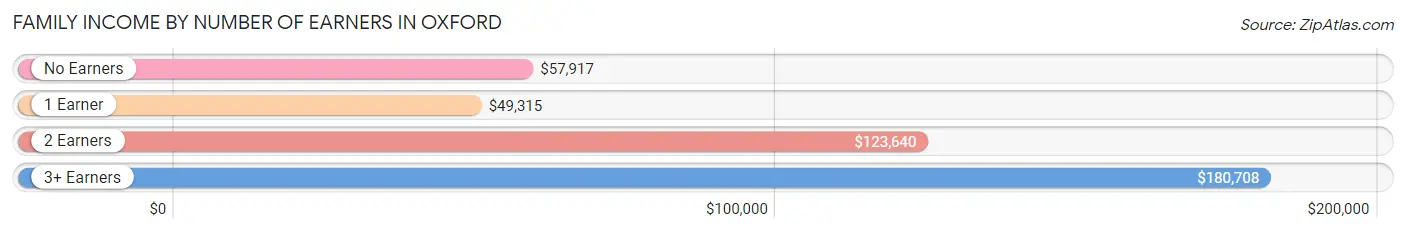
| Number of Earners | # Families | Median Income |
| No Earners | 608 (14.0%) | $57,917 |
| 1 Earner | 1,511 (34.7%) | $49,315 |
| 2 Earners | 2,042 (46.9%) | $123,640 |
| 3+ Earners | 190 (4.4%) | $180,708 |
| Total | 4,351 (100.0%) | $91,506 |
Household Income in Oxford
Household Income Brackets in Oxford
With 1,691 households falling in the category, the $50,000 to $74,999 income range is the most frequent in Oxford, accounting for 17.3% of all households. In contrast, only 596 households (6.1%) fall into the $10,000 to $14,999 income bracket, making it the least populous group.
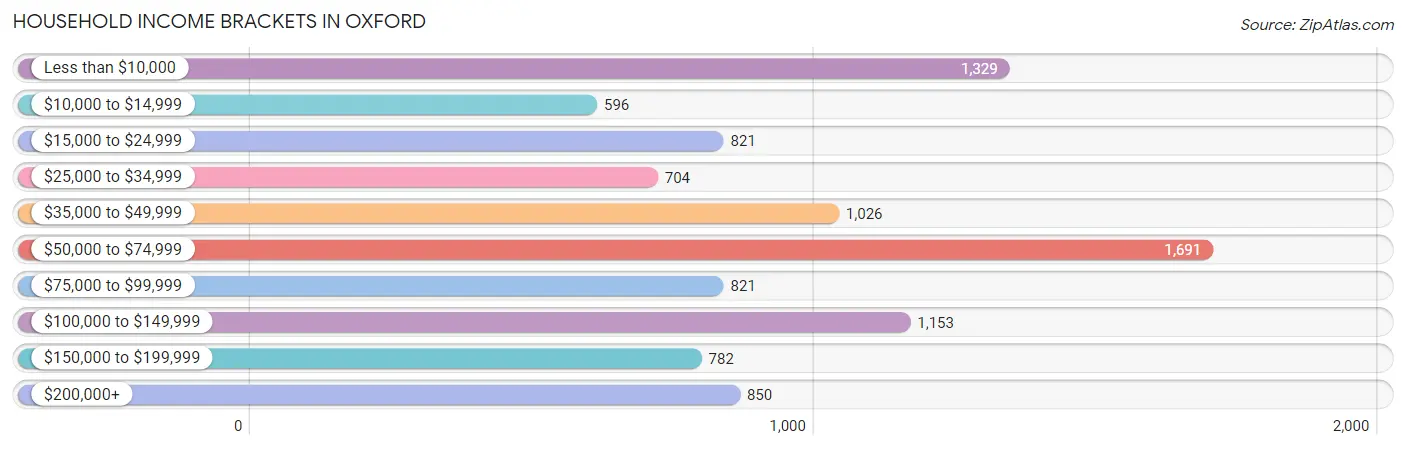
| Income Bracket | # Households | % Households |
| Less than $10,000 | 1,329 | 13.6% |
| $10,000 to $14,999 | 596 | 6.1% |
| $15,000 to $24,999 | 821 | 8.4% |
| $25,000 to $34,999 | 704 | 7.2% |
| $35,000 to $49,999 | 1,026 | 10.5% |
| $50,000 to $74,999 | 1,691 | 17.3% |
| $75,000 to $99,999 | 821 | 8.4% |
| $100,000 to $149,999 | 1,153 | 11.8% |
| $150,000 to $199,999 | 782 | 8.0% |
| $200,000+ | 850 | 8.7% |
Household Income by Householder Age in Oxford
The median household income in Oxford is $56,784, with the highest median household income of $98,795 found in the 45 to 64 years age bracket for the primary householder. A total of 2,129 households (21.8%) fall into this category. Meanwhile, the 15 to 24 years age bracket for the primary householder has the lowest median household income of $10,159, with 1,738 households (17.8%) in this group.
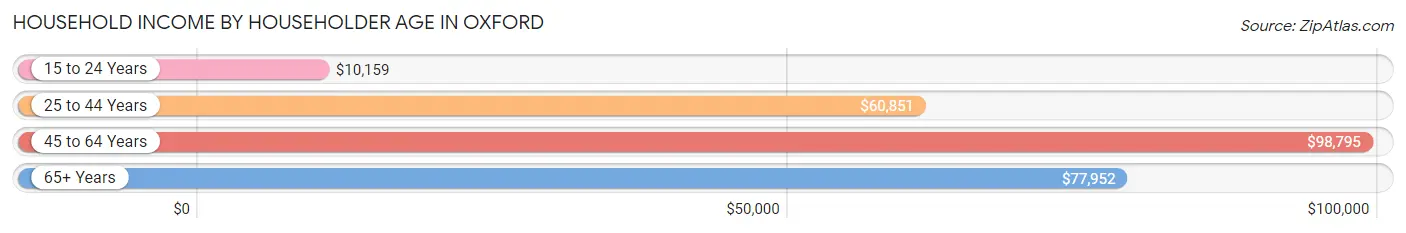
| Income Bracket | # Households | Median Income |
| 15 to 24 Years | 1,738 (17.8%) | $10,159 |
| 25 to 44 Years | 3,851 (39.4%) | $60,851 |
| 45 to 64 Years | 2,129 (21.8%) | $98,795 |
| 65+ Years | 2,055 (21.0%) | $77,952 |
| Total | 9,773 (100.0%) | $56,784 |
Poverty in Oxford
Income Below Poverty by Sex and Age in Oxford
With 28.3% poverty level for males and 28.0% for females among the residents of Oxford, 18 to 24 year old males and 18 to 24 year old females are the most vulnerable to poverty, with 2,325 males (72.5%) and 2,306 females (72.0%) in their respective age groups living below the poverty level.
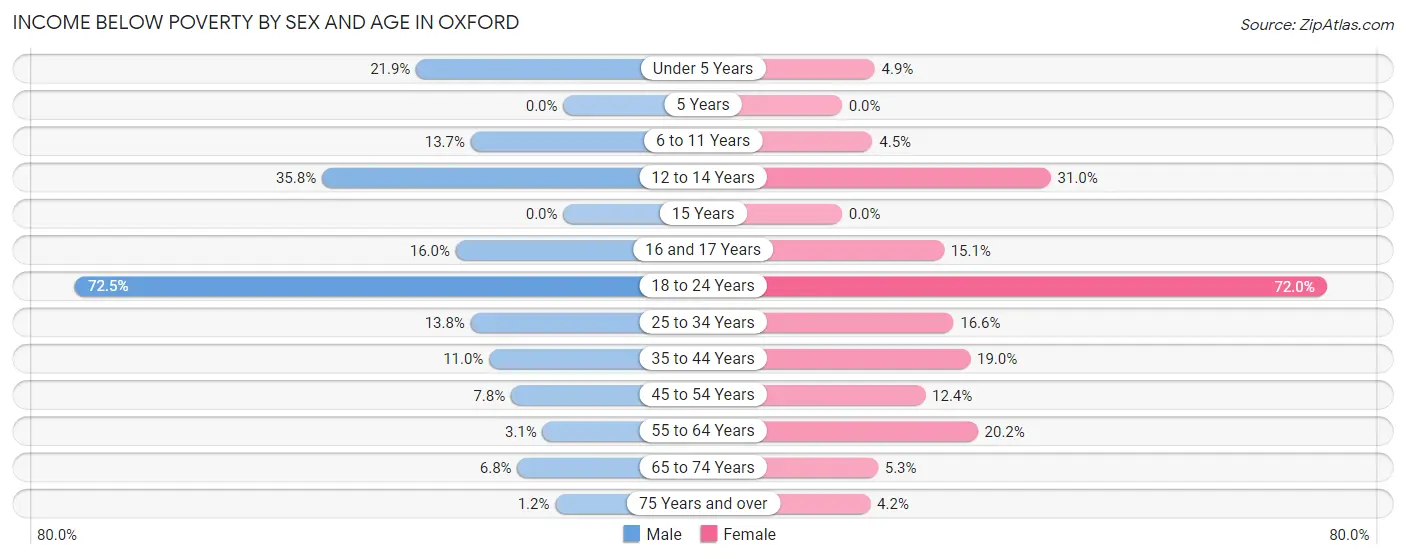
| Age Bracket | Male | Female |
| Under 5 Years | 144 (21.8%) | 28 (4.9%) |
| 5 Years | 0 (0.0%) | 0 (0.0%) |
| 6 to 11 Years | 93 (13.7%) | 22 (4.5%) |
| 12 to 14 Years | 124 (35.8%) | 160 (31.0%) |
| 15 Years | 0 (0.0%) | 0 (0.0%) |
| 16 and 17 Years | 19 (16.0%) | 41 (15.1%) |
| 18 to 24 Years | 2,325 (72.5%) | 2,306 (72.0%) |
| 25 to 34 Years | 313 (13.8%) | 371 (16.6%) |
| 35 to 44 Years | 139 (11.0%) | 310 (19.0%) |
| 45 to 54 Years | 63 (7.8%) | 159 (12.4%) |
| 55 to 64 Years | 26 (3.1%) | 188 (20.2%) |
| 65 to 74 Years | 54 (6.8%) | 50 (5.3%) |
| 75 Years and over | 5 (1.2%) | 36 (4.2%) |
| Total | 3,305 (28.3%) | 3,671 (28.0%) |
Income Above Poverty by Sex and Age in Oxford
According to the poverty statistics in Oxford, males aged 5 years and females aged 5 years are the age groups that are most secure financially, with 100.0% of males and 100.0% of females in these age groups living above the poverty line.
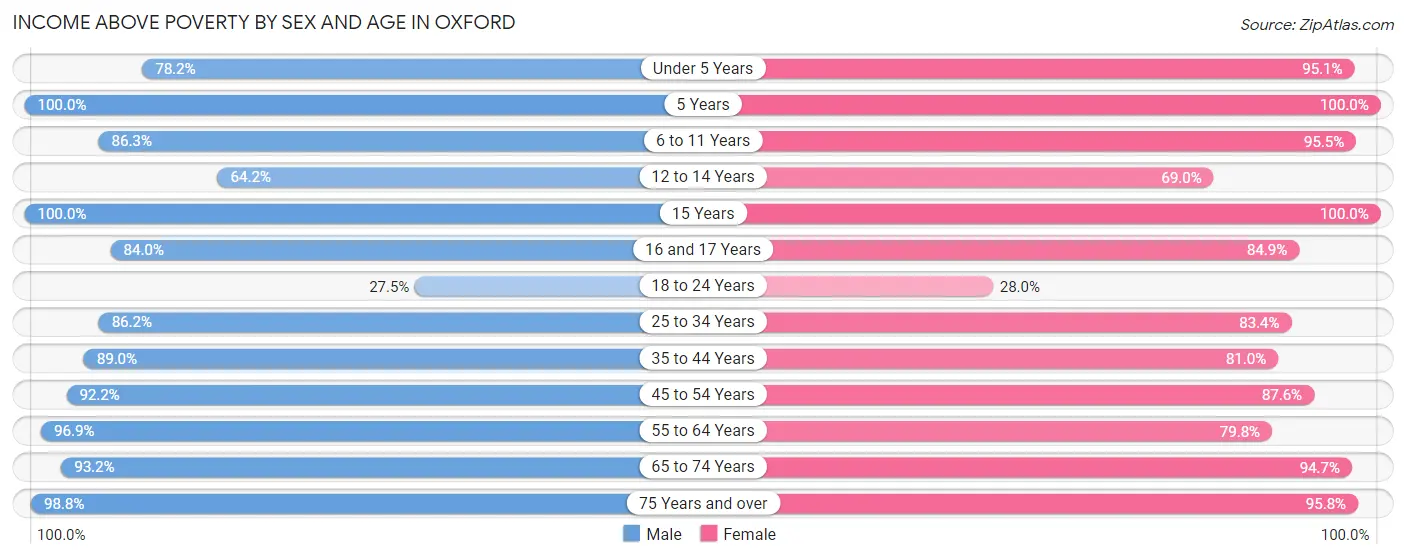
| Age Bracket | Male | Female |
| Under 5 Years | 515 (78.1%) | 547 (95.1%) |
| 5 Years | 45 (100.0%) | 167 (100.0%) |
| 6 to 11 Years | 584 (86.3%) | 463 (95.5%) |
| 12 to 14 Years | 222 (64.2%) | 356 (69.0%) |
| 15 Years | 239 (100.0%) | 24 (100.0%) |
| 16 and 17 Years | 100 (84.0%) | 230 (84.9%) |
| 18 to 24 Years | 882 (27.5%) | 898 (28.0%) |
| 25 to 34 Years | 1,961 (86.2%) | 1,869 (83.4%) |
| 35 to 44 Years | 1,124 (89.0%) | 1,318 (81.0%) |
| 45 to 54 Years | 748 (92.2%) | 1,126 (87.6%) |
| 55 to 64 Years | 819 (96.9%) | 744 (79.8%) |
| 65 to 74 Years | 738 (93.2%) | 886 (94.7%) |
| 75 Years and over | 412 (98.8%) | 819 (95.8%) |
| Total | 8,389 (71.7%) | 9,447 (72.0%) |
Income Below Poverty Among Married-Couple Families in Oxford
The poverty statistics for married-couple families in Oxford show that 5.8% or 204 of the total 3,525 families live below the poverty line. Families with 3 or 4 children have the highest poverty rate of 11.2%, comprising of 32 families. On the other hand, families with no children have the lowest poverty rate of 4.4%, which includes 93 families.
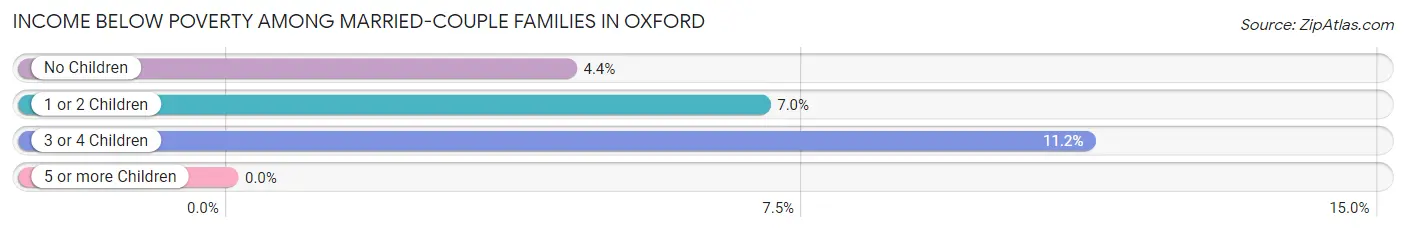
| Children | Above Poverty | Below Poverty |
| No Children | 2,009 (95.6%) | 93 (4.4%) |
| 1 or 2 Children | 1,058 (93.0%) | 79 (7.0%) |
| 3 or 4 Children | 254 (88.8%) | 32 (11.2%) |
| 5 or more Children | 0 (0.0%) | 0 (0.0%) |
| Total | 3,321 (94.2%) | 204 (5.8%) |
Income Below Poverty Among Single-Parent Households in Oxford
According to the poverty data in Oxford, 35.2% or 31 single-father households and 25.9% or 191 single-mother households are living below the poverty line. Among single-father households, those with no children have the highest poverty rate, with 31 households (35.2%) experiencing poverty. Likewise, among single-mother households, those with 3 or 4 children have the highest poverty rate, with 18 households (100.0%) falling below the poverty line.
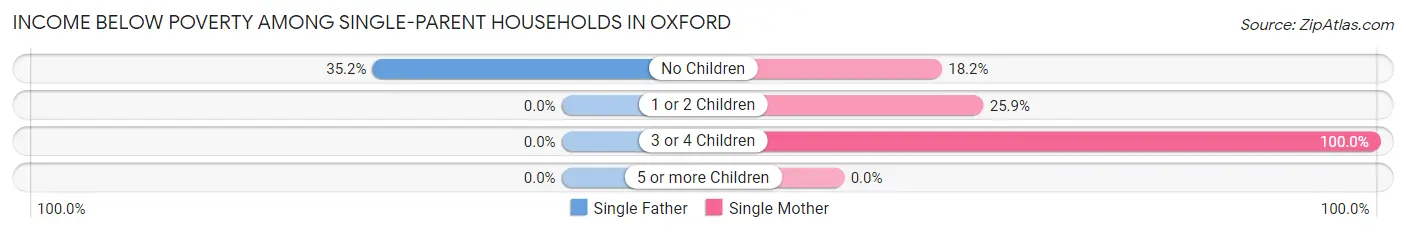
| Children | Single Father | Single Mother |
| No Children | 31 (35.2%) | 32 (18.2%) |
| 1 or 2 Children | 0 (0.0%) | 141 (25.9%) |
| 3 or 4 Children | 0 (0.0%) | 18 (100.0%) |
| 5 or more Children | 0 (0.0%) | 0 (0.0%) |
| Total | 31 (35.2%) | 191 (25.9%) |
Income Below Poverty Among Married-Couple vs Single-Parent Households in Oxford
The poverty data for Oxford shows that 204 of the married-couple family households (5.8%) and 222 of the single-parent households (26.9%) are living below the poverty level. Within the married-couple family households, those with 3 or 4 children have the highest poverty rate, with 32 households (11.2%) falling below the poverty line. Among the single-parent households, those with 3 or 4 children have the highest poverty rate, with 18 household (100.0%) living below poverty.
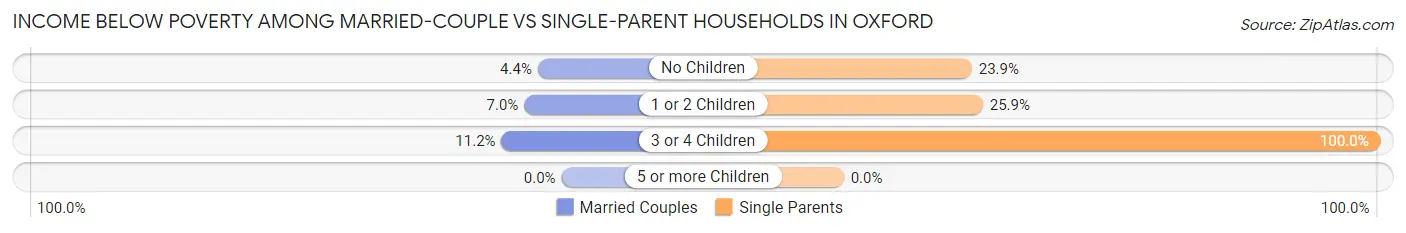
| Children | Married-Couple Families | Single-Parent Households |
| No Children | 93 (4.4%) | 63 (23.9%) |
| 1 or 2 Children | 79 (7.0%) | 141 (25.9%) |
| 3 or 4 Children | 32 (11.2%) | 18 (100.0%) |
| 5 or more Children | 0 (0.0%) | 0 (0.0%) |
| Total | 204 (5.8%) | 222 (26.9%) |
Race in Oxford
The most populous races in Oxford are White / Caucasian (17,613 | 68.5%), Black / African American (6,604 | 25.7%), and Asian (662 | 2.6%).
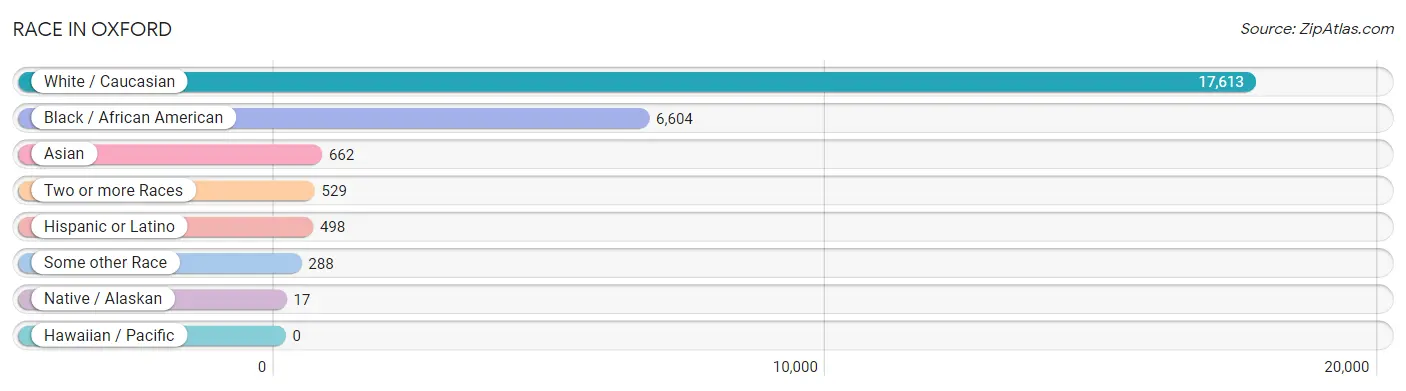
| Race | # Population | % Population |
| Asian | 662 | 2.6% |
| Black / African American | 6,604 | 25.7% |
| Hawaiian / Pacific | 0 | 0.0% |
| Hispanic or Latino | 498 | 1.9% |
| Native / Alaskan | 17 | 0.1% |
| White / Caucasian | 17,613 | 68.5% |
| Two or more Races | 529 | 2.1% |
| Some other Race | 288 | 1.1% |
| Total | 25,713 | 100.0% |
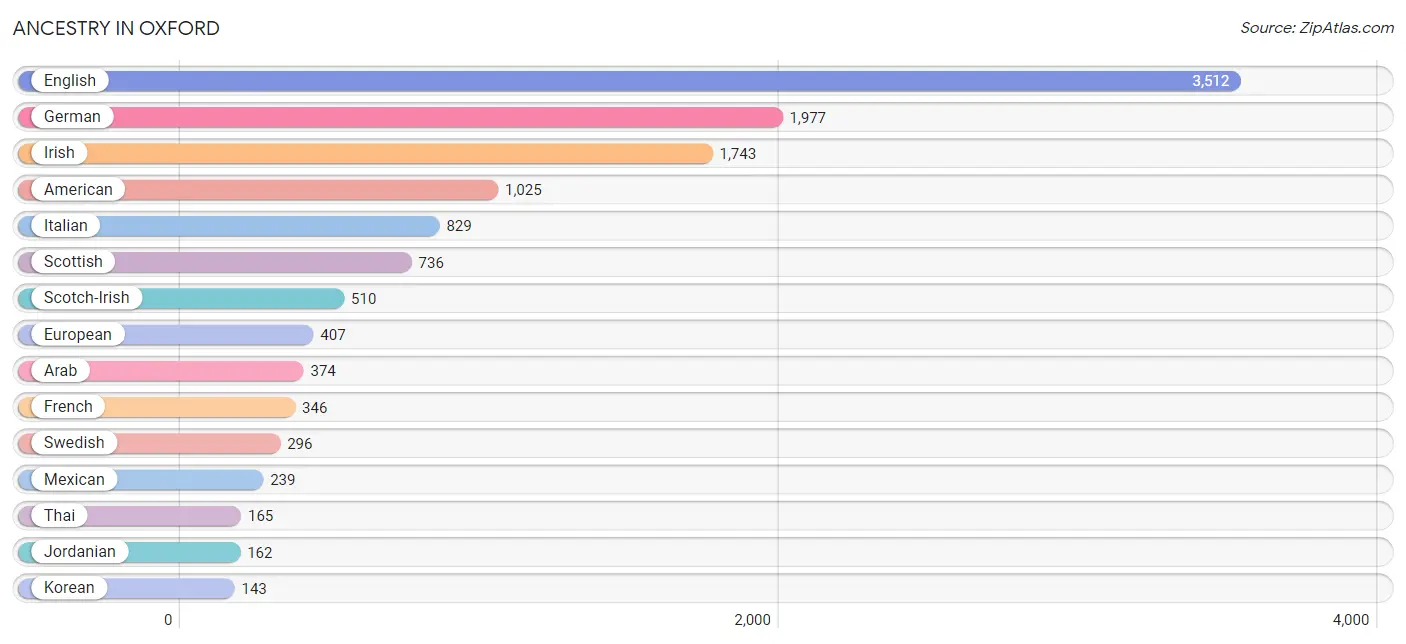
Ancestry in Oxford
The most populous ancestries reported in Oxford are English (3,512 | 13.7%), German (1,977 | 7.7%), Irish (1,743 | 6.8%), American (1,025 | 4.0%), and Italian (829 | 3.2%), together accounting for 35.3% of all Oxford residents.
| Ancestry | # Population | % Population |
| Afghan | 28 | 0.1% |
| American | 1,025 | 4.0% |
| Arab | 374 | 1.5% |
| Armenian | 7 | 0.0% |
| Austrian | 18 | 0.1% |
| Bahamian | 112 | 0.4% |
| Bhutanese | 137 | 0.5% |
| Bolivian | 81 | 0.3% |
| Brazilian | 54 | 0.2% |
| British | 89 | 0.4% |
| Burmese | 8 | 0.0% |
| Canadian | 10 | 0.0% |
| Celtic | 51 | 0.2% |
| Cherokee | 8 | 0.0% |
| Choctaw | 24 | 0.1% |
| Colombian | 16 | 0.1% |
| Croatian | 16 | 0.1% |
| Cuban | 119 | 0.5% |
| Czech | 60 | 0.2% |
| Czechoslovakian | 2 | 0.0% |
| Danish | 22 | 0.1% |
| Dutch | 70 | 0.3% |
| Eastern European | 14 | 0.1% |
| English | 3,512 | 13.7% |
| Ethiopian | 42 | 0.2% |
| European | 407 | 1.6% |
| Finnish | 48 | 0.2% |
| French | 346 | 1.3% |
| German | 1,977 | 7.7% |
| Greek | 6 | 0.0% |
| Haitian | 9 | 0.0% |
| Hungarian | 6 | 0.0% |
| Indian (Asian) | 110 | 0.4% |
| Iranian | 28 | 0.1% |
| Irish | 1,743 | 6.8% |
| Italian | 829 | 3.2% |
| Jamaican | 15 | 0.1% |
| Jordanian | 162 | 0.6% |
| Kenyan | 11 | 0.0% |
| Korean | 143 | 0.6% |
| Lebanese | 77 | 0.3% |
| Mexican | 239 | 0.9% |
| Northern European | 37 | 0.1% |
| Norwegian | 82 | 0.3% |
| Pakistani | 52 | 0.2% |
| Polish | 120 | 0.5% |
| Portuguese | 13 | 0.1% |
| Romanian | 20 | 0.1% |
| Russian | 5 | 0.0% |
| Scandinavian | 16 | 0.1% |
| Scotch-Irish | 510 | 2.0% |
| Scottish | 736 | 2.9% |
| Slovak | 29 | 0.1% |
| South American | 122 | 0.5% |
| Sri Lankan | 121 | 0.5% |
| Subsaharan African | 92 | 0.4% |
| Swedish | 296 | 1.1% |
| Swiss | 19 | 0.1% |
| Syrian | 8 | 0.0% |
| Thai | 165 | 0.6% |
| Ukrainian | 13 | 0.1% |
| Venezuelan | 25 | 0.1% |
| Welsh | 68 | 0.3% | View All 63 Rows |
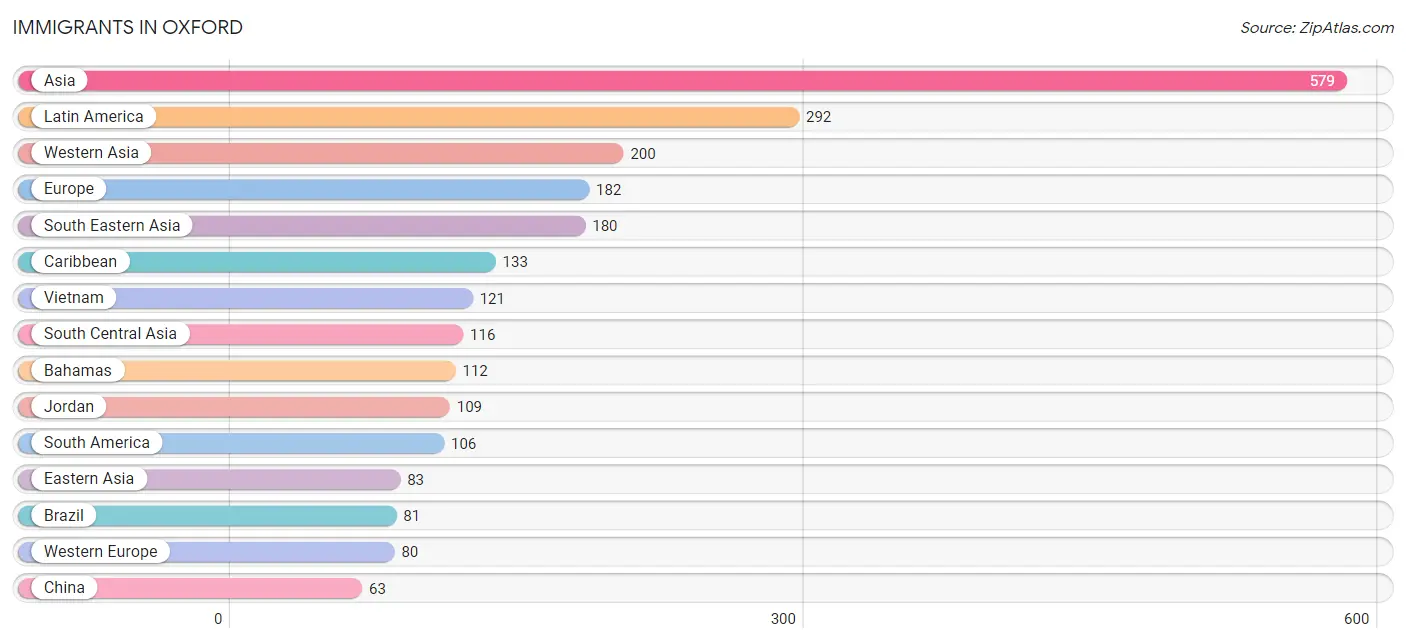
Immigrants in Oxford
The most numerous immigrant groups reported in Oxford came from Asia (579 | 2.2%), Latin America (292 | 1.1%), Western Asia (200 | 0.8%), Europe (182 | 0.7%), and South Eastern Asia (180 | 0.7%), together accounting for 5.6% of all Oxford residents.
| Immigration Origin | # Population | % Population |
| Africa | 55 | 0.2% |
| Asia | 579 | 2.2% |
| Bahamas | 112 | 0.4% |
| Bangladesh | 58 | 0.2% |
| Brazil | 81 | 0.3% |
| Cameroon | 2 | 0.0% |
| Caribbean | 133 | 0.5% |
| Central America | 53 | 0.2% |
| China | 63 | 0.3% |
| Czechoslovakia | 7 | 0.0% |
| Eastern Africa | 53 | 0.2% |
| Eastern Asia | 83 | 0.3% |
| Eastern Europe | 51 | 0.2% |
| England | 2 | 0.0% |
| Ethiopia | 42 | 0.2% |
| Europe | 182 | 0.7% |
| France | 37 | 0.1% |
| Germany | 28 | 0.1% |
| India | 47 | 0.2% |
| Israel | 38 | 0.2% |
| Italy | 11 | 0.0% |
| Japan | 15 | 0.1% |
| Jordan | 109 | 0.4% |
| Kenya | 11 | 0.0% |
| Korea | 5 | 0.0% |
| Latin America | 292 | 1.1% |
| Mexico | 53 | 0.2% |
| Middle Africa | 2 | 0.0% |
| Nepal | 11 | 0.0% |
| Netherlands | 15 | 0.1% |
| Northern Europe | 40 | 0.2% |
| Romania | 10 | 0.0% |
| Saudi Arabia | 39 | 0.2% |
| Scotland | 21 | 0.1% |
| South America | 106 | 0.4% |
| South Central Asia | 116 | 0.4% |
| South Eastern Asia | 180 | 0.7% |
| Southern Europe | 11 | 0.0% |
| Thailand | 59 | 0.2% |
| Trinidad and Tobago | 21 | 0.1% |
| Ukraine | 34 | 0.1% |
| Venezuela | 25 | 0.1% |
| Vietnam | 121 | 0.5% |
| Western Asia | 200 | 0.8% |
| Western Europe | 80 | 0.3% | View All 45 Rows |
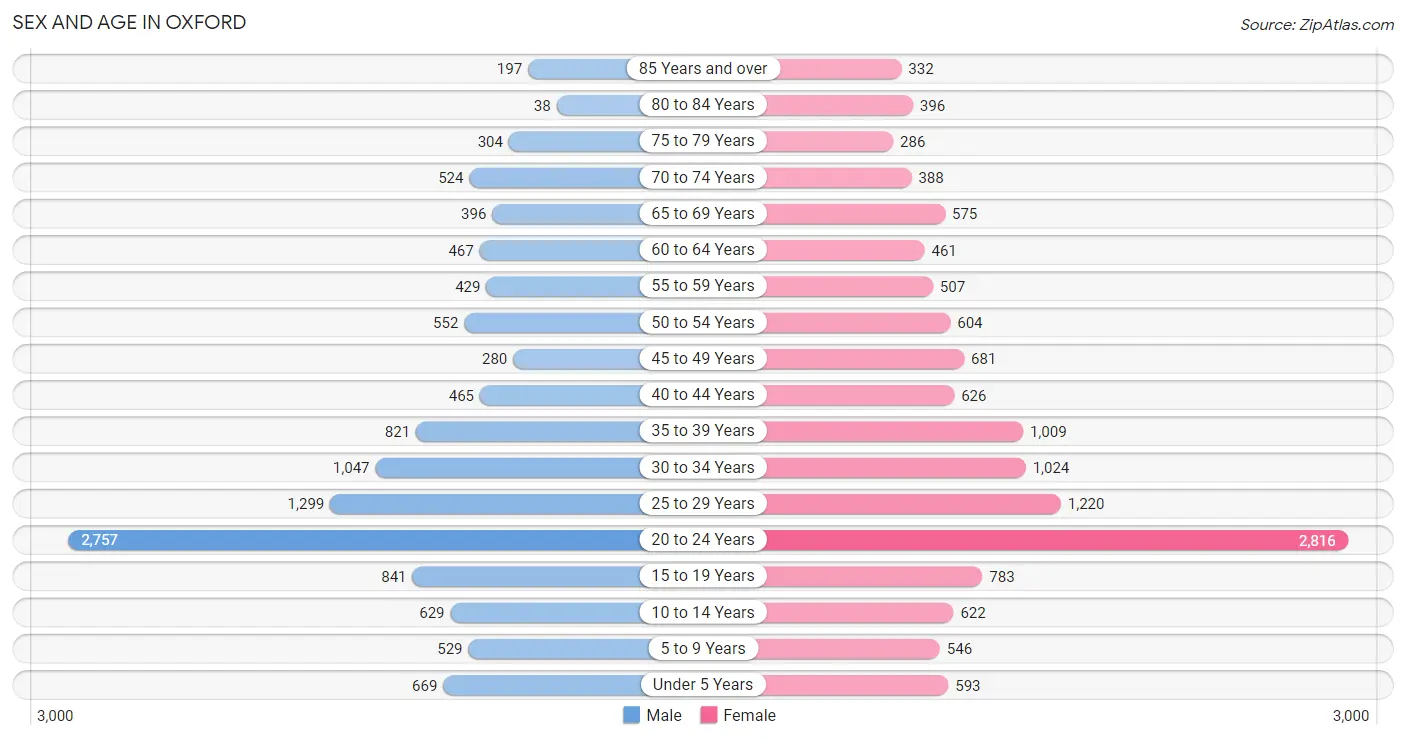
Sex and Age in Oxford
Sex and Age in Oxford
The most populous age groups in Oxford are 20 to 24 Years (2,757 | 22.5%) for men and 20 to 24 Years (2,816 | 20.9%) for women.
| Age Bracket | Male | Female |
| Under 5 Years | 669 (5.5%) | 593 (4.4%) |
| 5 to 9 Years | 529 (4.3%) | 546 (4.1%) |
| 10 to 14 Years | 629 (5.1%) | 622 (4.6%) |
| 15 to 19 Years | 841 (6.9%) | 783 (5.8%) |
| 20 to 24 Years | 2,757 (22.5%) | 2,816 (20.9%) |
| 25 to 29 Years | 1,299 (10.6%) | 1,220 (9.1%) |
| 30 to 34 Years | 1,047 (8.6%) | 1,024 (7.6%) |
| 35 to 39 Years | 821 (6.7%) | 1,009 (7.5%) |
| 40 to 44 Years | 465 (3.8%) | 626 (4.6%) |
| 45 to 49 Years | 280 (2.3%) | 681 (5.1%) |
| 50 to 54 Years | 552 (4.5%) | 604 (4.5%) |
| 55 to 59 Years | 429 (3.5%) | 507 (3.8%) |
| 60 to 64 Years | 467 (3.8%) | 461 (3.4%) |
| 65 to 69 Years | 396 (3.2%) | 575 (4.3%) |
| 70 to 74 Years | 524 (4.3%) | 388 (2.9%) |
| 75 to 79 Years | 304 (2.5%) | 286 (2.1%) |
| 80 to 84 Years | 38 (0.3%) | 396 (2.9%) |
| 85 Years and over | 197 (1.6%) | 332 (2.5%) |
| Total | 12,244 (100.0%) | 13,469 (100.0%) |
Families and Households in Oxford
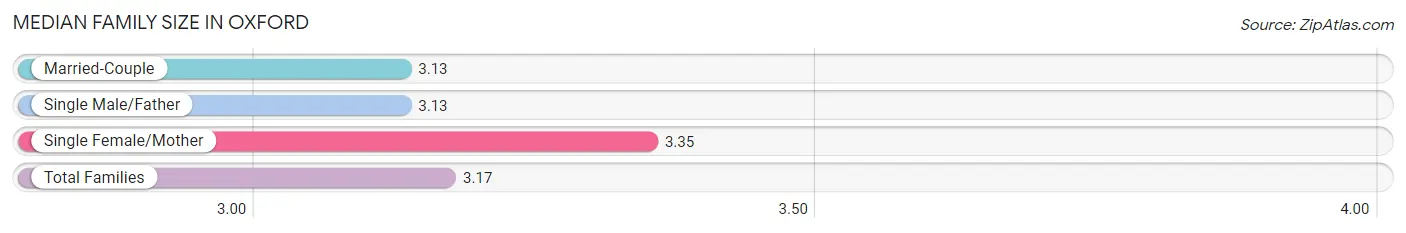
Median Family Size in Oxford
The median family size in Oxford is 3.17 persons per family, with single female/mother families (738 | 17.0%) accounting for the largest median family size of 3.35 persons per family. On the other hand, married-couple families (3,525 | 81.0%) represent the smallest median family size with 3.13 persons per family.
| Family Type | # Families | Family Size |
| Married-Couple | 3,525 (81.0%) | 3.13 |
| Single Male/Father | 88 (2.0%) | 3.13 |
| Single Female/Mother | 738 (17.0%) | 3.35 |
| Total Families | 4,351 (100.0%) | 3.17 |
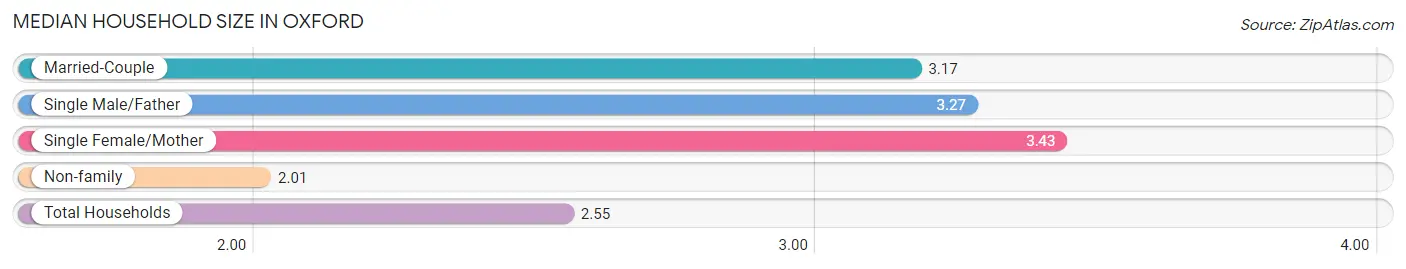
Median Household Size in Oxford
The median household size in Oxford is 2.55 persons per household, with single female/mother households (738 | 7.5%) accounting for the largest median household size of 3.43 persons per household. non-family households (5,422 | 55.5%) represent the smallest median household size with 2.01 persons per household.
| Household Type | # Households | Household Size |
| Married-Couple | 3,525 (36.1%) | 3.17 |
| Single Male/Father | 88 (0.9%) | 3.27 |
| Single Female/Mother | 738 (7.5%) | 3.43 |
| Non-family | 5,422 (55.5%) | 2.01 |
| Total Households | 9,773 (100.0%) | 2.55 |
Household Size by Marriage Status in Oxford
Out of a total of 9,773 households in Oxford, 4,351 (44.5%) are family households, while 5,422 (55.5%) are nonfamily households. The most numerous type of family households are 2-person households, comprising 2,382, and the most common type of nonfamily households are 1-person households, comprising 3,565.
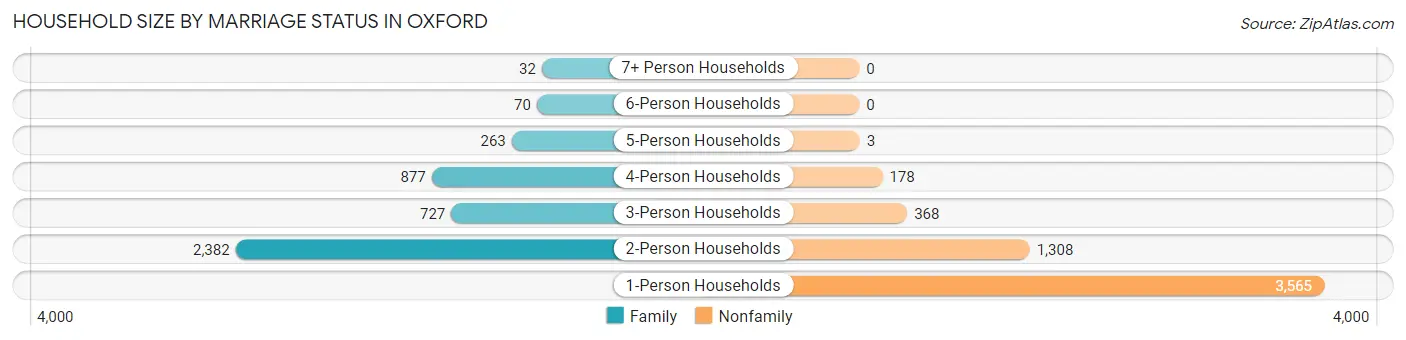
| Household Size | Family Households | Nonfamily Households |
| 1-Person Households | - | 3,565 (36.5%) |
| 2-Person Households | 2,382 (24.4%) | 1,308 (13.4%) |
| 3-Person Households | 727 (7.4%) | 368 (3.8%) |
| 4-Person Households | 877 (9.0%) | 178 (1.8%) |
| 5-Person Households | 263 (2.7%) | 3 (0.0%) |
| 6-Person Households | 70 (0.7%) | 0 (0.0%) |
| 7+ Person Households | 32 (0.3%) | 0 (0.0%) |
| Total | 4,351 (44.5%) | 5,422 (55.5%) |
Female Fertility in Oxford
Fertility by Age in Oxford
Average fertility rate in Oxford is 37.0 births per 1,000 women. Women in the age bracket of 35 to 50 years have the highest fertility rate with 61.0 births per 1,000 women. Women in the age bracket of 20 to 34 years acount for 50.5% of all women with births.
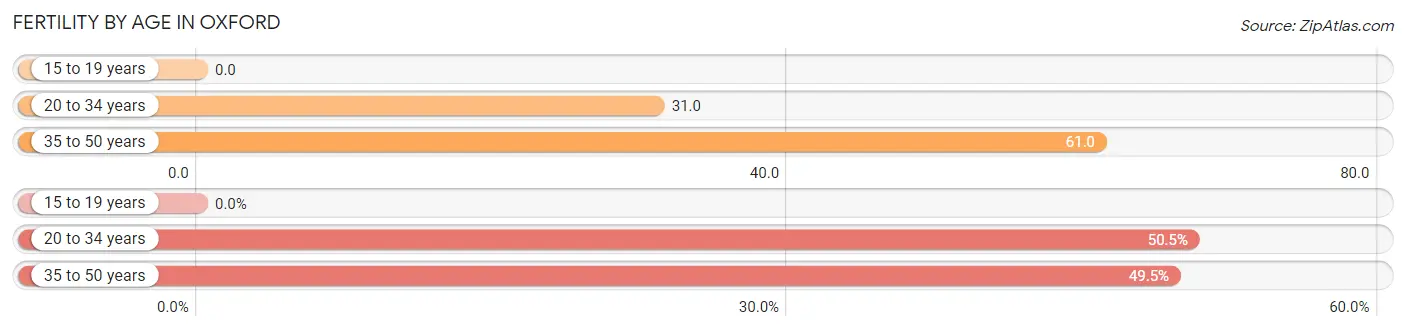
| Age Bracket | Women with Births | Births / 1,000 Women |
| 15 to 19 years | 0 (0.0%) | 0.0 |
| 20 to 34 years | 157 (50.5%) | 31.0 |
| 35 to 50 years | 154 (49.5%) | 61.0 |
| Total | 311 (100.0%) | 37.0 |
Fertility by Age by Marriage Status in Oxford
35.7% of women with births (311) in Oxford are married. The highest percentage of unmarried women with births falls into 35 to 50 years age bracket with 77.9% of them unmarried at the time of birth, while the lowest percentage of unmarried women with births belong to 20 to 34 years age bracket with 51.0% of them unmarried.
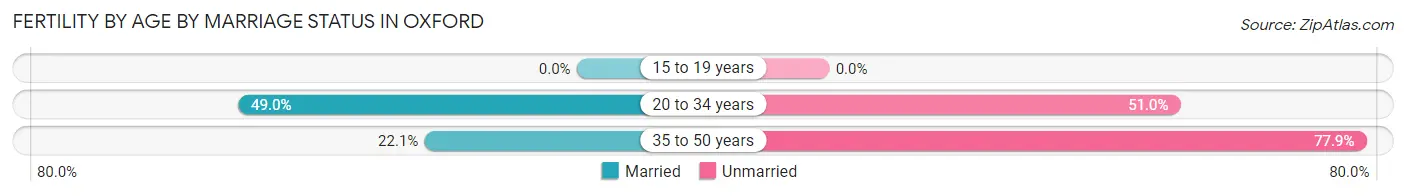
| Age Bracket | Married | Unmarried |
| 15 to 19 years | 0 (0.0%) | 0 (0.0%) |
| 20 to 34 years | 77 (49.0%) | 80 (51.0%) |
| 35 to 50 years | 34 (22.1%) | 120 (77.9%) |
| Total | 111 (35.7%) | 200 (64.3%) |
Fertility by Education in Oxford
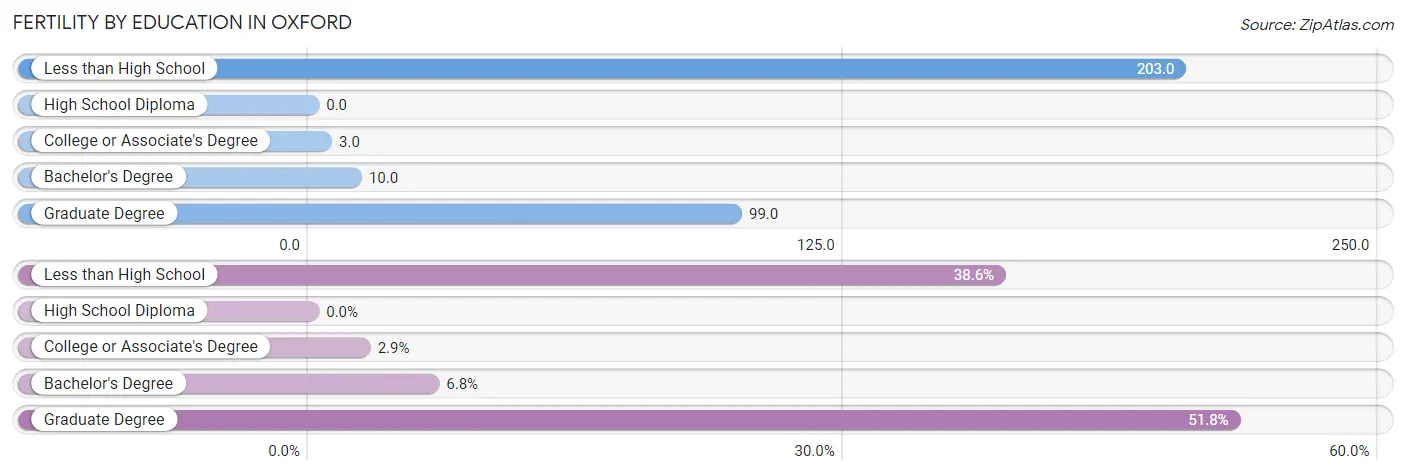
| Educational Attainment | Women with Births | Births / 1,000 Women |
| Less than High School | 120 (38.6%) | 203.0 |
| High School Diploma | 0 (0.0%) | 0.0 |
| College or Associate's Degree | 9 (2.9%) | 3.0 |
| Bachelor's Degree | 21 (6.8%) | 10.0 |
| Graduate Degree | 161 (51.8%) | 99.0 |
| Total | 311 (100.0%) | 37.0 |
Fertility by Education by Marriage Status in Oxford
64.3% of women with births in Oxford are unmarried. Women with the educational attainment of college or associate's degree are most likely to be married with 100.0% of them married at childbirth, while women with the educational attainment of less than high school are least likely to be married with 100.0% of them unmarried at childbirth.
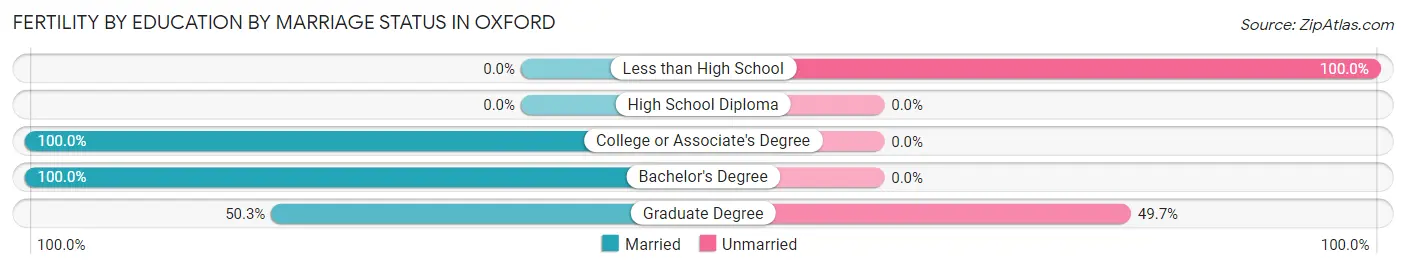
| Educational Attainment | Married | Unmarried |
| Less than High School | 0 (0.0%) | 120 (100.0%) |
| High School Diploma | 0 (0.0%) | 0 (0.0%) |
| College or Associate's Degree | 9 (100.0%) | 0 (0.0%) |
| Bachelor's Degree | 21 (100.0%) | 0 (0.0%) |
| Graduate Degree | 81 (50.3%) | 80 (49.7%) |
| Total | 111 (35.7%) | 200 (64.3%) |
Employment Characteristics in Oxford
Employment by Class of Employer in Oxford
Among the 12,156 employed individuals in Oxford, private company employees (6,717 | 55.3%), state government employees (2,509 | 20.6%), and local government employees (960 | 7.9%) make up the most common classes of employment.
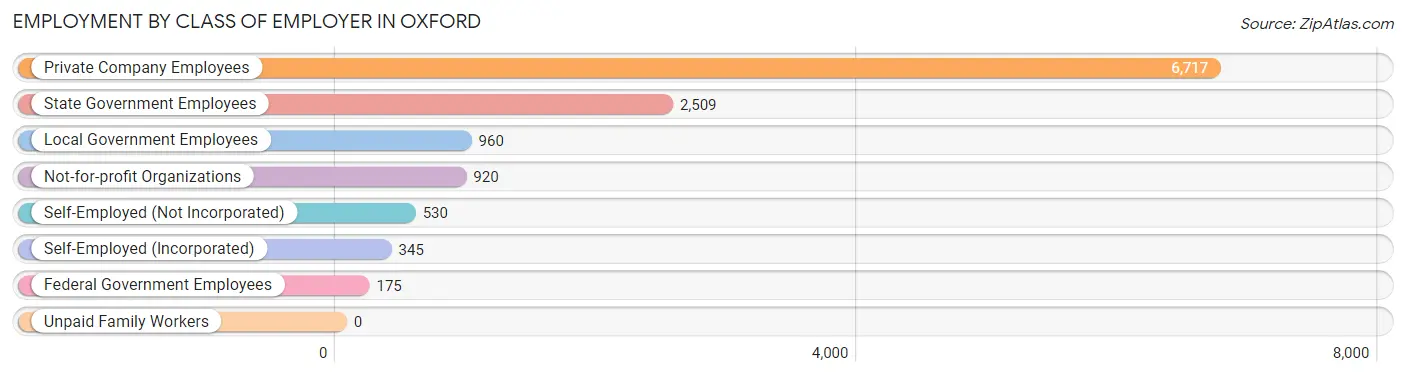
| Employer Class | # Employees | % Employees |
| Private Company Employees | 6,717 | 55.3% |
| Self-Employed (Incorporated) | 345 | 2.8% |
| Self-Employed (Not Incorporated) | 530 | 4.4% |
| Not-for-profit Organizations | 920 | 7.6% |
| Local Government Employees | 960 | 7.9% |
| State Government Employees | 2,509 | 20.6% |
| Federal Government Employees | 175 | 1.4% |
| Unpaid Family Workers | 0 | 0.0% |
| Total | 12,156 | 100.0% |
Employment Status by Age in Oxford
According to the labor force statistics for Oxford, out of the total population over 16 years of age (21,862), 60.0% or 13,117 individuals are in the labor force, with 3.3% or 433 of them unemployed. The age group with the highest labor force participation rate is 30 to 34 years, with 89.4% or 1,851 individuals in the labor force. Within the labor force, the 25 to 29 years age range has the highest percentage of unemployed individuals, with 5.8% or 129 of them being unemployed.
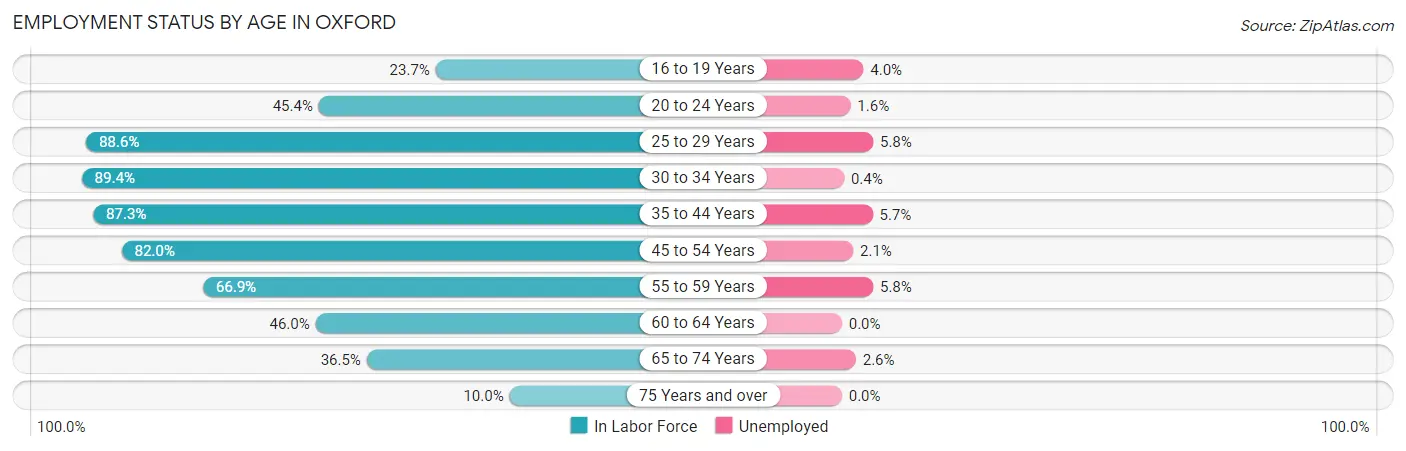
| Age Bracket | In Labor Force | Unemployed |
| 16 to 19 Years | 323 (23.7%) | 13 (4.0%) |
| 20 to 24 Years | 2,530 (45.4%) | 40 (1.6%) |
| 25 to 29 Years | 2,232 (88.6%) | 129 (5.8%) |
| 30 to 34 Years | 1,851 (89.4%) | 7 (0.4%) |
| 35 to 44 Years | 2,550 (87.3%) | 145 (5.7%) |
| 45 to 54 Years | 1,736 (82.0%) | 36 (2.1%) |
| 55 to 59 Years | 626 (66.9%) | 36 (5.8%) |
| 60 to 64 Years | 427 (46.0%) | 0 (0.0%) |
| 65 to 74 Years | 687 (36.5%) | 18 (2.6%) |
| 75 Years and over | 155 (10.0%) | 0 (0.0%) |
| Total | 13,117 (60.0%) | 433 (3.3%) |
Employment Status by Educational Attainment in Oxford
According to labor force statistics for Oxford, 82.0% of individuals (9,423) out of the total population between 25 and 64 years of age (11,492) are in the labor force, with 3.8% or 358 of them being unemployed. The group with the highest labor force participation rate are those with the educational attainment of bachelor's degree or higher, with 89.5% or 6,069 individuals in the labor force. Within the labor force, individuals with less than high school education have the highest percentage of unemployment, with 17.9% or 24 of them being unemployed.
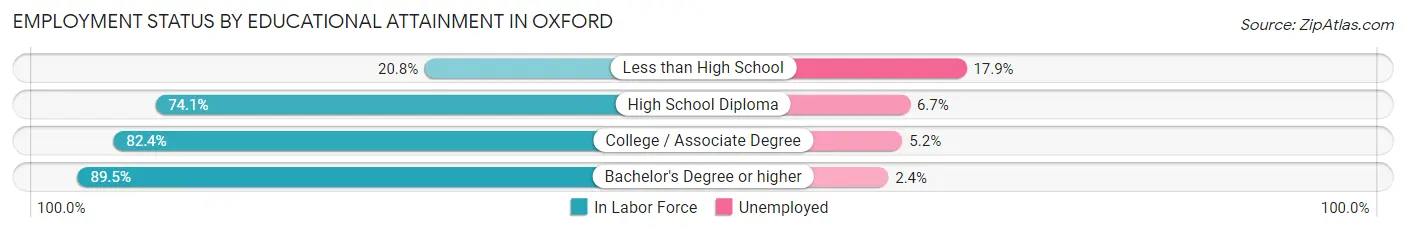
| Educational Attainment | In Labor Force | Unemployed |
| Less than High School | 134 (20.8%) | 115 (17.9%) |
| High School Diploma | 1,163 (74.1%) | 105 (6.7%) |
| College / Associate Degree | 2,058 (82.4%) | 130 (5.2%) |
| Bachelor's Degree or higher | 6,069 (89.5%) | 163 (2.4%) |
| Total | 9,423 (82.0%) | 437 (3.8%) |
Employment Occupations by Sex in Oxford
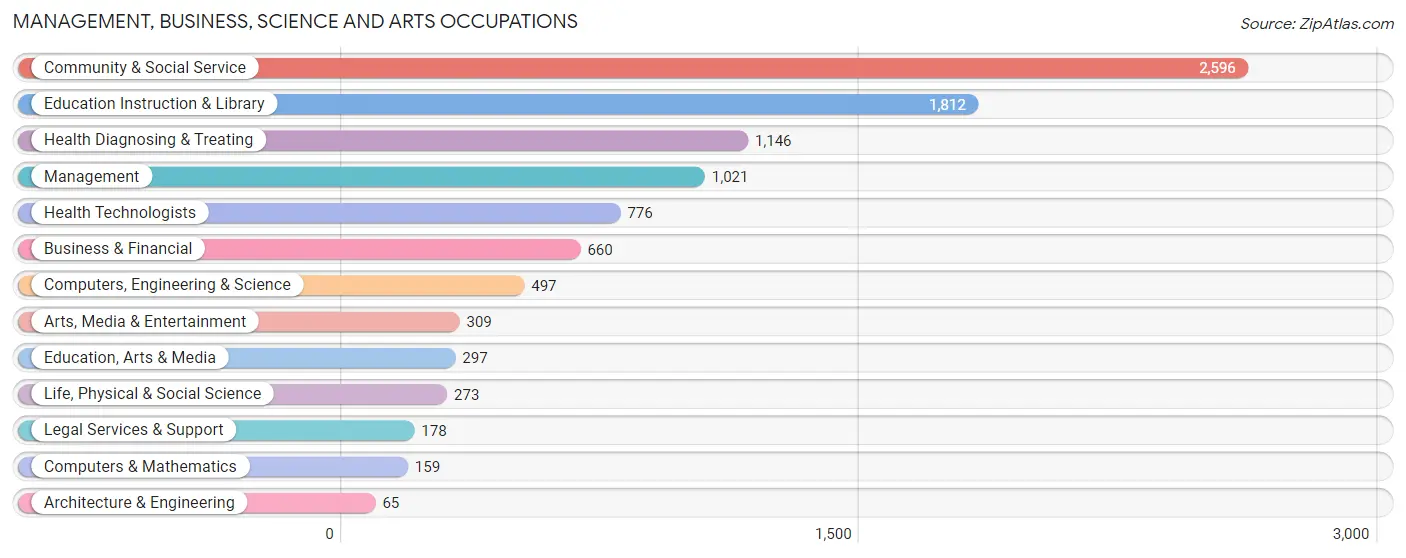
Management, Business, Science and Arts Occupations
The most common Management, Business, Science and Arts occupations in Oxford are Community & Social Service (2,596 | 20.5%), Education Instruction & Library (1,812 | 14.3%), Health Diagnosing & Treating (1,146 | 9.0%), Management (1,021 | 8.1%), and Health Technologists (776 | 6.1%).
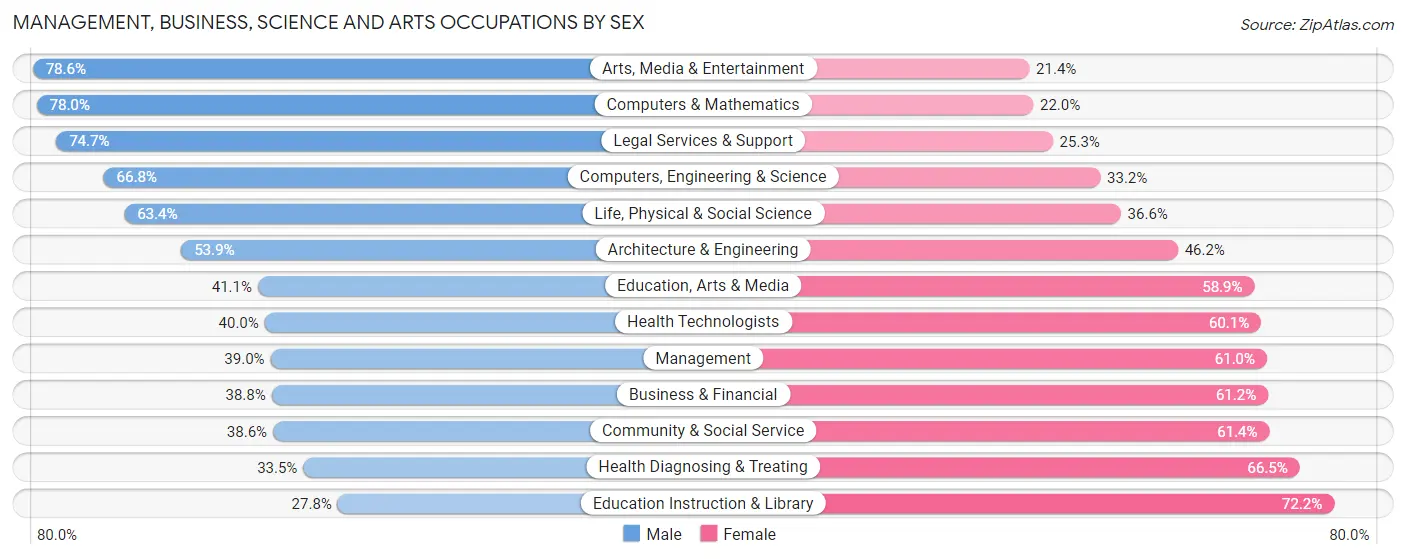
Management, Business, Science and Arts Occupations by Sex
Within the Management, Business, Science and Arts occupations in Oxford, the most male-oriented occupations are Arts, Media & Entertainment (78.6%), Computers & Mathematics (78.0%), and Legal Services & Support (74.7%), while the most female-oriented occupations are Education Instruction & Library (72.2%), Health Diagnosing & Treating (66.5%), and Community & Social Service (61.4%).
| Occupation | Male | Female |
| Management | 398 (39.0%) | 623 (61.0%) |
| Business & Financial | 256 (38.8%) | 404 (61.2%) |
| Computers, Engineering & Science | 332 (66.8%) | 165 (33.2%) |
| Computers & Mathematics | 124 (78.0%) | 35 (22.0%) |
| Architecture & Engineering | 35 (53.8%) | 30 (46.2%) |
| Life, Physical & Social Science | 173 (63.4%) | 100 (36.6%) |
| Community & Social Service | 1,001 (38.6%) | 1,595 (61.4%) |
| Education, Arts & Media | 122 (41.1%) | 175 (58.9%) |
| Legal Services & Support | 133 (74.7%) | 45 (25.3%) |
| Education Instruction & Library | 503 (27.8%) | 1,309 (72.2%) |
| Arts, Media & Entertainment | 243 (78.6%) | 66 (21.4%) |
| Health Diagnosing & Treating | 384 (33.5%) | 762 (66.5%) |
| Health Technologists | 310 (40.0%) | 466 (60.1%) |
| Total (Category) | 2,371 (40.1%) | 3,549 (60.0%) |
| Total (Overall) | 5,931 (46.8%) | 6,752 (53.2%) |
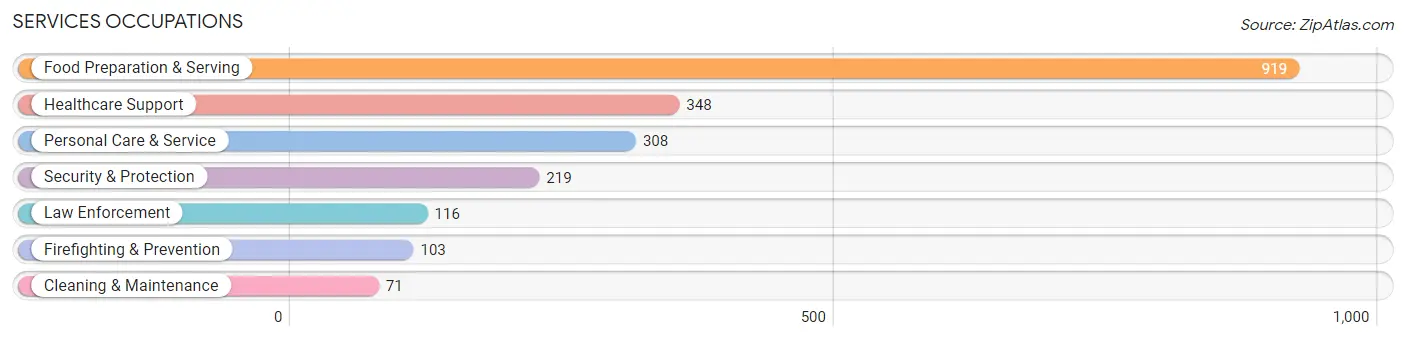
Services Occupations
The most common Services occupations in Oxford are Food Preparation & Serving (919 | 7.2%), Healthcare Support (348 | 2.7%), Personal Care & Service (308 | 2.4%), Security & Protection (219 | 1.7%), and Law Enforcement (116 | 0.9%).
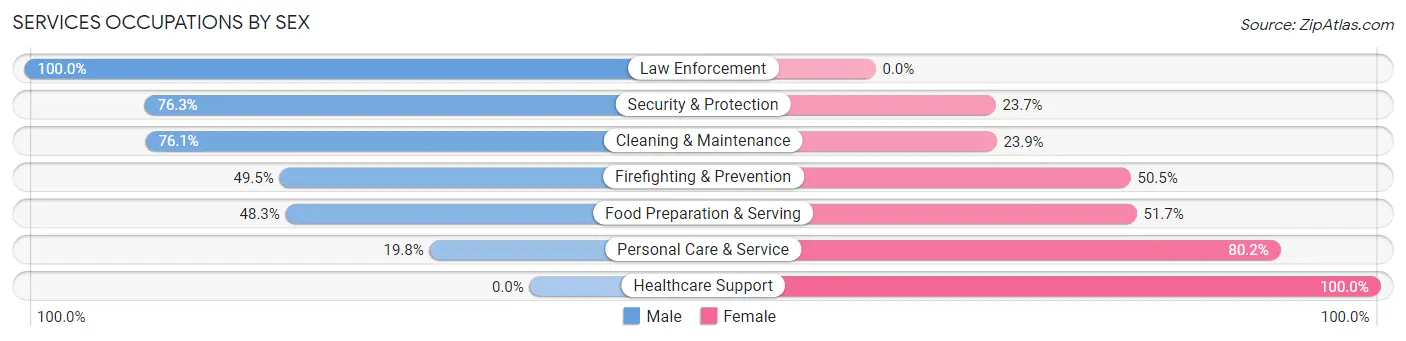
Services Occupations by Sex
Within the Services occupations in Oxford, the most male-oriented occupations are Law Enforcement (100.0%), Security & Protection (76.3%), and Cleaning & Maintenance (76.1%), while the most female-oriented occupations are Healthcare Support (100.0%), Personal Care & Service (80.2%), and Food Preparation & Serving (51.7%).
| Occupation | Male | Female |
| Healthcare Support | 0 (0.0%) | 348 (100.0%) |
| Security & Protection | 167 (76.3%) | 52 (23.7%) |
| Firefighting & Prevention | 51 (49.5%) | 52 (50.5%) |
| Law Enforcement | 116 (100.0%) | 0 (0.0%) |
| Food Preparation & Serving | 444 (48.3%) | 475 (51.7%) |
| Cleaning & Maintenance | 54 (76.1%) | 17 (23.9%) |
| Personal Care & Service | 61 (19.8%) | 247 (80.2%) |
| Total (Category) | 726 (38.9%) | 1,139 (61.1%) |
| Total (Overall) | 5,931 (46.8%) | 6,752 (53.2%) |
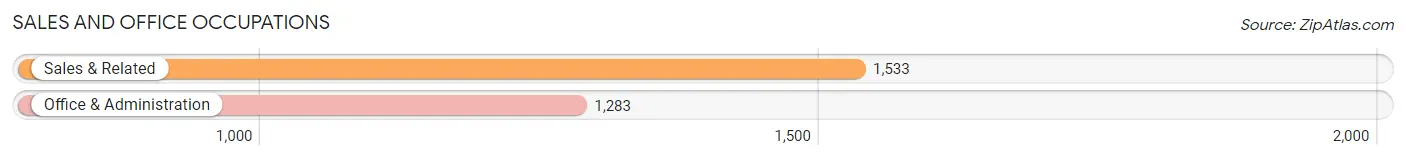
Sales and Office Occupations
The most common Sales and Office occupations in Oxford are Sales & Related (1,533 | 12.1%), and Office & Administration (1,283 | 10.1%).
Sales and Office Occupations by Sex
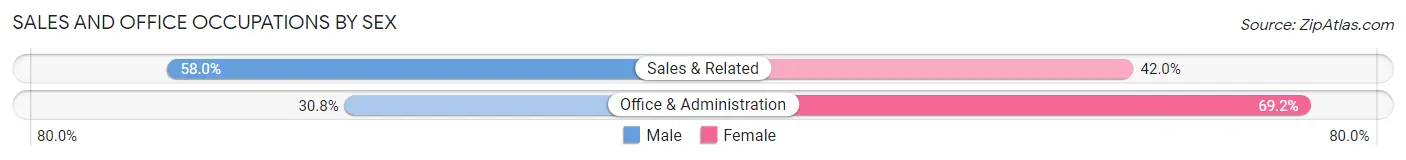
| Occupation | Male | Female |
| Sales & Related | 889 (58.0%) | 644 (42.0%) |
| Office & Administration | 395 (30.8%) | 888 (69.2%) |
| Total (Category) | 1,284 (45.6%) | 1,532 (54.4%) |
| Total (Overall) | 5,931 (46.8%) | 6,752 (53.2%) |
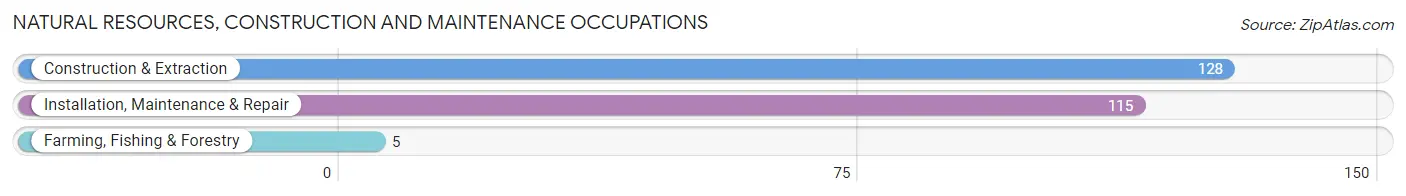
Natural Resources, Construction and Maintenance Occupations
The most common Natural Resources, Construction and Maintenance occupations in Oxford are Construction & Extraction (128 | 1.0%), Installation, Maintenance & Repair (115 | 0.9%), and Farming, Fishing & Forestry (5 | 0.0%).
Natural Resources, Construction and Maintenance Occupations by Sex
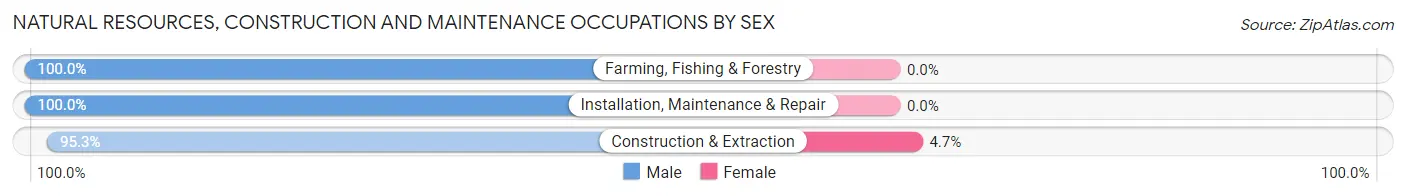
| Occupation | Male | Female |
| Farming, Fishing & Forestry | 5 (100.0%) | 0 (0.0%) |
| Construction & Extraction | 122 (95.3%) | 6 (4.7%) |
| Installation, Maintenance & Repair | 115 (100.0%) | 0 (0.0%) |
| Total (Category) | 242 (97.6%) | 6 (2.4%) |
| Total (Overall) | 5,931 (46.8%) | 6,752 (53.2%) |
Production, Transportation and Moving Occupations
The most common Production, Transportation and Moving occupations in Oxford are Material Moving (850 | 6.7%), Production (534 | 4.2%), and Transportation (450 | 3.5%).
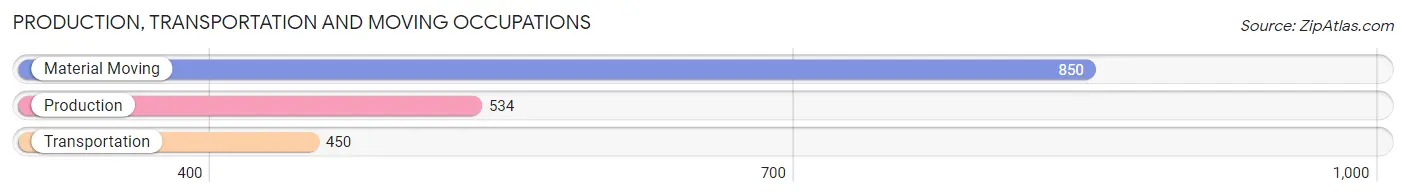
Production, Transportation and Moving Occupations by Sex
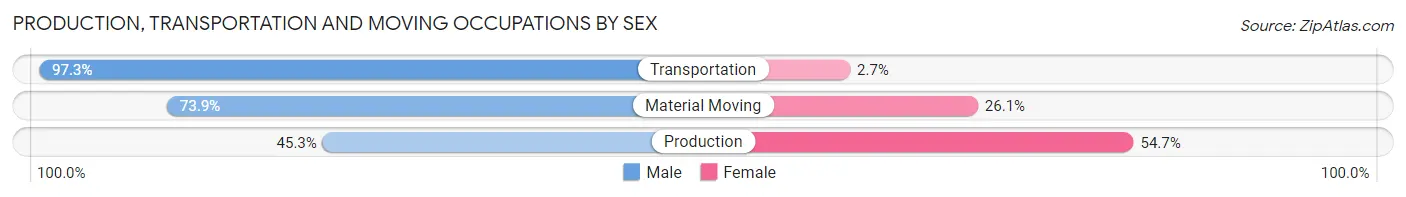
| Occupation | Male | Female |
| Production | 242 (45.3%) | 292 (54.7%) |
| Transportation | 438 (97.3%) | 12 (2.7%) |
| Material Moving | 628 (73.9%) | 222 (26.1%) |
| Total (Category) | 1,308 (71.3%) | 526 (28.7%) |
| Total (Overall) | 5,931 (46.8%) | 6,752 (53.2%) |
Employment Industries by Sex in Oxford
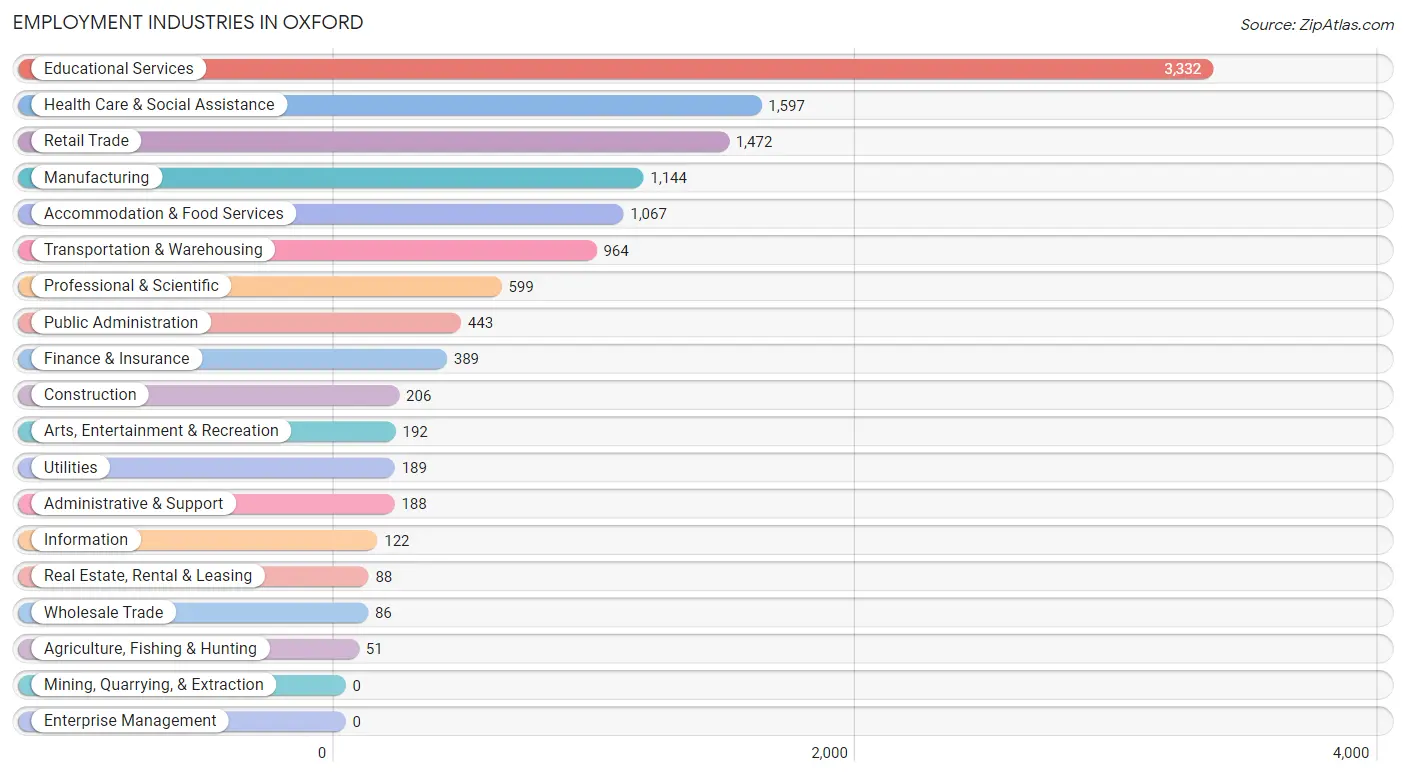
Employment Industries in Oxford
The major employment industries in Oxford include Educational Services (3,332 | 26.3%), Health Care & Social Assistance (1,597 | 12.6%), Retail Trade (1,472 | 11.6%), Manufacturing (1,144 | 9.0%), and Accommodation & Food Services (1,067 | 8.4%).
Employment Industries by Sex in Oxford
The Oxford industries that see more men than women are Agriculture, Fishing & Hunting (100.0%), Wholesale Trade (100.0%), and Transportation & Warehousing (97.3%), whereas the industries that tend to have a higher number of women are Health Care & Social Assistance (75.6%), Utilities (69.3%), and Professional & Scientific (67.9%).
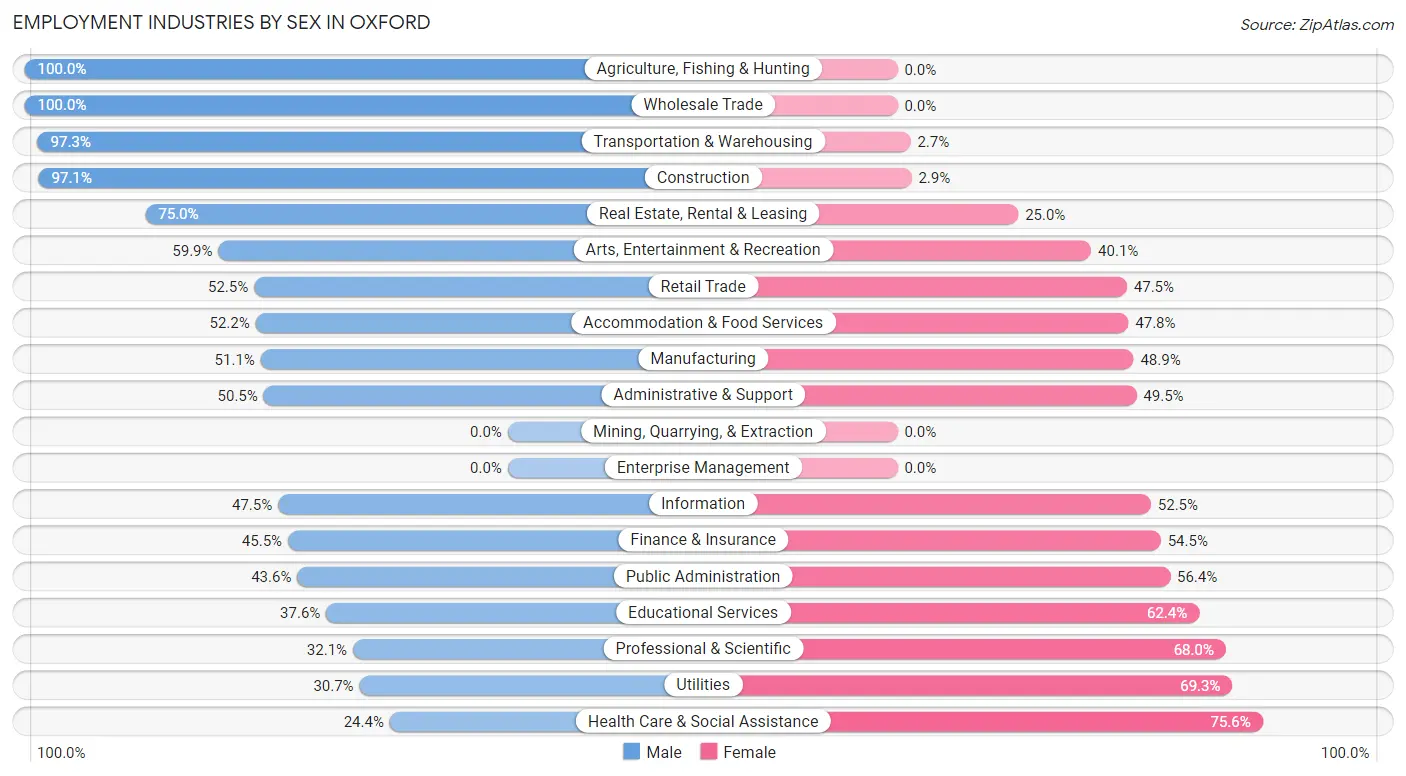
| Industry | Male | Female |
| Agriculture, Fishing & Hunting | 51 (100.0%) | 0 (0.0%) |
| Mining, Quarrying, & Extraction | 0 (0.0%) | 0 (0.0%) |
| Construction | 200 (97.1%) | 6 (2.9%) |
| Manufacturing | 585 (51.1%) | 559 (48.9%) |
| Wholesale Trade | 86 (100.0%) | 0 (0.0%) |
| Retail Trade | 773 (52.5%) | 699 (47.5%) |
| Transportation & Warehousing | 938 (97.3%) | 26 (2.7%) |
| Utilities | 58 (30.7%) | 131 (69.3%) |
| Information | 58 (47.5%) | 64 (52.5%) |
| Finance & Insurance | 177 (45.5%) | 212 (54.5%) |
| Real Estate, Rental & Leasing | 66 (75.0%) | 22 (25.0%) |
| Professional & Scientific | 192 (32.1%) | 407 (67.9%) |
| Enterprise Management | 0 (0.0%) | 0 (0.0%) |
| Administrative & Support | 95 (50.5%) | 93 (49.5%) |
| Educational Services | 1,252 (37.6%) | 2,080 (62.4%) |
| Health Care & Social Assistance | 390 (24.4%) | 1,207 (75.6%) |
| Arts, Entertainment & Recreation | 115 (59.9%) | 77 (40.1%) |
| Accommodation & Food Services | 557 (52.2%) | 510 (47.8%) |
| Public Administration | 193 (43.6%) | 250 (56.4%) |
| Total | 5,931 (46.8%) | 6,752 (53.2%) |
Education in Oxford
School Enrollment in Oxford
The most common levels of schooling among the 9,811 students in Oxford are college / undergraduate (5,092 | 51.9%), graduate / professional (1,263 | 12.9%), and middle school (1,064 | 10.8%).
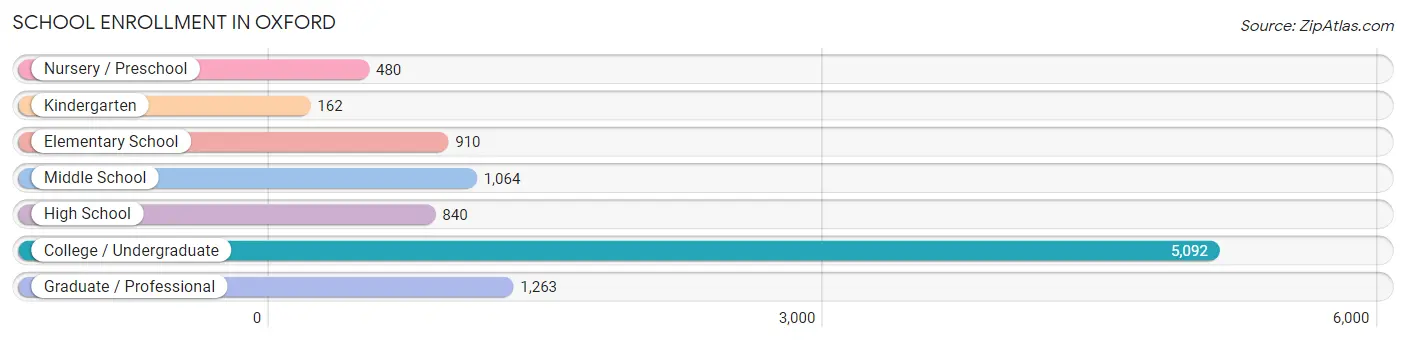
| School Level | # Students | % Students |
| Nursery / Preschool | 480 | 4.9% |
| Kindergarten | 162 | 1.7% |
| Elementary School | 910 | 9.3% |
| Middle School | 1,064 | 10.8% |
| High School | 840 | 8.6% |
| College / Undergraduate | 5,092 | 51.9% |
| Graduate / Professional | 1,263 | 12.9% |
| Total | 9,811 | 100.0% |
School Enrollment by Age by Funding Source in Oxford
Out of a total of 9,811 students who are enrolled in schools in Oxford, 736 (7.5%) attend a private institution, while the remaining 9,075 (92.5%) are enrolled in public schools. The age group of 3 to 4 year olds has the highest likelihood of being enrolled in private schools, with 147 (34.6% in the age bracket) enrolled. Conversely, the age group of 15 to 17 year olds has the lowest likelihood of being enrolled in a private school, with 653 (100.0% in the age bracket) attending a public institution.
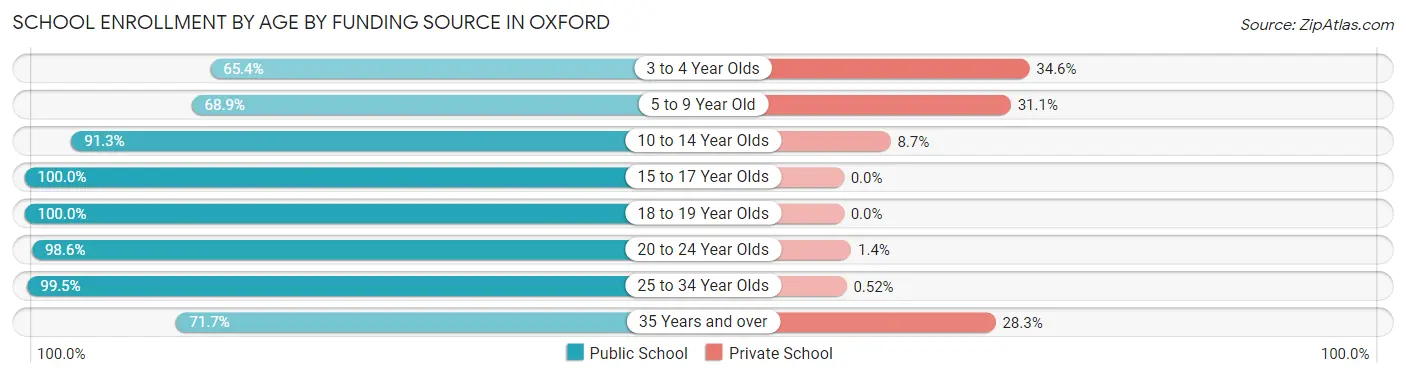
| Age Bracket | Public School | Private School |
| 3 to 4 Year Olds | 278 (65.4%) | 147 (34.6%) |
| 5 to 9 Year Old | 695 (68.9%) | 314 (31.1%) |
| 10 to 14 Year Olds | 1,142 (91.3%) | 109 (8.7%) |
| 15 to 17 Year Olds | 653 (100.0%) | 0 (0.0%) |
| 18 to 19 Year Olds | 863 (100.0%) | 0 (0.0%) |
| 20 to 24 Year Olds | 4,630 (98.6%) | 65 (1.4%) |
| 25 to 34 Year Olds | 569 (99.5%) | 3 (0.5%) |
| 35 Years and over | 246 (71.7%) | 97 (28.3%) |
| Total | 9,075 (92.5%) | 736 (7.5%) |
Educational Attainment by Field of Study in Oxford
Business (2,021 | 21.3%), arts & humanities (1,029 | 10.9%), education (953 | 10.1%), social sciences (770 | 8.1%), and liberal arts & history (677 | 7.1%) are the most common fields of study among 9,469 individuals in Oxford who have obtained a bachelor's degree or higher.
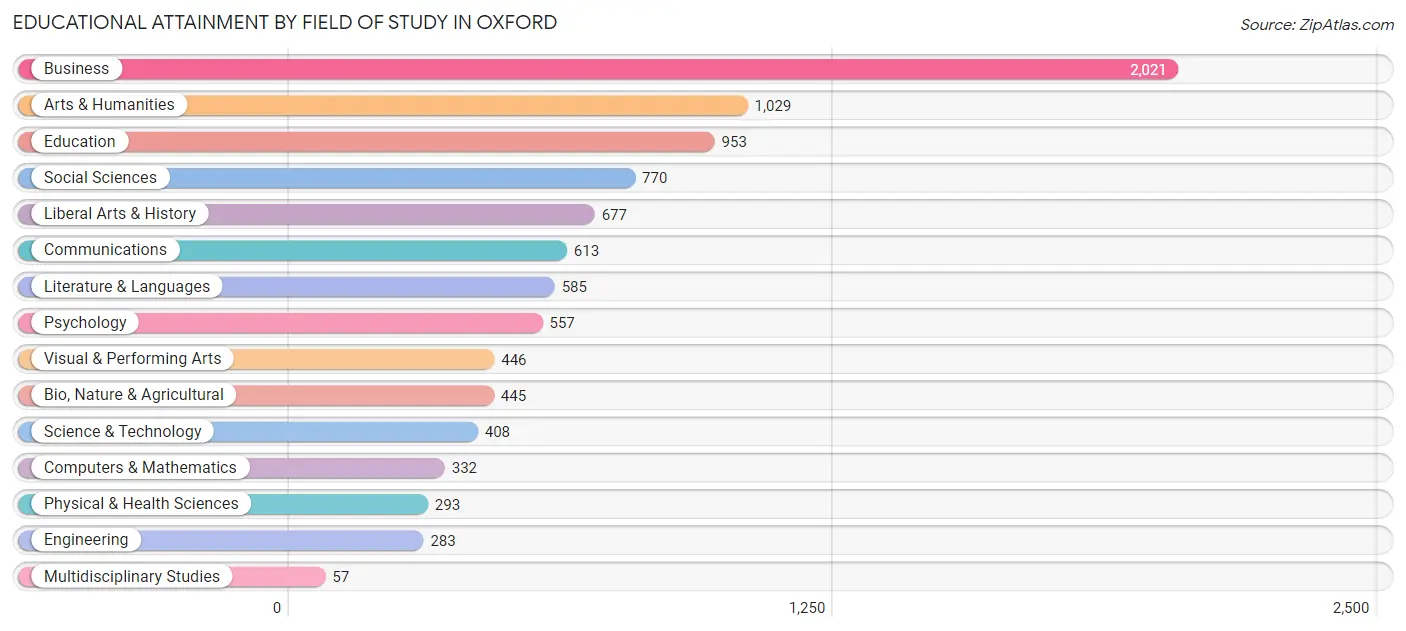
| Field of Study | # Graduates | % Graduates |
| Computers & Mathematics | 332 | 3.5% |
| Bio, Nature & Agricultural | 445 | 4.7% |
| Physical & Health Sciences | 293 | 3.1% |
| Psychology | 557 | 5.9% |
| Social Sciences | 770 | 8.1% |
| Engineering | 283 | 3.0% |
| Multidisciplinary Studies | 57 | 0.6% |
| Science & Technology | 408 | 4.3% |
| Business | 2,021 | 21.3% |
| Education | 953 | 10.1% |
| Literature & Languages | 585 | 6.2% |
| Liberal Arts & History | 677 | 7.1% |
| Visual & Performing Arts | 446 | 4.7% |
| Communications | 613 | 6.5% |
| Arts & Humanities | 1,029 | 10.9% |
| Total | 9,469 | 100.0% |
Transportation & Commute in Oxford
Vehicle Availability by Sex in Oxford
The most prevalent vehicle ownership categories in Oxford are males with 2 vehicles (2,337, accounting for 42.4%) and females with 2 vehicles (2,801, making up 35.4%).
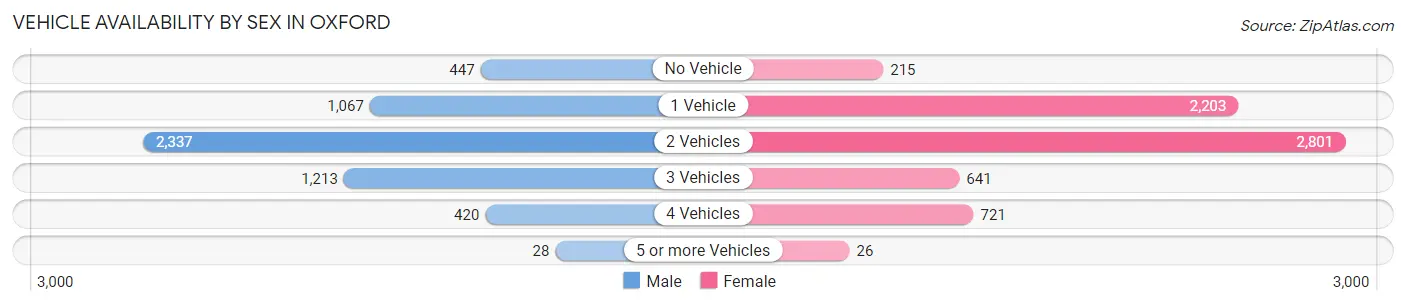
| Vehicles Available | Male | Female |
| No Vehicle | 447 (8.1%) | 215 (3.3%) |
| 1 Vehicle | 1,067 (19.4%) | 2,203 (33.3%) |
| 2 Vehicles | 2,337 (42.4%) | 2,801 (42.4%) |
| 3 Vehicles | 1,213 (22.0%) | 641 (9.7%) |
| 4 Vehicles | 420 (7.6%) | 721 (10.9%) |
| 5 or more Vehicles | 28 (0.5%) | 26 (0.4%) |
| Total | 5,512 (100.0%) | 6,607 (100.0%) |
Commute Time in Oxford
The most frequently occuring commute durations in Oxford are 10 to 14 minutes (3,440 commuters, 29.7%), 5 to 9 minutes (2,941 commuters, 25.4%), and 15 to 19 minutes (1,816 commuters, 15.7%).
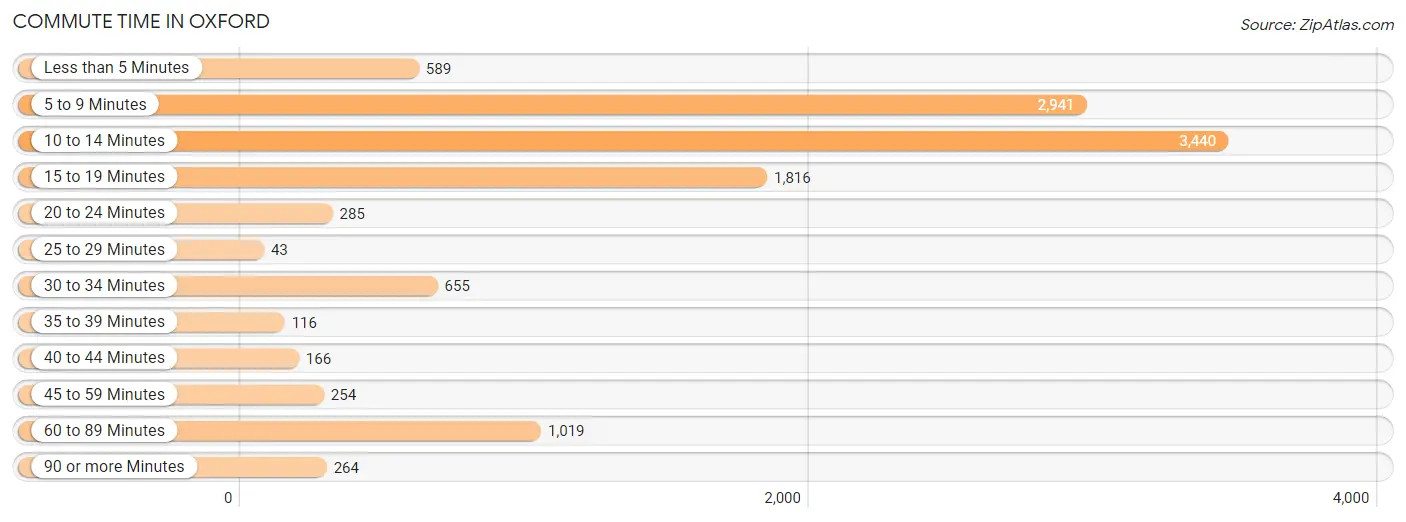
| Commute Time | # Commuters | % Commuters |
| Less than 5 Minutes | 589 | 5.1% |
| 5 to 9 Minutes | 2,941 | 25.4% |
| 10 to 14 Minutes | 3,440 | 29.7% |
| 15 to 19 Minutes | 1,816 | 15.7% |
| 20 to 24 Minutes | 285 | 2.5% |
| 25 to 29 Minutes | 43 | 0.4% |
| 30 to 34 Minutes | 655 | 5.7% |
| 35 to 39 Minutes | 116 | 1.0% |
| 40 to 44 Minutes | 166 | 1.4% |
| 45 to 59 Minutes | 254 | 2.2% |
| 60 to 89 Minutes | 1,019 | 8.8% |
| 90 or more Minutes | 264 | 2.3% |
Commute Time by Sex in Oxford
The most common commute times in Oxford are 10 to 14 minutes (1,709 commuters, 33.3%) for males and 5 to 9 minutes (1,856 commuters, 28.7%) for females.
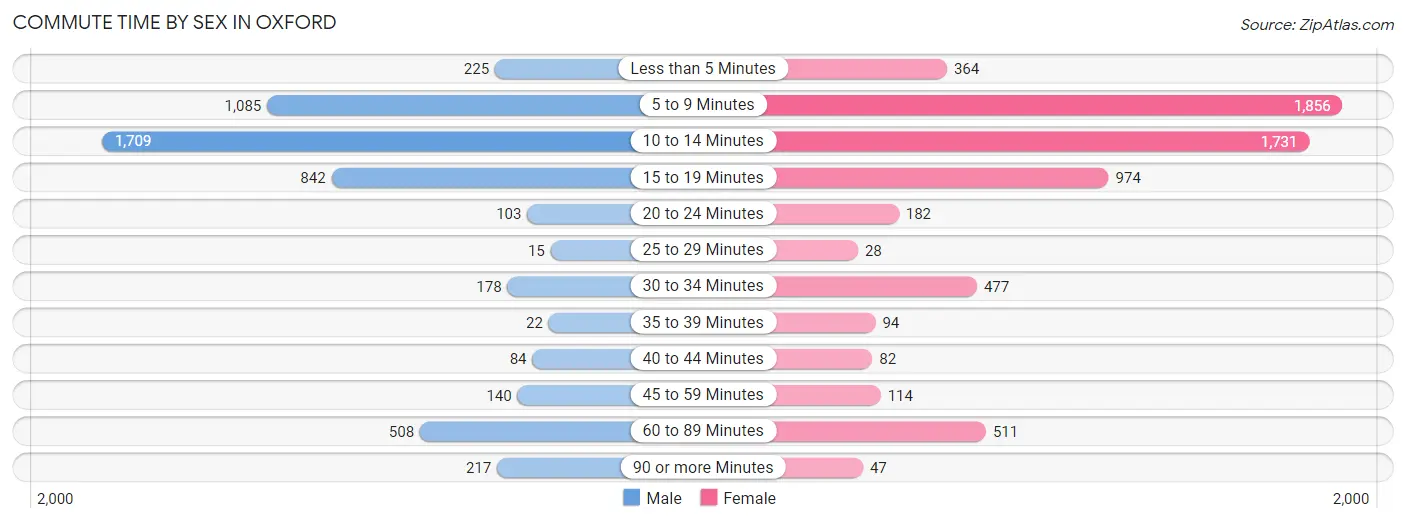
| Commute Time | Male | Female |
| Less than 5 Minutes | 225 (4.4%) | 364 (5.6%) |
| 5 to 9 Minutes | 1,085 (21.2%) | 1,856 (28.7%) |
| 10 to 14 Minutes | 1,709 (33.3%) | 1,731 (26.8%) |
| 15 to 19 Minutes | 842 (16.4%) | 974 (15.1%) |
| 20 to 24 Minutes | 103 (2.0%) | 182 (2.8%) |
| 25 to 29 Minutes | 15 (0.3%) | 28 (0.4%) |
| 30 to 34 Minutes | 178 (3.5%) | 477 (7.4%) |
| 35 to 39 Minutes | 22 (0.4%) | 94 (1.5%) |
| 40 to 44 Minutes | 84 (1.6%) | 82 (1.3%) |
| 45 to 59 Minutes | 140 (2.7%) | 114 (1.8%) |
| 60 to 89 Minutes | 508 (9.9%) | 511 (7.9%) |
| 90 or more Minutes | 217 (4.2%) | 47 (0.7%) |
Time of Departure to Work by Sex in Oxford
The most frequent times of departure to work in Oxford are 4:00 PM to 11:59 PM (1,049, 20.5%) for males and 7:30 AM to 7:59 AM (1,544, 23.9%) for females.
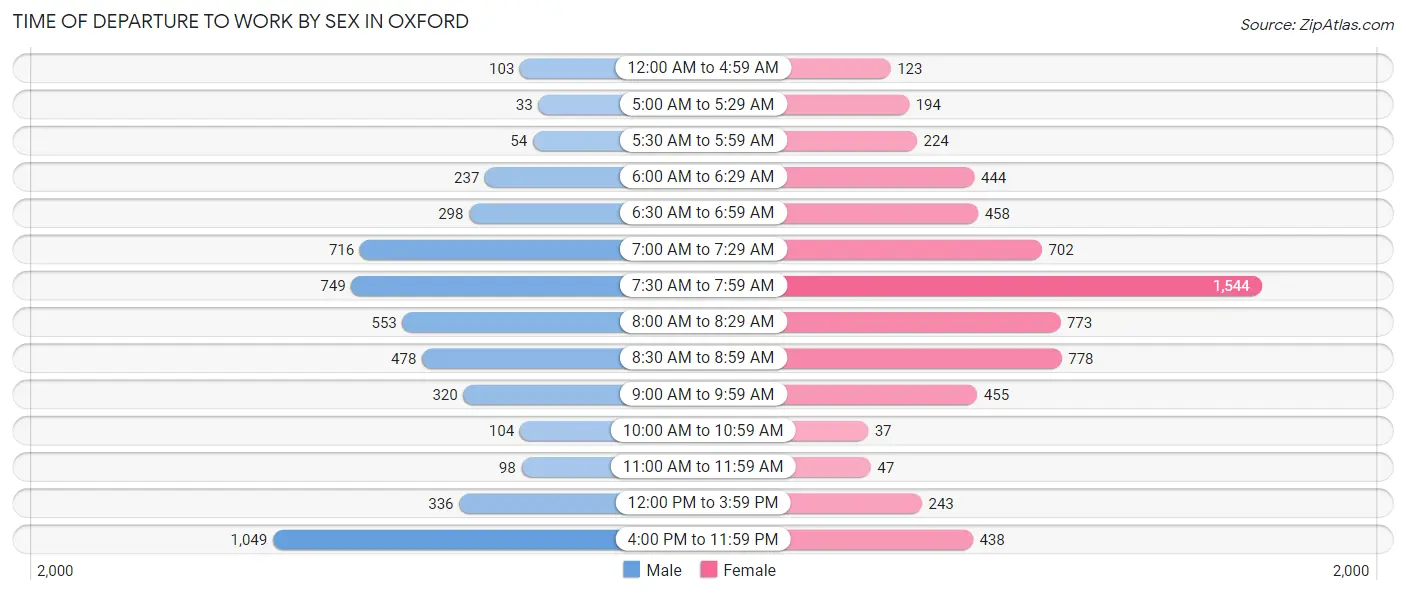
| Time of Departure | Male | Female |
| 12:00 AM to 4:59 AM | 103 (2.0%) | 123 (1.9%) |
| 5:00 AM to 5:29 AM | 33 (0.6%) | 194 (3.0%) |
| 5:30 AM to 5:59 AM | 54 (1.1%) | 224 (3.5%) |
| 6:00 AM to 6:29 AM | 237 (4.6%) | 444 (6.9%) |
| 6:30 AM to 6:59 AM | 298 (5.8%) | 458 (7.1%) |
| 7:00 AM to 7:29 AM | 716 (14.0%) | 702 (10.9%) |
| 7:30 AM to 7:59 AM | 749 (14.6%) | 1,544 (23.9%) |
| 8:00 AM to 8:29 AM | 553 (10.8%) | 773 (12.0%) |
| 8:30 AM to 8:59 AM | 478 (9.3%) | 778 (12.0%) |
| 9:00 AM to 9:59 AM | 320 (6.2%) | 455 (7.0%) |
| 10:00 AM to 10:59 AM | 104 (2.0%) | 37 (0.6%) |
| 11:00 AM to 11:59 AM | 98 (1.9%) | 47 (0.7%) |
| 12:00 PM to 3:59 PM | 336 (6.6%) | 243 (3.8%) |
| 4:00 PM to 11:59 PM | 1,049 (20.5%) | 438 (6.8%) |
| Total | 5,128 (100.0%) | 6,460 (100.0%) |
Housing Occupancy in Oxford
Occupancy by Ownership in Oxford
Of the total 9,773 dwellings in Oxford, owner-occupied units account for 4,168 (42.6%), while renter-occupied units make up 5,605 (57.4%).
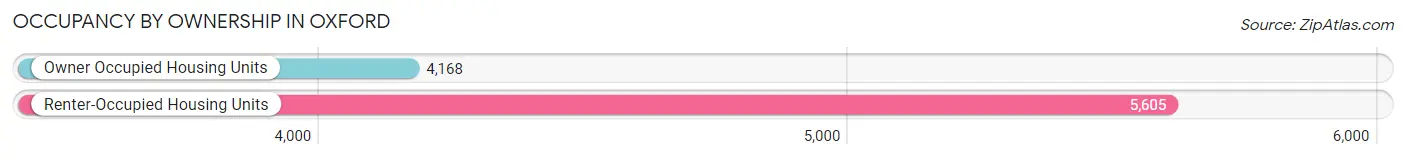
| Occupancy | # Housing Units | % Housing Units |
| Owner Occupied Housing Units | 4,168 | 42.6% |
| Renter-Occupied Housing Units | 5,605 | 57.4% |
| Total Occupied Housing Units | 9,773 | 100.0% |
Occupancy by Household Size in Oxford
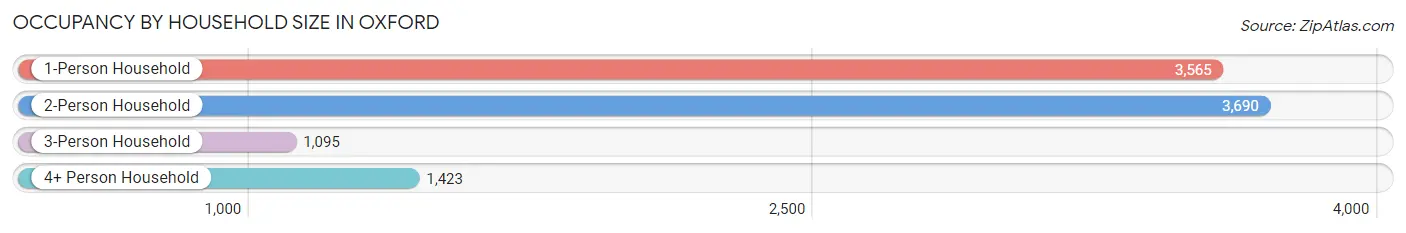
| Household Size | # Housing Units | % Housing Units |
| 1-Person Household | 3,565 | 36.5% |
| 2-Person Household | 3,690 | 37.8% |
| 3-Person Household | 1,095 | 11.2% |
| 4+ Person Household | 1,423 | 14.6% |
| Total Housing Units | 9,773 | 100.0% |
Occupancy by Ownership by Household Size in Oxford
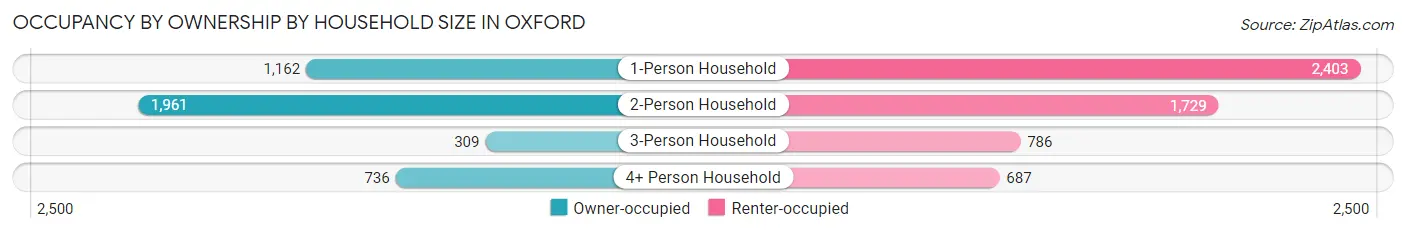
| Household Size | Owner-occupied | Renter-occupied |
| 1-Person Household | 1,162 (32.6%) | 2,403 (67.4%) |
| 2-Person Household | 1,961 (53.1%) | 1,729 (46.9%) |
| 3-Person Household | 309 (28.2%) | 786 (71.8%) |
| 4+ Person Household | 736 (51.7%) | 687 (48.3%) |
| Total Housing Units | 4,168 (42.6%) | 5,605 (57.4%) |
Occupancy by Educational Attainment in Oxford
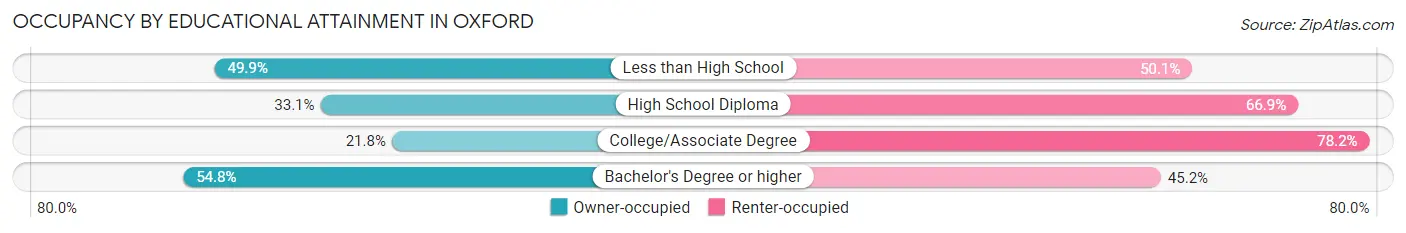
| Household Size | Owner-occupied | Renter-occupied |
| Less than High School | 187 (49.9%) | 188 (50.1%) |
| High School Diploma | 314 (33.1%) | 635 (66.9%) |
| College/Associate Degree | 636 (21.8%) | 2,286 (78.2%) |
| Bachelor's Degree or higher | 3,031 (54.8%) | 2,496 (45.2%) |
Occupancy by Age of Householder in Oxford
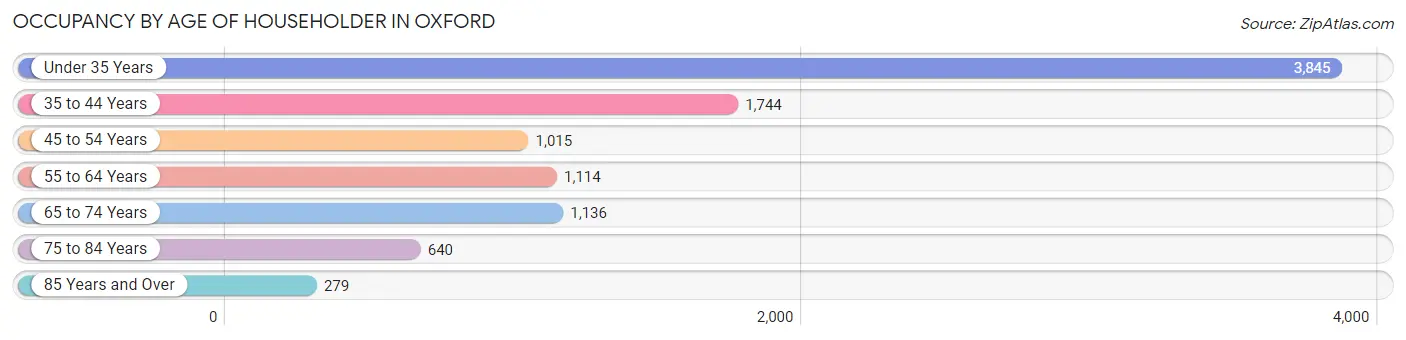
| Age Bracket | # Households | % Households |
| Under 35 Years | 3,845 | 39.3% |
| 35 to 44 Years | 1,744 | 17.8% |
| 45 to 54 Years | 1,015 | 10.4% |
| 55 to 64 Years | 1,114 | 11.4% |
| 65 to 74 Years | 1,136 | 11.6% |
| 75 to 84 Years | 640 | 6.6% |
| 85 Years and Over | 279 | 2.9% |
| Total | 9,773 | 100.0% |
Housing Finances in Oxford
Median Income by Occupancy in Oxford
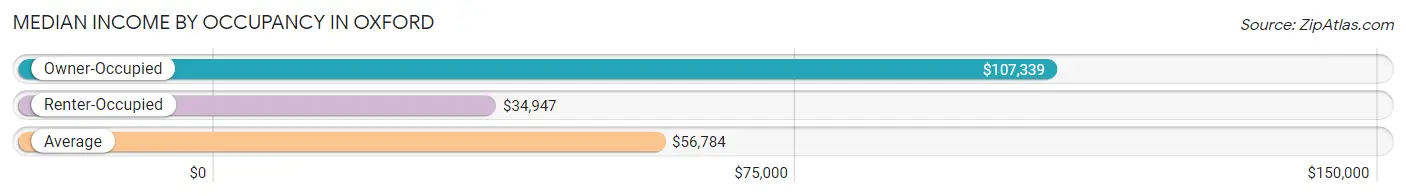
| Occupancy Type | # Households | Median Income |
| Owner-Occupied | 4,168 (42.6%) | $107,339 |
| Renter-Occupied | 5,605 (57.4%) | $34,947 |
| Average | 9,773 (100.0%) | $56,784 |
Occupancy by Householder Income Bracket in Oxford
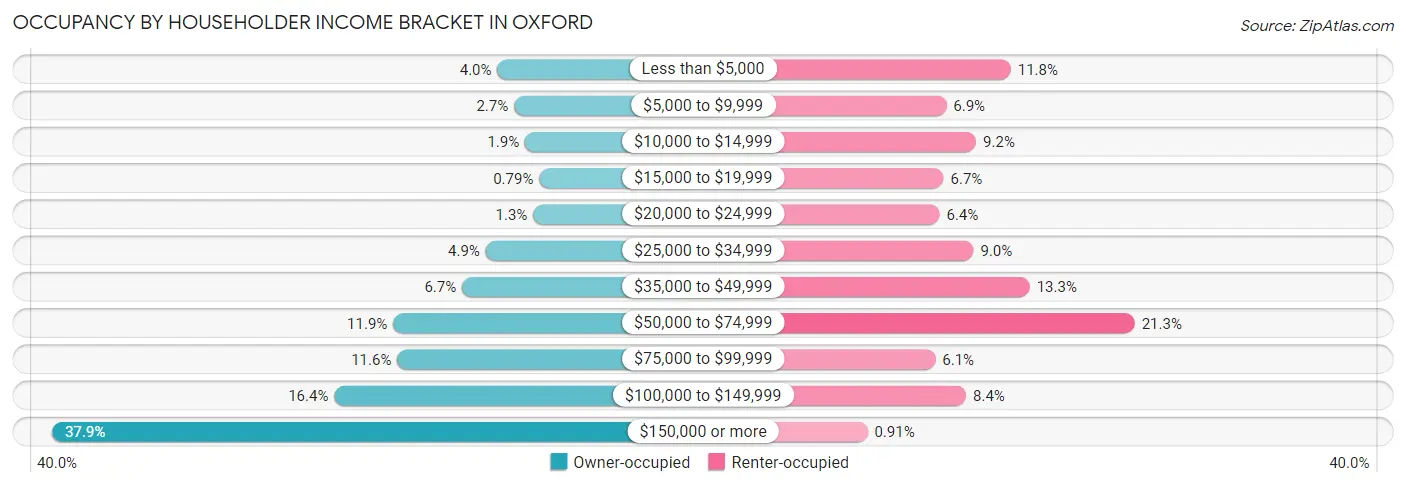
| Income Bracket | Owner-occupied | Renter-occupied |
| Less than $5,000 | 166 (4.0%) | 663 (11.8%) |
| $5,000 to $9,999 | 113 (2.7%) | 388 (6.9%) |
| $10,000 to $14,999 | 78 (1.9%) | 515 (9.2%) |
| $15,000 to $19,999 | 33 (0.8%) | 376 (6.7%) |
| $20,000 to $24,999 | 52 (1.3%) | 359 (6.4%) |
| $25,000 to $34,999 | 203 (4.9%) | 504 (9.0%) |
| $35,000 to $49,999 | 278 (6.7%) | 744 (13.3%) |
| $50,000 to $74,999 | 497 (11.9%) | 1,192 (21.3%) |
| $75,000 to $99,999 | 484 (11.6%) | 341 (6.1%) |
| $100,000 to $149,999 | 684 (16.4%) | 472 (8.4%) |
| $150,000 or more | 1,580 (37.9%) | 51 (0.9%) |
| Total | 4,168 (100.0%) | 5,605 (100.0%) |
Monthly Housing Cost Tiers in Oxford
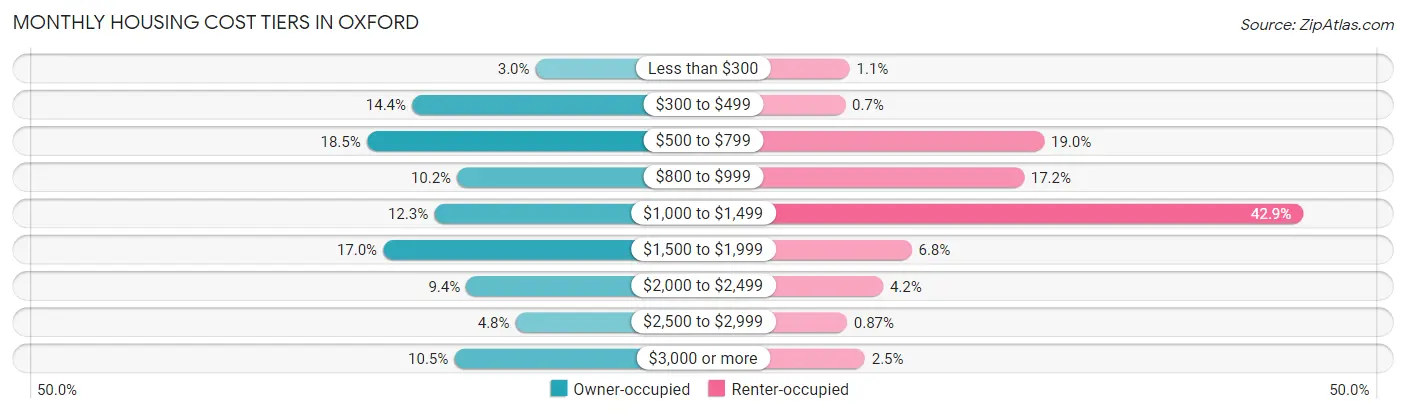
| Monthly Cost | Owner-occupied | Renter-occupied |
| Less than $300 | 124 (3.0%) | 63 (1.1%) |
| $300 to $499 | 598 (14.3%) | 39 (0.7%) |
| $500 to $799 | 772 (18.5%) | 1,066 (19.0%) |
| $800 to $999 | 425 (10.2%) | 962 (17.2%) |
| $1,000 to $1,499 | 513 (12.3%) | 2,403 (42.9%) |
| $1,500 to $1,999 | 709 (17.0%) | 382 (6.8%) |
| $2,000 to $2,499 | 390 (9.4%) | 235 (4.2%) |
| $2,500 to $2,999 | 201 (4.8%) | 49 (0.9%) |
| $3,000 or more | 436 (10.5%) | 141 (2.5%) |
| Total | 4,168 (100.0%) | 5,605 (100.0%) |
Physical Housing Characteristics in Oxford
Housing Structures in Oxford
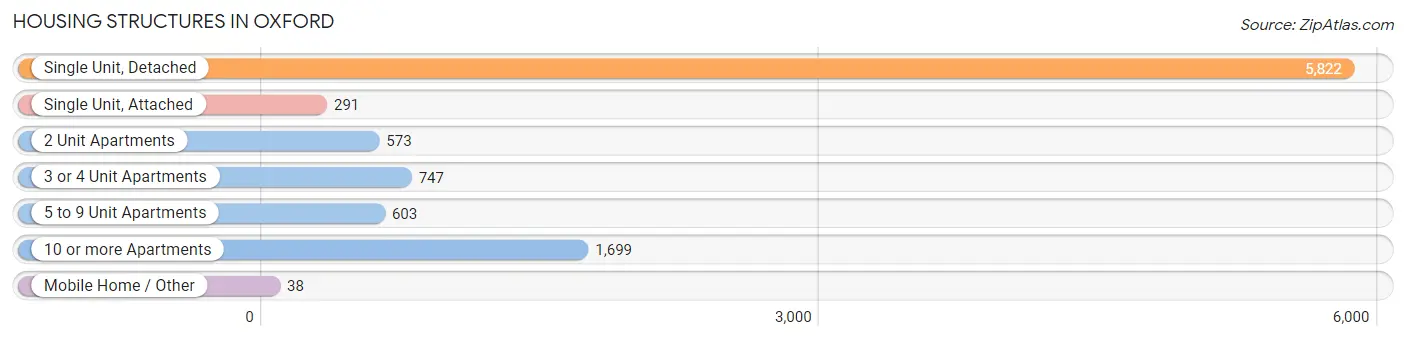
| Structure Type | # Housing Units | % Housing Units |
| Single Unit, Detached | 5,822 | 59.6% |
| Single Unit, Attached | 291 | 3.0% |
| 2 Unit Apartments | 573 | 5.9% |
| 3 or 4 Unit Apartments | 747 | 7.6% |
| 5 to 9 Unit Apartments | 603 | 6.2% |
| 10 or more Apartments | 1,699 | 17.4% |
| Mobile Home / Other | 38 | 0.4% |
| Total | 9,773 | 100.0% |
Housing Structures by Occupancy in Oxford
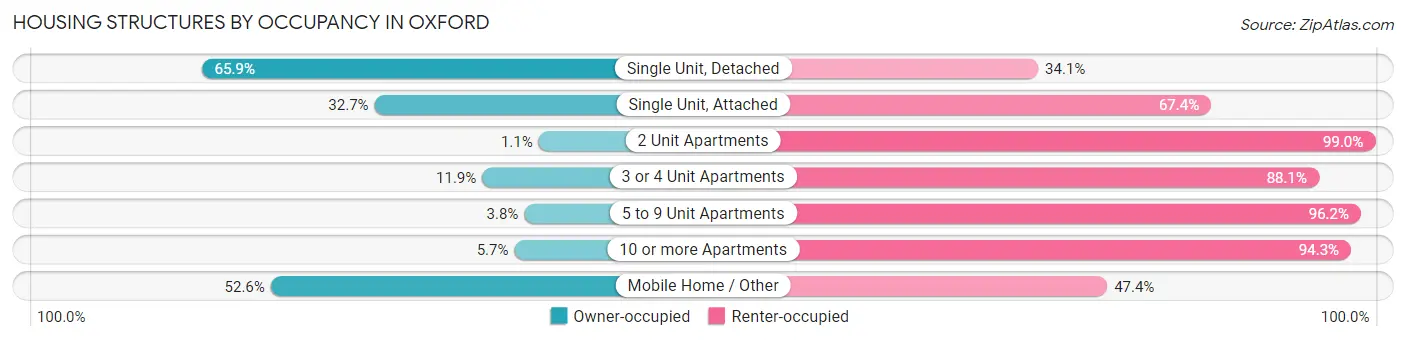
| Structure Type | Owner-occupied | Renter-occupied |
| Single Unit, Detached | 3,838 (65.9%) | 1,984 (34.1%) |
| Single Unit, Attached | 95 (32.7%) | 196 (67.3%) |
| 2 Unit Apartments | 6 (1.1%) | 567 (99.0%) |
| 3 or 4 Unit Apartments | 89 (11.9%) | 658 (88.1%) |
| 5 to 9 Unit Apartments | 23 (3.8%) | 580 (96.2%) |
| 10 or more Apartments | 97 (5.7%) | 1,602 (94.3%) |
| Mobile Home / Other | 20 (52.6%) | 18 (47.4%) |
| Total | 4,168 (42.6%) | 5,605 (57.4%) |
Housing Structures by Number of Rooms in Oxford
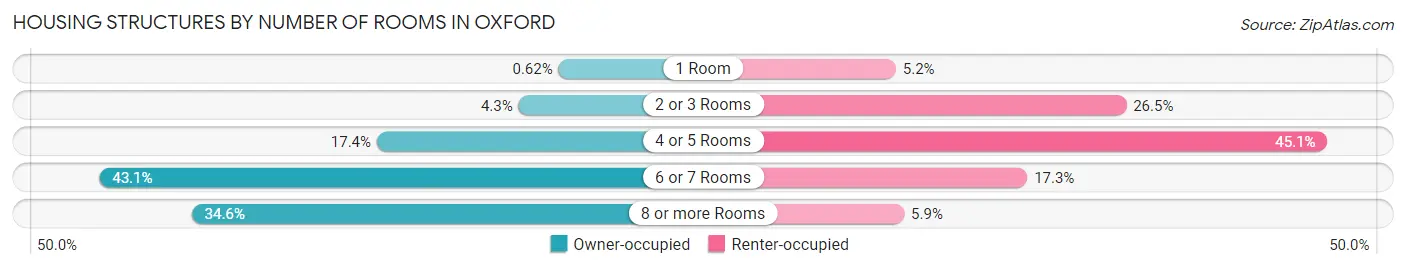
| Number of Rooms | Owner-occupied | Renter-occupied |
| 1 Room | 26 (0.6%) | 290 (5.2%) |
| 2 or 3 Rooms | 180 (4.3%) | 1,484 (26.5%) |
| 4 or 5 Rooms | 726 (17.4%) | 2,527 (45.1%) |
| 6 or 7 Rooms | 1,796 (43.1%) | 971 (17.3%) |
| 8 or more Rooms | 1,440 (34.5%) | 333 (5.9%) |
| Total | 4,168 (100.0%) | 5,605 (100.0%) |
Housing Structure by Heating Type in Oxford
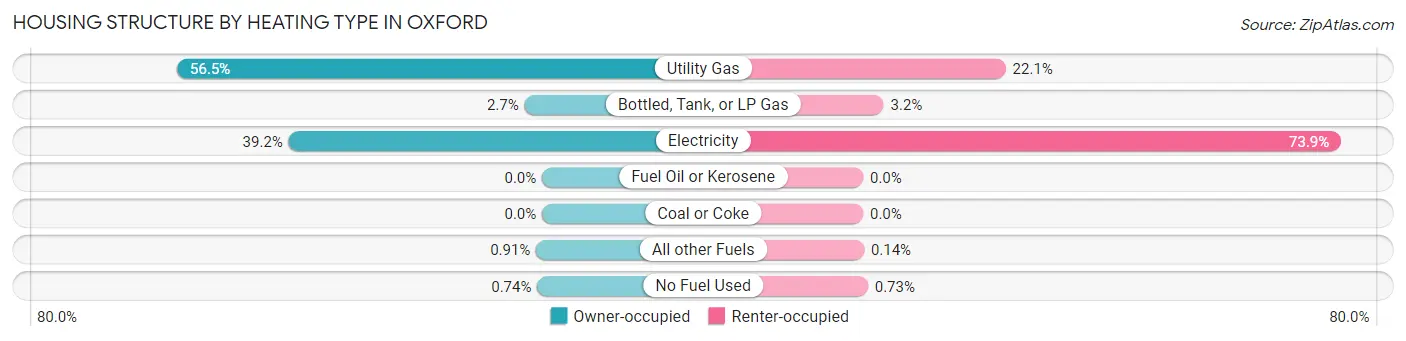
| Heating Type | Owner-occupied | Renter-occupied |
| Utility Gas | 2,353 (56.5%) | 1,236 (22.1%) |
| Bottled, Tank, or LP Gas | 113 (2.7%) | 178 (3.2%) |
| Electricity | 1,633 (39.2%) | 4,142 (73.9%) |
| Fuel Oil or Kerosene | 0 (0.0%) | 0 (0.0%) |
| Coal or Coke | 0 (0.0%) | 0 (0.0%) |
| All other Fuels | 38 (0.9%) | 8 (0.1%) |
| No Fuel Used | 31 (0.7%) | 41 (0.7%) |
| Total | 4,168 (100.0%) | 5,605 (100.0%) |
Household Vehicle Usage in Oxford
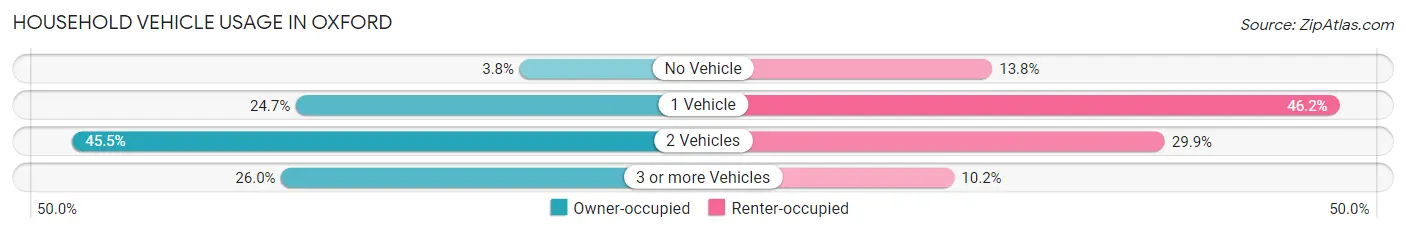
| Vehicles per Household | Owner-occupied | Renter-occupied |
| No Vehicle | 157 (3.8%) | 771 (13.8%) |
| 1 Vehicle | 1,028 (24.7%) | 2,587 (46.2%) |
| 2 Vehicles | 1,898 (45.5%) | 1,674 (29.9%) |
| 3 or more Vehicles | 1,085 (26.0%) | 573 (10.2%) |
| Total | 4,168 (100.0%) | 5,605 (100.0%) |
Real Estate & Mortgages in Oxford
Real Estate and Mortgage Overview in Oxford
| Characteristic | Without Mortgage | With Mortgage |
| Housing Units | 1,876 | 2,292 |
| Median Property Value | $313,100 | $337,400 |
| Median Household Income | $100,511 | $845 |
| Monthly Housing Costs | $580 | $436 |
| Real Estate Taxes | $1,966 | $54 |
Property Value by Mortgage Status in Oxford
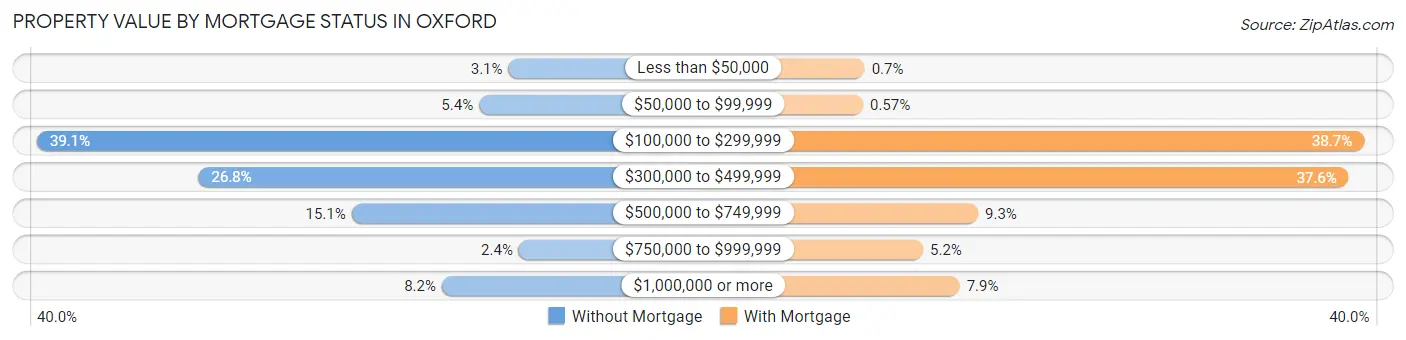
| Property Value | Without Mortgage | With Mortgage |
| Less than $50,000 | 59 (3.1%) | 16 (0.7%) |
| $50,000 to $99,999 | 101 (5.4%) | 13 (0.6%) |
| $100,000 to $299,999 | 733 (39.1%) | 888 (38.7%) |
| $300,000 to $499,999 | 502 (26.8%) | 861 (37.6%) |
| $500,000 to $749,999 | 283 (15.1%) | 214 (9.3%) |
| $750,000 to $999,999 | 44 (2.4%) | 118 (5.1%) |
| $1,000,000 or more | 154 (8.2%) | 182 (7.9%) |
| Total | 1,876 (100.0%) | 2,292 (100.0%) |
Household Income by Mortgage Status in Oxford
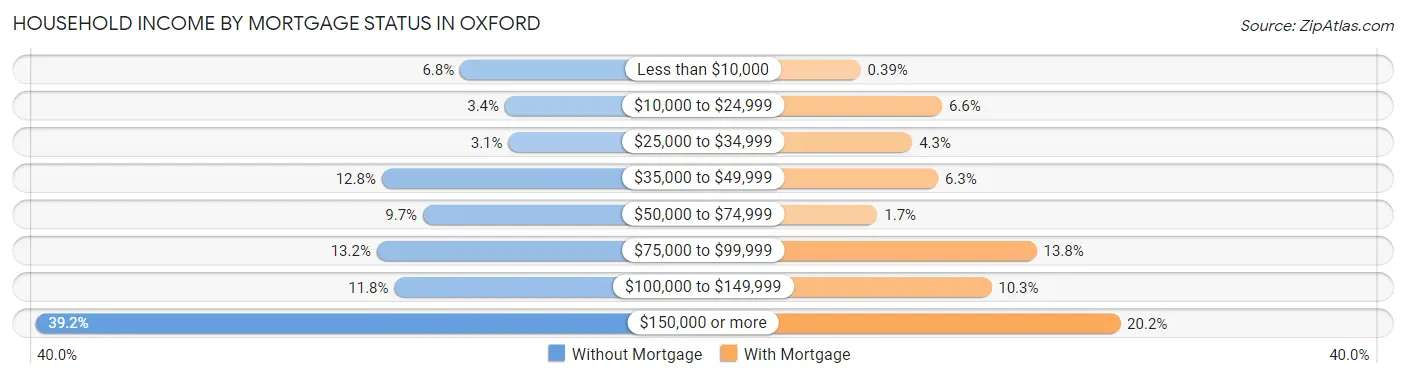
| Household Income | Without Mortgage | With Mortgage |
| Less than $10,000 | 128 (6.8%) | 9 (0.4%) |
| $10,000 to $24,999 | 64 (3.4%) | 151 (6.6%) |
| $25,000 to $34,999 | 59 (3.1%) | 99 (4.3%) |
| $35,000 to $49,999 | 240 (12.8%) | 144 (6.3%) |
| $50,000 to $74,999 | 181 (9.7%) | 38 (1.7%) |
| $75,000 to $99,999 | 247 (13.2%) | 316 (13.8%) |
| $100,000 to $149,999 | 222 (11.8%) | 237 (10.3%) |
| $150,000 or more | 735 (39.2%) | 462 (20.2%) |
| Total | 1,876 (100.0%) | 2,292 (100.0%) |
Property Value to Household Income Ratio in Oxford
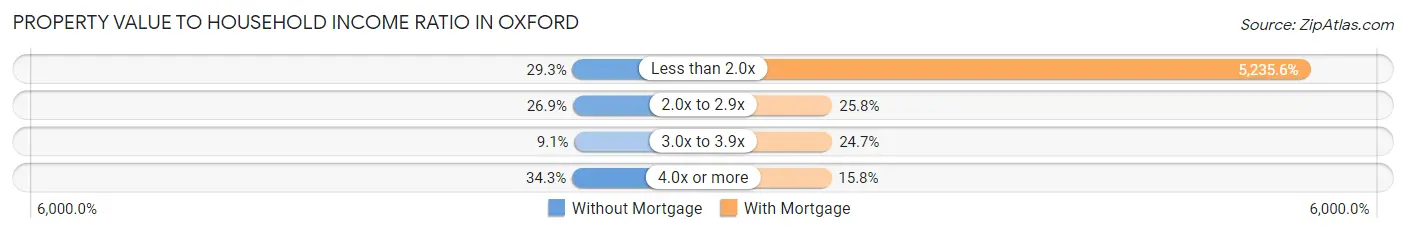
| Value-to-Income Ratio | Without Mortgage | With Mortgage |
| Less than 2.0x | 549 (29.3%) | 120,000 (5,235.6%) |
| 2.0x to 2.9x | 505 (26.9%) | 591 (25.8%) |
| 3.0x to 3.9x | 170 (9.1%) | 567 (24.7%) |
| 4.0x or more | 643 (34.3%) | 361 (15.8%) |
| Total | 1,876 (100.0%) | 2,292 (100.0%) |
Real Estate Taxes by Mortgage Status in Oxford
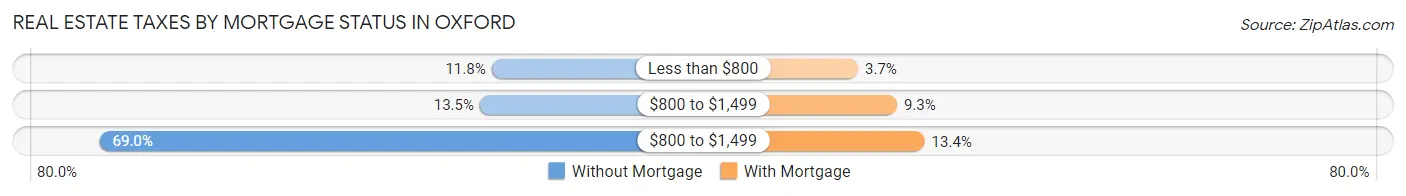
| Property Taxes | Without Mortgage | With Mortgage |
| Less than $800 | 221 (11.8%) | 84 (3.7%) |
| $800 to $1,499 | 253 (13.5%) | 214 (9.3%) |
| $800 to $1,499 | 1,295 (69.0%) | 307 (13.4%) |
| Total | 1,876 (100.0%) | 2,292 (100.0%) |
Health & Disability in Oxford
Health Insurance Coverage by Age in Oxford
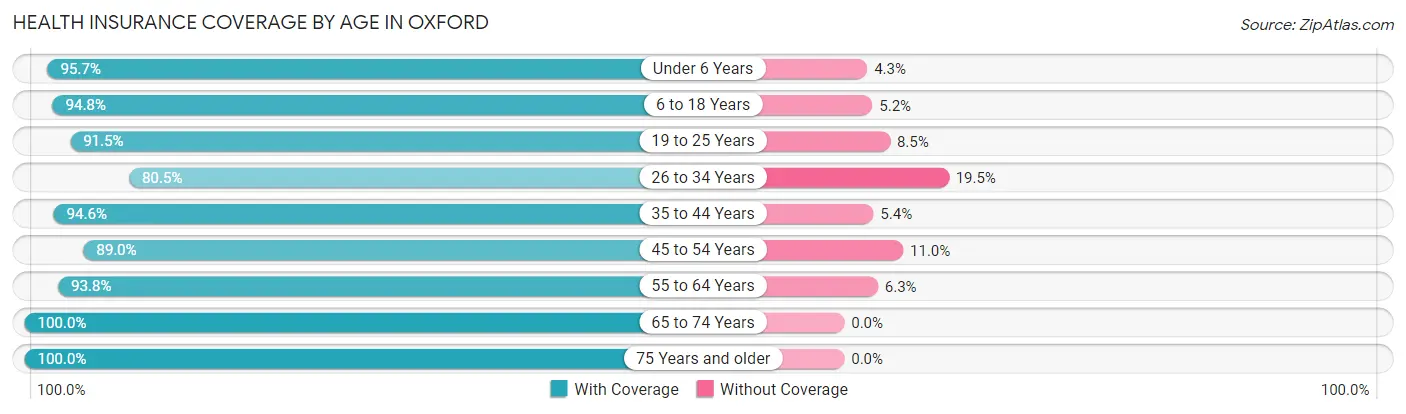
| Age Bracket | With Coverage | Without Coverage |
| Under 6 Years | 1,411 (95.7%) | 63 (4.3%) |
| 6 to 18 Years | 2,844 (94.8%) | 157 (5.2%) |
| 19 to 25 Years | 6,237 (91.5%) | 580 (8.5%) |
| 26 to 34 Years | 3,206 (80.5%) | 775 (19.5%) |
| 35 to 44 Years | 2,734 (94.6%) | 157 (5.4%) |
| 45 to 54 Years | 1,866 (89.0%) | 230 (11.0%) |
| 55 to 64 Years | 1,666 (93.8%) | 111 (6.2%) |
| 65 to 74 Years | 1,728 (100.0%) | 0 (0.0%) |
| 75 Years and older | 1,272 (100.0%) | 0 (0.0%) |
| Total | 22,964 (91.7%) | 2,073 (8.3%) |
Health Insurance Coverage by Citizenship Status in Oxford
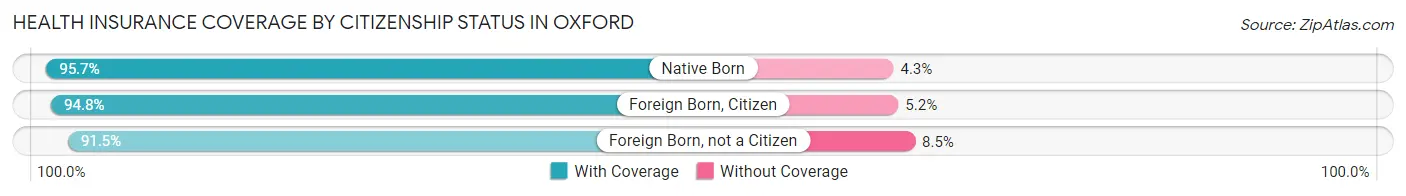
| Citizenship Status | With Coverage | Without Coverage |
| Native Born | 1,411 (95.7%) | 63 (4.3%) |
| Foreign Born, Citizen | 2,844 (94.8%) | 157 (5.2%) |
| Foreign Born, not a Citizen | 6,237 (91.5%) | 580 (8.5%) |
Health Insurance Coverage by Household Income in Oxford
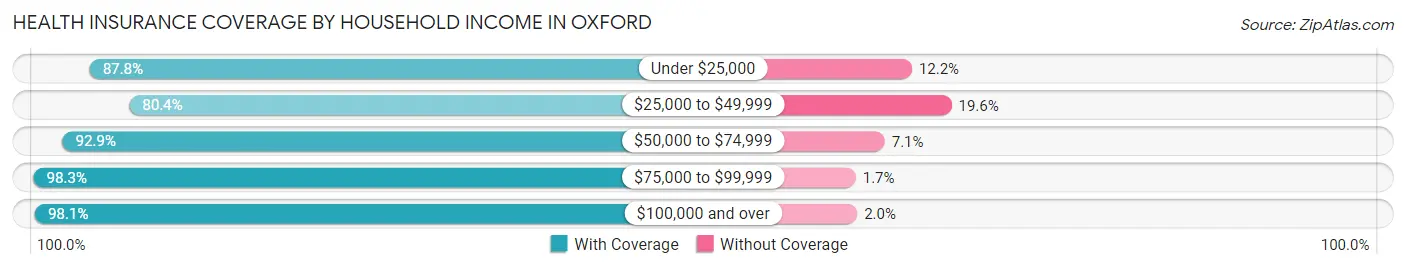
| Household Income | With Coverage | Without Coverage |
| Under $25,000 | 5,550 (87.8%) | 772 (12.2%) |
| $25,000 to $49,999 | 3,472 (80.4%) | 848 (19.6%) |
| $50,000 to $74,999 | 3,249 (92.9%) | 249 (7.1%) |
| $75,000 to $99,999 | 2,105 (98.3%) | 36 (1.7%) |
| $100,000 and over | 8,442 (98.1%) | 168 (1.9%) |
Public vs Private Health Insurance Coverage by Age in Oxford
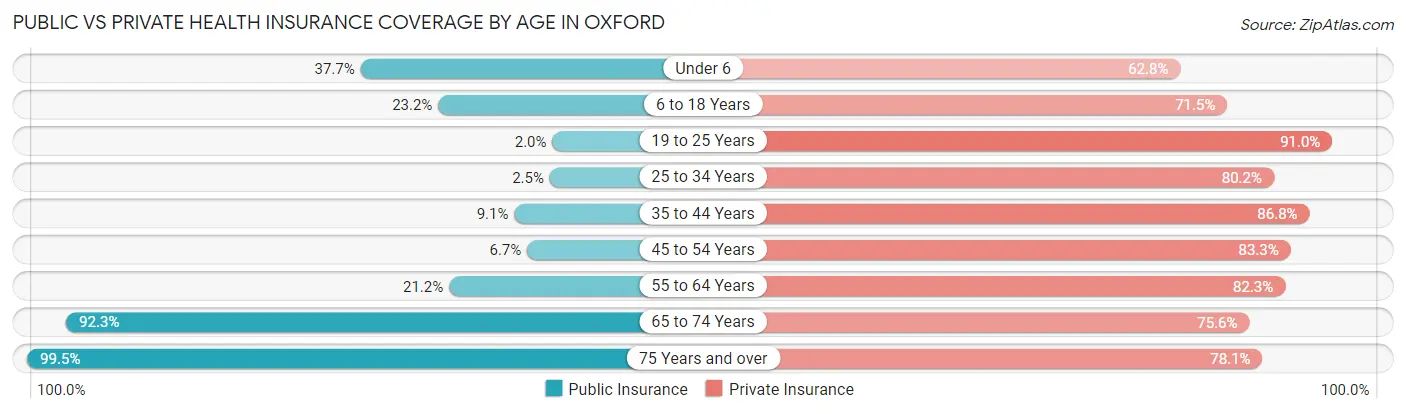
| Age Bracket | Public Insurance | Private Insurance |
| Under 6 | 555 (37.7%) | 926 (62.8%) |
| 6 to 18 Years | 697 (23.2%) | 2,147 (71.5%) |
| 19 to 25 Years | 139 (2.0%) | 6,205 (91.0%) |
| 25 to 34 Years | 100 (2.5%) | 3,192 (80.2%) |
| 35 to 44 Years | 263 (9.1%) | 2,509 (86.8%) |
| 45 to 54 Years | 141 (6.7%) | 1,746 (83.3%) |
| 55 to 64 Years | 377 (21.2%) | 1,462 (82.3%) |
| 65 to 74 Years | 1,595 (92.3%) | 1,307 (75.6%) |
| 75 Years and over | 1,266 (99.5%) | 993 (78.1%) |
| Total | 5,133 (20.5%) | 20,487 (81.8%) |
Disability Status by Sex by Age in Oxford
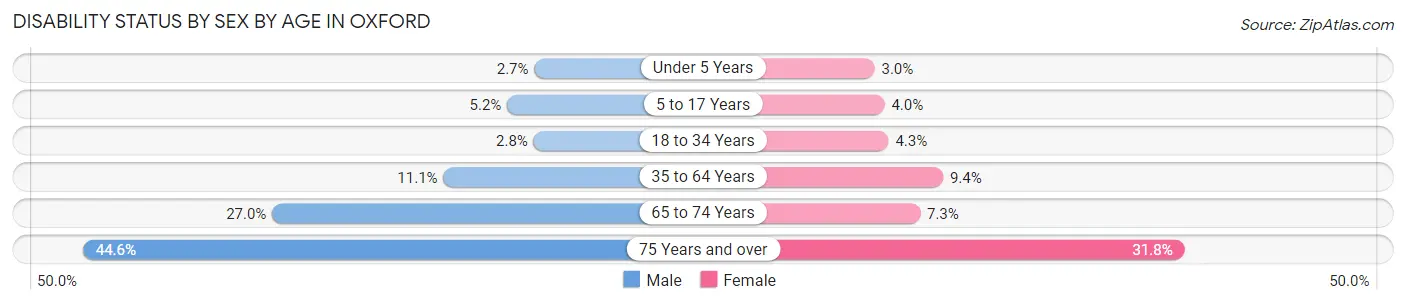
| Age Bracket | Male | Female |
| Under 5 Years | 18 (2.7%) | 18 (3.0%) |
| 5 to 17 Years | 79 (5.2%) | 58 (4.0%) |
| 18 to 34 Years | 151 (2.8%) | 240 (4.3%) |
| 35 to 64 Years | 325 (11.1%) | 361 (9.4%) |
| 65 to 74 Years | 214 (27.0%) | 68 (7.3%) |
| 75 Years and over | 186 (44.6%) | 272 (31.8%) |
Disability Class by Sex by Age in Oxford
Disability Class: Hearing Difficulty
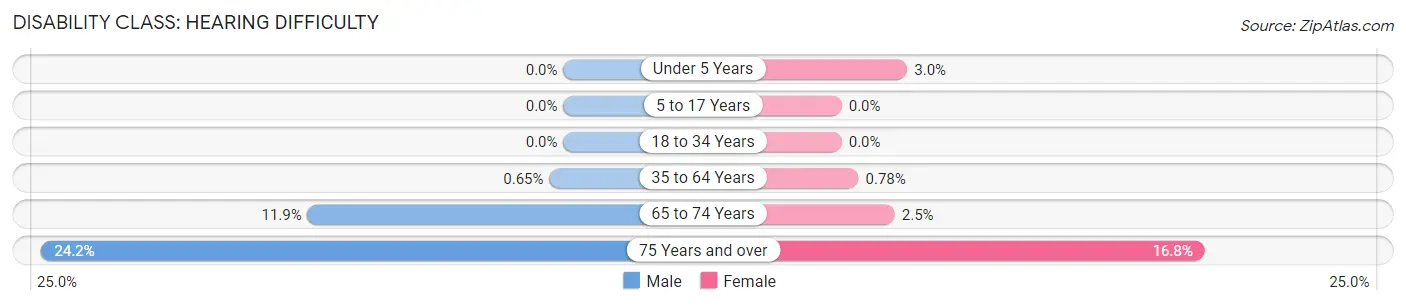
| Age Bracket | Male | Female |
| Under 5 Years | 0 (0.0%) | 18 (3.0%) |
| 5 to 17 Years | 0 (0.0%) | 0 (0.0%) |
| 18 to 34 Years | 0 (0.0%) | 0 (0.0%) |
| 35 to 64 Years | 19 (0.6%) | 30 (0.8%) |
| 65 to 74 Years | 94 (11.9%) | 23 (2.5%) |
| 75 Years and over | 101 (24.2%) | 144 (16.8%) |
Disability Class: Vision Difficulty
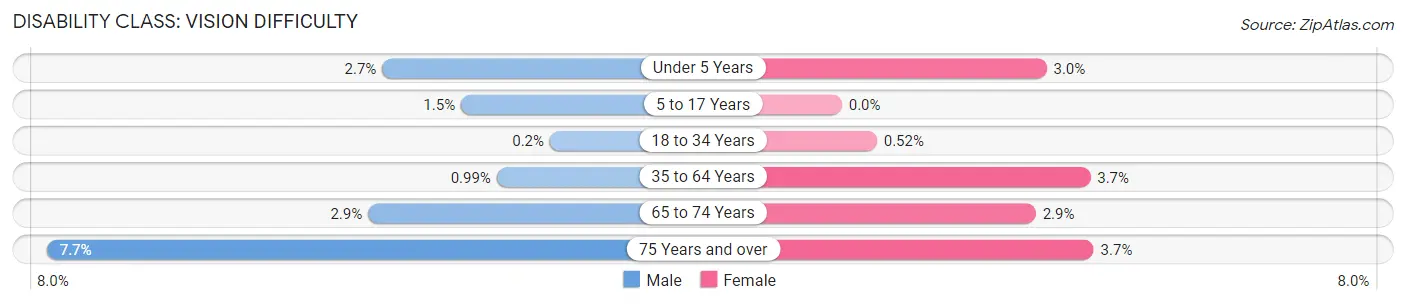
| Age Bracket | Male | Female |
| Under 5 Years | 18 (2.7%) | 18 (3.0%) |
| 5 to 17 Years | 23 (1.5%) | 0 (0.0%) |
| 18 to 34 Years | 11 (0.2%) | 29 (0.5%) |
| 35 to 64 Years | 29 (1.0%) | 142 (3.7%) |
| 65 to 74 Years | 23 (2.9%) | 27 (2.9%) |
| 75 Years and over | 32 (7.7%) | 32 (3.7%) |
Disability Class: Cognitive Difficulty
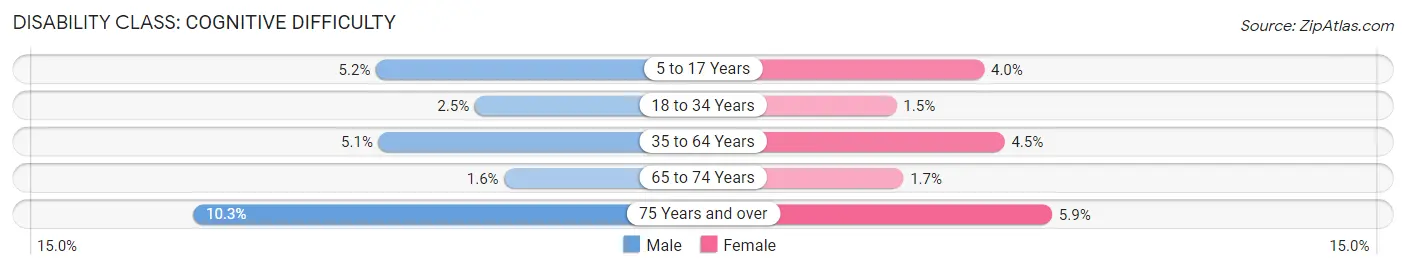
| Age Bracket | Male | Female |
| 5 to 17 Years | 79 (5.2%) | 58 (4.0%) |
| 18 to 34 Years | 135 (2.5%) | 84 (1.5%) |
| 35 to 64 Years | 150 (5.1%) | 174 (4.5%) |
| 65 to 74 Years | 13 (1.6%) | 16 (1.7%) |
| 75 Years and over | 43 (10.3%) | 50 (5.9%) |
Disability Class: Ambulatory Difficulty
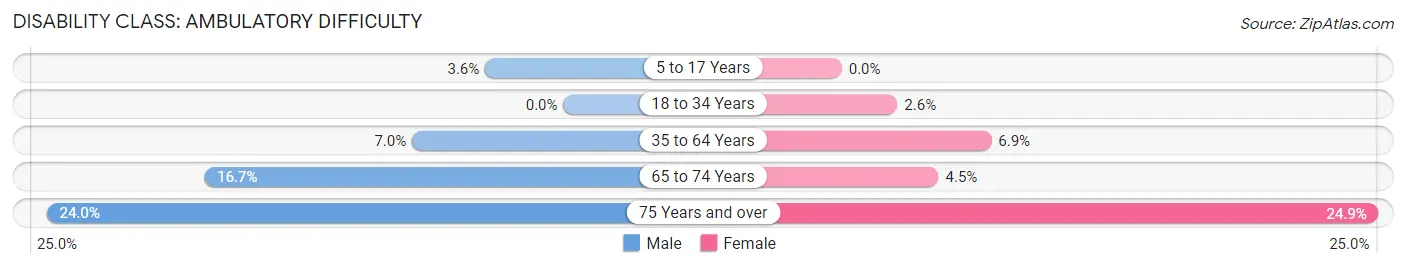
| Age Bracket | Male | Female |
| 5 to 17 Years | 55 (3.6%) | 0 (0.0%) |
| 18 to 34 Years | 0 (0.0%) | 143 (2.6%) |
| 35 to 64 Years | 205 (7.0%) | 267 (6.9%) |
| 65 to 74 Years | 132 (16.7%) | 42 (4.5%) |
| 75 Years and over | 100 (24.0%) | 213 (24.9%) |
Disability Class: Self-Care Difficulty
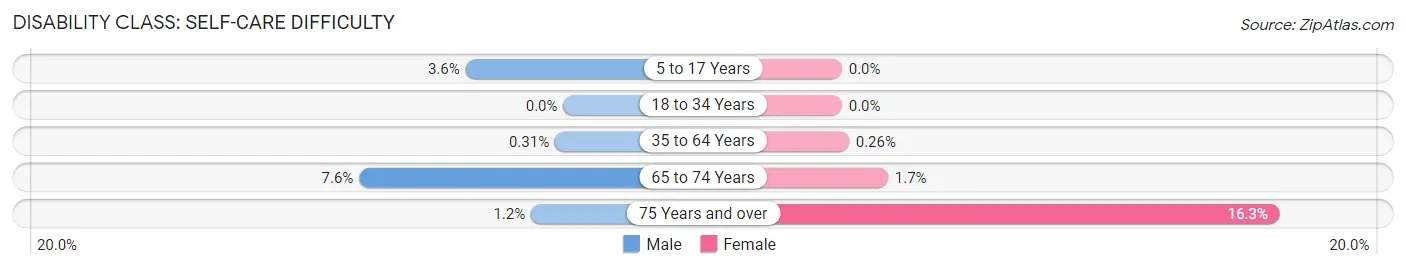
| Age Bracket | Male | Female |
| 5 to 17 Years | 55 (3.6%) | 0 (0.0%) |
| 18 to 34 Years | 0 (0.0%) | 0 (0.0%) |
| 35 to 64 Years | 9 (0.3%) | 10 (0.3%) |
| 65 to 74 Years | 60 (7.6%) | 16 (1.7%) |
| 75 Years and over | 5 (1.2%) | 139 (16.3%) |
Technology Access in Oxford
Computing Device Access in Oxford
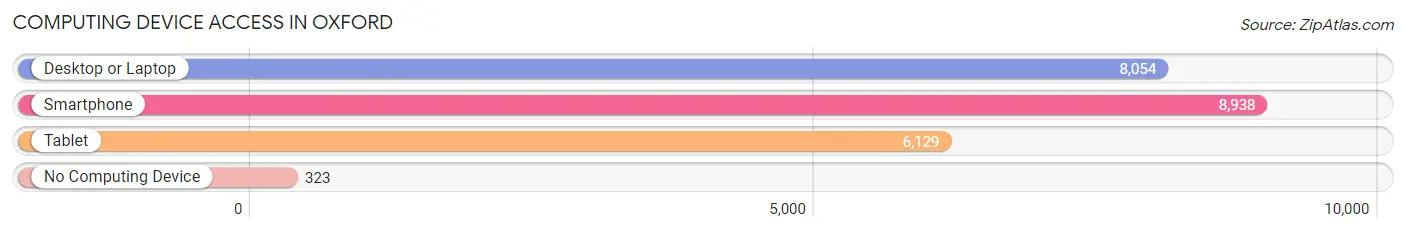
| Device Type | # Households | % Households |
| Desktop or Laptop | 8,054 | 82.4% |
| Smartphone | 8,938 | 91.5% |
| Tablet | 6,129 | 62.7% |
| No Computing Device | 323 | 3.3% |
| Total | 9,773 | 100.0% |
Internet Access in Oxford
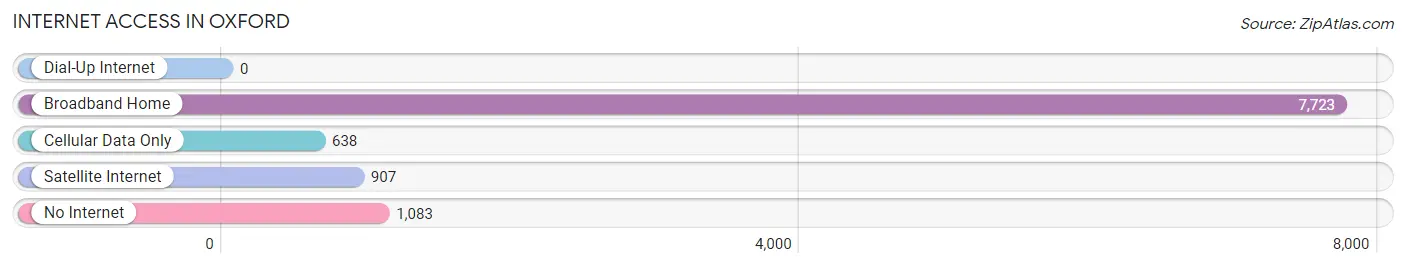
| Internet Type | # Households | % Households |
| Dial-Up Internet | 0 | 0.0% |
| Broadband Home | 7,723 | 79.0% |
| Cellular Data Only | 638 | 6.5% |
| Satellite Internet | 907 | 9.3% |
| No Internet | 1,083 | 11.1% |
| Total | 9,773 | 100.0% |
Oxford Summary
Oxford, Mississippi is a city located in Lafayette County in the northern part of the state. It is the county seat and home to the University of Mississippi, commonly known as Ole Miss. Oxford is known for its vibrant culture, rich history, and beautiful scenery.
History
Oxford was founded in 1837 and named after the British university city of Oxford. The city was originally a trading post and was the site of the Battle of Oxford during the Civil War. After the war, the city was rebuilt and became a center of education and culture. The University of Mississippi was founded in 1848 and has since become one of the most prestigious universities in the South.
Geography
Oxford is located in the northern part of Mississippi, in Lafayette County. It is situated on the banks of the Tallahatchie River and is surrounded by rolling hills and forests. The city is located about 90 miles south of Memphis, Tennessee and about 60 miles north of Jackson, Mississippi.
Economy
Oxford’s economy is largely driven by the University of Mississippi, which is the city’s largest employer. The university provides jobs for faculty, staff, and students, as well as providing a boost to the local economy through tourism and spending. Other major employers in the city include the Oxford-Lafayette County School District, Baptist Memorial Hospital, and the Oxford-Lafayette County Chamber of Commerce.
Demographics
As of the 2010 census, the population of Oxford was 21,348. The racial makeup of the city was 73.3% White, 21.2% African American, 0.3% Native American, 2.2% Asian, and 2.9% from other races. The median household income was $37,845 and the median family income was $50,945.
Oxford is a vibrant city with a rich history and culture. It is home to the University of Mississippi, which provides a boost to the local economy and provides jobs for many of the city’s residents. The city is also known for its beautiful scenery and is a popular destination for tourists.
Common Questions
What is Per Capita Income in Oxford?
Per Capita income in Oxford is $36,979.
What is the Median Family Income in Oxford?
Median Family Income in Oxford is $91,506.
What is the Median Household income in Oxford?
Median Household Income in Oxford is $56,784.
What is Income or Wage Gap in Oxford?
Income or Wage Gap in Oxford is 33.6%.
Women in Oxford earn 66.4 cents for every dollar earned by a man.
What is Inequality or Gini Index in Oxford?
Inequality or Gini Index in Oxford is 0.58.
What is the Total Population of Oxford?
Total Population of Oxford is 25,713.
What is the Total Male Population of Oxford?
Total Male Population of Oxford is 12,244.
What is the Total Female Population of Oxford?
Total Female Population of Oxford is 13,469.
What is the Ratio of Males per 100 Females in Oxford?
There are 90.91 Males per 100 Females in Oxford.
What is the Ratio of Females per 100 Males in Oxford?
There are 110.00 Females per 100 Males in Oxford.
What is the Median Population Age in Oxford?
Median Population Age in Oxford is 27.7 Years.
What is the Average Family Size in Oxford
Average Family Size in Oxford is 3.2 People.
What is the Average Household Size in Oxford
Average Household Size in Oxford is 2.5 People.
How Large is the Labor Force in Oxford?
There are 13,117 People in the Labor Forcein in Oxford.
What is the Percentage of People in the Labor Force in Oxford?
60.0% of People are in the Labor Force in Oxford.
What is the Unemployment Rate in Oxford?
Unemployment Rate in Oxford is 3.3%.