Charleston, MS Map & Demographics
Charleston Map
Charleston Overview
$17,154
PER CAPITA INCOME
$38,984
AVG FAMILY INCOME
$34,137
AVG HOUSEHOLD INCOME
10.0%
WAGE / INCOME GAP [ % ]
90.0¢/ $1
WAGE / INCOME GAP [ $ ]
0.41
INEQUALITY / GINI INDEX
2,624
TOTAL POPULATION
1,401
MALE POPULATION
1,223
FEMALE POPULATION
114.55
MALES / 100 FEMALES
87.29
FEMALES / 100 MALES
31.1
MEDIAN AGE
4.0
AVG FAMILY SIZE
3.0
AVG HOUSEHOLD SIZE
1,039
LABOR FORCE [ PEOPLE ]
54.2%
PERCENT IN LABOR FORCE
14.8%
UNEMPLOYMENT RATE
Charleston Zip Codes
Charleston Area Codes
Income in Charleston
Income Overview in Charleston
Per Capita Income in Charleston is $17,154, while median incomes of families and households are $38,984 and $34,137 respectively.
| Characteristic | Number | Measure |
| Per Capita Income | 2,624 | $17,154 |
| Median Family Income | 507 | $38,984 |
| Mean Family Income | 507 | $49,292 |
| Median Household Income | 838 | $34,137 |
| Mean Household Income | 838 | $45,843 |
| Income Deficit | 507 | $0 |
| Wage / Income Gap (%) | 2,624 | 10.04% |
| Wage / Income Gap ($) | 2,624 | 89.96¢ per $1 |
| Gini / Inequality Index | 2,624 | 0.41 |
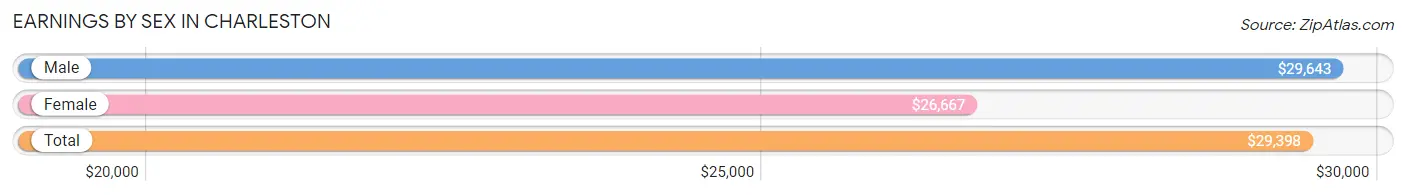
Earnings by Sex in Charleston
Average Earnings in Charleston are $29,398, $29,643 for men and $26,667 for women, a difference of 10.0%.
| Sex | Number | Average Earnings |
| Male | 568 (58.1%) | $29,643 |
| Female | 410 (41.9%) | $26,667 |
| Total | 978 (100.0%) | $29,398 |
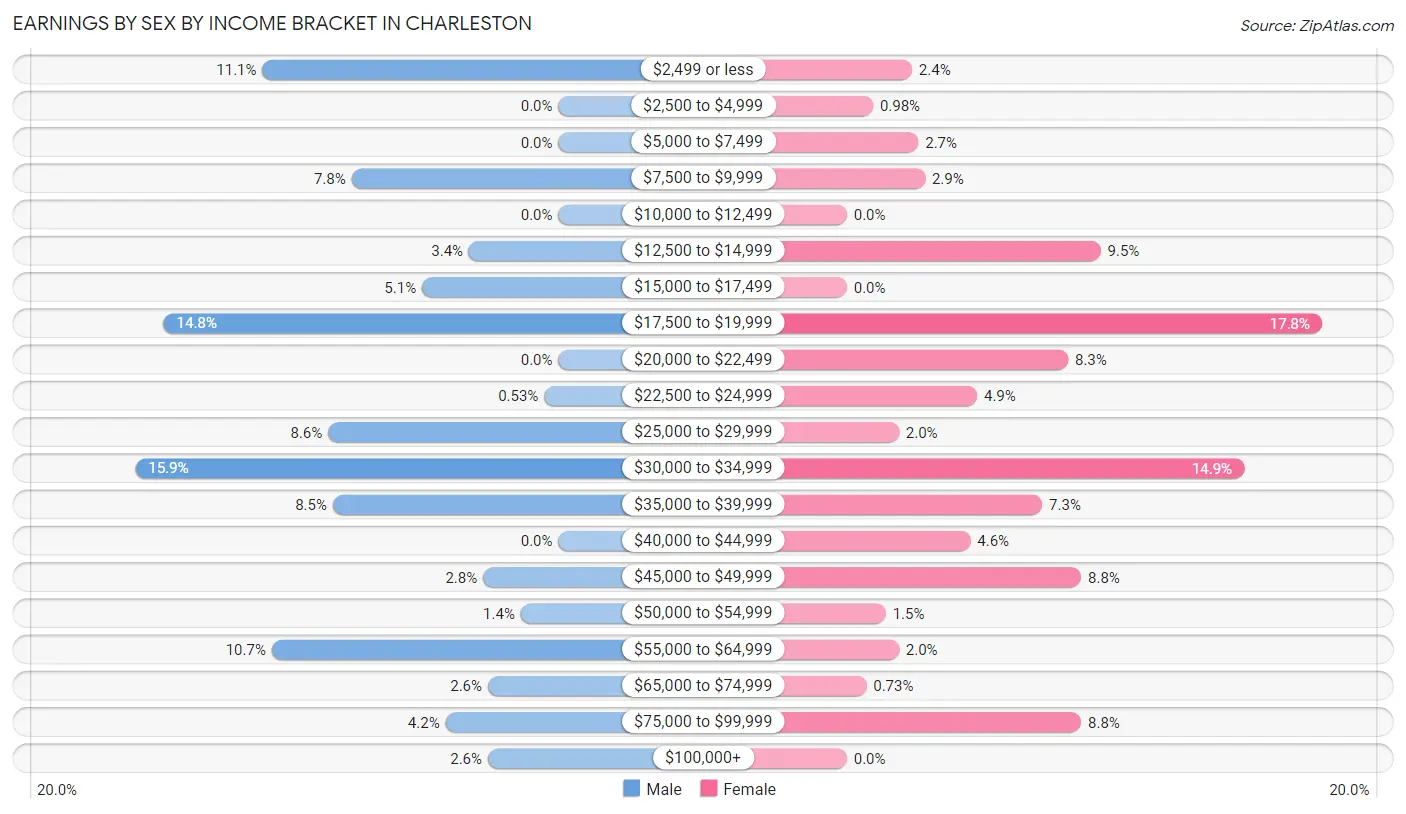
Earnings by Sex by Income Bracket in Charleston
The most common earnings brackets in Charleston are $30,000 to $34,999 for men (90 | 15.9%) and $17,500 to $19,999 for women (73 | 17.8%).
| Income | Male | Female |
| $2,499 or less | 63 (11.1%) | 10 (2.4%) |
| $2,500 to $4,999 | 0 (0.0%) | 4 (1.0%) |
| $5,000 to $7,499 | 0 (0.0%) | 11 (2.7%) |
| $7,500 to $9,999 | 44 (7.7%) | 12 (2.9%) |
| $10,000 to $12,499 | 0 (0.0%) | 0 (0.0%) |
| $12,500 to $14,999 | 19 (3.4%) | 39 (9.5%) |
| $15,000 to $17,499 | 29 (5.1%) | 0 (0.0%) |
| $17,500 to $19,999 | 84 (14.8%) | 73 (17.8%) |
| $20,000 to $22,499 | 0 (0.0%) | 34 (8.3%) |
| $22,500 to $24,999 | 3 (0.5%) | 20 (4.9%) |
| $25,000 to $29,999 | 49 (8.6%) | 8 (1.9%) |
| $30,000 to $34,999 | 90 (15.9%) | 61 (14.9%) |
| $35,000 to $39,999 | 48 (8.5%) | 30 (7.3%) |
| $40,000 to $44,999 | 0 (0.0%) | 19 (4.6%) |
| $45,000 to $49,999 | 16 (2.8%) | 36 (8.8%) |
| $50,000 to $54,999 | 8 (1.4%) | 6 (1.5%) |
| $55,000 to $64,999 | 61 (10.7%) | 8 (1.9%) |
| $65,000 to $74,999 | 15 (2.6%) | 3 (0.7%) |
| $75,000 to $99,999 | 24 (4.2%) | 36 (8.8%) |
| $100,000+ | 15 (2.6%) | 0 (0.0%) |
| Total | 568 (100.0%) | 410 (100.0%) |
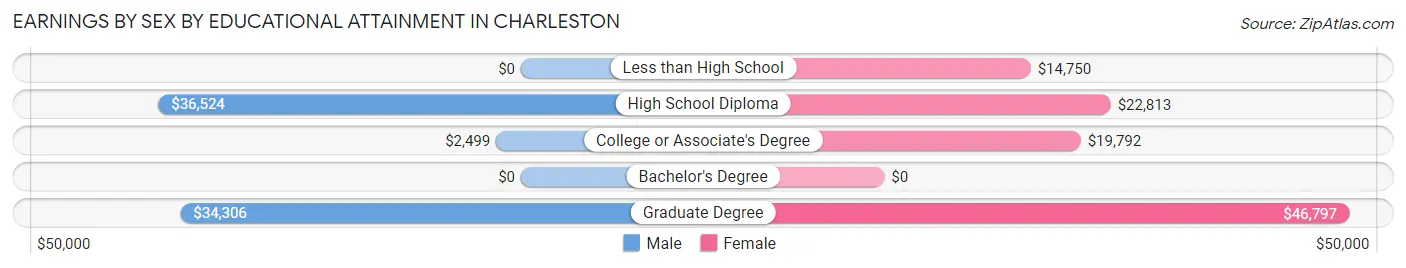
Earnings by Sex by Educational Attainment in Charleston
Average earnings in Charleston are $32,556 for men and $24,375 for women, a difference of 25.1%. Men with an educational attainment of high school diploma enjoy the highest average annual earnings of $36,524, while those with college or associate's degree education earn the least with $2,499. Women with an educational attainment of graduate degree earn the most with the average annual earnings of $46,797, while those with less than high school education have the smallest earnings of $14,750.
| Educational Attainment | Male Income | Female Income |
| Less than High School | - | - |
| High School Diploma | $36,524 | $22,813 |
| College or Associate's Degree | $2,499 | $19,792 |
| Bachelor's Degree | - | - |
| Graduate Degree | $34,306 | $46,797 |
| Total | $32,556 | $24,375 |
Family Income in Charleston
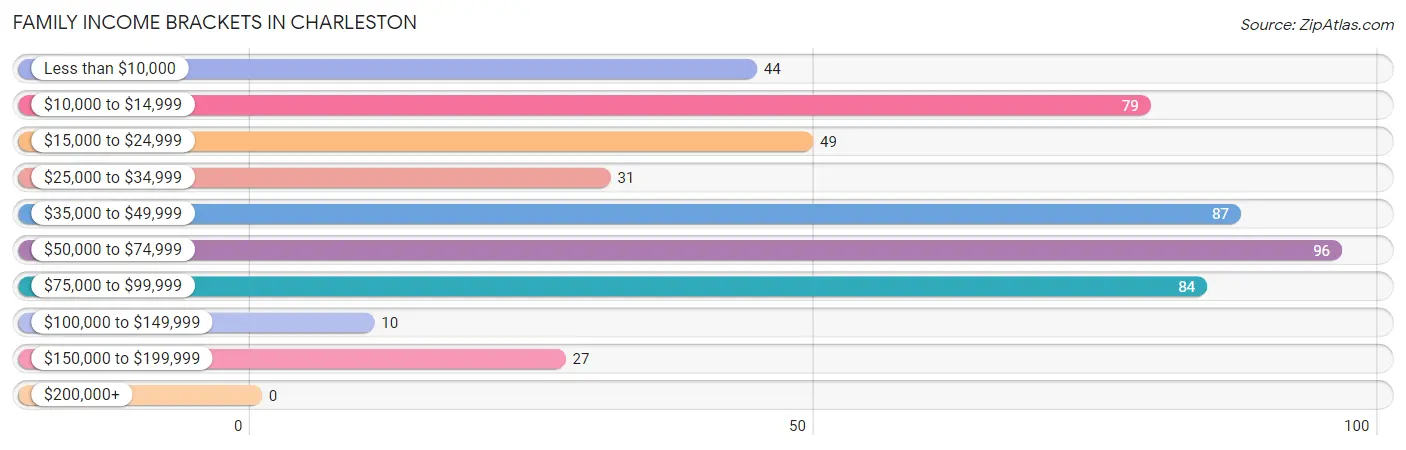
Family Income Brackets in Charleston
According to the Charleston family income data, there are 96 families falling into the $50,000 to $74,999 income range, which is the most common income bracket and makes up 18.9% of all families.
| Income Bracket | # Families | % Families |
| Less than $10,000 | 44 | 8.7% |
| $10,000 to $14,999 | 79 | 15.6% |
| $15,000 to $24,999 | 49 | 9.7% |
| $25,000 to $34,999 | 31 | 6.1% |
| $35,000 to $49,999 | 87 | 17.2% |
| $50,000 to $74,999 | 96 | 18.9% |
| $75,000 to $99,999 | 84 | 16.6% |
| $100,000 to $149,999 | 10 | 2.0% |
| $150,000 to $199,999 | 27 | 5.3% |
| $200,000+ | 0 | 0.0% |
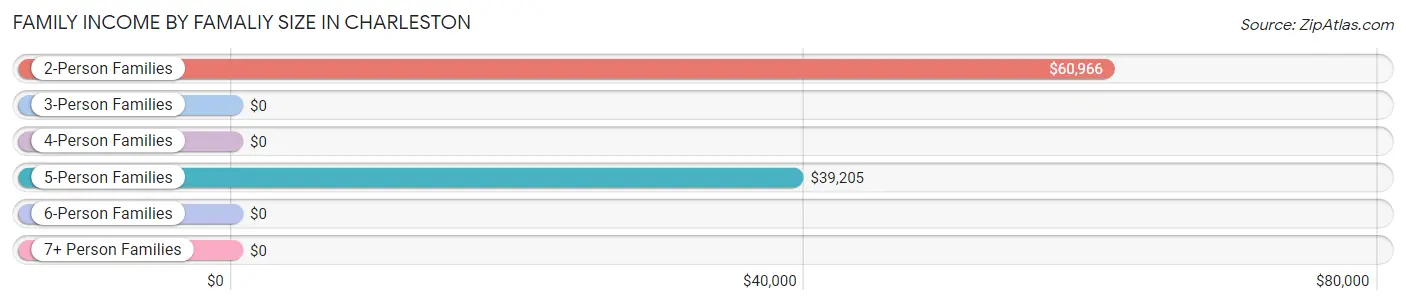
Family Income by Famaliy Size in Charleston
2-person families (167 | 32.9%) account for the highest median family income in Charleston with $60,966 per family, while 2-person families (167 | 32.9%) have the highest median income of $30,483 per family member.
| Income Bracket | # Families | Median Income |
| 2-Person Families | 167 (32.9%) | $60,966 |
| 3-Person Families | 168 (33.1%) | $0 |
| 4-Person Families | 92 (18.1%) | $0 |
| 5-Person Families | 72 (14.2%) | $39,205 |
| 6-Person Families | 4 (0.8%) | $0 |
| 7+ Person Families | 4 (0.8%) | $0 |
| Total | 507 (100.0%) | $38,984 |
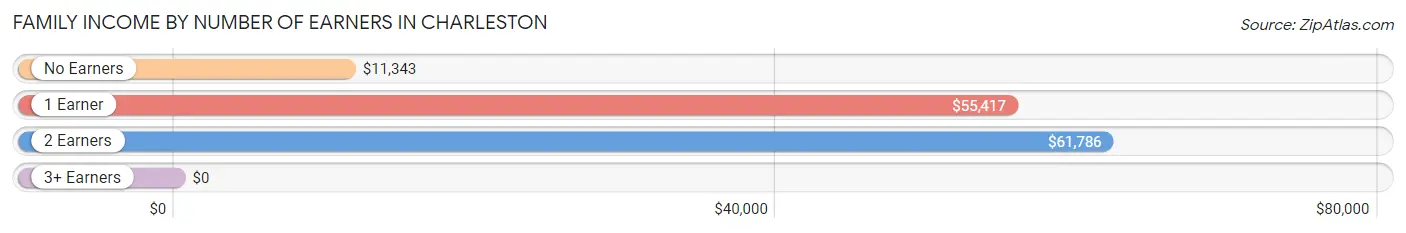
Family Income by Number of Earners in Charleston
| Number of Earners | # Families | Median Income |
| No Earners | 117 (23.1%) | $11,343 |
| 1 Earner | 237 (46.8%) | $55,417 |
| 2 Earners | 146 (28.8%) | $61,786 |
| 3+ Earners | 7 (1.4%) | $0 |
| Total | 507 (100.0%) | $38,984 |
Household Income in Charleston
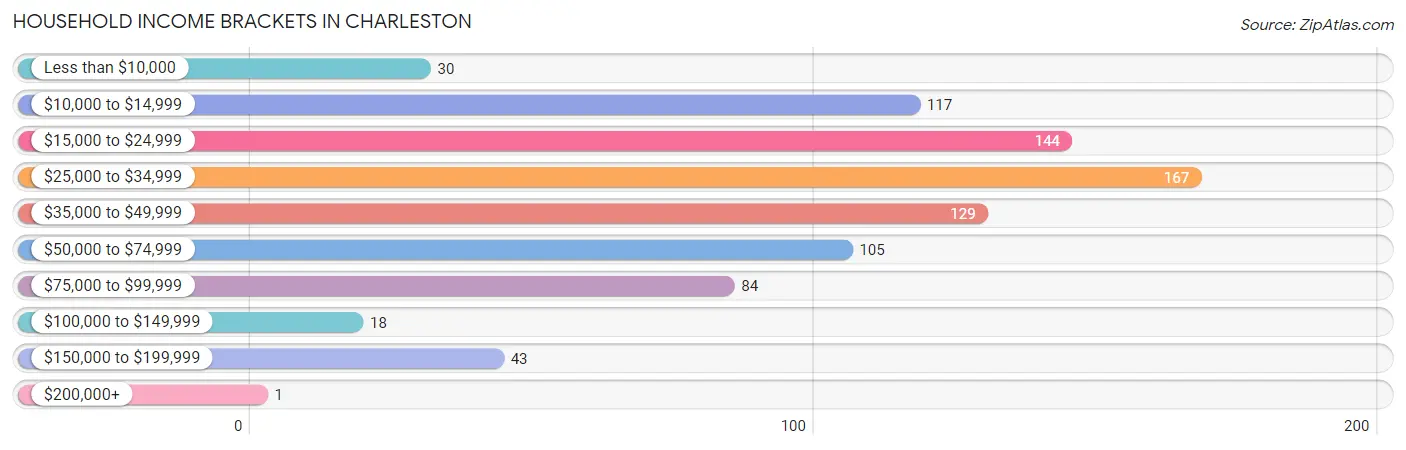
Household Income Brackets in Charleston
With 167 households falling in the category, the $25,000 to $34,999 income range is the most frequent in Charleston, accounting for 19.9% of all households. In contrast, only 1 households (0.1%) fall into the $200,000+ income bracket, making it the least populous group.
| Income Bracket | # Households | % Households |
| Less than $10,000 | 30 | 3.6% |
| $10,000 to $14,999 | 117 | 14.0% |
| $15,000 to $24,999 | 144 | 17.2% |
| $25,000 to $34,999 | 167 | 19.9% |
| $35,000 to $49,999 | 129 | 15.4% |
| $50,000 to $74,999 | 105 | 12.5% |
| $75,000 to $99,999 | 84 | 10.0% |
| $100,000 to $149,999 | 18 | 2.1% |
| $150,000 to $199,999 | 43 | 5.1% |
| $200,000+ | 1 | 0.1% |
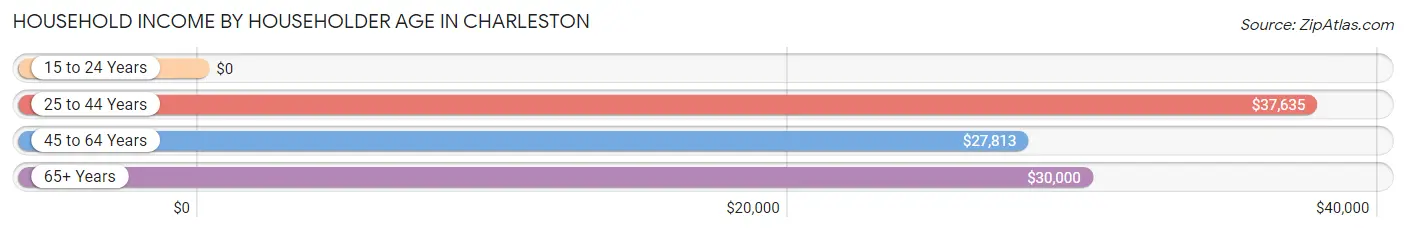
Household Income by Householder Age in Charleston
The median household income in Charleston is $34,137, with the highest median household income of $37,635 found in the 25 to 44 years age bracket for the primary householder. A total of 376 households (44.9%) fall into this category.
| Income Bracket | # Households | Median Income |
| 15 to 24 Years | 0 (0.0%) | $0 |
| 25 to 44 Years | 376 (44.9%) | $37,635 |
| 45 to 64 Years | 220 (26.3%) | $27,813 |
| 65+ Years | 242 (28.9%) | $30,000 |
| Total | 838 (100.0%) | $34,137 |
Poverty in Charleston
Income Below Poverty by Sex and Age in Charleston
With 40.7% poverty level for males and 28.6% for females among the residents of Charleston, 5 year old males and 5 year old females are the most vulnerable to poverty, with 4 males (100.0%) and 24 females (100.0%) in their respective age groups living below the poverty level.
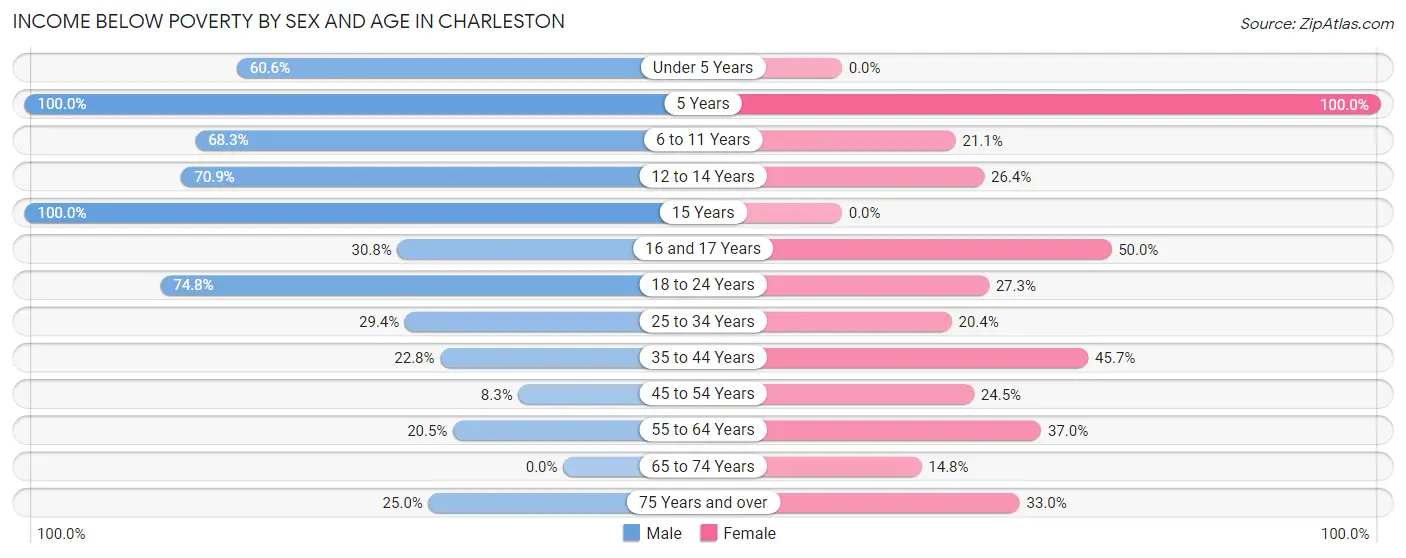
| Age Bracket | Male | Female |
| Under 5 Years | 80 (60.6%) | 0 (0.0%) |
| 5 Years | 4 (100.0%) | 24 (100.0%) |
| 6 to 11 Years | 138 (68.3%) | 19 (21.1%) |
| 12 to 14 Years | 56 (70.9%) | 14 (26.4%) |
| 15 Years | 6 (100.0%) | 0 (0.0%) |
| 16 and 17 Years | 8 (30.8%) | 17 (50.0%) |
| 18 to 24 Years | 89 (74.8%) | 24 (27.3%) |
| 25 to 34 Years | 111 (29.4%) | 22 (20.4%) |
| 35 to 44 Years | 29 (22.8%) | 75 (45.7%) |
| 45 to 54 Years | 5 (8.3%) | 38 (24.5%) |
| 55 to 64 Years | 27 (20.4%) | 44 (37.0%) |
| 65 to 74 Years | 0 (0.0%) | 13 (14.8%) |
| 75 Years and over | 3 (25.0%) | 33 (33.0%) |
| Total | 556 (40.7%) | 323 (28.6%) |
Income Above Poverty by Sex and Age in Charleston
According to the poverty statistics in Charleston, males aged 65 to 74 years and females aged under 5 years are the age groups that are most secure financially, with 100.0% of males and 100.0% of females in these age groups living above the poverty line.
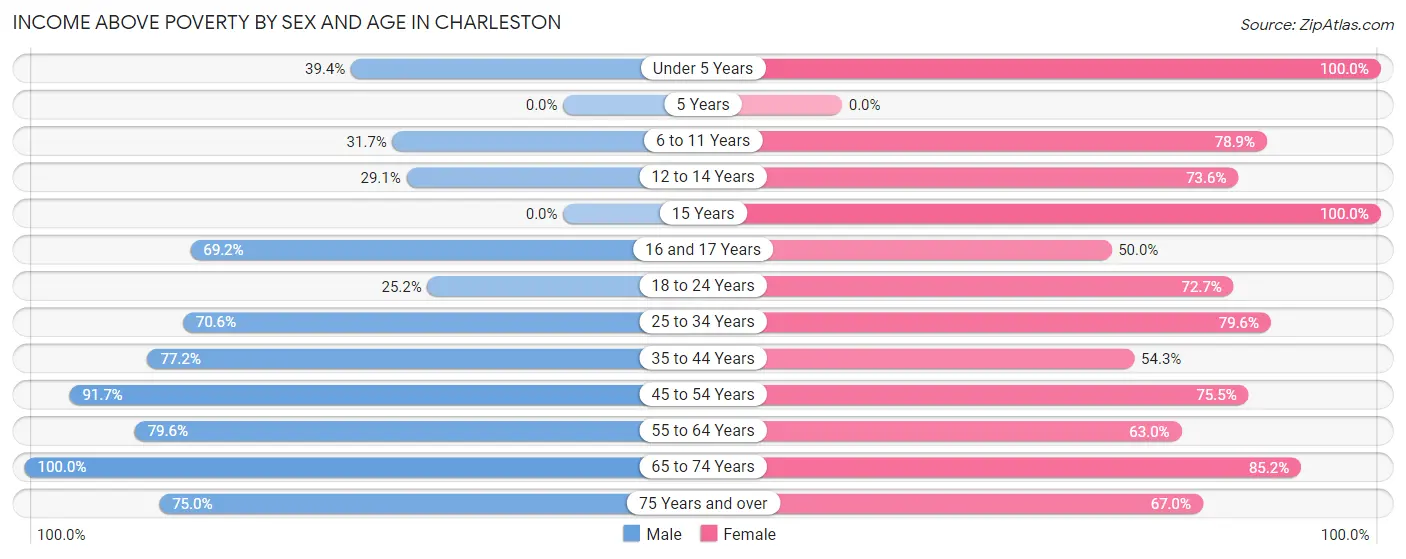
| Age Bracket | Male | Female |
| Under 5 Years | 52 (39.4%) | 87 (100.0%) |
| 5 Years | 0 (0.0%) | 0 (0.0%) |
| 6 to 11 Years | 64 (31.7%) | 71 (78.9%) |
| 12 to 14 Years | 23 (29.1%) | 39 (73.6%) |
| 15 Years | 0 (0.0%) | 21 (100.0%) |
| 16 and 17 Years | 18 (69.2%) | 17 (50.0%) |
| 18 to 24 Years | 30 (25.2%) | 64 (72.7%) |
| 25 to 34 Years | 267 (70.6%) | 86 (79.6%) |
| 35 to 44 Years | 98 (77.2%) | 89 (54.3%) |
| 45 to 54 Years | 55 (91.7%) | 117 (75.5%) |
| 55 to 64 Years | 105 (79.5%) | 75 (63.0%) |
| 65 to 74 Years | 90 (100.0%) | 75 (85.2%) |
| 75 Years and over | 9 (75.0%) | 67 (67.0%) |
| Total | 811 (59.3%) | 808 (71.4%) |
Income Below Poverty Among Married-Couple Families in Charleston
The poverty statistics for married-couple families in Charleston show that 14.6% or 25 of the total 171 families live below the poverty line. Families with 1 or 2 children have the highest poverty rate of 25.0%, comprising of 22 families. On the other hand, families with 3 or 4 children have the lowest poverty rate of 0.0%, which includes 0 families.
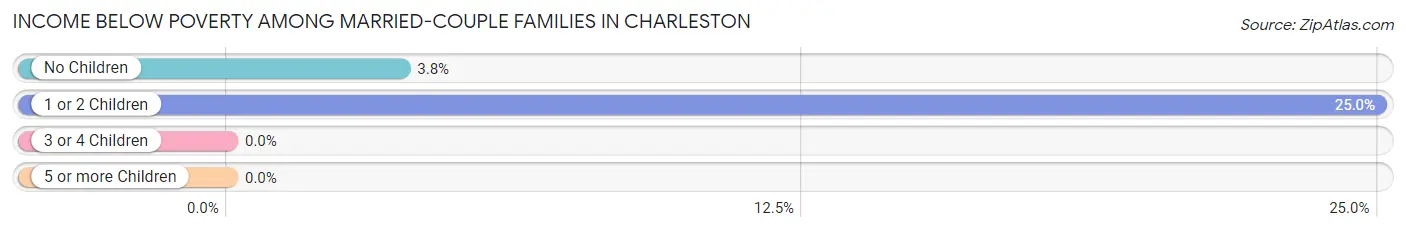
| Children | Above Poverty | Below Poverty |
| No Children | 77 (96.3%) | 3 (3.7%) |
| 1 or 2 Children | 66 (75.0%) | 22 (25.0%) |
| 3 or 4 Children | 3 (100.0%) | 0 (0.0%) |
| 5 or more Children | 0 (0.0%) | 0 (0.0%) |
| Total | 146 (85.4%) | 25 (14.6%) |
Income Below Poverty Among Single-Parent Households in Charleston
According to the poverty data in Charleston, 55.9% or 38 single-father households and 49.6% or 133 single-mother households are living below the poverty line. Among single-father households, those with 1 or 2 children have the highest poverty rate, with 29 households (64.4%) experiencing poverty. Likewise, among single-mother households, those with 5 or more children have the highest poverty rate, with 4 households (100.0%) falling below the poverty line.
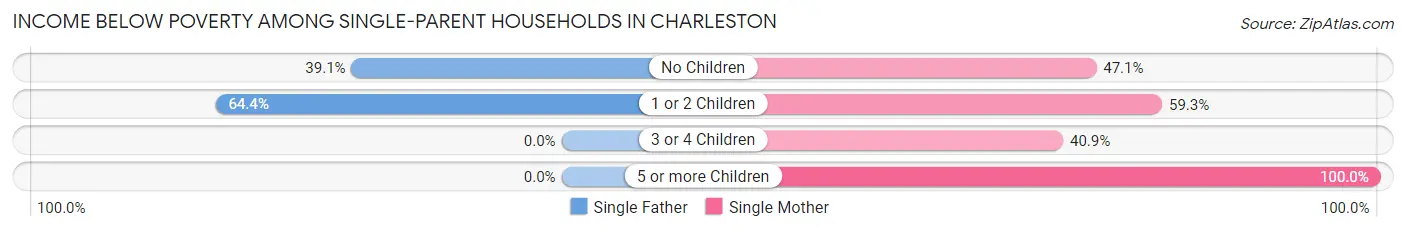
| Children | Single Father | Single Mother |
| No Children | 9 (39.1%) | 40 (47.1%) |
| 1 or 2 Children | 29 (64.4%) | 51 (59.3%) |
| 3 or 4 Children | 0 (0.0%) | 38 (40.9%) |
| 5 or more Children | 0 (0.0%) | 4 (100.0%) |
| Total | 38 (55.9%) | 133 (49.6%) |
Income Below Poverty Among Married-Couple vs Single-Parent Households in Charleston
The poverty data for Charleston shows that 25 of the married-couple family households (14.6%) and 171 of the single-parent households (50.9%) are living below the poverty level. Within the married-couple family households, those with 1 or 2 children have the highest poverty rate, with 22 households (25.0%) falling below the poverty line. Among the single-parent households, those with 5 or more children have the highest poverty rate, with 4 household (100.0%) living below poverty.
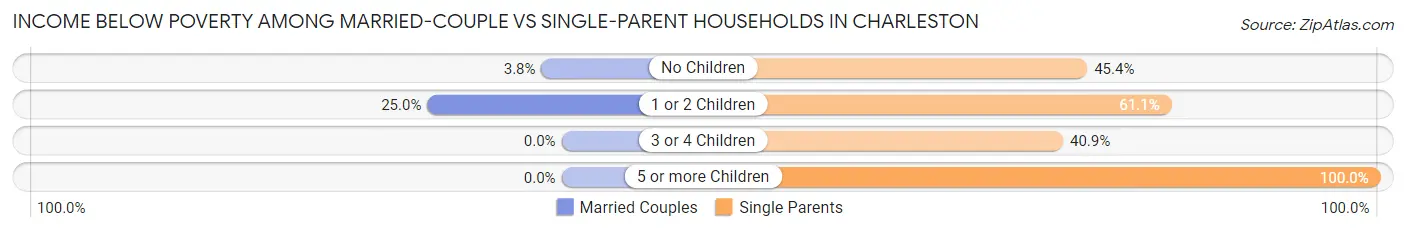
| Children | Married-Couple Families | Single-Parent Households |
| No Children | 3 (3.7%) | 49 (45.4%) |
| 1 or 2 Children | 22 (25.0%) | 80 (61.1%) |
| 3 or 4 Children | 0 (0.0%) | 38 (40.9%) |
| 5 or more Children | 0 (0.0%) | 4 (100.0%) |
| Total | 25 (14.6%) | 171 (50.9%) |
Race in Charleston
The most populous races in Charleston are Black / African American (1,944 | 74.1%), White / Caucasian (603 | 23.0%), and Two or more Races (76 | 2.9%).
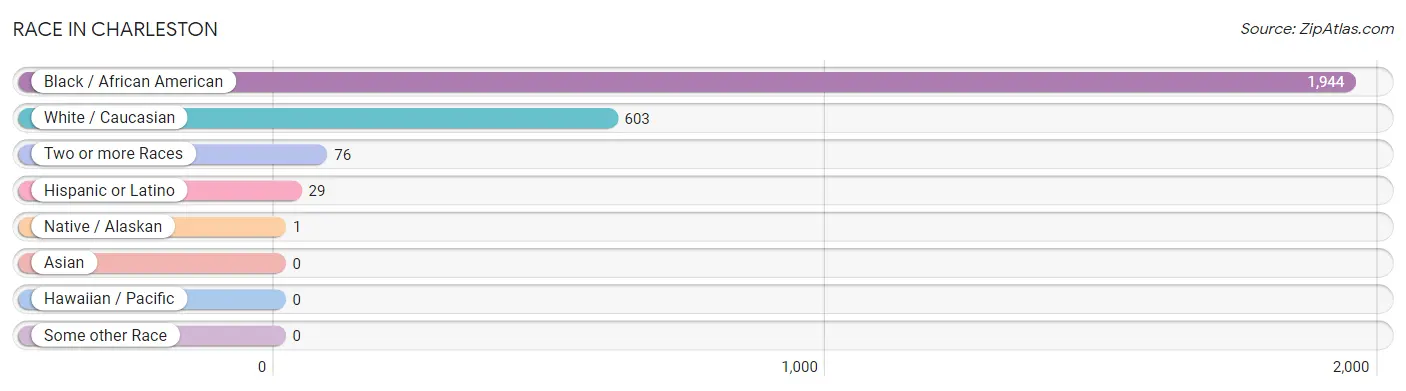
| Race | # Population | % Population |
| Asian | 0 | 0.0% |
| Black / African American | 1,944 | 74.1% |
| Hawaiian / Pacific | 0 | 0.0% |
| Hispanic or Latino | 29 | 1.1% |
| Native / Alaskan | 1 | 0.0% |
| White / Caucasian | 603 | 23.0% |
| Two or more Races | 76 | 2.9% |
| Some other Race | 0 | 0.0% |
| Total | 2,624 | 100.0% |
Ancestry in Charleston
The most populous ancestries reported in Charleston are English (152 | 5.8%), German (81 | 3.1%), American (80 | 3.0%), Irish (47 | 1.8%), and African (27 | 1.0%), together accounting for 14.7% of all Charleston residents.
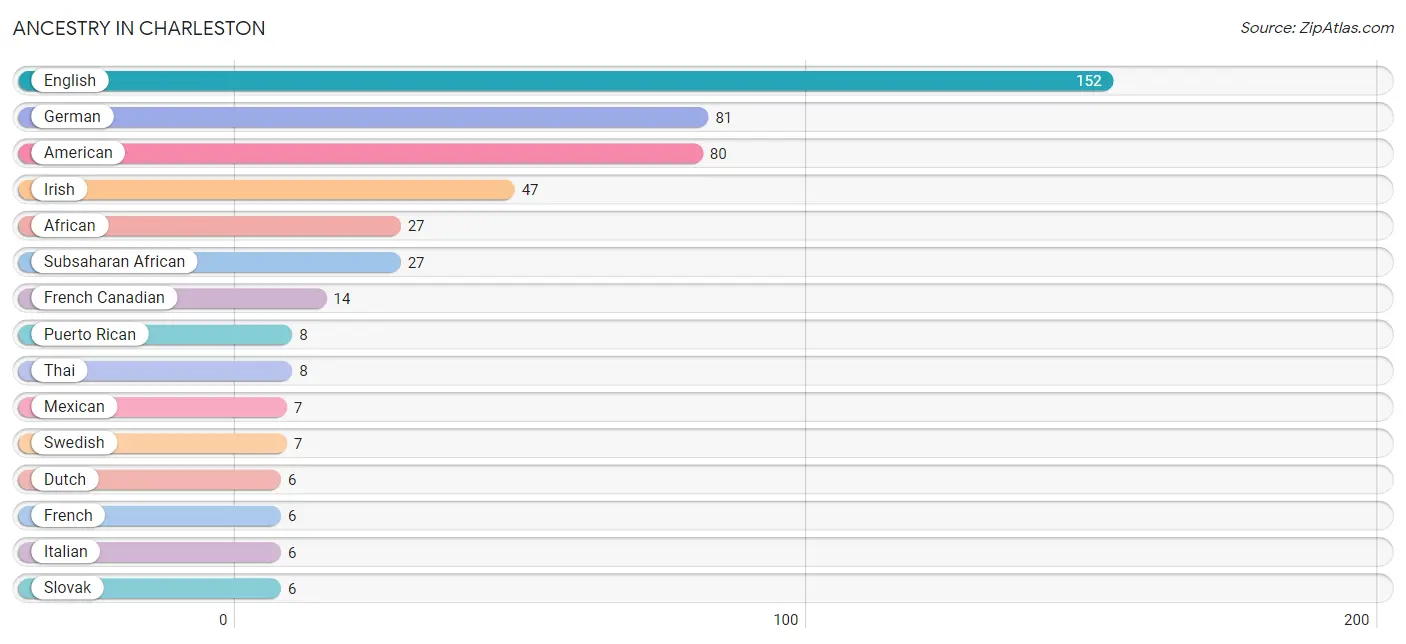
| Ancestry | # Population | % Population |
| African | 27 | 1.0% |
| American | 80 | 3.0% |
| Creek | 1 | 0.0% |
| Cuban | 4 | 0.2% |
| Dutch | 6 | 0.2% |
| English | 152 | 5.8% |
| French | 6 | 0.2% |
| French Canadian | 14 | 0.5% |
| German | 81 | 3.1% |
| Irish | 47 | 1.8% |
| Italian | 6 | 0.2% |
| Mexican | 7 | 0.3% |
| Puerto Rican | 8 | 0.3% |
| Slovak | 6 | 0.2% |
| Subsaharan African | 27 | 1.0% |
| Swedish | 7 | 0.3% |
| Thai | 8 | 0.3% |
| Welsh | 3 | 0.1% | View All 18 Rows |
Immigrants in Charleston
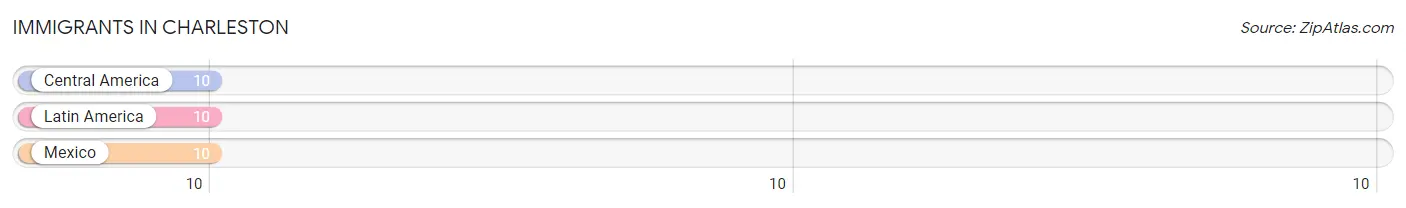
The most numerous immigrant groups reported in Charleston came from Central America (10 | 0.4%), Latin America (10 | 0.4%), and Mexico (10 | 0.4%), together accounting for 1.1% of all Charleston residents.
| Immigration Origin | # Population | % Population |
| Central America | 10 | 0.4% |
| Latin America | 10 | 0.4% |
| Mexico | 10 | 0.4% | View All 3 Rows |
Sex and Age in Charleston
Sex and Age in Charleston
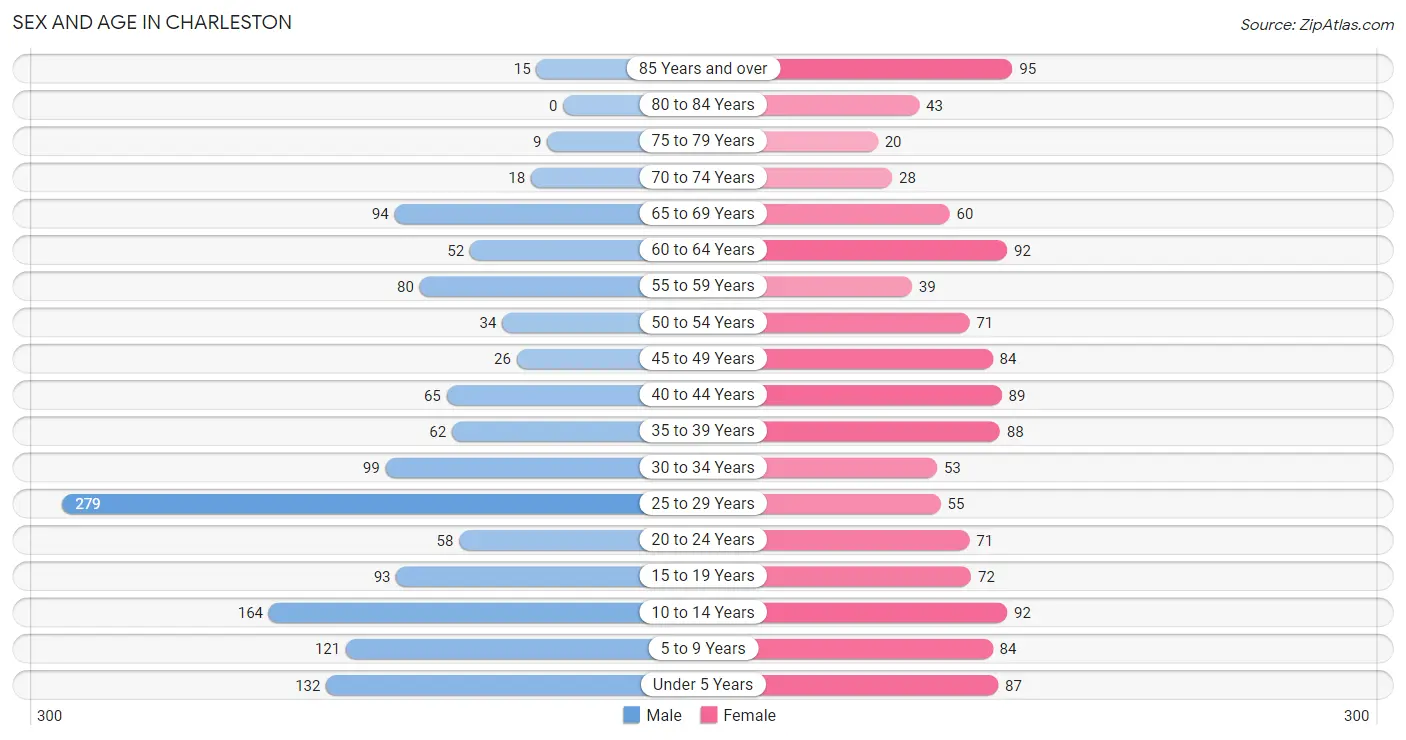
The most populous age groups in Charleston are 25 to 29 Years (279 | 19.9%) for men and 85 Years and over (95 | 7.8%) for women.
| Age Bracket | Male | Female |
| Under 5 Years | 132 (9.4%) | 87 (7.1%) |
| 5 to 9 Years | 121 (8.6%) | 84 (6.9%) |
| 10 to 14 Years | 164 (11.7%) | 92 (7.5%) |
| 15 to 19 Years | 93 (6.6%) | 72 (5.9%) |
| 20 to 24 Years | 58 (4.1%) | 71 (5.8%) |
| 25 to 29 Years | 279 (19.9%) | 55 (4.5%) |
| 30 to 34 Years | 99 (7.1%) | 53 (4.3%) |
| 35 to 39 Years | 62 (4.4%) | 88 (7.2%) |
| 40 to 44 Years | 65 (4.6%) | 89 (7.3%) |
| 45 to 49 Years | 26 (1.9%) | 84 (6.9%) |
| 50 to 54 Years | 34 (2.4%) | 71 (5.8%) |
| 55 to 59 Years | 80 (5.7%) | 39 (3.2%) |
| 60 to 64 Years | 52 (3.7%) | 92 (7.5%) |
| 65 to 69 Years | 94 (6.7%) | 60 (4.9%) |
| 70 to 74 Years | 18 (1.3%) | 28 (2.3%) |
| 75 to 79 Years | 9 (0.6%) | 20 (1.6%) |
| 80 to 84 Years | 0 (0.0%) | 43 (3.5%) |
| 85 Years and over | 15 (1.1%) | 95 (7.8%) |
| Total | 1,401 (100.0%) | 1,223 (100.0%) |
Families and Households in Charleston
Median Family Size in Charleston
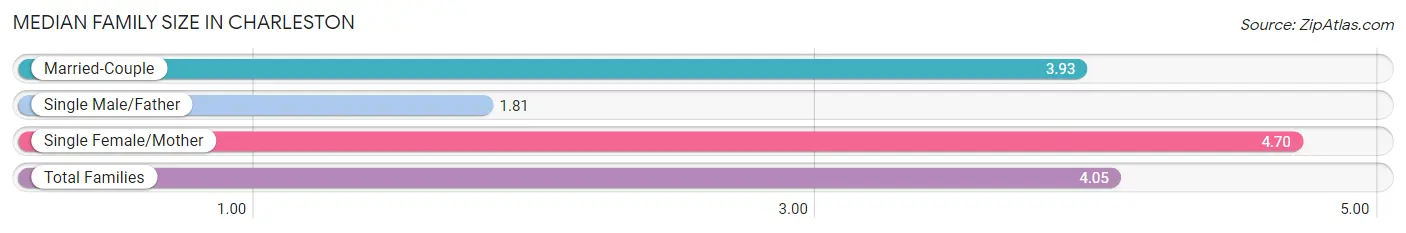
The median family size in Charleston is 4.05 persons per family, with single female/mother families (268 | 52.9%) accounting for the largest median family size of 4.7 persons per family. On the other hand, single male/father families (68 | 13.4%) represent the smallest median family size with 1.81 persons per family.
| Family Type | # Families | Family Size |
| Married-Couple | 171 (33.7%) | 3.93 |
| Single Male/Father | 68 (13.4%) | 1.81 |
| Single Female/Mother | 268 (52.9%) | 4.70 |
| Total Families | 507 (100.0%) | 4.05 |
Median Household Size in Charleston
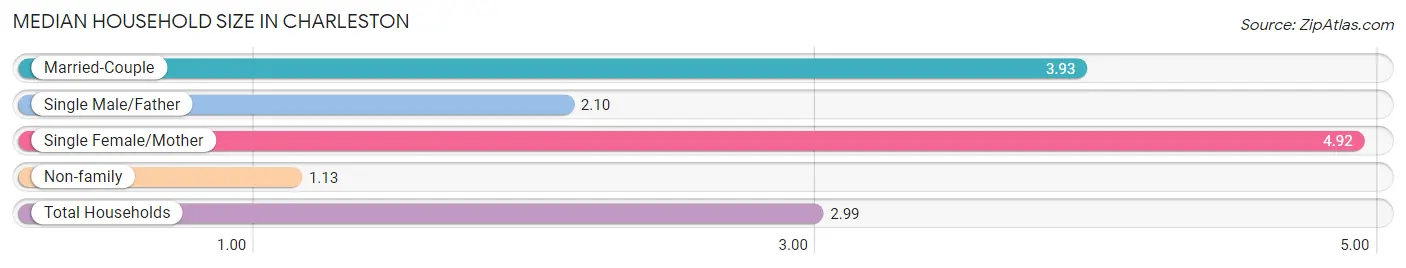
The median household size in Charleston is 2.99 persons per household, with single female/mother households (268 | 32.0%) accounting for the largest median household size of 4.92 persons per household. non-family households (331 | 39.5%) represent the smallest median household size with 1.13 persons per household.
| Household Type | # Households | Household Size |
| Married-Couple | 171 (20.4%) | 3.93 |
| Single Male/Father | 68 (8.1%) | 2.10 |
| Single Female/Mother | 268 (32.0%) | 4.92 |
| Non-family | 331 (39.5%) | 1.13 |
| Total Households | 838 (100.0%) | 2.99 |
Household Size by Marriage Status in Charleston
Out of a total of 838 households in Charleston, 507 (60.5%) are family households, while 331 (39.5%) are nonfamily households. The most numerous type of family households are 2-person households, comprising 151, and the most common type of nonfamily households are 1-person households, comprising 298.
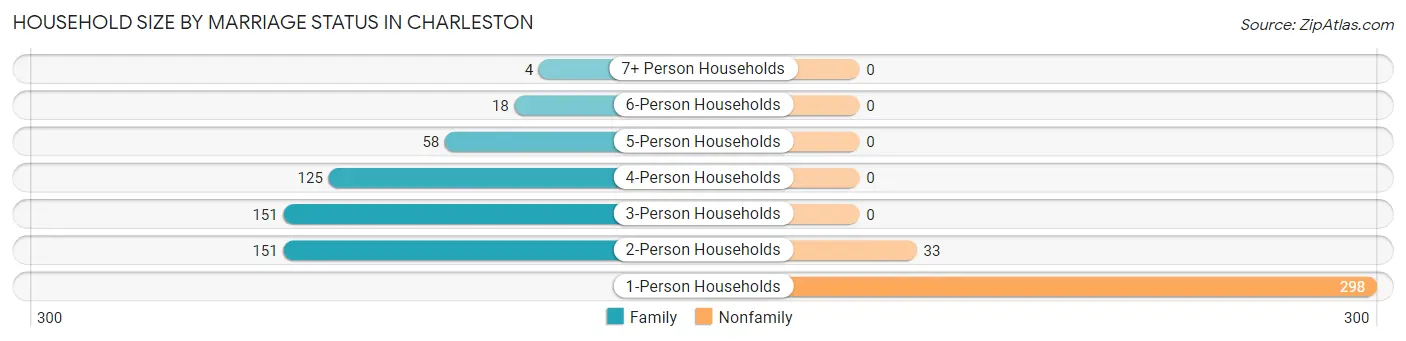
| Household Size | Family Households | Nonfamily Households |
| 1-Person Households | - | 298 (35.6%) |
| 2-Person Households | 151 (18.0%) | 33 (3.9%) |
| 3-Person Households | 151 (18.0%) | 0 (0.0%) |
| 4-Person Households | 125 (14.9%) | 0 (0.0%) |
| 5-Person Households | 58 (6.9%) | 0 (0.0%) |
| 6-Person Households | 18 (2.1%) | 0 (0.0%) |
| 7+ Person Households | 4 (0.5%) | 0 (0.0%) |
| Total | 507 (60.5%) | 331 (39.5%) |
Female Fertility in Charleston
Fertility by Age in Charleston
Average fertility rate in Charleston is 10.0 births per 1,000 women. Women in the age bracket of 20 to 34 years have the highest fertility rate with 28.0 births per 1,000 women. Women in the age bracket of 20 to 34 years acount for 100.0% of all women with births.
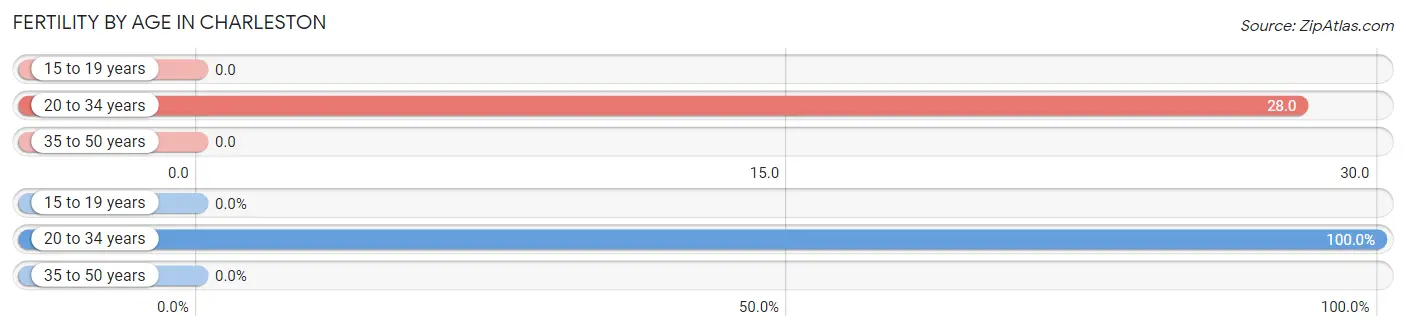
| Age Bracket | Women with Births | Births / 1,000 Women |
| 15 to 19 years | 0 (0.0%) | 0.0 |
| 20 to 34 years | 5 (100.0%) | 28.0 |
| 35 to 50 years | 0 (0.0%) | 0.0 |
| Total | 5 (100.0%) | 10.0 |
Fertility by Age by Marriage Status in Charleston
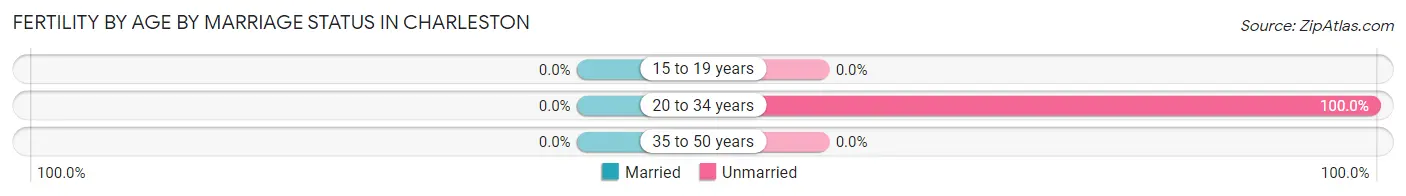
| Age Bracket | Married | Unmarried |
| 15 to 19 years | 0 (0.0%) | 0 (0.0%) |
| 20 to 34 years | 0 (0.0%) | 5 (100.0%) |
| 35 to 50 years | 0 (0.0%) | 0 (0.0%) |
| Total | 0 (0.0%) | 5 (100.0%) |
Fertility by Education in Charleston
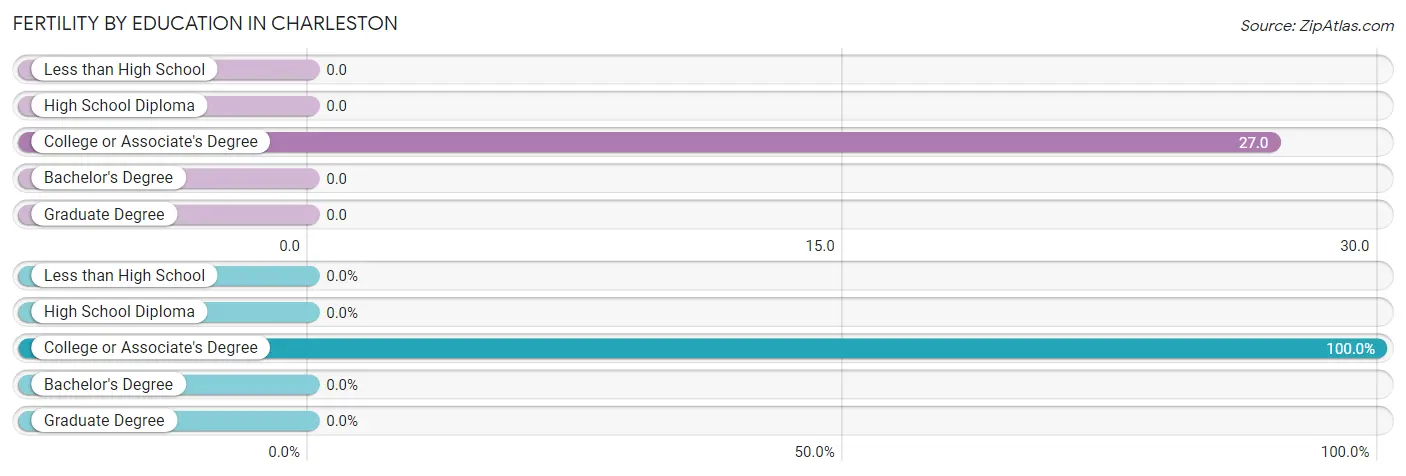
| Educational Attainment | Women with Births | Births / 1,000 Women |
| Less than High School | 0 (0.0%) | 0.0 |
| High School Diploma | 0 (0.0%) | 0.0 |
| College or Associate's Degree | 5 (100.0%) | 27.0 |
| Bachelor's Degree | 0 (0.0%) | 0.0 |
| Graduate Degree | 0 (0.0%) | 0.0 |
| Total | 5 (100.0%) | 10.0 |
Fertility by Education by Marriage Status in Charleston
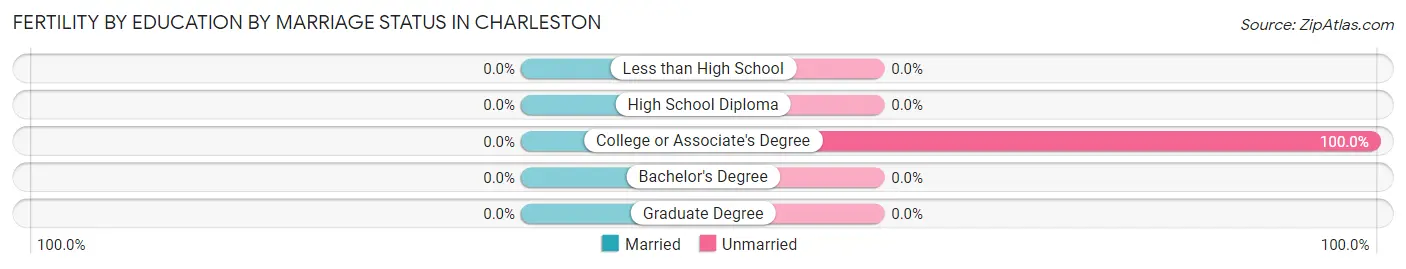
| Educational Attainment | Married | Unmarried |
| Less than High School | 0 (0.0%) | 0 (0.0%) |
| High School Diploma | 0 (0.0%) | 0 (0.0%) |
| College or Associate's Degree | 0 (0.0%) | 5 (100.0%) |
| Bachelor's Degree | 0 (0.0%) | 0 (0.0%) |
| Graduate Degree | 0 (0.0%) | 0 (0.0%) |
| Total | 0 (0.0%) | 5 (100.0%) |
Employment Characteristics in Charleston
Employment by Class of Employer in Charleston
Among the 875 employed individuals in Charleston, private company employees (386 | 44.1%), state government employees (190 | 21.7%), and self-employed (not incorporated) (184 | 21.0%) make up the most common classes of employment.
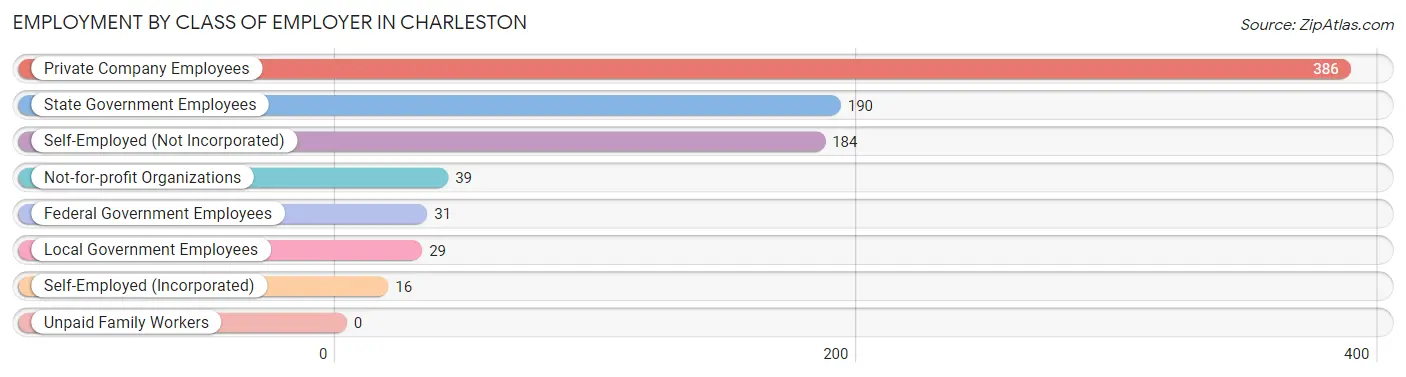
| Employer Class | # Employees | % Employees |
| Private Company Employees | 386 | 44.1% |
| Self-Employed (Incorporated) | 16 | 1.8% |
| Self-Employed (Not Incorporated) | 184 | 21.0% |
| Not-for-profit Organizations | 39 | 4.5% |
| Local Government Employees | 29 | 3.3% |
| State Government Employees | 190 | 21.7% |
| Federal Government Employees | 31 | 3.5% |
| Unpaid Family Workers | 0 | 0.0% |
| Total | 875 | 100.0% |
Employment Status by Age in Charleston
According to the labor force statistics for Charleston, out of the total population over 16 years of age (1,917), 54.2% or 1,039 individuals are in the labor force, with 14.8% or 154 of them unemployed. The age group with the highest labor force participation rate is 30 to 34 years, with 94.1% or 143 individuals in the labor force. Within the labor force, the 75 years and over age range has the highest percentage of unemployed individuals, with 66.7% or 8 of them being unemployed.
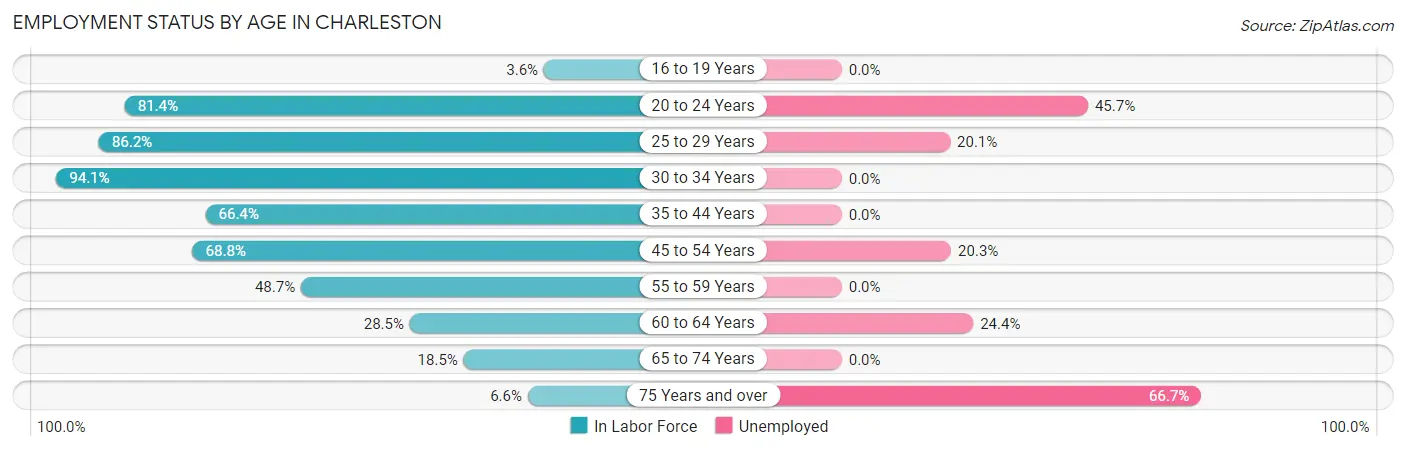
| Age Bracket | In Labor Force | Unemployed |
| 16 to 19 Years | 5 (3.6%) | 0 (0.0%) |
| 20 to 24 Years | 105 (81.4%) | 48 (45.7%) |
| 25 to 29 Years | 288 (86.2%) | 58 (20.1%) |
| 30 to 34 Years | 143 (94.1%) | 0 (0.0%) |
| 35 to 44 Years | 202 (66.4%) | 0 (0.0%) |
| 45 to 54 Years | 148 (68.8%) | 30 (20.3%) |
| 55 to 59 Years | 58 (48.7%) | 0 (0.0%) |
| 60 to 64 Years | 41 (28.5%) | 10 (24.4%) |
| 65 to 74 Years | 37 (18.5%) | 0 (0.0%) |
| 75 Years and over | 12 (6.6%) | 8 (66.7%) |
| Total | 1,039 (54.2%) | 154 (14.8%) |
Employment Status by Educational Attainment in Charleston
According to labor force statistics for Charleston, 69.4% of individuals (880) out of the total population between 25 and 64 years of age (1,268) are in the labor force, with 11.1% or 98 of them being unemployed. The group with the highest labor force participation rate are those with the educational attainment of bachelor's degree or higher, with 100.0% or 247 individuals in the labor force. Within the labor force, individuals with college / associate degree education have the highest percentage of unemployment, with 22.1% or 58 of them being unemployed.
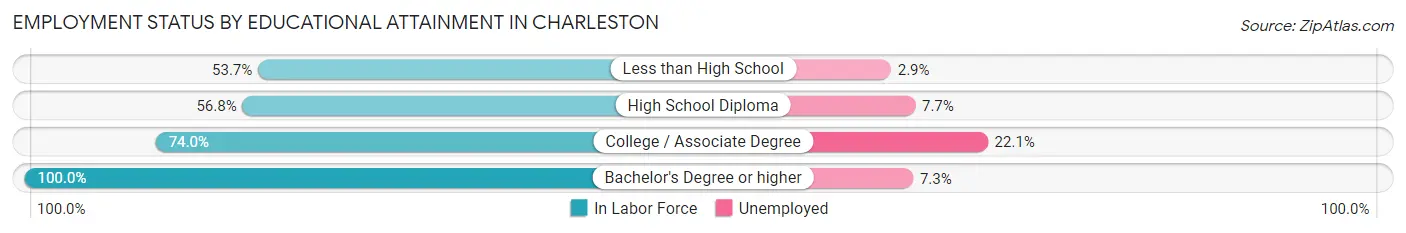
| Educational Attainment | In Labor Force | Unemployed |
| Less than High School | 137 (53.7%) | 7 (2.9%) |
| High School Diploma | 234 (56.8%) | 32 (7.7%) |
| College / Associate Degree | 262 (74.0%) | 78 (22.1%) |
| Bachelor's Degree or higher | 247 (100.0%) | 18 (7.3%) |
| Total | 880 (69.4%) | 141 (11.1%) |
Employment Occupations by Sex in Charleston
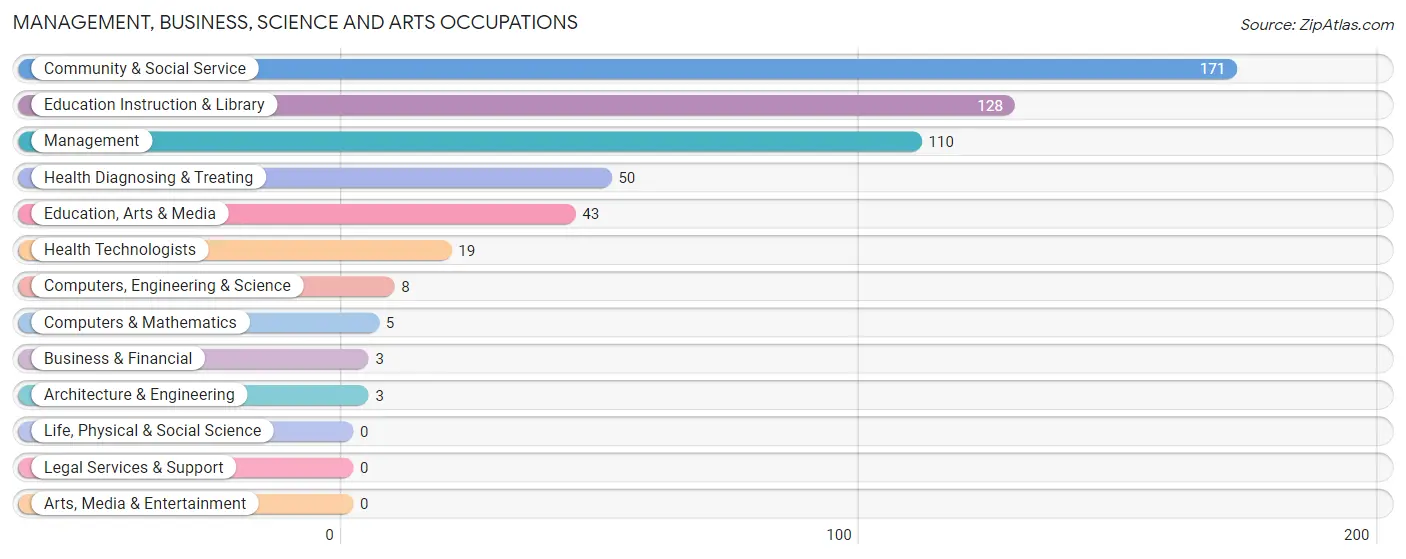
Management, Business, Science and Arts Occupations
The most common Management, Business, Science and Arts occupations in Charleston are Community & Social Service (171 | 19.3%), Education Instruction & Library (128 | 14.5%), Management (110 | 12.4%), Health Diagnosing & Treating (50 | 5.7%), and Education, Arts & Media (43 | 4.9%).
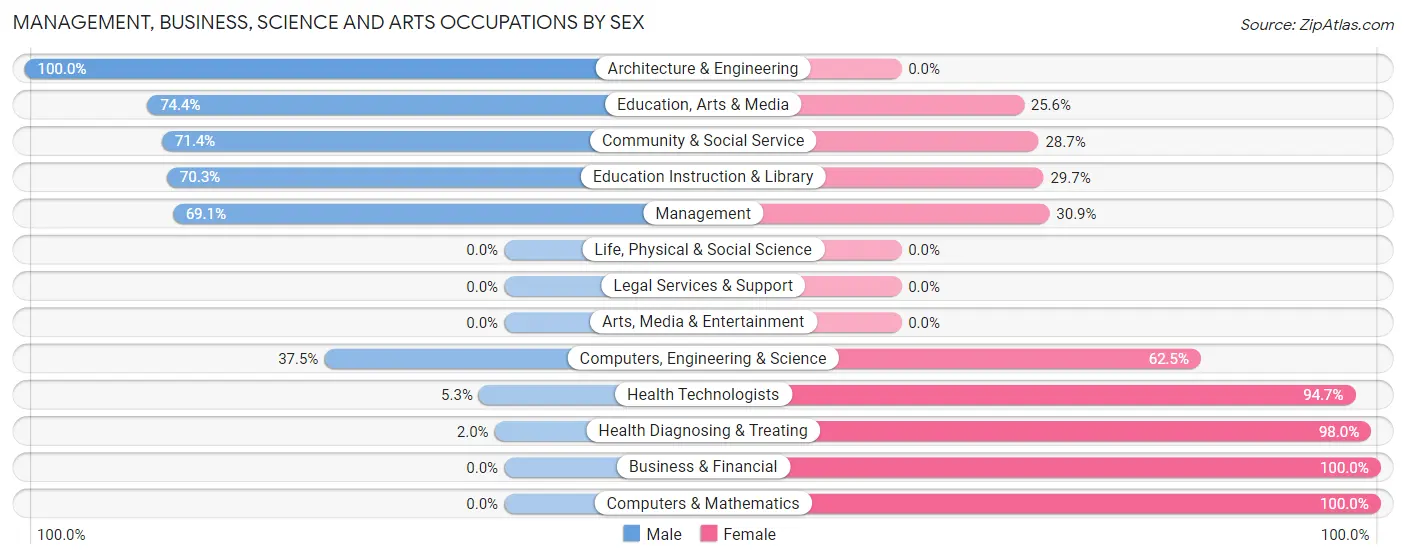
Management, Business, Science and Arts Occupations by Sex
Within the Management, Business, Science and Arts occupations in Charleston, the most male-oriented occupations are Architecture & Engineering (100.0%), Education, Arts & Media (74.4%), and Community & Social Service (71.4%), while the most female-oriented occupations are Business & Financial (100.0%), Computers & Mathematics (100.0%), and Health Diagnosing & Treating (98.0%).
| Occupation | Male | Female |
| Management | 76 (69.1%) | 34 (30.9%) |
| Business & Financial | 0 (0.0%) | 3 (100.0%) |
| Computers, Engineering & Science | 3 (37.5%) | 5 (62.5%) |
| Computers & Mathematics | 0 (0.0%) | 5 (100.0%) |
| Architecture & Engineering | 3 (100.0%) | 0 (0.0%) |
| Life, Physical & Social Science | 0 (0.0%) | 0 (0.0%) |
| Community & Social Service | 122 (71.4%) | 49 (28.6%) |
| Education, Arts & Media | 32 (74.4%) | 11 (25.6%) |
| Legal Services & Support | 0 (0.0%) | 0 (0.0%) |
| Education Instruction & Library | 90 (70.3%) | 38 (29.7%) |
| Arts, Media & Entertainment | 0 (0.0%) | 0 (0.0%) |
| Health Diagnosing & Treating | 1 (2.0%) | 49 (98.0%) |
| Health Technologists | 1 (5.3%) | 18 (94.7%) |
| Total (Category) | 202 (59.1%) | 140 (40.9%) |
| Total (Overall) | 502 (56.7%) | 383 (43.3%) |
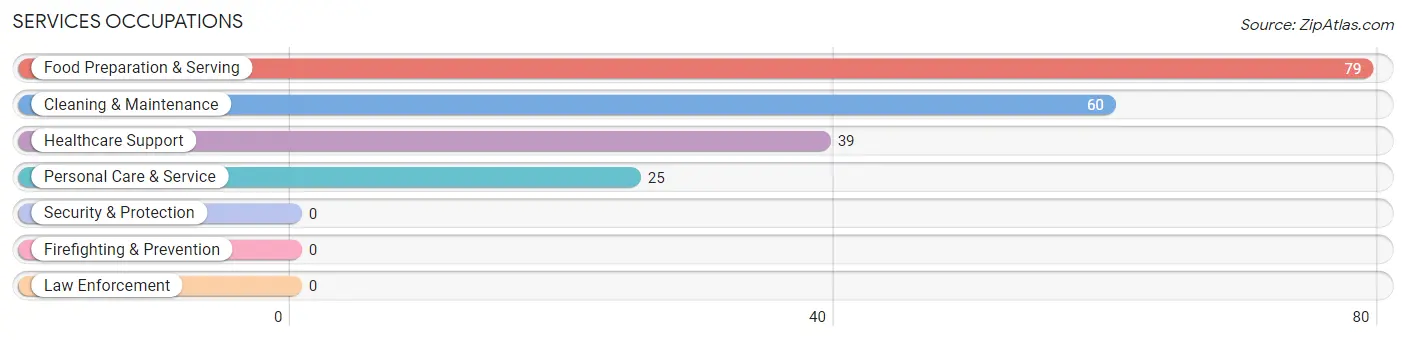
Services Occupations
The most common Services occupations in Charleston are Food Preparation & Serving (79 | 8.9%), Cleaning & Maintenance (60 | 6.8%), Healthcare Support (39 | 4.4%), and Personal Care & Service (25 | 2.8%).
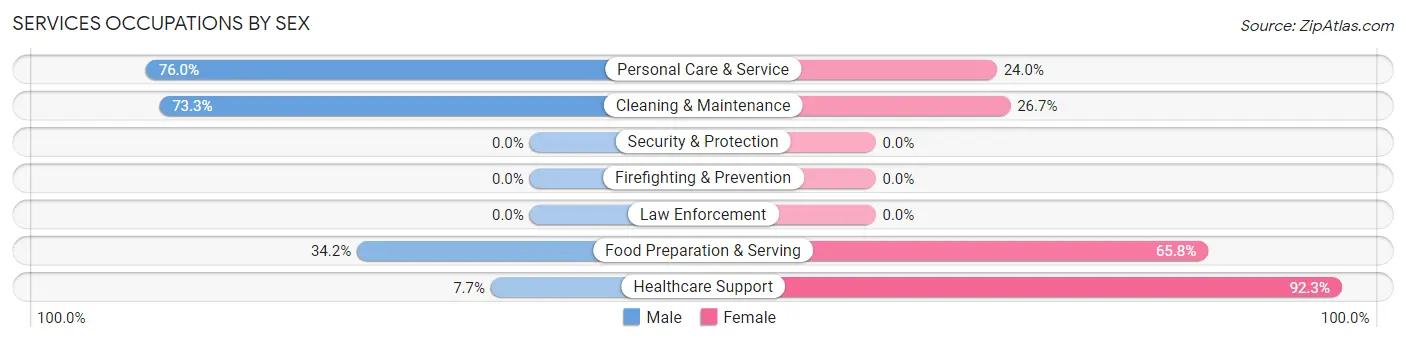
Services Occupations by Sex
Within the Services occupations in Charleston, the most male-oriented occupations are Personal Care & Service (76.0%), Cleaning & Maintenance (73.3%), and Food Preparation & Serving (34.2%), while the most female-oriented occupations are Healthcare Support (92.3%), Food Preparation & Serving (65.8%), and Cleaning & Maintenance (26.7%).
| Occupation | Male | Female |
| Healthcare Support | 3 (7.7%) | 36 (92.3%) |
| Security & Protection | 0 (0.0%) | 0 (0.0%) |
| Firefighting & Prevention | 0 (0.0%) | 0 (0.0%) |
| Law Enforcement | 0 (0.0%) | 0 (0.0%) |
| Food Preparation & Serving | 27 (34.2%) | 52 (65.8%) |
| Cleaning & Maintenance | 44 (73.3%) | 16 (26.7%) |
| Personal Care & Service | 19 (76.0%) | 6 (24.0%) |
| Total (Category) | 93 (45.8%) | 110 (54.2%) |
| Total (Overall) | 502 (56.7%) | 383 (43.3%) |
Sales and Office Occupations
The most common Sales and Office occupations in Charleston are Sales & Related (97 | 11.0%), and Office & Administration (35 | 4.0%).
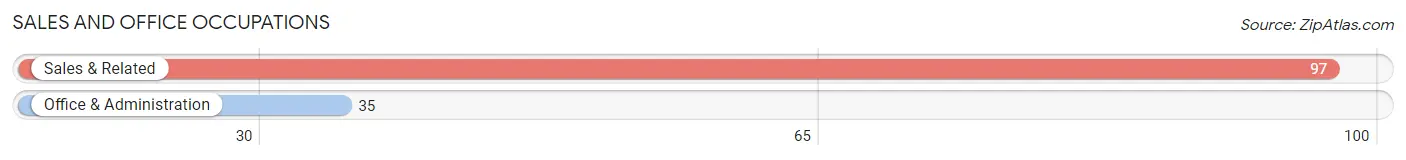
Sales and Office Occupations by Sex
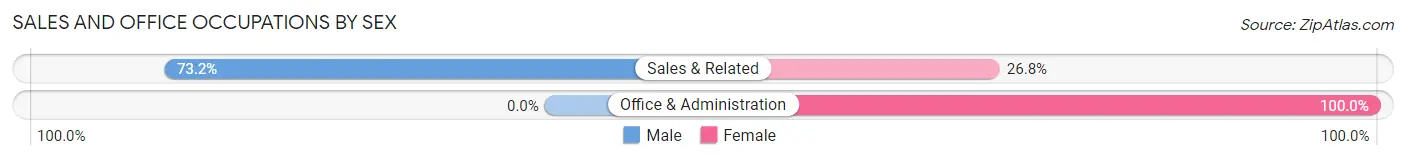
| Occupation | Male | Female |
| Sales & Related | 71 (73.2%) | 26 (26.8%) |
| Office & Administration | 0 (0.0%) | 35 (100.0%) |
| Total (Category) | 71 (53.8%) | 61 (46.2%) |
| Total (Overall) | 502 (56.7%) | 383 (43.3%) |
Natural Resources, Construction and Maintenance Occupations
The most common Natural Resources, Construction and Maintenance occupations in Charleston are Construction & Extraction (29 | 3.3%), and Installation, Maintenance & Repair (3 | 0.3%).
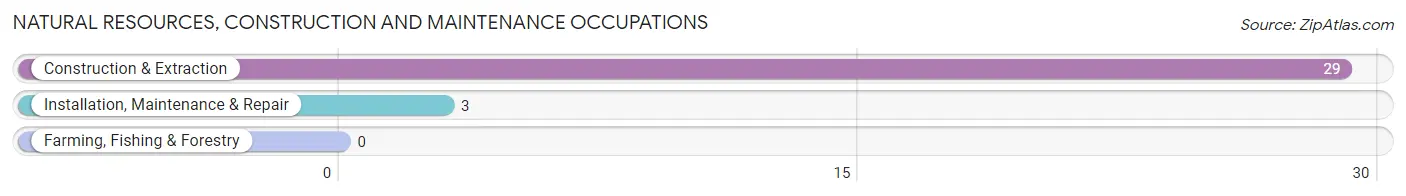
Natural Resources, Construction and Maintenance Occupations by Sex
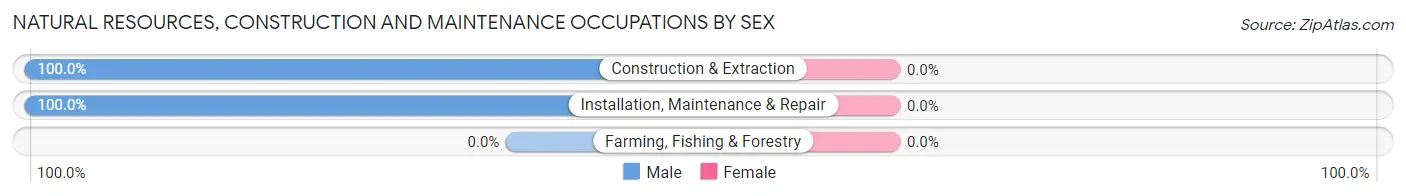
| Occupation | Male | Female |
| Farming, Fishing & Forestry | 0 (0.0%) | 0 (0.0%) |
| Construction & Extraction | 29 (100.0%) | 0 (0.0%) |
| Installation, Maintenance & Repair | 3 (100.0%) | 0 (0.0%) |
| Total (Category) | 32 (100.0%) | 0 (0.0%) |
| Total (Overall) | 502 (56.7%) | 383 (43.3%) |
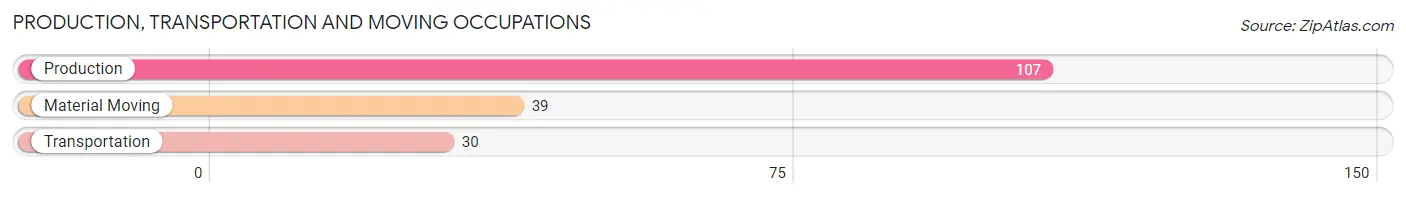
Production, Transportation and Moving Occupations
The most common Production, Transportation and Moving occupations in Charleston are Production (107 | 12.1%), Material Moving (39 | 4.4%), and Transportation (30 | 3.4%).
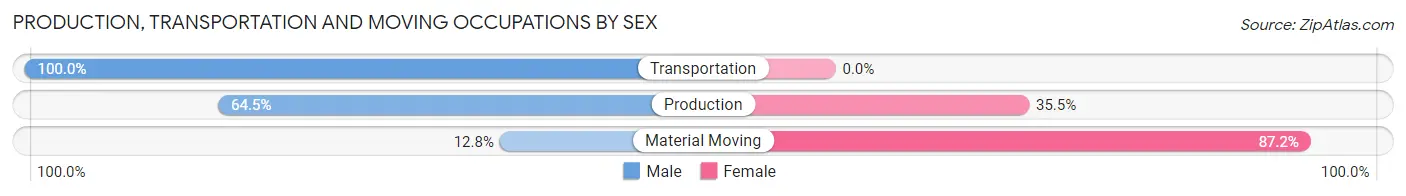
Production, Transportation and Moving Occupations by Sex
| Occupation | Male | Female |
| Production | 69 (64.5%) | 38 (35.5%) |
| Transportation | 30 (100.0%) | 0 (0.0%) |
| Material Moving | 5 (12.8%) | 34 (87.2%) |
| Total (Category) | 104 (59.1%) | 72 (40.9%) |
| Total (Overall) | 502 (56.7%) | 383 (43.3%) |
Employment Industries by Sex in Charleston
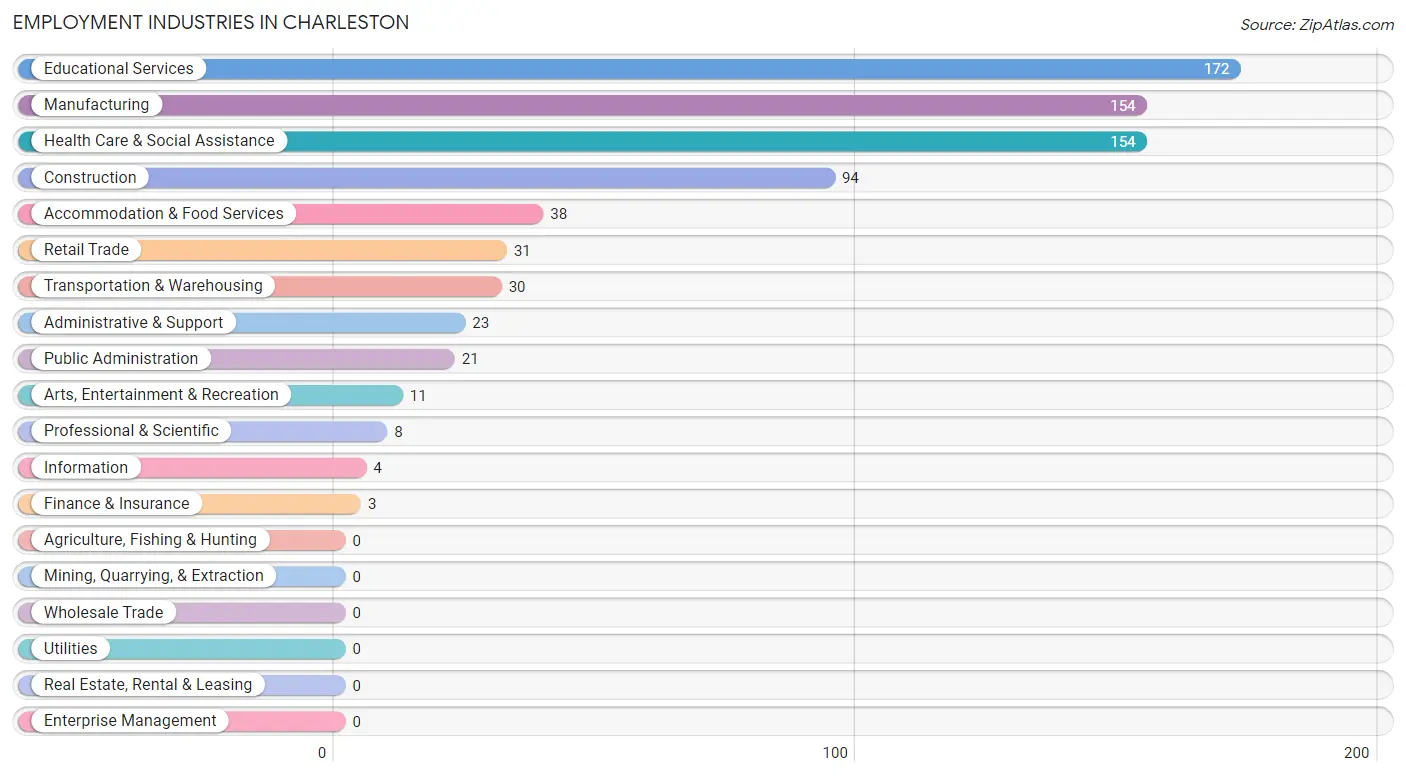
Employment Industries in Charleston
The major employment industries in Charleston include Educational Services (172 | 19.4%), Manufacturing (154 | 17.4%), Health Care & Social Assistance (154 | 17.4%), Construction (94 | 10.6%), and Accommodation & Food Services (38 | 4.3%).
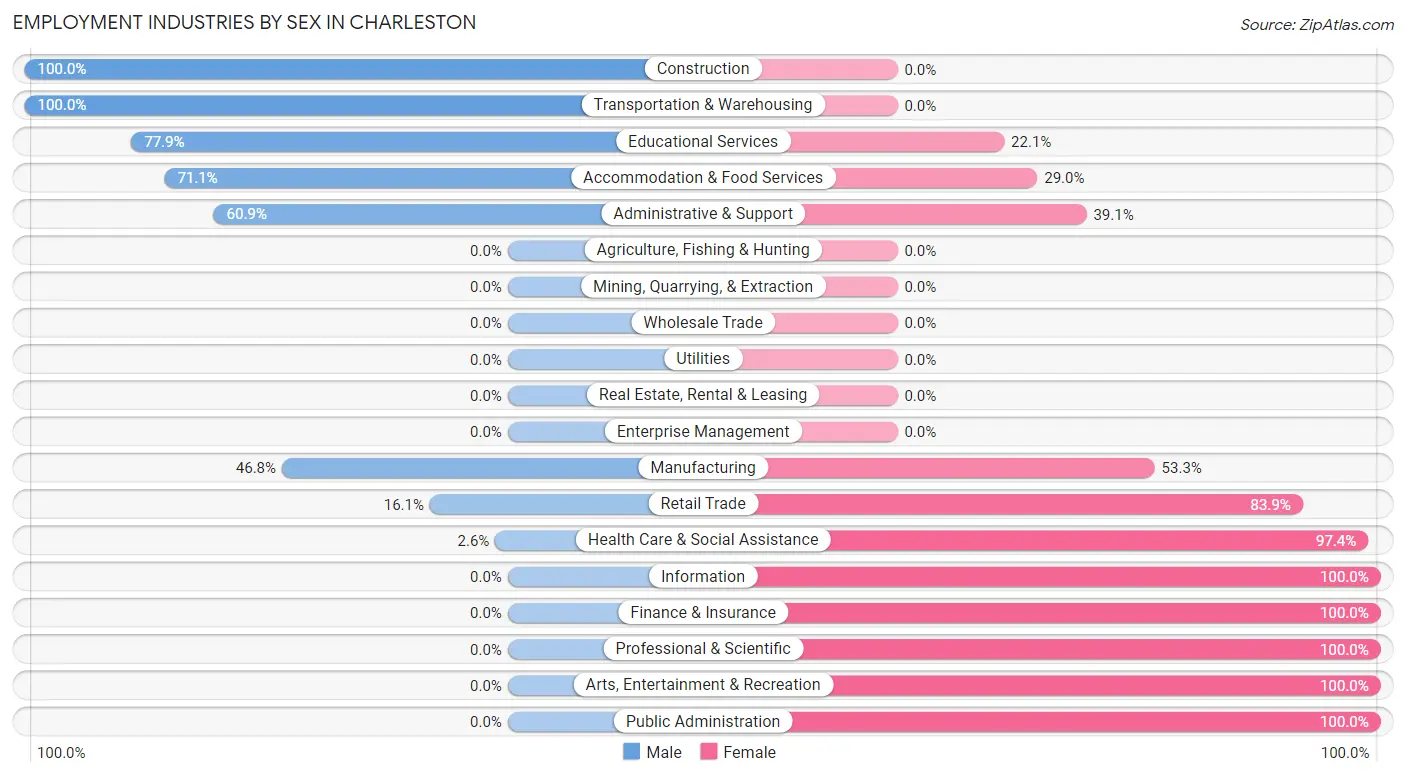
Employment Industries by Sex in Charleston
The Charleston industries that see more men than women are Construction (100.0%), Transportation & Warehousing (100.0%), and Educational Services (77.9%), whereas the industries that tend to have a higher number of women are Information (100.0%), Finance & Insurance (100.0%), and Professional & Scientific (100.0%).
| Industry | Male | Female |
| Agriculture, Fishing & Hunting | 0 (0.0%) | 0 (0.0%) |
| Mining, Quarrying, & Extraction | 0 (0.0%) | 0 (0.0%) |
| Construction | 94 (100.0%) | 0 (0.0%) |
| Manufacturing | 72 (46.8%) | 82 (53.2%) |
| Wholesale Trade | 0 (0.0%) | 0 (0.0%) |
| Retail Trade | 5 (16.1%) | 26 (83.9%) |
| Transportation & Warehousing | 30 (100.0%) | 0 (0.0%) |
| Utilities | 0 (0.0%) | 0 (0.0%) |
| Information | 0 (0.0%) | 4 (100.0%) |
| Finance & Insurance | 0 (0.0%) | 3 (100.0%) |
| Real Estate, Rental & Leasing | 0 (0.0%) | 0 (0.0%) |
| Professional & Scientific | 0 (0.0%) | 8 (100.0%) |
| Enterprise Management | 0 (0.0%) | 0 (0.0%) |
| Administrative & Support | 14 (60.9%) | 9 (39.1%) |
| Educational Services | 134 (77.9%) | 38 (22.1%) |
| Health Care & Social Assistance | 4 (2.6%) | 150 (97.4%) |
| Arts, Entertainment & Recreation | 0 (0.0%) | 11 (100.0%) |
| Accommodation & Food Services | 27 (71.1%) | 11 (28.9%) |
| Public Administration | 0 (0.0%) | 21 (100.0%) |
| Total | 502 (56.7%) | 383 (43.3%) |
Education in Charleston
School Enrollment in Charleston
The most common levels of schooling among the 783 students in Charleston are middle school (241 | 30.8%), elementary school (161 | 20.6%), and high school (146 | 18.6%).
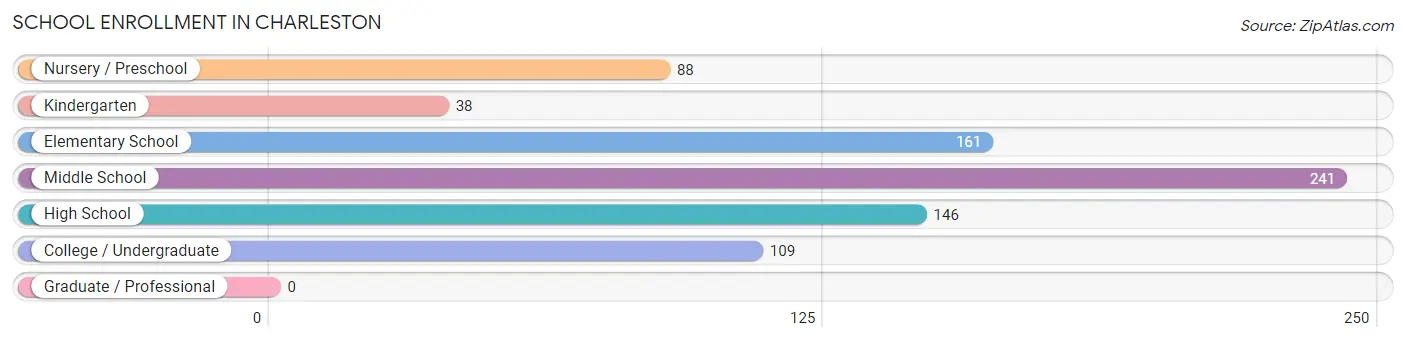
| School Level | # Students | % Students |
| Nursery / Preschool | 88 | 11.2% |
| Kindergarten | 38 | 4.9% |
| Elementary School | 161 | 20.6% |
| Middle School | 241 | 30.8% |
| High School | 146 | 18.6% |
| College / Undergraduate | 109 | 13.9% |
| Graduate / Professional | 0 | 0.0% |
| Total | 783 | 100.0% |
School Enrollment by Age by Funding Source in Charleston
Out of a total of 783 students who are enrolled in schools in Charleston, 66 (8.4%) attend a private institution, while the remaining 717 (91.6%) are enrolled in public schools. The age group of 25 to 34 year olds has the highest likelihood of being enrolled in private schools, with 58 (100.0% in the age bracket) enrolled. Conversely, the age group of 3 to 4 year olds has the lowest likelihood of being enrolled in a private school, with 84 (100.0% in the age bracket) attending a public institution.
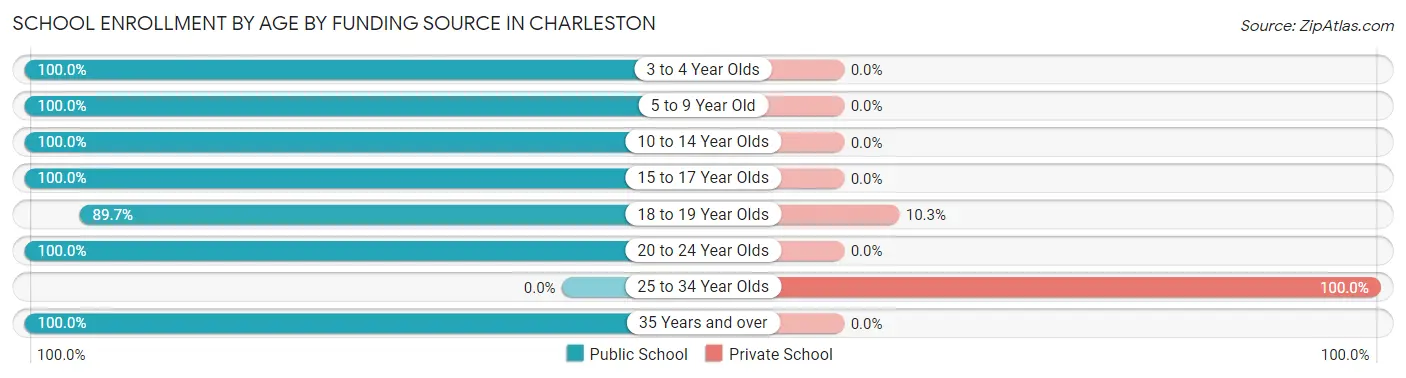
| Age Bracket | Public School | Private School |
| 3 to 4 Year Olds | 84 (100.0%) | 0 (0.0%) |
| 5 to 9 Year Old | 199 (100.0%) | 0 (0.0%) |
| 10 to 14 Year Olds | 251 (100.0%) | 0 (0.0%) |
| 15 to 17 Year Olds | 87 (100.0%) | 0 (0.0%) |
| 18 to 19 Year Olds | 70 (89.7%) | 8 (10.3%) |
| 20 to 24 Year Olds | 22 (100.0%) | 0 (0.0%) |
| 25 to 34 Year Olds | 0 (0.0%) | 58 (100.0%) |
| 35 Years and over | 4 (100.0%) | 0 (0.0%) |
| Total | 717 (91.6%) | 66 (8.4%) |
Educational Attainment by Field of Study in Charleston
Education (170 | 49.0%), liberal arts & history (32 | 9.2%), science & technology (31 | 8.9%), engineering (29 | 8.4%), and social sciences (20 | 5.8%) are the most common fields of study among 347 individuals in Charleston who have obtained a bachelor's degree or higher.
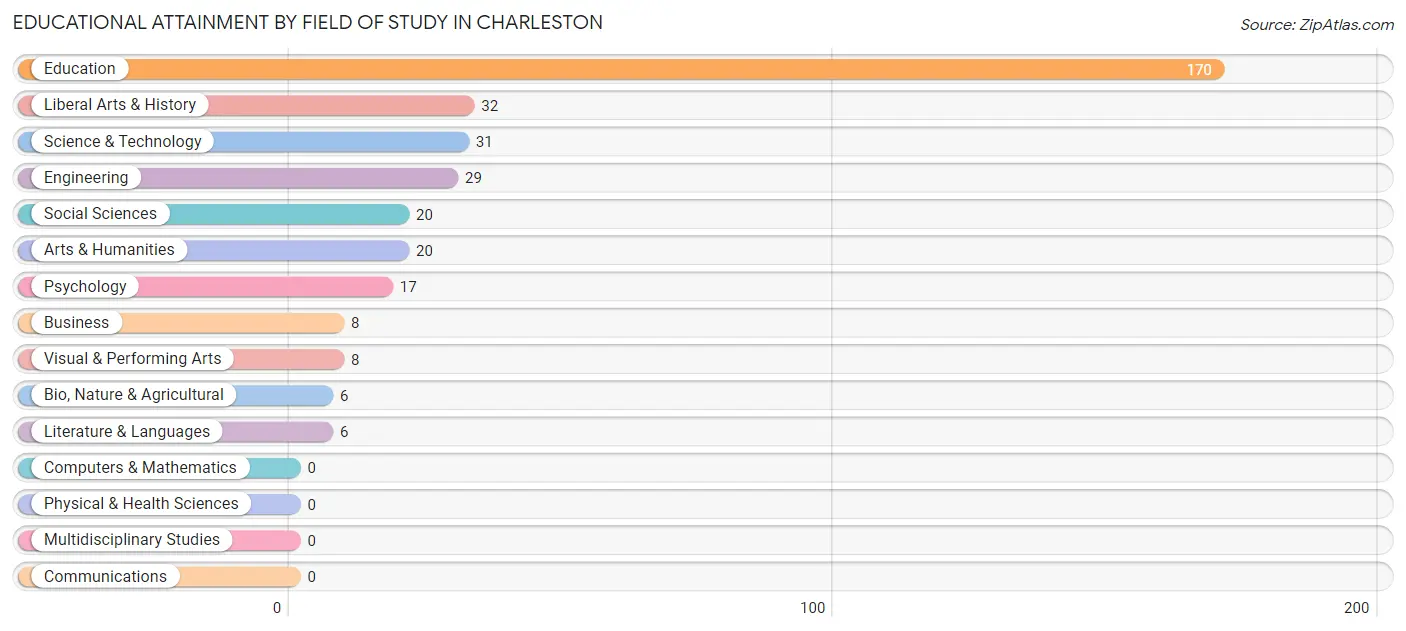
| Field of Study | # Graduates | % Graduates |
| Computers & Mathematics | 0 | 0.0% |
| Bio, Nature & Agricultural | 6 | 1.7% |
| Physical & Health Sciences | 0 | 0.0% |
| Psychology | 17 | 4.9% |
| Social Sciences | 20 | 5.8% |
| Engineering | 29 | 8.4% |
| Multidisciplinary Studies | 0 | 0.0% |
| Science & Technology | 31 | 8.9% |
| Business | 8 | 2.3% |
| Education | 170 | 49.0% |
| Literature & Languages | 6 | 1.7% |
| Liberal Arts & History | 32 | 9.2% |
| Visual & Performing Arts | 8 | 2.3% |
| Communications | 0 | 0.0% |
| Arts & Humanities | 20 | 5.8% |
| Total | 347 | 100.0% |
Transportation & Commute in Charleston
Vehicle Availability by Sex in Charleston
The most prevalent vehicle ownership categories in Charleston are males with 2 vehicles (213, accounting for 42.4%) and females with 2 vehicles (117, making up 57.1%).
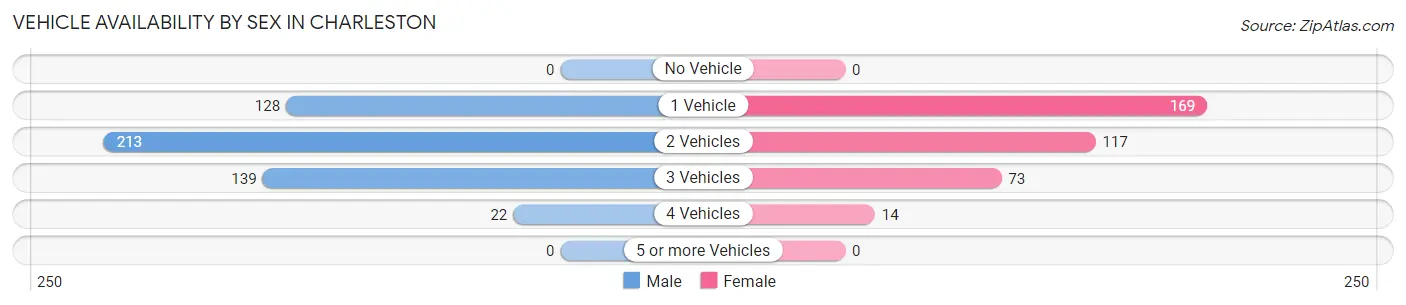
| Vehicles Available | Male | Female |
| No Vehicle | 0 (0.0%) | 0 (0.0%) |
| 1 Vehicle | 128 (25.5%) | 169 (45.3%) |
| 2 Vehicles | 213 (42.4%) | 117 (31.4%) |
| 3 Vehicles | 139 (27.7%) | 73 (19.6%) |
| 4 Vehicles | 22 (4.4%) | 14 (3.7%) |
| 5 or more Vehicles | 0 (0.0%) | 0 (0.0%) |
| Total | 502 (100.0%) | 373 (100.0%) |
Commute Time in Charleston
The most frequently occuring commute durations in Charleston are 5 to 9 minutes (201 commuters, 26.3%), 45 to 59 minutes (148 commuters, 19.4%), and less than 5 minutes (138 commuters, 18.1%).
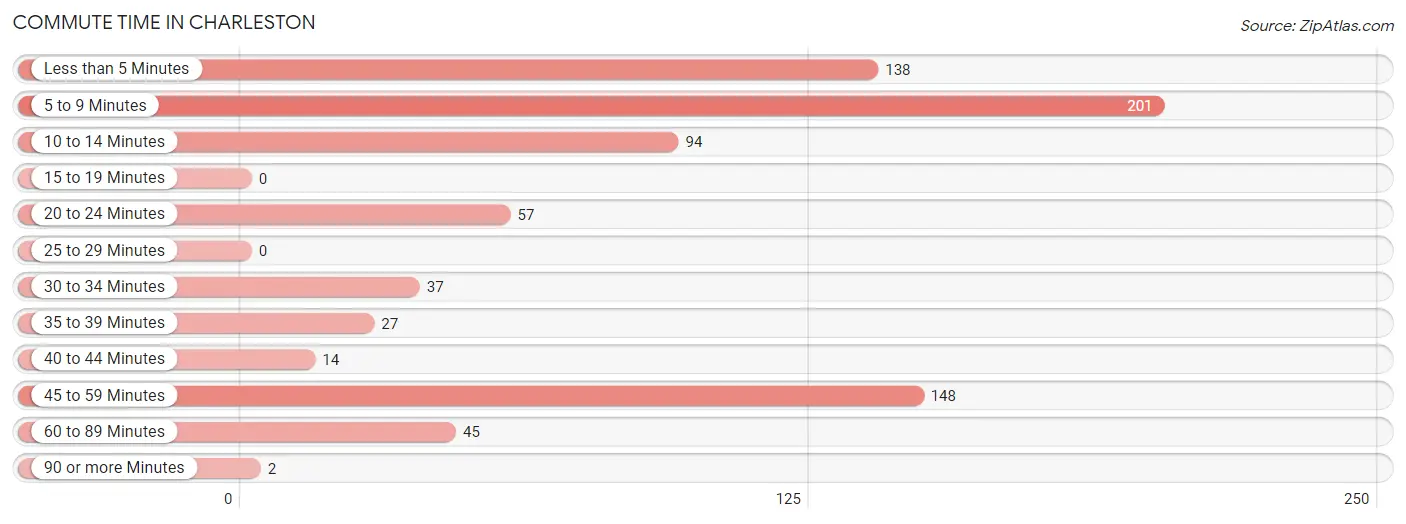
| Commute Time | # Commuters | % Commuters |
| Less than 5 Minutes | 138 | 18.1% |
| 5 to 9 Minutes | 201 | 26.3% |
| 10 to 14 Minutes | 94 | 12.3% |
| 15 to 19 Minutes | 0 | 0.0% |
| 20 to 24 Minutes | 57 | 7.5% |
| 25 to 29 Minutes | 0 | 0.0% |
| 30 to 34 Minutes | 37 | 4.9% |
| 35 to 39 Minutes | 27 | 3.5% |
| 40 to 44 Minutes | 14 | 1.8% |
| 45 to 59 Minutes | 148 | 19.4% |
| 60 to 89 Minutes | 45 | 5.9% |
| 90 or more Minutes | 2 | 0.3% |
Commute Time by Sex in Charleston
The most common commute times in Charleston are 5 to 9 minutes (110 commuters, 27.6%) for males and 5 to 9 minutes (91 commuters, 25.0%) for females.
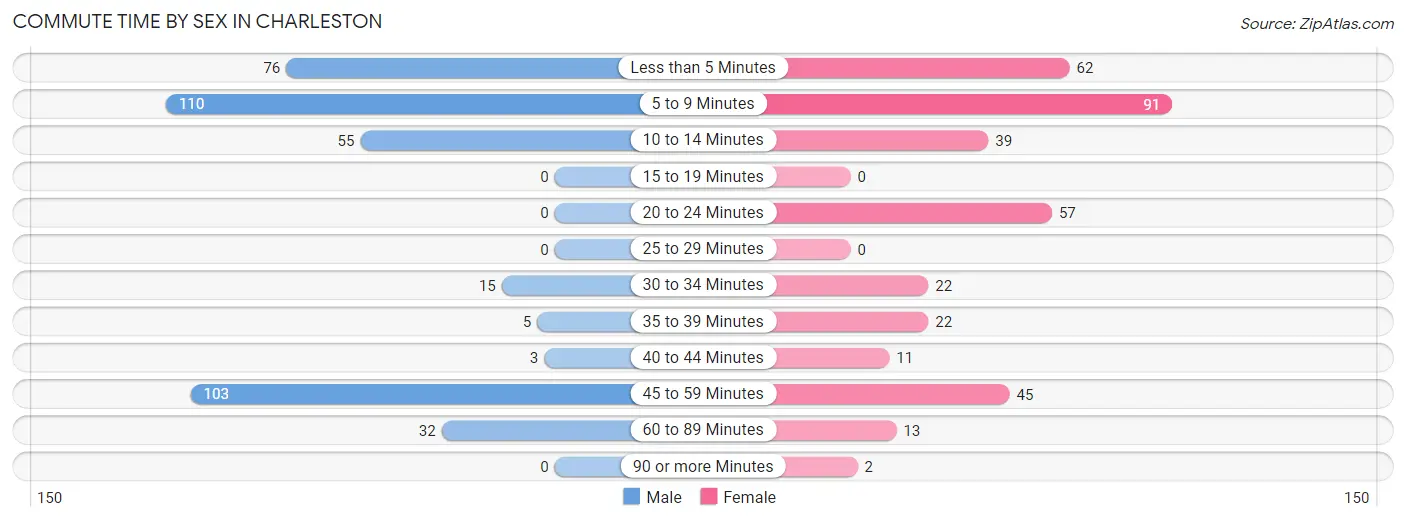
| Commute Time | Male | Female |
| Less than 5 Minutes | 76 (19.1%) | 62 (17.0%) |
| 5 to 9 Minutes | 110 (27.6%) | 91 (25.0%) |
| 10 to 14 Minutes | 55 (13.8%) | 39 (10.7%) |
| 15 to 19 Minutes | 0 (0.0%) | 0 (0.0%) |
| 20 to 24 Minutes | 0 (0.0%) | 57 (15.7%) |
| 25 to 29 Minutes | 0 (0.0%) | 0 (0.0%) |
| 30 to 34 Minutes | 15 (3.8%) | 22 (6.0%) |
| 35 to 39 Minutes | 5 (1.3%) | 22 (6.0%) |
| 40 to 44 Minutes | 3 (0.7%) | 11 (3.0%) |
| 45 to 59 Minutes | 103 (25.8%) | 45 (12.4%) |
| 60 to 89 Minutes | 32 (8.0%) | 13 (3.6%) |
| 90 or more Minutes | 0 (0.0%) | 2 (0.5%) |
Time of Departure to Work by Sex in Charleston
The most frequent times of departure to work in Charleston are 7:00 AM to 7:29 AM (114, 28.6%) for males and 7:00 AM to 7:29 AM (84, 23.1%) for females.
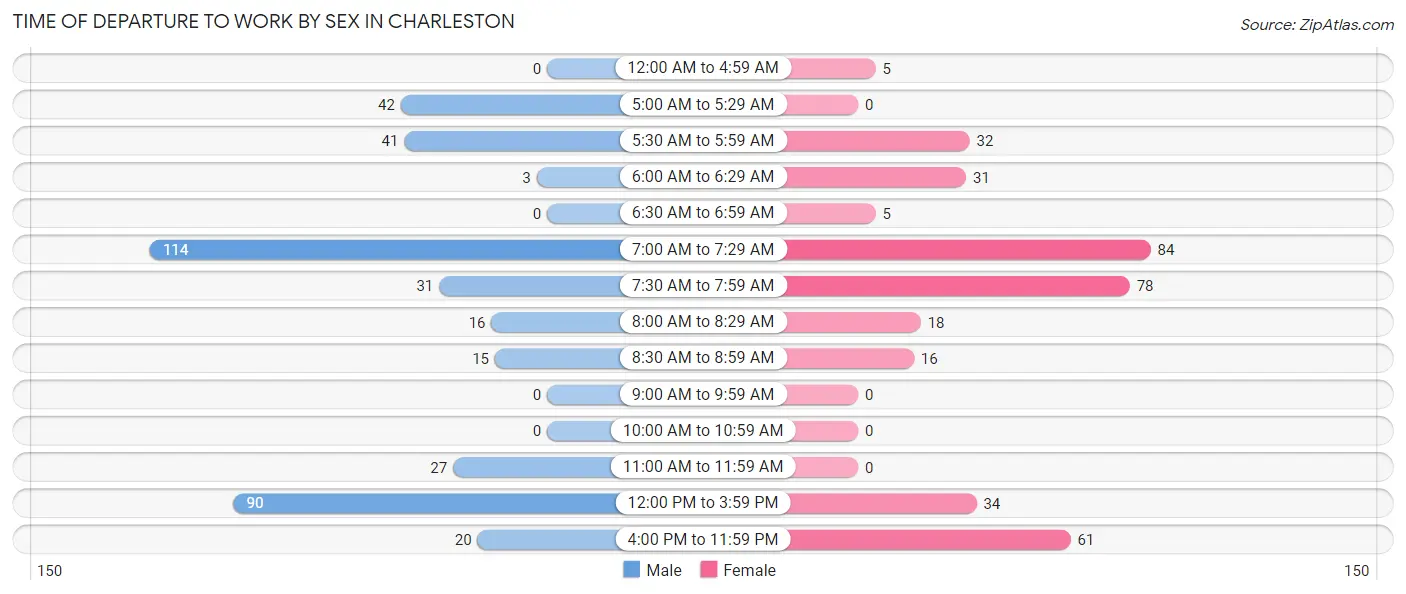
| Time of Departure | Male | Female |
| 12:00 AM to 4:59 AM | 0 (0.0%) | 5 (1.4%) |
| 5:00 AM to 5:29 AM | 42 (10.5%) | 0 (0.0%) |
| 5:30 AM to 5:59 AM | 41 (10.3%) | 32 (8.8%) |
| 6:00 AM to 6:29 AM | 3 (0.7%) | 31 (8.5%) |
| 6:30 AM to 6:59 AM | 0 (0.0%) | 5 (1.4%) |
| 7:00 AM to 7:29 AM | 114 (28.6%) | 84 (23.1%) |
| 7:30 AM to 7:59 AM | 31 (7.8%) | 78 (21.4%) |
| 8:00 AM to 8:29 AM | 16 (4.0%) | 18 (5.0%) |
| 8:30 AM to 8:59 AM | 15 (3.8%) | 16 (4.4%) |
| 9:00 AM to 9:59 AM | 0 (0.0%) | 0 (0.0%) |
| 10:00 AM to 10:59 AM | 0 (0.0%) | 0 (0.0%) |
| 11:00 AM to 11:59 AM | 27 (6.8%) | 0 (0.0%) |
| 12:00 PM to 3:59 PM | 90 (22.6%) | 34 (9.3%) |
| 4:00 PM to 11:59 PM | 20 (5.0%) | 61 (16.8%) |
| Total | 399 (100.0%) | 364 (100.0%) |
Housing Occupancy in Charleston
Occupancy by Ownership in Charleston
Of the total 838 dwellings in Charleston, owner-occupied units account for 423 (50.5%), while renter-occupied units make up 415 (49.5%).
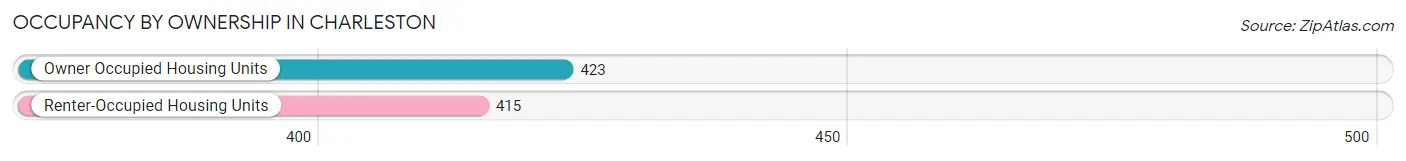
| Occupancy | # Housing Units | % Housing Units |
| Owner Occupied Housing Units | 423 | 50.5% |
| Renter-Occupied Housing Units | 415 | 49.5% |
| Total Occupied Housing Units | 838 | 100.0% |
Occupancy by Household Size in Charleston
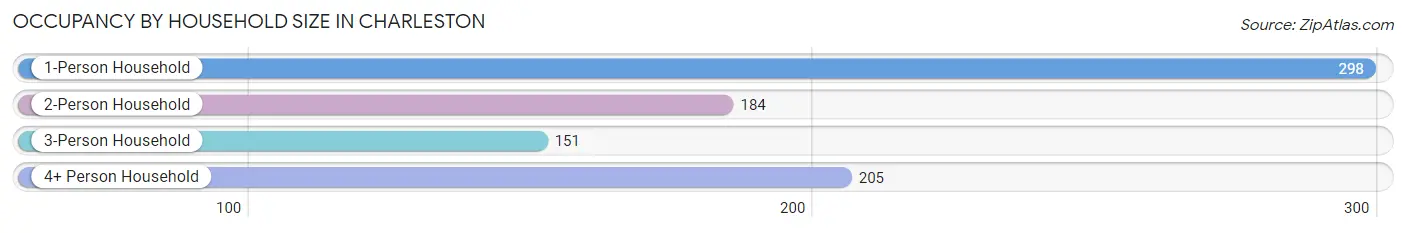
| Household Size | # Housing Units | % Housing Units |
| 1-Person Household | 298 | 35.6% |
| 2-Person Household | 184 | 22.0% |
| 3-Person Household | 151 | 18.0% |
| 4+ Person Household | 205 | 24.5% |
| Total Housing Units | 838 | 100.0% |
Occupancy by Ownership by Household Size in Charleston
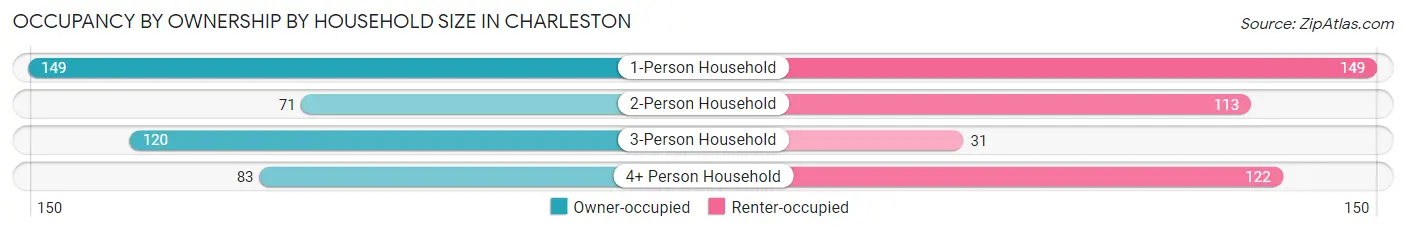
| Household Size | Owner-occupied | Renter-occupied |
| 1-Person Household | 149 (50.0%) | 149 (50.0%) |
| 2-Person Household | 71 (38.6%) | 113 (61.4%) |
| 3-Person Household | 120 (79.5%) | 31 (20.5%) |
| 4+ Person Household | 83 (40.5%) | 122 (59.5%) |
| Total Housing Units | 423 (50.5%) | 415 (49.5%) |
Occupancy by Educational Attainment in Charleston
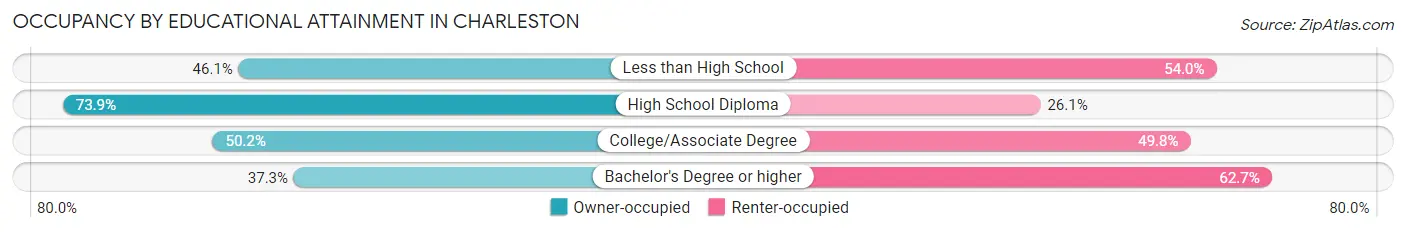
| Household Size | Owner-occupied | Renter-occupied |
| Less than High School | 70 (46.1%) | 82 (53.9%) |
| High School Diploma | 122 (73.9%) | 43 (26.1%) |
| College/Associate Degree | 143 (50.2%) | 142 (49.8%) |
| Bachelor's Degree or higher | 88 (37.3%) | 148 (62.7%) |
Occupancy by Age of Householder in Charleston
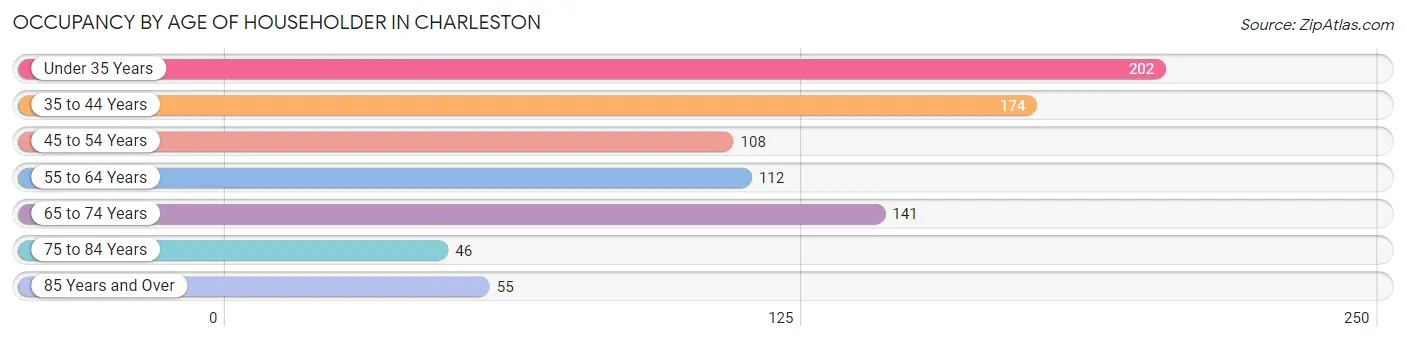
| Age Bracket | # Households | % Households |
| Under 35 Years | 202 | 24.1% |
| 35 to 44 Years | 174 | 20.8% |
| 45 to 54 Years | 108 | 12.9% |
| 55 to 64 Years | 112 | 13.4% |
| 65 to 74 Years | 141 | 16.8% |
| 75 to 84 Years | 46 | 5.5% |
| 85 Years and Over | 55 | 6.6% |
| Total | 838 | 100.0% |
Housing Finances in Charleston
Median Income by Occupancy in Charleston
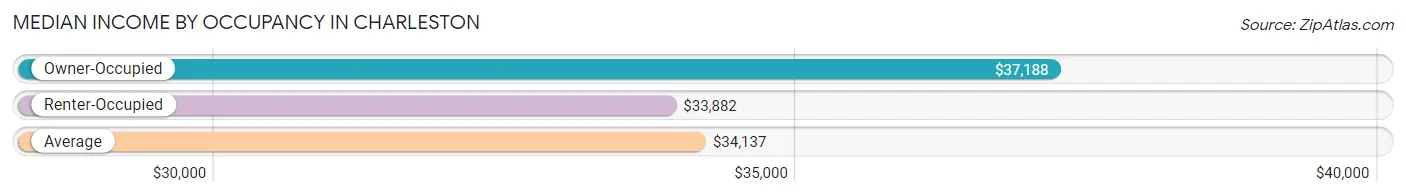
| Occupancy Type | # Households | Median Income |
| Owner-Occupied | 423 (50.5%) | $37,188 |
| Renter-Occupied | 415 (49.5%) | $33,882 |
| Average | 838 (100.0%) | $34,137 |
Occupancy by Householder Income Bracket in Charleston
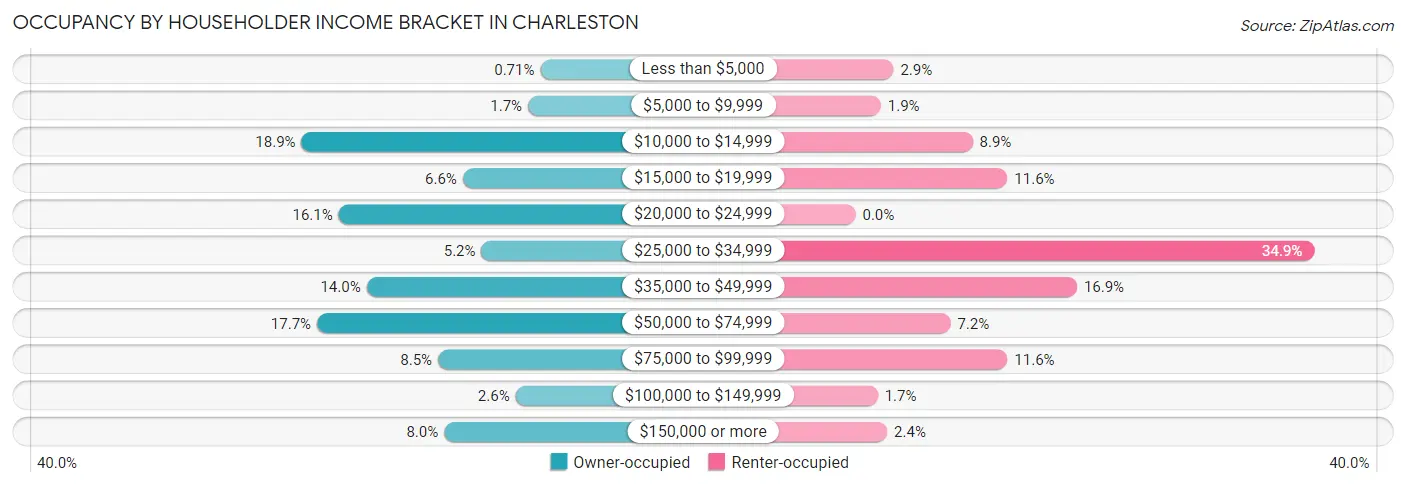
| Income Bracket | Owner-occupied | Renter-occupied |
| Less than $5,000 | 3 (0.7%) | 12 (2.9%) |
| $5,000 to $9,999 | 7 (1.7%) | 8 (1.9%) |
| $10,000 to $14,999 | 80 (18.9%) | 37 (8.9%) |
| $15,000 to $19,999 | 28 (6.6%) | 48 (11.6%) |
| $20,000 to $24,999 | 68 (16.1%) | 0 (0.0%) |
| $25,000 to $34,999 | 22 (5.2%) | 145 (34.9%) |
| $35,000 to $49,999 | 59 (14.0%) | 70 (16.9%) |
| $50,000 to $74,999 | 75 (17.7%) | 30 (7.2%) |
| $75,000 to $99,999 | 36 (8.5%) | 48 (11.6%) |
| $100,000 to $149,999 | 11 (2.6%) | 7 (1.7%) |
| $150,000 or more | 34 (8.0%) | 10 (2.4%) |
| Total | 423 (100.0%) | 415 (100.0%) |
Monthly Housing Cost Tiers in Charleston
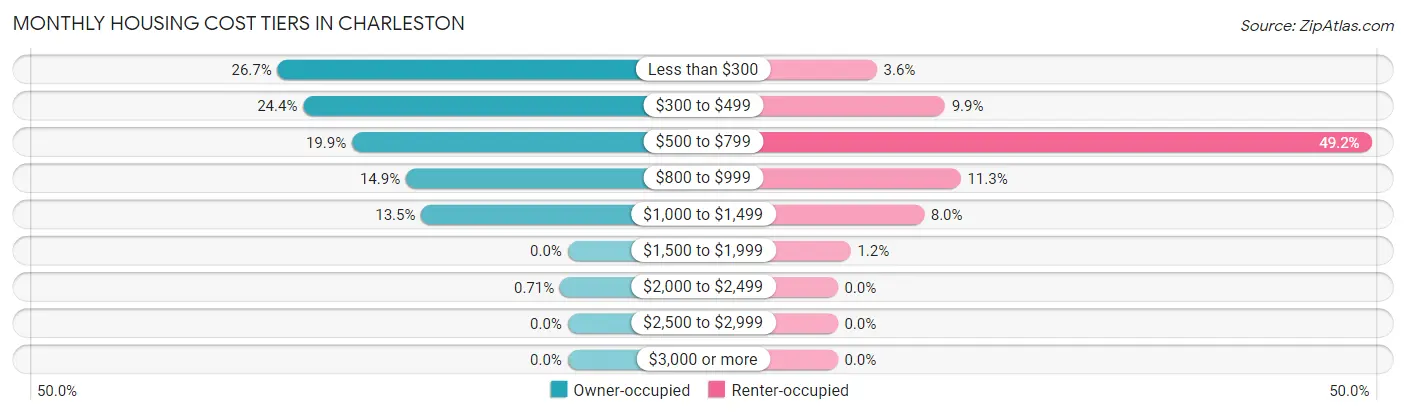
| Monthly Cost | Owner-occupied | Renter-occupied |
| Less than $300 | 113 (26.7%) | 15 (3.6%) |
| $300 to $499 | 103 (24.3%) | 41 (9.9%) |
| $500 to $799 | 84 (19.9%) | 204 (49.2%) |
| $800 to $999 | 63 (14.9%) | 47 (11.3%) |
| $1,000 to $1,499 | 57 (13.5%) | 33 (8.0%) |
| $1,500 to $1,999 | 0 (0.0%) | 5 (1.2%) |
| $2,000 to $2,499 | 3 (0.7%) | 0 (0.0%) |
| $2,500 to $2,999 | 0 (0.0%) | 0 (0.0%) |
| $3,000 or more | 0 (0.0%) | 0 (0.0%) |
| Total | 423 (100.0%) | 415 (100.0%) |
Physical Housing Characteristics in Charleston
Housing Structures in Charleston
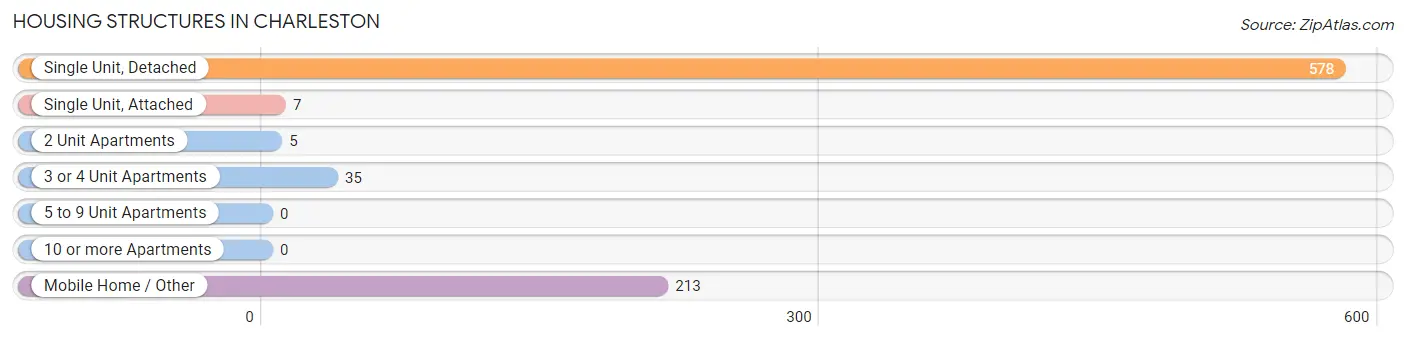
| Structure Type | # Housing Units | % Housing Units |
| Single Unit, Detached | 578 | 69.0% |
| Single Unit, Attached | 7 | 0.8% |
| 2 Unit Apartments | 5 | 0.6% |
| 3 or 4 Unit Apartments | 35 | 4.2% |
| 5 to 9 Unit Apartments | 0 | 0.0% |
| 10 or more Apartments | 0 | 0.0% |
| Mobile Home / Other | 213 | 25.4% |
| Total | 838 | 100.0% |
Housing Structures by Occupancy in Charleston
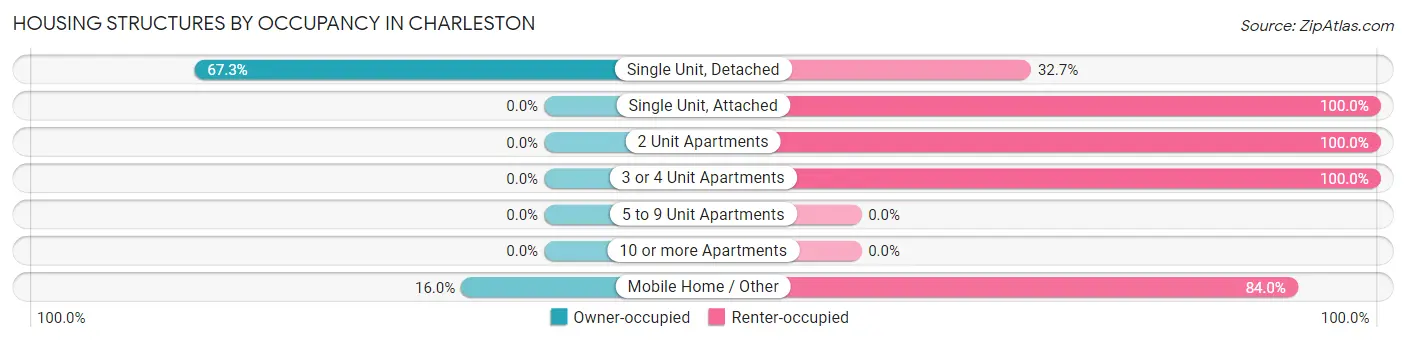
| Structure Type | Owner-occupied | Renter-occupied |
| Single Unit, Detached | 389 (67.3%) | 189 (32.7%) |
| Single Unit, Attached | 0 (0.0%) | 7 (100.0%) |
| 2 Unit Apartments | 0 (0.0%) | 5 (100.0%) |
| 3 or 4 Unit Apartments | 0 (0.0%) | 35 (100.0%) |
| 5 to 9 Unit Apartments | 0 (0.0%) | 0 (0.0%) |
| 10 or more Apartments | 0 (0.0%) | 0 (0.0%) |
| Mobile Home / Other | 34 (16.0%) | 179 (84.0%) |
| Total | 423 (50.5%) | 415 (49.5%) |
Housing Structures by Number of Rooms in Charleston
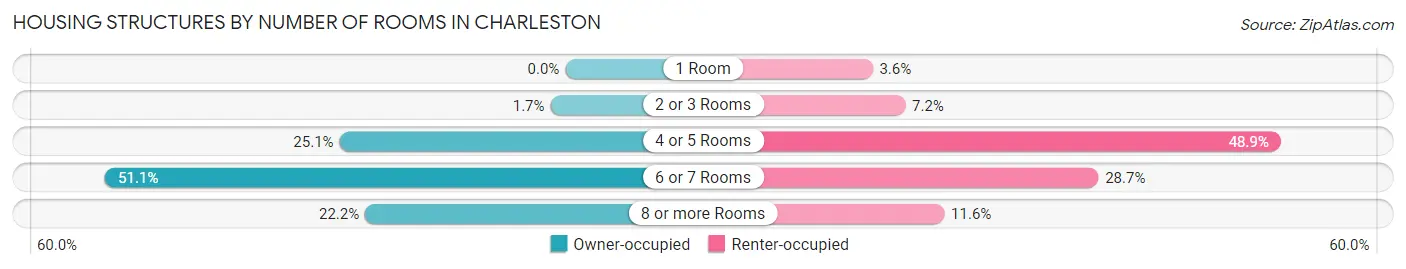
| Number of Rooms | Owner-occupied | Renter-occupied |
| 1 Room | 0 (0.0%) | 15 (3.6%) |
| 2 or 3 Rooms | 7 (1.7%) | 30 (7.2%) |
| 4 or 5 Rooms | 106 (25.1%) | 203 (48.9%) |
| 6 or 7 Rooms | 216 (51.1%) | 119 (28.7%) |
| 8 or more Rooms | 94 (22.2%) | 48 (11.6%) |
| Total | 423 (100.0%) | 415 (100.0%) |
Housing Structure by Heating Type in Charleston
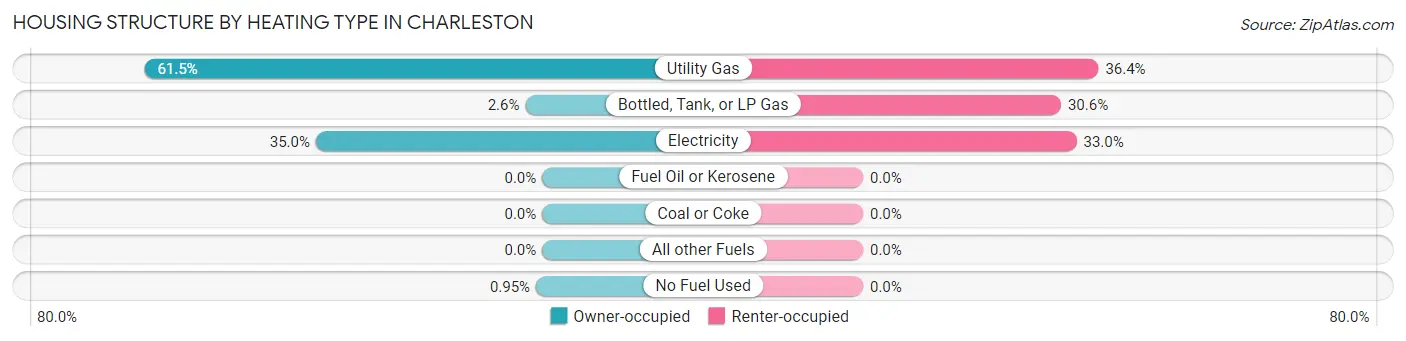
| Heating Type | Owner-occupied | Renter-occupied |
| Utility Gas | 260 (61.5%) | 151 (36.4%) |
| Bottled, Tank, or LP Gas | 11 (2.6%) | 127 (30.6%) |
| Electricity | 148 (35.0%) | 137 (33.0%) |
| Fuel Oil or Kerosene | 0 (0.0%) | 0 (0.0%) |
| Coal or Coke | 0 (0.0%) | 0 (0.0%) |
| All other Fuels | 0 (0.0%) | 0 (0.0%) |
| No Fuel Used | 4 (0.9%) | 0 (0.0%) |
| Total | 423 (100.0%) | 415 (100.0%) |
Household Vehicle Usage in Charleston
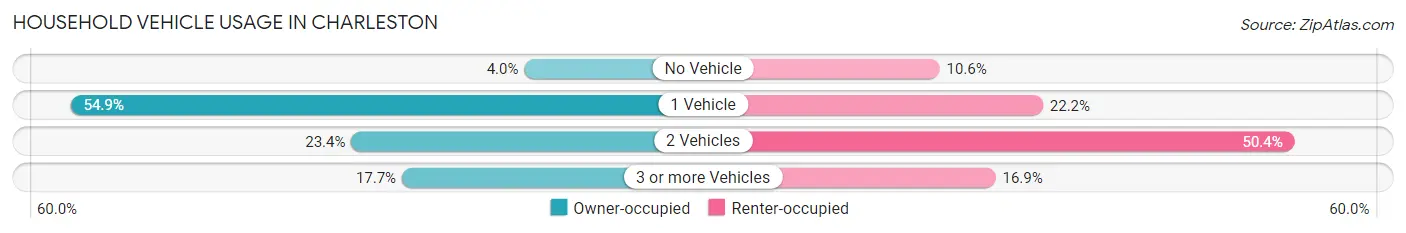
| Vehicles per Household | Owner-occupied | Renter-occupied |
| No Vehicle | 17 (4.0%) | 44 (10.6%) |
| 1 Vehicle | 232 (54.8%) | 92 (22.2%) |
| 2 Vehicles | 99 (23.4%) | 209 (50.4%) |
| 3 or more Vehicles | 75 (17.7%) | 70 (16.9%) |
| Total | 423 (100.0%) | 415 (100.0%) |
Real Estate & Mortgages in Charleston
Real Estate and Mortgage Overview in Charleston
| Characteristic | Without Mortgage | With Mortgage |
| Housing Units | 252 | 171 |
| Median Property Value | $78,800 | $88,200 |
| Median Household Income | $22,112 | $34 |
| Monthly Housing Costs | $328 | $0 |
| Real Estate Taxes | $280 | $78 |
Property Value by Mortgage Status in Charleston
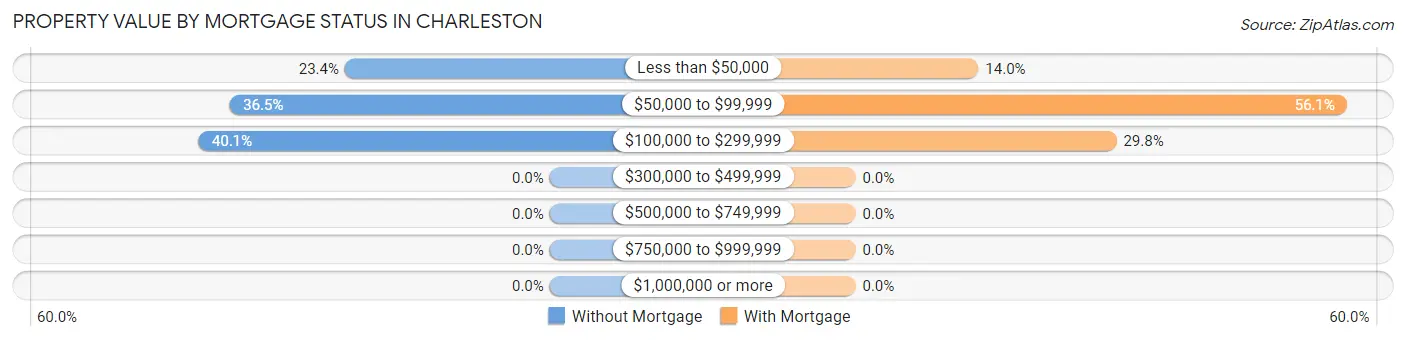
| Property Value | Without Mortgage | With Mortgage |
| Less than $50,000 | 59 (23.4%) | 24 (14.0%) |
| $50,000 to $99,999 | 92 (36.5%) | 96 (56.1%) |
| $100,000 to $299,999 | 101 (40.1%) | 51 (29.8%) |
| $300,000 to $499,999 | 0 (0.0%) | 0 (0.0%) |
| $500,000 to $749,999 | 0 (0.0%) | 0 (0.0%) |
| $750,000 to $999,999 | 0 (0.0%) | 0 (0.0%) |
| $1,000,000 or more | 0 (0.0%) | 0 (0.0%) |
| Total | 252 (100.0%) | 171 (100.0%) |
Household Income by Mortgage Status in Charleston
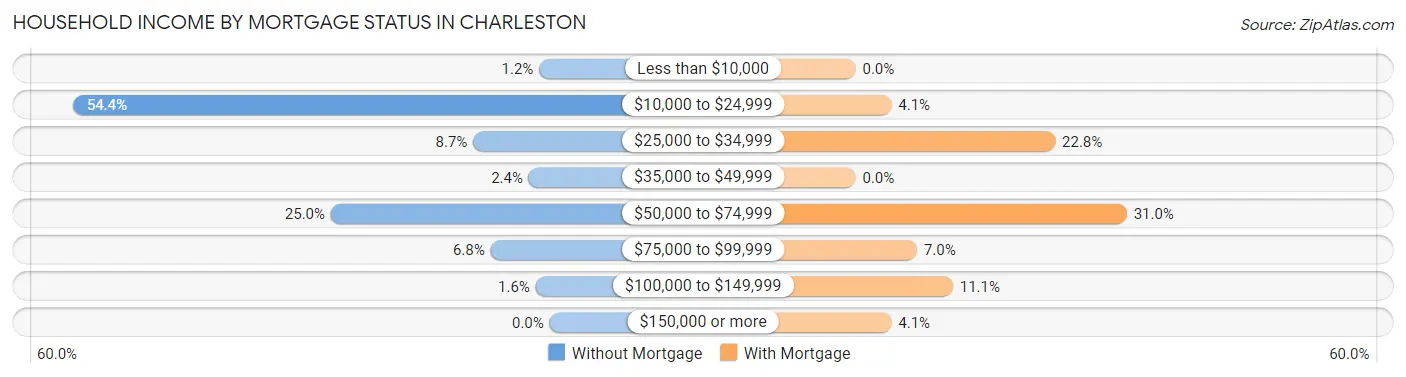
| Household Income | Without Mortgage | With Mortgage |
| Less than $10,000 | 3 (1.2%) | 0 (0.0%) |
| $10,000 to $24,999 | 137 (54.4%) | 7 (4.1%) |
| $25,000 to $34,999 | 22 (8.7%) | 39 (22.8%) |
| $35,000 to $49,999 | 6 (2.4%) | 0 (0.0%) |
| $50,000 to $74,999 | 63 (25.0%) | 53 (31.0%) |
| $75,000 to $99,999 | 17 (6.8%) | 12 (7.0%) |
| $100,000 to $149,999 | 4 (1.6%) | 19 (11.1%) |
| $150,000 or more | 0 (0.0%) | 7 (4.1%) |
| Total | 252 (100.0%) | 171 (100.0%) |
Property Value to Household Income Ratio in Charleston
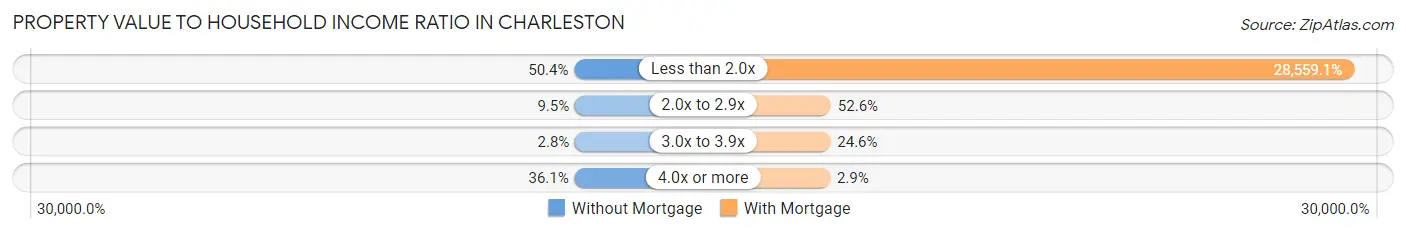
| Value-to-Income Ratio | Without Mortgage | With Mortgage |
| Less than 2.0x | 127 (50.4%) | 48,836 (28,559.1%) |
| 2.0x to 2.9x | 24 (9.5%) | 90 (52.6%) |
| 3.0x to 3.9x | 7 (2.8%) | 42 (24.6%) |
| 4.0x or more | 91 (36.1%) | 5 (2.9%) |
| Total | 252 (100.0%) | 171 (100.0%) |
Real Estate Taxes by Mortgage Status in Charleston
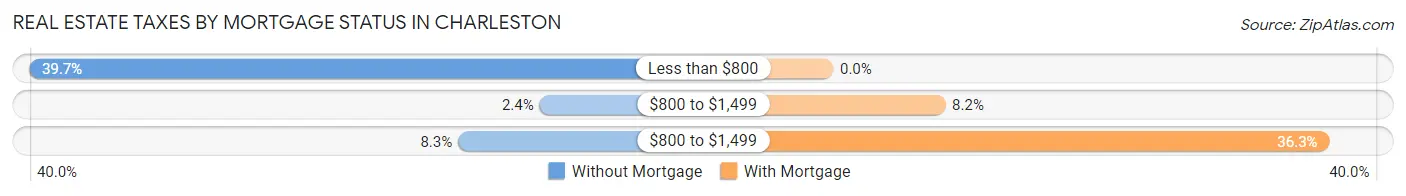
| Property Taxes | Without Mortgage | With Mortgage |
| Less than $800 | 100 (39.7%) | 0 (0.0%) |
| $800 to $1,499 | 6 (2.4%) | 14 (8.2%) |
| $800 to $1,499 | 21 (8.3%) | 62 (36.3%) |
| Total | 252 (100.0%) | 171 (100.0%) |
Health & Disability in Charleston
Health Insurance Coverage by Age in Charleston
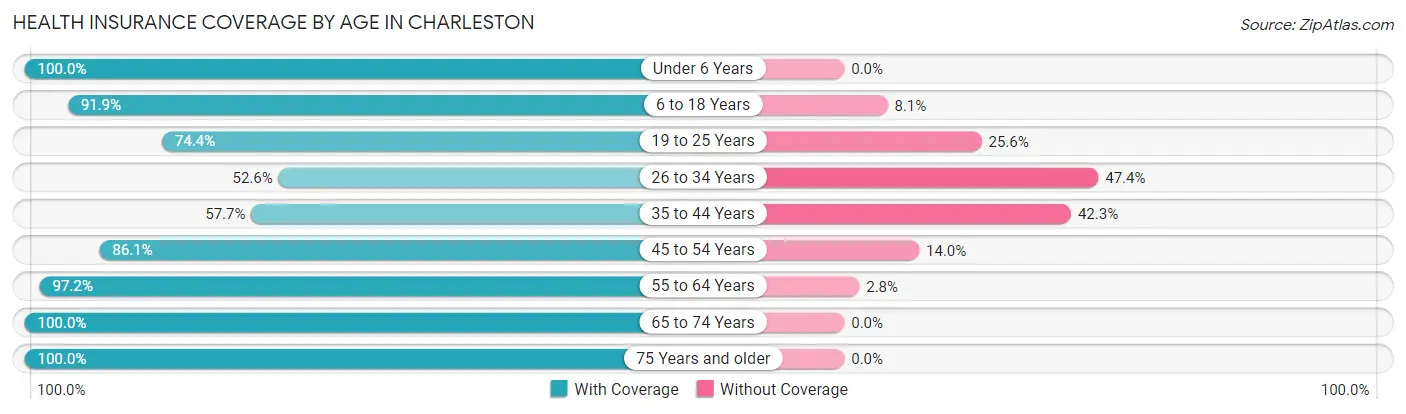
| Age Bracket | With Coverage | Without Coverage |
| Under 6 Years | 247 (100.0%) | 0 (0.0%) |
| 6 to 18 Years | 525 (91.9%) | 46 (8.1%) |
| 19 to 25 Years | 154 (74.4%) | 53 (25.6%) |
| 26 to 34 Years | 229 (52.6%) | 206 (47.4%) |
| 35 to 44 Years | 168 (57.7%) | 123 (42.3%) |
| 45 to 54 Years | 185 (86.1%) | 30 (14.0%) |
| 55 to 64 Years | 244 (97.2%) | 7 (2.8%) |
| 65 to 74 Years | 178 (100.0%) | 0 (0.0%) |
| 75 Years and older | 112 (100.0%) | 0 (0.0%) |
| Total | 2,042 (81.5%) | 465 (18.5%) |
Health Insurance Coverage by Citizenship Status in Charleston
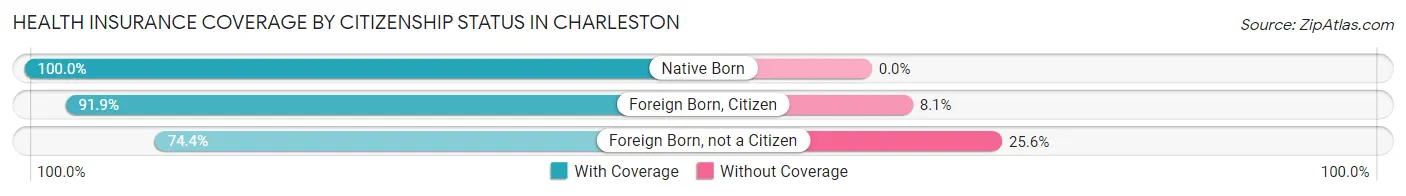
| Citizenship Status | With Coverage | Without Coverage |
| Native Born | 247 (100.0%) | 0 (0.0%) |
| Foreign Born, Citizen | 525 (91.9%) | 46 (8.1%) |
| Foreign Born, not a Citizen | 154 (74.4%) | 53 (25.6%) |
Health Insurance Coverage by Household Income in Charleston
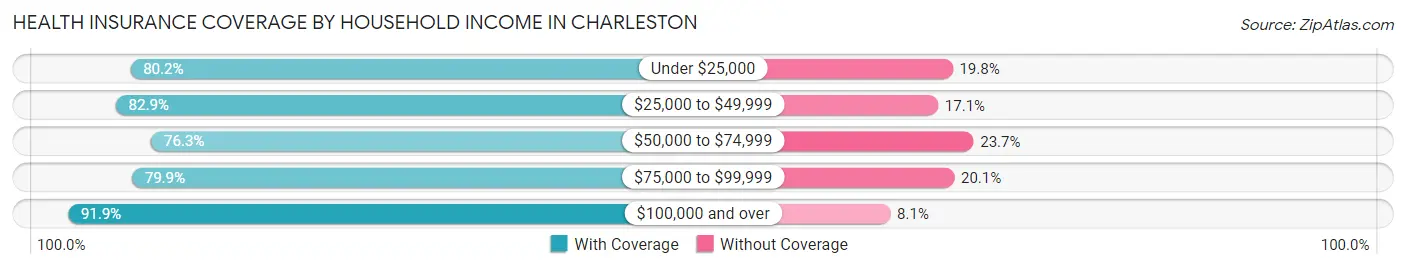
| Household Income | With Coverage | Without Coverage |
| Under $25,000 | 563 (80.2%) | 139 (19.8%) |
| $25,000 to $49,999 | 714 (82.9%) | 147 (17.1%) |
| $50,000 to $74,999 | 367 (76.3%) | 114 (23.7%) |
| $75,000 to $99,999 | 183 (79.9%) | 46 (20.1%) |
| $100,000 and over | 215 (91.9%) | 19 (8.1%) |
Public vs Private Health Insurance Coverage by Age in Charleston
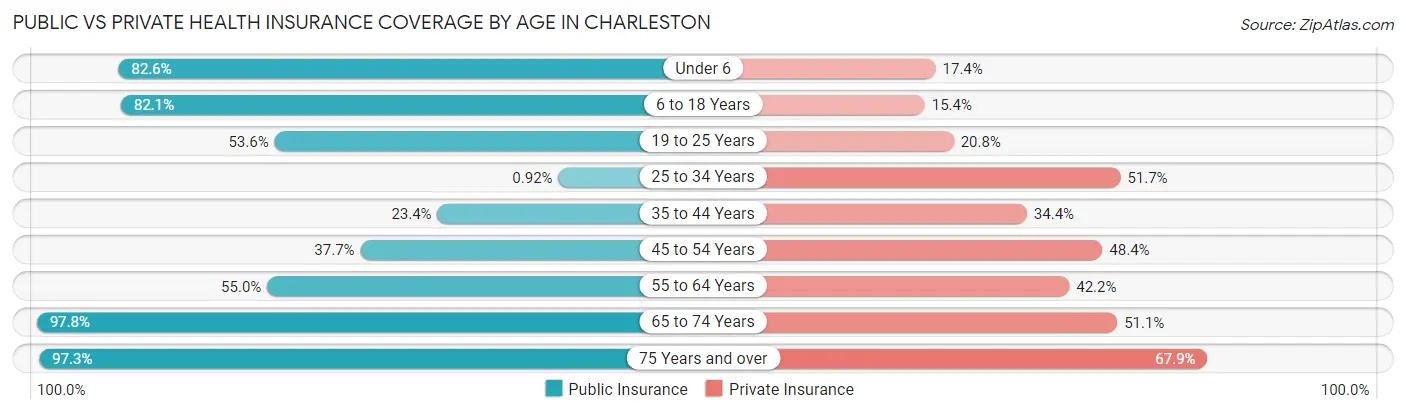
| Age Bracket | Public Insurance | Private Insurance |
| Under 6 | 204 (82.6%) | 43 (17.4%) |
| 6 to 18 Years | 469 (82.1%) | 88 (15.4%) |
| 19 to 25 Years | 111 (53.6%) | 43 (20.8%) |
| 25 to 34 Years | 4 (0.9%) | 225 (51.7%) |
| 35 to 44 Years | 68 (23.4%) | 100 (34.4%) |
| 45 to 54 Years | 81 (37.7%) | 104 (48.4%) |
| 55 to 64 Years | 138 (55.0%) | 106 (42.2%) |
| 65 to 74 Years | 174 (97.8%) | 91 (51.1%) |
| 75 Years and over | 109 (97.3%) | 76 (67.9%) |
| Total | 1,358 (54.2%) | 876 (34.9%) |
Disability Status by Sex by Age in Charleston
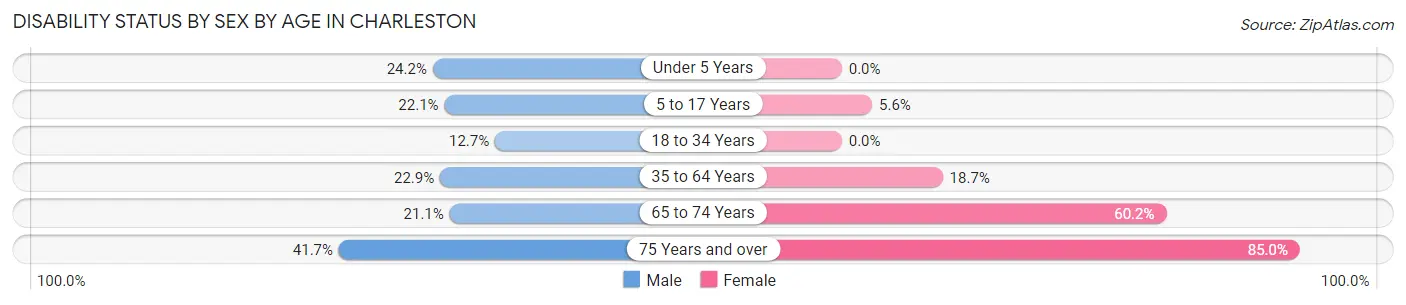
| Age Bracket | Male | Female |
| Under 5 Years | 32 (24.2%) | 0 (0.0%) |
| 5 to 17 Years | 70 (22.1%) | 13 (5.6%) |
| 18 to 34 Years | 63 (12.7%) | 0 (0.0%) |
| 35 to 64 Years | 73 (22.9%) | 82 (18.7%) |
| 65 to 74 Years | 19 (21.1%) | 53 (60.2%) |
| 75 Years and over | 5 (41.7%) | 85 (85.0%) |
Disability Class by Sex by Age in Charleston
Disability Class: Hearing Difficulty
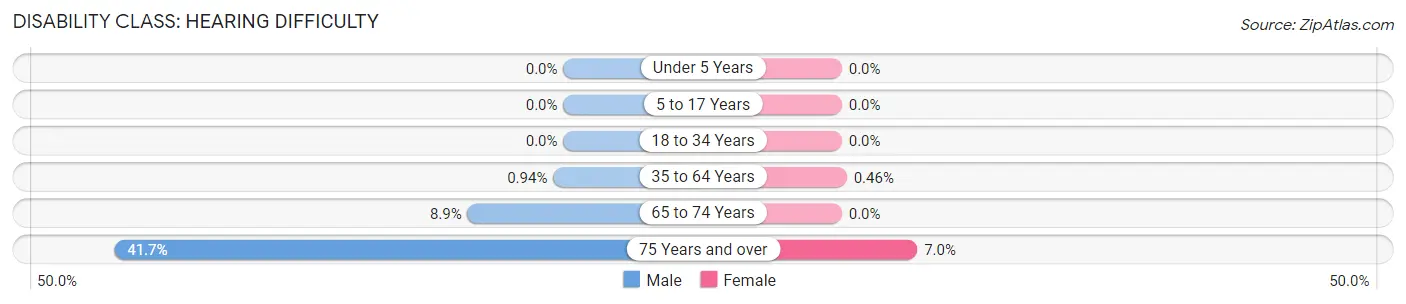
| Age Bracket | Male | Female |
| Under 5 Years | 0 (0.0%) | 0 (0.0%) |
| 5 to 17 Years | 0 (0.0%) | 0 (0.0%) |
| 18 to 34 Years | 0 (0.0%) | 0 (0.0%) |
| 35 to 64 Years | 3 (0.9%) | 2 (0.5%) |
| 65 to 74 Years | 8 (8.9%) | 0 (0.0%) |
| 75 Years and over | 5 (41.7%) | 7 (7.0%) |
Disability Class: Vision Difficulty
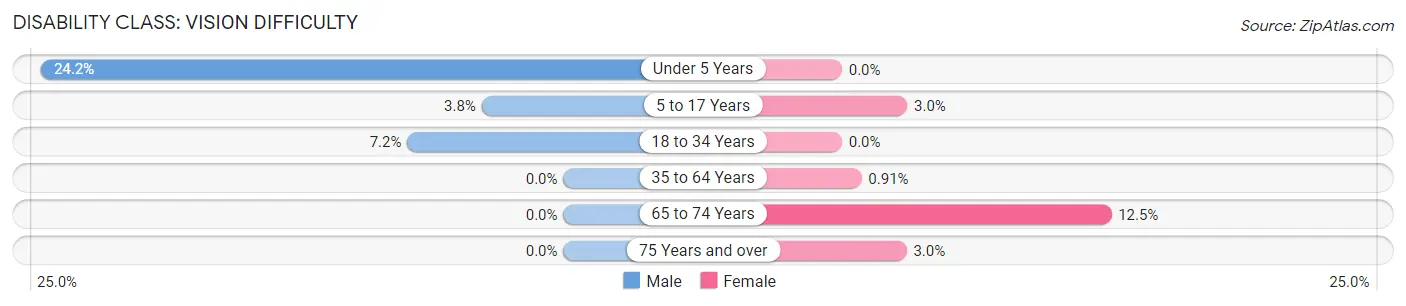
| Age Bracket | Male | Female |
| Under 5 Years | 32 (24.2%) | 0 (0.0%) |
| 5 to 17 Years | 12 (3.8%) | 7 (3.0%) |
| 18 to 34 Years | 36 (7.2%) | 0 (0.0%) |
| 35 to 64 Years | 0 (0.0%) | 4 (0.9%) |
| 65 to 74 Years | 0 (0.0%) | 11 (12.5%) |
| 75 Years and over | 0 (0.0%) | 3 (3.0%) |
Disability Class: Cognitive Difficulty
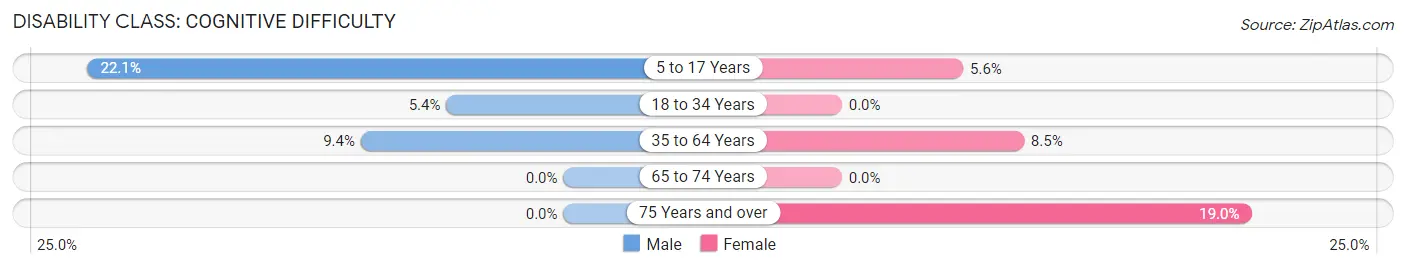
| Age Bracket | Male | Female |
| 5 to 17 Years | 70 (22.1%) | 13 (5.6%) |
| 18 to 34 Years | 27 (5.4%) | 0 (0.0%) |
| 35 to 64 Years | 30 (9.4%) | 37 (8.5%) |
| 65 to 74 Years | 0 (0.0%) | 0 (0.0%) |
| 75 Years and over | 0 (0.0%) | 19 (19.0%) |
Disability Class: Ambulatory Difficulty
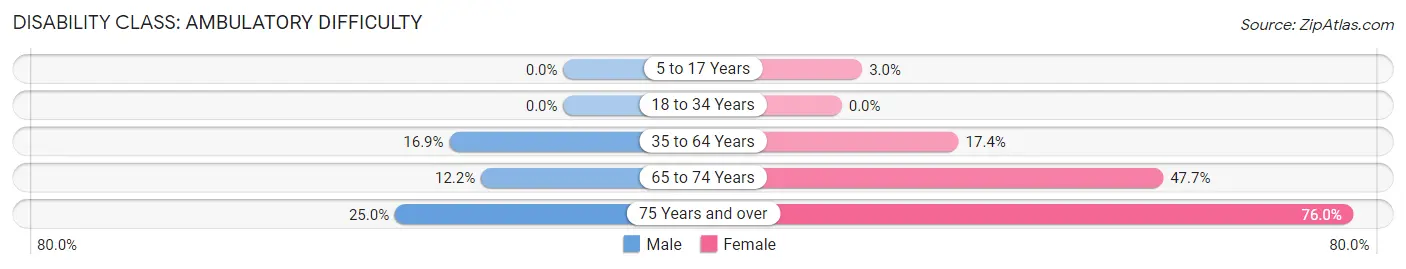
| Age Bracket | Male | Female |
| 5 to 17 Years | 0 (0.0%) | 7 (3.0%) |
| 18 to 34 Years | 0 (0.0%) | 0 (0.0%) |
| 35 to 64 Years | 54 (16.9%) | 76 (17.3%) |
| 65 to 74 Years | 11 (12.2%) | 42 (47.7%) |
| 75 Years and over | 3 (25.0%) | 76 (76.0%) |
Disability Class: Self-Care Difficulty
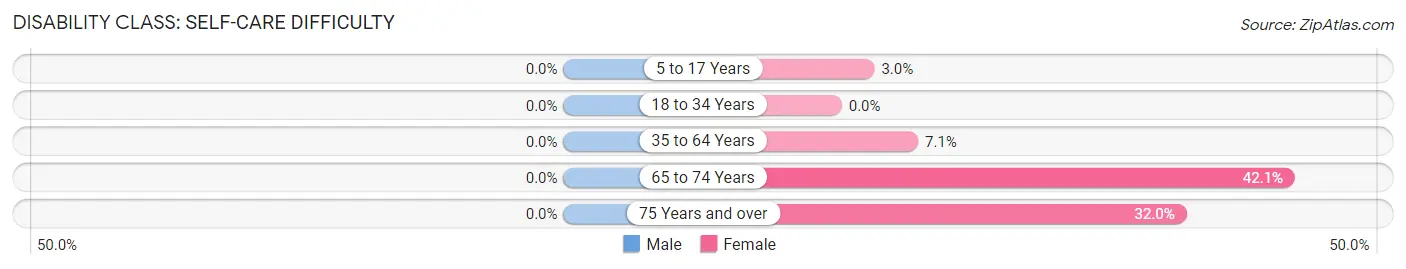
| Age Bracket | Male | Female |
| 5 to 17 Years | 0 (0.0%) | 7 (3.0%) |
| 18 to 34 Years | 0 (0.0%) | 0 (0.0%) |
| 35 to 64 Years | 0 (0.0%) | 31 (7.1%) |
| 65 to 74 Years | 0 (0.0%) | 37 (42.0%) |
| 75 Years and over | 0 (0.0%) | 32 (32.0%) |
Technology Access in Charleston
Computing Device Access in Charleston
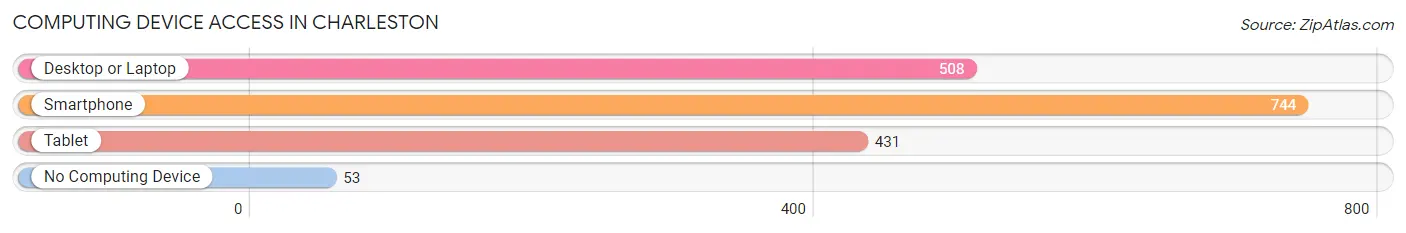
| Device Type | # Households | % Households |
| Desktop or Laptop | 508 | 60.6% |
| Smartphone | 744 | 88.8% |
| Tablet | 431 | 51.4% |
| No Computing Device | 53 | 6.3% |
| Total | 838 | 100.0% |
Internet Access in Charleston
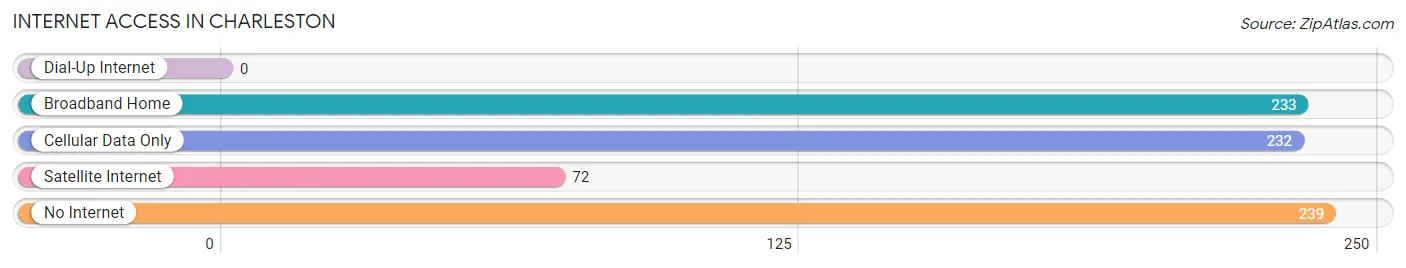
| Internet Type | # Households | % Households |
| Dial-Up Internet | 0 | 0.0% |
| Broadband Home | 233 | 27.8% |
| Cellular Data Only | 232 | 27.7% |
| Satellite Internet | 72 | 8.6% |
| No Internet | 239 | 28.5% |
| Total | 838 | 100.0% |
Charleston Summary
Charleston, Mississippi is a small town located in the northeastern corner of the state, in Tallahatchie County. It is situated on the banks of the Tallahatchie River, and is home to a population of approximately 1,500 people. The town was founded in 1837, and has a rich history that is deeply rooted in the Civil War and the civil rights movement.
Geography
Charleston is located in the northeastern corner of Mississippi, in Tallahatchie County. It is situated on the banks of the Tallahatchie River, and is surrounded by rolling hills and lush forests. The town is located approximately 30 miles south of Memphis, Tennessee, and is accessible by US Highway 61.
Economy
The economy of Charleston is largely based on agriculture and timber production. The town is home to several large farms, and the surrounding area is known for its cotton, soybean, and corn production. In addition, the town is home to several small businesses, including a grocery store, a hardware store, and a few restaurants.
Demographics
As of the 2010 census, the population of Charleston was 1,500 people. The racial makeup of the town was 79.2% African American, 19.2% White, 0.7% Native American, and 0.9% from other races. The median household income was $25,000, and the median age was 37.
History
Charleston was founded in 1837, and was named after Charles Meriwether, a prominent local landowner. The town was an important trading center during the Civil War, and was the site of several battles. After the war, the town became a center of the civil rights movement, and was the site of several protests and marches. In the late 1960s, the town was the site of the trial of James Meredith, the first African American to attend the University of Mississippi.
Today, Charleston is a small, quiet town that is home to a diverse population. The town is known for its rich history and its commitment to preserving its heritage. The town is home to several historic sites, including the Tallahatchie County Courthouse, the Tallahatchie County Museum, and the Charleston Historic District. The town is also home to several churches, including the First Baptist Church of Charleston, which was founded in 1837.
Common Questions
What is Per Capita Income in Charleston?
Per Capita income in Charleston is $17,154.
What is the Median Family Income in Charleston?
Median Family Income in Charleston is $38,984.
What is the Median Household income in Charleston?
Median Household Income in Charleston is $34,137.
What is Income or Wage Gap in Charleston?
Income or Wage Gap in Charleston is 10.0%.
Women in Charleston earn 90.0 cents for every dollar earned by a man.
What is Inequality or Gini Index in Charleston?
Inequality or Gini Index in Charleston is 0.41.
What is the Total Population of Charleston?
Total Population of Charleston is 2,624.
What is the Total Male Population of Charleston?
Total Male Population of Charleston is 1,401.
What is the Total Female Population of Charleston?
Total Female Population of Charleston is 1,223.
What is the Ratio of Males per 100 Females in Charleston?
There are 114.55 Males per 100 Females in Charleston.
What is the Ratio of Females per 100 Males in Charleston?
There are 87.29 Females per 100 Males in Charleston.
What is the Median Population Age in Charleston?
Median Population Age in Charleston is 31.1 Years.
What is the Average Family Size in Charleston
Average Family Size in Charleston is 4.0 People.
What is the Average Household Size in Charleston
Average Household Size in Charleston is 3.0 People.
How Large is the Labor Force in Charleston?
There are 1,039 People in the Labor Forcein in Charleston.
What is the Percentage of People in the Labor Force in Charleston?
54.2% of People are in the Labor Force in Charleston.
What is the Unemployment Rate in Charleston?
Unemployment Rate in Charleston is 14.8%.