Houston, MS Map & Demographics
Houston Map
Houston Overview
$20,649
PER CAPITA INCOME
$47,543
AVG FAMILY INCOME
$32,410
AVG HOUSEHOLD INCOME
21.3%
WAGE / INCOME GAP [ % ]
78.7¢/ $1
WAGE / INCOME GAP [ $ ]
0.42
INEQUALITY / GINI INDEX
3,762
TOTAL POPULATION
1,610
MALE POPULATION
2,152
FEMALE POPULATION
74.81
MALES / 100 FEMALES
133.66
FEMALES / 100 MALES
46.4
MEDIAN AGE
2.7
AVG FAMILY SIZE
2.1
AVG HOUSEHOLD SIZE
1,543
LABOR FORCE [ PEOPLE ]
49.6%
PERCENT IN LABOR FORCE
3.3%
UNEMPLOYMENT RATE
Houston Zip Codes
Houston Area Codes
Income in Houston
Income Overview in Houston
Per Capita Income in Houston is $20,649, while median incomes of families and households are $47,543 and $32,410 respectively.
| Characteristic | Number | Measure |
| Per Capita Income | 3,762 | $20,649 |
| Median Family Income | 1,044 | $47,543 |
| Mean Family Income | 1,044 | $50,907 |
| Median Household Income | 1,762 | $32,410 |
| Mean Household Income | 1,762 | $41,921 |
| Income Deficit | 1,044 | $0 |
| Wage / Income Gap (%) | 3,762 | 21.30% |
| Wage / Income Gap ($) | 3,762 | 78.70¢ per $1 |
| Gini / Inequality Index | 3,762 | 0.42 |
Earnings by Sex in Houston
Average Earnings in Houston are $28,977, $31,722 for men and $24,964 for women, a difference of 21.3%.
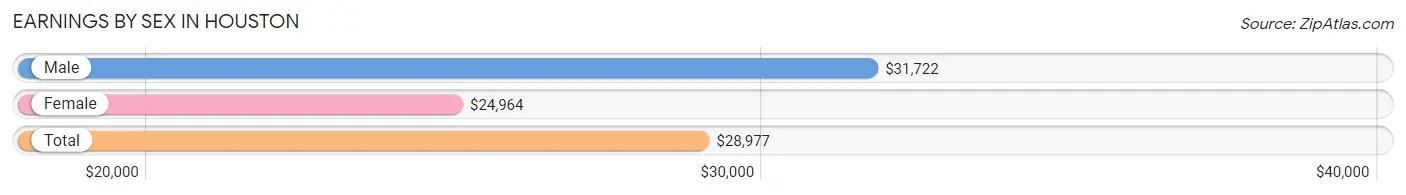
| Sex | Number | Average Earnings |
| Male | 665 (43.2%) | $31,722 |
| Female | 873 (56.8%) | $24,964 |
| Total | 1,538 (100.0%) | $28,977 |
Earnings by Sex by Income Bracket in Houston
The most common earnings brackets in Houston are $50,000 to $54,999 for men (114 | 17.1%) and $30,000 to $34,999 for women (159 | 18.2%).
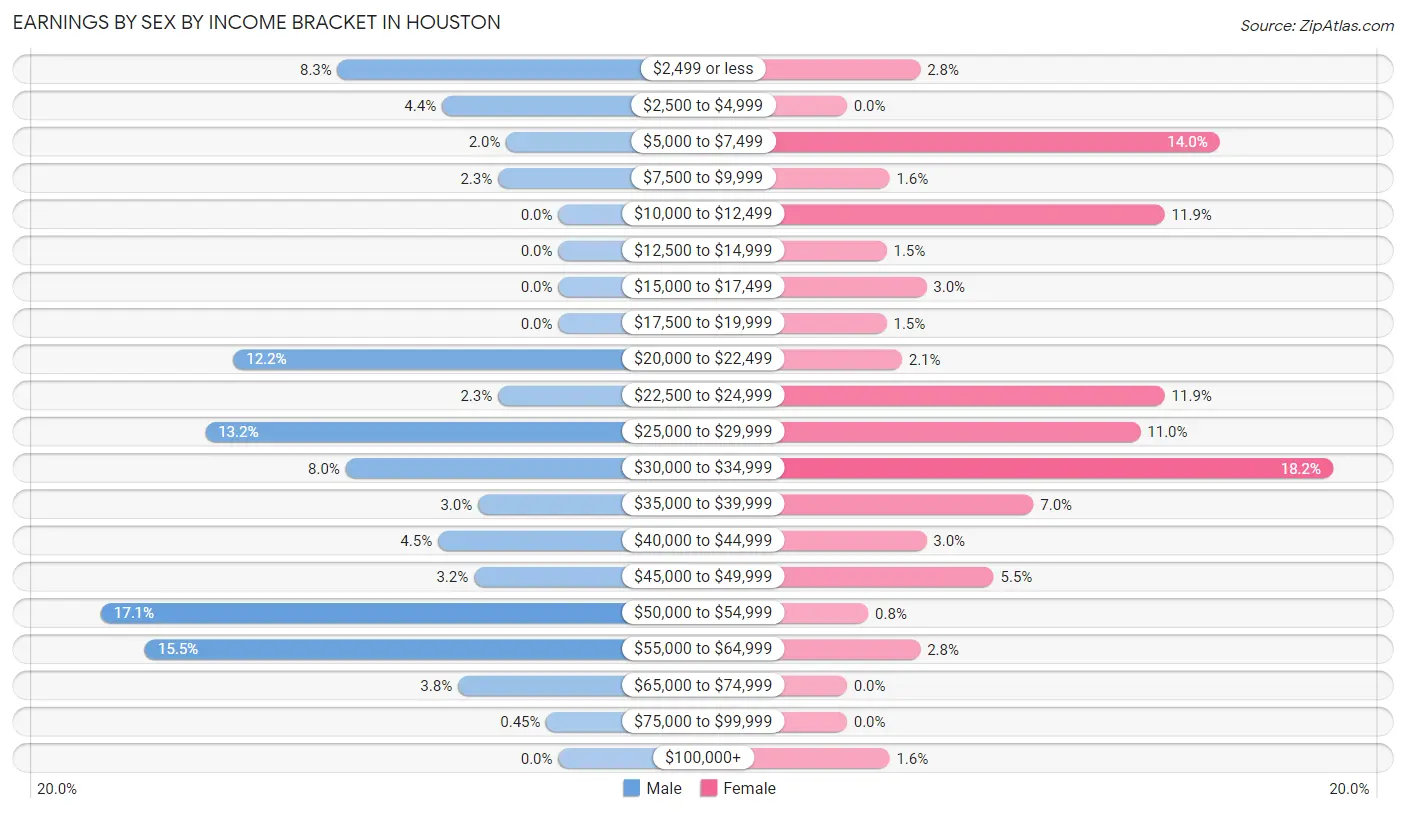
| Income | Male | Female |
| $2,499 or less | 55 (8.3%) | 24 (2.8%) |
| $2,500 to $4,999 | 29 (4.4%) | 0 (0.0%) |
| $5,000 to $7,499 | 13 (1.9%) | 122 (14.0%) |
| $7,500 to $9,999 | 15 (2.3%) | 14 (1.6%) |
| $10,000 to $12,499 | 0 (0.0%) | 104 (11.9%) |
| $12,500 to $14,999 | 0 (0.0%) | 13 (1.5%) |
| $15,000 to $17,499 | 0 (0.0%) | 26 (3.0%) |
| $17,500 to $19,999 | 0 (0.0%) | 13 (1.5%) |
| $20,000 to $22,499 | 81 (12.2%) | 18 (2.1%) |
| $22,500 to $24,999 | 15 (2.3%) | 104 (11.9%) |
| $25,000 to $29,999 | 88 (13.2%) | 96 (11.0%) |
| $30,000 to $34,999 | 53 (8.0%) | 159 (18.2%) |
| $35,000 to $39,999 | 20 (3.0%) | 61 (7.0%) |
| $40,000 to $44,999 | 30 (4.5%) | 26 (3.0%) |
| $45,000 to $49,999 | 21 (3.2%) | 48 (5.5%) |
| $50,000 to $54,999 | 114 (17.1%) | 7 (0.8%) |
| $55,000 to $64,999 | 103 (15.5%) | 24 (2.8%) |
| $65,000 to $74,999 | 25 (3.8%) | 0 (0.0%) |
| $75,000 to $99,999 | 3 (0.4%) | 0 (0.0%) |
| $100,000+ | 0 (0.0%) | 14 (1.6%) |
| Total | 665 (100.0%) | 873 (100.0%) |
Earnings by Sex by Educational Attainment in Houston
Average earnings in Houston are $42,935 for men and $27,725 for women, a difference of 35.4%. Men with an educational attainment of graduate degree enjoy the highest average annual earnings of $62,639, while those with less than high school education earn the least with $29,395. Women with an educational attainment of graduate degree earn the most with the average annual earnings of $34,570, while those with college or associate's degree education have the smallest earnings of $24,052.
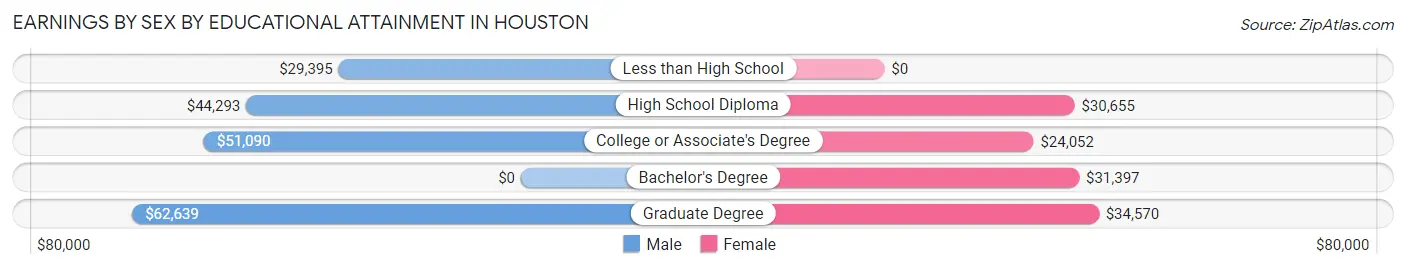
| Educational Attainment | Male Income | Female Income |
| Less than High School | $29,395 | $0 |
| High School Diploma | $44,293 | $30,655 |
| College or Associate's Degree | $51,090 | $24,052 |
| Bachelor's Degree | - | - |
| Graduate Degree | $62,639 | $34,570 |
| Total | $42,935 | $27,725 |
Family Income in Houston
Family Income Brackets in Houston
According to the Houston family income data, there are 228 families falling into the $75,000 to $99,999 income range, which is the most common income bracket and makes up 21.8% of all families.
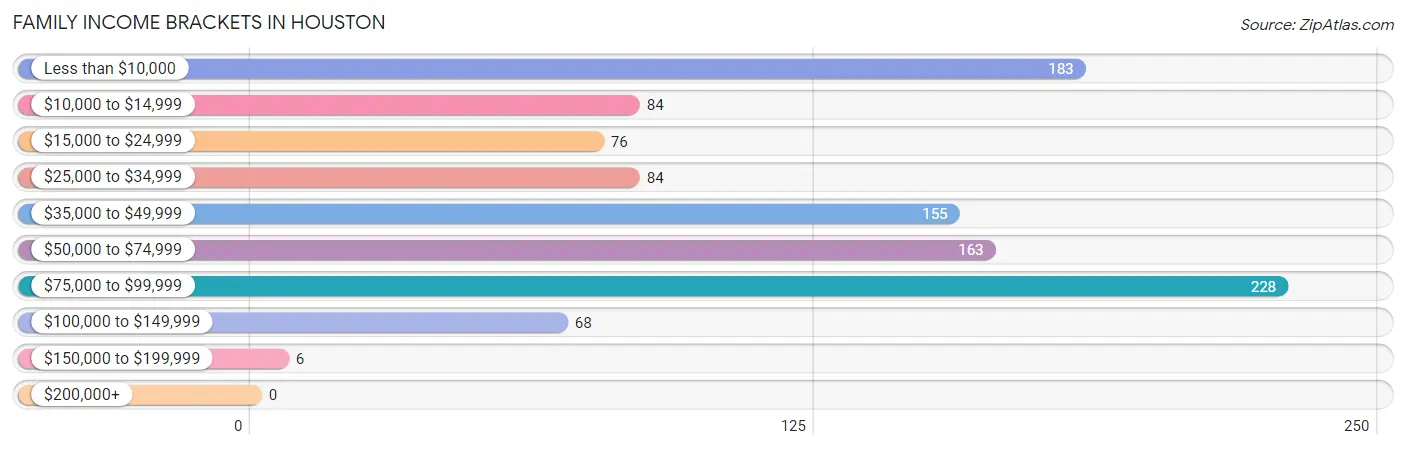
| Income Bracket | # Families | % Families |
| Less than $10,000 | 183 | 17.5% |
| $10,000 to $14,999 | 84 | 8.0% |
| $15,000 to $24,999 | 76 | 7.3% |
| $25,000 to $34,999 | 84 | 8.0% |
| $35,000 to $49,999 | 155 | 14.8% |
| $50,000 to $74,999 | 163 | 15.6% |
| $75,000 to $99,999 | 228 | 21.8% |
| $100,000 to $149,999 | 68 | 6.5% |
| $150,000 to $199,999 | 6 | 0.6% |
| $200,000+ | 0 | 0.0% |
Family Income by Famaliy Size in Houston
4-person families (157 | 15.0%) account for the highest median family income in Houston with $69,281 per family, while 2-person families (569 | 54.5%) have the highest median income of $21,014 per family member.
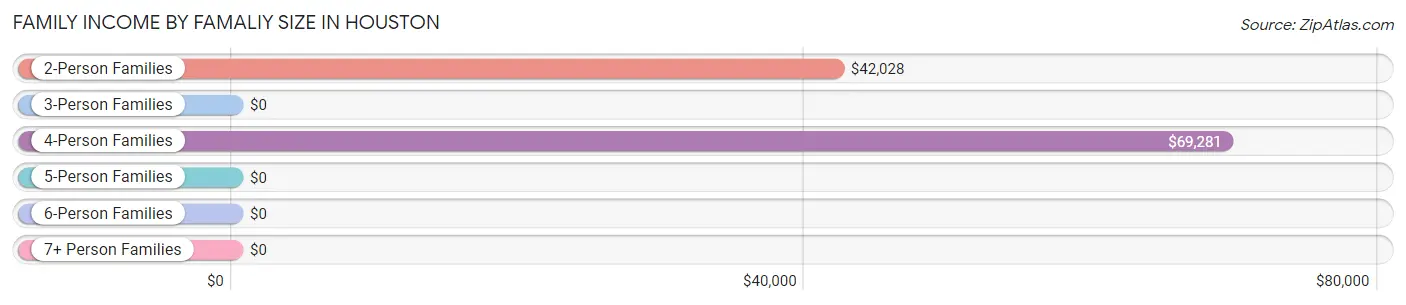
| Income Bracket | # Families | Median Income |
| 2-Person Families | 569 (54.5%) | $42,028 |
| 3-Person Families | 299 (28.6%) | $0 |
| 4-Person Families | 157 (15.0%) | $69,281 |
| 5-Person Families | 19 (1.8%) | $0 |
| 6-Person Families | 0 (0.0%) | $0 |
| 7+ Person Families | 0 (0.0%) | $0 |
| Total | 1,044 (100.0%) | $47,543 |
Family Income by Number of Earners in Houston
The median family income in Houston is $47,543, with families comprising 3+ earners (50) having the highest median family income of $97,619, while families with no earners (308) have the lowest median family income of $10,265, accounting for 4.8% and 29.5% of families, respectively.
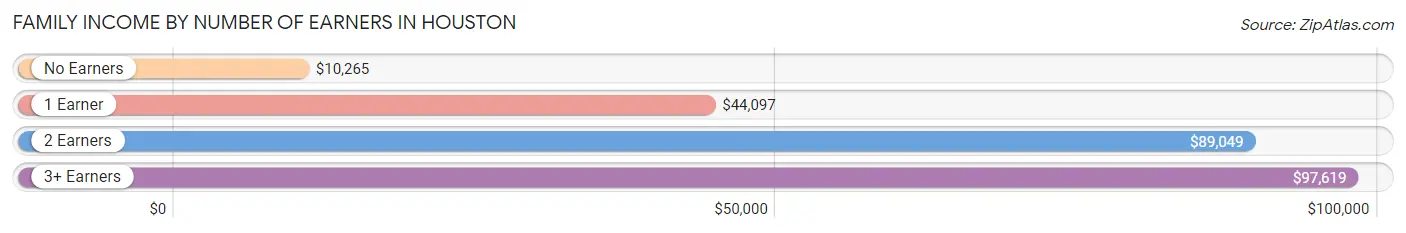
| Number of Earners | # Families | Median Income |
| No Earners | 308 (29.5%) | $10,265 |
| 1 Earner | 421 (40.3%) | $44,097 |
| 2 Earners | 265 (25.4%) | $89,049 |
| 3+ Earners | 50 (4.8%) | $97,619 |
| Total | 1,044 (100.0%) | $47,543 |
Household Income in Houston
Household Income Brackets in Houston
With 331 households falling in the category, the $15,000 to $24,999 income range is the most frequent in Houston, accounting for 18.8% of all households.
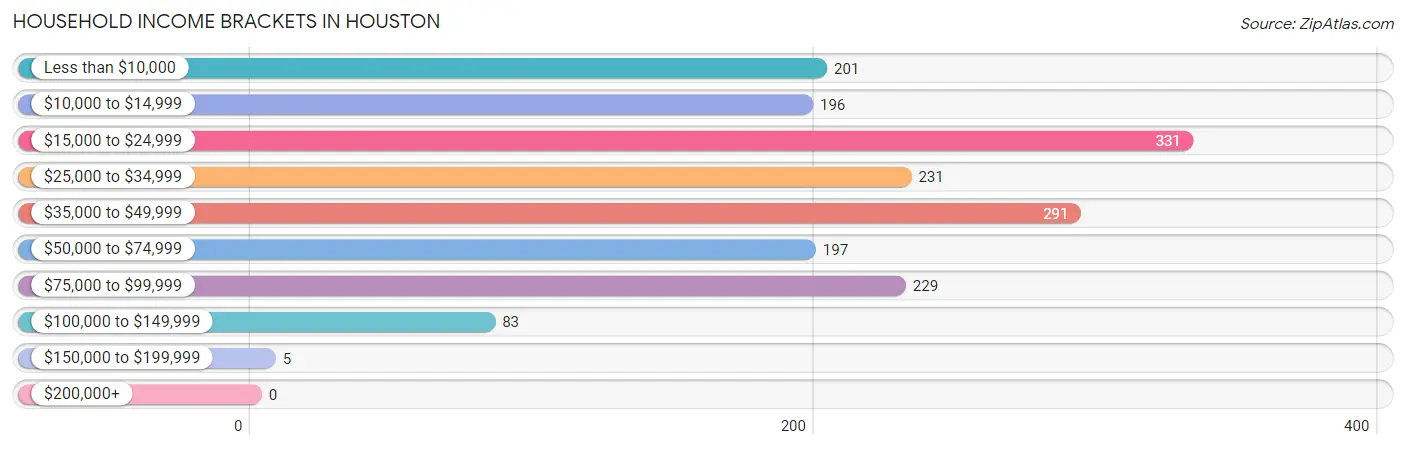
| Income Bracket | # Households | % Households |
| Less than $10,000 | 201 | 11.4% |
| $10,000 to $14,999 | 196 | 11.1% |
| $15,000 to $24,999 | 331 | 18.8% |
| $25,000 to $34,999 | 231 | 13.1% |
| $35,000 to $49,999 | 291 | 16.5% |
| $50,000 to $74,999 | 197 | 11.2% |
| $75,000 to $99,999 | 229 | 13.0% |
| $100,000 to $149,999 | 83 | 4.7% |
| $150,000 to $199,999 | 5 | 0.3% |
| $200,000+ | 0 | 0.0% |
Household Income by Householder Age in Houston
The median household income in Houston is $32,410, with the highest median household income of $41,795 found in the 45 to 64 years age bracket for the primary householder. A total of 542 households (30.8%) fall into this category. Meanwhile, the 15 to 24 years age bracket for the primary householder has the lowest median household income of $20,556, with 168 households (9.5%) in this group.
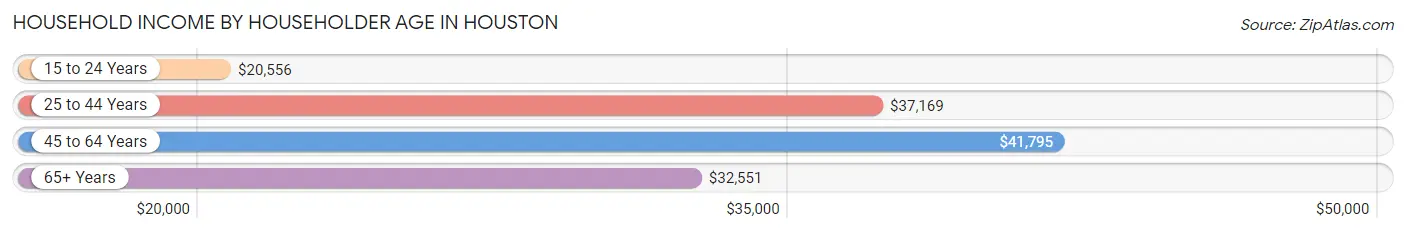
| Income Bracket | # Households | Median Income |
| 15 to 24 Years | 168 (9.5%) | $20,556 |
| 25 to 44 Years | 393 (22.3%) | $37,169 |
| 45 to 64 Years | 542 (30.8%) | $41,795 |
| 65+ Years | 659 (37.4%) | $32,551 |
| Total | 1,762 (100.0%) | $32,410 |
Poverty in Houston
Income Below Poverty by Sex and Age in Houston
With 23.3% poverty level for males and 33.0% for females among the residents of Houston, 75 year old and over males and under 5 year old females are the most vulnerable to poverty, with 109 males (76.8%) and 67 females (100.0%) in their respective age groups living below the poverty level.
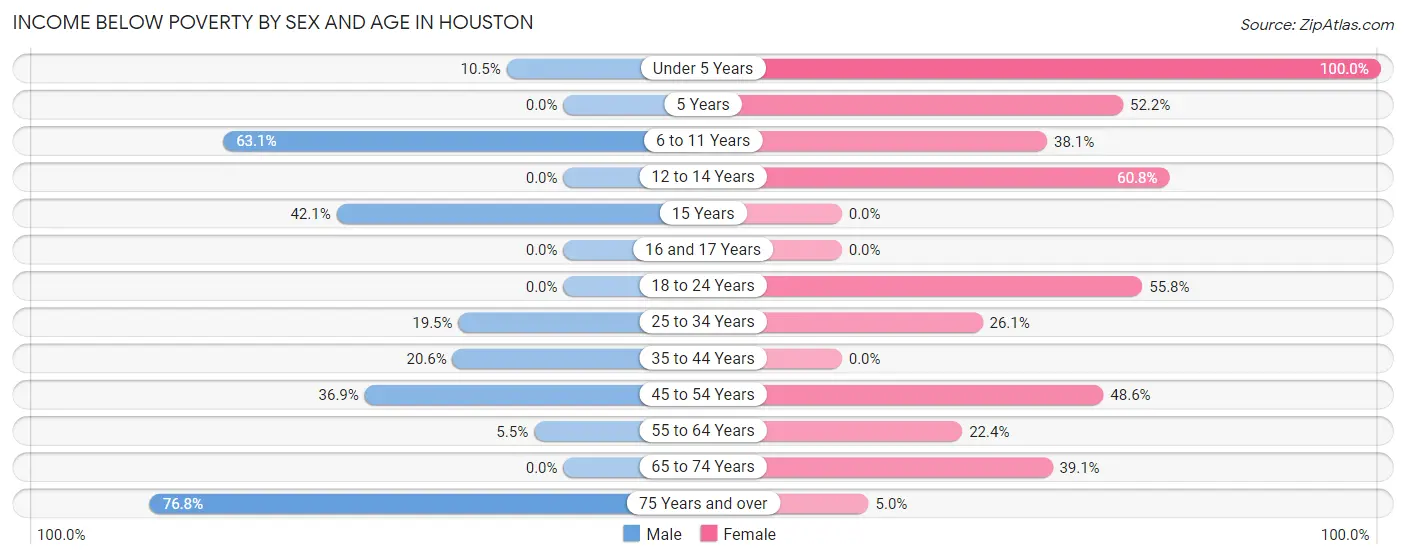
| Age Bracket | Male | Female |
| Under 5 Years | 6 (10.5%) | 67 (100.0%) |
| 5 Years | 0 (0.0%) | 59 (52.2%) |
| 6 to 11 Years | 89 (63.1%) | 40 (38.1%) |
| 12 to 14 Years | 0 (0.0%) | 31 (60.8%) |
| 15 Years | 8 (42.1%) | 0 (0.0%) |
| 16 and 17 Years | 0 (0.0%) | 0 (0.0%) |
| 18 to 24 Years | 0 (0.0%) | 106 (55.8%) |
| 25 to 34 Years | 38 (19.5%) | 76 (26.1%) |
| 35 to 44 Years | 22 (20.6%) | 0 (0.0%) |
| 45 to 54 Years | 83 (36.9%) | 101 (48.6%) |
| 55 to 64 Years | 12 (5.4%) | 55 (22.4%) |
| 65 to 74 Years | 0 (0.0%) | 147 (39.1%) |
| 75 Years and over | 109 (76.8%) | 12 (5.0%) |
| Total | 367 (23.3%) | 694 (33.0%) |
Income Above Poverty by Sex and Age in Houston
According to the poverty statistics in Houston, males aged 5 years and females aged 15 years are the age groups that are most secure financially, with 100.0% of males and 100.0% of females in these age groups living above the poverty line.
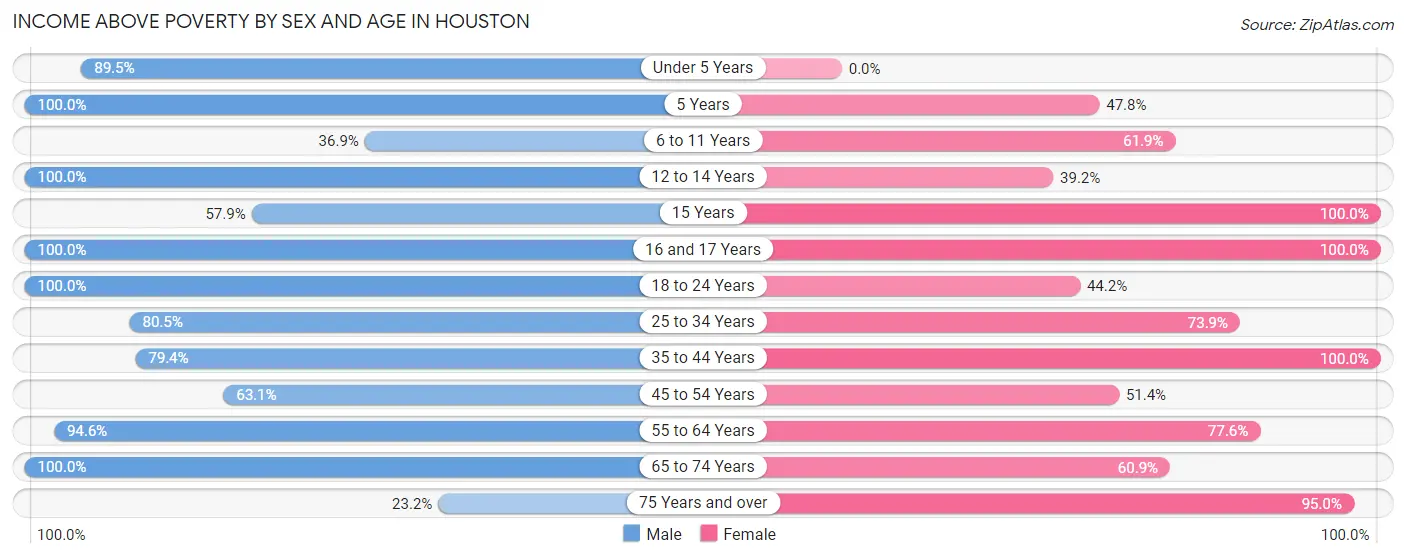
| Age Bracket | Male | Female |
| Under 5 Years | 51 (89.5%) | 0 (0.0%) |
| 5 Years | 32 (100.0%) | 54 (47.8%) |
| 6 to 11 Years | 52 (36.9%) | 65 (61.9%) |
| 12 to 14 Years | 29 (100.0%) | 20 (39.2%) |
| 15 Years | 11 (57.9%) | 37 (100.0%) |
| 16 and 17 Years | 24 (100.0%) | 15 (100.0%) |
| 18 to 24 Years | 160 (100.0%) | 84 (44.2%) |
| 25 to 34 Years | 157 (80.5%) | 215 (73.9%) |
| 35 to 44 Years | 85 (79.4%) | 165 (100.0%) |
| 45 to 54 Years | 142 (63.1%) | 107 (51.4%) |
| 55 to 64 Years | 208 (94.6%) | 191 (77.6%) |
| 65 to 74 Years | 227 (100.0%) | 229 (60.9%) |
| 75 Years and over | 33 (23.2%) | 229 (95.0%) |
| Total | 1,211 (76.7%) | 1,411 (67.0%) |
Income Below Poverty Among Married-Couple Families in Houston
The poverty statistics for married-couple families in Houston show that 29.2% or 159 of the total 545 families live below the poverty line. Families with no children have the highest poverty rate of 39.8%, comprising of 159 families. On the other hand, families with 1 or 2 children have the lowest poverty rate of 0.0%, which includes 0 families.
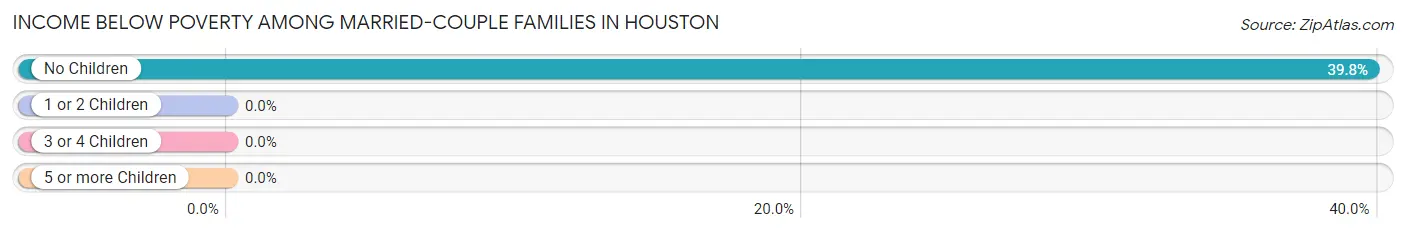
| Children | Above Poverty | Below Poverty |
| No Children | 241 (60.3%) | 159 (39.8%) |
| 1 or 2 Children | 126 (100.0%) | 0 (0.0%) |
| 3 or 4 Children | 19 (100.0%) | 0 (0.0%) |
| 5 or more Children | 0 (0.0%) | 0 (0.0%) |
| Total | 386 (70.8%) | 159 (29.2%) |
Income Below Poverty Among Single-Parent Households in Houston
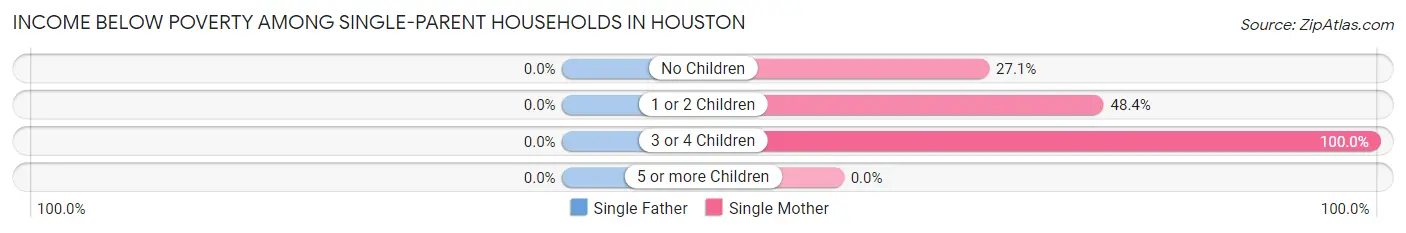
| Children | Single Father | Single Mother |
| No Children | 0 (0.0%) | 42 (27.1%) |
| 1 or 2 Children | 0 (0.0%) | 107 (48.4%) |
| 3 or 4 Children | 0 (0.0%) | 34 (100.0%) |
| 5 or more Children | 0 (0.0%) | 0 (0.0%) |
| Total | 0 (0.0%) | 183 (44.6%) |
Income Below Poverty Among Married-Couple vs Single-Parent Households in Houston
The poverty data for Houston shows that 159 of the married-couple family households (29.2%) and 183 of the single-parent households (36.7%) are living below the poverty level. Within the married-couple family households, those with no children have the highest poverty rate, with 159 households (39.8%) falling below the poverty line. Among the single-parent households, those with 3 or 4 children have the highest poverty rate, with 34 household (89.5%) living below poverty.
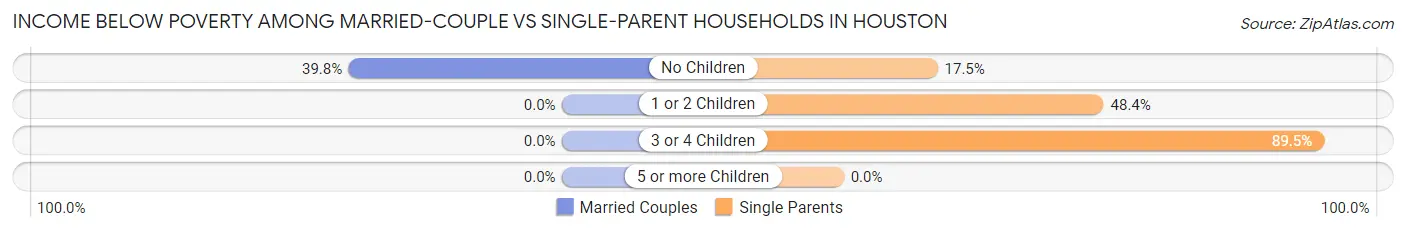
| Children | Married-Couple Families | Single-Parent Households |
| No Children | 159 (39.8%) | 42 (17.5%) |
| 1 or 2 Children | 0 (0.0%) | 107 (48.4%) |
| 3 or 4 Children | 0 (0.0%) | 34 (89.5%) |
| 5 or more Children | 0 (0.0%) | 0 (0.0%) |
| Total | 159 (29.2%) | 183 (36.7%) |
Race in Houston
The most populous races in Houston are White / Caucasian (1,998 | 53.1%), Black / African American (1,500 | 39.9%), and Two or more Races (241 | 6.4%).
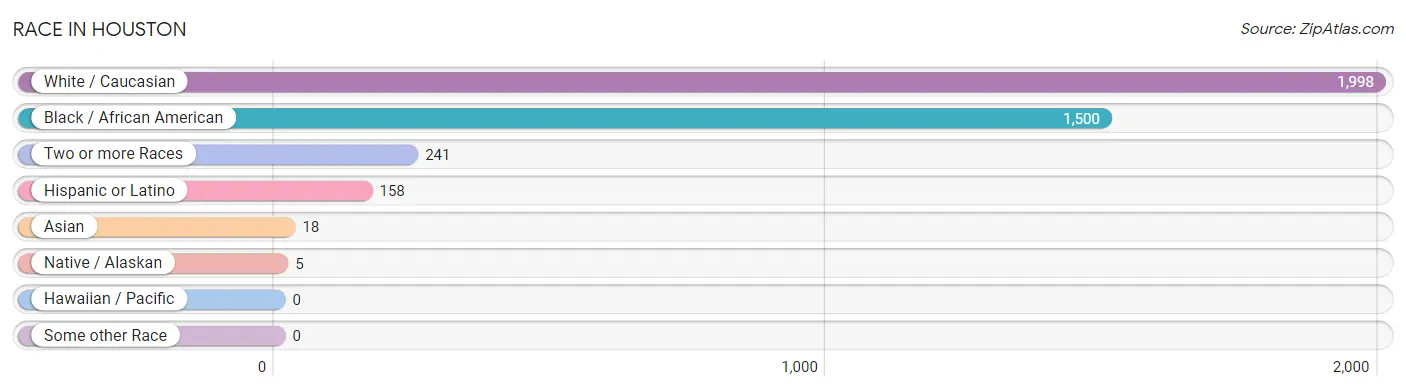
| Race | # Population | % Population |
| Asian | 18 | 0.5% |
| Black / African American | 1,500 | 39.9% |
| Hawaiian / Pacific | 0 | 0.0% |
| Hispanic or Latino | 158 | 4.2% |
| Native / Alaskan | 5 | 0.1% |
| White / Caucasian | 1,998 | 53.1% |
| Two or more Races | 241 | 6.4% |
| Some other Race | 0 | 0.0% |
| Total | 3,762 | 100.0% |
Ancestry in Houston
The most populous ancestries reported in Houston are American (520 | 13.8%), English (273 | 7.3%), Irish (206 | 5.5%), Mexican (158 | 4.2%), and German (142 | 3.8%), together accounting for 34.5% of all Houston residents.
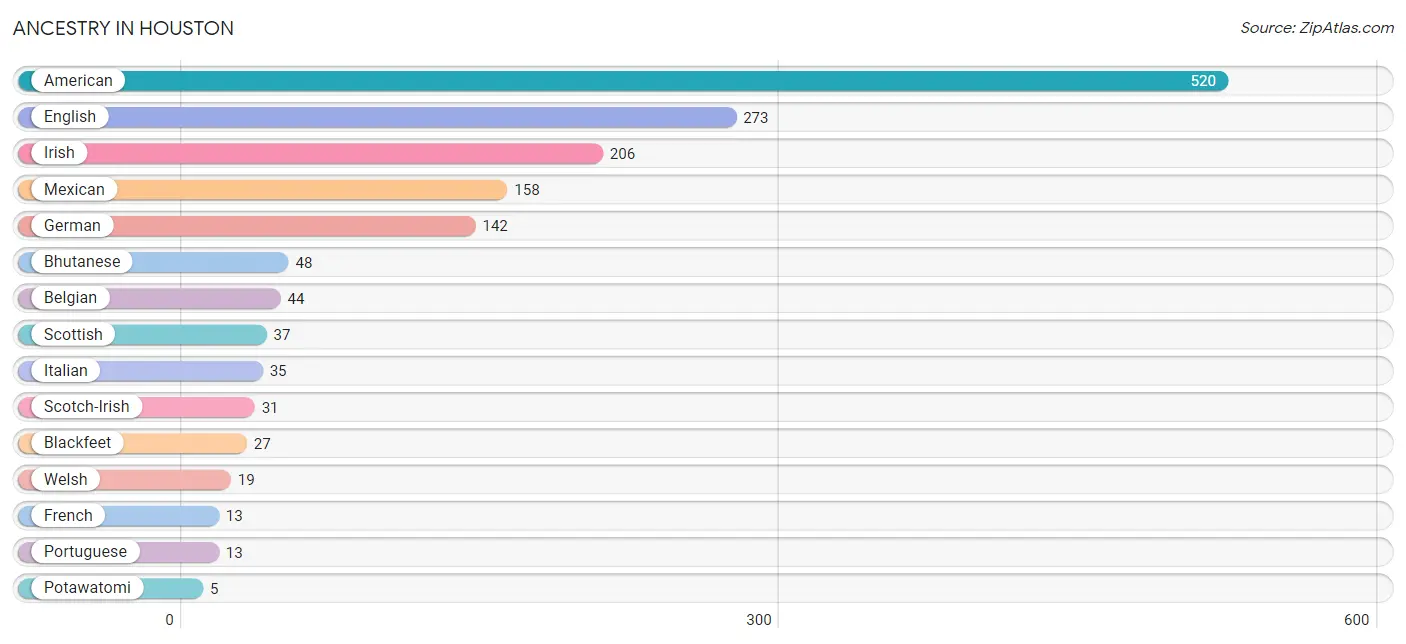
| Ancestry | # Population | % Population |
| American | 520 | 13.8% |
| Belgian | 44 | 1.2% |
| Bhutanese | 48 | 1.3% |
| Blackfeet | 27 | 0.7% |
| English | 273 | 7.3% |
| French | 13 | 0.4% |
| German | 142 | 3.8% |
| Irish | 206 | 5.5% |
| Italian | 35 | 0.9% |
| Mexican | 158 | 4.2% |
| Portuguese | 13 | 0.4% |
| Potawatomi | 5 | 0.1% |
| Russian | 4 | 0.1% |
| Scotch-Irish | 31 | 0.8% |
| Scottish | 37 | 1.0% |
| Welsh | 19 | 0.5% | View All 16 Rows |
Immigrants in Houston
The most numerous immigrant groups reported in Houston came from Central America (149 | 4.0%), Latin America (149 | 4.0%), Mexico (92 | 2.5%), Honduras (57 | 1.5%), and Asia (18 | 0.5%), together accounting for 12.4% of all Houston residents.
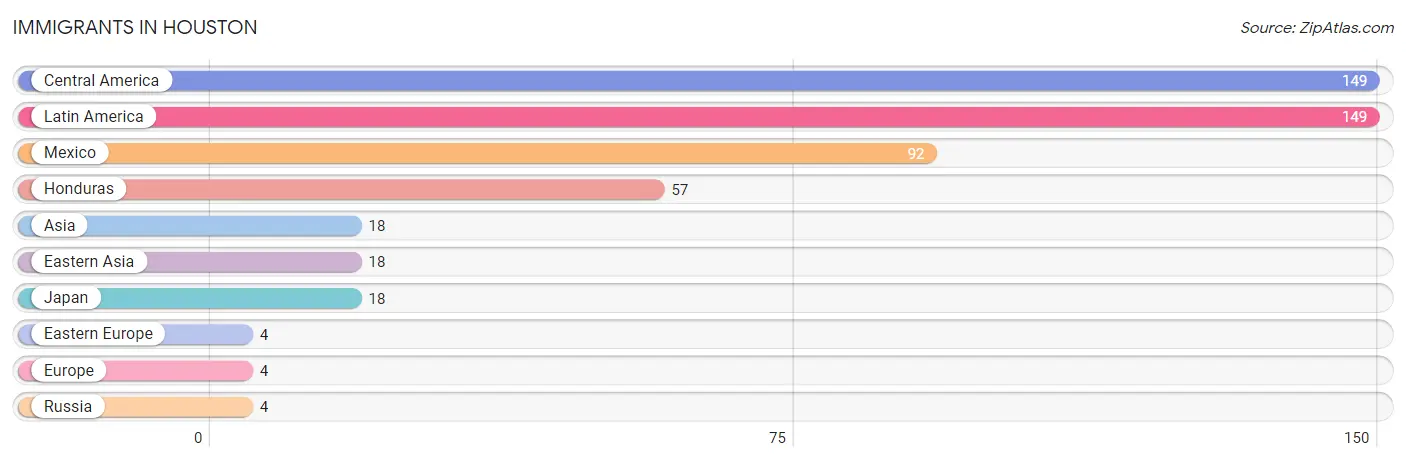
| Immigration Origin | # Population | % Population |
| Asia | 18 | 0.5% |
| Central America | 149 | 4.0% |
| Eastern Asia | 18 | 0.5% |
| Eastern Europe | 4 | 0.1% |
| Europe | 4 | 0.1% |
| Honduras | 57 | 1.5% |
| Japan | 18 | 0.5% |
| Latin America | 149 | 4.0% |
| Mexico | 92 | 2.5% |
| Russia | 4 | 0.1% | View All 10 Rows |
Sex and Age in Houston
Sex and Age in Houston
The most populous age groups in Houston are 65 to 69 Years (172 | 10.7%) for men and 5 to 9 Years (211 | 9.8%) for women.
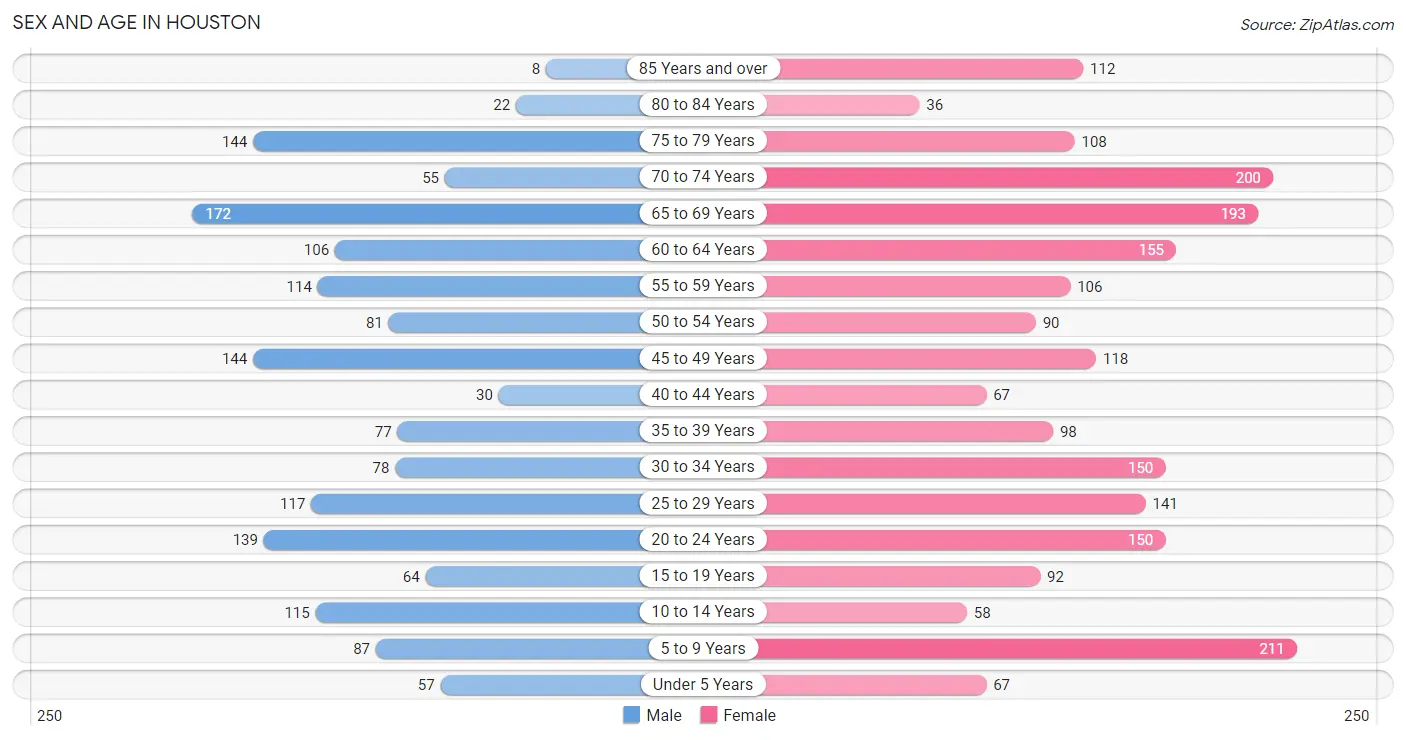
| Age Bracket | Male | Female |
| Under 5 Years | 57 (3.5%) | 67 (3.1%) |
| 5 to 9 Years | 87 (5.4%) | 211 (9.8%) |
| 10 to 14 Years | 115 (7.1%) | 58 (2.7%) |
| 15 to 19 Years | 64 (4.0%) | 92 (4.3%) |
| 20 to 24 Years | 139 (8.6%) | 150 (7.0%) |
| 25 to 29 Years | 117 (7.3%) | 141 (6.6%) |
| 30 to 34 Years | 78 (4.8%) | 150 (7.0%) |
| 35 to 39 Years | 77 (4.8%) | 98 (4.5%) |
| 40 to 44 Years | 30 (1.9%) | 67 (3.1%) |
| 45 to 49 Years | 144 (8.9%) | 118 (5.5%) |
| 50 to 54 Years | 81 (5.0%) | 90 (4.2%) |
| 55 to 59 Years | 114 (7.1%) | 106 (4.9%) |
| 60 to 64 Years | 106 (6.6%) | 155 (7.2%) |
| 65 to 69 Years | 172 (10.7%) | 193 (9.0%) |
| 70 to 74 Years | 55 (3.4%) | 200 (9.3%) |
| 75 to 79 Years | 144 (8.9%) | 108 (5.0%) |
| 80 to 84 Years | 22 (1.4%) | 36 (1.7%) |
| 85 Years and over | 8 (0.5%) | 112 (5.2%) |
| Total | 1,610 (100.0%) | 2,152 (100.0%) |
Families and Households in Houston
Median Family Size in Houston
The median family size in Houston is 2.71 persons per family, with single female/mother families (410 | 39.3%) accounting for the largest median family size of 2.86 persons per family. On the other hand, single male/father families (89 | 8.5%) represent the smallest median family size with 2.24 persons per family.
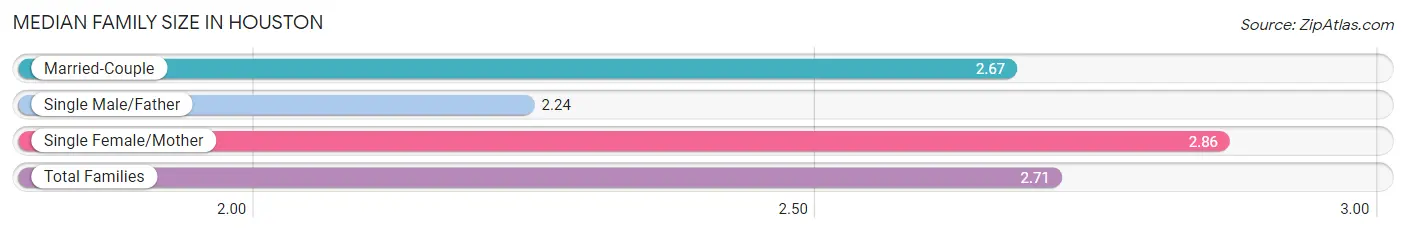
| Family Type | # Families | Family Size |
| Married-Couple | 545 (52.2%) | 2.67 |
| Single Male/Father | 89 (8.5%) | 2.24 |
| Single Female/Mother | 410 (39.3%) | 2.86 |
| Total Families | 1,044 (100.0%) | 2.71 |
Median Household Size in Houston
The median household size in Houston is 2.09 persons per household, with single female/mother households (410 | 23.3%) accounting for the largest median household size of 2.99 persons per household. non-family households (718 | 40.7%) represent the smallest median household size with 1.11 persons per household.
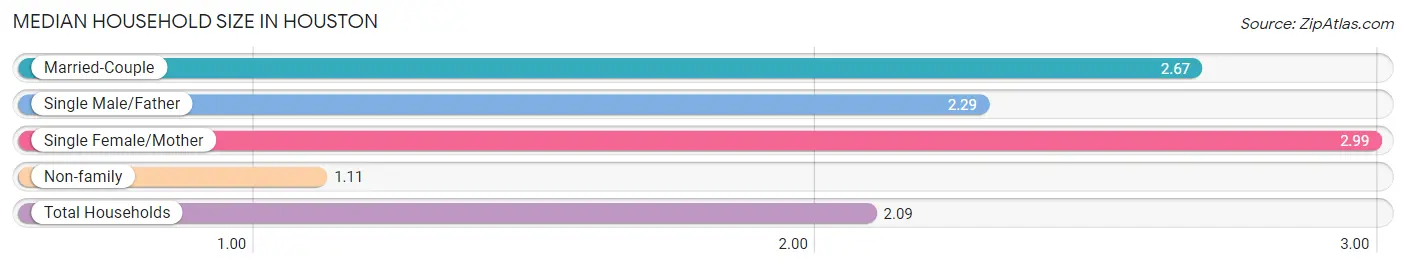
| Household Type | # Households | Household Size |
| Married-Couple | 545 (30.9%) | 2.67 |
| Single Male/Father | 89 (5.1%) | 2.29 |
| Single Female/Mother | 410 (23.3%) | 2.99 |
| Non-family | 718 (40.7%) | 1.11 |
| Total Households | 1,762 (100.0%) | 2.09 |
Household Size by Marriage Status in Houston
Out of a total of 1,762 households in Houston, 1,044 (59.3%) are family households, while 718 (40.7%) are nonfamily households. The most numerous type of family households are 2-person households, comprising 569, and the most common type of nonfamily households are 1-person households, comprising 626.
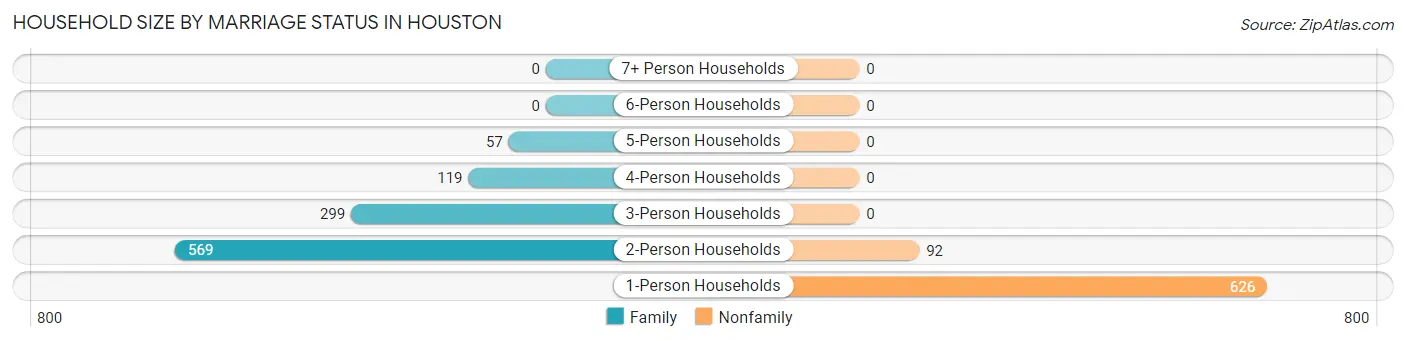
| Household Size | Family Households | Nonfamily Households |
| 1-Person Households | - | 626 (35.5%) |
| 2-Person Households | 569 (32.3%) | 92 (5.2%) |
| 3-Person Households | 299 (17.0%) | 0 (0.0%) |
| 4-Person Households | 119 (6.8%) | 0 (0.0%) |
| 5-Person Households | 57 (3.2%) | 0 (0.0%) |
| 6-Person Households | 0 (0.0%) | 0 (0.0%) |
| 7+ Person Households | 0 (0.0%) | 0 (0.0%) |
| Total | 1,044 (59.3%) | 718 (40.7%) |
Female Fertility in Houston
Fertility by Age in Houston
| Age Bracket | Women with Births | Births / 1,000 Women |
| 15 to 19 years | 0 (0.0%) | 0.0 |
| 20 to 34 years | 0 (0.0%) | 0.0 |
| 35 to 50 years | 0 (0.0%) | 0.0 |
| Total | 0 (0.0%) | 0.0 |
Fertility by Age by Marriage Status in Houston
| Age Bracket | Married | Unmarried |
| 15 to 19 years | 0 (0.0%) | 0 (0.0%) |
| 20 to 34 years | 0 (0.0%) | 0 (0.0%) |
| 35 to 50 years | 0 (0.0%) | 0 (0.0%) |
| Total | 0 (0.0%) | 0 (0.0%) |
Fertility by Education in Houston
| Educational Attainment | Women with Births | Births / 1,000 Women |
| Less than High School | 0 (0.0%) | 0.0 |
| High School Diploma | 0 (0.0%) | 0.0 |
| College or Associate's Degree | 0 (0.0%) | 0.0 |
| Bachelor's Degree | 0 (0.0%) | 0.0 |
| Graduate Degree | 0 (0.0%) | 0.0 |
| Total | 0 (0.0%) | 0.0 |
Fertility by Education by Marriage Status in Houston
| Educational Attainment | Married | Unmarried |
| Less than High School | 0 (0.0%) | 0 (0.0%) |
| High School Diploma | 0 (0.0%) | 0 (0.0%) |
| College or Associate's Degree | 0 (0.0%) | 0 (0.0%) |
| Bachelor's Degree | 0 (0.0%) | 0 (0.0%) |
| Graduate Degree | 0 (0.0%) | 0 (0.0%) |
| Total | 0 (0.0%) | 0 (0.0%) |
Employment Characteristics in Houston
Employment by Class of Employer in Houston
Among the 1,440 employed individuals in Houston, private company employees (1,034 | 71.8%), self-employed (not incorporated) (126 | 8.7%), and local government employees (98 | 6.8%) make up the most common classes of employment.
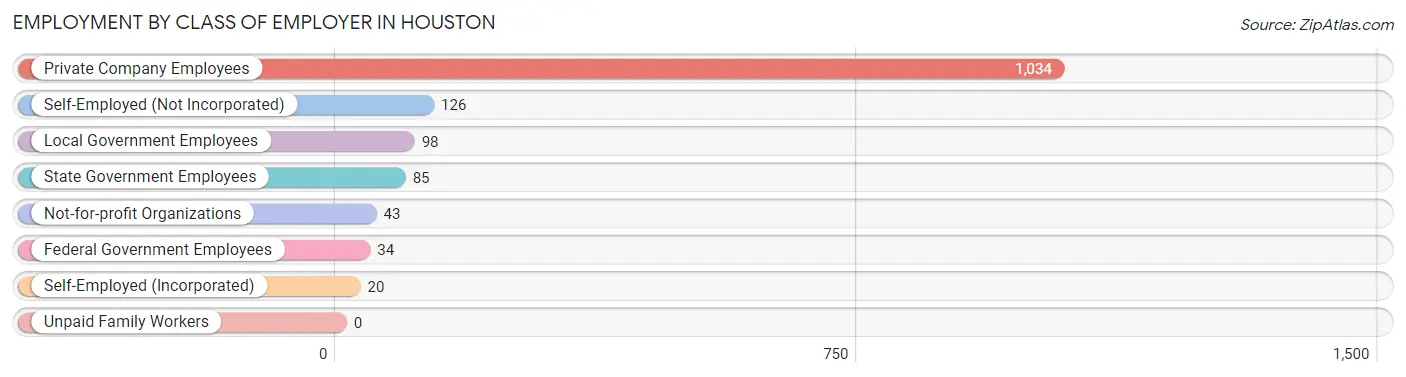
| Employer Class | # Employees | % Employees |
| Private Company Employees | 1,034 | 71.8% |
| Self-Employed (Incorporated) | 20 | 1.4% |
| Self-Employed (Not Incorporated) | 126 | 8.7% |
| Not-for-profit Organizations | 43 | 3.0% |
| Local Government Employees | 98 | 6.8% |
| State Government Employees | 85 | 5.9% |
| Federal Government Employees | 34 | 2.4% |
| Unpaid Family Workers | 0 | 0.0% |
| Total | 1,440 | 100.0% |
Employment Status by Age in Houston
According to the labor force statistics for Houston, out of the total population over 16 years of age (3,111), 49.6% or 1,543 individuals are in the labor force, with 3.3% or 51 of them unemployed. The age group with the highest labor force participation rate is 25 to 29 years, with 100.0% or 258 individuals in the labor force. Within the labor force, the 16 to 19 years age range has the highest percentage of unemployed individuals, with 48.8% or 21 of them being unemployed.
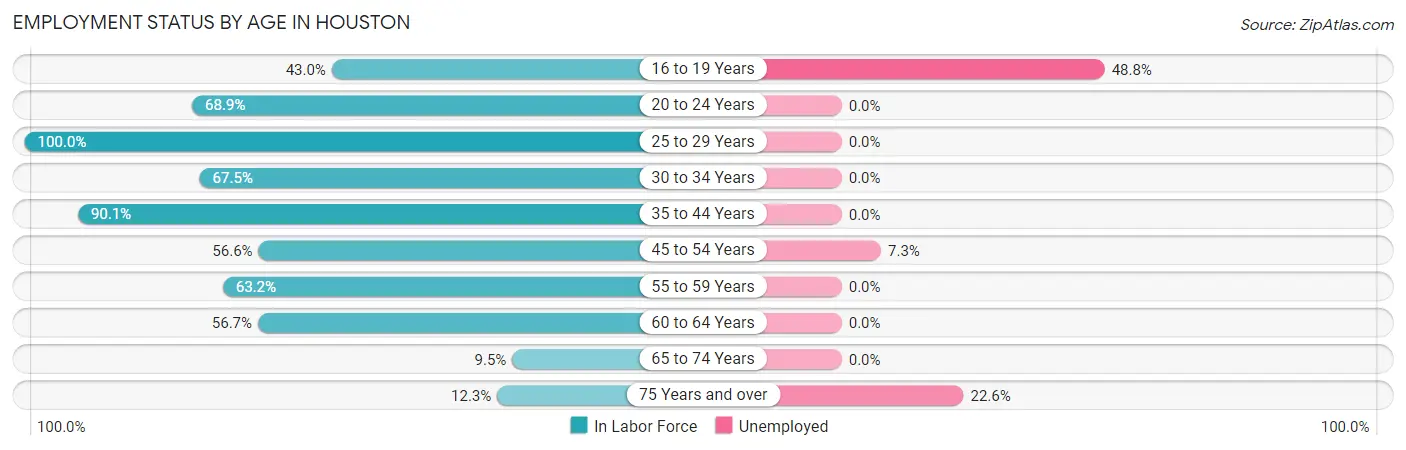
| Age Bracket | In Labor Force | Unemployed |
| 16 to 19 Years | 43 (43.0%) | 21 (48.8%) |
| 20 to 24 Years | 199 (68.9%) | 0 (0.0%) |
| 25 to 29 Years | 258 (100.0%) | 0 (0.0%) |
| 30 to 34 Years | 154 (67.5%) | 0 (0.0%) |
| 35 to 44 Years | 245 (90.1%) | 0 (0.0%) |
| 45 to 54 Years | 245 (56.6%) | 18 (7.3%) |
| 55 to 59 Years | 139 (63.2%) | 0 (0.0%) |
| 60 to 64 Years | 148 (56.7%) | 0 (0.0%) |
| 65 to 74 Years | 59 (9.5%) | 0 (0.0%) |
| 75 Years and over | 53 (12.3%) | 12 (22.6%) |
| Total | 1,543 (49.6%) | 51 (3.3%) |
Employment Status by Educational Attainment in Houston
According to labor force statistics for Houston, 71.1% of individuals (1,189) out of the total population between 25 and 64 years of age (1,672) are in the labor force, with 1.5% or 18 of them being unemployed. The group with the highest labor force participation rate are those with the educational attainment of bachelor's degree or higher, with 94.3% or 249 individuals in the labor force. Within the labor force, individuals with college / associate degree education have the highest percentage of unemployment, with 3.4% or 18 of them being unemployed.
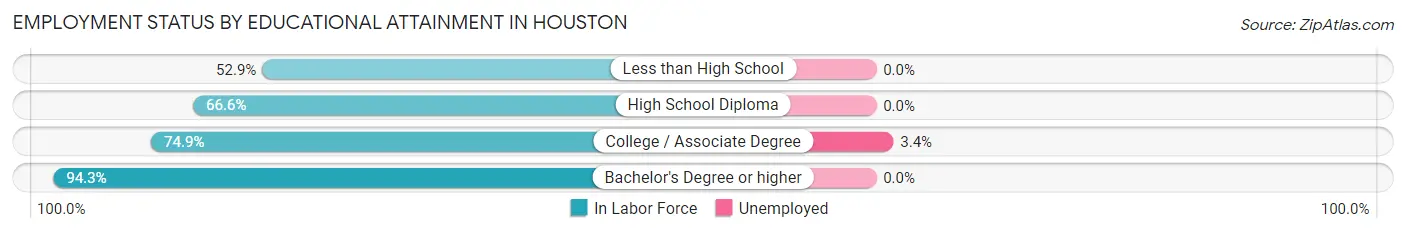
| Educational Attainment | In Labor Force | Unemployed |
| Less than High School | 217 (52.9%) | 0 (0.0%) |
| High School Diploma | 193 (66.6%) | 0 (0.0%) |
| College / Associate Degree | 530 (74.9%) | 24 (3.4%) |
| Bachelor's Degree or higher | 249 (94.3%) | 0 (0.0%) |
| Total | 1,189 (71.1%) | 25 (1.5%) |
Employment Occupations by Sex in Houston
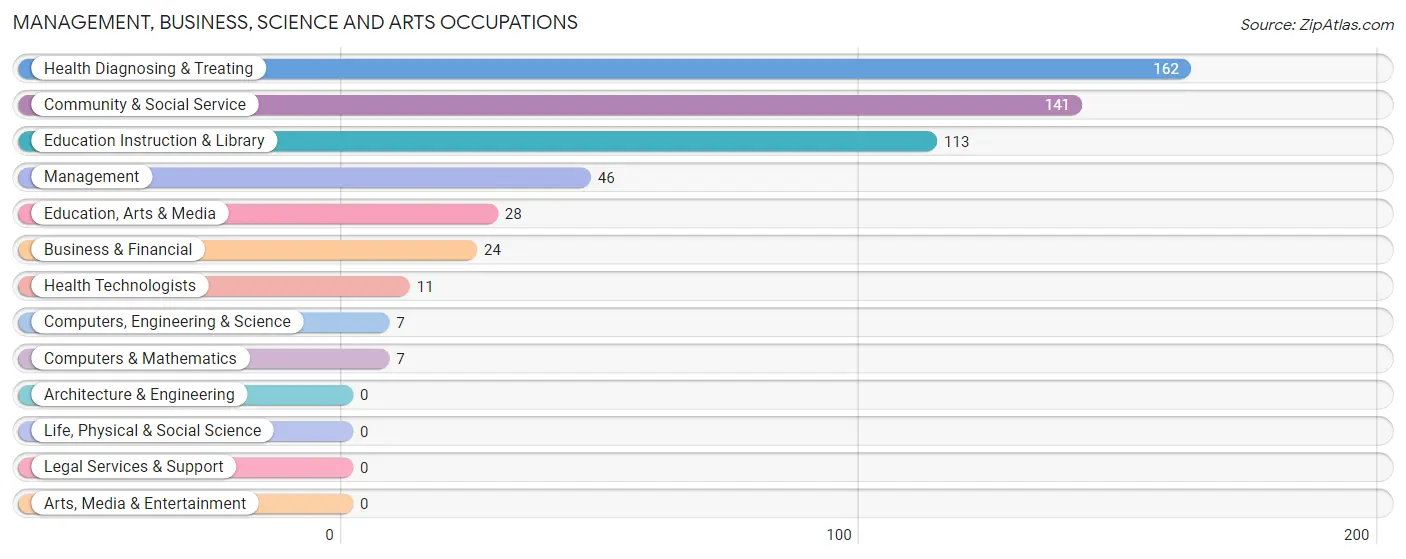
Management, Business, Science and Arts Occupations
The most common Management, Business, Science and Arts occupations in Houston are Health Diagnosing & Treating (162 | 10.9%), Community & Social Service (141 | 9.5%), Education Instruction & Library (113 | 7.6%), Management (46 | 3.1%), and Education, Arts & Media (28 | 1.9%).
Management, Business, Science and Arts Occupations by Sex
Within the Management, Business, Science and Arts occupations in Houston, the most male-oriented occupations are Computers, Engineering & Science (100.0%), Computers & Mathematics (100.0%), and Business & Financial (75.0%), while the most female-oriented occupations are Education, Arts & Media (100.0%), Health Diagnosing & Treating (96.9%), and Community & Social Service (90.1%).
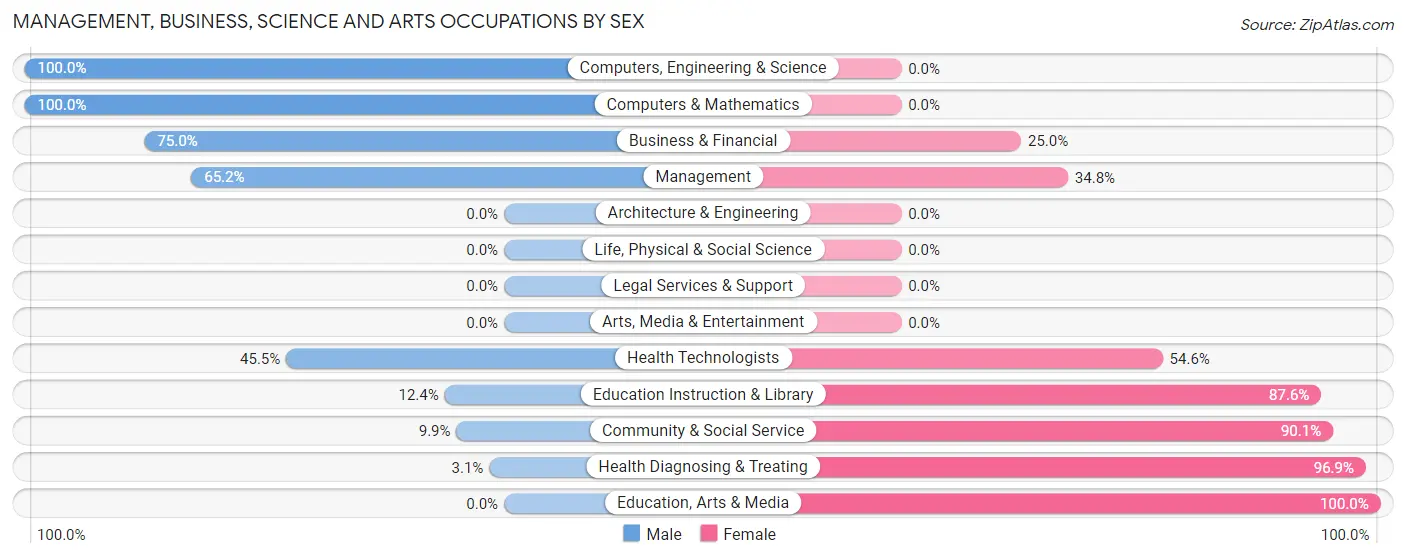
| Occupation | Male | Female |
| Management | 30 (65.2%) | 16 (34.8%) |
| Business & Financial | 18 (75.0%) | 6 (25.0%) |
| Computers, Engineering & Science | 7 (100.0%) | 0 (0.0%) |
| Computers & Mathematics | 7 (100.0%) | 0 (0.0%) |
| Architecture & Engineering | 0 (0.0%) | 0 (0.0%) |
| Life, Physical & Social Science | 0 (0.0%) | 0 (0.0%) |
| Community & Social Service | 14 (9.9%) | 127 (90.1%) |
| Education, Arts & Media | 0 (0.0%) | 28 (100.0%) |
| Legal Services & Support | 0 (0.0%) | 0 (0.0%) |
| Education Instruction & Library | 14 (12.4%) | 99 (87.6%) |
| Arts, Media & Entertainment | 0 (0.0%) | 0 (0.0%) |
| Health Diagnosing & Treating | 5 (3.1%) | 157 (96.9%) |
| Health Technologists | 5 (45.5%) | 6 (54.5%) |
| Total (Category) | 74 (19.5%) | 306 (80.5%) |
| Total (Overall) | 647 (43.4%) | 845 (56.6%) |
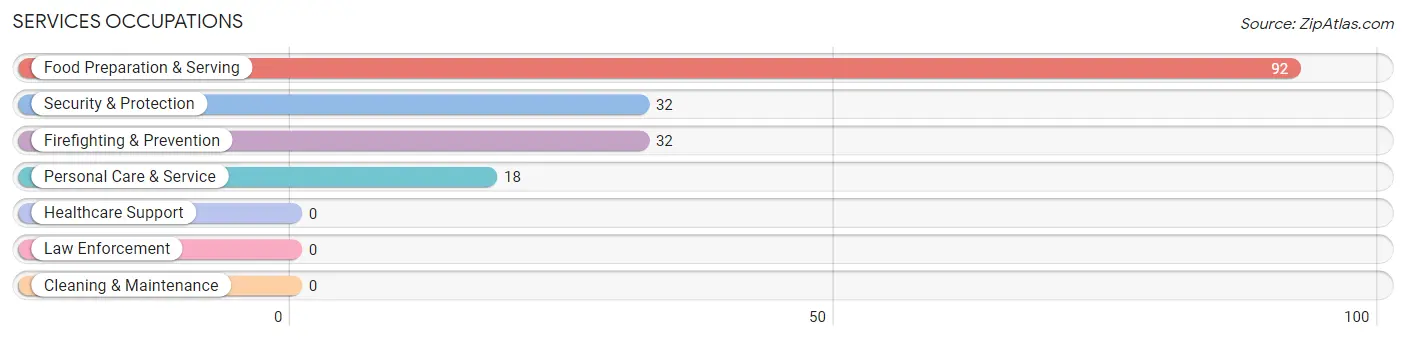
Services Occupations
The most common Services occupations in Houston are Food Preparation & Serving (92 | 6.2%), Security & Protection (32 | 2.1%), Firefighting & Prevention (32 | 2.1%), and Personal Care & Service (18 | 1.2%).
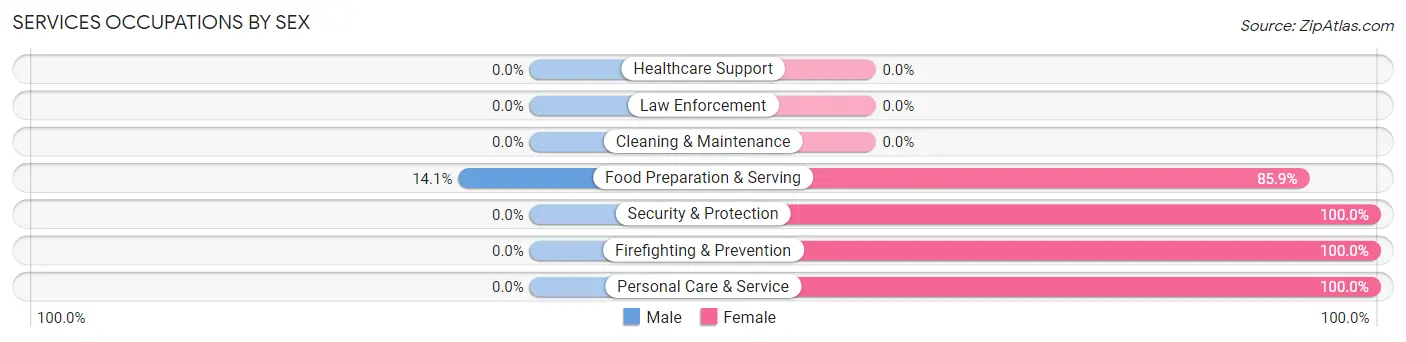
Services Occupations by Sex
| Occupation | Male | Female |
| Healthcare Support | 0 (0.0%) | 0 (0.0%) |
| Security & Protection | 0 (0.0%) | 32 (100.0%) |
| Firefighting & Prevention | 0 (0.0%) | 32 (100.0%) |
| Law Enforcement | 0 (0.0%) | 0 (0.0%) |
| Food Preparation & Serving | 13 (14.1%) | 79 (85.9%) |
| Cleaning & Maintenance | 0 (0.0%) | 0 (0.0%) |
| Personal Care & Service | 0 (0.0%) | 18 (100.0%) |
| Total (Category) | 13 (9.1%) | 129 (90.8%) |
| Total (Overall) | 647 (43.4%) | 845 (56.6%) |
Sales and Office Occupations
The most common Sales and Office occupations in Houston are Office & Administration (396 | 26.5%), and Sales & Related (200 | 13.4%).
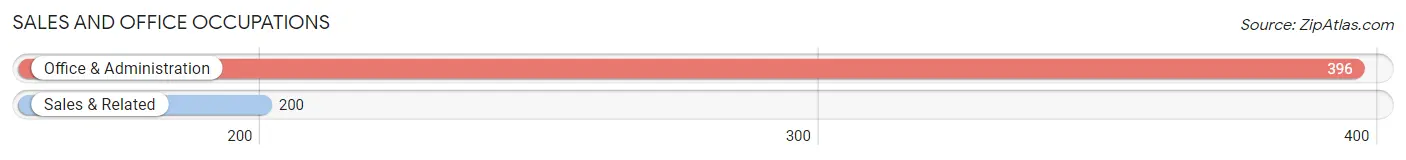
Sales and Office Occupations by Sex
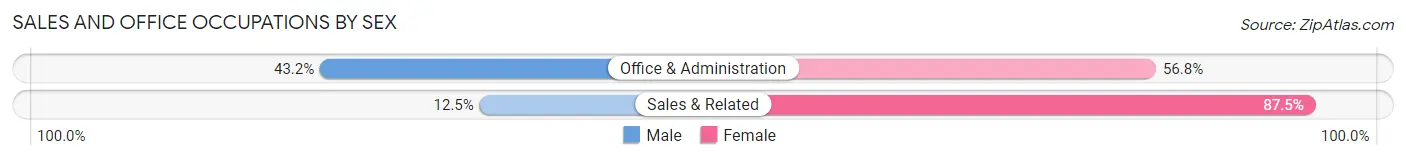
| Occupation | Male | Female |
| Sales & Related | 25 (12.5%) | 175 (87.5%) |
| Office & Administration | 171 (43.2%) | 225 (56.8%) |
| Total (Category) | 196 (32.9%) | 400 (67.1%) |
| Total (Overall) | 647 (43.4%) | 845 (56.6%) |
Natural Resources, Construction and Maintenance Occupations
The most common Natural Resources, Construction and Maintenance occupations in Houston are , and Construction & Extraction (86 | 5.8%).
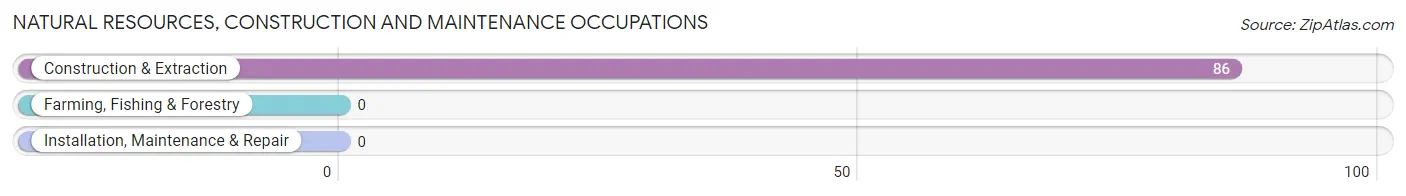
Natural Resources, Construction and Maintenance Occupations by Sex
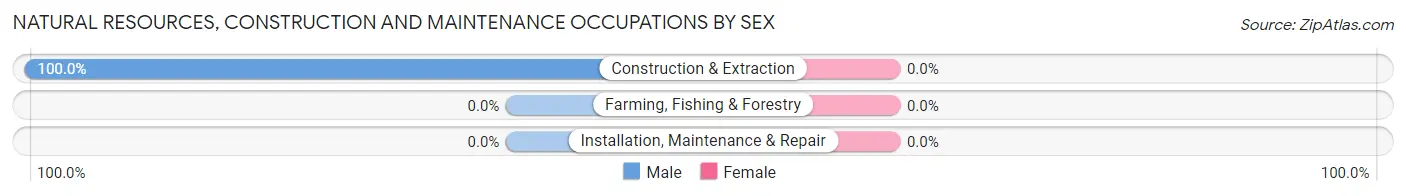
| Occupation | Male | Female |
| Farming, Fishing & Forestry | 0 (0.0%) | 0 (0.0%) |
| Construction & Extraction | 86 (100.0%) | 0 (0.0%) |
| Installation, Maintenance & Repair | 0 (0.0%) | 0 (0.0%) |
| Total (Category) | 86 (100.0%) | 0 (0.0%) |
| Total (Overall) | 647 (43.4%) | 845 (56.6%) |
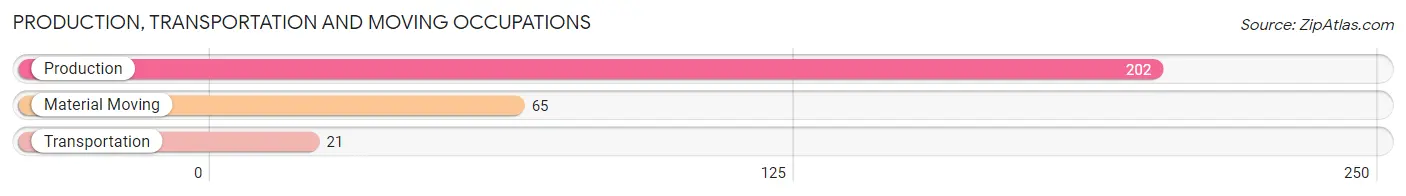
Production, Transportation and Moving Occupations
The most common Production, Transportation and Moving occupations in Houston are Production (202 | 13.5%), Material Moving (65 | 4.4%), and Transportation (21 | 1.4%).
Production, Transportation and Moving Occupations by Sex
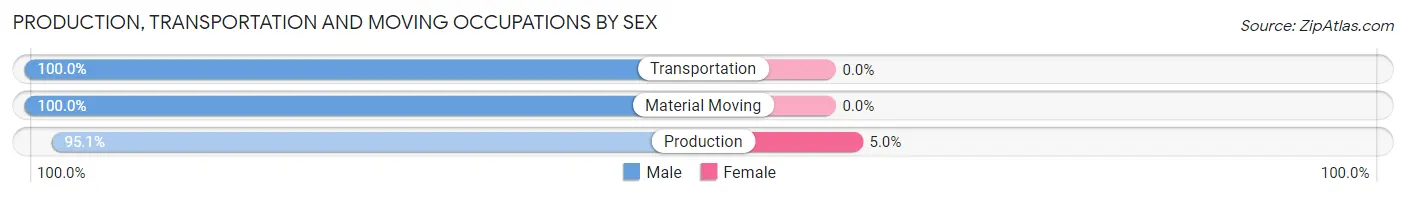
| Occupation | Male | Female |
| Production | 192 (95.1%) | 10 (5.0%) |
| Transportation | 21 (100.0%) | 0 (0.0%) |
| Material Moving | 65 (100.0%) | 0 (0.0%) |
| Total (Category) | 278 (96.5%) | 10 (3.5%) |
| Total (Overall) | 647 (43.4%) | 845 (56.6%) |
Employment Industries by Sex in Houston
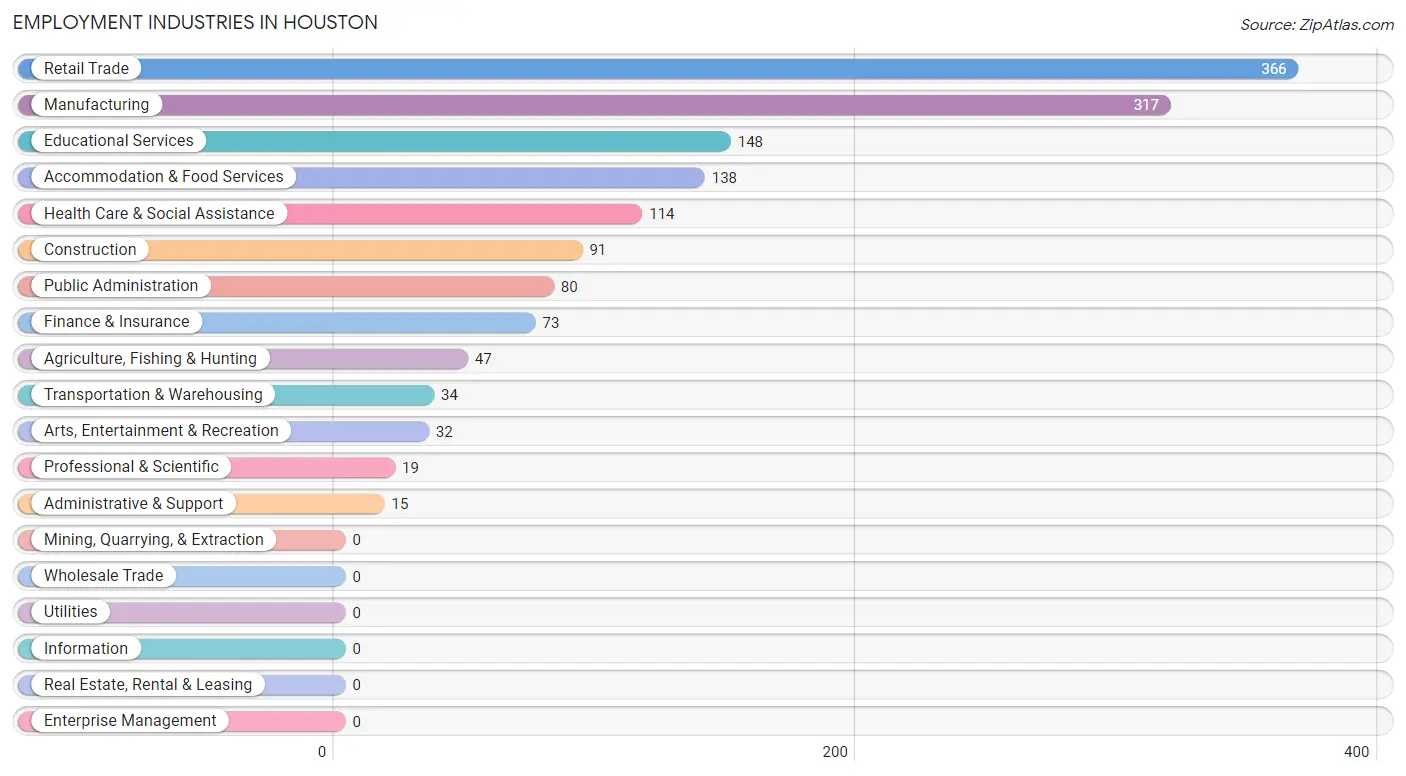
Employment Industries in Houston
The major employment industries in Houston include Retail Trade (366 | 24.5%), Manufacturing (317 | 21.2%), Educational Services (148 | 9.9%), Accommodation & Food Services (138 | 9.2%), and Health Care & Social Assistance (114 | 7.6%).
Employment Industries by Sex in Houston
The Houston industries that see more men than women are Agriculture, Fishing & Hunting (100.0%), Construction (100.0%), and Professional & Scientific (100.0%), whereas the industries that tend to have a higher number of women are Administrative & Support (100.0%), Arts, Entertainment & Recreation (100.0%), and Public Administration (100.0%).
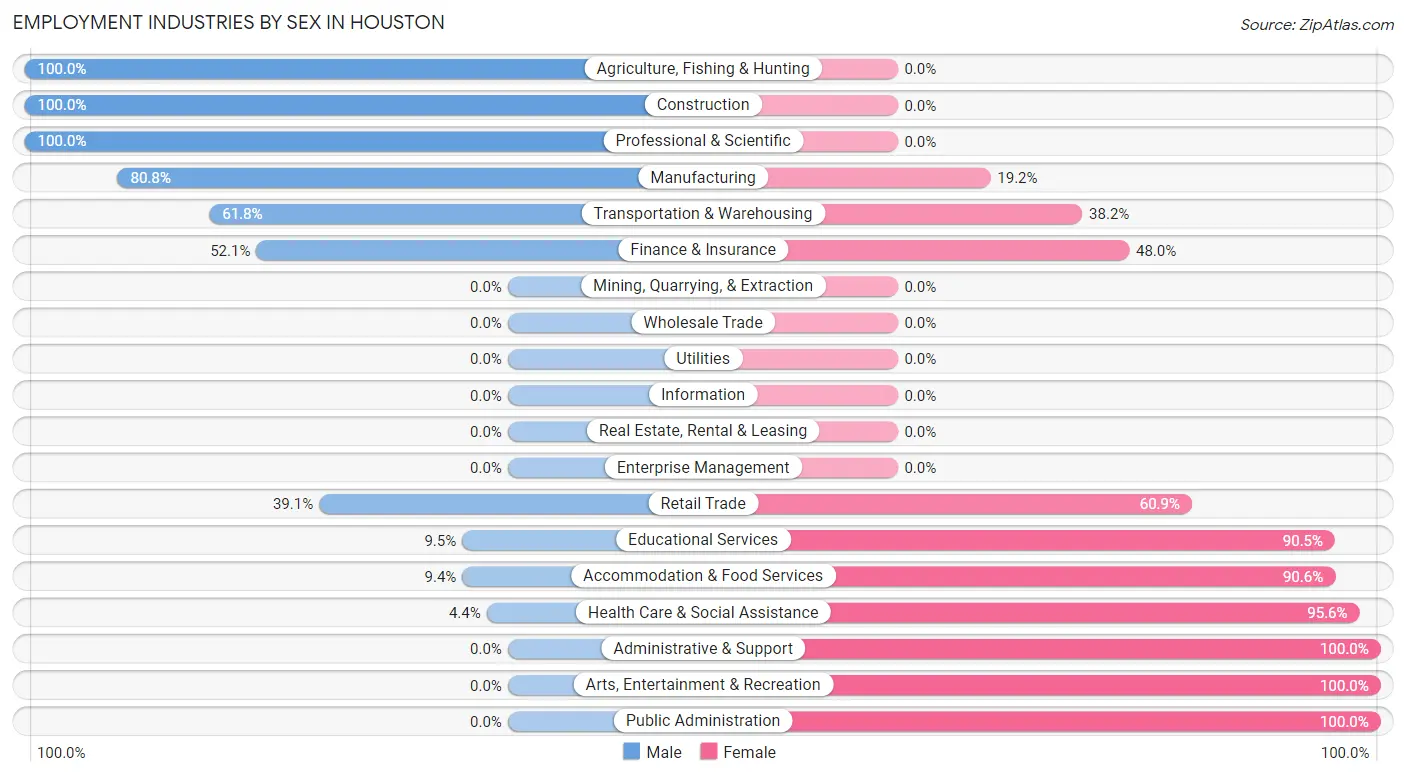
| Industry | Male | Female |
| Agriculture, Fishing & Hunting | 47 (100.0%) | 0 (0.0%) |
| Mining, Quarrying, & Extraction | 0 (0.0%) | 0 (0.0%) |
| Construction | 91 (100.0%) | 0 (0.0%) |
| Manufacturing | 256 (80.8%) | 61 (19.2%) |
| Wholesale Trade | 0 (0.0%) | 0 (0.0%) |
| Retail Trade | 143 (39.1%) | 223 (60.9%) |
| Transportation & Warehousing | 21 (61.8%) | 13 (38.2%) |
| Utilities | 0 (0.0%) | 0 (0.0%) |
| Information | 0 (0.0%) | 0 (0.0%) |
| Finance & Insurance | 38 (52.0%) | 35 (47.9%) |
| Real Estate, Rental & Leasing | 0 (0.0%) | 0 (0.0%) |
| Professional & Scientific | 19 (100.0%) | 0 (0.0%) |
| Enterprise Management | 0 (0.0%) | 0 (0.0%) |
| Administrative & Support | 0 (0.0%) | 15 (100.0%) |
| Educational Services | 14 (9.5%) | 134 (90.5%) |
| Health Care & Social Assistance | 5 (4.4%) | 109 (95.6%) |
| Arts, Entertainment & Recreation | 0 (0.0%) | 32 (100.0%) |
| Accommodation & Food Services | 13 (9.4%) | 125 (90.6%) |
| Public Administration | 0 (0.0%) | 80 (100.0%) |
| Total | 647 (43.4%) | 845 (56.6%) |
Education in Houston
School Enrollment in Houston
The most common levels of schooling among the 693 students in Houston are middle school (166 | 23.9%), elementary school (160 | 23.1%), and high school (146 | 21.1%).
| School Level | # Students | % Students |
| Nursery / Preschool | 78 | 11.3% |
| Kindergarten | 67 | 9.7% |
| Elementary School | 160 | 23.1% |
| Middle School | 166 | 23.9% |
| High School | 146 | 21.1% |
| College / Undergraduate | 76 | 11.0% |
| Graduate / Professional | 0 | 0.0% |
| Total | 693 | 100.0% |
School Enrollment by Age by Funding Source in Houston
Out of a total of 693 students who are enrolled in schools in Houston, 106 (15.3%) attend a private institution, while the remaining 587 (84.7%) are enrolled in public schools. The age group of 18 to 19 year olds has the highest likelihood of being enrolled in private schools, with 30 (49.2% in the age bracket) enrolled. Conversely, the age group of 20 to 24 year olds has the lowest likelihood of being enrolled in a private school, with 44 (100.0% in the age bracket) attending a public institution.
| Age Bracket | Public School | Private School |
| 3 to 4 Year Olds | 0 (0.0%) | 0 (0.0%) |
| 5 to 9 Year Old | 284 (95.3%) | 14 (4.7%) |
| 10 to 14 Year Olds | 148 (85.6%) | 25 (14.4%) |
| 15 to 17 Year Olds | 58 (61.1%) | 37 (39.0%) |
| 18 to 19 Year Olds | 31 (50.8%) | 30 (49.2%) |
| 20 to 24 Year Olds | 44 (100.0%) | 0 (0.0%) |
| 25 to 34 Year Olds | 22 (100.0%) | 0 (0.0%) |
| 35 Years and over | 0 (0.0%) | 0 (0.0%) |
| Total | 587 (84.7%) | 106 (15.3%) |
Educational Attainment by Field of Study in Houston
Business (140 | 31.0%), education (135 | 29.9%), arts & humanities (105 | 23.2%), science & technology (27 | 6.0%), and computers & mathematics (19 | 4.2%) are the most common fields of study among 452 individuals in Houston who have obtained a bachelor's degree or higher.
| Field of Study | # Graduates | % Graduates |
| Computers & Mathematics | 19 | 4.2% |
| Bio, Nature & Agricultural | 0 | 0.0% |
| Physical & Health Sciences | 7 | 1.5% |
| Psychology | 14 | 3.1% |
| Social Sciences | 0 | 0.0% |
| Engineering | 5 | 1.1% |
| Multidisciplinary Studies | 0 | 0.0% |
| Science & Technology | 27 | 6.0% |
| Business | 140 | 31.0% |
| Education | 135 | 29.9% |
| Literature & Languages | 0 | 0.0% |
| Liberal Arts & History | 0 | 0.0% |
| Visual & Performing Arts | 0 | 0.0% |
| Communications | 0 | 0.0% |
| Arts & Humanities | 105 | 23.2% |
| Total | 452 | 100.0% |
Transportation & Commute in Houston
Vehicle Availability by Sex in Houston
The most prevalent vehicle ownership categories in Houston are males with 2 vehicles (225, accounting for 34.9%) and females with 2 vehicles (353, making up 28.3%).
| Vehicles Available | Male | Female |
| No Vehicle | 12 (1.9%) | 0 (0.0%) |
| 1 Vehicle | 192 (29.8%) | 150 (18.8%) |
| 2 Vehicles | 225 (34.9%) | 353 (44.4%) |
| 3 Vehicles | 146 (22.7%) | 217 (27.3%) |
| 4 Vehicles | 65 (10.1%) | 76 (9.6%) |
| 5 or more Vehicles | 4 (0.6%) | 0 (0.0%) |
| Total | 644 (100.0%) | 796 (100.0%) |
Commute Time in Houston
The most frequently occuring commute durations in Houston are 5 to 9 minutes (388 commuters, 26.9%), 30 to 34 minutes (376 commuters, 26.1%), and 10 to 14 minutes (244 commuters, 16.9%).
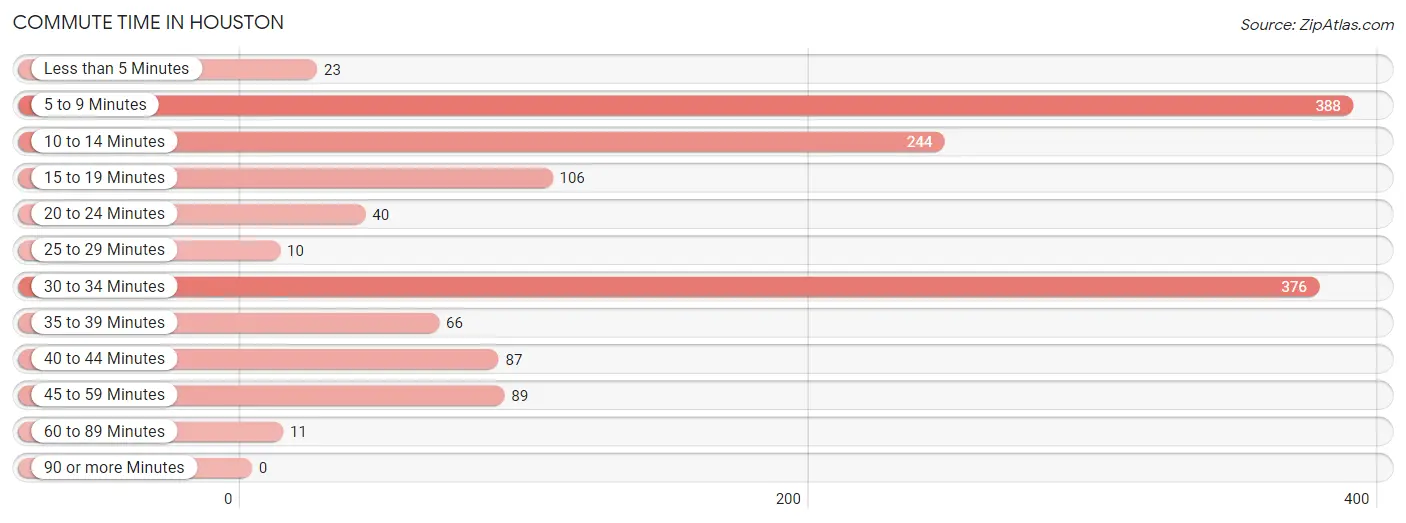
| Commute Time | # Commuters | % Commuters |
| Less than 5 Minutes | 23 | 1.6% |
| 5 to 9 Minutes | 388 | 26.9% |
| 10 to 14 Minutes | 244 | 16.9% |
| 15 to 19 Minutes | 106 | 7.4% |
| 20 to 24 Minutes | 40 | 2.8% |
| 25 to 29 Minutes | 10 | 0.7% |
| 30 to 34 Minutes | 376 | 26.1% |
| 35 to 39 Minutes | 66 | 4.6% |
| 40 to 44 Minutes | 87 | 6.0% |
| 45 to 59 Minutes | 89 | 6.2% |
| 60 to 89 Minutes | 11 | 0.8% |
| 90 or more Minutes | 0 | 0.0% |
Commute Time by Sex in Houston
The most common commute times in Houston are 30 to 34 minutes (308 commuters, 47.8%) for males and 5 to 9 minutes (264 commuters, 33.2%) for females.
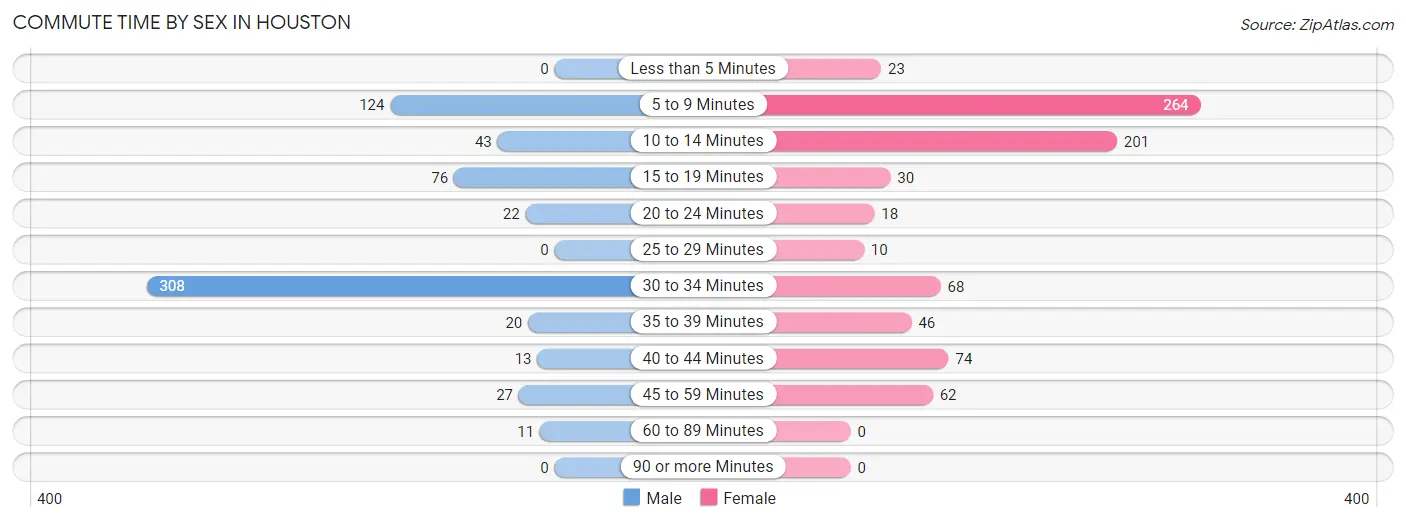
| Commute Time | Male | Female |
| Less than 5 Minutes | 0 (0.0%) | 23 (2.9%) |
| 5 to 9 Minutes | 124 (19.3%) | 264 (33.2%) |
| 10 to 14 Minutes | 43 (6.7%) | 201 (25.3%) |
| 15 to 19 Minutes | 76 (11.8%) | 30 (3.8%) |
| 20 to 24 Minutes | 22 (3.4%) | 18 (2.3%) |
| 25 to 29 Minutes | 0 (0.0%) | 10 (1.3%) |
| 30 to 34 Minutes | 308 (47.8%) | 68 (8.5%) |
| 35 to 39 Minutes | 20 (3.1%) | 46 (5.8%) |
| 40 to 44 Minutes | 13 (2.0%) | 74 (9.3%) |
| 45 to 59 Minutes | 27 (4.2%) | 62 (7.8%) |
| 60 to 89 Minutes | 11 (1.7%) | 0 (0.0%) |
| 90 or more Minutes | 0 (0.0%) | 0 (0.0%) |
Time of Departure to Work by Sex in Houston
The most frequent times of departure to work in Houston are 6:00 AM to 6:29 AM (142, 22.1%) for males and 7:30 AM to 7:59 AM (177, 22.2%) for females.
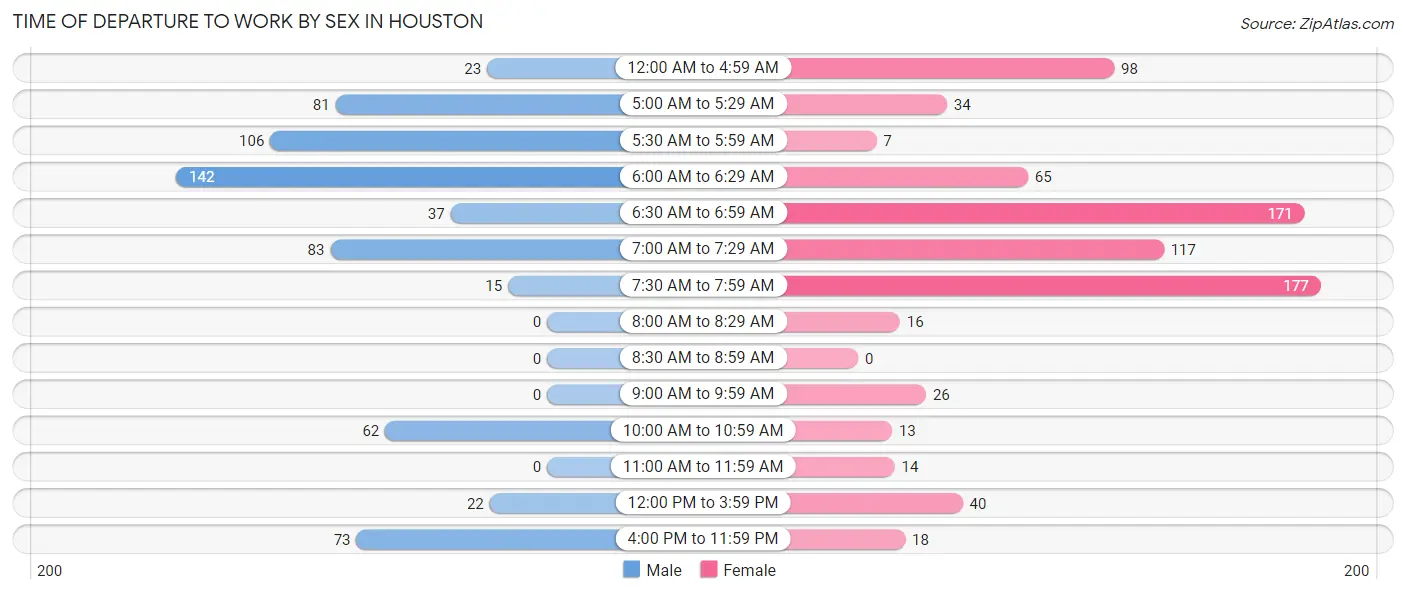
| Time of Departure | Male | Female |
| 12:00 AM to 4:59 AM | 23 (3.6%) | 98 (12.3%) |
| 5:00 AM to 5:29 AM | 81 (12.6%) | 34 (4.3%) |
| 5:30 AM to 5:59 AM | 106 (16.5%) | 7 (0.9%) |
| 6:00 AM to 6:29 AM | 142 (22.1%) | 65 (8.2%) |
| 6:30 AM to 6:59 AM | 37 (5.8%) | 171 (21.5%) |
| 7:00 AM to 7:29 AM | 83 (12.9%) | 117 (14.7%) |
| 7:30 AM to 7:59 AM | 15 (2.3%) | 177 (22.2%) |
| 8:00 AM to 8:29 AM | 0 (0.0%) | 16 (2.0%) |
| 8:30 AM to 8:59 AM | 0 (0.0%) | 0 (0.0%) |
| 9:00 AM to 9:59 AM | 0 (0.0%) | 26 (3.3%) |
| 10:00 AM to 10:59 AM | 62 (9.6%) | 13 (1.6%) |
| 11:00 AM to 11:59 AM | 0 (0.0%) | 14 (1.8%) |
| 12:00 PM to 3:59 PM | 22 (3.4%) | 40 (5.0%) |
| 4:00 PM to 11:59 PM | 73 (11.3%) | 18 (2.3%) |
| Total | 644 (100.0%) | 796 (100.0%) |
Housing Occupancy in Houston
Occupancy by Ownership in Houston
Of the total 1,762 dwellings in Houston, owner-occupied units account for 1,055 (59.9%), while renter-occupied units make up 707 (40.1%).
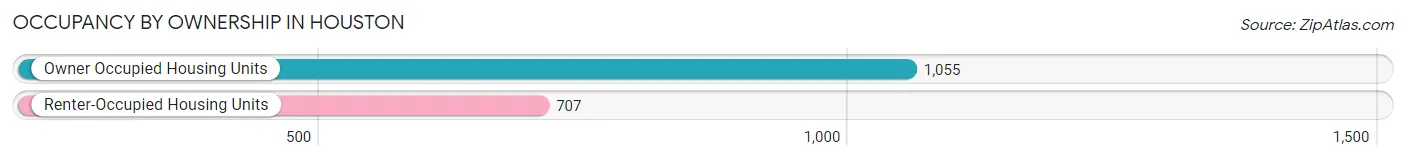
| Occupancy | # Housing Units | % Housing Units |
| Owner Occupied Housing Units | 1,055 | 59.9% |
| Renter-Occupied Housing Units | 707 | 40.1% |
| Total Occupied Housing Units | 1,762 | 100.0% |
Occupancy by Household Size in Houston
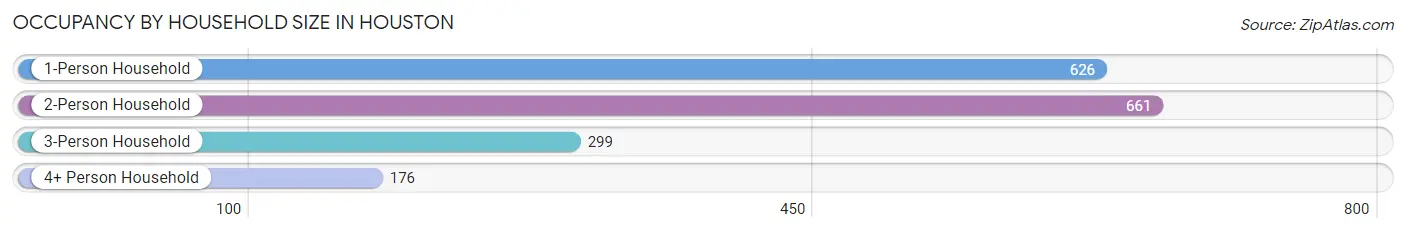
| Household Size | # Housing Units | % Housing Units |
| 1-Person Household | 626 | 35.5% |
| 2-Person Household | 661 | 37.5% |
| 3-Person Household | 299 | 17.0% |
| 4+ Person Household | 176 | 10.0% |
| Total Housing Units | 1,762 | 100.0% |
Occupancy by Ownership by Household Size in Houston
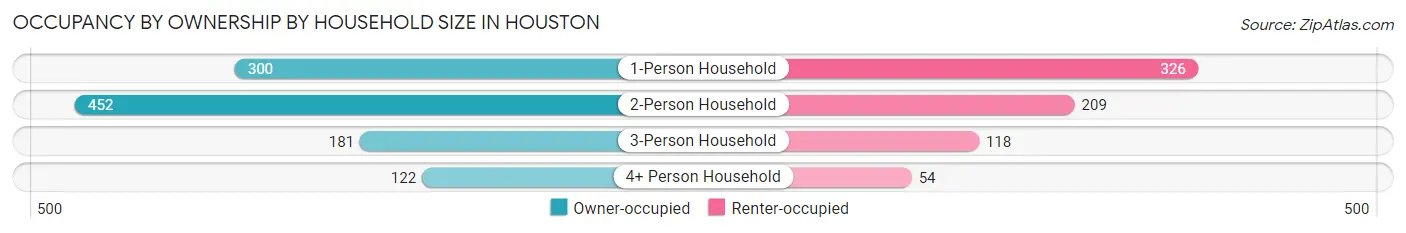
| Household Size | Owner-occupied | Renter-occupied |
| 1-Person Household | 300 (47.9%) | 326 (52.1%) |
| 2-Person Household | 452 (68.4%) | 209 (31.6%) |
| 3-Person Household | 181 (60.5%) | 118 (39.5%) |
| 4+ Person Household | 122 (69.3%) | 54 (30.7%) |
| Total Housing Units | 1,055 (59.9%) | 707 (40.1%) |
Occupancy by Educational Attainment in Houston
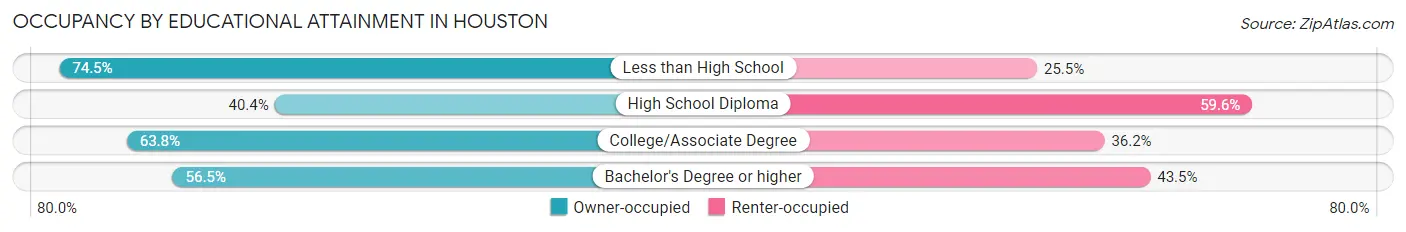
| Household Size | Owner-occupied | Renter-occupied |
| Less than High School | 286 (74.5%) | 98 (25.5%) |
| High School Diploma | 155 (40.4%) | 229 (59.6%) |
| College/Associate Degree | 458 (63.8%) | 260 (36.2%) |
| Bachelor's Degree or higher | 156 (56.5%) | 120 (43.5%) |
Occupancy by Age of Householder in Houston
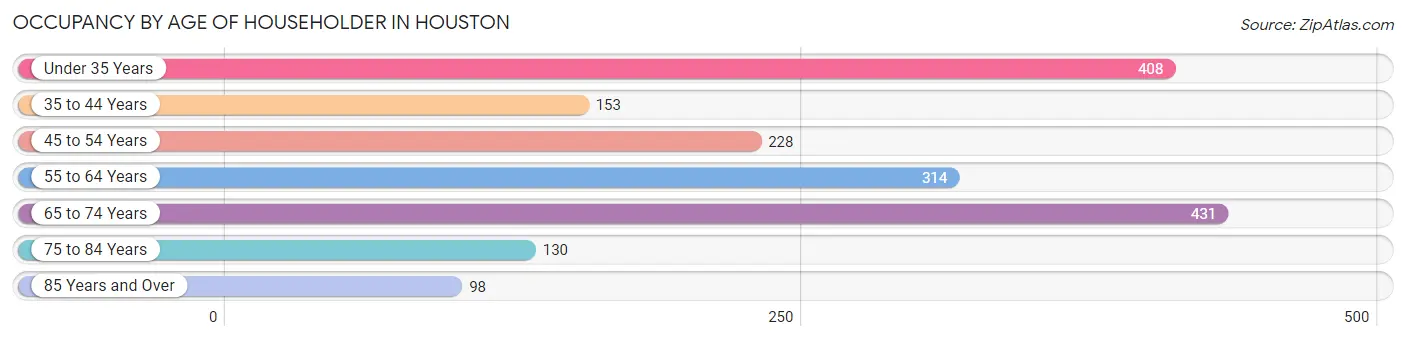
| Age Bracket | # Households | % Households |
| Under 35 Years | 408 | 23.2% |
| 35 to 44 Years | 153 | 8.7% |
| 45 to 54 Years | 228 | 12.9% |
| 55 to 64 Years | 314 | 17.8% |
| 65 to 74 Years | 431 | 24.5% |
| 75 to 84 Years | 130 | 7.4% |
| 85 Years and Over | 98 | 5.6% |
| Total | 1,762 | 100.0% |
Housing Finances in Houston
Median Income by Occupancy in Houston
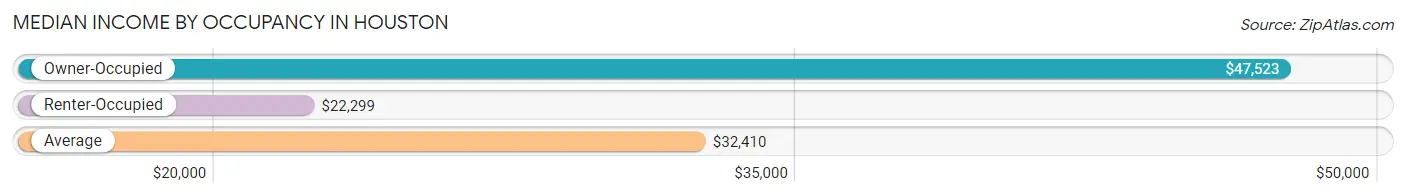
| Occupancy Type | # Households | Median Income |
| Owner-Occupied | 1,055 (59.9%) | $47,523 |
| Renter-Occupied | 707 (40.1%) | $22,299 |
| Average | 1,762 (100.0%) | $32,410 |
Occupancy by Householder Income Bracket in Houston
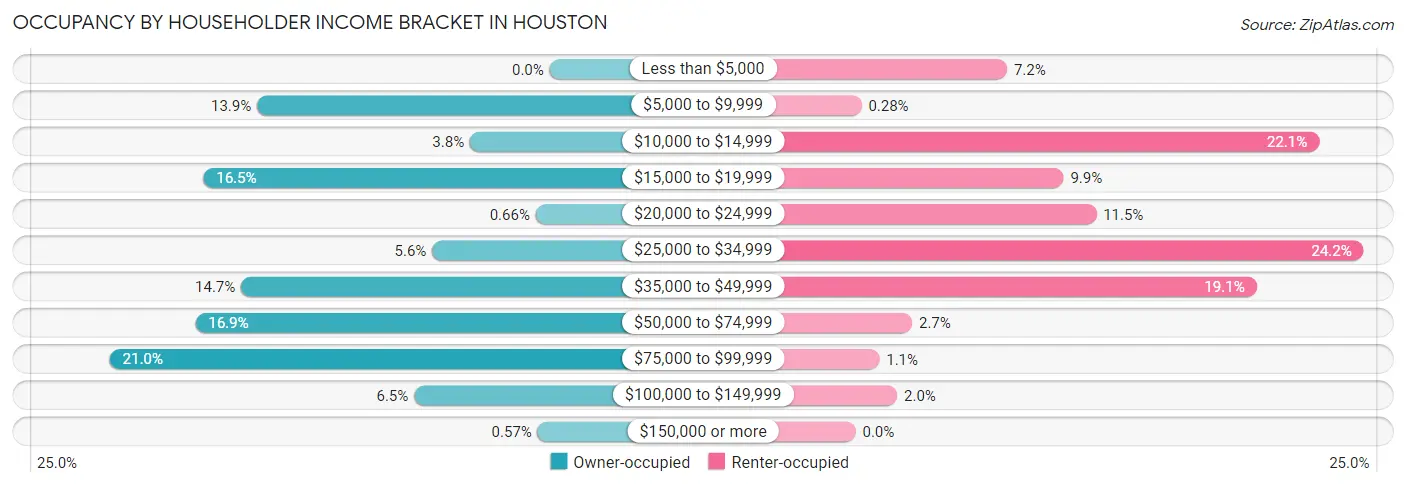
| Income Bracket | Owner-occupied | Renter-occupied |
| Less than $5,000 | 0 (0.0%) | 51 (7.2%) |
| $5,000 to $9,999 | 147 (13.9%) | 2 (0.3%) |
| $10,000 to $14,999 | 40 (3.8%) | 156 (22.1%) |
| $15,000 to $19,999 | 174 (16.5%) | 70 (9.9%) |
| $20,000 to $24,999 | 7 (0.7%) | 81 (11.5%) |
| $25,000 to $34,999 | 59 (5.6%) | 171 (24.2%) |
| $35,000 to $49,999 | 155 (14.7%) | 135 (19.1%) |
| $50,000 to $74,999 | 178 (16.9%) | 19 (2.7%) |
| $75,000 to $99,999 | 221 (20.9%) | 8 (1.1%) |
| $100,000 to $149,999 | 68 (6.5%) | 14 (2.0%) |
| $150,000 or more | 6 (0.6%) | 0 (0.0%) |
| Total | 1,055 (100.0%) | 707 (100.0%) |
Monthly Housing Cost Tiers in Houston
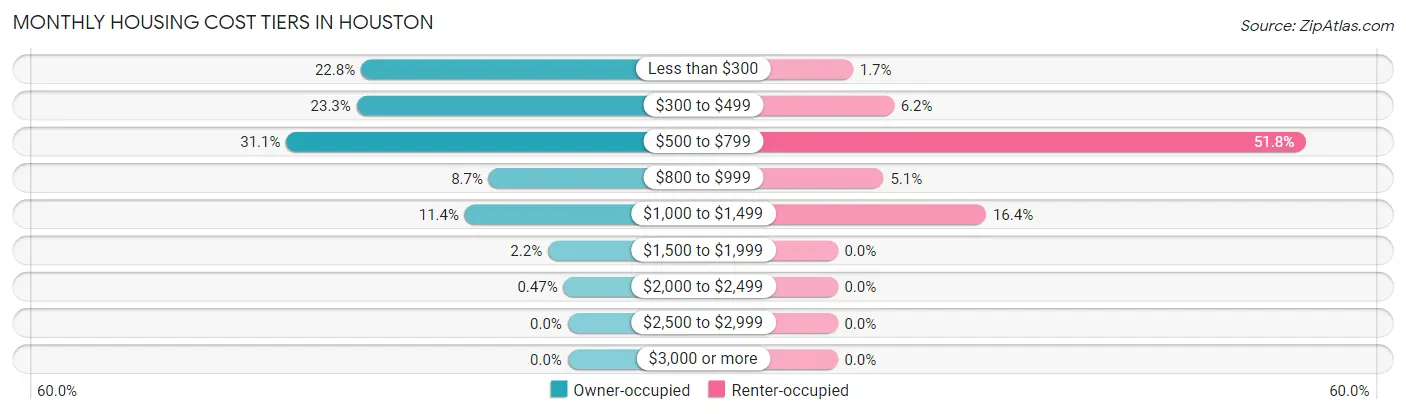
| Monthly Cost | Owner-occupied | Renter-occupied |
| Less than $300 | 241 (22.8%) | 12 (1.7%) |
| $300 to $499 | 246 (23.3%) | 44 (6.2%) |
| $500 to $799 | 328 (31.1%) | 366 (51.8%) |
| $800 to $999 | 92 (8.7%) | 36 (5.1%) |
| $1,000 to $1,499 | 120 (11.4%) | 116 (16.4%) |
| $1,500 to $1,999 | 23 (2.2%) | 0 (0.0%) |
| $2,000 to $2,499 | 5 (0.5%) | 0 (0.0%) |
| $2,500 to $2,999 | 0 (0.0%) | 0 (0.0%) |
| $3,000 or more | 0 (0.0%) | 0 (0.0%) |
| Total | 1,055 (100.0%) | 707 (100.0%) |
Physical Housing Characteristics in Houston
Housing Structures in Houston
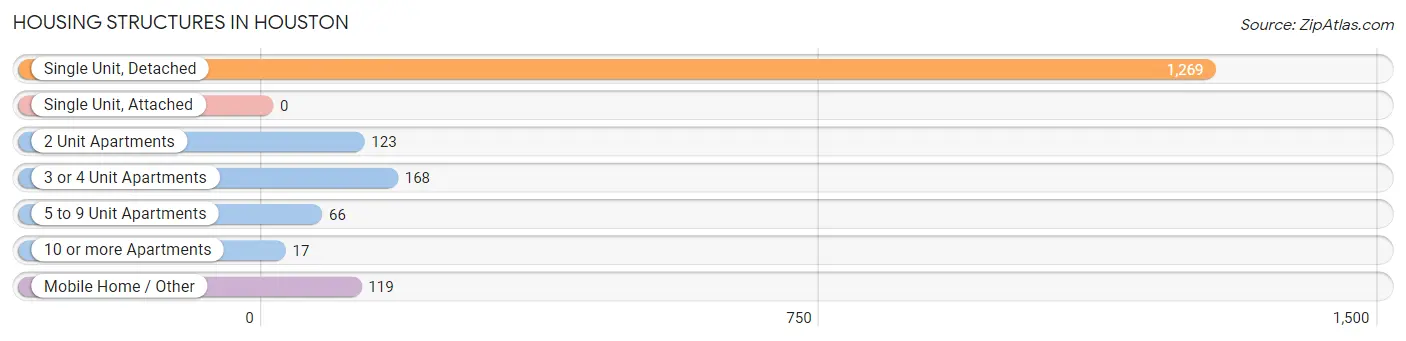
| Structure Type | # Housing Units | % Housing Units |
| Single Unit, Detached | 1,269 | 72.0% |
| Single Unit, Attached | 0 | 0.0% |
| 2 Unit Apartments | 123 | 7.0% |
| 3 or 4 Unit Apartments | 168 | 9.5% |
| 5 to 9 Unit Apartments | 66 | 3.7% |
| 10 or more Apartments | 17 | 1.0% |
| Mobile Home / Other | 119 | 6.8% |
| Total | 1,762 | 100.0% |
Housing Structures by Occupancy in Houston
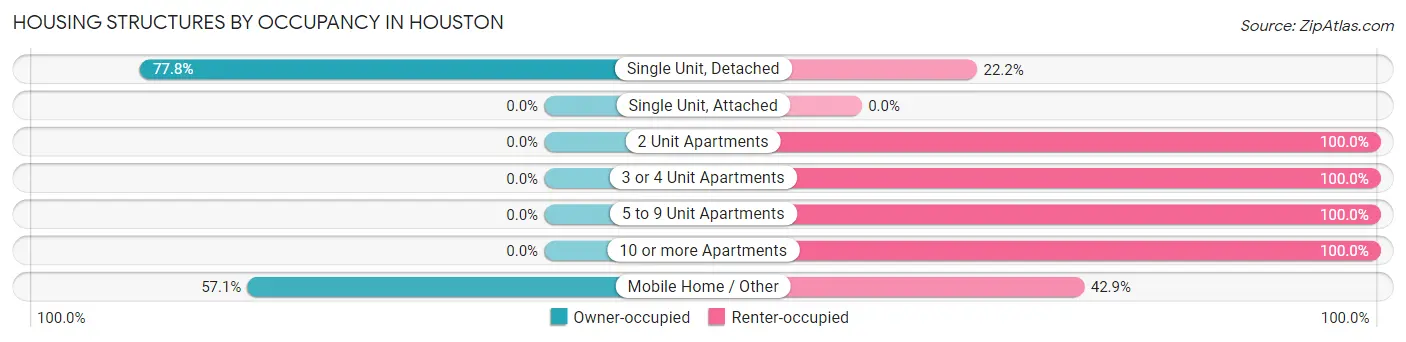
| Structure Type | Owner-occupied | Renter-occupied |
| Single Unit, Detached | 987 (77.8%) | 282 (22.2%) |
| Single Unit, Attached | 0 (0.0%) | 0 (0.0%) |
| 2 Unit Apartments | 0 (0.0%) | 123 (100.0%) |
| 3 or 4 Unit Apartments | 0 (0.0%) | 168 (100.0%) |
| 5 to 9 Unit Apartments | 0 (0.0%) | 66 (100.0%) |
| 10 or more Apartments | 0 (0.0%) | 17 (100.0%) |
| Mobile Home / Other | 68 (57.1%) | 51 (42.9%) |
| Total | 1,055 (59.9%) | 707 (40.1%) |
Housing Structures by Number of Rooms in Houston
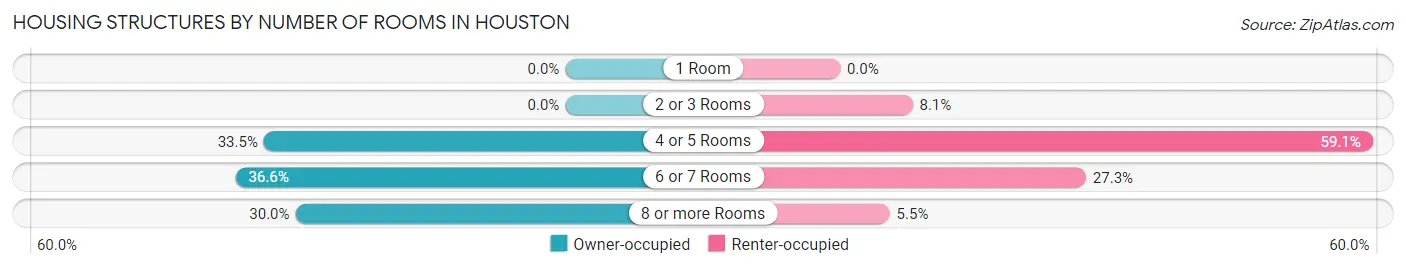
| Number of Rooms | Owner-occupied | Renter-occupied |
| 1 Room | 0 (0.0%) | 0 (0.0%) |
| 2 or 3 Rooms | 0 (0.0%) | 57 (8.1%) |
| 4 or 5 Rooms | 353 (33.5%) | 418 (59.1%) |
| 6 or 7 Rooms | 386 (36.6%) | 193 (27.3%) |
| 8 or more Rooms | 316 (29.9%) | 39 (5.5%) |
| Total | 1,055 (100.0%) | 707 (100.0%) |
Housing Structure by Heating Type in Houston
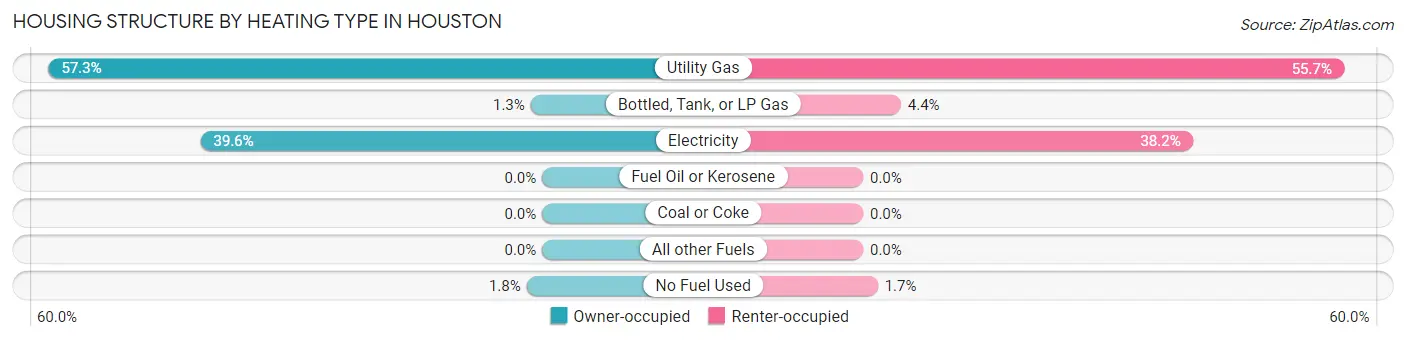
| Heating Type | Owner-occupied | Renter-occupied |
| Utility Gas | 604 (57.3%) | 394 (55.7%) |
| Bottled, Tank, or LP Gas | 14 (1.3%) | 31 (4.4%) |
| Electricity | 418 (39.6%) | 270 (38.2%) |
| Fuel Oil or Kerosene | 0 (0.0%) | 0 (0.0%) |
| Coal or Coke | 0 (0.0%) | 0 (0.0%) |
| All other Fuels | 0 (0.0%) | 0 (0.0%) |
| No Fuel Used | 19 (1.8%) | 12 (1.7%) |
| Total | 1,055 (100.0%) | 707 (100.0%) |
Household Vehicle Usage in Houston
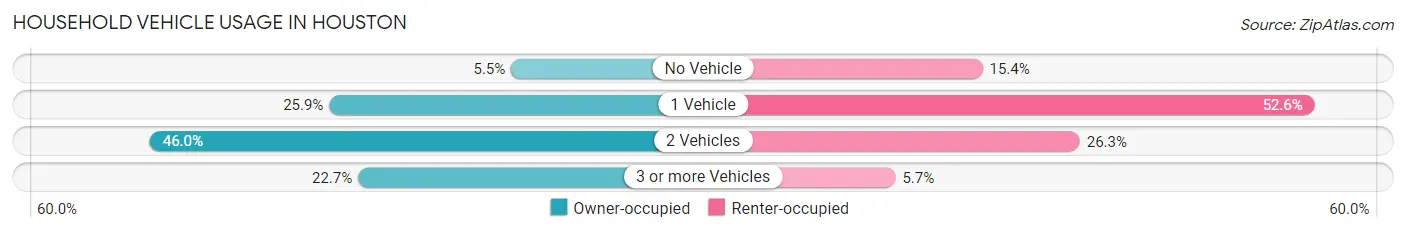
| Vehicles per Household | Owner-occupied | Renter-occupied |
| No Vehicle | 58 (5.5%) | 109 (15.4%) |
| 1 Vehicle | 273 (25.9%) | 372 (52.6%) |
| 2 Vehicles | 485 (46.0%) | 186 (26.3%) |
| 3 or more Vehicles | 239 (22.7%) | 40 (5.7%) |
| Total | 1,055 (100.0%) | 707 (100.0%) |
Real Estate & Mortgages in Houston
Real Estate and Mortgage Overview in Houston
| Characteristic | Without Mortgage | With Mortgage |
| Housing Units | 684 | 371 |
| Median Property Value | $88,900 | $88,700 |
| Median Household Income | - | - |
| Monthly Housing Costs | $384 | $0 |
| Real Estate Taxes | $1,293 | $138 |
Property Value by Mortgage Status in Houston
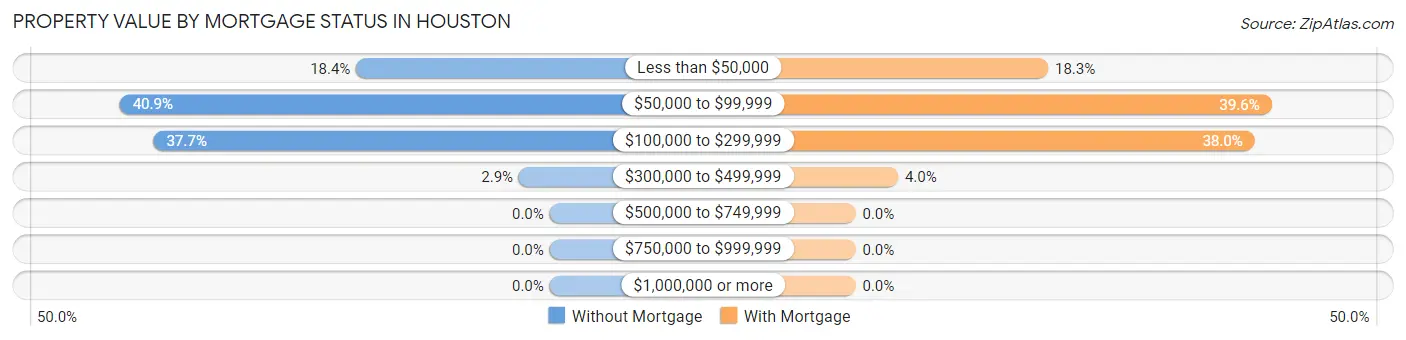
| Property Value | Without Mortgage | With Mortgage |
| Less than $50,000 | 126 (18.4%) | 68 (18.3%) |
| $50,000 to $99,999 | 280 (40.9%) | 147 (39.6%) |
| $100,000 to $299,999 | 258 (37.7%) | 141 (38.0%) |
| $300,000 to $499,999 | 20 (2.9%) | 15 (4.0%) |
| $500,000 to $749,999 | 0 (0.0%) | 0 (0.0%) |
| $750,000 to $999,999 | 0 (0.0%) | 0 (0.0%) |
| $1,000,000 or more | 0 (0.0%) | 0 (0.0%) |
| Total | 684 (100.0%) | 371 (100.0%) |
Household Income by Mortgage Status in Houston
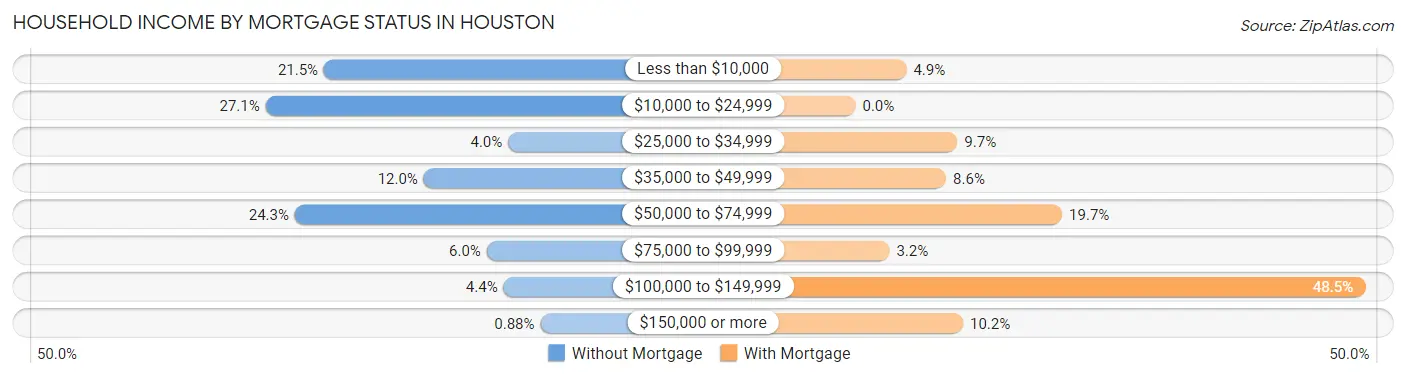
| Household Income | Without Mortgage | With Mortgage |
| Less than $10,000 | 147 (21.5%) | 18 (4.9%) |
| $10,000 to $24,999 | 185 (27.1%) | 0 (0.0%) |
| $25,000 to $34,999 | 27 (4.0%) | 36 (9.7%) |
| $35,000 to $49,999 | 82 (12.0%) | 32 (8.6%) |
| $50,000 to $74,999 | 166 (24.3%) | 73 (19.7%) |
| $75,000 to $99,999 | 41 (6.0%) | 12 (3.2%) |
| $100,000 to $149,999 | 30 (4.4%) | 180 (48.5%) |
| $150,000 or more | 6 (0.9%) | 38 (10.2%) |
| Total | 684 (100.0%) | 371 (100.0%) |
Property Value to Household Income Ratio in Houston
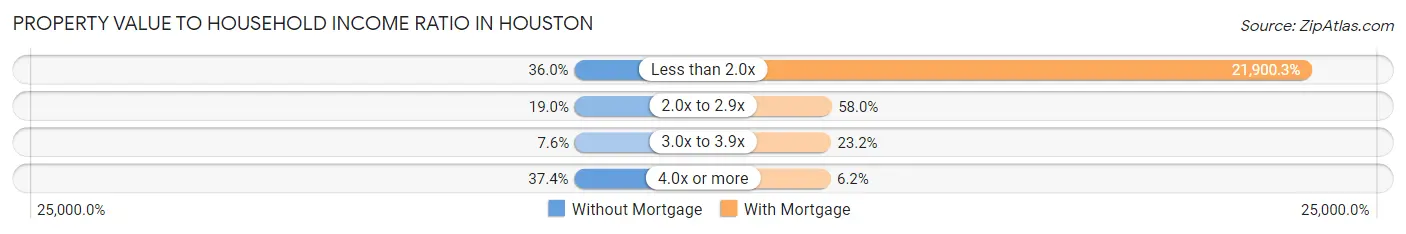
| Value-to-Income Ratio | Without Mortgage | With Mortgage |
| Less than 2.0x | 246 (36.0%) | 81,250 (21,900.3%) |
| 2.0x to 2.9x | 130 (19.0%) | 215 (58.0%) |
| 3.0x to 3.9x | 52 (7.6%) | 86 (23.2%) |
| 4.0x or more | 256 (37.4%) | 23 (6.2%) |
| Total | 684 (100.0%) | 371 (100.0%) |
Real Estate Taxes by Mortgage Status in Houston
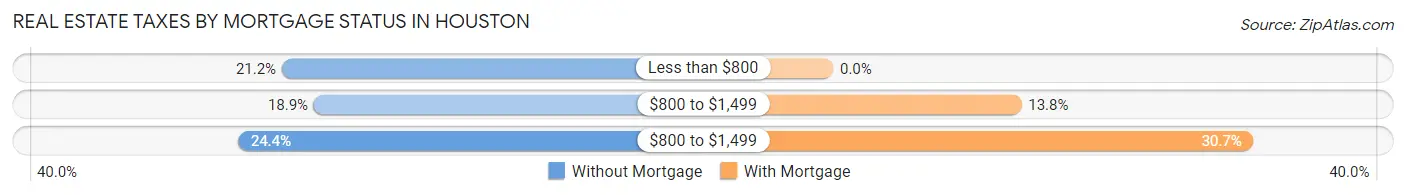
| Property Taxes | Without Mortgage | With Mortgage |
| Less than $800 | 145 (21.2%) | 0 (0.0%) |
| $800 to $1,499 | 129 (18.9%) | 51 (13.8%) |
| $800 to $1,499 | 167 (24.4%) | 114 (30.7%) |
| Total | 684 (100.0%) | 371 (100.0%) |
Health & Disability in Houston
Health Insurance Coverage by Age in Houston
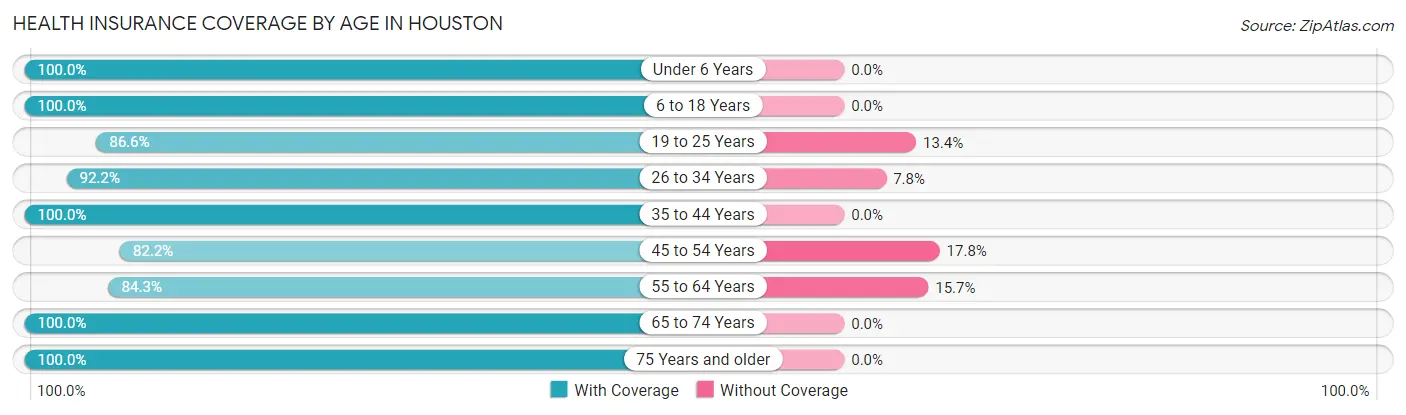
| Age Bracket | With Coverage | Without Coverage |
| Under 6 Years | 269 (100.0%) | 0 (0.0%) |
| 6 to 18 Years | 472 (100.0%) | 0 (0.0%) |
| 19 to 25 Years | 259 (86.6%) | 40 (13.4%) |
| 26 to 34 Years | 448 (92.2%) | 38 (7.8%) |
| 35 to 44 Years | 272 (100.0%) | 0 (0.0%) |
| 45 to 54 Years | 356 (82.2%) | 77 (17.8%) |
| 55 to 64 Years | 393 (84.3%) | 73 (15.7%) |
| 65 to 74 Years | 603 (100.0%) | 0 (0.0%) |
| 75 Years and older | 383 (100.0%) | 0 (0.0%) |
| Total | 3,455 (93.8%) | 228 (6.2%) |
Health Insurance Coverage by Citizenship Status in Houston
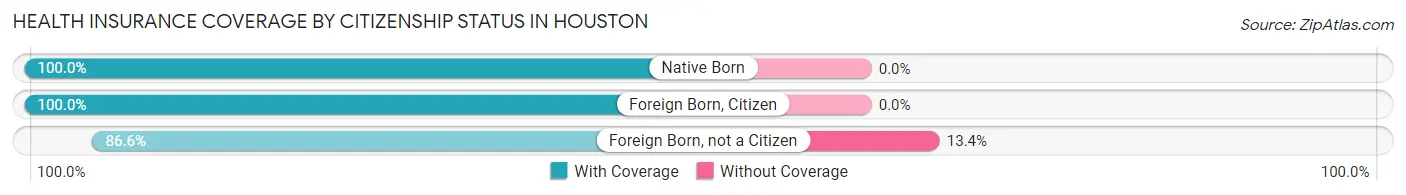
| Citizenship Status | With Coverage | Without Coverage |
| Native Born | 269 (100.0%) | 0 (0.0%) |
| Foreign Born, Citizen | 472 (100.0%) | 0 (0.0%) |
| Foreign Born, not a Citizen | 259 (86.6%) | 40 (13.4%) |
Health Insurance Coverage by Household Income in Houston
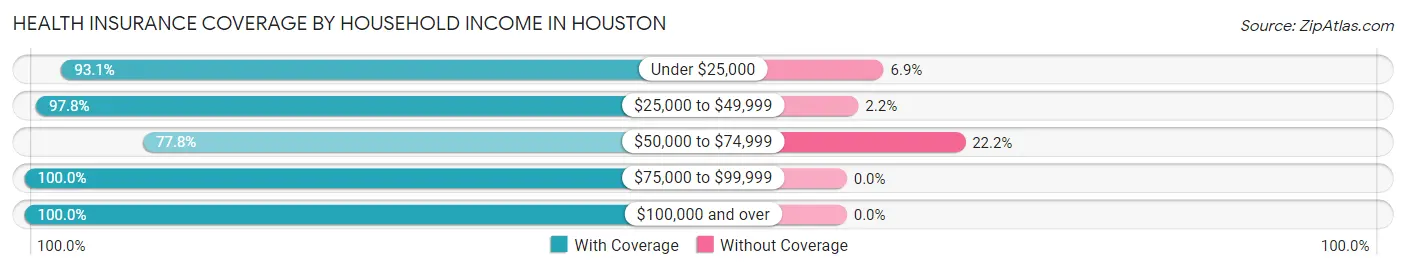
| Household Income | With Coverage | Without Coverage |
| Under $25,000 | 1,066 (93.1%) | 79 (6.9%) |
| $25,000 to $49,999 | 992 (97.8%) | 22 (2.2%) |
| $50,000 to $74,999 | 435 (77.8%) | 124 (22.2%) |
| $75,000 to $99,999 | 731 (100.0%) | 0 (0.0%) |
| $100,000 and over | 231 (100.0%) | 0 (0.0%) |
Public vs Private Health Insurance Coverage by Age in Houston
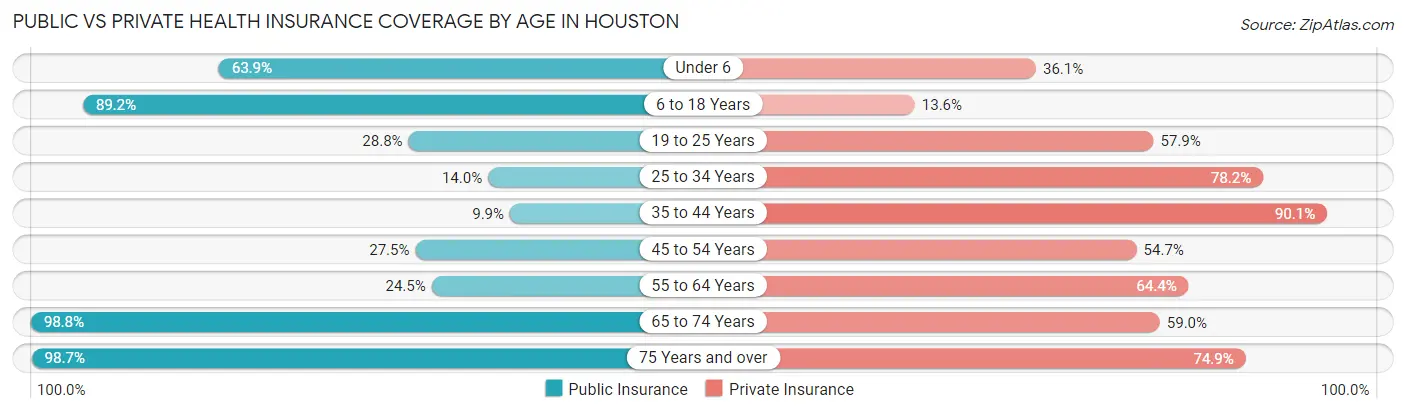
| Age Bracket | Public Insurance | Private Insurance |
| Under 6 | 172 (63.9%) | 97 (36.1%) |
| 6 to 18 Years | 421 (89.2%) | 64 (13.6%) |
| 19 to 25 Years | 86 (28.8%) | 173 (57.9%) |
| 25 to 34 Years | 68 (14.0%) | 380 (78.2%) |
| 35 to 44 Years | 27 (9.9%) | 245 (90.1%) |
| 45 to 54 Years | 119 (27.5%) | 237 (54.7%) |
| 55 to 64 Years | 114 (24.5%) | 300 (64.4%) |
| 65 to 74 Years | 596 (98.8%) | 356 (59.0%) |
| 75 Years and over | 378 (98.7%) | 287 (74.9%) |
| Total | 1,981 (53.8%) | 2,139 (58.1%) |
Disability Status by Sex by Age in Houston
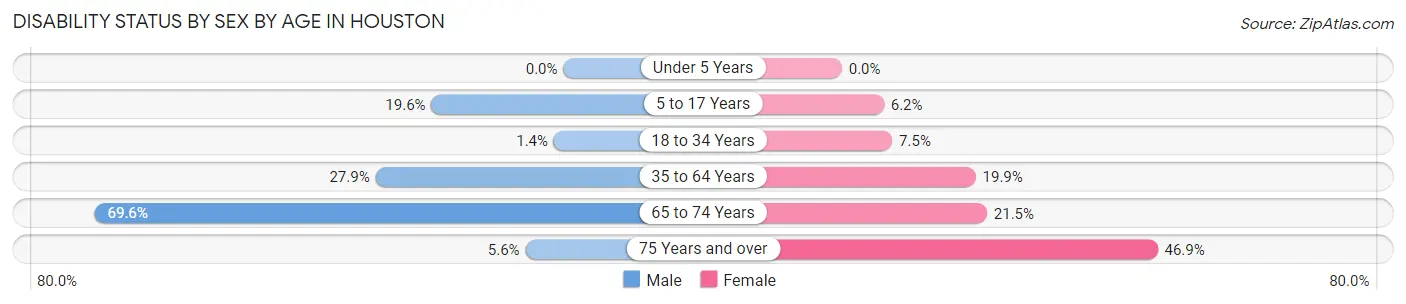
| Age Bracket | Male | Female |
| Under 5 Years | 0 (0.0%) | 0 (0.0%) |
| 5 to 17 Years | 48 (19.6%) | 20 (6.2%) |
| 18 to 34 Years | 5 (1.4%) | 36 (7.5%) |
| 35 to 64 Years | 154 (27.9%) | 123 (19.9%) |
| 65 to 74 Years | 158 (69.6%) | 81 (21.5%) |
| 75 Years and over | 8 (5.6%) | 113 (46.9%) |
Disability Class by Sex by Age in Houston
Disability Class: Hearing Difficulty
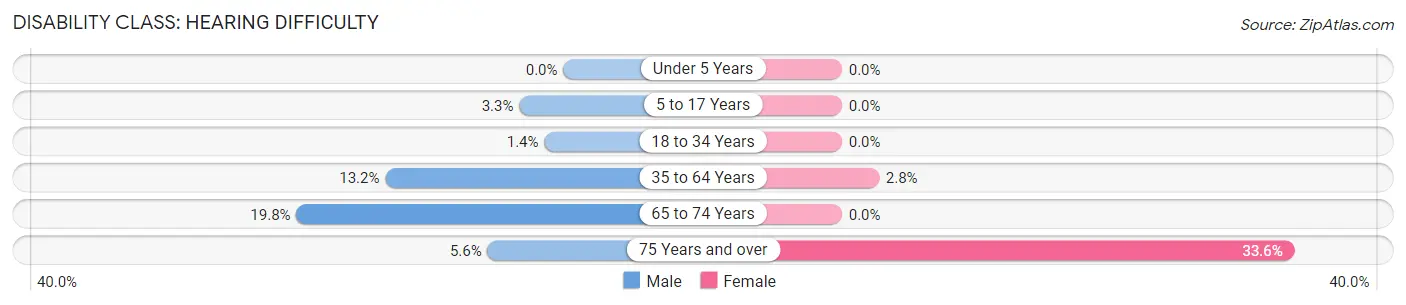
| Age Bracket | Male | Female |
| Under 5 Years | 0 (0.0%) | 0 (0.0%) |
| 5 to 17 Years | 8 (3.3%) | 0 (0.0%) |
| 18 to 34 Years | 5 (1.4%) | 0 (0.0%) |
| 35 to 64 Years | 73 (13.2%) | 17 (2.8%) |
| 65 to 74 Years | 45 (19.8%) | 0 (0.0%) |
| 75 Years and over | 8 (5.6%) | 81 (33.6%) |
Disability Class: Vision Difficulty
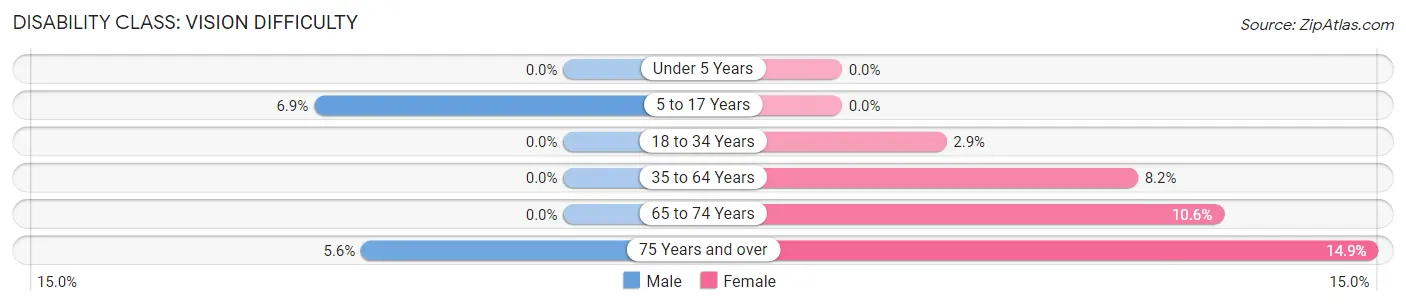
| Age Bracket | Male | Female |
| Under 5 Years | 0 (0.0%) | 0 (0.0%) |
| 5 to 17 Years | 17 (6.9%) | 0 (0.0%) |
| 18 to 34 Years | 0 (0.0%) | 14 (2.9%) |
| 35 to 64 Years | 0 (0.0%) | 51 (8.2%) |
| 65 to 74 Years | 0 (0.0%) | 40 (10.6%) |
| 75 Years and over | 8 (5.6%) | 36 (14.9%) |
Disability Class: Cognitive Difficulty
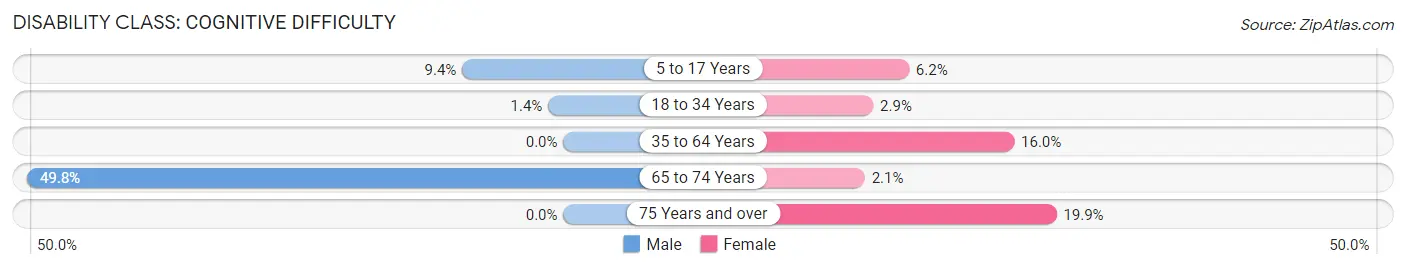
| Age Bracket | Male | Female |
| 5 to 17 Years | 23 (9.4%) | 20 (6.2%) |
| 18 to 34 Years | 5 (1.4%) | 14 (2.9%) |
| 35 to 64 Years | 0 (0.0%) | 99 (16.0%) |
| 65 to 74 Years | 113 (49.8%) | 8 (2.1%) |
| 75 Years and over | 0 (0.0%) | 48 (19.9%) |
Disability Class: Ambulatory Difficulty
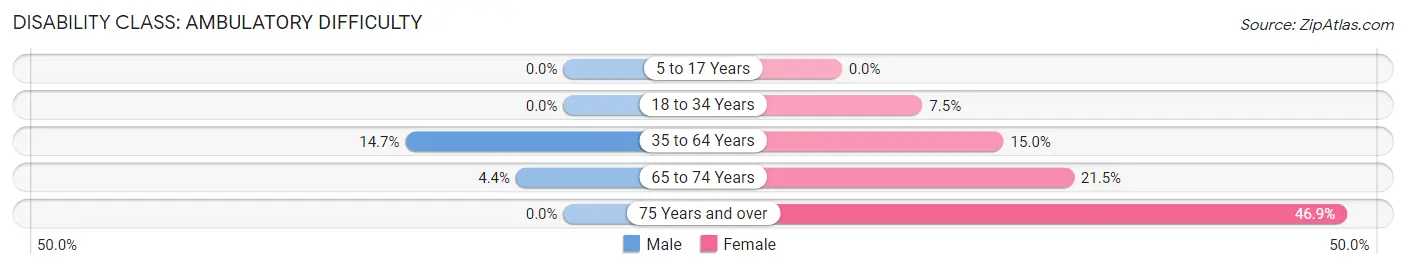
| Age Bracket | Male | Female |
| 5 to 17 Years | 0 (0.0%) | 0 (0.0%) |
| 18 to 34 Years | 0 (0.0%) | 36 (7.5%) |
| 35 to 64 Years | 81 (14.7%) | 93 (15.0%) |
| 65 to 74 Years | 10 (4.4%) | 81 (21.5%) |
| 75 Years and over | 0 (0.0%) | 113 (46.9%) |
Disability Class: Self-Care Difficulty
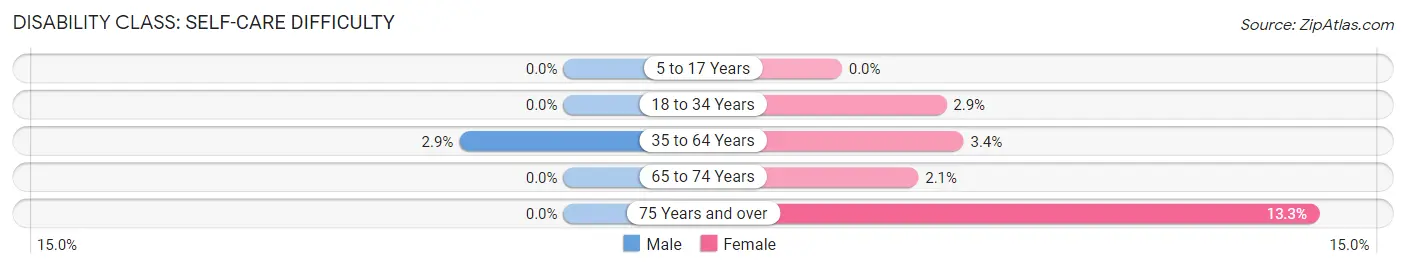
| Age Bracket | Male | Female |
| 5 to 17 Years | 0 (0.0%) | 0 (0.0%) |
| 18 to 34 Years | 0 (0.0%) | 14 (2.9%) |
| 35 to 64 Years | 16 (2.9%) | 21 (3.4%) |
| 65 to 74 Years | 0 (0.0%) | 8 (2.1%) |
| 75 Years and over | 0 (0.0%) | 32 (13.3%) |
Technology Access in Houston
Computing Device Access in Houston
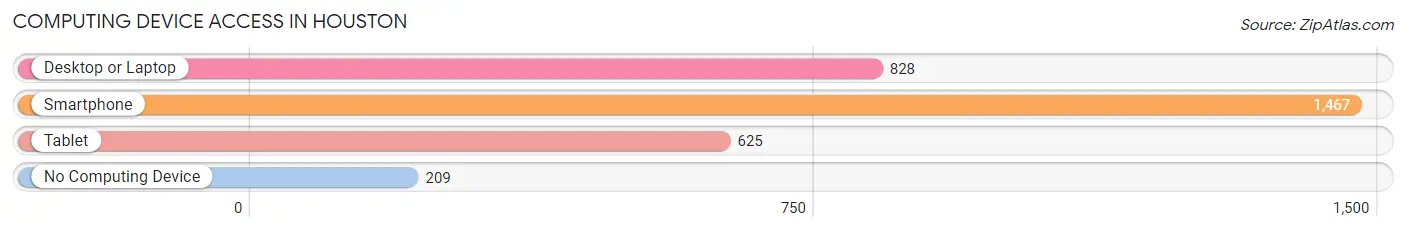
| Device Type | # Households | % Households |
| Desktop or Laptop | 828 | 47.0% |
| Smartphone | 1,467 | 83.3% |
| Tablet | 625 | 35.5% |
| No Computing Device | 209 | 11.9% |
| Total | 1,762 | 100.0% |
Internet Access in Houston
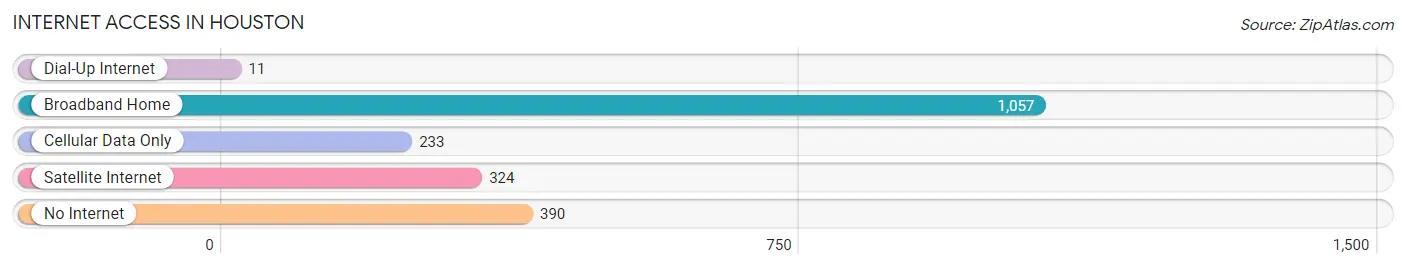
| Internet Type | # Households | % Households |
| Dial-Up Internet | 11 | 0.6% |
| Broadband Home | 1,057 | 60.0% |
| Cellular Data Only | 233 | 13.2% |
| Satellite Internet | 324 | 18.4% |
| No Internet | 390 | 22.1% |
| Total | 1,762 | 100.0% |
Houston Summary
Houston, Mississippi is a small city located in the northern part of the state, in Chickasaw County. It is the county seat and the largest city in the county. The city is located on the banks of the Tallahatchie River, and is part of the Tupelo-Corinth-Fulton Combined Statistical Area. The city has a population of approximately 3,000 people, and is the home of the University of Mississippi Medical Center.
History
Houston was founded in 1836 by William Houston, a Chickasaw Indian. The city was named after him, and was originally known as Houstonville. The city was incorporated in 1837, and was the first city in Chickasaw County. The city was a major trading center for the Chickasaw Nation, and was a major stop on the Natchez Trace.
During the Civil War, Houston was the site of a major battle between Union and Confederate forces. The Battle of Houston was fought on April 12, 1862, and resulted in a Confederate victory. After the war, the city was rebuilt and continued to grow.
Geography
Houston is located in the northern part of Mississippi, in Chickasaw County. The city is situated on the banks of the Tallahatchie River, and is part of the Tupelo-Corinth-Fulton Combined Statistical Area. The city has a total area of 4.2 square miles, all of which is land.
Economy
Houston’s economy is largely based on agriculture and manufacturing. The city is home to several large manufacturing plants, including a Tyson Foods plant and a Georgia-Pacific plant. The city is also home to several small businesses, including restaurants, retail stores, and service providers.
Demographics
As of the 2010 census, Houston had a population of 3,078 people. The racial makeup of the city was 73.3% White, 24.2% African American, 0.3% Native American, 0.2% Asian, 0.1% Pacific Islander, 0.7% from other races, and 1.4% from two or more races. Hispanic or Latino of any race were 1.7% of the population.
The median income for a household in the city was $30,938, and the median income for a family was $37,917. The per capita income for the city was $15,945. About 19.2% of families and 22.2% of the population were below the poverty line, including 33.3% of those under age 18 and 16.2% of those age 65 or over.
Common Questions
What is Per Capita Income in Houston?
Per Capita income in Houston is $20,649.
What is the Median Family Income in Houston?
Median Family Income in Houston is $47,543.
What is the Median Household income in Houston?
Median Household Income in Houston is $32,410.
What is Income or Wage Gap in Houston?
Income or Wage Gap in Houston is 21.3%.
Women in Houston earn 78.7 cents for every dollar earned by a man.
What is Inequality or Gini Index in Houston?
Inequality or Gini Index in Houston is 0.42.
What is the Total Population of Houston?
Total Population of Houston is 3,762.
What is the Total Male Population of Houston?
Total Male Population of Houston is 1,610.
What is the Total Female Population of Houston?
Total Female Population of Houston is 2,152.
What is the Ratio of Males per 100 Females in Houston?
There are 74.81 Males per 100 Females in Houston.
What is the Ratio of Females per 100 Males in Houston?
There are 133.66 Females per 100 Males in Houston.
What is the Median Population Age in Houston?
Median Population Age in Houston is 46.4 Years.
What is the Average Family Size in Houston
Average Family Size in Houston is 2.7 People.
What is the Average Household Size in Houston
Average Household Size in Houston is 2.1 People.
How Large is the Labor Force in Houston?
There are 1,543 People in the Labor Forcein in Houston.
What is the Percentage of People in the Labor Force in Houston?
49.6% of People are in the Labor Force in Houston.
What is the Unemployment Rate in Houston?
Unemployment Rate in Houston is 3.3%.