Terry, MS Map & Demographics
Terry Map
Terry Overview
$27,193
PER CAPITA INCOME
$45,125
AVG FAMILY INCOME
$46,585
AVG HOUSEHOLD INCOME
38.6%
WAGE / INCOME GAP [ % ]
61.4¢/ $1
WAGE / INCOME GAP [ $ ]
$9,640
FAMILY INCOME DEFICIT
0.52
INEQUALITY / GINI INDEX
1,541
TOTAL POPULATION
746
MALE POPULATION
795
FEMALE POPULATION
93.84
MALES / 100 FEMALES
106.57
FEMALES / 100 MALES
28.5
MEDIAN AGE
3.4
AVG FAMILY SIZE
3.2
AVG HOUSEHOLD SIZE
585
LABOR FORCE [ PEOPLE ]
58.6%
PERCENT IN LABOR FORCE
0.9%
UNEMPLOYMENT RATE
Terry Zip Codes
Income in Terry
Income Overview in Terry
Per Capita Income in Terry is $27,193, while median incomes of families and households are $45,125 and $46,585 respectively.
| Characteristic | Number | Measure |
| Per Capita Income | 1,541 | $27,193 |
| Median Family Income | 423 | $45,125 |
| Mean Family Income | 423 | $89,074 |
| Median Household Income | 488 | $46,585 |
| Mean Household Income | 488 | $85,633 |
| Income Deficit | 423 | $9,640 |
| Wage / Income Gap (%) | 1,541 | 38.65% |
| Wage / Income Gap ($) | 1,541 | 61.35¢ per $1 |
| Gini / Inequality Index | 1,541 | 0.52 |
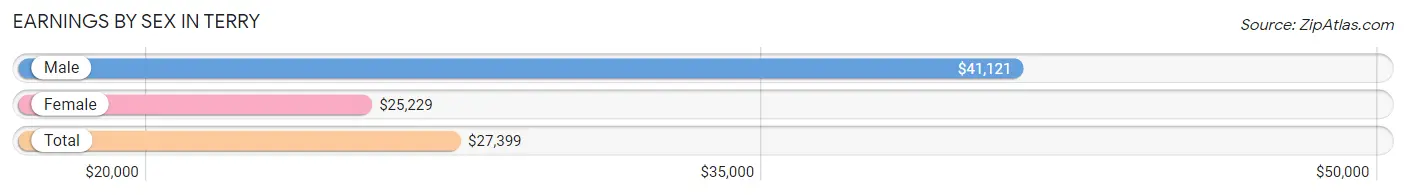
Earnings by Sex in Terry
Average Earnings in Terry are $27,399, $41,121 for men and $25,229 for women, a difference of 38.7%.
| Sex | Number | Average Earnings |
| Male | 246 (38.6%) | $41,121 |
| Female | 391 (61.4%) | $25,229 |
| Total | 637 (100.0%) | $27,399 |
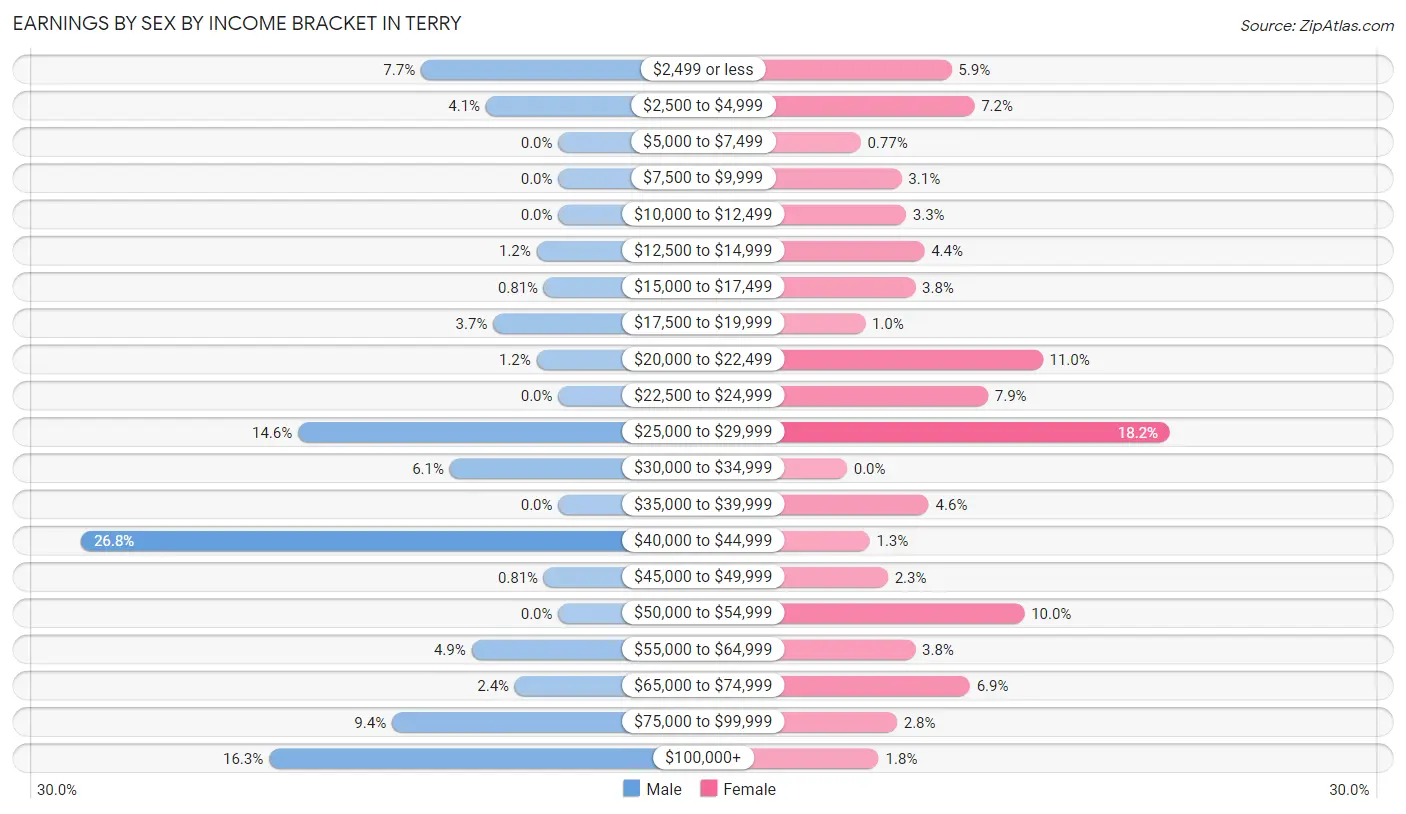
Earnings by Sex by Income Bracket in Terry
The most common earnings brackets in Terry are $40,000 to $44,999 for men (66 | 26.8%) and $25,000 to $29,999 for women (71 | 18.2%).
| Income | Male | Female |
| $2,499 or less | 19 (7.7%) | 23 (5.9%) |
| $2,500 to $4,999 | 10 (4.1%) | 28 (7.2%) |
| $5,000 to $7,499 | 0 (0.0%) | 3 (0.8%) |
| $7,500 to $9,999 | 0 (0.0%) | 12 (3.1%) |
| $10,000 to $12,499 | 0 (0.0%) | 13 (3.3%) |
| $12,500 to $14,999 | 3 (1.2%) | 17 (4.3%) |
| $15,000 to $17,499 | 2 (0.8%) | 15 (3.8%) |
| $17,500 to $19,999 | 9 (3.7%) | 4 (1.0%) |
| $20,000 to $22,499 | 3 (1.2%) | 43 (11.0%) |
| $22,500 to $24,999 | 0 (0.0%) | 31 (7.9%) |
| $25,000 to $29,999 | 36 (14.6%) | 71 (18.2%) |
| $30,000 to $34,999 | 15 (6.1%) | 0 (0.0%) |
| $35,000 to $39,999 | 0 (0.0%) | 18 (4.6%) |
| $40,000 to $44,999 | 66 (26.8%) | 5 (1.3%) |
| $45,000 to $49,999 | 2 (0.8%) | 9 (2.3%) |
| $50,000 to $54,999 | 0 (0.0%) | 39 (10.0%) |
| $55,000 to $64,999 | 12 (4.9%) | 15 (3.8%) |
| $65,000 to $74,999 | 6 (2.4%) | 27 (6.9%) |
| $75,000 to $99,999 | 23 (9.3%) | 11 (2.8%) |
| $100,000+ | 40 (16.3%) | 7 (1.8%) |
| Total | 246 (100.0%) | 391 (100.0%) |
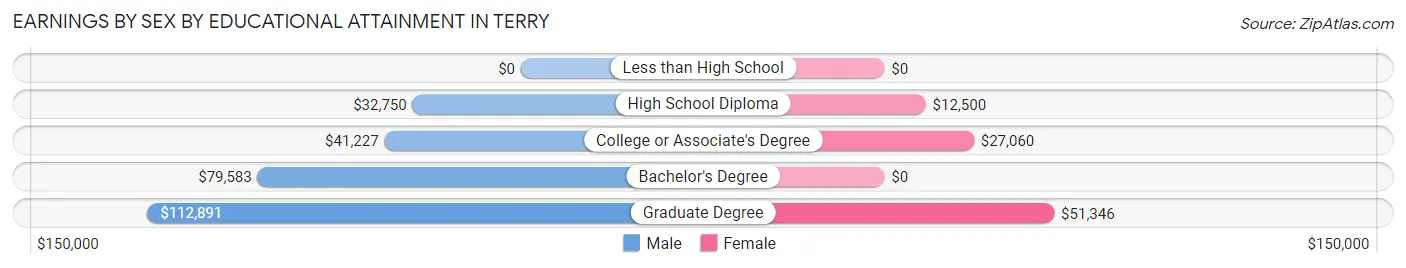
Earnings by Sex by Educational Attainment in Terry
Average earnings in Terry are $42,392 for men and $26,937 for women, a difference of 36.5%. Men with an educational attainment of graduate degree enjoy the highest average annual earnings of $112,891, while those with high school diploma education earn the least with $32,750. Women with an educational attainment of graduate degree earn the most with the average annual earnings of $51,346, while those with high school diploma education have the smallest earnings of $12,500.
| Educational Attainment | Male Income | Female Income |
| Less than High School | - | - |
| High School Diploma | $32,750 | $12,500 |
| College or Associate's Degree | $41,227 | $27,060 |
| Bachelor's Degree | $79,583 | $0 |
| Graduate Degree | $112,891 | $51,346 |
| Total | $42,392 | $26,937 |
Family Income in Terry
Family Income Brackets in Terry
According to the Terry family income data, there are 128 families falling into the $35,000 to $49,999 income range, which is the most common income bracket and makes up 30.3% of all families. Conversely, the less than $10,000 income bracket is the least frequent group with only 2 families (0.5%) belonging to this category.
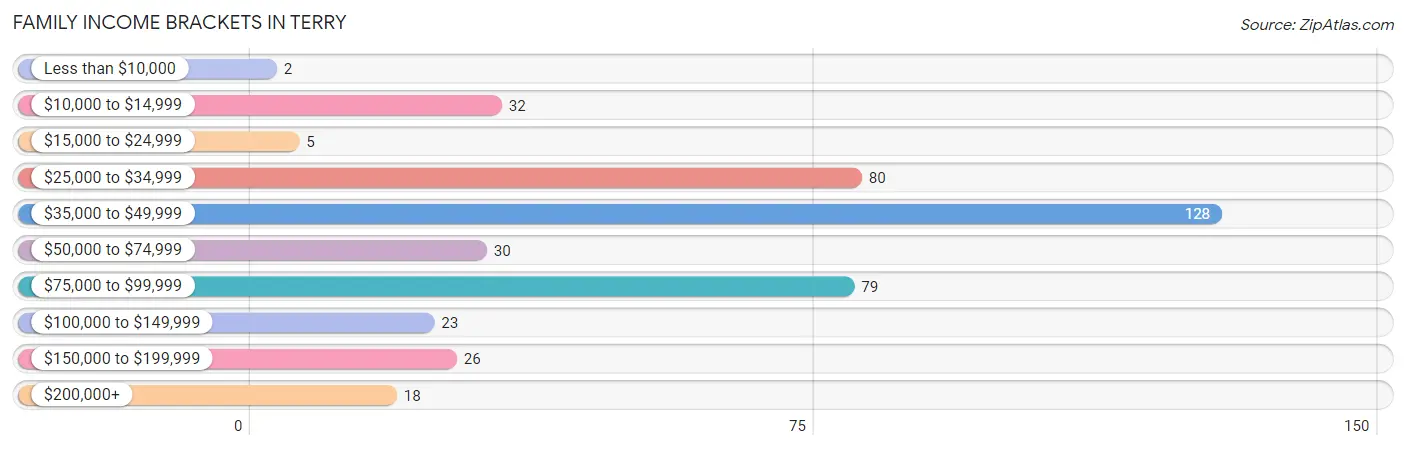
| Income Bracket | # Families | % Families |
| Less than $10,000 | 2 | 0.5% |
| $10,000 to $14,999 | 32 | 7.6% |
| $15,000 to $24,999 | 5 | 1.2% |
| $25,000 to $34,999 | 80 | 18.9% |
| $35,000 to $49,999 | 128 | 30.3% |
| $50,000 to $74,999 | 30 | 7.1% |
| $75,000 to $99,999 | 79 | 18.7% |
| $100,000 to $149,999 | 23 | 5.4% |
| $150,000 to $199,999 | 26 | 6.1% |
| $200,000+ | 18 | 4.3% |
Family Income by Famaliy Size in Terry
5-person families (42 | 9.9%) account for the highest median family income in Terry with $83,750 per family, while 2-person families (124 | 29.3%) have the highest median income of $40,500 per family member.
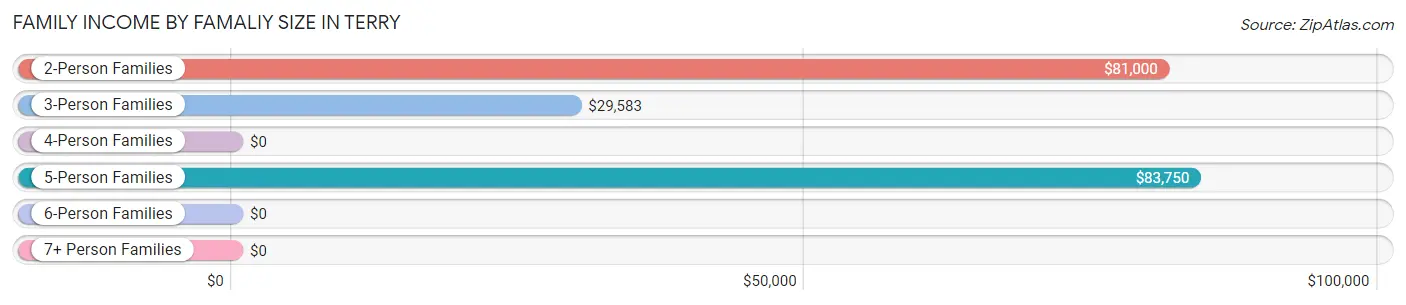
| Income Bracket | # Families | Median Income |
| 2-Person Families | 124 (29.3%) | $81,000 |
| 3-Person Families | 176 (41.6%) | $29,583 |
| 4-Person Families | 24 (5.7%) | $0 |
| 5-Person Families | 42 (9.9%) | $83,750 |
| 6-Person Families | 57 (13.5%) | $0 |
| 7+ Person Families | 0 (0.0%) | $0 |
| Total | 423 (100.0%) | $45,125 |
Family Income by Number of Earners in Terry
The median family income in Terry is $45,125, with families comprising 2 earners (103) having the highest median family income of $94,583, while families with no earners (28) have the lowest median family income of $37,500, accounting for 24.3% and 6.6% of families, respectively.
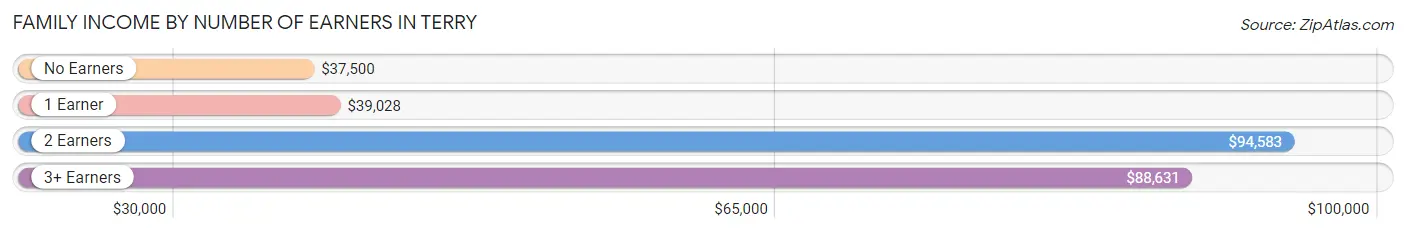
| Number of Earners | # Families | Median Income |
| No Earners | 28 (6.6%) | $37,500 |
| 1 Earner | 257 (60.8%) | $39,028 |
| 2 Earners | 103 (24.3%) | $94,583 |
| 3+ Earners | 35 (8.3%) | $88,631 |
| Total | 423 (100.0%) | $45,125 |
Household Income in Terry
Household Income Brackets in Terry
With 148 households falling in the category, the $35,000 to $49,999 income range is the most frequent in Terry, accounting for 30.3% of all households. In contrast, only 5 households (1.0%) fall into the less than $10,000 income bracket, making it the least populous group.
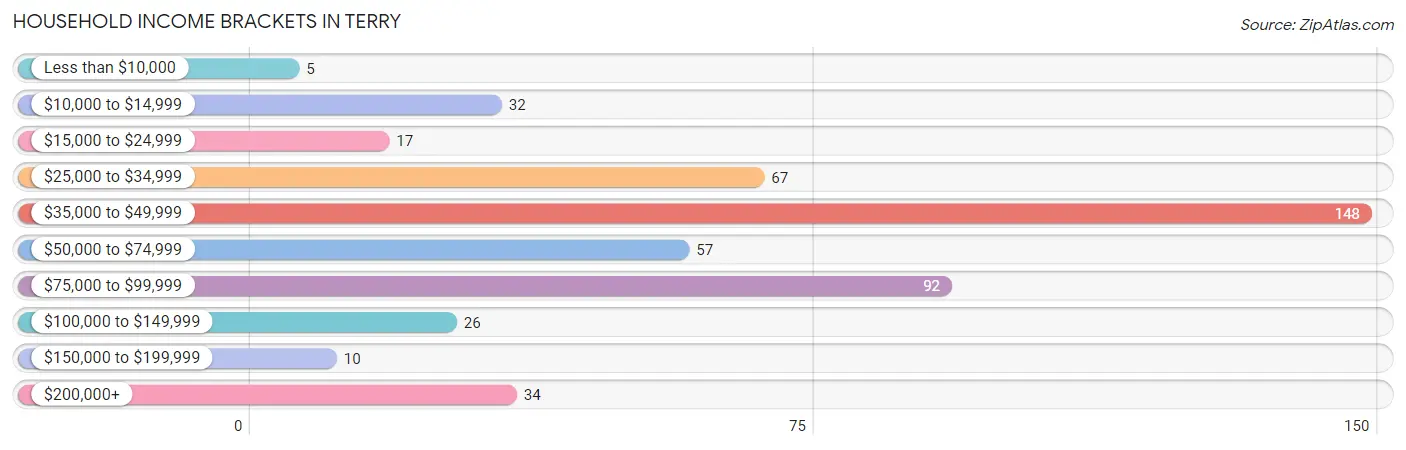
| Income Bracket | # Households | % Households |
| Less than $10,000 | 5 | 1.0% |
| $10,000 to $14,999 | 32 | 6.6% |
| $15,000 to $24,999 | 17 | 3.5% |
| $25,000 to $34,999 | 67 | 13.7% |
| $35,000 to $49,999 | 148 | 30.3% |
| $50,000 to $74,999 | 57 | 11.7% |
| $75,000 to $99,999 | 92 | 18.9% |
| $100,000 to $149,999 | 26 | 5.3% |
| $150,000 to $199,999 | 10 | 2.0% |
| $200,000+ | 34 | 7.0% |
Household Income by Householder Age in Terry
The median household income in Terry is $46,585, with the highest median household income of $55,625 found in the 45 to 64 years age bracket for the primary householder. A total of 156 households (32.0%) fall into this category.
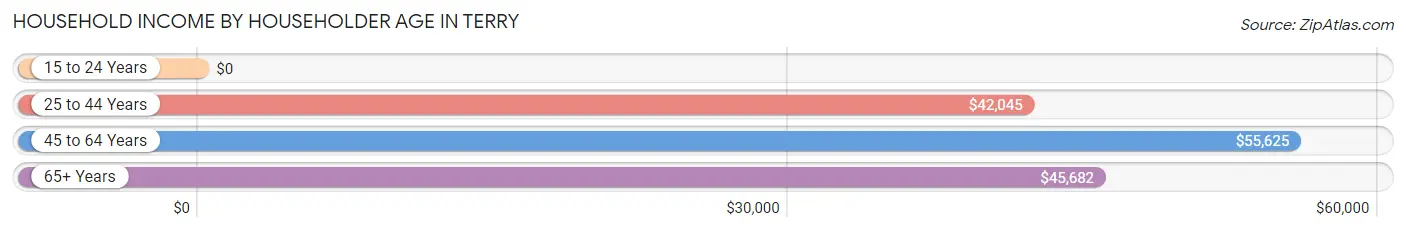
| Income Bracket | # Households | Median Income |
| 15 to 24 Years | 0 (0.0%) | $0 |
| 25 to 44 Years | 256 (52.5%) | $42,045 |
| 45 to 64 Years | 156 (32.0%) | $55,625 |
| 65+ Years | 76 (15.6%) | $45,682 |
| Total | 488 (100.0%) | $46,585 |
Poverty in Terry
Income Below Poverty by Sex and Age in Terry
With 11.8% poverty level for males and 7.7% for females among the residents of Terry, 75 year old and over males and 5 year old females are the most vulnerable to poverty, with 2 males (100.0%) and 10 females (83.3%) in their respective age groups living below the poverty level.
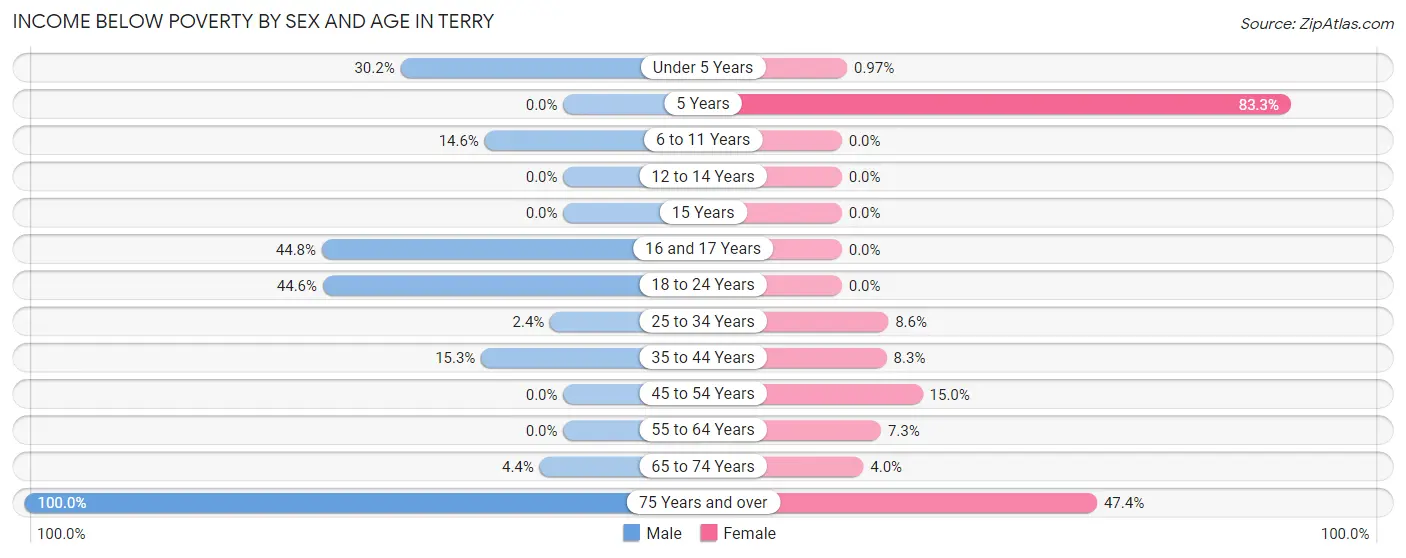
| Age Bracket | Male | Female |
| Under 5 Years | 13 (30.2%) | 1 (1.0%) |
| 5 Years | 0 (0.0%) | 10 (83.3%) |
| 6 to 11 Years | 20 (14.6%) | 0 (0.0%) |
| 12 to 14 Years | 0 (0.0%) | 0 (0.0%) |
| 15 Years | 0 (0.0%) | 0 (0.0%) |
| 16 and 17 Years | 13 (44.8%) | 0 (0.0%) |
| 18 to 24 Years | 25 (44.6%) | 0 (0.0%) |
| 25 to 34 Years | 2 (2.4%) | 15 (8.6%) |
| 35 to 44 Years | 9 (15.2%) | 8 (8.3%) |
| 45 to 54 Years | 0 (0.0%) | 12 (15.0%) |
| 55 to 64 Years | 0 (0.0%) | 4 (7.3%) |
| 65 to 74 Years | 3 (4.4%) | 2 (4.0%) |
| 75 Years and over | 2 (100.0%) | 9 (47.4%) |
| Total | 87 (11.8%) | 61 (7.7%) |
Income Above Poverty by Sex and Age in Terry
According to the poverty statistics in Terry, males aged 5 years and females aged 6 to 11 years are the age groups that are most secure financially, with 100.0% of males and 100.0% of females in these age groups living above the poverty line.
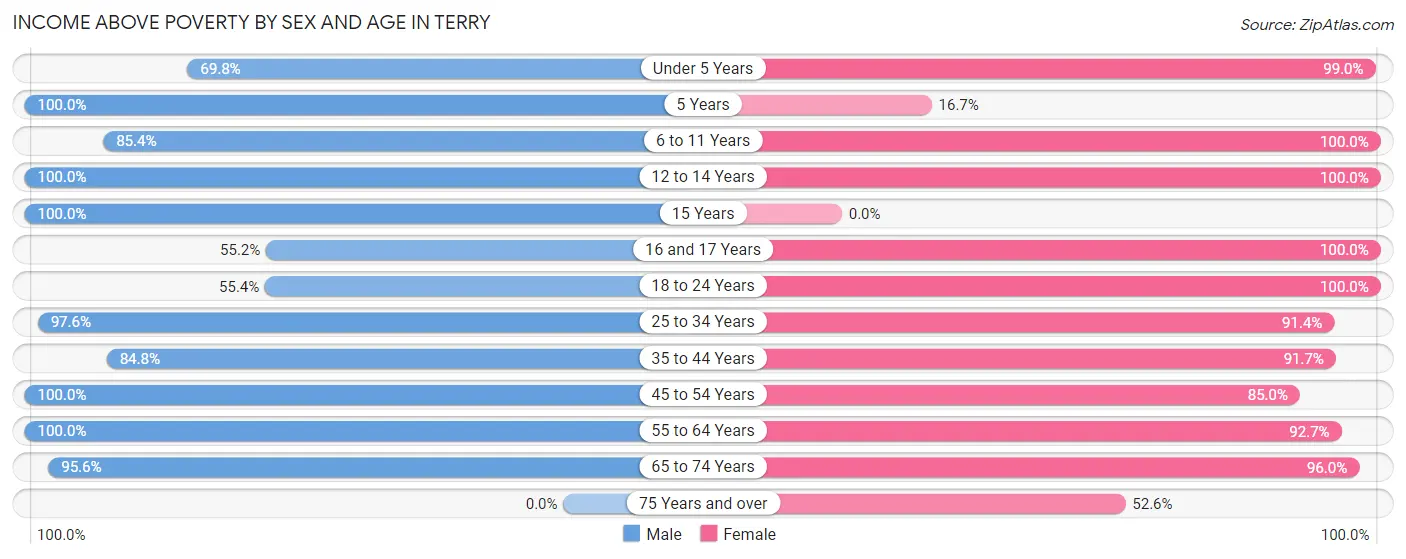
| Age Bracket | Male | Female |
| Under 5 Years | 30 (69.8%) | 102 (99.0%) |
| 5 Years | 95 (100.0%) | 2 (16.7%) |
| 6 to 11 Years | 117 (85.4%) | 45 (100.0%) |
| 12 to 14 Years | 57 (100.0%) | 37 (100.0%) |
| 15 Years | 6 (100.0%) | 0 (0.0%) |
| 16 and 17 Years | 16 (55.2%) | 51 (100.0%) |
| 18 to 24 Years | 31 (55.4%) | 71 (100.0%) |
| 25 to 34 Years | 80 (97.6%) | 159 (91.4%) |
| 35 to 44 Years | 50 (84.8%) | 88 (91.7%) |
| 45 to 54 Years | 35 (100.0%) | 68 (85.0%) |
| 55 to 64 Years | 71 (100.0%) | 51 (92.7%) |
| 65 to 74 Years | 65 (95.6%) | 48 (96.0%) |
| 75 Years and over | 0 (0.0%) | 10 (52.6%) |
| Total | 653 (88.2%) | 732 (92.3%) |
Income Below Poverty Among Married-Couple Families in Terry
The poverty statistics for married-couple families in Terry show that 6.1% or 13 of the total 213 families live below the poverty line. Families with 1 or 2 children have the highest poverty rate of 12.2%, comprising of 9 families. On the other hand, families with 3 or 4 children have the lowest poverty rate of 0.0%, which includes 0 families.
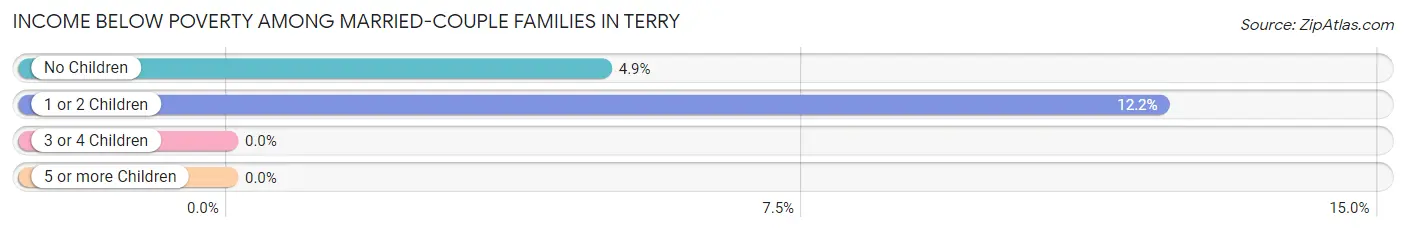
| Children | Above Poverty | Below Poverty |
| No Children | 78 (95.1%) | 4 (4.9%) |
| 1 or 2 Children | 65 (87.8%) | 9 (12.2%) |
| 3 or 4 Children | 57 (100.0%) | 0 (0.0%) |
| 5 or more Children | 0 (0.0%) | 0 (0.0%) |
| Total | 200 (93.9%) | 13 (6.1%) |
Income Below Poverty Among Single-Parent Households in Terry
| Children | Single Father | Single Mother |
| No Children | 0 (0.0%) | 0 (0.0%) |
| 1 or 2 Children | 0 (0.0%) | 22 (17.9%) |
| 3 or 4 Children | 0 (0.0%) | 0 (0.0%) |
| 5 or more Children | 0 (0.0%) | 0 (0.0%) |
| Total | 0 (0.0%) | 22 (12.9%) |
Income Below Poverty Among Married-Couple vs Single-Parent Households in Terry
The poverty data for Terry shows that 13 of the married-couple family households (6.1%) and 22 of the single-parent households (10.5%) are living below the poverty level. Within the married-couple family households, those with 1 or 2 children have the highest poverty rate, with 9 households (12.2%) falling below the poverty line. Among the single-parent households, those with 1 or 2 children have the highest poverty rate, with 22 household (14.5%) living below poverty.
| Children | Married-Couple Families | Single-Parent Households |
| No Children | 4 (4.9%) | 0 (0.0%) |
| 1 or 2 Children | 9 (12.2%) | 22 (14.5%) |
| 3 or 4 Children | 0 (0.0%) | 0 (0.0%) |
| 5 or more Children | 0 (0.0%) | 0 (0.0%) |
| Total | 13 (6.1%) | 22 (10.5%) |
Race in Terry
The most populous races in Terry are Black / African American (1,295 | 84.0%), White / Caucasian (223 | 14.5%), and Hispanic or Latino (17 | 1.1%).
| Race | # Population | % Population |
| Asian | 0 | 0.0% |
| Black / African American | 1,295 | 84.0% |
| Hawaiian / Pacific | 0 | 0.0% |
| Hispanic or Latino | 17 | 1.1% |
| Native / Alaskan | 17 | 1.1% |
| White / Caucasian | 223 | 14.5% |
| Two or more Races | 6 | 0.4% |
| Some other Race | 0 | 0.0% |
| Total | 1,541 | 100.0% |
Ancestry in Terry
The most populous ancestries reported in Terry are Irish (65 | 4.2%), German (39 | 2.5%), African (36 | 2.3%), American (36 | 2.3%), and Subsaharan African (36 | 2.3%), together accounting for 13.8% of all Terry residents.
| Ancestry | # Population | % Population |
| African | 36 | 2.3% |
| American | 36 | 2.3% |
| Central American | 8 | 0.5% |
| Central American Indian | 8 | 0.5% |
| Cherokee | 2 | 0.1% |
| English | 3 | 0.2% |
| French | 6 | 0.4% |
| French Canadian | 3 | 0.2% |
| German | 39 | 2.5% |
| Guatemalan | 8 | 0.5% |
| Irish | 65 | 4.2% |
| Italian | 3 | 0.2% |
| Mexican | 9 | 0.6% |
| Mexican American Indian | 9 | 0.6% |
| Scotch-Irish | 4 | 0.3% |
| Subsaharan African | 36 | 2.3% | View All 16 Rows |
Immigrants in Terry
The most numerous immigrant groups reported in Terry came from Central America (6 | 0.4%), Guatemala (6 | 0.4%), and Latin America (6 | 0.4%), together accounting for 1.2% of all Terry residents.
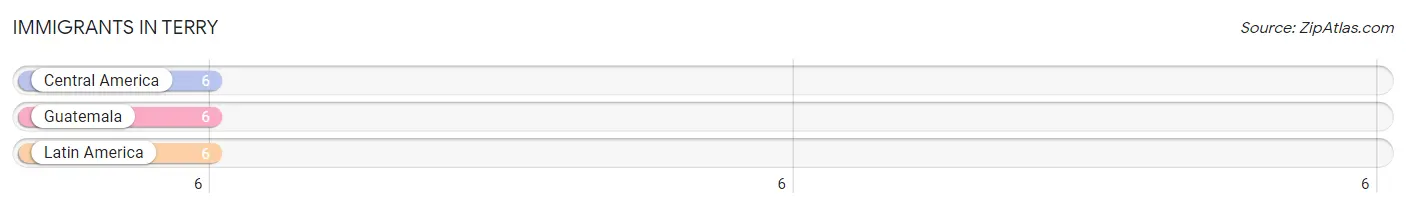
| Immigration Origin | # Population | % Population |
| Central America | 6 | 0.4% |
| Guatemala | 6 | 0.4% |
| Latin America | 6 | 0.4% | View All 3 Rows |
Sex and Age in Terry
Sex and Age in Terry
The most populous age groups in Terry are 5 to 9 Years (150 | 20.1%) for men and 30 to 34 Years (150 | 18.9%) for women.
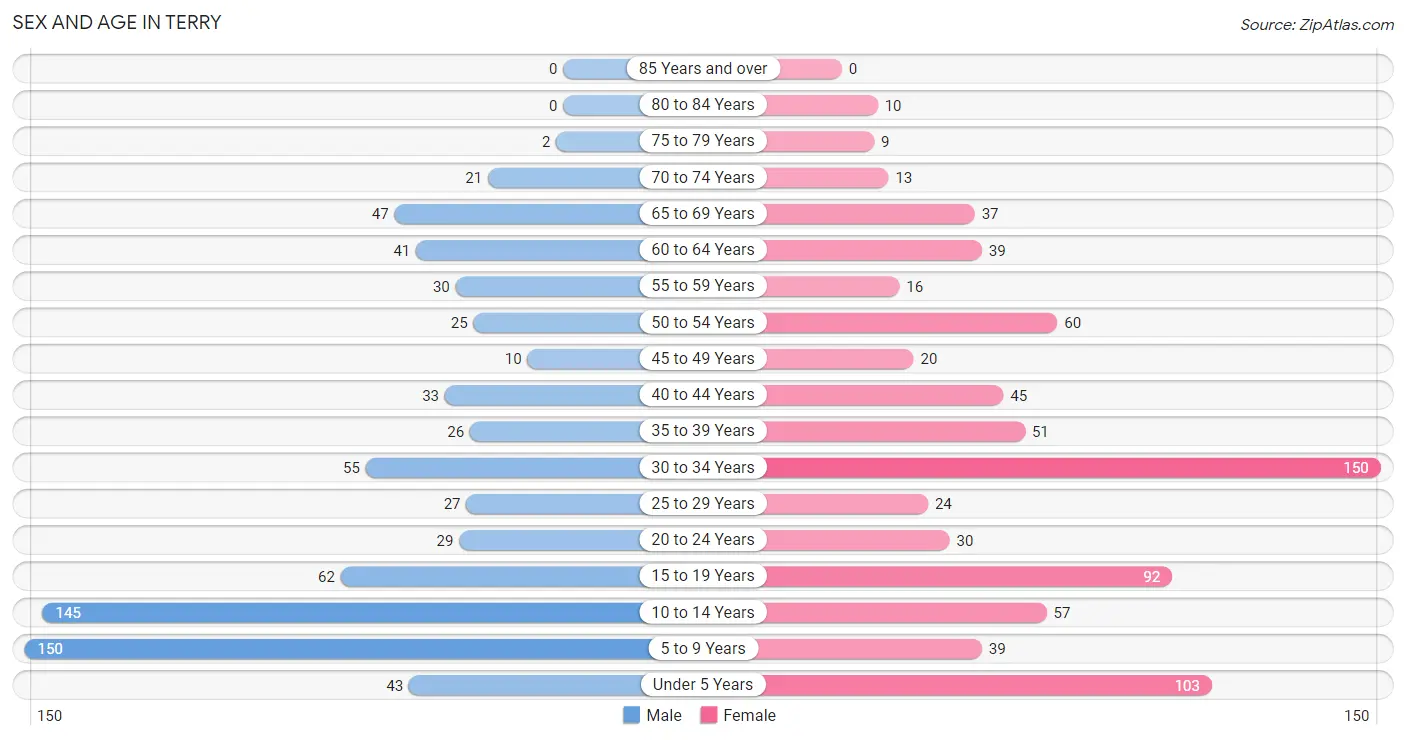
| Age Bracket | Male | Female |
| Under 5 Years | 43 (5.8%) | 103 (13.0%) |
| 5 to 9 Years | 150 (20.1%) | 39 (4.9%) |
| 10 to 14 Years | 145 (19.4%) | 57 (7.2%) |
| 15 to 19 Years | 62 (8.3%) | 92 (11.6%) |
| 20 to 24 Years | 29 (3.9%) | 30 (3.8%) |
| 25 to 29 Years | 27 (3.6%) | 24 (3.0%) |
| 30 to 34 Years | 55 (7.4%) | 150 (18.9%) |
| 35 to 39 Years | 26 (3.5%) | 51 (6.4%) |
| 40 to 44 Years | 33 (4.4%) | 45 (5.7%) |
| 45 to 49 Years | 10 (1.3%) | 20 (2.5%) |
| 50 to 54 Years | 25 (3.4%) | 60 (7.5%) |
| 55 to 59 Years | 30 (4.0%) | 16 (2.0%) |
| 60 to 64 Years | 41 (5.5%) | 39 (4.9%) |
| 65 to 69 Years | 47 (6.3%) | 37 (4.6%) |
| 70 to 74 Years | 21 (2.8%) | 13 (1.6%) |
| 75 to 79 Years | 2 (0.3%) | 9 (1.1%) |
| 80 to 84 Years | 0 (0.0%) | 10 (1.3%) |
| 85 Years and over | 0 (0.0%) | 0 (0.0%) |
| Total | 746 (100.0%) | 795 (100.0%) |
Families and Households in Terry
Median Family Size in Terry
The median family size in Terry is 3.35 persons per family, with married-couple families (213 | 50.3%) accounting for the largest median family size of 3.61 persons per family. On the other hand, single male/father families (40 | 9.5%) represent the smallest median family size with 2.80 persons per family.
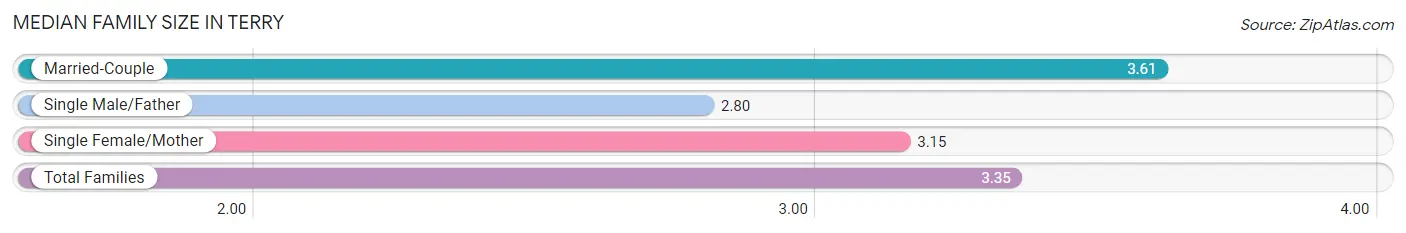
| Family Type | # Families | Family Size |
| Married-Couple | 213 (50.3%) | 3.61 |
| Single Male/Father | 40 (9.5%) | 2.80 |
| Single Female/Mother | 170 (40.2%) | 3.15 |
| Total Families | 423 (100.0%) | 3.35 |
Median Household Size in Terry
The median household size in Terry is 3.16 persons per household, with married-couple households (213 | 43.6%) accounting for the largest median household size of 3.74 persons per household. non-family households (65 | 13.3%) represent the smallest median household size with 1.18 persons per household.
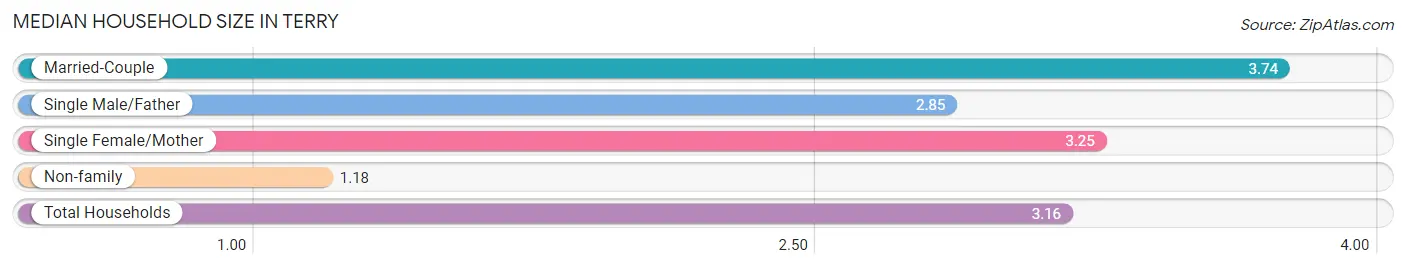
| Household Type | # Households | Household Size |
| Married-Couple | 213 (43.6%) | 3.74 |
| Single Male/Father | 40 (8.2%) | 2.85 |
| Single Female/Mother | 170 (34.8%) | 3.25 |
| Non-family | 65 (13.3%) | 1.18 |
| Total Households | 488 (100.0%) | 3.16 |
Household Size by Marriage Status in Terry
Out of a total of 488 households in Terry, 423 (86.7%) are family households, while 65 (13.3%) are nonfamily households. The most numerous type of family households are 3-person households, comprising 144, and the most common type of nonfamily households are 1-person households, comprising 59.
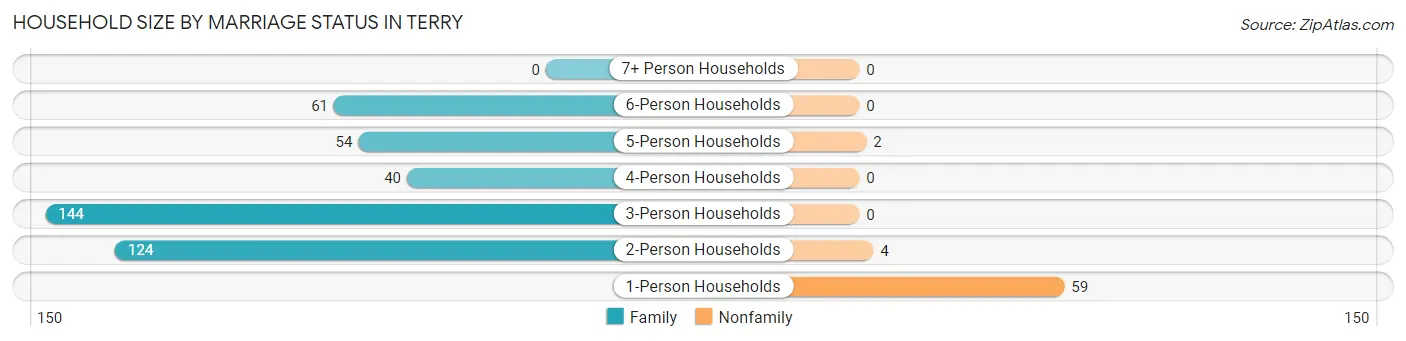
| Household Size | Family Households | Nonfamily Households |
| 1-Person Households | - | 59 (12.1%) |
| 2-Person Households | 124 (25.4%) | 4 (0.8%) |
| 3-Person Households | 144 (29.5%) | 0 (0.0%) |
| 4-Person Households | 40 (8.2%) | 0 (0.0%) |
| 5-Person Households | 54 (11.1%) | 2 (0.4%) |
| 6-Person Households | 61 (12.5%) | 0 (0.0%) |
| 7+ Person Households | 0 (0.0%) | 0 (0.0%) |
| Total | 423 (86.7%) | 65 (13.3%) |
Female Fertility in Terry
Fertility by Age in Terry
Average fertility rate in Terry is 21.0 births per 1,000 women. Women in the age bracket of 35 to 50 years have the highest fertility rate with 68.0 births per 1,000 women. Women in the age bracket of 35 to 50 years acount for 100.0% of all women with births.
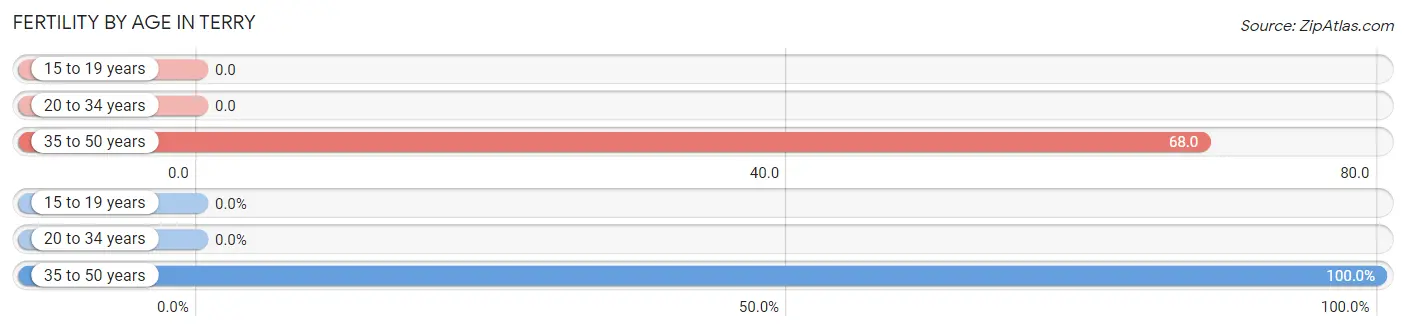
| Age Bracket | Women with Births | Births / 1,000 Women |
| 15 to 19 years | 0 (0.0%) | 0.0 |
| 20 to 34 years | 0 (0.0%) | 0.0 |
| 35 to 50 years | 9 (100.0%) | 68.0 |
| Total | 9 (100.0%) | 21.0 |
Fertility by Age by Marriage Status in Terry
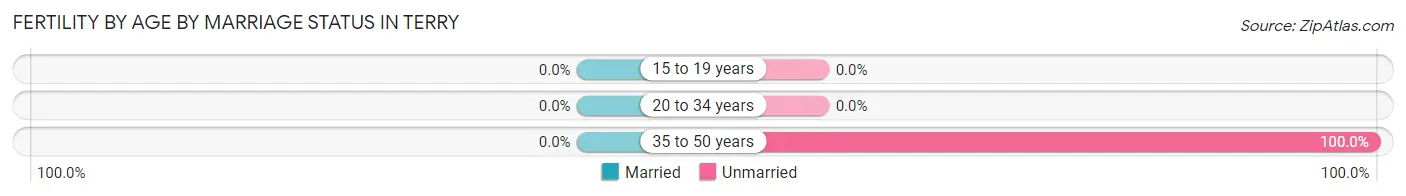
| Age Bracket | Married | Unmarried |
| 15 to 19 years | 0 (0.0%) | 0 (0.0%) |
| 20 to 34 years | 0 (0.0%) | 0 (0.0%) |
| 35 to 50 years | 0 (0.0%) | 9 (100.0%) |
| Total | 0 (0.0%) | 9 (100.0%) |
Fertility by Education in Terry
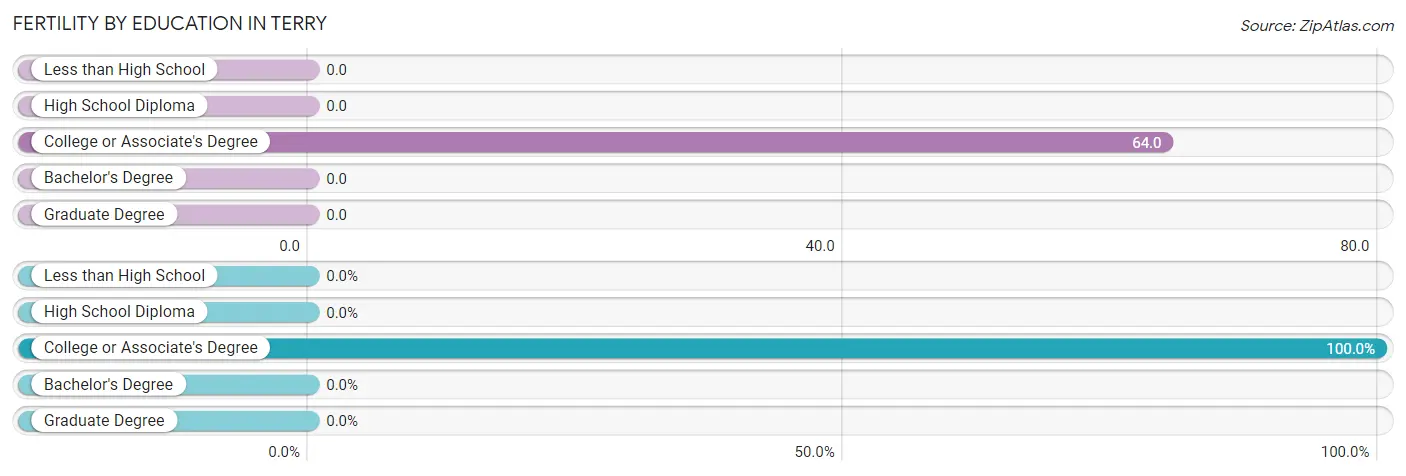
| Educational Attainment | Women with Births | Births / 1,000 Women |
| Less than High School | 0 (0.0%) | 0.0 |
| High School Diploma | 0 (0.0%) | 0.0 |
| College or Associate's Degree | 9 (100.0%) | 64.0 |
| Bachelor's Degree | 0 (0.0%) | 0.0 |
| Graduate Degree | 0 (0.0%) | 0.0 |
| Total | 9 (100.0%) | 21.0 |
Fertility by Education by Marriage Status in Terry
| Educational Attainment | Married | Unmarried |
| Less than High School | 0 (0.0%) | 0 (0.0%) |
| High School Diploma | 0 (0.0%) | 0 (0.0%) |
| College or Associate's Degree | 0 (0.0%) | 9 (100.0%) |
| Bachelor's Degree | 0 (0.0%) | 0 (0.0%) |
| Graduate Degree | 0 (0.0%) | 0 (0.0%) |
| Total | 0 (0.0%) | 9 (100.0%) |
Employment Characteristics in Terry
Employment by Class of Employer in Terry
Among the 568 employed individuals in Terry, private company employees (296 | 52.1%), not-for-profit organizations (103 | 18.1%), and state government employees (46 | 8.1%) make up the most common classes of employment.
| Employer Class | # Employees | % Employees |
| Private Company Employees | 296 | 52.1% |
| Self-Employed (Incorporated) | 30 | 5.3% |
| Self-Employed (Not Incorporated) | 4 | 0.7% |
| Not-for-profit Organizations | 103 | 18.1% |
| Local Government Employees | 41 | 7.2% |
| State Government Employees | 46 | 8.1% |
| Federal Government Employees | 45 | 7.9% |
| Unpaid Family Workers | 3 | 0.5% |
| Total | 568 | 100.0% |
Employment Status by Age in Terry
According to the labor force statistics for Terry, out of the total population over 16 years of age (998), 58.6% or 585 individuals are in the labor force, with 0.9% or 5 of them unemployed. The age group with the highest labor force participation rate is 20 to 24 years, with 100.0% or 59 individuals in the labor force. Within the labor force, the 16 to 19 years age range has the highest percentage of unemployed individuals, with 5.7% or 3 of them being unemployed.
| Age Bracket | In Labor Force | Unemployed |
| 16 to 19 Years | 53 (35.8%) | 3 (5.7%) |
| 20 to 24 Years | 59 (100.0%) | 0 (0.0%) |
| 25 to 29 Years | 42 (82.4%) | 2 (4.8%) |
| 30 to 34 Years | 134 (65.4%) | 0 (0.0%) |
| 35 to 44 Years | 137 (88.4%) | 0 (0.0%) |
| 45 to 54 Years | 95 (82.6%) | 0 (0.0%) |
| 55 to 59 Years | 19 (41.3%) | 0 (0.0%) |
| 60 to 64 Years | 38 (47.5%) | 0 (0.0%) |
| 65 to 74 Years | 8 (6.8%) | 0 (0.0%) |
| 75 Years and over | 0 (0.0%) | 0 (0.0%) |
| Total | 585 (58.6%) | 5 (0.9%) |
Employment Status by Educational Attainment in Terry
According to labor force statistics for Terry, 71.3% of individuals (465) out of the total population between 25 and 64 years of age (652) are in the labor force, with 0.4% or 2 of them being unemployed. The group with the highest labor force participation rate are those with the educational attainment of college / associate degree, with 83.7% or 206 individuals in the labor force. Within the labor force, individuals with high school diploma education have the highest percentage of unemployment, with 3.8% or 2 of them being unemployed.
| Educational Attainment | In Labor Force | Unemployed |
| Less than High School | 16 (61.5%) | 0 (0.0%) |
| High School Diploma | 53 (63.9%) | 3 (3.8%) |
| College / Associate Degree | 206 (83.7%) | 0 (0.0%) |
| Bachelor's Degree or higher | 190 (64.0%) | 0 (0.0%) |
| Total | 465 (71.3%) | 3 (0.4%) |
Employment Occupations by Sex in Terry
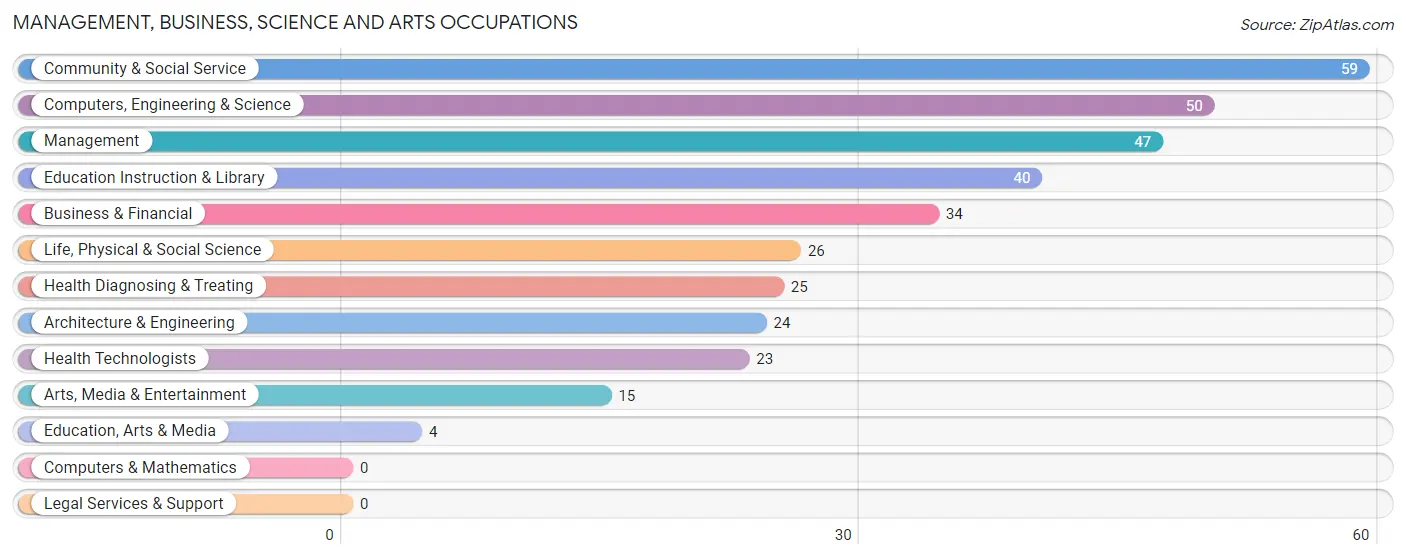
Management, Business, Science and Arts Occupations
The most common Management, Business, Science and Arts occupations in Terry are Community & Social Service (59 | 10.2%), Computers, Engineering & Science (50 | 8.6%), Management (47 | 8.1%), Education Instruction & Library (40 | 6.9%), and Business & Financial (34 | 5.9%).
Management, Business, Science and Arts Occupations by Sex
Within the Management, Business, Science and Arts occupations in Terry, the most male-oriented occupations are Education, Arts & Media (100.0%), Life, Physical & Social Science (61.5%), and Health Technologists (47.8%), while the most female-oriented occupations are Architecture & Engineering (100.0%), Management (89.4%), and Arts, Media & Entertainment (73.3%).
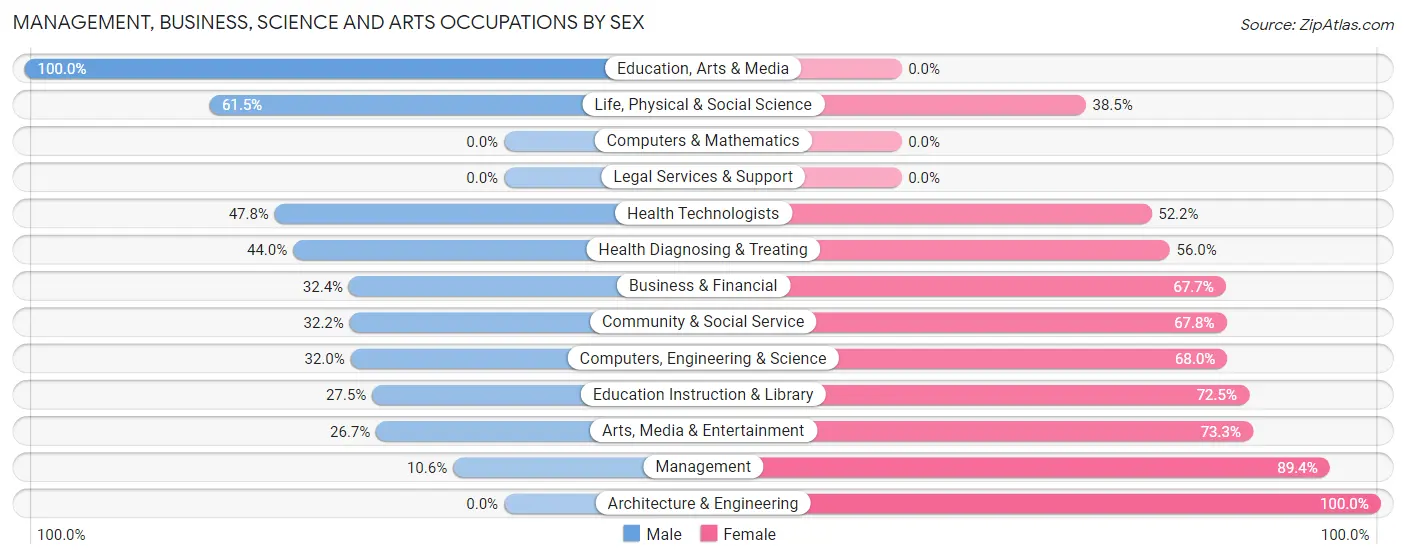
| Occupation | Male | Female |
| Management | 5 (10.6%) | 42 (89.4%) |
| Business & Financial | 11 (32.4%) | 23 (67.6%) |
| Computers, Engineering & Science | 16 (32.0%) | 34 (68.0%) |
| Computers & Mathematics | 0 (0.0%) | 0 (0.0%) |
| Architecture & Engineering | 0 (0.0%) | 24 (100.0%) |
| Life, Physical & Social Science | 16 (61.5%) | 10 (38.5%) |
| Community & Social Service | 19 (32.2%) | 40 (67.8%) |
| Education, Arts & Media | 4 (100.0%) | 0 (0.0%) |
| Legal Services & Support | 0 (0.0%) | 0 (0.0%) |
| Education Instruction & Library | 11 (27.5%) | 29 (72.5%) |
| Arts, Media & Entertainment | 4 (26.7%) | 11 (73.3%) |
| Health Diagnosing & Treating | 11 (44.0%) | 14 (56.0%) |
| Health Technologists | 11 (47.8%) | 12 (52.2%) |
| Total (Category) | 62 (28.8%) | 153 (71.2%) |
| Total (Overall) | 227 (39.1%) | 353 (60.9%) |
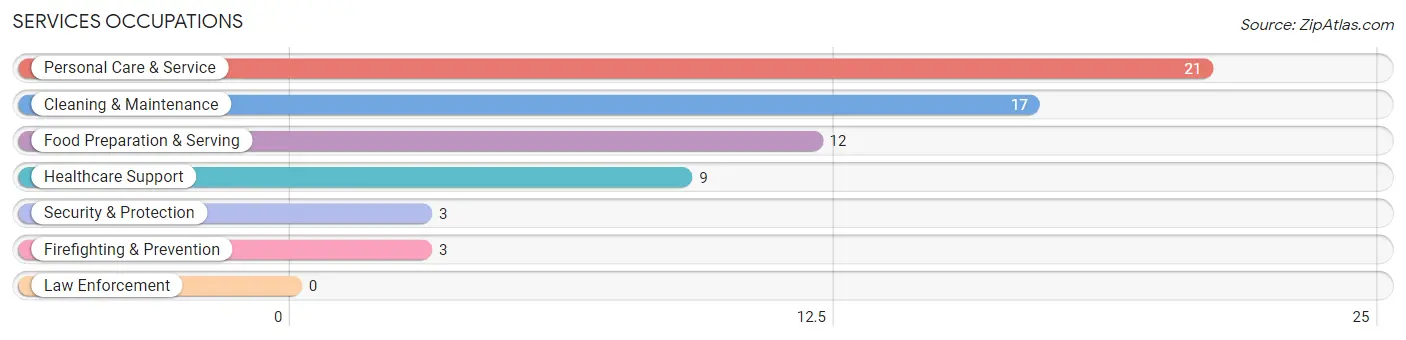
Services Occupations
The most common Services occupations in Terry are Personal Care & Service (21 | 3.6%), Cleaning & Maintenance (17 | 2.9%), Food Preparation & Serving (12 | 2.1%), Healthcare Support (9 | 1.5%), and Security & Protection (3 | 0.5%).
Services Occupations by Sex
Within the Services occupations in Terry, the most male-oriented occupations are Security & Protection (100.0%), Firefighting & Prevention (100.0%), and Cleaning & Maintenance (100.0%), while the most female-oriented occupations are Healthcare Support (100.0%), Food Preparation & Serving (100.0%), and Personal Care & Service (100.0%).
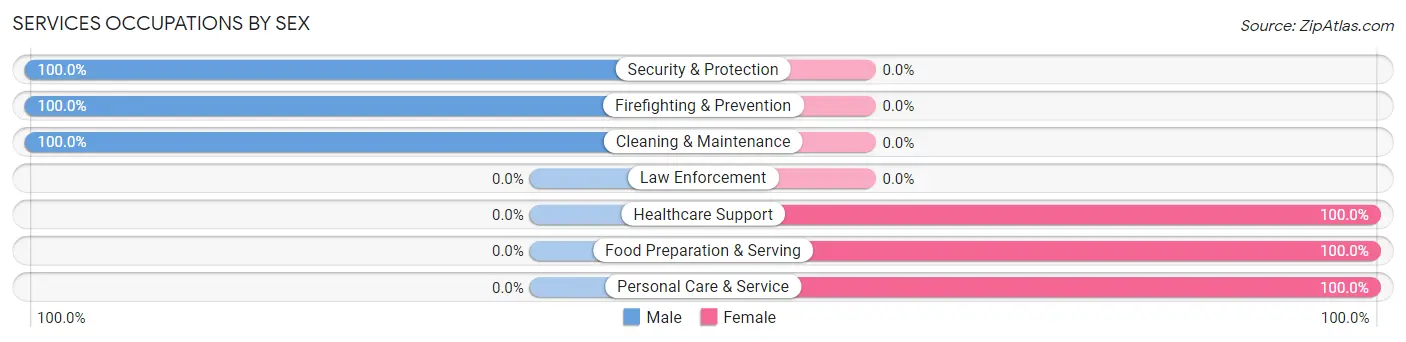
| Occupation | Male | Female |
| Healthcare Support | 0 (0.0%) | 9 (100.0%) |
| Security & Protection | 3 (100.0%) | 0 (0.0%) |
| Firefighting & Prevention | 3 (100.0%) | 0 (0.0%) |
| Law Enforcement | 0 (0.0%) | 0 (0.0%) |
| Food Preparation & Serving | 0 (0.0%) | 12 (100.0%) |
| Cleaning & Maintenance | 17 (100.0%) | 0 (0.0%) |
| Personal Care & Service | 0 (0.0%) | 21 (100.0%) |
| Total (Category) | 20 (32.3%) | 42 (67.7%) |
| Total (Overall) | 227 (39.1%) | 353 (60.9%) |
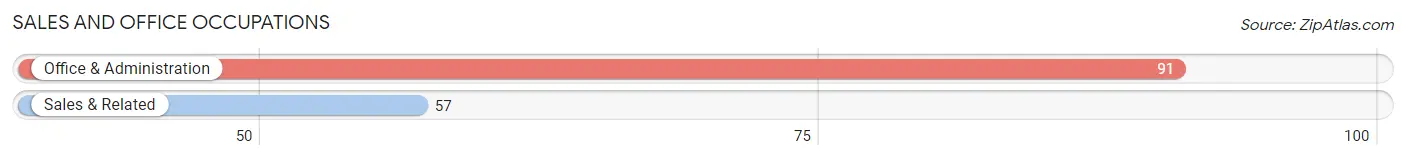
Sales and Office Occupations
The most common Sales and Office occupations in Terry are Office & Administration (91 | 15.7%), and Sales & Related (57 | 9.8%).
Sales and Office Occupations by Sex
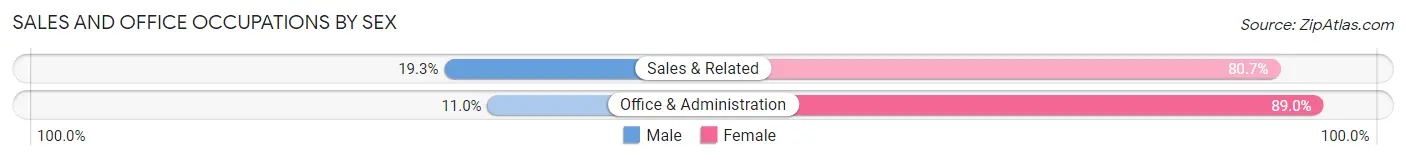
| Occupation | Male | Female |
| Sales & Related | 11 (19.3%) | 46 (80.7%) |
| Office & Administration | 10 (11.0%) | 81 (89.0%) |
| Total (Category) | 21 (14.2%) | 127 (85.8%) |
| Total (Overall) | 227 (39.1%) | 353 (60.9%) |
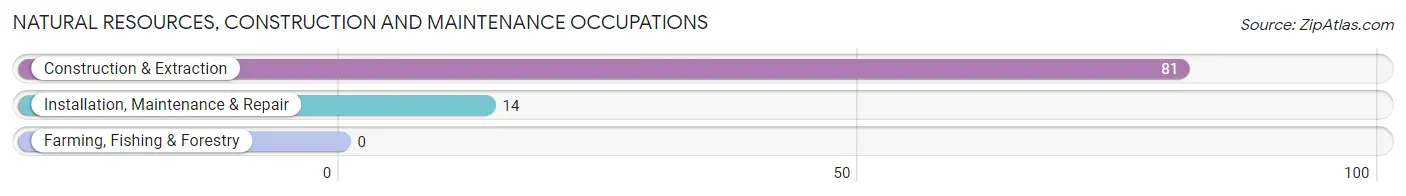
Natural Resources, Construction and Maintenance Occupations
The most common Natural Resources, Construction and Maintenance occupations in Terry are Construction & Extraction (81 | 14.0%), and Installation, Maintenance & Repair (14 | 2.4%).
Natural Resources, Construction and Maintenance Occupations by Sex
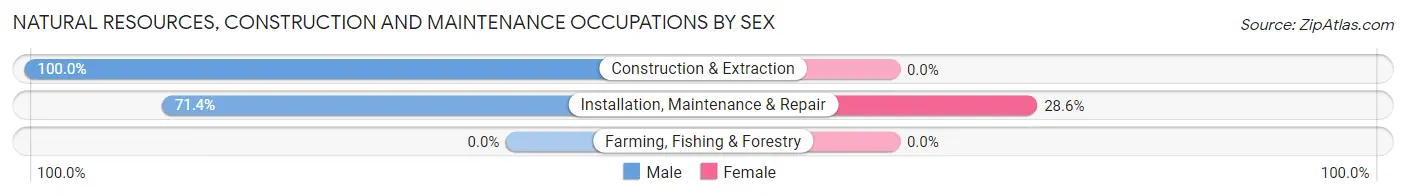
| Occupation | Male | Female |
| Farming, Fishing & Forestry | 0 (0.0%) | 0 (0.0%) |
| Construction & Extraction | 81 (100.0%) | 0 (0.0%) |
| Installation, Maintenance & Repair | 10 (71.4%) | 4 (28.6%) |
| Total (Category) | 91 (95.8%) | 4 (4.2%) |
| Total (Overall) | 227 (39.1%) | 353 (60.9%) |
Production, Transportation and Moving Occupations
The most common Production, Transportation and Moving occupations in Terry are Production (27 | 4.7%), Material Moving (17 | 2.9%), and Transportation (16 | 2.8%).
Production, Transportation and Moving Occupations by Sex
| Occupation | Male | Female |
| Production | 0 (0.0%) | 27 (100.0%) |
| Transportation | 16 (100.0%) | 0 (0.0%) |
| Material Moving | 17 (100.0%) | 0 (0.0%) |
| Total (Category) | 33 (55.0%) | 27 (45.0%) |
| Total (Overall) | 227 (39.1%) | 353 (60.9%) |
Employment Industries by Sex in Terry
Employment Industries in Terry
The major employment industries in Terry include Finance & Insurance (80 | 13.8%), Educational Services (65 | 11.2%), Construction (61 | 10.5%), Accommodation & Food Services (57 | 9.8%), and Health Care & Social Assistance (44 | 7.6%).
Employment Industries by Sex in Terry
The Terry industries that see more men than women are Construction (100.0%), Utilities (100.0%), and Arts, Entertainment & Recreation (100.0%), whereas the industries that tend to have a higher number of women are Finance & Insurance (100.0%), Real Estate, Rental & Leasing (100.0%), and Professional & Scientific (100.0%).
| Industry | Male | Female |
| Agriculture, Fishing & Hunting | 0 (0.0%) | 0 (0.0%) |
| Mining, Quarrying, & Extraction | 0 (0.0%) | 0 (0.0%) |
| Construction | 61 (100.0%) | 0 (0.0%) |
| Manufacturing | 21 (51.2%) | 20 (48.8%) |
| Wholesale Trade | 3 (27.3%) | 8 (72.7%) |
| Retail Trade | 17 (73.9%) | 6 (26.1%) |
| Transportation & Warehousing | 25 (83.3%) | 5 (16.7%) |
| Utilities | 8 (100.0%) | 0 (0.0%) |
| Information | 0 (0.0%) | 0 (0.0%) |
| Finance & Insurance | 0 (0.0%) | 80 (100.0%) |
| Real Estate, Rental & Leasing | 0 (0.0%) | 2 (100.0%) |
| Professional & Scientific | 0 (0.0%) | 26 (100.0%) |
| Enterprise Management | 0 (0.0%) | 0 (0.0%) |
| Administrative & Support | 17 (80.9%) | 4 (19.1%) |
| Educational Services | 7 (10.8%) | 58 (89.2%) |
| Health Care & Social Assistance | 11 (25.0%) | 33 (75.0%) |
| Arts, Entertainment & Recreation | 3 (100.0%) | 0 (0.0%) |
| Accommodation & Food Services | 0 (0.0%) | 57 (100.0%) |
| Public Administration | 19 (51.3%) | 18 (48.6%) |
| Total | 227 (39.1%) | 353 (60.9%) |
Education in Terry
School Enrollment in Terry
The most common levels of schooling among the 631 students in Terry are middle school (161 | 25.5%), high school (135 | 21.4%), and elementary school (94 | 14.9%).
| School Level | # Students | % Students |
| Nursery / Preschool | 71 | 11.3% |
| Kindergarten | 50 | 7.9% |
| Elementary School | 94 | 14.9% |
| Middle School | 161 | 25.5% |
| High School | 135 | 21.4% |
| College / Undergraduate | 30 | 4.8% |
| Graduate / Professional | 90 | 14.3% |
| Total | 631 | 100.0% |
School Enrollment by Age by Funding Source in Terry
Out of a total of 631 students who are enrolled in schools in Terry, 123 (19.5%) attend a private institution, while the remaining 508 (80.5%) are enrolled in public schools. The age group of 3 to 4 year olds has the highest likelihood of being enrolled in private schools, with 10 (71.4% in the age bracket) enrolled. Conversely, the age group of 20 to 24 year olds has the lowest likelihood of being enrolled in a private school, with 4 (100.0% in the age bracket) attending a public institution.
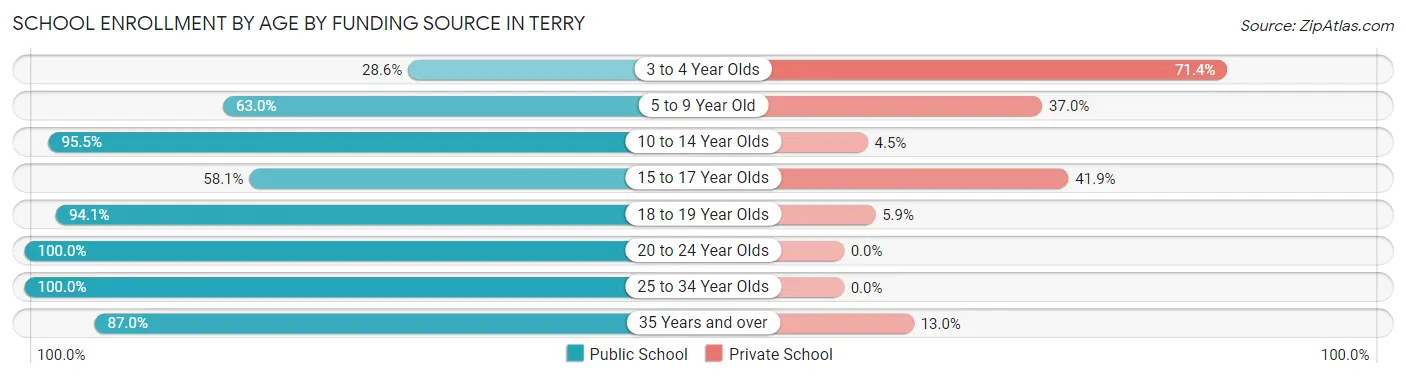
| Age Bracket | Public School | Private School |
| 3 to 4 Year Olds | 4 (28.6%) | 10 (71.4%) |
| 5 to 9 Year Old | 104 (63.0%) | 61 (37.0%) |
| 10 to 14 Year Olds | 193 (95.5%) | 9 (4.5%) |
| 15 to 17 Year Olds | 50 (58.1%) | 36 (41.9%) |
| 18 to 19 Year Olds | 64 (94.1%) | 4 (5.9%) |
| 20 to 24 Year Olds | 4 (100.0%) | 0 (0.0%) |
| 25 to 34 Year Olds | 69 (100.0%) | 0 (0.0%) |
| 35 Years and over | 20 (87.0%) | 3 (13.0%) |
| Total | 508 (80.5%) | 123 (19.5%) |
Educational Attainment by Field of Study in Terry
Business (86 | 26.1%), bio, nature & agricultural (85 | 25.8%), education (37 | 11.3%), social sciences (30 | 9.1%), and engineering (28 | 8.5%) are the most common fields of study among 329 individuals in Terry who have obtained a bachelor's degree or higher.
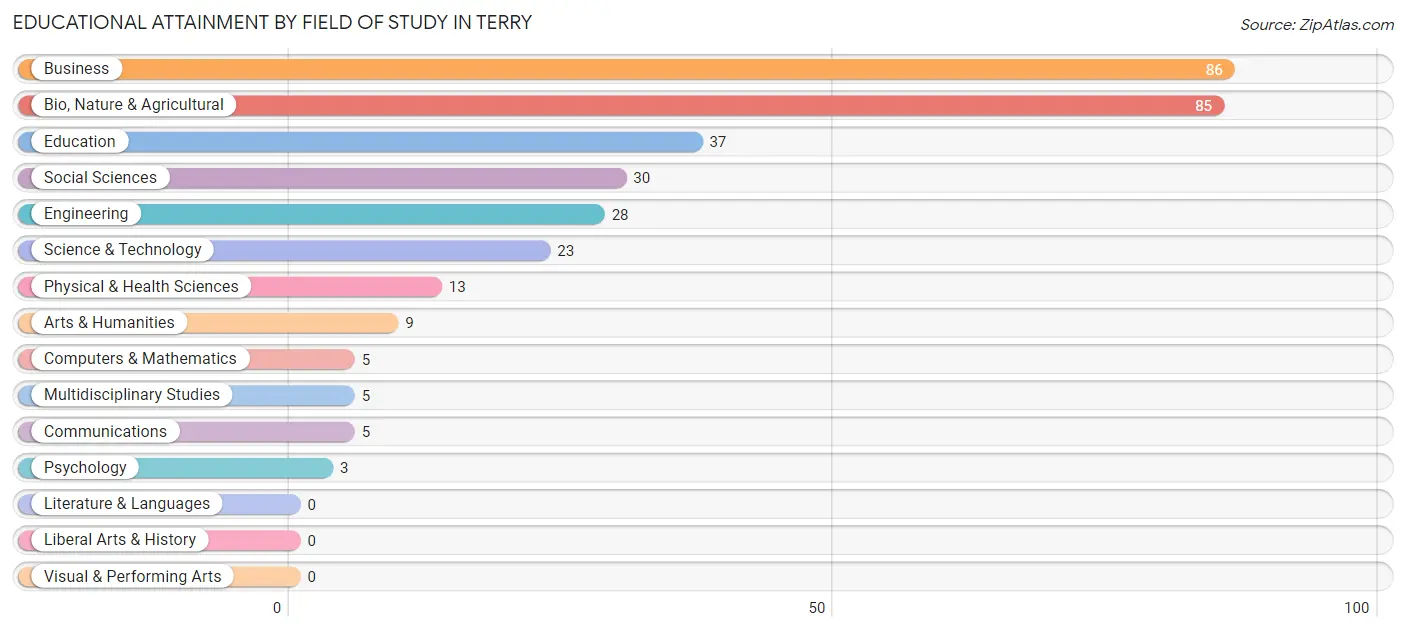
| Field of Study | # Graduates | % Graduates |
| Computers & Mathematics | 5 | 1.5% |
| Bio, Nature & Agricultural | 85 | 25.8% |
| Physical & Health Sciences | 13 | 4.0% |
| Psychology | 3 | 0.9% |
| Social Sciences | 30 | 9.1% |
| Engineering | 28 | 8.5% |
| Multidisciplinary Studies | 5 | 1.5% |
| Science & Technology | 23 | 7.0% |
| Business | 86 | 26.1% |
| Education | 37 | 11.3% |
| Literature & Languages | 0 | 0.0% |
| Liberal Arts & History | 0 | 0.0% |
| Visual & Performing Arts | 0 | 0.0% |
| Communications | 5 | 1.5% |
| Arts & Humanities | 9 | 2.7% |
| Total | 329 | 100.0% |
Transportation & Commute in Terry
Vehicle Availability by Sex in Terry
The most prevalent vehicle ownership categories in Terry are males with 2 vehicles (106, accounting for 47.3%) and females with 2 vehicles (137, making up 30.8%).
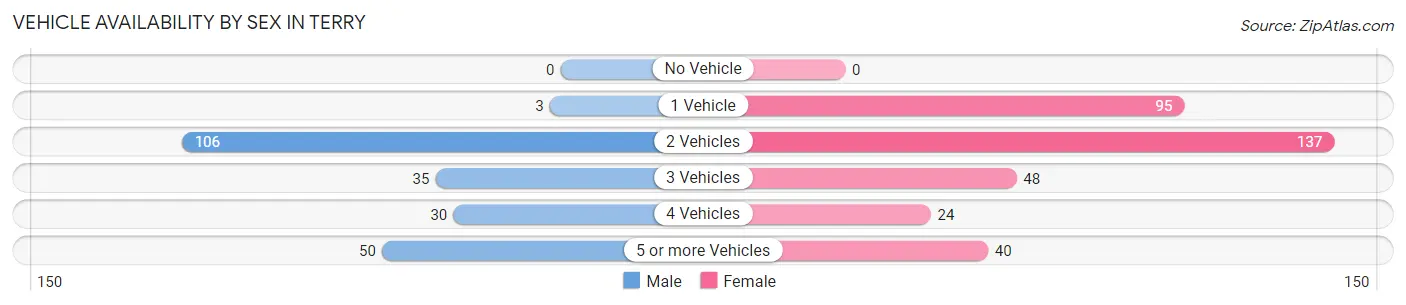
| Vehicles Available | Male | Female |
| No Vehicle | 0 (0.0%) | 0 (0.0%) |
| 1 Vehicle | 3 (1.3%) | 95 (27.6%) |
| 2 Vehicles | 106 (47.3%) | 137 (39.8%) |
| 3 Vehicles | 35 (15.6%) | 48 (14.0%) |
| 4 Vehicles | 30 (13.4%) | 24 (7.0%) |
| 5 or more Vehicles | 50 (22.3%) | 40 (11.6%) |
| Total | 224 (100.0%) | 344 (100.0%) |
Commute Time in Terry
The most frequently occuring commute durations in Terry are 30 to 34 minutes (122 commuters, 22.3%), 15 to 19 minutes (104 commuters, 19.0%), and 25 to 29 minutes (75 commuters, 13.7%).
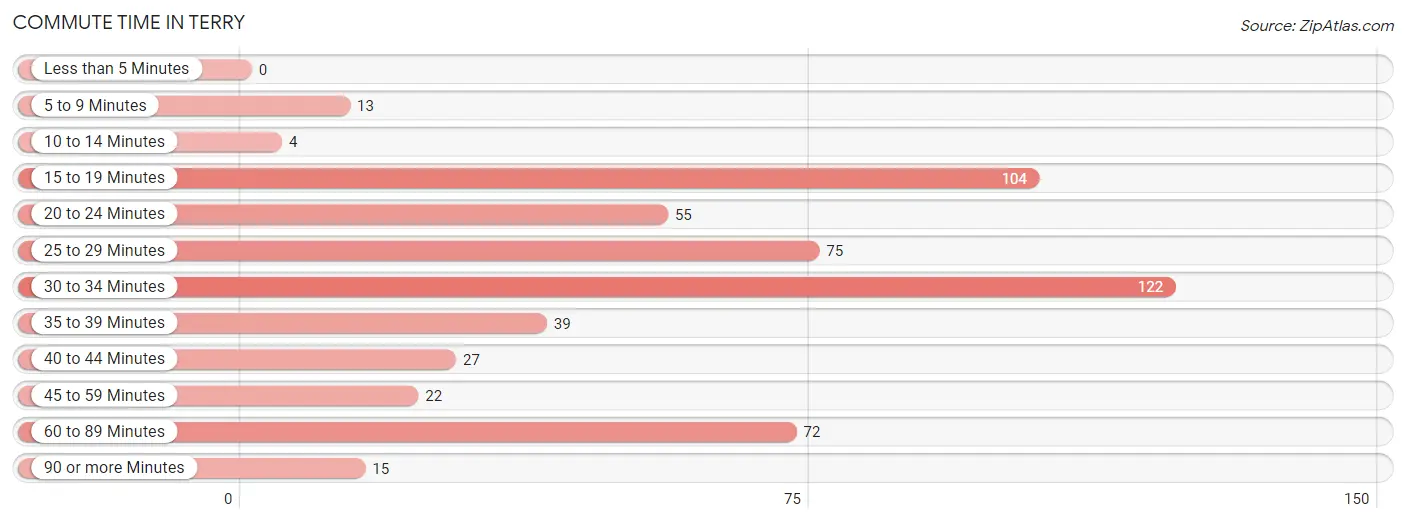
| Commute Time | # Commuters | % Commuters |
| Less than 5 Minutes | 0 | 0.0% |
| 5 to 9 Minutes | 13 | 2.4% |
| 10 to 14 Minutes | 4 | 0.7% |
| 15 to 19 Minutes | 104 | 19.0% |
| 20 to 24 Minutes | 55 | 10.0% |
| 25 to 29 Minutes | 75 | 13.7% |
| 30 to 34 Minutes | 122 | 22.3% |
| 35 to 39 Minutes | 39 | 7.1% |
| 40 to 44 Minutes | 27 | 4.9% |
| 45 to 59 Minutes | 22 | 4.0% |
| 60 to 89 Minutes | 72 | 13.1% |
| 90 or more Minutes | 15 | 2.7% |
Commute Time by Sex in Terry
The most common commute times in Terry are 60 to 89 minutes (55 commuters, 25.4%) for males and 30 to 34 minutes (83 commuters, 25.1%) for females.
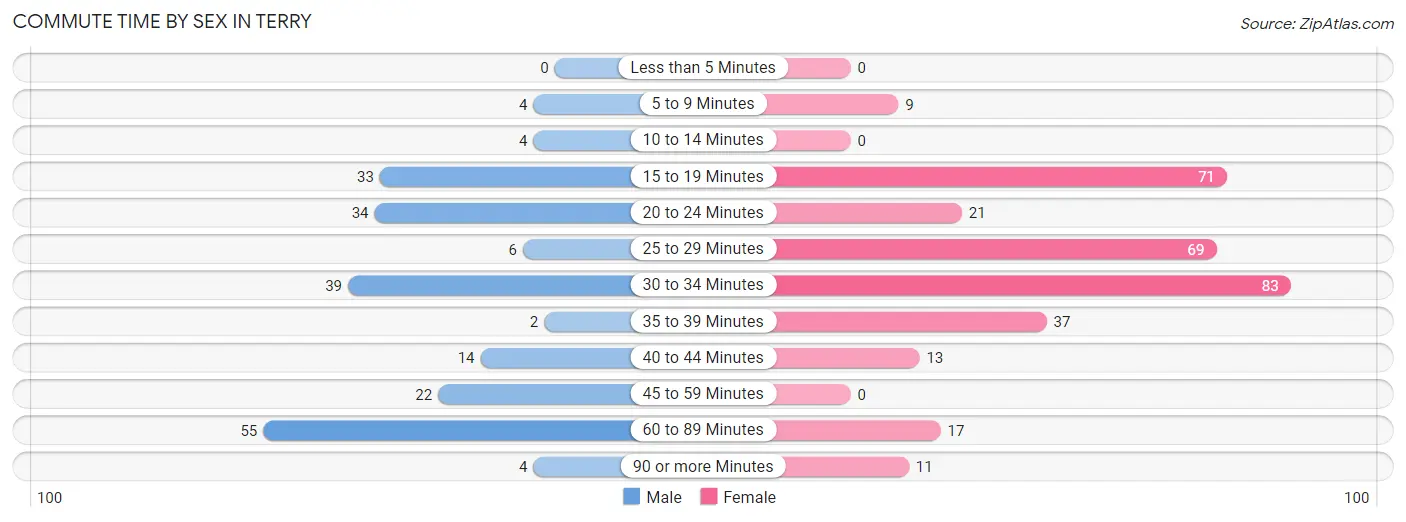
| Commute Time | Male | Female |
| Less than 5 Minutes | 0 (0.0%) | 0 (0.0%) |
| 5 to 9 Minutes | 4 (1.8%) | 9 (2.7%) |
| 10 to 14 Minutes | 4 (1.8%) | 0 (0.0%) |
| 15 to 19 Minutes | 33 (15.2%) | 71 (21.4%) |
| 20 to 24 Minutes | 34 (15.7%) | 21 (6.3%) |
| 25 to 29 Minutes | 6 (2.8%) | 69 (20.8%) |
| 30 to 34 Minutes | 39 (18.0%) | 83 (25.1%) |
| 35 to 39 Minutes | 2 (0.9%) | 37 (11.2%) |
| 40 to 44 Minutes | 14 (6.5%) | 13 (3.9%) |
| 45 to 59 Minutes | 22 (10.1%) | 0 (0.0%) |
| 60 to 89 Minutes | 55 (25.4%) | 17 (5.1%) |
| 90 or more Minutes | 4 (1.8%) | 11 (3.3%) |
Time of Departure to Work by Sex in Terry
The most frequent times of departure to work in Terry are 6:00 AM to 6:29 AM (78, 35.9%) for males and 7:30 AM to 7:59 AM (97, 29.3%) for females.
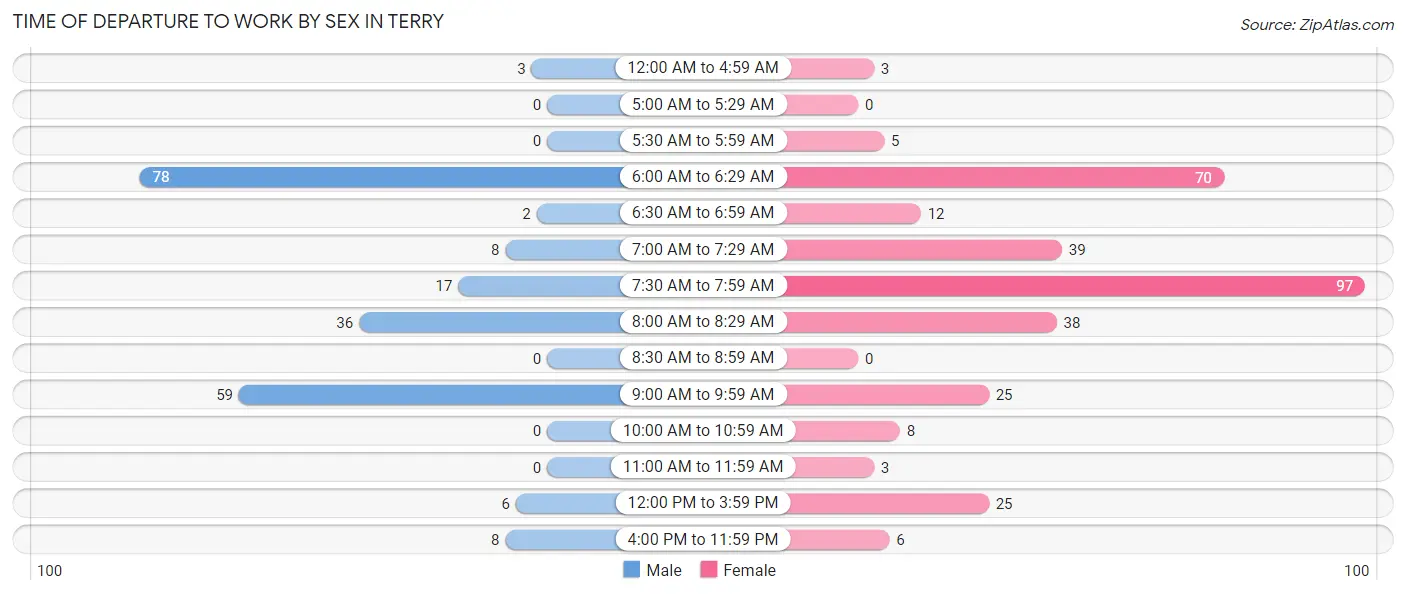
| Time of Departure | Male | Female |
| 12:00 AM to 4:59 AM | 3 (1.4%) | 3 (0.9%) |
| 5:00 AM to 5:29 AM | 0 (0.0%) | 0 (0.0%) |
| 5:30 AM to 5:59 AM | 0 (0.0%) | 5 (1.5%) |
| 6:00 AM to 6:29 AM | 78 (35.9%) | 70 (21.1%) |
| 6:30 AM to 6:59 AM | 2 (0.9%) | 12 (3.6%) |
| 7:00 AM to 7:29 AM | 8 (3.7%) | 39 (11.8%) |
| 7:30 AM to 7:59 AM | 17 (7.8%) | 97 (29.3%) |
| 8:00 AM to 8:29 AM | 36 (16.6%) | 38 (11.5%) |
| 8:30 AM to 8:59 AM | 0 (0.0%) | 0 (0.0%) |
| 9:00 AM to 9:59 AM | 59 (27.2%) | 25 (7.5%) |
| 10:00 AM to 10:59 AM | 0 (0.0%) | 8 (2.4%) |
| 11:00 AM to 11:59 AM | 0 (0.0%) | 3 (0.9%) |
| 12:00 PM to 3:59 PM | 6 (2.8%) | 25 (7.5%) |
| 4:00 PM to 11:59 PM | 8 (3.7%) | 6 (1.8%) |
| Total | 217 (100.0%) | 331 (100.0%) |
Housing Occupancy in Terry
Occupancy by Ownership in Terry
Of the total 488 dwellings in Terry, owner-occupied units account for 434 (88.9%), while renter-occupied units make up 54 (11.1%).
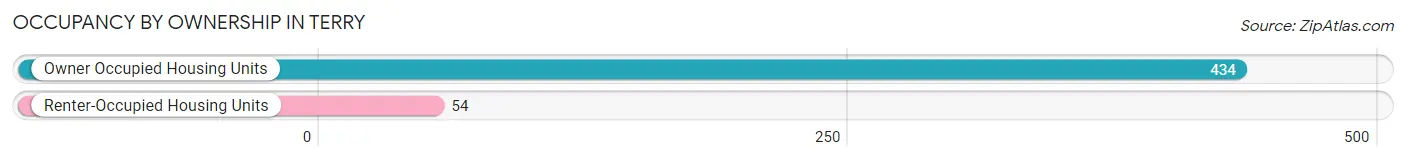
| Occupancy | # Housing Units | % Housing Units |
| Owner Occupied Housing Units | 434 | 88.9% |
| Renter-Occupied Housing Units | 54 | 11.1% |
| Total Occupied Housing Units | 488 | 100.0% |
Occupancy by Household Size in Terry
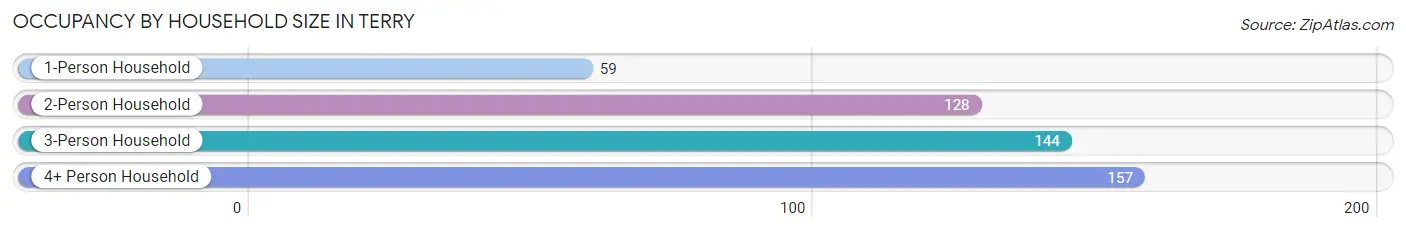
| Household Size | # Housing Units | % Housing Units |
| 1-Person Household | 59 | 12.1% |
| 2-Person Household | 128 | 26.2% |
| 3-Person Household | 144 | 29.5% |
| 4+ Person Household | 157 | 32.2% |
| Total Housing Units | 488 | 100.0% |
Occupancy by Ownership by Household Size in Terry
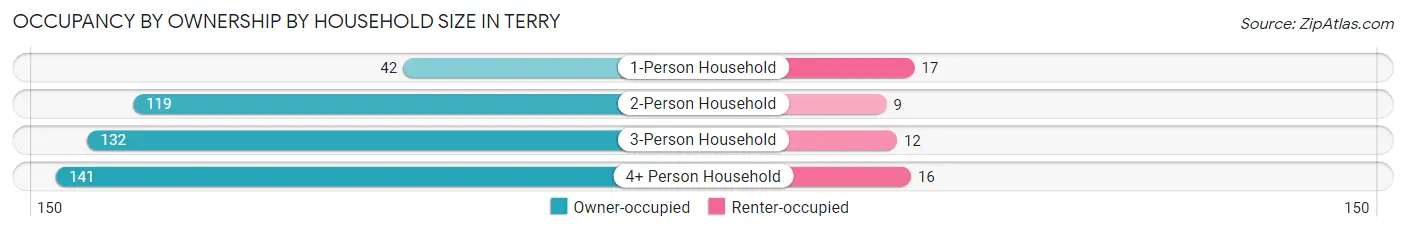
| Household Size | Owner-occupied | Renter-occupied |
| 1-Person Household | 42 (71.2%) | 17 (28.8%) |
| 2-Person Household | 119 (93.0%) | 9 (7.0%) |
| 3-Person Household | 132 (91.7%) | 12 (8.3%) |
| 4+ Person Household | 141 (89.8%) | 16 (10.2%) |
| Total Housing Units | 434 (88.9%) | 54 (11.1%) |
Occupancy by Educational Attainment in Terry
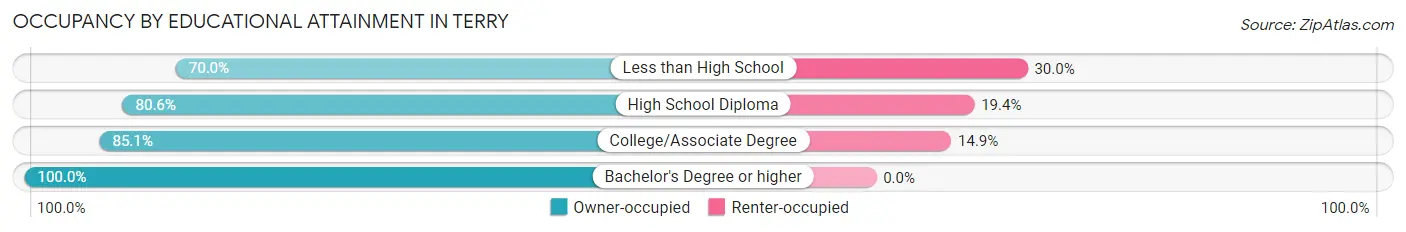
| Household Size | Owner-occupied | Renter-occupied |
| Less than High School | 7 (70.0%) | 3 (30.0%) |
| High School Diploma | 58 (80.6%) | 14 (19.4%) |
| College/Associate Degree | 212 (85.1%) | 37 (14.9%) |
| Bachelor's Degree or higher | 157 (100.0%) | 0 (0.0%) |
Occupancy by Age of Householder in Terry
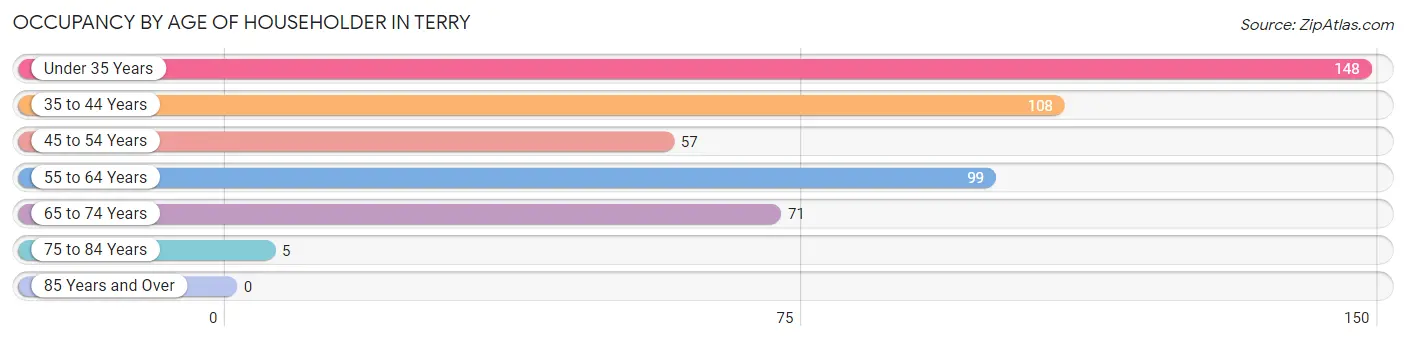
| Age Bracket | # Households | % Households |
| Under 35 Years | 148 | 30.3% |
| 35 to 44 Years | 108 | 22.1% |
| 45 to 54 Years | 57 | 11.7% |
| 55 to 64 Years | 99 | 20.3% |
| 65 to 74 Years | 71 | 14.5% |
| 75 to 84 Years | 5 | 1.0% |
| 85 Years and Over | 0 | 0.0% |
| Total | 488 | 100.0% |
Housing Finances in Terry
Median Income by Occupancy in Terry
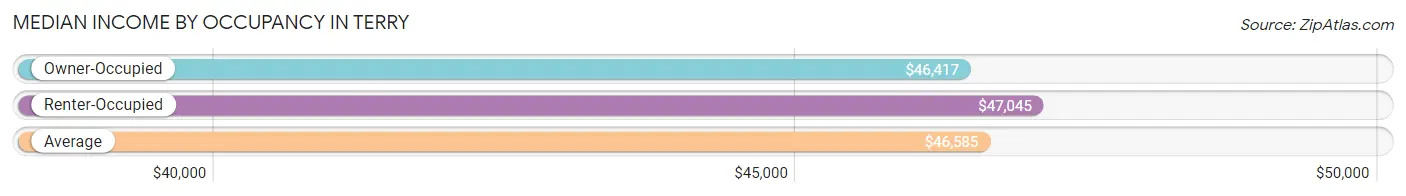
| Occupancy Type | # Households | Median Income |
| Owner-Occupied | 434 (88.9%) | $46,417 |
| Renter-Occupied | 54 (11.1%) | $47,045 |
| Average | 488 (100.0%) | $46,585 |
Occupancy by Householder Income Bracket in Terry
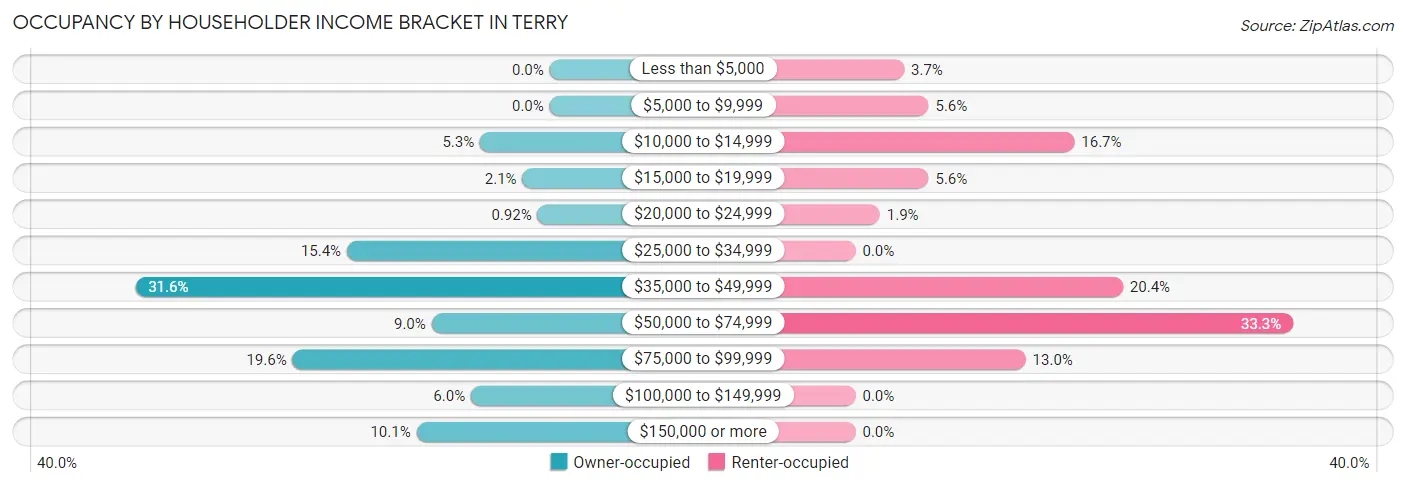
| Income Bracket | Owner-occupied | Renter-occupied |
| Less than $5,000 | 0 (0.0%) | 2 (3.7%) |
| $5,000 to $9,999 | 0 (0.0%) | 3 (5.6%) |
| $10,000 to $14,999 | 23 (5.3%) | 9 (16.7%) |
| $15,000 to $19,999 | 9 (2.1%) | 3 (5.6%) |
| $20,000 to $24,999 | 4 (0.9%) | 1 (1.8%) |
| $25,000 to $34,999 | 67 (15.4%) | 0 (0.0%) |
| $35,000 to $49,999 | 137 (31.6%) | 11 (20.4%) |
| $50,000 to $74,999 | 39 (9.0%) | 18 (33.3%) |
| $75,000 to $99,999 | 85 (19.6%) | 7 (13.0%) |
| $100,000 to $149,999 | 26 (6.0%) | 0 (0.0%) |
| $150,000 or more | 44 (10.1%) | 0 (0.0%) |
| Total | 434 (100.0%) | 54 (100.0%) |
Monthly Housing Cost Tiers in Terry
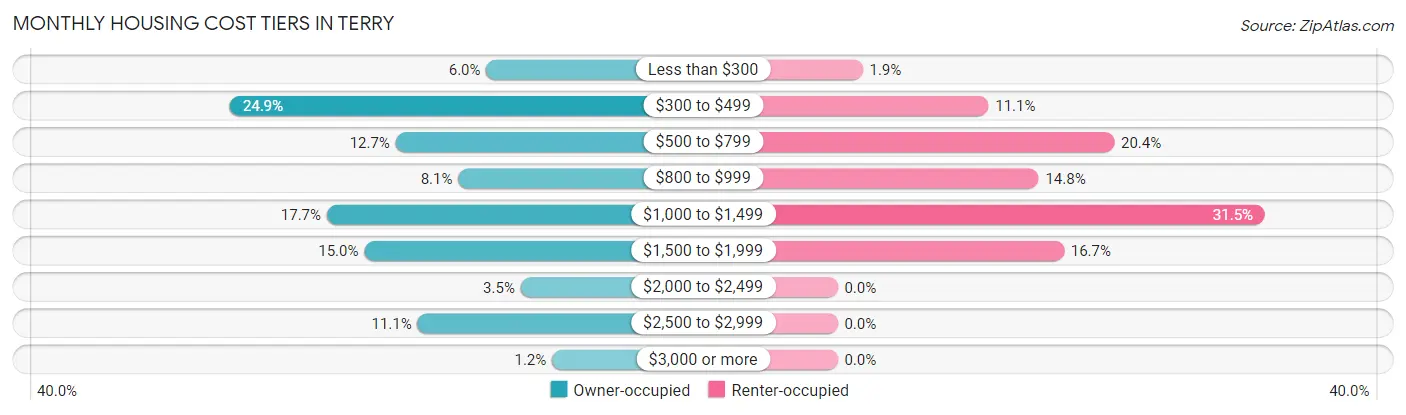
| Monthly Cost | Owner-occupied | Renter-occupied |
| Less than $300 | 26 (6.0%) | 1 (1.8%) |
| $300 to $499 | 108 (24.9%) | 6 (11.1%) |
| $500 to $799 | 55 (12.7%) | 11 (20.4%) |
| $800 to $999 | 35 (8.1%) | 8 (14.8%) |
| $1,000 to $1,499 | 77 (17.7%) | 17 (31.5%) |
| $1,500 to $1,999 | 65 (15.0%) | 9 (16.7%) |
| $2,000 to $2,499 | 15 (3.5%) | 0 (0.0%) |
| $2,500 to $2,999 | 48 (11.1%) | 0 (0.0%) |
| $3,000 or more | 5 (1.1%) | 0 (0.0%) |
| Total | 434 (100.0%) | 54 (100.0%) |
Physical Housing Characteristics in Terry
Housing Structures in Terry
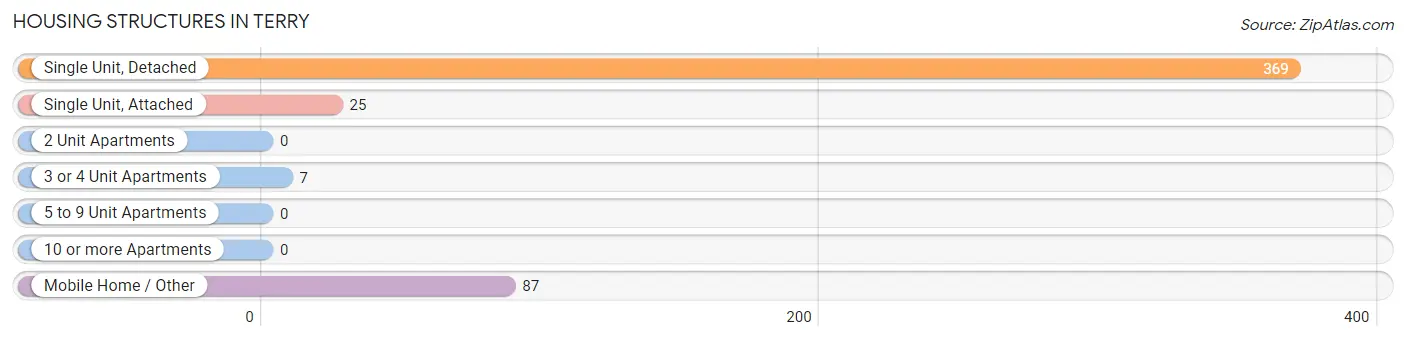
| Structure Type | # Housing Units | % Housing Units |
| Single Unit, Detached | 369 | 75.6% |
| Single Unit, Attached | 25 | 5.1% |
| 2 Unit Apartments | 0 | 0.0% |
| 3 or 4 Unit Apartments | 7 | 1.4% |
| 5 to 9 Unit Apartments | 0 | 0.0% |
| 10 or more Apartments | 0 | 0.0% |
| Mobile Home / Other | 87 | 17.8% |
| Total | 488 | 100.0% |
Housing Structures by Occupancy in Terry
| Structure Type | Owner-occupied | Renter-occupied |
| Single Unit, Detached | 322 (87.3%) | 47 (12.7%) |
| Single Unit, Attached | 25 (100.0%) | 0 (0.0%) |
| 2 Unit Apartments | 0 (0.0%) | 0 (0.0%) |
| 3 or 4 Unit Apartments | 0 (0.0%) | 7 (100.0%) |
| 5 to 9 Unit Apartments | 0 (0.0%) | 0 (0.0%) |
| 10 or more Apartments | 0 (0.0%) | 0 (0.0%) |
| Mobile Home / Other | 87 (100.0%) | 0 (0.0%) |
| Total | 434 (88.9%) | 54 (11.1%) |
Housing Structures by Number of Rooms in Terry
| Number of Rooms | Owner-occupied | Renter-occupied |
| 1 Room | 0 (0.0%) | 0 (0.0%) |
| 2 or 3 Rooms | 6 (1.4%) | 3 (5.6%) |
| 4 or 5 Rooms | 245 (56.5%) | 32 (59.3%) |
| 6 or 7 Rooms | 140 (32.3%) | 8 (14.8%) |
| 8 or more Rooms | 43 (9.9%) | 11 (20.4%) |
| Total | 434 (100.0%) | 54 (100.0%) |
Housing Structure by Heating Type in Terry
| Heating Type | Owner-occupied | Renter-occupied |
| Utility Gas | 295 (68.0%) | 42 (77.8%) |
| Bottled, Tank, or LP Gas | 44 (10.1%) | 0 (0.0%) |
| Electricity | 95 (21.9%) | 12 (22.2%) |
| Fuel Oil or Kerosene | 0 (0.0%) | 0 (0.0%) |
| Coal or Coke | 0 (0.0%) | 0 (0.0%) |
| All other Fuels | 0 (0.0%) | 0 (0.0%) |
| No Fuel Used | 0 (0.0%) | 0 (0.0%) |
| Total | 434 (100.0%) | 54 (100.0%) |
Household Vehicle Usage in Terry
| Vehicles per Household | Owner-occupied | Renter-occupied |
| No Vehicle | 0 (0.0%) | 0 (0.0%) |
| 1 Vehicle | 115 (26.5%) | 34 (63.0%) |
| 2 Vehicles | 195 (44.9%) | 7 (13.0%) |
| 3 or more Vehicles | 124 (28.6%) | 13 (24.1%) |
| Total | 434 (100.0%) | 54 (100.0%) |
Real Estate & Mortgages in Terry
Real Estate and Mortgage Overview in Terry
| Characteristic | Without Mortgage | With Mortgage |
| Housing Units | 202 | 232 |
| Median Property Value | $94,600 | $179,800 |
| Median Household Income | $36,316 | $23 |
| Monthly Housing Costs | $388 | $5 |
| Real Estate Taxes | $452 | $15 |
Property Value by Mortgage Status in Terry
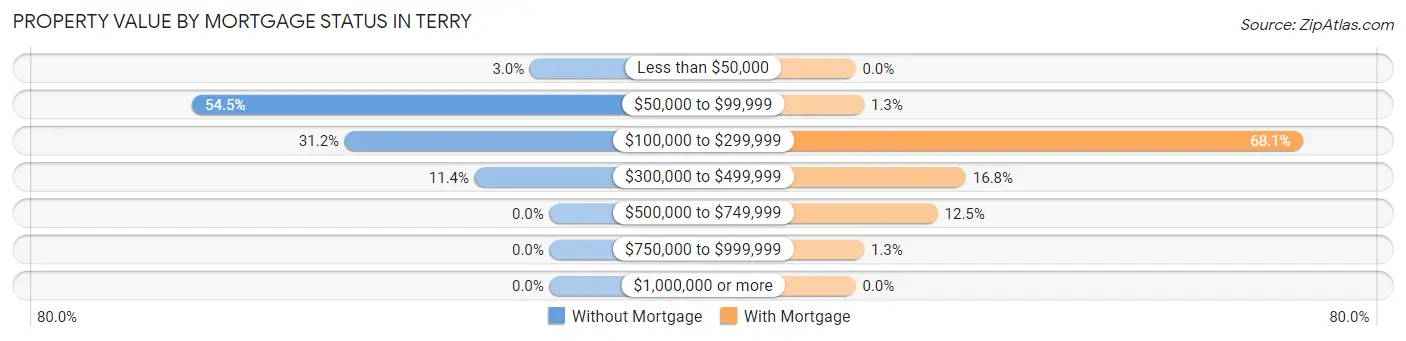
| Property Value | Without Mortgage | With Mortgage |
| Less than $50,000 | 6 (3.0%) | 0 (0.0%) |
| $50,000 to $99,999 | 110 (54.5%) | 3 (1.3%) |
| $100,000 to $299,999 | 63 (31.2%) | 158 (68.1%) |
| $300,000 to $499,999 | 23 (11.4%) | 39 (16.8%) |
| $500,000 to $749,999 | 0 (0.0%) | 29 (12.5%) |
| $750,000 to $999,999 | 0 (0.0%) | 3 (1.3%) |
| $1,000,000 or more | 0 (0.0%) | 0 (0.0%) |
| Total | 202 (100.0%) | 232 (100.0%) |
Household Income by Mortgage Status in Terry
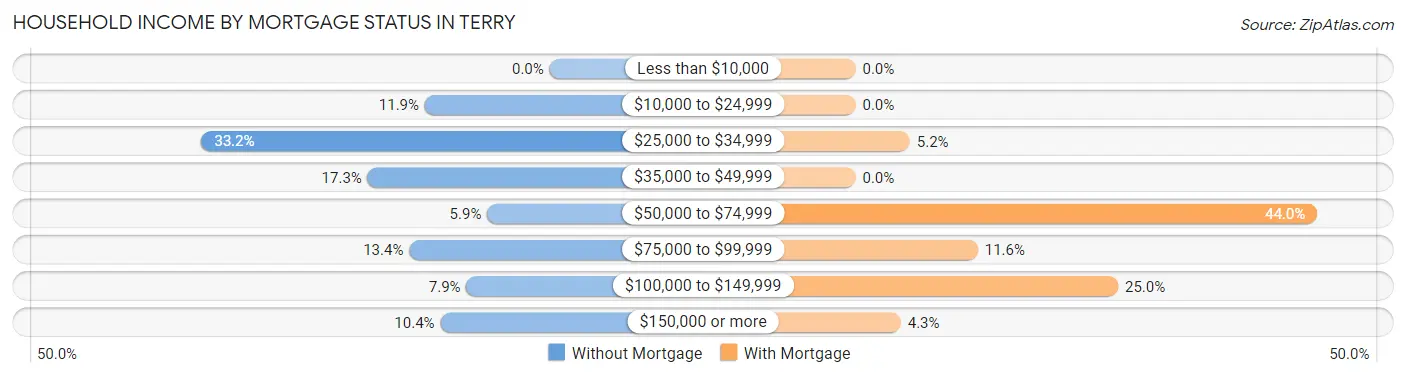
| Household Income | Without Mortgage | With Mortgage |
| Less than $10,000 | 0 (0.0%) | 0 (0.0%) |
| $10,000 to $24,999 | 24 (11.9%) | 0 (0.0%) |
| $25,000 to $34,999 | 67 (33.2%) | 12 (5.2%) |
| $35,000 to $49,999 | 35 (17.3%) | 0 (0.0%) |
| $50,000 to $74,999 | 12 (5.9%) | 102 (44.0%) |
| $75,000 to $99,999 | 27 (13.4%) | 27 (11.6%) |
| $100,000 to $149,999 | 16 (7.9%) | 58 (25.0%) |
| $150,000 or more | 21 (10.4%) | 10 (4.3%) |
| Total | 202 (100.0%) | 232 (100.0%) |
Property Value to Household Income Ratio in Terry
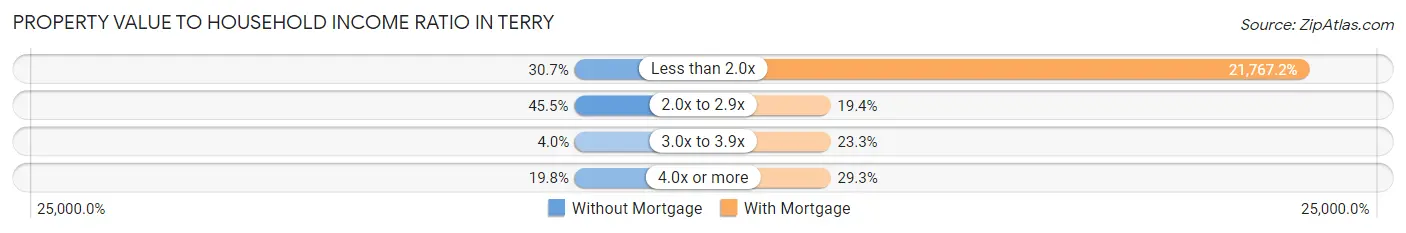
| Value-to-Income Ratio | Without Mortgage | With Mortgage |
| Less than 2.0x | 62 (30.7%) | 50,500 (21,767.2%) |
| 2.0x to 2.9x | 92 (45.5%) | 45 (19.4%) |
| 3.0x to 3.9x | 8 (4.0%) | 54 (23.3%) |
| 4.0x or more | 40 (19.8%) | 68 (29.3%) |
| Total | 202 (100.0%) | 232 (100.0%) |
Real Estate Taxes by Mortgage Status in Terry
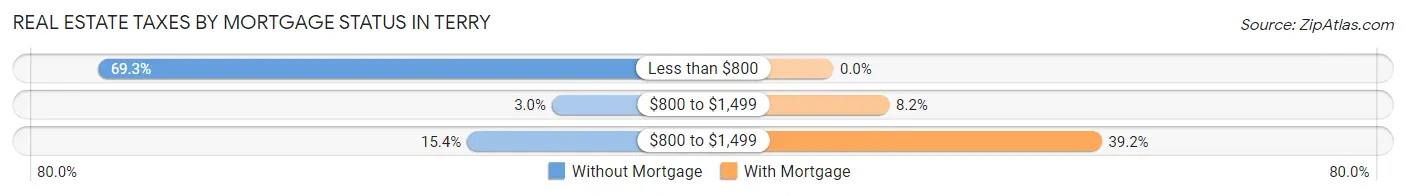
| Property Taxes | Without Mortgage | With Mortgage |
| Less than $800 | 140 (69.3%) | 0 (0.0%) |
| $800 to $1,499 | 6 (3.0%) | 19 (8.2%) |
| $800 to $1,499 | 31 (15.3%) | 91 (39.2%) |
| Total | 202 (100.0%) | 232 (100.0%) |
Health & Disability in Terry
Health Insurance Coverage by Age in Terry
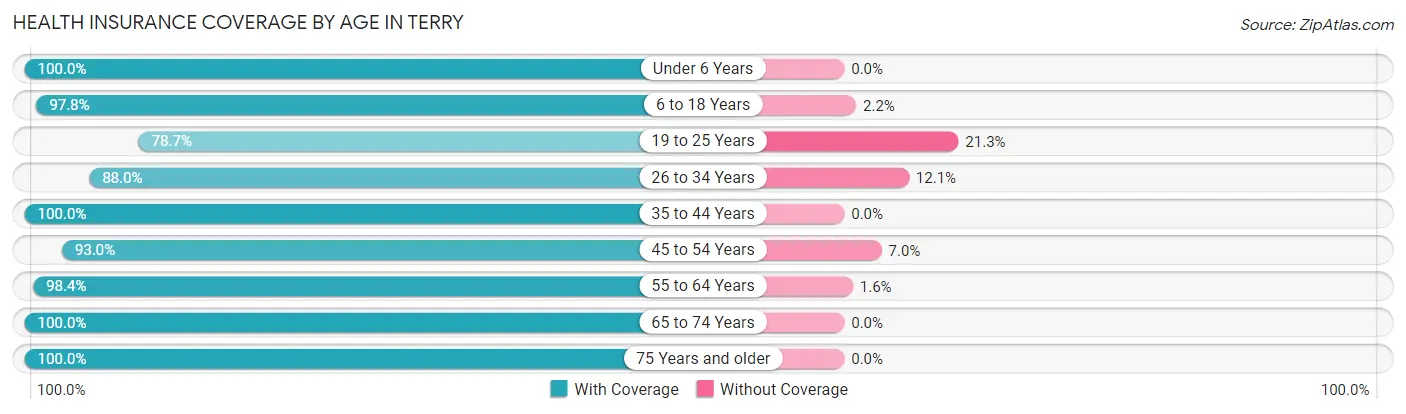
| Age Bracket | With Coverage | Without Coverage |
| Under 6 Years | 253 (100.0%) | 0 (0.0%) |
| 6 to 18 Years | 401 (97.8%) | 9 (2.2%) |
| 19 to 25 Years | 74 (78.7%) | 20 (21.3%) |
| 26 to 34 Years | 219 (87.9%) | 30 (12.0%) |
| 35 to 44 Years | 155 (100.0%) | 0 (0.0%) |
| 45 to 54 Years | 107 (93.0%) | 8 (7.0%) |
| 55 to 64 Years | 124 (98.4%) | 2 (1.6%) |
| 65 to 74 Years | 118 (100.0%) | 0 (0.0%) |
| 75 Years and older | 21 (100.0%) | 0 (0.0%) |
| Total | 1,472 (95.5%) | 69 (4.5%) |
Health Insurance Coverage by Citizenship Status in Terry
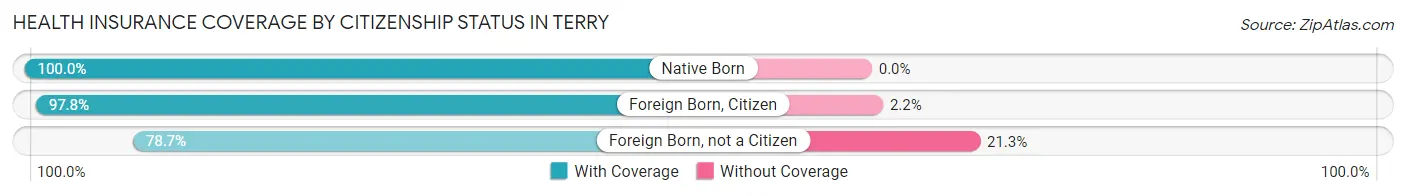
| Citizenship Status | With Coverage | Without Coverage |
| Native Born | 253 (100.0%) | 0 (0.0%) |
| Foreign Born, Citizen | 401 (97.8%) | 9 (2.2%) |
| Foreign Born, not a Citizen | 74 (78.7%) | 20 (21.3%) |
Health Insurance Coverage by Household Income in Terry
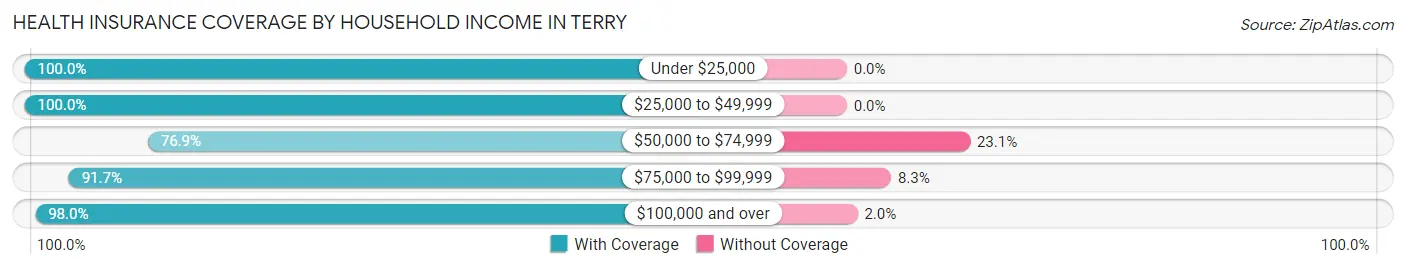
| Household Income | With Coverage | Without Coverage |
| Under $25,000 | 149 (100.0%) | 0 (0.0%) |
| $25,000 to $49,999 | 732 (100.0%) | 0 (0.0%) |
| $50,000 to $74,999 | 140 (76.9%) | 42 (23.1%) |
| $75,000 to $99,999 | 255 (91.7%) | 23 (8.3%) |
| $100,000 and over | 196 (98.0%) | 4 (2.0%) |
Public vs Private Health Insurance Coverage by Age in Terry
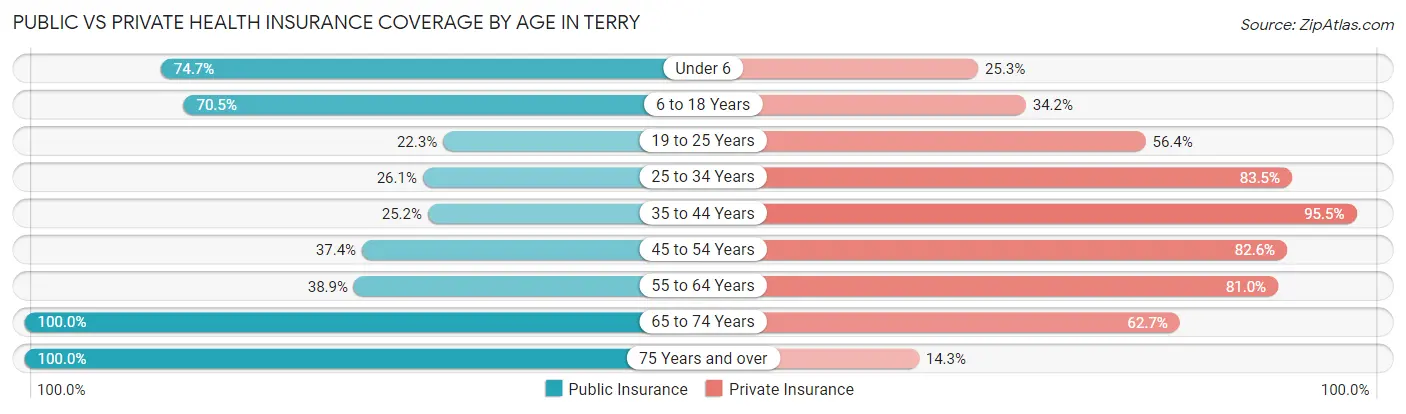
| Age Bracket | Public Insurance | Private Insurance |
| Under 6 | 189 (74.7%) | 64 (25.3%) |
| 6 to 18 Years | 289 (70.5%) | 140 (34.2%) |
| 19 to 25 Years | 21 (22.3%) | 53 (56.4%) |
| 25 to 34 Years | 65 (26.1%) | 208 (83.5%) |
| 35 to 44 Years | 39 (25.2%) | 148 (95.5%) |
| 45 to 54 Years | 43 (37.4%) | 95 (82.6%) |
| 55 to 64 Years | 49 (38.9%) | 102 (80.9%) |
| 65 to 74 Years | 118 (100.0%) | 74 (62.7%) |
| 75 Years and over | 21 (100.0%) | 3 (14.3%) |
| Total | 834 (54.1%) | 887 (57.6%) |
Disability Status by Sex by Age in Terry
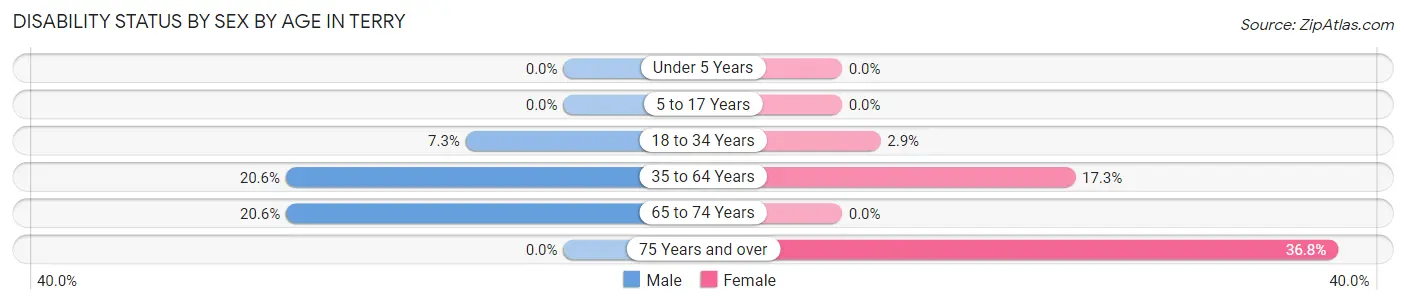
| Age Bracket | Male | Female |
| Under 5 Years | 0 (0.0%) | 0 (0.0%) |
| 5 to 17 Years | 0 (0.0%) | 0 (0.0%) |
| 18 to 34 Years | 10 (7.2%) | 7 (2.9%) |
| 35 to 64 Years | 34 (20.6%) | 40 (17.3%) |
| 65 to 74 Years | 14 (20.6%) | 0 (0.0%) |
| 75 Years and over | 0 (0.0%) | 7 (36.8%) |
Disability Class by Sex by Age in Terry
Disability Class: Hearing Difficulty
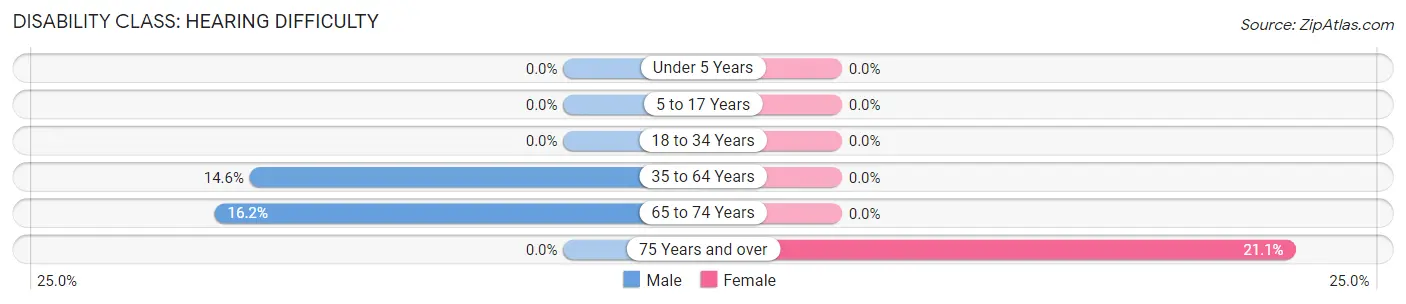
| Age Bracket | Male | Female |
| Under 5 Years | 0 (0.0%) | 0 (0.0%) |
| 5 to 17 Years | 0 (0.0%) | 0 (0.0%) |
| 18 to 34 Years | 0 (0.0%) | 0 (0.0%) |
| 35 to 64 Years | 24 (14.5%) | 0 (0.0%) |
| 65 to 74 Years | 11 (16.2%) | 0 (0.0%) |
| 75 Years and over | 0 (0.0%) | 4 (21.0%) |
Disability Class: Vision Difficulty
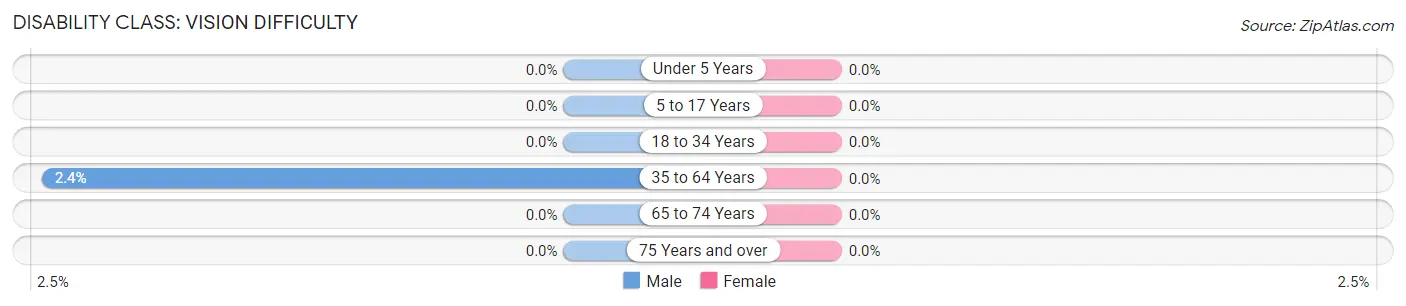
| Age Bracket | Male | Female |
| Under 5 Years | 0 (0.0%) | 0 (0.0%) |
| 5 to 17 Years | 0 (0.0%) | 0 (0.0%) |
| 18 to 34 Years | 0 (0.0%) | 0 (0.0%) |
| 35 to 64 Years | 4 (2.4%) | 0 (0.0%) |
| 65 to 74 Years | 0 (0.0%) | 0 (0.0%) |
| 75 Years and over | 0 (0.0%) | 0 (0.0%) |
Disability Class: Cognitive Difficulty
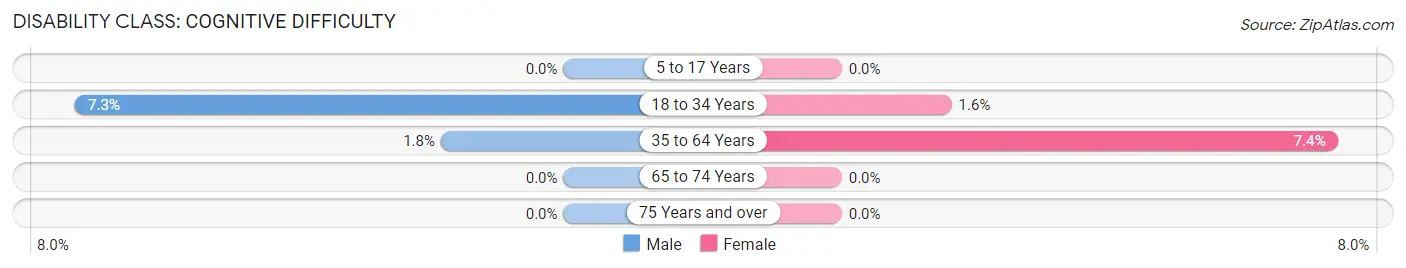
| Age Bracket | Male | Female |
| 5 to 17 Years | 0 (0.0%) | 0 (0.0%) |
| 18 to 34 Years | 10 (7.2%) | 4 (1.6%) |
| 35 to 64 Years | 3 (1.8%) | 17 (7.4%) |
| 65 to 74 Years | 0 (0.0%) | 0 (0.0%) |
| 75 Years and over | 0 (0.0%) | 0 (0.0%) |
Disability Class: Ambulatory Difficulty
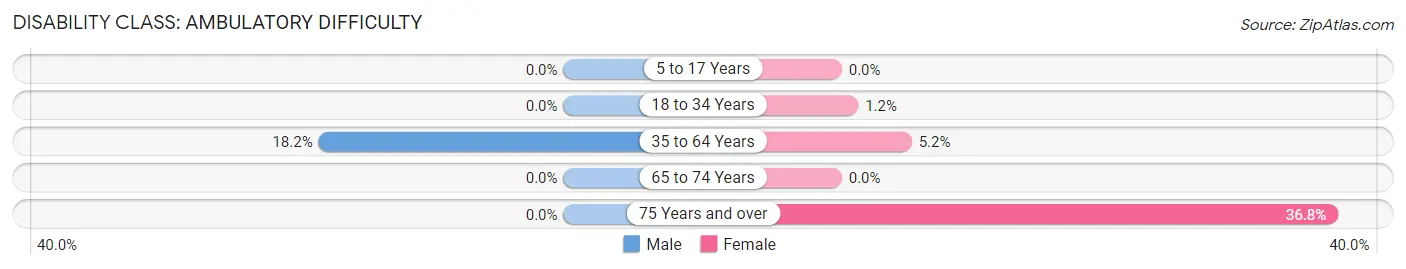
| Age Bracket | Male | Female |
| 5 to 17 Years | 0 (0.0%) | 0 (0.0%) |
| 18 to 34 Years | 0 (0.0%) | 3 (1.2%) |
| 35 to 64 Years | 30 (18.2%) | 12 (5.2%) |
| 65 to 74 Years | 0 (0.0%) | 0 (0.0%) |
| 75 Years and over | 0 (0.0%) | 7 (36.8%) |
Disability Class: Self-Care Difficulty
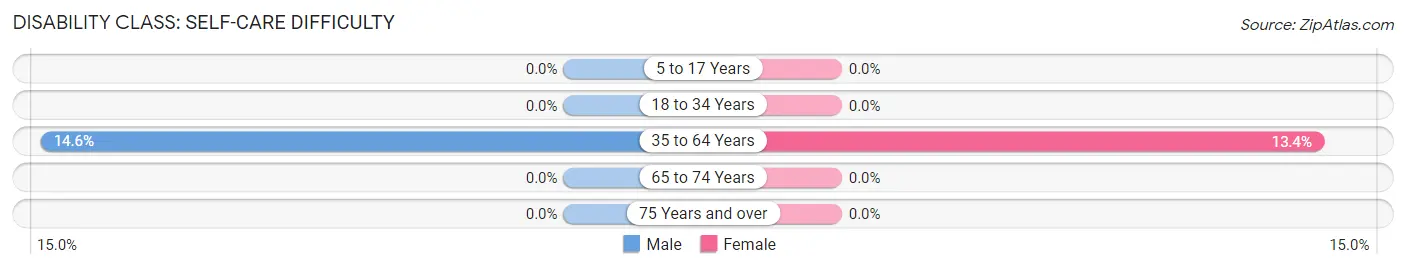
| Age Bracket | Male | Female |
| 5 to 17 Years | 0 (0.0%) | 0 (0.0%) |
| 18 to 34 Years | 0 (0.0%) | 0 (0.0%) |
| 35 to 64 Years | 24 (14.5%) | 31 (13.4%) |
| 65 to 74 Years | 0 (0.0%) | 0 (0.0%) |
| 75 Years and over | 0 (0.0%) | 0 (0.0%) |
Technology Access in Terry
Computing Device Access in Terry
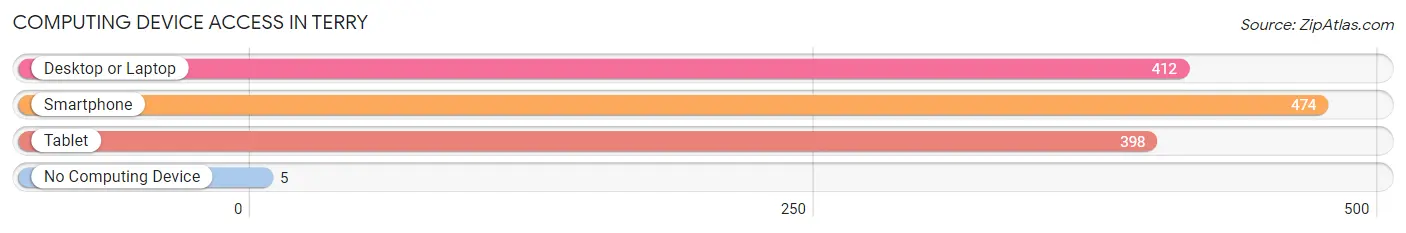
| Device Type | # Households | % Households |
| Desktop or Laptop | 412 | 84.4% |
| Smartphone | 474 | 97.1% |
| Tablet | 398 | 81.6% |
| No Computing Device | 5 | 1.0% |
| Total | 488 | 100.0% |
Internet Access in Terry
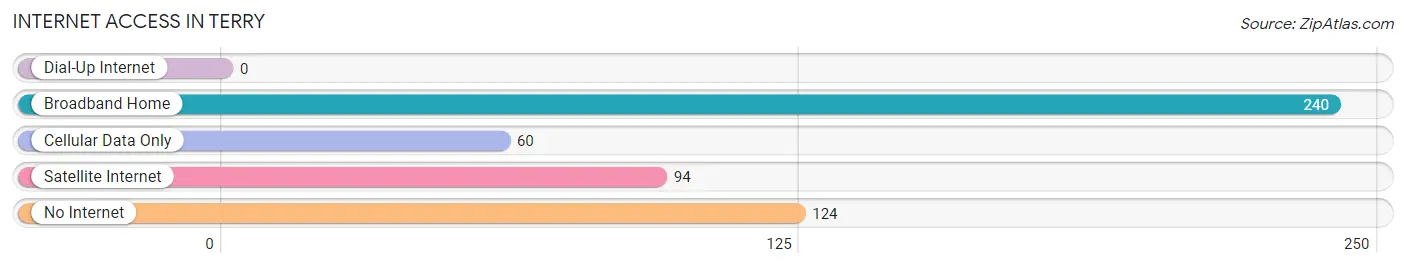
| Internet Type | # Households | % Households |
| Dial-Up Internet | 0 | 0.0% |
| Broadband Home | 240 | 49.2% |
| Cellular Data Only | 60 | 12.3% |
| Satellite Internet | 94 | 19.3% |
| No Internet | 124 | 25.4% |
| Total | 488 | 100.0% |
Terry Summary
History
The state of Mississippi has a long and storied history, beginning with the Native American tribes that inhabited the area for thousands of years before the arrival of Europeans. The Choctaw, Chickasaw, and Natchez tribes were the most prominent of these tribes, and their influence can still be seen in the state today.
The first Europeans to explore the area were the Spanish, who arrived in the late 1500s. They established a few small settlements, but these were abandoned by the early 1700s. The French then arrived and established a colony in the area, which they called Louisiana. This colony was eventually ceded to the British in 1763, and the area became part of the British colony of West Florida.
In 1798, the area became part of the Mississippi Territory, which was created by the United States. The territory was divided into two parts in 1817, with the western part becoming the state of Mississippi. The state was admitted to the Union in 1817, becoming the 20th state.
During the 19th century, Mississippi was a slave state, and the state was a major contributor to the Confederate cause during the Civil War. After the war, the state was subject to Reconstruction, and the state was readmitted to the Union in 1870.
In the early 20th century, Mississippi was a major center of the civil rights movement, and the state was the site of several major civil rights protests and demonstrations. The state was also the site of the infamous murder of civil rights leader Medgar Evers in 1963.
Geography
Mississippi is located in the southeastern United States, bordered by Tennessee to the north, Alabama to the east, Louisiana to the south, and Arkansas and the Mississippi River to the west. The state has a total area of 48,430 square miles, making it the 32nd largest state in the country.
The state is divided into three distinct geographic regions. The Gulf Coastal Plain is located in the southern part of the state, and is characterized by flat, low-lying land. The Piedmont Plateau is located in the central part of the state, and is characterized by rolling hills and valleys. The Mississippi Alluvial Plain is located in the northern part of the state, and is characterized by flat, fertile land.
The state is home to a variety of natural features, including the Mississippi River, which forms the western border of the state. Other major rivers include the Yazoo, Big Black, and Pearl Rivers. The state also has numerous lakes, including Ross Barnett Reservoir, Sardis Lake, and Grenada Lake.
Economy
Mississippi has a diverse economy, with a variety of industries contributing to the state’s economic output. The state’s largest industry is agriculture, which accounts for about one-third of the state’s total economic output. The state is a major producer of cotton, soybeans, corn, and rice.
The state is also a major producer of timber, and the lumber industry is a major contributor to the state’s economy. The state is also home to a number of manufacturing industries, including furniture, textiles, and chemicals.
The state’s service sector is also a major contributor to the state’s economy, with tourism being a major industry. The state is home to a number of popular tourist destinations, including the Gulf Coast, the Mississippi Delta, and the Natchez Trace Parkway.
Demographics
As of 2019, the population of Mississippi was estimated to be 2,976,149. The state has a population density of 60.3 people per square mile, making it the 37th most densely populated state in the country.
The racial makeup of the state is 63.7% White, 37.3% African American, 0.4% Native American, 0.7% Asian, 0.1% Pacific Islander, 0.3% from other races, and 1.4% from two or more races. The state’s Hispanic population is estimated to be 2.3%.
The median household income in the state is $41,754, and the median home value is $125,400. The state’s poverty rate is 19.7%, and the unemployment rate is 5.2%.
Common Questions
What is Per Capita Income in Terry?
Per Capita income in Terry is $27,193.
What is the Median Family Income in Terry?
Median Family Income in Terry is $45,125.
What is the Median Household income in Terry?
Median Household Income in Terry is $46,585.
What is Income or Wage Gap in Terry?
Income or Wage Gap in Terry is 38.6%.
Women in Terry earn 61.4 cents for every dollar earned by a man.
What is Family Income Deficit in Terry?
Family Income Deficit in Terry is $9,640.
Families that are below poverty line in Terry earn $9,640 less on average than the poverty threshold level.
What is Inequality or Gini Index in Terry?
Inequality or Gini Index in Terry is 0.52.
What is the Total Population of Terry?
Total Population of Terry is 1,541.
What is the Total Male Population of Terry?
Total Male Population of Terry is 746.
What is the Total Female Population of Terry?
Total Female Population of Terry is 795.
What is the Ratio of Males per 100 Females in Terry?
There are 93.84 Males per 100 Females in Terry.
What is the Ratio of Females per 100 Males in Terry?
There are 106.57 Females per 100 Males in Terry.
What is the Median Population Age in Terry?
Median Population Age in Terry is 28.5 Years.
What is the Average Family Size in Terry
Average Family Size in Terry is 3.4 People.
What is the Average Household Size in Terry
Average Household Size in Terry is 3.2 People.
How Large is the Labor Force in Terry?
There are 585 People in the Labor Forcein in Terry.
What is the Percentage of People in the Labor Force in Terry?
58.6% of People are in the Labor Force in Terry.
What is the Unemployment Rate in Terry?
Unemployment Rate in Terry is 0.9%.