Lexington, MS Map & Demographics
Lexington Map
Lexington Overview
$36,654
PER CAPITA INCOME
$38,478
AVG FAMILY INCOME
$39,076
AVG HOUSEHOLD INCOME
37.5%
WAGE / INCOME GAP [ % ]
62.5¢/ $1
WAGE / INCOME GAP [ $ ]
0.59
INEQUALITY / GINI INDEX
1,154
TOTAL POPULATION
452
MALE POPULATION
702
FEMALE POPULATION
64.39
MALES / 100 FEMALES
155.31
FEMALES / 100 MALES
47.5
MEDIAN AGE
3.3
AVG FAMILY SIZE
2.2
AVG HOUSEHOLD SIZE
578
LABOR FORCE [ PEOPLE ]
54.1%
PERCENT IN LABOR FORCE
5.4%
UNEMPLOYMENT RATE
Lexington Zip Codes
Lexington Area Codes
Income in Lexington
Income Overview in Lexington
Per Capita Income in Lexington is $36,654, while median incomes of families and households are $38,478 and $39,076 respectively.
| Characteristic | Number | Measure |
| Per Capita Income | 1,154 | $36,654 |
| Median Family Income | 260 | $38,478 |
| Mean Family Income | 260 | $75,362 |
| Median Household Income | 513 | $39,076 |
| Mean Household Income | 513 | $69,879 |
| Income Deficit | 260 | $0 |
| Wage / Income Gap (%) | 1,154 | 37.52% |
| Wage / Income Gap ($) | 1,154 | 62.48¢ per $1 |
| Gini / Inequality Index | 1,154 | 0.59 |
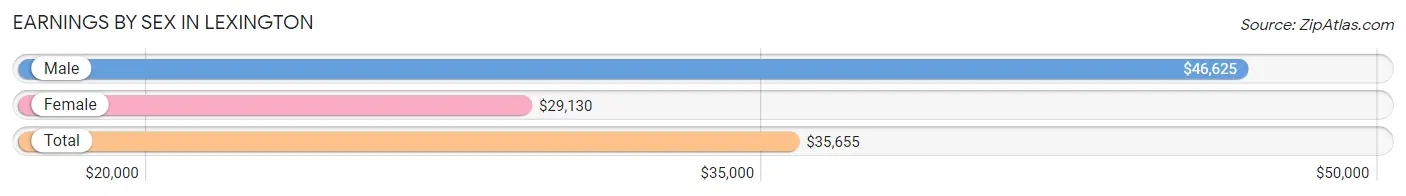
Earnings by Sex in Lexington
Average Earnings in Lexington are $35,655, $46,625 for men and $29,130 for women, a difference of 37.5%.
| Sex | Number | Average Earnings |
| Male | 193 (33.3%) | $46,625 |
| Female | 386 (66.7%) | $29,130 |
| Total | 579 (100.0%) | $35,655 |
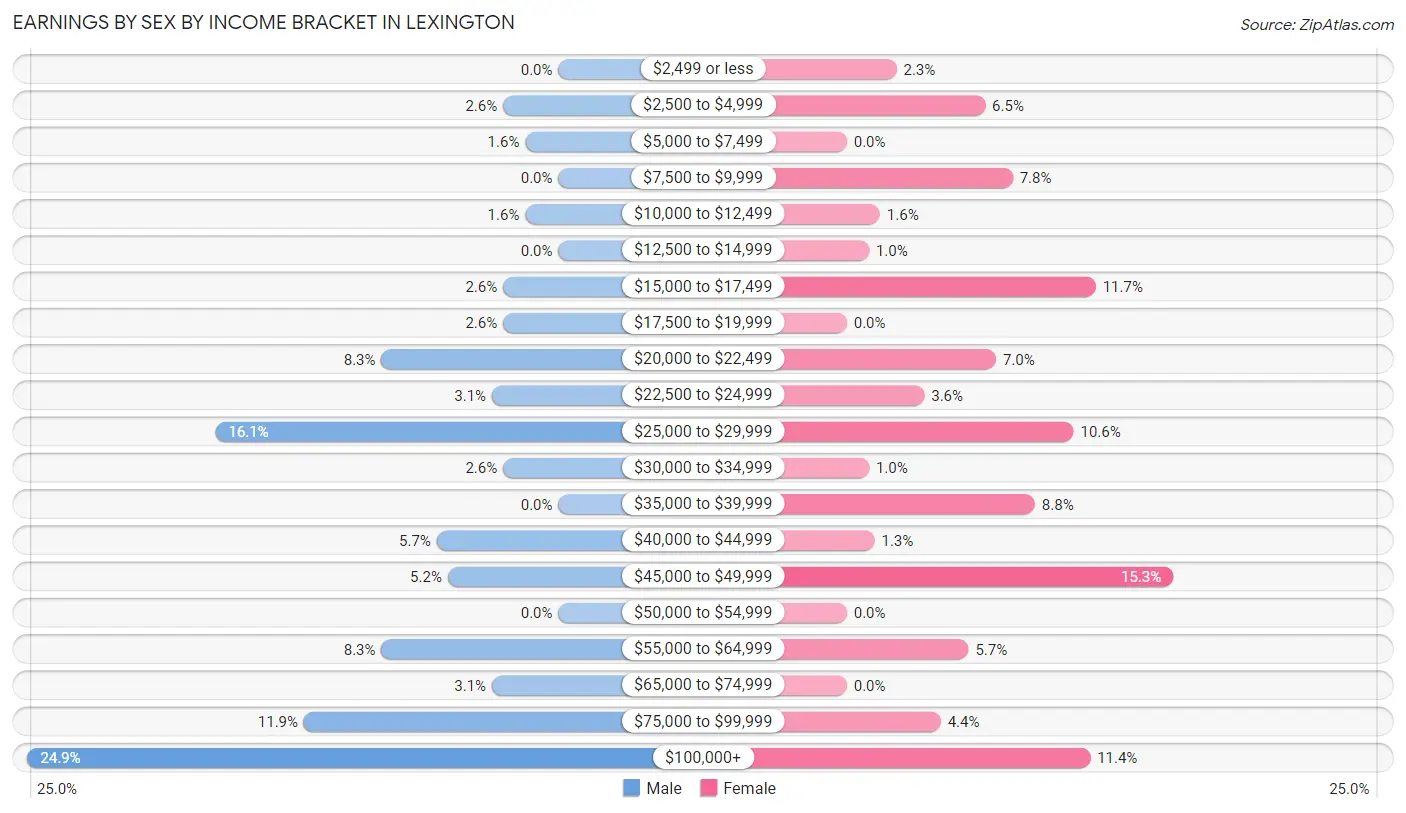
Earnings by Sex by Income Bracket in Lexington
The most common earnings brackets in Lexington are $100,000+ for men (48 | 24.9%) and $45,000 to $49,999 for women (59 | 15.3%).
| Income | Male | Female |
| $2,499 or less | 0 (0.0%) | 9 (2.3%) |
| $2,500 to $4,999 | 5 (2.6%) | 25 (6.5%) |
| $5,000 to $7,499 | 3 (1.5%) | 0 (0.0%) |
| $7,500 to $9,999 | 0 (0.0%) | 30 (7.8%) |
| $10,000 to $12,499 | 3 (1.5%) | 6 (1.5%) |
| $12,500 to $14,999 | 0 (0.0%) | 4 (1.0%) |
| $15,000 to $17,499 | 5 (2.6%) | 45 (11.7%) |
| $17,500 to $19,999 | 5 (2.6%) | 0 (0.0%) |
| $20,000 to $22,499 | 16 (8.3%) | 27 (7.0%) |
| $22,500 to $24,999 | 6 (3.1%) | 14 (3.6%) |
| $25,000 to $29,999 | 31 (16.1%) | 41 (10.6%) |
| $30,000 to $34,999 | 5 (2.6%) | 4 (1.0%) |
| $35,000 to $39,999 | 0 (0.0%) | 34 (8.8%) |
| $40,000 to $44,999 | 11 (5.7%) | 5 (1.3%) |
| $45,000 to $49,999 | 10 (5.2%) | 59 (15.3%) |
| $50,000 to $54,999 | 0 (0.0%) | 0 (0.0%) |
| $55,000 to $64,999 | 16 (8.3%) | 22 (5.7%) |
| $65,000 to $74,999 | 6 (3.1%) | 0 (0.0%) |
| $75,000 to $99,999 | 23 (11.9%) | 17 (4.4%) |
| $100,000+ | 48 (24.9%) | 44 (11.4%) |
| Total | 193 (100.0%) | 386 (100.0%) |
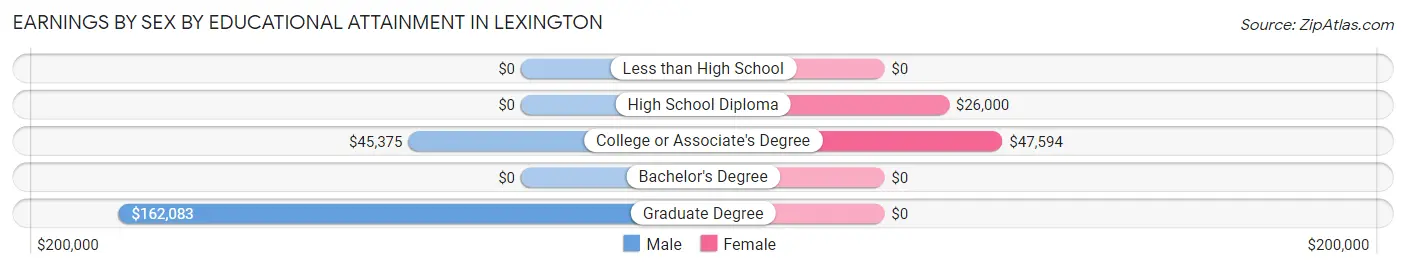
Earnings by Sex by Educational Attainment in Lexington
Average earnings in Lexington are $45,625 for men and $36,905 for women, a difference of 19.1%. Men with an educational attainment of graduate degree enjoy the highest average annual earnings of $162,083, while those with college or associate's degree education earn the least with $45,375. Women with an educational attainment of college or associate's degree earn the most with the average annual earnings of $47,594, while those with high school diploma education have the smallest earnings of $26,000.
| Educational Attainment | Male Income | Female Income |
| Less than High School | - | - |
| High School Diploma | - | - |
| College or Associate's Degree | $45,375 | $47,594 |
| Bachelor's Degree | - | - |
| Graduate Degree | $162,083 | $0 |
| Total | $45,625 | $36,905 |
Family Income in Lexington
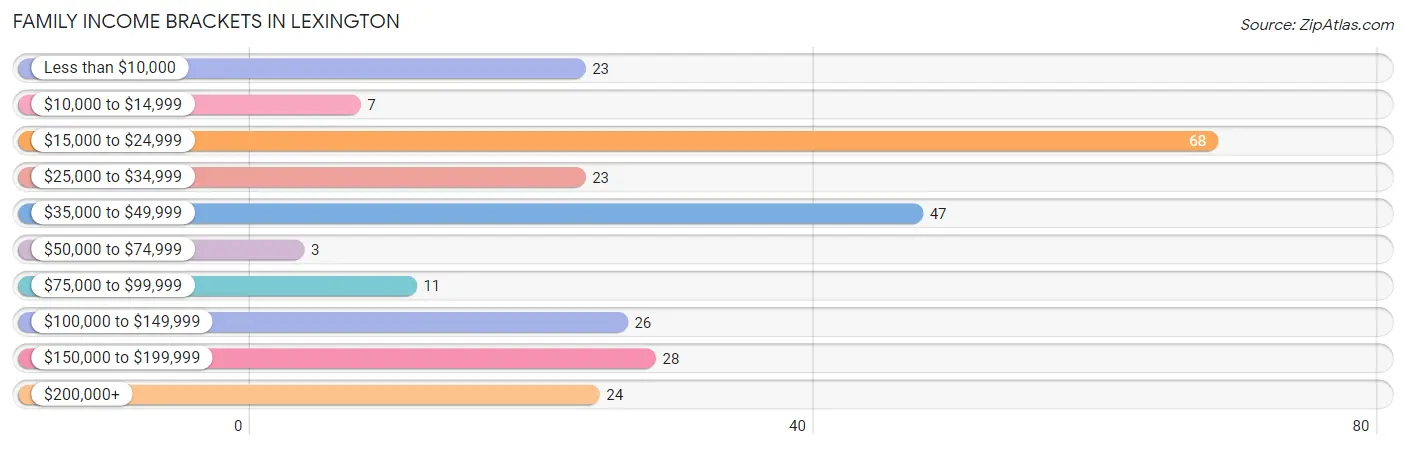
Family Income Brackets in Lexington
According to the Lexington family income data, there are 68 families falling into the $15,000 to $24,999 income range, which is the most common income bracket and makes up 26.2% of all families. Conversely, the $50,000 to $74,999 income bracket is the least frequent group with only 3 families (1.1%) belonging to this category.
| Income Bracket | # Families | % Families |
| Less than $10,000 | 23 | 8.8% |
| $10,000 to $14,999 | 7 | 2.7% |
| $15,000 to $24,999 | 68 | 26.2% |
| $25,000 to $34,999 | 23 | 8.8% |
| $35,000 to $49,999 | 47 | 18.1% |
| $50,000 to $74,999 | 3 | 1.2% |
| $75,000 to $99,999 | 11 | 4.2% |
| $100,000 to $149,999 | 26 | 10.0% |
| $150,000 to $199,999 | 28 | 10.8% |
| $200,000+ | 24 | 9.2% |
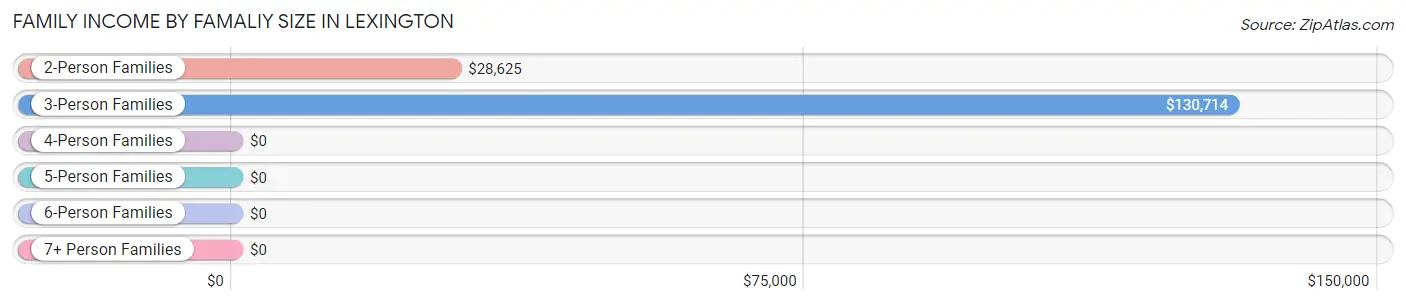
Family Income by Famaliy Size in Lexington
3-person families (22 | 8.5%) account for the highest median family income in Lexington with $130,714 per family, while 3-person families (22 | 8.5%) have the highest median income of $43,571 per family member.
| Income Bracket | # Families | Median Income |
| 2-Person Families | 199 (76.5%) | $28,625 |
| 3-Person Families | 22 (8.5%) | $130,714 |
| 4-Person Families | 39 (15.0%) | $0 |
| 5-Person Families | 0 (0.0%) | $0 |
| 6-Person Families | 0 (0.0%) | $0 |
| 7+ Person Families | 0 (0.0%) | $0 |
| Total | 260 (100.0%) | $38,478 |
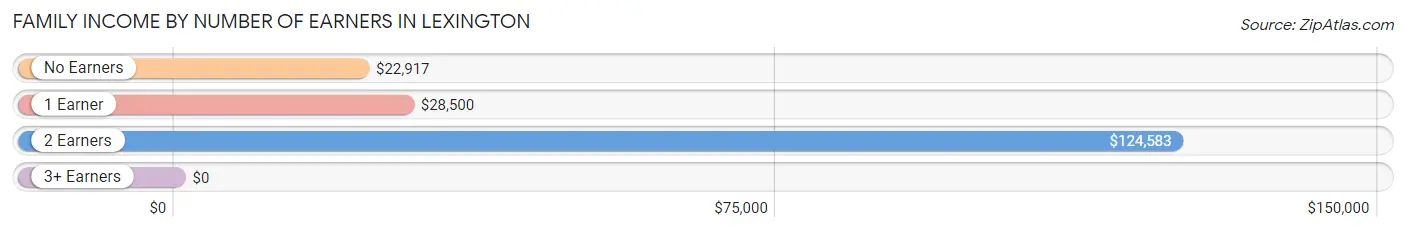
Family Income by Number of Earners in Lexington
| Number of Earners | # Families | Median Income |
| No Earners | 67 (25.8%) | $22,917 |
| 1 Earner | 122 (46.9%) | $28,500 |
| 2 Earners | 55 (21.1%) | $124,583 |
| 3+ Earners | 16 (6.1%) | $0 |
| Total | 260 (100.0%) | $38,478 |
Household Income in Lexington
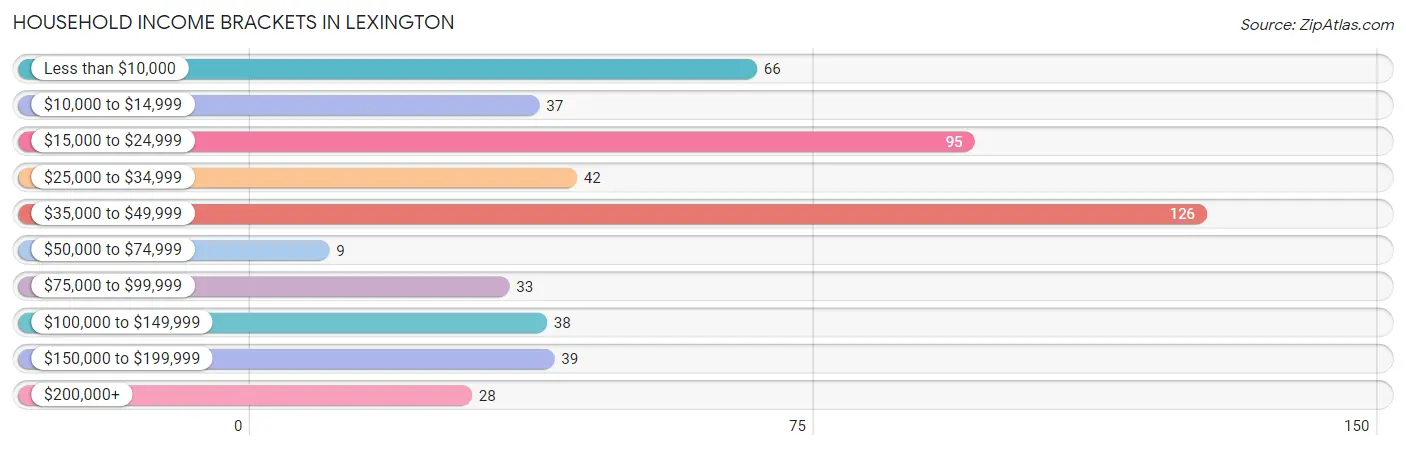
Household Income Brackets in Lexington
With 126 households falling in the category, the $35,000 to $49,999 income range is the most frequent in Lexington, accounting for 24.6% of all households. In contrast, only 9 households (1.8%) fall into the $50,000 to $74,999 income bracket, making it the least populous group.
| Income Bracket | # Households | % Households |
| Less than $10,000 | 66 | 12.9% |
| $10,000 to $14,999 | 37 | 7.2% |
| $15,000 to $24,999 | 95 | 18.5% |
| $25,000 to $34,999 | 42 | 8.2% |
| $35,000 to $49,999 | 126 | 24.6% |
| $50,000 to $74,999 | 9 | 1.8% |
| $75,000 to $99,999 | 33 | 6.4% |
| $100,000 to $149,999 | 38 | 7.4% |
| $150,000 to $199,999 | 39 | 7.6% |
| $200,000+ | 28 | 5.5% |
Household Income by Householder Age in Lexington
The median household income in Lexington is $39,076, with the highest median household income of $47,775 found in the 25 to 44 years age bracket for the primary householder. A total of 113 households (22.0%) fall into this category. Meanwhile, the 15 to 24 years age bracket for the primary householder has the lowest median household income of $0, with 5 households (1.0%) in this group.
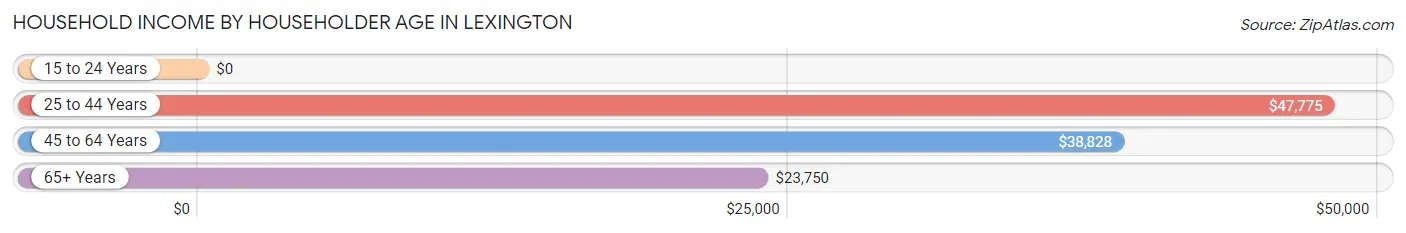
| Income Bracket | # Households | Median Income |
| 15 to 24 Years | 5 (1.0%) | $0 |
| 25 to 44 Years | 113 (22.0%) | $47,775 |
| 45 to 64 Years | 217 (42.3%) | $38,828 |
| 65+ Years | 178 (34.7%) | $23,750 |
| Total | 513 (100.0%) | $39,076 |
Poverty in Lexington
Income Below Poverty by Sex and Age in Lexington
With 17.0% poverty level for males and 26.4% for females among the residents of Lexington, 75 year old and over males and 18 to 24 year old females are the most vulnerable to poverty, with 21 males (42.9%) and 59 females (75.6%) in their respective age groups living below the poverty level.
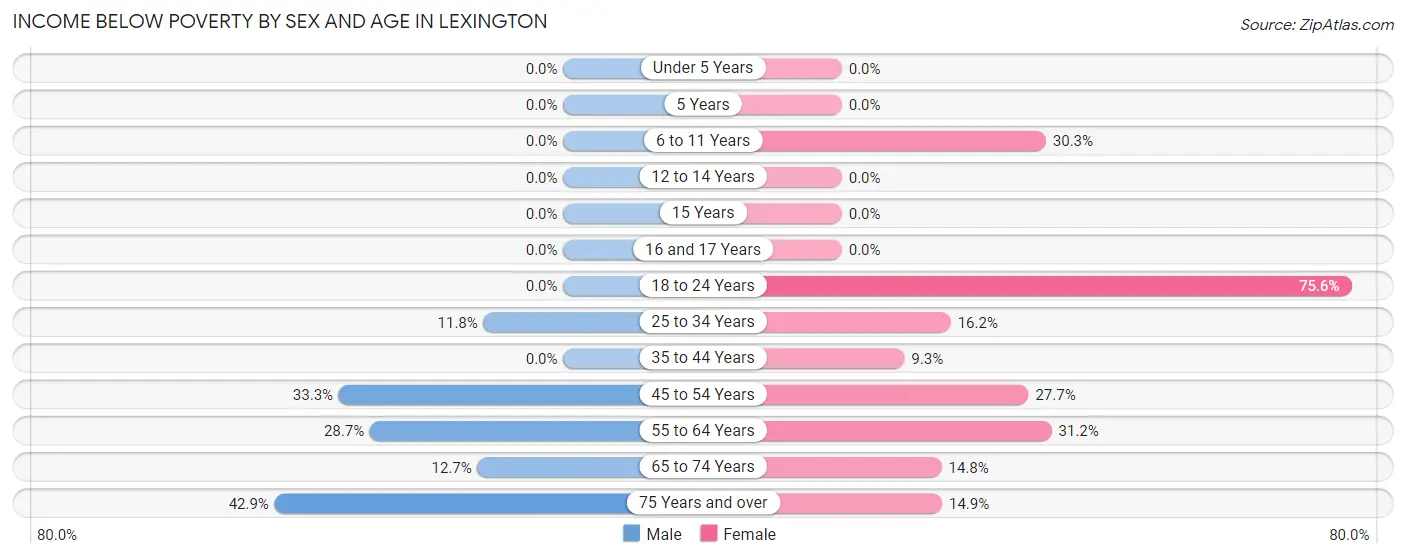
| Age Bracket | Male | Female |
| Under 5 Years | 0 (0.0%) | 0 (0.0%) |
| 5 Years | 0 (0.0%) | 0 (0.0%) |
| 6 to 11 Years | 0 (0.0%) | 10 (30.3%) |
| 12 to 14 Years | 0 (0.0%) | 0 (0.0%) |
| 15 Years | 0 (0.0%) | 0 (0.0%) |
| 16 and 17 Years | 0 (0.0%) | 0 (0.0%) |
| 18 to 24 Years | 0 (0.0%) | 59 (75.6%) |
| 25 to 34 Years | 9 (11.8%) | 22 (16.2%) |
| 35 to 44 Years | 0 (0.0%) | 4 (9.3%) |
| 45 to 54 Years | 11 (33.3%) | 28 (27.7%) |
| 55 to 64 Years | 29 (28.7%) | 43 (31.2%) |
| 65 to 74 Years | 7 (12.7%) | 12 (14.8%) |
| 75 Years and over | 21 (42.9%) | 7 (14.9%) |
| Total | 77 (17.0%) | 185 (26.4%) |
Income Above Poverty by Sex and Age in Lexington
According to the poverty statistics in Lexington, males aged 12 to 14 years and females aged under 5 years are the age groups that are most secure financially, with 100.0% of males and 100.0% of females in these age groups living above the poverty line.
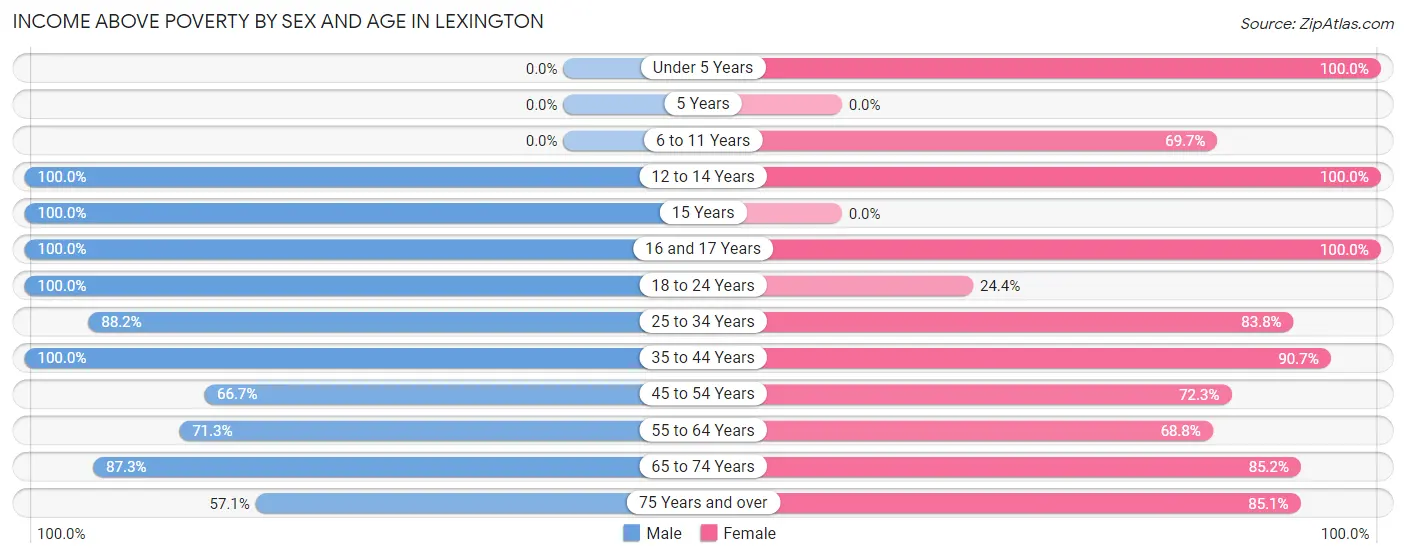
| Age Bracket | Male | Female |
| Under 5 Years | 0 (0.0%) | 17 (100.0%) |
| 5 Years | 0 (0.0%) | 0 (0.0%) |
| 6 to 11 Years | 0 (0.0%) | 23 (69.7%) |
| 12 to 14 Years | 13 (100.0%) | 15 (100.0%) |
| 15 Years | 7 (100.0%) | 0 (0.0%) |
| 16 and 17 Years | 28 (100.0%) | 13 (100.0%) |
| 18 to 24 Years | 18 (100.0%) | 19 (24.4%) |
| 25 to 34 Years | 67 (88.2%) | 114 (83.8%) |
| 35 to 44 Years | 72 (100.0%) | 39 (90.7%) |
| 45 to 54 Years | 22 (66.7%) | 73 (72.3%) |
| 55 to 64 Years | 72 (71.3%) | 95 (68.8%) |
| 65 to 74 Years | 48 (87.3%) | 69 (85.2%) |
| 75 Years and over | 28 (57.1%) | 40 (85.1%) |
| Total | 375 (83.0%) | 517 (73.7%) |
Income Below Poverty Among Married-Couple Families in Lexington
The poverty statistics for married-couple families in Lexington show that 13.3% or 18 of the total 135 families live below the poverty line. Families with no children have the highest poverty rate of 15.8%, comprising of 18 families. On the other hand, families with 1 or 2 children have the lowest poverty rate of 0.0%, which includes 0 families.
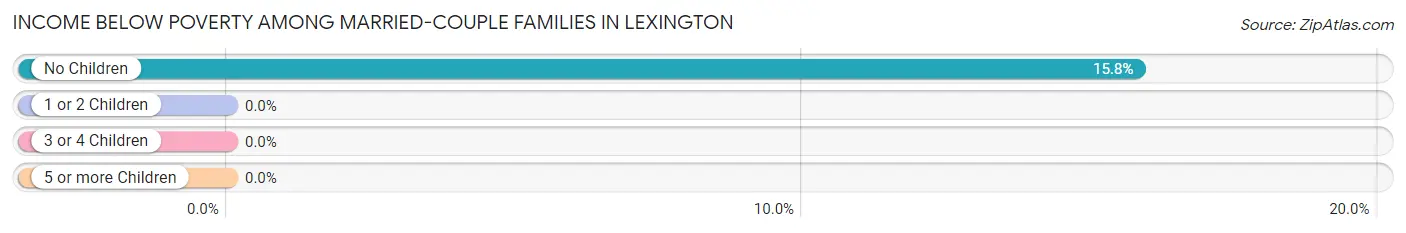
| Children | Above Poverty | Below Poverty |
| No Children | 96 (84.2%) | 18 (15.8%) |
| 1 or 2 Children | 21 (100.0%) | 0 (0.0%) |
| 3 or 4 Children | 0 (0.0%) | 0 (0.0%) |
| 5 or more Children | 0 (0.0%) | 0 (0.0%) |
| Total | 117 (86.7%) | 18 (13.3%) |
Income Below Poverty Among Single-Parent Households in Lexington
According to the poverty data in Lexington, 24.2% or 8 single-father households and 35.9% or 33 single-mother households are living below the poverty line. Among single-father households, those with 1 or 2 children have the highest poverty rate, with 3 households (27.3%) experiencing poverty. Likewise, among single-mother households, those with no children have the highest poverty rate, with 33 households (43.4%) falling below the poverty line.
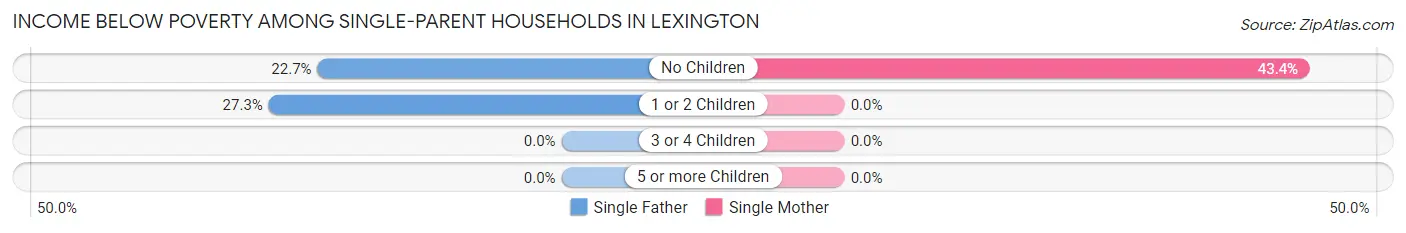
| Children | Single Father | Single Mother |
| No Children | 5 (22.7%) | 33 (43.4%) |
| 1 or 2 Children | 3 (27.3%) | 0 (0.0%) |
| 3 or 4 Children | 0 (0.0%) | 0 (0.0%) |
| 5 or more Children | 0 (0.0%) | 0 (0.0%) |
| Total | 8 (24.2%) | 33 (35.9%) |
Income Below Poverty Among Married-Couple vs Single-Parent Households in Lexington
The poverty data for Lexington shows that 18 of the married-couple family households (13.3%) and 41 of the single-parent households (32.8%) are living below the poverty level. Within the married-couple family households, those with no children have the highest poverty rate, with 18 households (15.8%) falling below the poverty line. Among the single-parent households, those with no children have the highest poverty rate, with 38 household (38.8%) living below poverty.
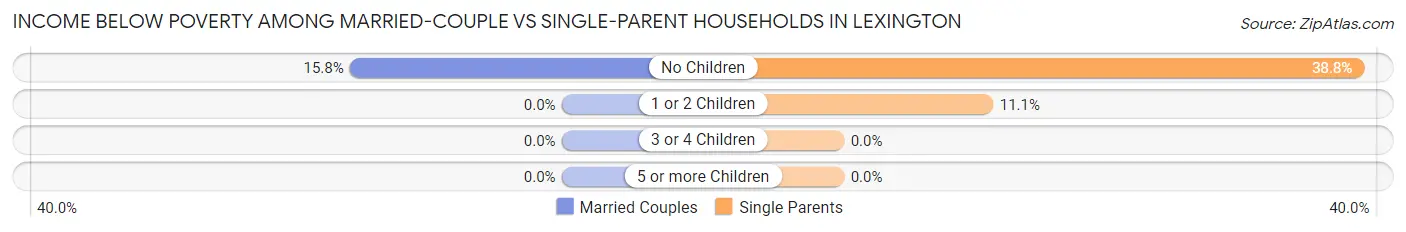
| Children | Married-Couple Families | Single-Parent Households |
| No Children | 18 (15.8%) | 38 (38.8%) |
| 1 or 2 Children | 0 (0.0%) | 3 (11.1%) |
| 3 or 4 Children | 0 (0.0%) | 0 (0.0%) |
| 5 or more Children | 0 (0.0%) | 0 (0.0%) |
| Total | 18 (13.3%) | 41 (32.8%) |
Race in Lexington
The most populous races in Lexington are Black / African American (873 | 75.6%), White / Caucasian (250 | 21.7%), and Asian (22 | 1.9%).
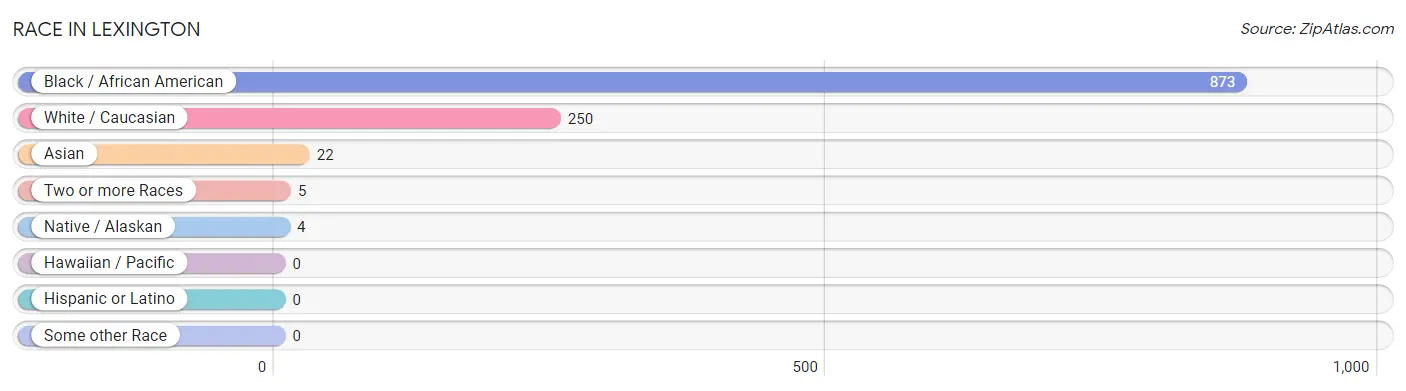
| Race | # Population | % Population |
| Asian | 22 | 1.9% |
| Black / African American | 873 | 75.6% |
| Hawaiian / Pacific | 0 | 0.0% |
| Hispanic or Latino | 0 | 0.0% |
| Native / Alaskan | 4 | 0.4% |
| White / Caucasian | 250 | 21.7% |
| Two or more Races | 5 | 0.4% |
| Some other Race | 0 | 0.0% |
| Total | 1,154 | 100.0% |
Ancestry in Lexington
The most populous ancestries reported in Lexington are American (107 | 9.3%), Irish (50 | 4.3%), English (26 | 2.2%), African (23 | 2.0%), and Subsaharan African (23 | 2.0%), together accounting for 19.8% of all Lexington residents.
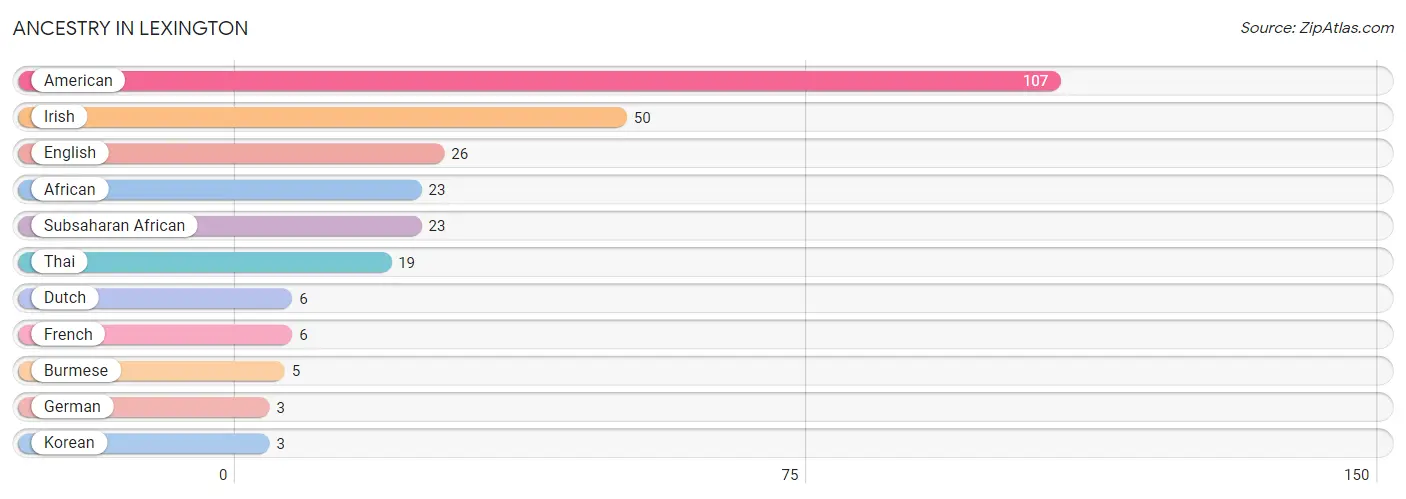
| Ancestry | # Population | % Population |
| African | 23 | 2.0% |
| American | 107 | 9.3% |
| Burmese | 5 | 0.4% |
| Dutch | 6 | 0.5% |
| English | 26 | 2.2% |
| French | 6 | 0.5% |
| German | 3 | 0.3% |
| Irish | 50 | 4.3% |
| Korean | 3 | 0.3% |
| Subsaharan African | 23 | 2.0% |
| Thai | 19 | 1.7% | View All 11 Rows |
Immigrants in Lexington
The most numerous immigrant groups reported in Lexington came from Asia (22 | 1.9%), India (19 | 1.7%), South Central Asia (19 | 1.7%), Philippines (3 | 0.3%), and South Eastern Asia (3 | 0.3%), together accounting for 5.7% of all Lexington residents.
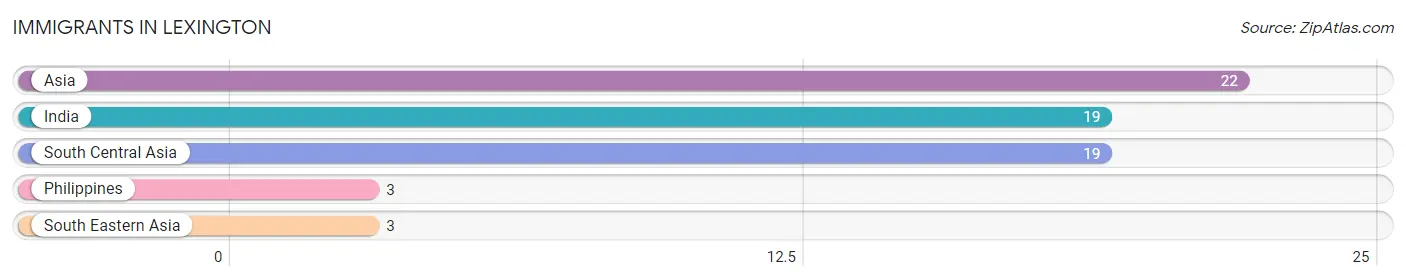
| Immigration Origin | # Population | % Population |
| Asia | 22 | 1.9% |
| India | 19 | 1.7% |
| Philippines | 3 | 0.3% |
| South Central Asia | 19 | 1.7% |
| South Eastern Asia | 3 | 0.3% | View All 5 Rows |
Sex and Age in Lexington
Sex and Age in Lexington
The most populous age groups in Lexington are 30 to 34 Years (70 | 15.5%) for men and 55 to 59 Years (96 | 13.7%) for women.
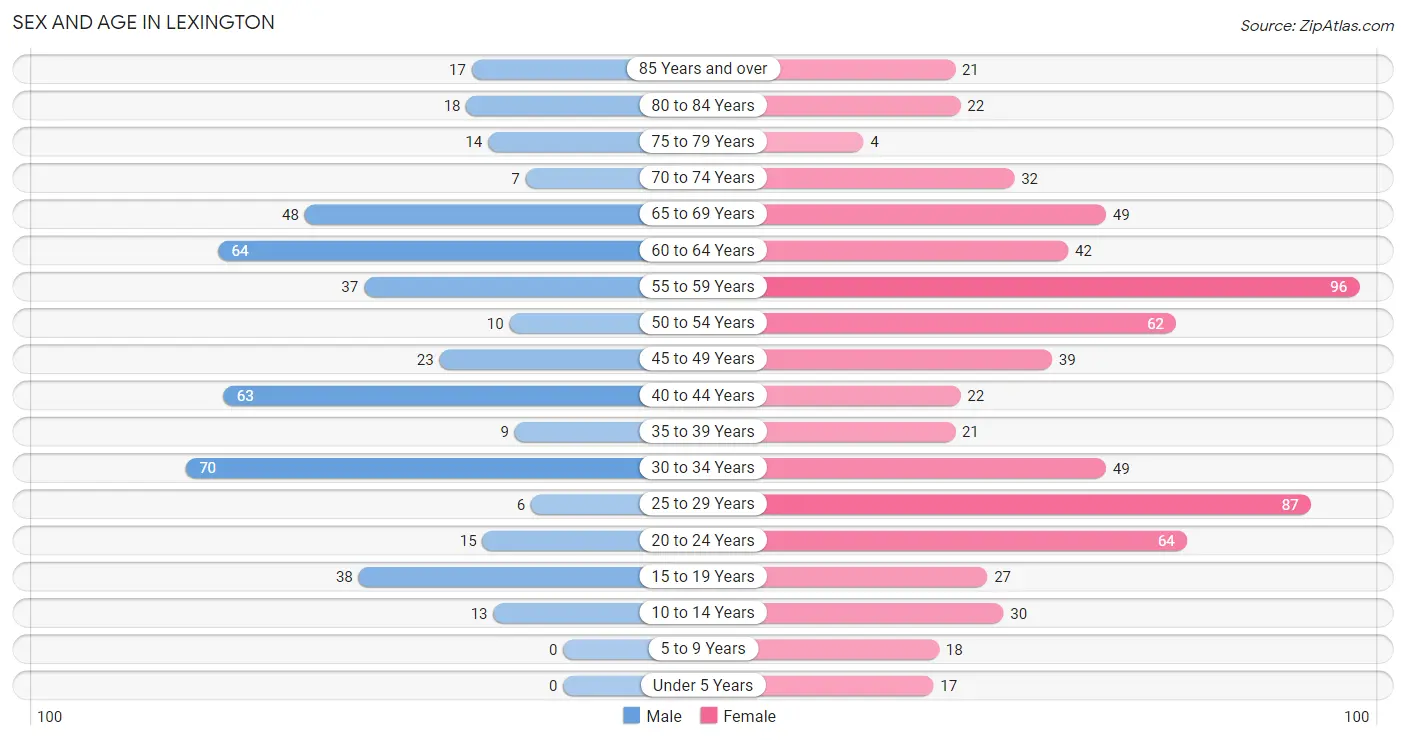
| Age Bracket | Male | Female |
| Under 5 Years | 0 (0.0%) | 17 (2.4%) |
| 5 to 9 Years | 0 (0.0%) | 18 (2.6%) |
| 10 to 14 Years | 13 (2.9%) | 30 (4.3%) |
| 15 to 19 Years | 38 (8.4%) | 27 (3.8%) |
| 20 to 24 Years | 15 (3.3%) | 64 (9.1%) |
| 25 to 29 Years | 6 (1.3%) | 87 (12.4%) |
| 30 to 34 Years | 70 (15.5%) | 49 (7.0%) |
| 35 to 39 Years | 9 (2.0%) | 21 (3.0%) |
| 40 to 44 Years | 63 (13.9%) | 22 (3.1%) |
| 45 to 49 Years | 23 (5.1%) | 39 (5.6%) |
| 50 to 54 Years | 10 (2.2%) | 62 (8.8%) |
| 55 to 59 Years | 37 (8.2%) | 96 (13.7%) |
| 60 to 64 Years | 64 (14.2%) | 42 (6.0%) |
| 65 to 69 Years | 48 (10.6%) | 49 (7.0%) |
| 70 to 74 Years | 7 (1.5%) | 32 (4.6%) |
| 75 to 79 Years | 14 (3.1%) | 4 (0.6%) |
| 80 to 84 Years | 18 (4.0%) | 22 (3.1%) |
| 85 Years and over | 17 (3.8%) | 21 (3.0%) |
| Total | 452 (100.0%) | 702 (100.0%) |
Families and Households in Lexington
Median Family Size in Lexington
The median family size in Lexington is 3.32 persons per family, with single female/mother families (92 | 35.4%) accounting for the largest median family size of 4 persons per family. On the other hand, married-couple families (135 | 51.9%) represent the smallest median family size with 2.90 persons per family.
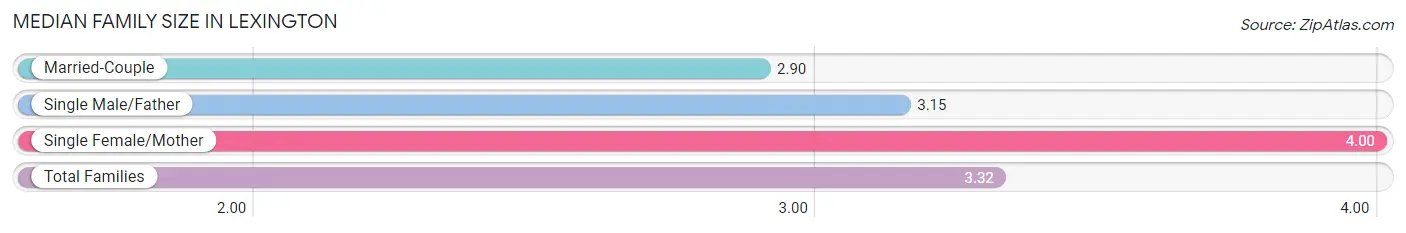
| Family Type | # Families | Family Size |
| Married-Couple | 135 (51.9%) | 2.90 |
| Single Male/Father | 33 (12.7%) | 3.15 |
| Single Female/Mother | 92 (35.4%) | 4.00 |
| Total Families | 260 (100.0%) | 3.32 |
Median Household Size in Lexington
The median household size in Lexington is 2.25 persons per household, with single female/mother households (92 | 17.9%) accounting for the largest median household size of 4 persons per household. non-family households (253 | 49.3%) represent the smallest median household size with 1.11 persons per household.
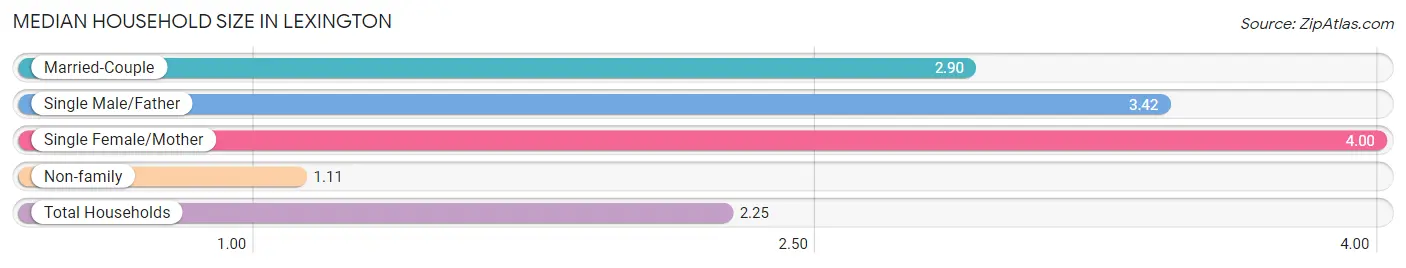
| Household Type | # Households | Household Size |
| Married-Couple | 135 (26.3%) | 2.90 |
| Single Male/Father | 33 (6.4%) | 3.42 |
| Single Female/Mother | 92 (17.9%) | 4.00 |
| Non-family | 253 (49.3%) | 1.11 |
| Total Households | 513 (100.0%) | 2.25 |
Household Size by Marriage Status in Lexington
Out of a total of 513 households in Lexington, 260 (50.7%) are family households, while 253 (49.3%) are nonfamily households. The most numerous type of family households are 2-person households, comprising 183, and the most common type of nonfamily households are 1-person households, comprising 230.
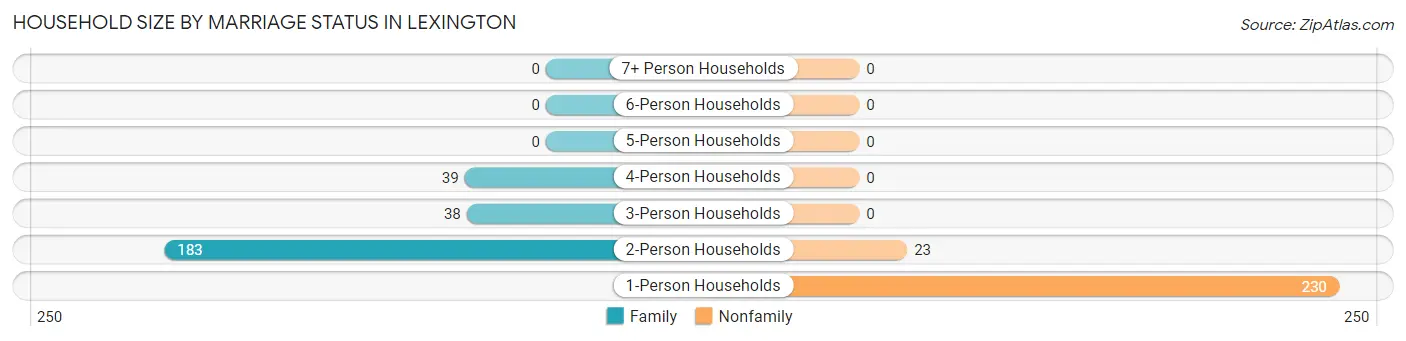
| Household Size | Family Households | Nonfamily Households |
| 1-Person Households | - | 230 (44.8%) |
| 2-Person Households | 183 (35.7%) | 23 (4.5%) |
| 3-Person Households | 38 (7.4%) | 0 (0.0%) |
| 4-Person Households | 39 (7.6%) | 0 (0.0%) |
| 5-Person Households | 0 (0.0%) | 0 (0.0%) |
| 6-Person Households | 0 (0.0%) | 0 (0.0%) |
| 7+ Person Households | 0 (0.0%) | 0 (0.0%) |
| Total | 260 (50.7%) | 253 (49.3%) |
Female Fertility in Lexington
Fertility by Age in Lexington
| Age Bracket | Women with Births | Births / 1,000 Women |
| 15 to 19 years | 0 (0.0%) | 0.0 |
| 20 to 34 years | 0 (0.0%) | 0.0 |
| 35 to 50 years | 0 (0.0%) | 0.0 |
| Total | 0 (0.0%) | 0.0 |
Fertility by Age by Marriage Status in Lexington
| Age Bracket | Married | Unmarried |
| 15 to 19 years | 0 (0.0%) | 0 (0.0%) |
| 20 to 34 years | 0 (0.0%) | 0 (0.0%) |
| 35 to 50 years | 0 (0.0%) | 0 (0.0%) |
| Total | 0 (0.0%) | 0 (0.0%) |
Fertility by Education in Lexington
| Educational Attainment | Women with Births | Births / 1,000 Women |
| Less than High School | 0 (0.0%) | 0.0 |
| High School Diploma | 0 (0.0%) | 0.0 |
| College or Associate's Degree | 0 (0.0%) | 0.0 |
| Bachelor's Degree | 0 (0.0%) | 0.0 |
| Graduate Degree | 0 (0.0%) | 0.0 |
| Total | 0 (0.0%) | 0.0 |
Fertility by Education by Marriage Status in Lexington
| Educational Attainment | Married | Unmarried |
| Less than High School | 0 (0.0%) | 0 (0.0%) |
| High School Diploma | 0 (0.0%) | 0 (0.0%) |
| College or Associate's Degree | 0 (0.0%) | 0 (0.0%) |
| Bachelor's Degree | 0 (0.0%) | 0 (0.0%) |
| Graduate Degree | 0 (0.0%) | 0 (0.0%) |
| Total | 0 (0.0%) | 0 (0.0%) |
Employment Characteristics in Lexington
Employment by Class of Employer in Lexington
Among the 537 employed individuals in Lexington, private company employees (320 | 59.6%), state government employees (81 | 15.1%), and local government employees (51 | 9.5%) make up the most common classes of employment.
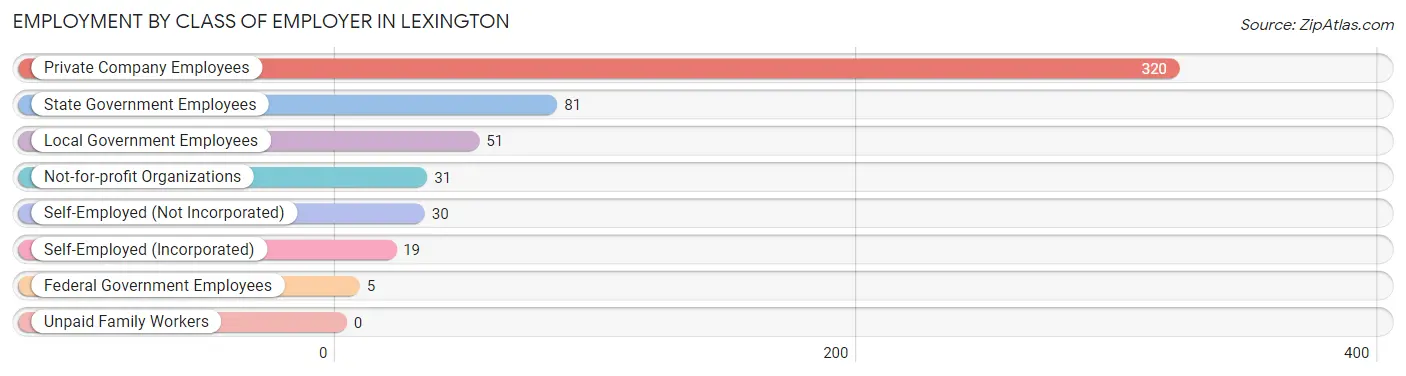
| Employer Class | # Employees | % Employees |
| Private Company Employees | 320 | 59.6% |
| Self-Employed (Incorporated) | 19 | 3.5% |
| Self-Employed (Not Incorporated) | 30 | 5.6% |
| Not-for-profit Organizations | 31 | 5.8% |
| Local Government Employees | 51 | 9.5% |
| State Government Employees | 81 | 15.1% |
| Federal Government Employees | 5 | 0.9% |
| Unpaid Family Workers | 0 | 0.0% |
| Total | 537 | 100.0% |
Employment Status by Age in Lexington
According to the labor force statistics for Lexington, out of the total population over 16 years of age (1,069), 54.1% or 578 individuals are in the labor force, with 5.4% or 31 of them unemployed. The age group with the highest labor force participation rate is 25 to 29 years, with 100.0% or 93 individuals in the labor force. Within the labor force, the 65 to 74 years age range has the highest percentage of unemployed individuals, with 25.0% or 9 of them being unemployed.
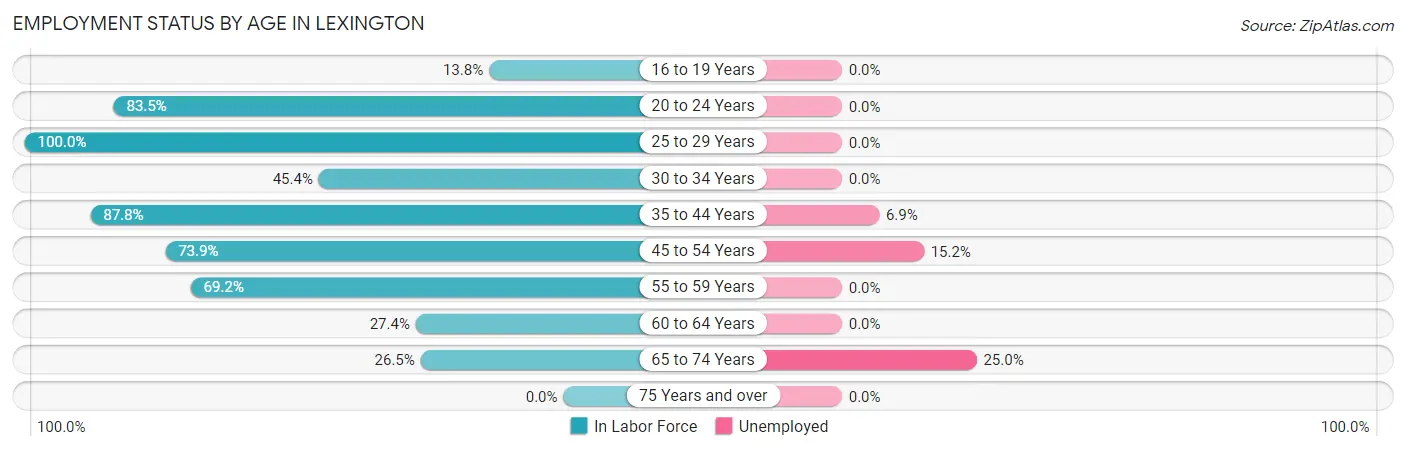
| Age Bracket | In Labor Force | Unemployed |
| 16 to 19 Years | 8 (13.8%) | 0 (0.0%) |
| 20 to 24 Years | 66 (83.5%) | 0 (0.0%) |
| 25 to 29 Years | 93 (100.0%) | 0 (0.0%) |
| 30 to 34 Years | 54 (45.4%) | 0 (0.0%) |
| 35 to 44 Years | 101 (87.8%) | 7 (6.9%) |
| 45 to 54 Years | 99 (73.9%) | 15 (15.2%) |
| 55 to 59 Years | 92 (69.2%) | 0 (0.0%) |
| 60 to 64 Years | 29 (27.4%) | 0 (0.0%) |
| 65 to 74 Years | 36 (26.5%) | 9 (25.0%) |
| 75 Years and over | 0 (0.0%) | 0 (0.0%) |
| Total | 578 (54.1%) | 31 (5.4%) |
Employment Status by Educational Attainment in Lexington
According to labor force statistics for Lexington, 66.9% of individuals (468) out of the total population between 25 and 64 years of age (700) are in the labor force, with 4.7% or 22 of them being unemployed. The group with the highest labor force participation rate are those with the educational attainment of bachelor's degree or higher, with 88.4% or 167 individuals in the labor force. Within the labor force, individuals with less than high school education have the highest percentage of unemployment, with 57.7% or 15 of them being unemployed.
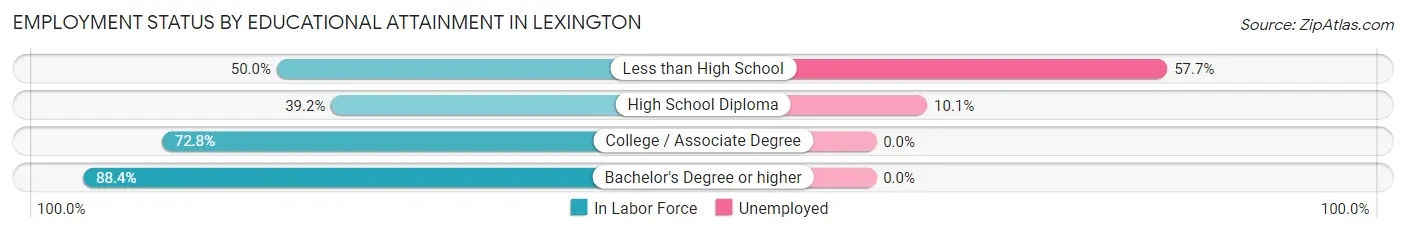
| Educational Attainment | In Labor Force | Unemployed |
| Less than High School | 26 (50.0%) | 30 (57.7%) |
| High School Diploma | 69 (39.2%) | 18 (10.1%) |
| College / Associate Degree | 206 (72.8%) | 0 (0.0%) |
| Bachelor's Degree or higher | 167 (88.4%) | 0 (0.0%) |
| Total | 468 (66.9%) | 33 (4.7%) |
Employment Occupations by Sex in Lexington
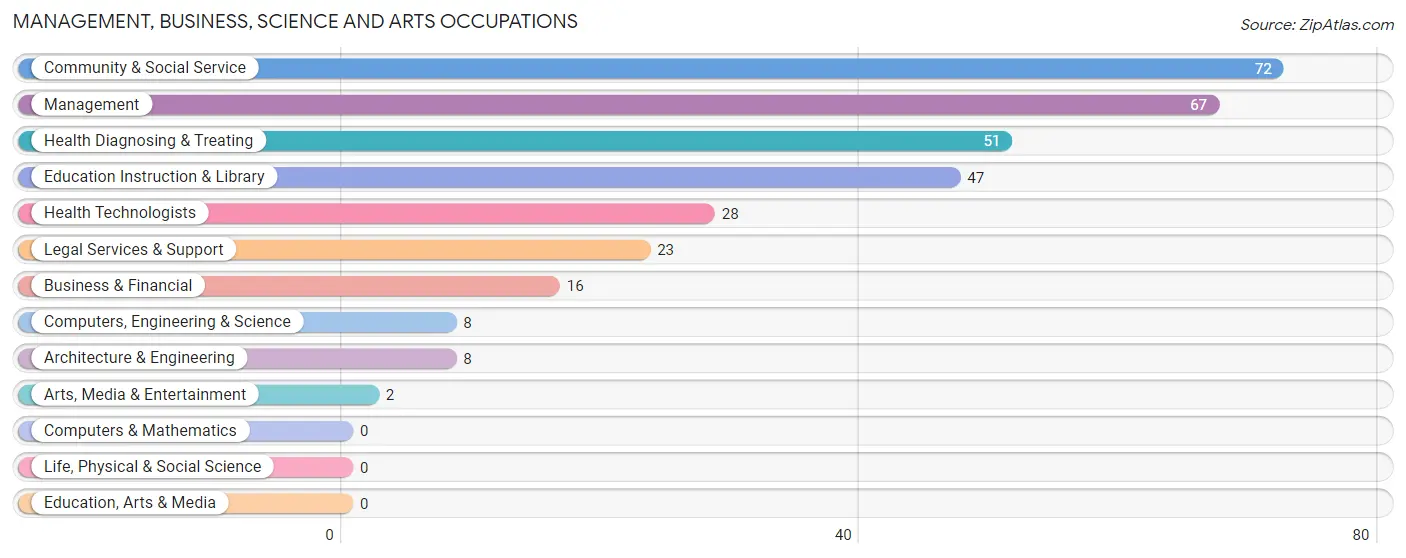
Management, Business, Science and Arts Occupations
The most common Management, Business, Science and Arts occupations in Lexington are Community & Social Service (72 | 13.2%), Management (67 | 12.2%), Health Diagnosing & Treating (51 | 9.3%), Education Instruction & Library (47 | 8.6%), and Health Technologists (28 | 5.1%).
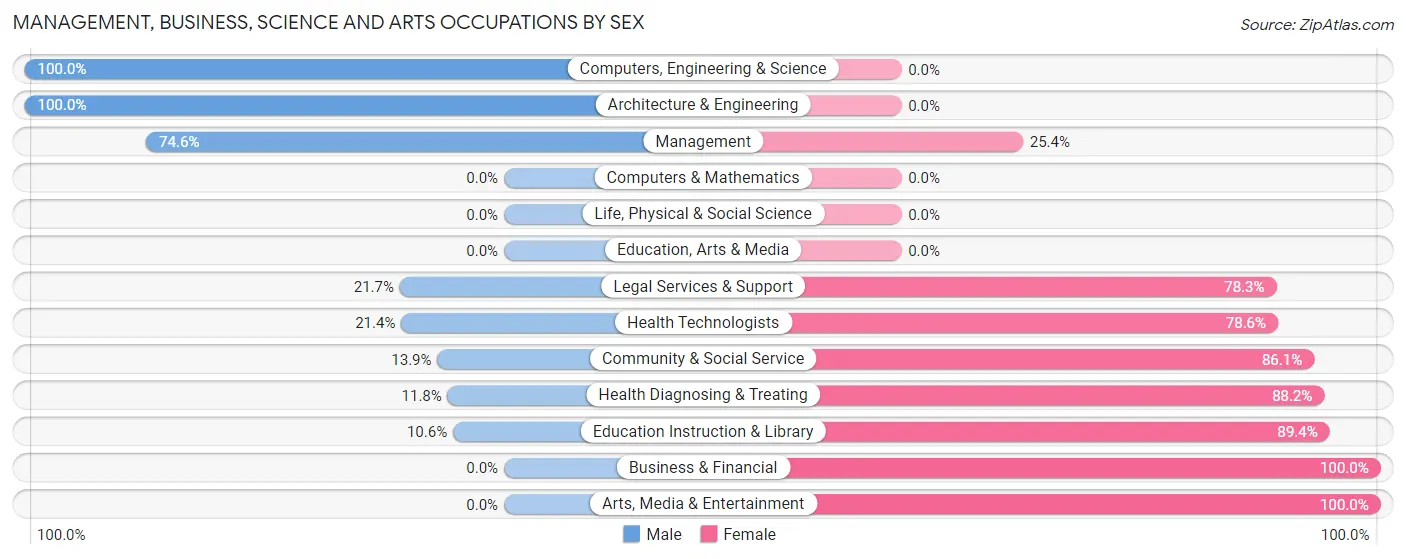
Management, Business, Science and Arts Occupations by Sex
Within the Management, Business, Science and Arts occupations in Lexington, the most male-oriented occupations are Computers, Engineering & Science (100.0%), Architecture & Engineering (100.0%), and Management (74.6%), while the most female-oriented occupations are Business & Financial (100.0%), Arts, Media & Entertainment (100.0%), and Education Instruction & Library (89.4%).
| Occupation | Male | Female |
| Management | 50 (74.6%) | 17 (25.4%) |
| Business & Financial | 0 (0.0%) | 16 (100.0%) |
| Computers, Engineering & Science | 8 (100.0%) | 0 (0.0%) |
| Computers & Mathematics | 0 (0.0%) | 0 (0.0%) |
| Architecture & Engineering | 8 (100.0%) | 0 (0.0%) |
| Life, Physical & Social Science | 0 (0.0%) | 0 (0.0%) |
| Community & Social Service | 10 (13.9%) | 62 (86.1%) |
| Education, Arts & Media | 0 (0.0%) | 0 (0.0%) |
| Legal Services & Support | 5 (21.7%) | 18 (78.3%) |
| Education Instruction & Library | 5 (10.6%) | 42 (89.4%) |
| Arts, Media & Entertainment | 0 (0.0%) | 2 (100.0%) |
| Health Diagnosing & Treating | 6 (11.8%) | 45 (88.2%) |
| Health Technologists | 6 (21.4%) | 22 (78.6%) |
| Total (Category) | 74 (34.6%) | 140 (65.4%) |
| Total (Overall) | 188 (34.4%) | 359 (65.6%) |
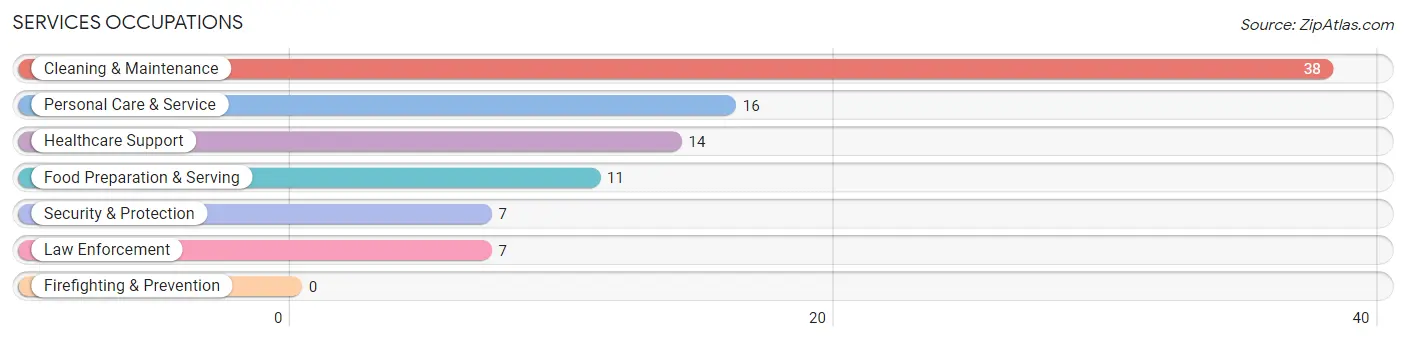
Services Occupations
The most common Services occupations in Lexington are Cleaning & Maintenance (38 | 7.0%), Personal Care & Service (16 | 2.9%), Healthcare Support (14 | 2.6%), Food Preparation & Serving (11 | 2.0%), and Security & Protection (7 | 1.3%).
Services Occupations by Sex
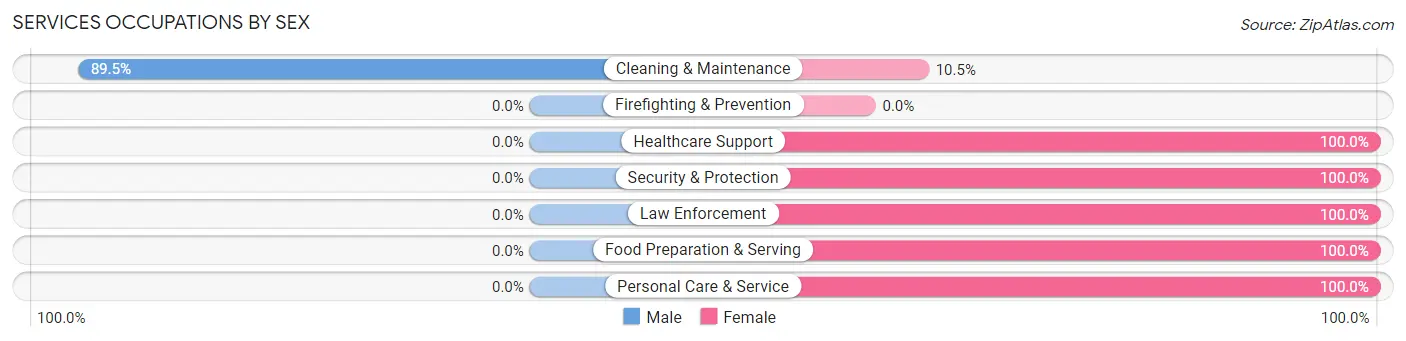
| Occupation | Male | Female |
| Healthcare Support | 0 (0.0%) | 14 (100.0%) |
| Security & Protection | 0 (0.0%) | 7 (100.0%) |
| Firefighting & Prevention | 0 (0.0%) | 0 (0.0%) |
| Law Enforcement | 0 (0.0%) | 7 (100.0%) |
| Food Preparation & Serving | 0 (0.0%) | 11 (100.0%) |
| Cleaning & Maintenance | 34 (89.5%) | 4 (10.5%) |
| Personal Care & Service | 0 (0.0%) | 16 (100.0%) |
| Total (Category) | 34 (39.5%) | 52 (60.5%) |
| Total (Overall) | 188 (34.4%) | 359 (65.6%) |
Sales and Office Occupations
The most common Sales and Office occupations in Lexington are Office & Administration (30 | 5.5%), and Sales & Related (25 | 4.6%).
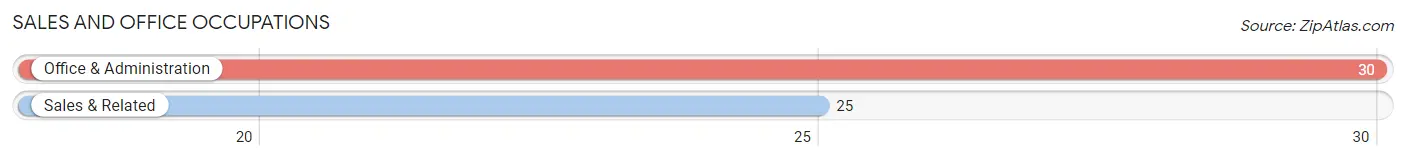
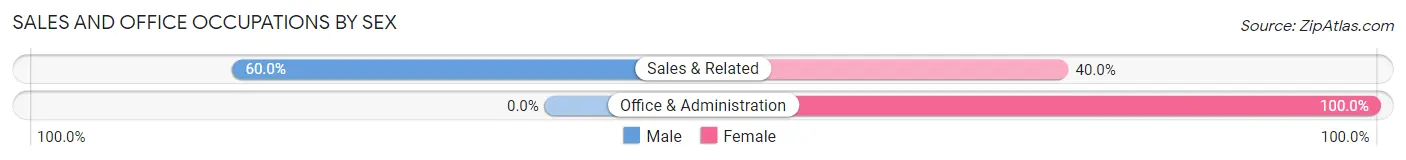
Sales and Office Occupations by Sex
| Occupation | Male | Female |
| Sales & Related | 15 (60.0%) | 10 (40.0%) |
| Office & Administration | 0 (0.0%) | 30 (100.0%) |
| Total (Category) | 15 (27.3%) | 40 (72.7%) |
| Total (Overall) | 188 (34.4%) | 359 (65.6%) |
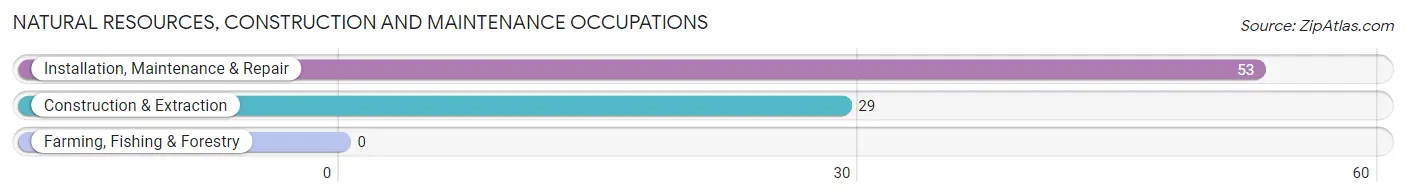
Natural Resources, Construction and Maintenance Occupations
The most common Natural Resources, Construction and Maintenance occupations in Lexington are Installation, Maintenance & Repair (53 | 9.7%), and Construction & Extraction (29 | 5.3%).
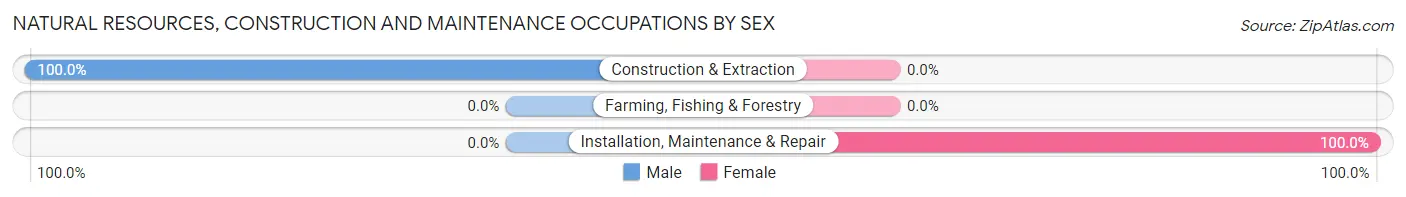
Natural Resources, Construction and Maintenance Occupations by Sex
| Occupation | Male | Female |
| Farming, Fishing & Forestry | 0 (0.0%) | 0 (0.0%) |
| Construction & Extraction | 29 (100.0%) | 0 (0.0%) |
| Installation, Maintenance & Repair | 0 (0.0%) | 53 (100.0%) |
| Total (Category) | 29 (35.4%) | 53 (64.6%) |
| Total (Overall) | 188 (34.4%) | 359 (65.6%) |
Production, Transportation and Moving Occupations
The most common Production, Transportation and Moving occupations in Lexington are Material Moving (53 | 9.7%), Transportation (35 | 6.4%), and Production (22 | 4.0%).
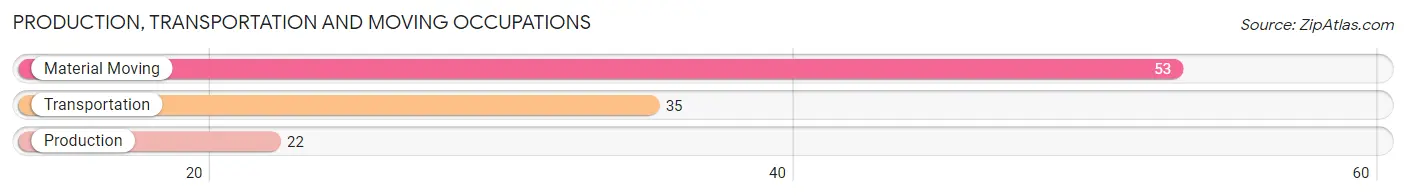
Production, Transportation and Moving Occupations by Sex
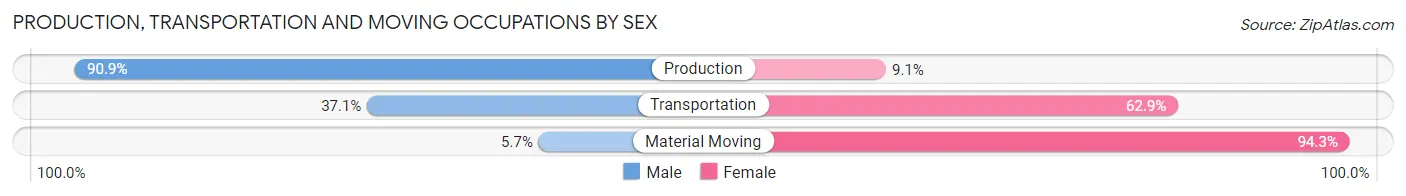
| Occupation | Male | Female |
| Production | 20 (90.9%) | 2 (9.1%) |
| Transportation | 13 (37.1%) | 22 (62.9%) |
| Material Moving | 3 (5.7%) | 50 (94.3%) |
| Total (Category) | 36 (32.7%) | 74 (67.3%) |
| Total (Overall) | 188 (34.4%) | 359 (65.6%) |
Employment Industries by Sex in Lexington
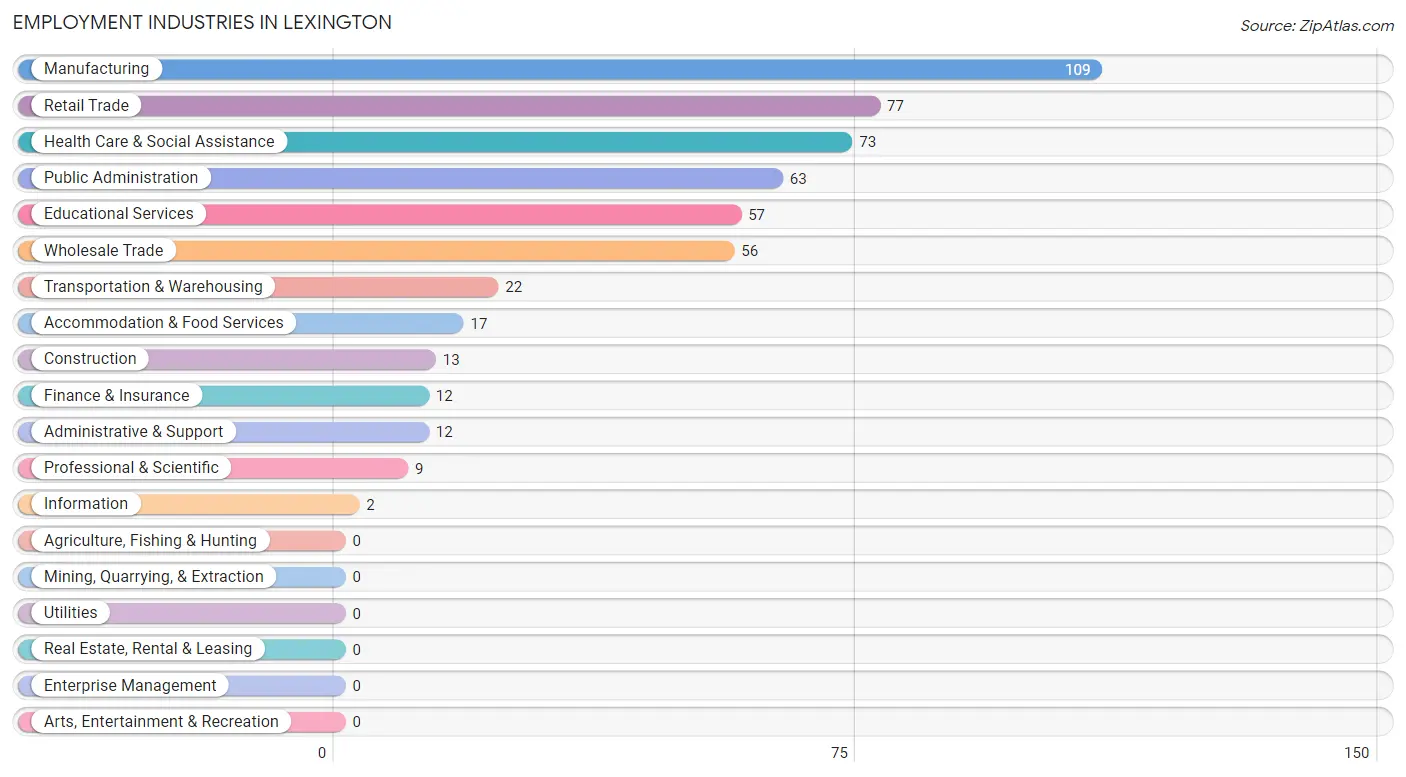
Employment Industries in Lexington
The major employment industries in Lexington include Manufacturing (109 | 19.9%), Retail Trade (77 | 14.1%), Health Care & Social Assistance (73 | 13.4%), Public Administration (63 | 11.5%), and Educational Services (57 | 10.4%).
Employment Industries by Sex in Lexington
The Lexington industries that see more men than women are Construction (100.0%), Finance & Insurance (100.0%), and Manufacturing (88.1%), whereas the industries that tend to have a higher number of women are Transportation & Warehousing (100.0%), Information (100.0%), and Accommodation & Food Services (100.0%).
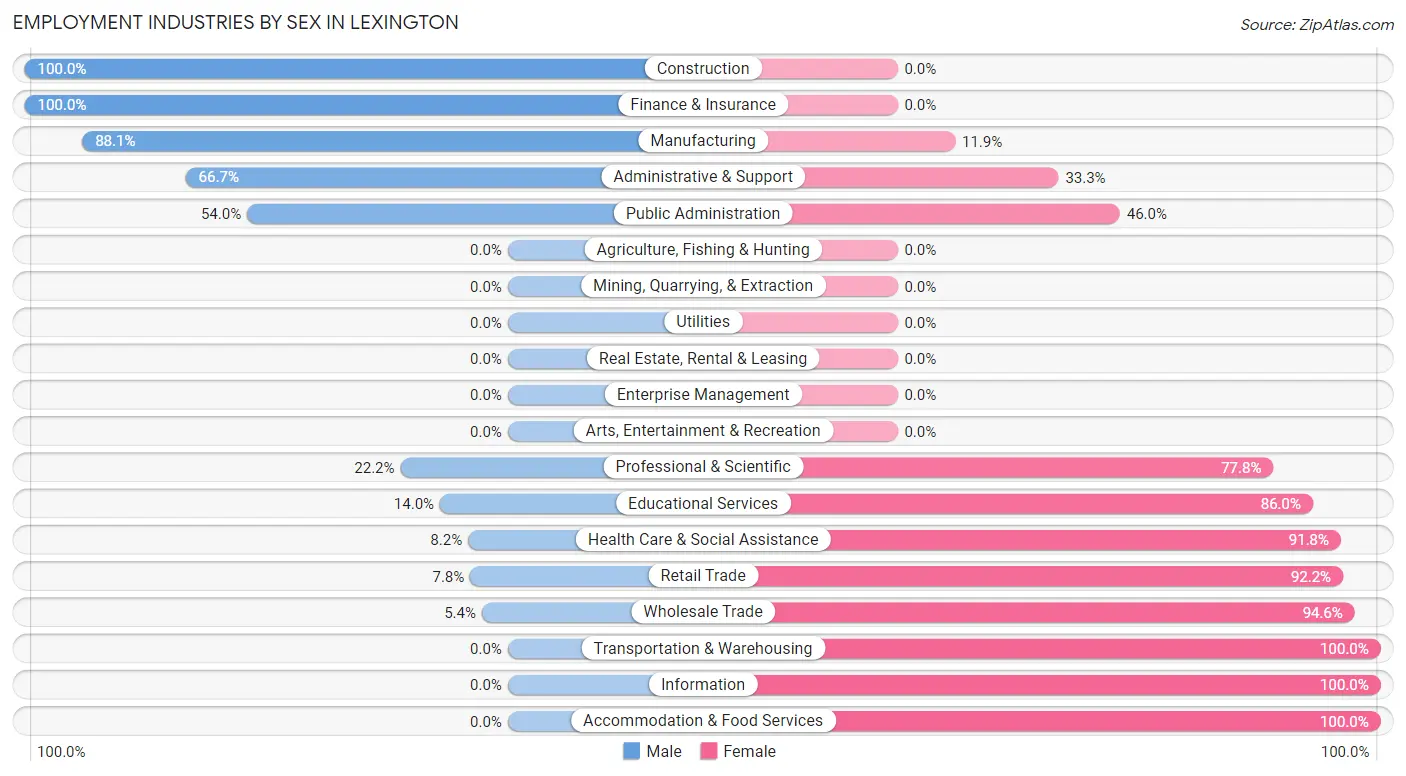
| Industry | Male | Female |
| Agriculture, Fishing & Hunting | 0 (0.0%) | 0 (0.0%) |
| Mining, Quarrying, & Extraction | 0 (0.0%) | 0 (0.0%) |
| Construction | 13 (100.0%) | 0 (0.0%) |
| Manufacturing | 96 (88.1%) | 13 (11.9%) |
| Wholesale Trade | 3 (5.4%) | 53 (94.6%) |
| Retail Trade | 6 (7.8%) | 71 (92.2%) |
| Transportation & Warehousing | 0 (0.0%) | 22 (100.0%) |
| Utilities | 0 (0.0%) | 0 (0.0%) |
| Information | 0 (0.0%) | 2 (100.0%) |
| Finance & Insurance | 12 (100.0%) | 0 (0.0%) |
| Real Estate, Rental & Leasing | 0 (0.0%) | 0 (0.0%) |
| Professional & Scientific | 2 (22.2%) | 7 (77.8%) |
| Enterprise Management | 0 (0.0%) | 0 (0.0%) |
| Administrative & Support | 8 (66.7%) | 4 (33.3%) |
| Educational Services | 8 (14.0%) | 49 (86.0%) |
| Health Care & Social Assistance | 6 (8.2%) | 67 (91.8%) |
| Arts, Entertainment & Recreation | 0 (0.0%) | 0 (0.0%) |
| Accommodation & Food Services | 0 (0.0%) | 17 (100.0%) |
| Public Administration | 34 (54.0%) | 29 (46.0%) |
| Total | 188 (34.4%) | 359 (65.6%) |
Education in Lexington
School Enrollment in Lexington
The most common levels of schooling among the 221 students in Lexington are college / undergraduate (66 | 29.9%), high school (62 | 28.1%), and middle school (43 | 19.5%).

| School Level | # Students | % Students |
| Nursery / Preschool | 17 | 7.7% |
| Kindergarten | 0 | 0.0% |
| Elementary School | 18 | 8.1% |
| Middle School | 43 | 19.5% |
| High School | 62 | 28.1% |
| College / Undergraduate | 66 | 29.9% |
| Graduate / Professional | 15 | 6.8% |
| Total | 221 | 100.0% |
School Enrollment by Age by Funding Source in Lexington
Out of a total of 221 students who are enrolled in schools in Lexington, 39 (17.6%) attend a private institution, while the remaining 182 (82.4%) are enrolled in public schools. The age group of 10 to 14 year olds has the highest likelihood of being enrolled in private schools, with 23 (53.5% in the age bracket) enrolled. Conversely, the age group of 3 to 4 year olds has the lowest likelihood of being enrolled in a private school, with 17 (100.0% in the age bracket) attending a public institution.
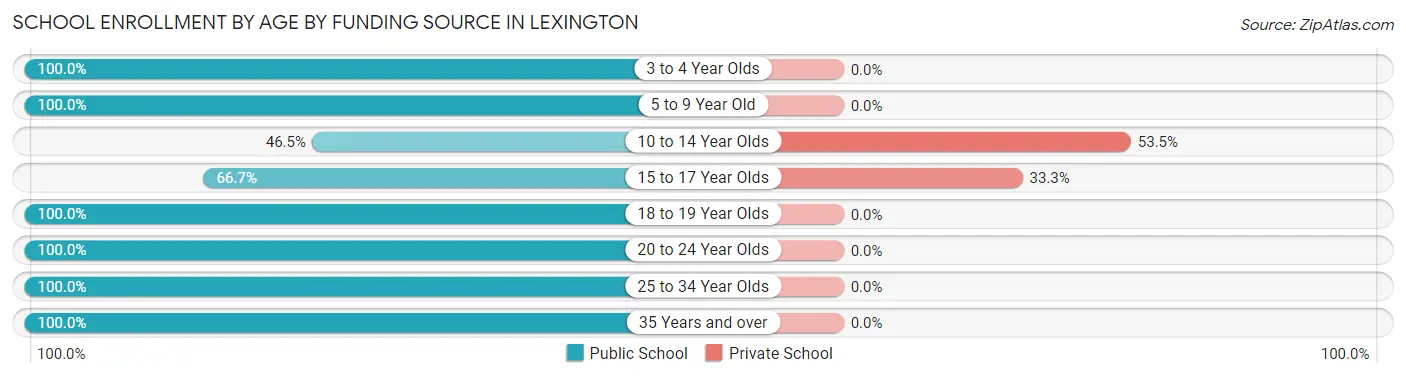
| Age Bracket | Public School | Private School |
| 3 to 4 Year Olds | 17 (100.0%) | 0 (0.0%) |
| 5 to 9 Year Old | 18 (100.0%) | 0 (0.0%) |
| 10 to 14 Year Olds | 20 (46.5%) | 23 (53.5%) |
| 15 to 17 Year Olds | 32 (66.7%) | 16 (33.3%) |
| 18 to 19 Year Olds | 14 (100.0%) | 0 (0.0%) |
| 20 to 24 Year Olds | 52 (100.0%) | 0 (0.0%) |
| 25 to 34 Year Olds | 15 (100.0%) | 0 (0.0%) |
| 35 Years and over | 14 (100.0%) | 0 (0.0%) |
| Total | 182 (82.4%) | 39 (17.6%) |
Educational Attainment by Field of Study in Lexington
Bio, nature & agricultural (60 | 21.1%), business (59 | 20.8%), arts & humanities (54 | 19.0%), education (42 | 14.8%), and physical & health sciences (18 | 6.3%) are the most common fields of study among 284 individuals in Lexington who have obtained a bachelor's degree or higher.
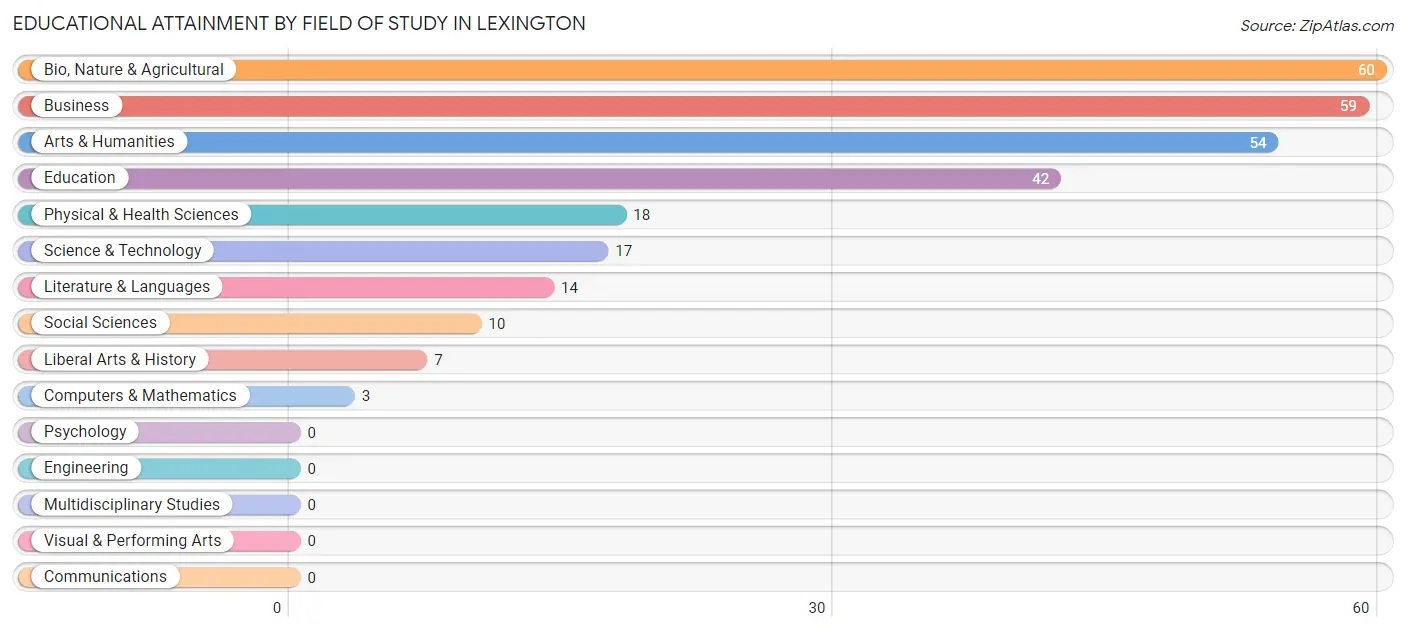
| Field of Study | # Graduates | % Graduates |
| Computers & Mathematics | 3 | 1.1% |
| Bio, Nature & Agricultural | 60 | 21.1% |
| Physical & Health Sciences | 18 | 6.3% |
| Psychology | 0 | 0.0% |
| Social Sciences | 10 | 3.5% |
| Engineering | 0 | 0.0% |
| Multidisciplinary Studies | 0 | 0.0% |
| Science & Technology | 17 | 6.0% |
| Business | 59 | 20.8% |
| Education | 42 | 14.8% |
| Literature & Languages | 14 | 4.9% |
| Liberal Arts & History | 7 | 2.5% |
| Visual & Performing Arts | 0 | 0.0% |
| Communications | 0 | 0.0% |
| Arts & Humanities | 54 | 19.0% |
| Total | 284 | 100.0% |
Transportation & Commute in Lexington
Vehicle Availability by Sex in Lexington
The most prevalent vehicle ownership categories in Lexington are males with 3 vehicles (81, accounting for 43.1%) and females with 3 vehicles (110, making up 23.2%).
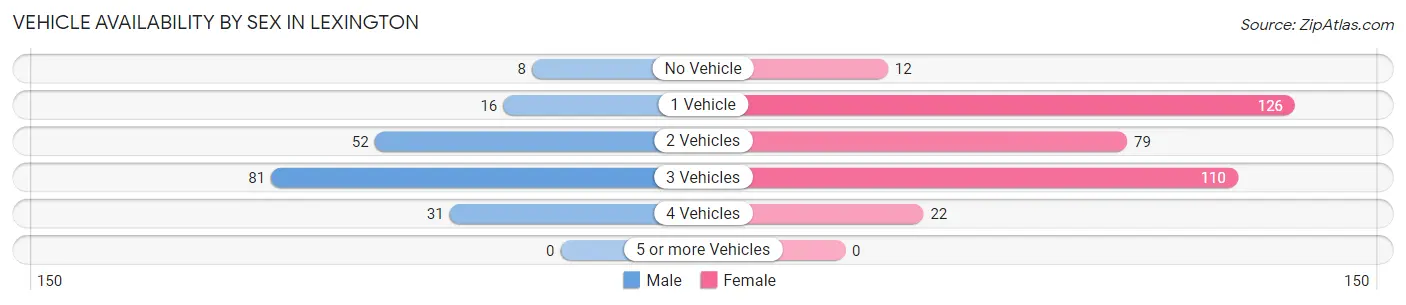
| Vehicles Available | Male | Female |
| No Vehicle | 8 (4.3%) | 12 (3.4%) |
| 1 Vehicle | 16 (8.5%) | 126 (36.1%) |
| 2 Vehicles | 52 (27.7%) | 79 (22.6%) |
| 3 Vehicles | 81 (43.1%) | 110 (31.5%) |
| 4 Vehicles | 31 (16.5%) | 22 (6.3%) |
| 5 or more Vehicles | 0 (0.0%) | 0 (0.0%) |
| Total | 188 (100.0%) | 349 (100.0%) |
Commute Time in Lexington
The most frequently occuring commute durations in Lexington are 45 to 59 minutes (135 commuters, 25.7%), 10 to 14 minutes (75 commuters, 14.3%), and 5 to 9 minutes (69 commuters, 13.1%).
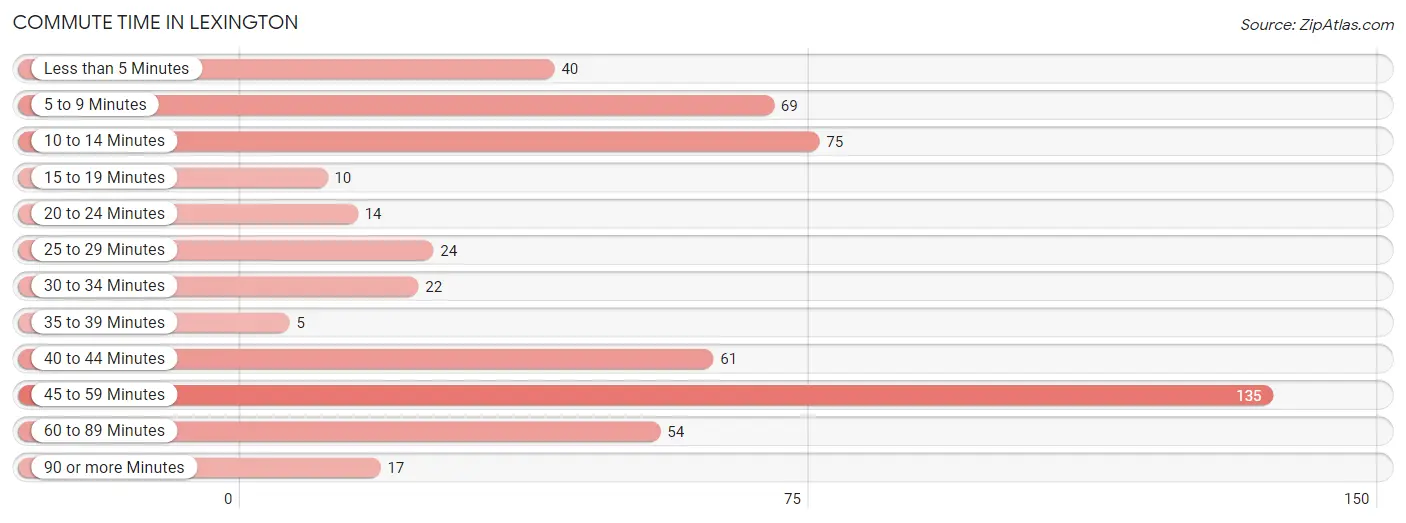
| Commute Time | # Commuters | % Commuters |
| Less than 5 Minutes | 40 | 7.6% |
| 5 to 9 Minutes | 69 | 13.1% |
| 10 to 14 Minutes | 75 | 14.3% |
| 15 to 19 Minutes | 10 | 1.9% |
| 20 to 24 Minutes | 14 | 2.7% |
| 25 to 29 Minutes | 24 | 4.6% |
| 30 to 34 Minutes | 22 | 4.2% |
| 35 to 39 Minutes | 5 | 0.9% |
| 40 to 44 Minutes | 61 | 11.6% |
| 45 to 59 Minutes | 135 | 25.7% |
| 60 to 89 Minutes | 54 | 10.3% |
| 90 or more Minutes | 17 | 3.2% |
Commute Time by Sex in Lexington
The most common commute times in Lexington are 45 to 59 minutes (76 commuters, 41.1%) for males and 45 to 59 minutes (59 commuters, 17.3%) for females.
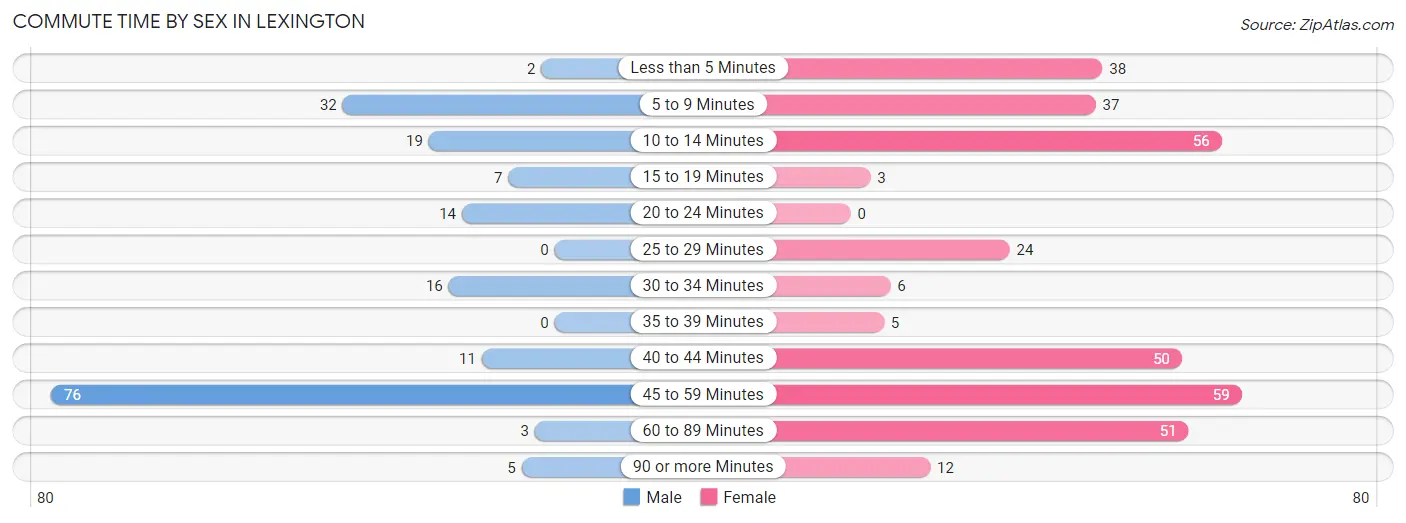
| Commute Time | Male | Female |
| Less than 5 Minutes | 2 (1.1%) | 38 (11.1%) |
| 5 to 9 Minutes | 32 (17.3%) | 37 (10.8%) |
| 10 to 14 Minutes | 19 (10.3%) | 56 (16.4%) |
| 15 to 19 Minutes | 7 (3.8%) | 3 (0.9%) |
| 20 to 24 Minutes | 14 (7.6%) | 0 (0.0%) |
| 25 to 29 Minutes | 0 (0.0%) | 24 (7.0%) |
| 30 to 34 Minutes | 16 (8.6%) | 6 (1.8%) |
| 35 to 39 Minutes | 0 (0.0%) | 5 (1.5%) |
| 40 to 44 Minutes | 11 (5.9%) | 50 (14.7%) |
| 45 to 59 Minutes | 76 (41.1%) | 59 (17.3%) |
| 60 to 89 Minutes | 3 (1.6%) | 51 (15.0%) |
| 90 or more Minutes | 5 (2.7%) | 12 (3.5%) |
Time of Departure to Work by Sex in Lexington
The most frequent times of departure to work in Lexington are 6:30 AM to 6:59 AM (54, 29.2%) for males and 7:00 AM to 7:29 AM (74, 21.7%) for females.
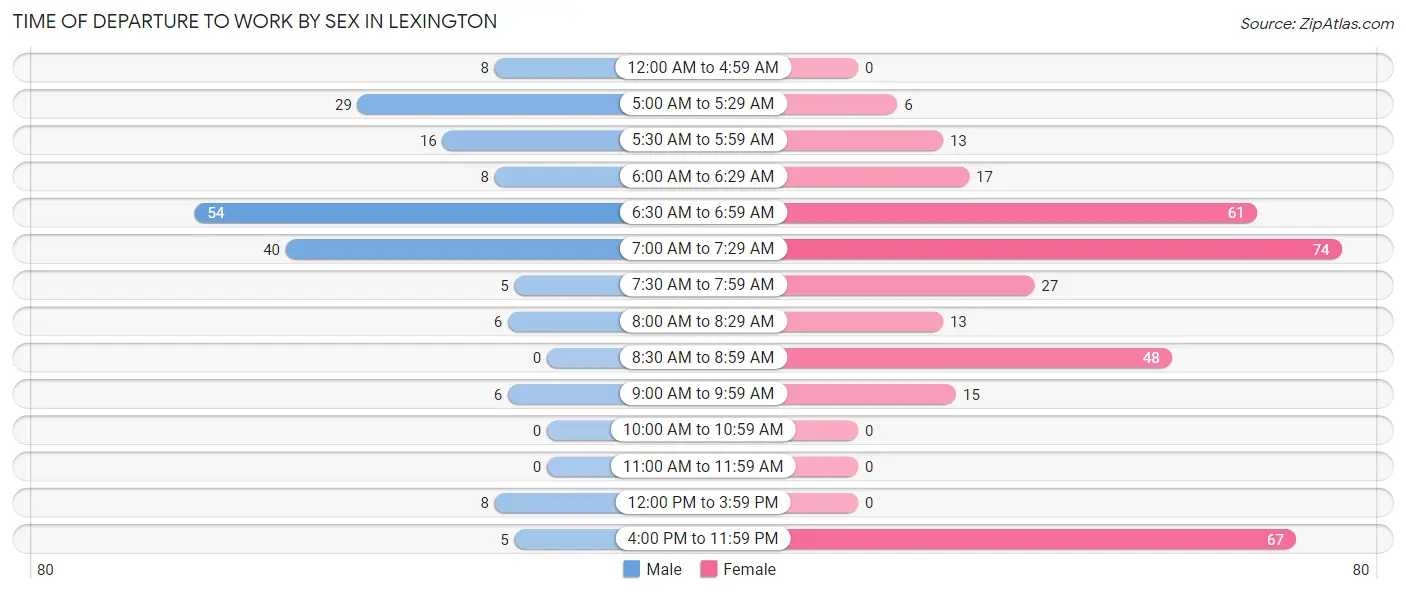
| Time of Departure | Male | Female |
| 12:00 AM to 4:59 AM | 8 (4.3%) | 0 (0.0%) |
| 5:00 AM to 5:29 AM | 29 (15.7%) | 6 (1.8%) |
| 5:30 AM to 5:59 AM | 16 (8.6%) | 13 (3.8%) |
| 6:00 AM to 6:29 AM | 8 (4.3%) | 17 (5.0%) |
| 6:30 AM to 6:59 AM | 54 (29.2%) | 61 (17.9%) |
| 7:00 AM to 7:29 AM | 40 (21.6%) | 74 (21.7%) |
| 7:30 AM to 7:59 AM | 5 (2.7%) | 27 (7.9%) |
| 8:00 AM to 8:29 AM | 6 (3.2%) | 13 (3.8%) |
| 8:30 AM to 8:59 AM | 0 (0.0%) | 48 (14.1%) |
| 9:00 AM to 9:59 AM | 6 (3.2%) | 15 (4.4%) |
| 10:00 AM to 10:59 AM | 0 (0.0%) | 0 (0.0%) |
| 11:00 AM to 11:59 AM | 0 (0.0%) | 0 (0.0%) |
| 12:00 PM to 3:59 PM | 8 (4.3%) | 0 (0.0%) |
| 4:00 PM to 11:59 PM | 5 (2.7%) | 67 (19.7%) |
| Total | 185 (100.0%) | 341 (100.0%) |
Housing Occupancy in Lexington
Occupancy by Ownership in Lexington
Of the total 513 dwellings in Lexington, owner-occupied units account for 357 (69.6%), while renter-occupied units make up 156 (30.4%).
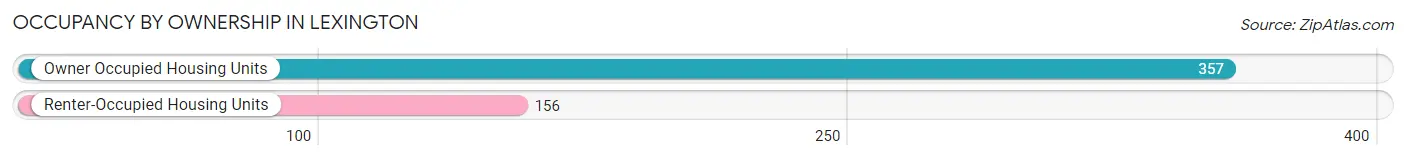
| Occupancy | # Housing Units | % Housing Units |
| Owner Occupied Housing Units | 357 | 69.6% |
| Renter-Occupied Housing Units | 156 | 30.4% |
| Total Occupied Housing Units | 513 | 100.0% |
Occupancy by Household Size in Lexington
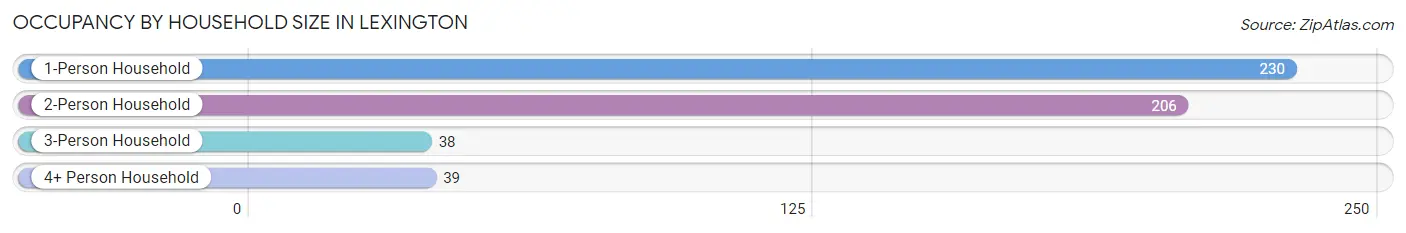
| Household Size | # Housing Units | % Housing Units |
| 1-Person Household | 230 | 44.8% |
| 2-Person Household | 206 | 40.2% |
| 3-Person Household | 38 | 7.4% |
| 4+ Person Household | 39 | 7.6% |
| Total Housing Units | 513 | 100.0% |
Occupancy by Ownership by Household Size in Lexington
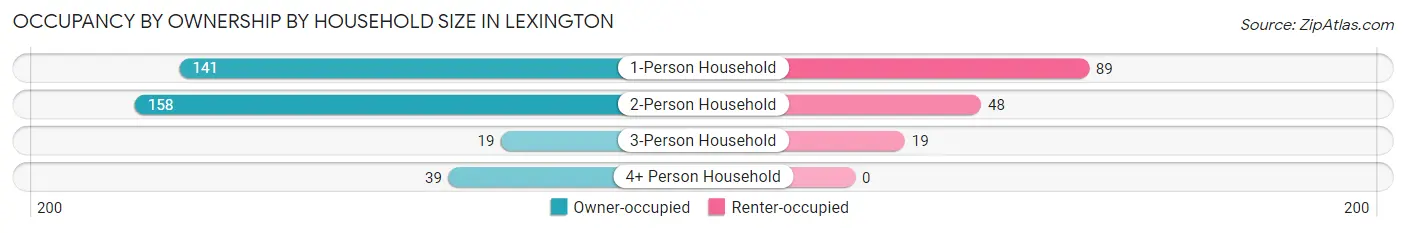
| Household Size | Owner-occupied | Renter-occupied |
| 1-Person Household | 141 (61.3%) | 89 (38.7%) |
| 2-Person Household | 158 (76.7%) | 48 (23.3%) |
| 3-Person Household | 19 (50.0%) | 19 (50.0%) |
| 4+ Person Household | 39 (100.0%) | 0 (0.0%) |
| Total Housing Units | 357 (69.6%) | 156 (30.4%) |
Occupancy by Educational Attainment in Lexington
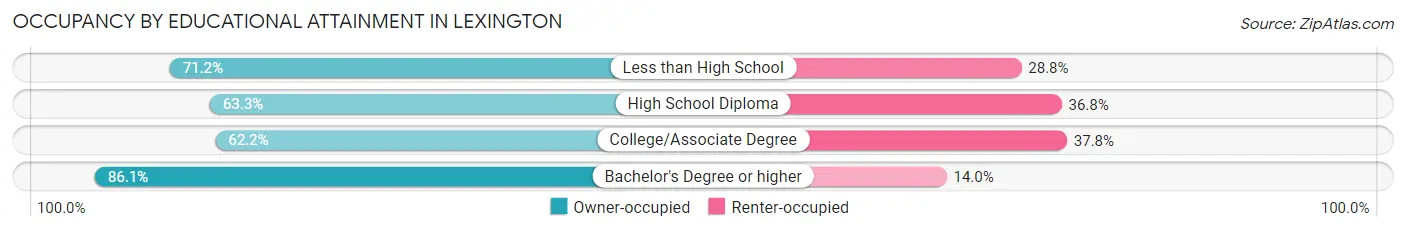
| Household Size | Owner-occupied | Renter-occupied |
| Less than High School | 47 (71.2%) | 19 (28.8%) |
| High School Diploma | 74 (63.2%) | 43 (36.7%) |
| College/Associate Degree | 125 (62.2%) | 76 (37.8%) |
| Bachelor's Degree or higher | 111 (86.1%) | 18 (14.0%) |
Occupancy by Age of Householder in Lexington
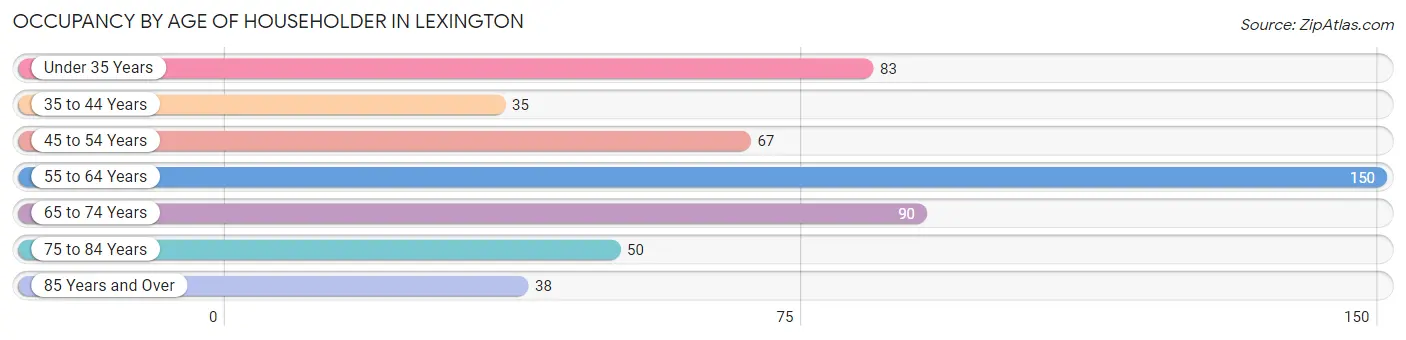
| Age Bracket | # Households | % Households |
| Under 35 Years | 83 | 16.2% |
| 35 to 44 Years | 35 | 6.8% |
| 45 to 54 Years | 67 | 13.1% |
| 55 to 64 Years | 150 | 29.2% |
| 65 to 74 Years | 90 | 17.5% |
| 75 to 84 Years | 50 | 9.8% |
| 85 Years and Over | 38 | 7.4% |
| Total | 513 | 100.0% |
Housing Finances in Lexington
Median Income by Occupancy in Lexington
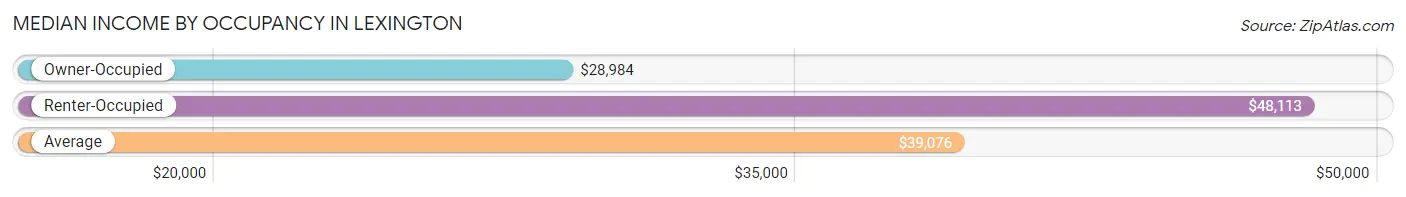
| Occupancy Type | # Households | Median Income |
| Owner-Occupied | 357 (69.6%) | $28,984 |
| Renter-Occupied | 156 (30.4%) | $48,113 |
| Average | 513 (100.0%) | $39,076 |
Occupancy by Householder Income Bracket in Lexington
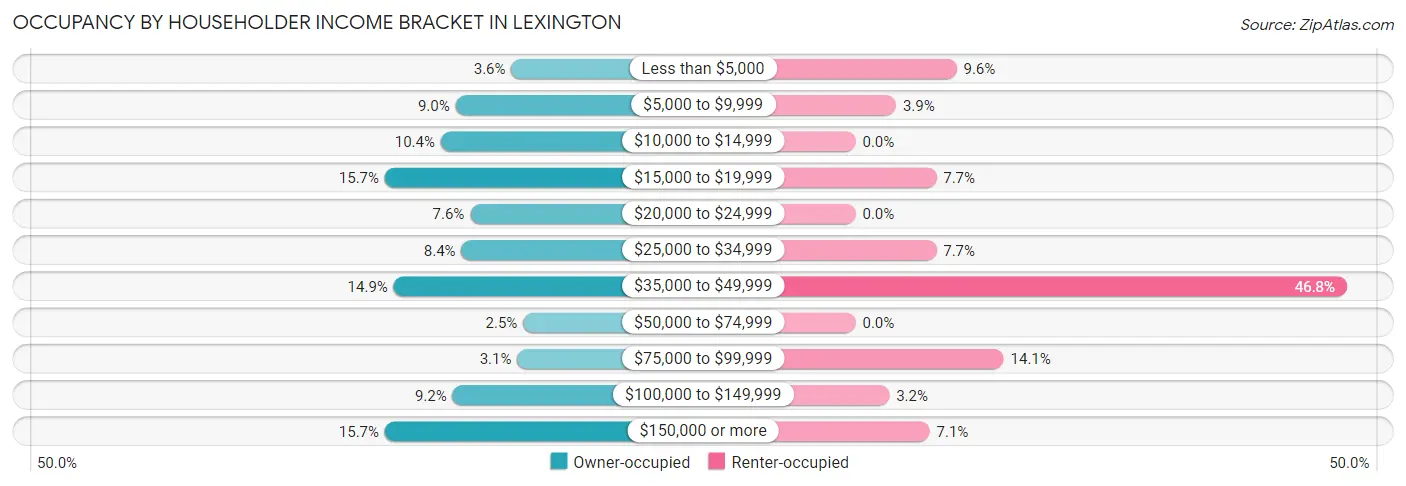
| Income Bracket | Owner-occupied | Renter-occupied |
| Less than $5,000 | 13 (3.6%) | 15 (9.6%) |
| $5,000 to $9,999 | 32 (9.0%) | 6 (3.8%) |
| $10,000 to $14,999 | 37 (10.4%) | 0 (0.0%) |
| $15,000 to $19,999 | 56 (15.7%) | 12 (7.7%) |
| $20,000 to $24,999 | 27 (7.6%) | 0 (0.0%) |
| $25,000 to $34,999 | 30 (8.4%) | 12 (7.7%) |
| $35,000 to $49,999 | 53 (14.8%) | 73 (46.8%) |
| $50,000 to $74,999 | 9 (2.5%) | 0 (0.0%) |
| $75,000 to $99,999 | 11 (3.1%) | 22 (14.1%) |
| $100,000 to $149,999 | 33 (9.2%) | 5 (3.2%) |
| $150,000 or more | 56 (15.7%) | 11 (7.0%) |
| Total | 357 (100.0%) | 156 (100.0%) |
Monthly Housing Cost Tiers in Lexington
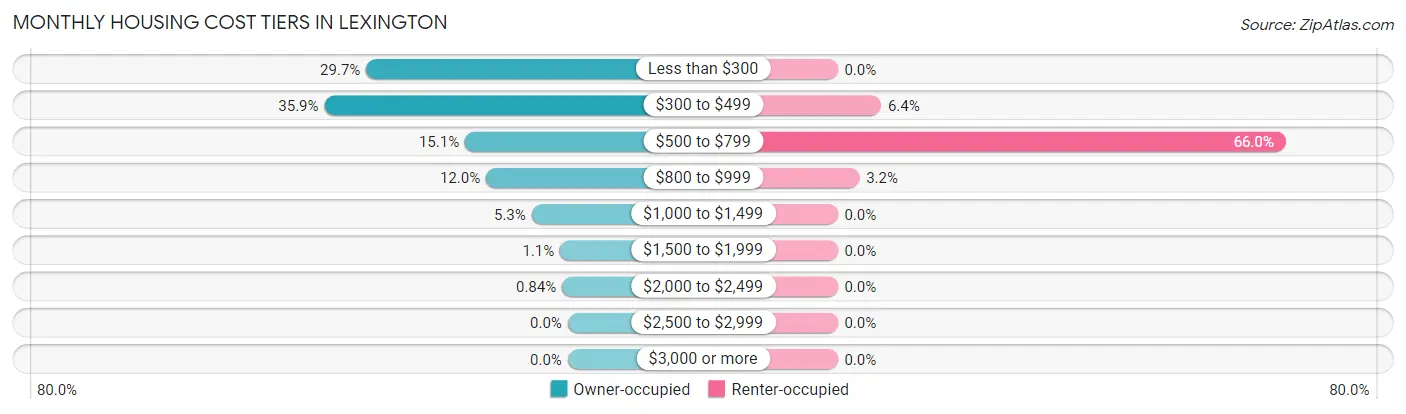
| Monthly Cost | Owner-occupied | Renter-occupied |
| Less than $300 | 106 (29.7%) | 0 (0.0%) |
| $300 to $499 | 128 (35.8%) | 10 (6.4%) |
| $500 to $799 | 54 (15.1%) | 103 (66.0%) |
| $800 to $999 | 43 (12.0%) | 5 (3.2%) |
| $1,000 to $1,499 | 19 (5.3%) | 0 (0.0%) |
| $1,500 to $1,999 | 4 (1.1%) | 0 (0.0%) |
| $2,000 to $2,499 | 3 (0.8%) | 0 (0.0%) |
| $2,500 to $2,999 | 0 (0.0%) | 0 (0.0%) |
| $3,000 or more | 0 (0.0%) | 0 (0.0%) |
| Total | 357 (100.0%) | 156 (100.0%) |
Physical Housing Characteristics in Lexington
Housing Structures in Lexington
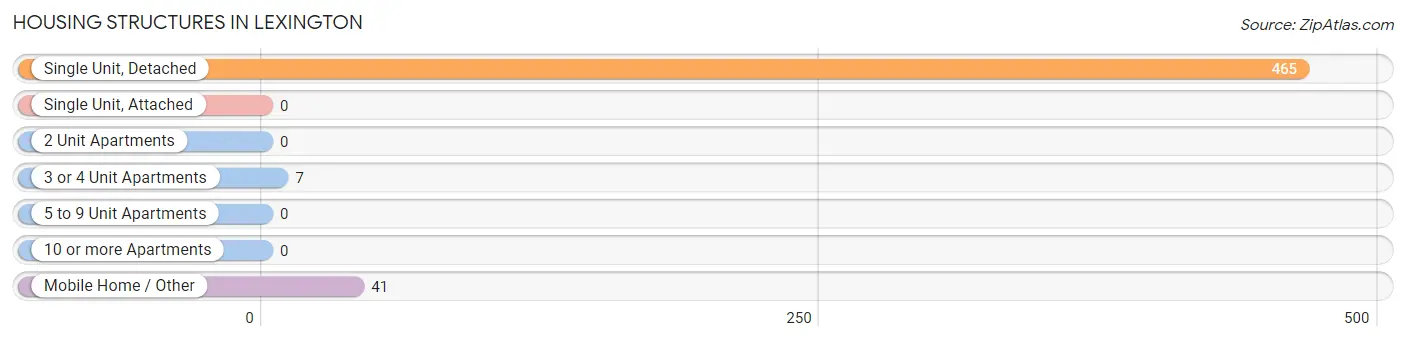
| Structure Type | # Housing Units | % Housing Units |
| Single Unit, Detached | 465 | 90.6% |
| Single Unit, Attached | 0 | 0.0% |
| 2 Unit Apartments | 0 | 0.0% |
| 3 or 4 Unit Apartments | 7 | 1.4% |
| 5 to 9 Unit Apartments | 0 | 0.0% |
| 10 or more Apartments | 0 | 0.0% |
| Mobile Home / Other | 41 | 8.0% |
| Total | 513 | 100.0% |
Housing Structures by Occupancy in Lexington
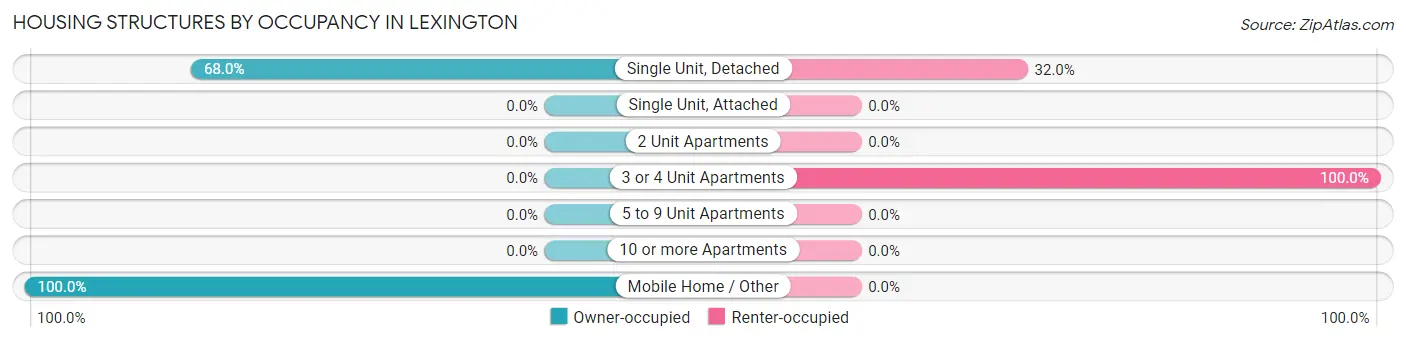
| Structure Type | Owner-occupied | Renter-occupied |
| Single Unit, Detached | 316 (68.0%) | 149 (32.0%) |
| Single Unit, Attached | 0 (0.0%) | 0 (0.0%) |
| 2 Unit Apartments | 0 (0.0%) | 0 (0.0%) |
| 3 or 4 Unit Apartments | 0 (0.0%) | 7 (100.0%) |
| 5 to 9 Unit Apartments | 0 (0.0%) | 0 (0.0%) |
| 10 or more Apartments | 0 (0.0%) | 0 (0.0%) |
| Mobile Home / Other | 41 (100.0%) | 0 (0.0%) |
| Total | 357 (69.6%) | 156 (30.4%) |
Housing Structures by Number of Rooms in Lexington
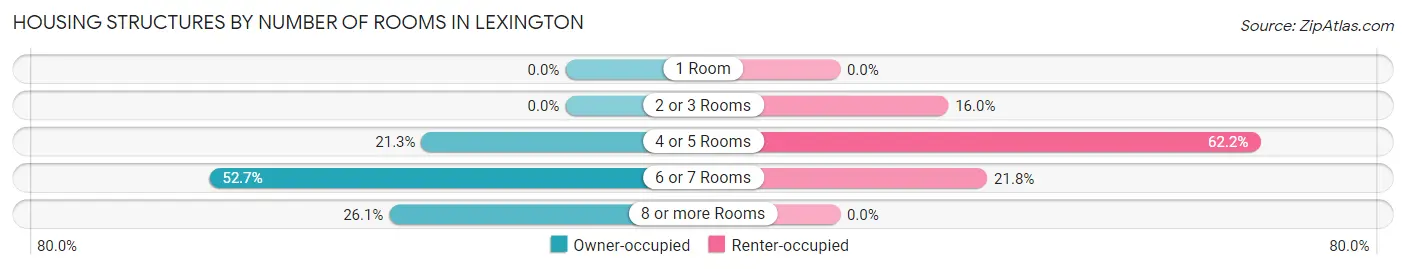
| Number of Rooms | Owner-occupied | Renter-occupied |
| 1 Room | 0 (0.0%) | 0 (0.0%) |
| 2 or 3 Rooms | 0 (0.0%) | 25 (16.0%) |
| 4 or 5 Rooms | 76 (21.3%) | 97 (62.2%) |
| 6 or 7 Rooms | 188 (52.7%) | 34 (21.8%) |
| 8 or more Rooms | 93 (26.1%) | 0 (0.0%) |
| Total | 357 (100.0%) | 156 (100.0%) |
Housing Structure by Heating Type in Lexington
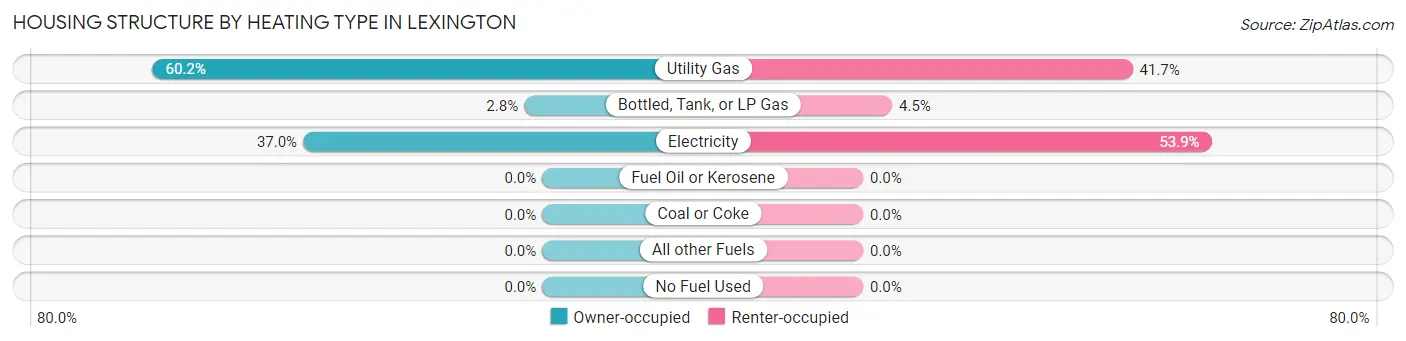
| Heating Type | Owner-occupied | Renter-occupied |
| Utility Gas | 215 (60.2%) | 65 (41.7%) |
| Bottled, Tank, or LP Gas | 10 (2.8%) | 7 (4.5%) |
| Electricity | 132 (37.0%) | 84 (53.8%) |
| Fuel Oil or Kerosene | 0 (0.0%) | 0 (0.0%) |
| Coal or Coke | 0 (0.0%) | 0 (0.0%) |
| All other Fuels | 0 (0.0%) | 0 (0.0%) |
| No Fuel Used | 0 (0.0%) | 0 (0.0%) |
| Total | 357 (100.0%) | 156 (100.0%) |
Household Vehicle Usage in Lexington
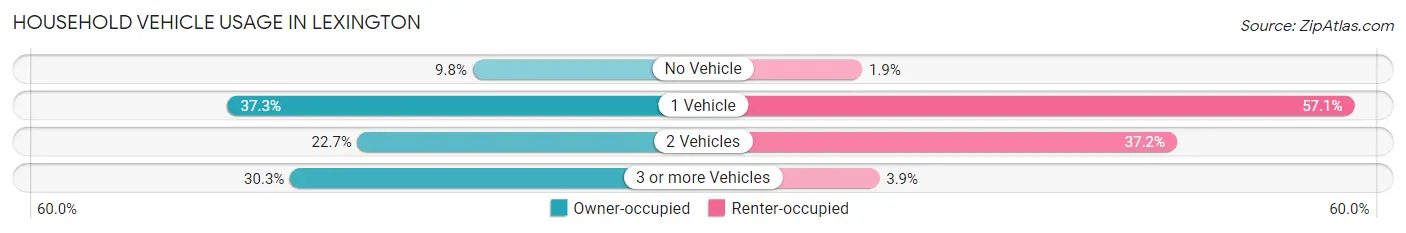
| Vehicles per Household | Owner-occupied | Renter-occupied |
| No Vehicle | 35 (9.8%) | 3 (1.9%) |
| 1 Vehicle | 133 (37.2%) | 89 (57.1%) |
| 2 Vehicles | 81 (22.7%) | 58 (37.2%) |
| 3 or more Vehicles | 108 (30.2%) | 6 (3.8%) |
| Total | 357 (100.0%) | 156 (100.0%) |
Real Estate & Mortgages in Lexington
Real Estate and Mortgage Overview in Lexington
| Characteristic | Without Mortgage | With Mortgage |
| Housing Units | 273 | 84 |
| Median Property Value | $86,000 | $79,300 |
| Median Household Income | $23,021 | $16 |
| Monthly Housing Costs | $349 | $0 |
| Real Estate Taxes | $790 | $11 |
Property Value by Mortgage Status in Lexington
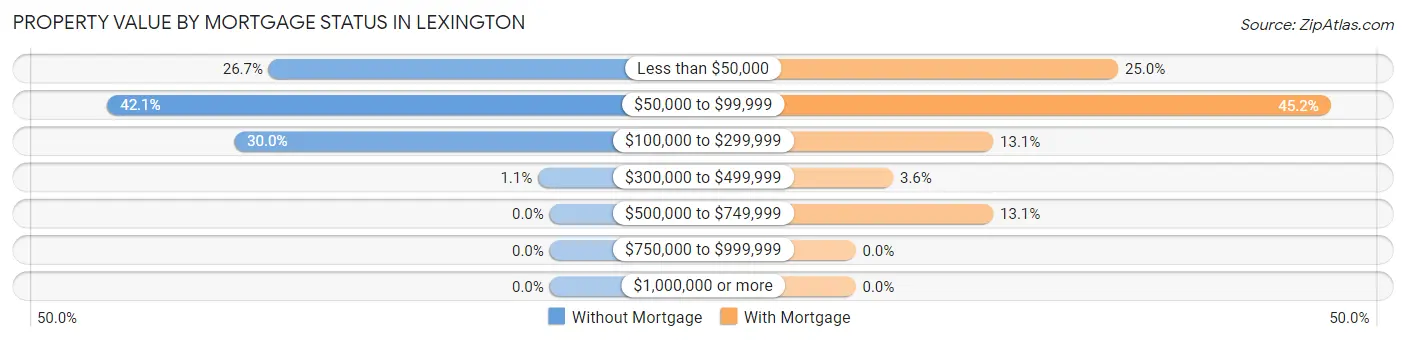
| Property Value | Without Mortgage | With Mortgage |
| Less than $50,000 | 73 (26.7%) | 21 (25.0%) |
| $50,000 to $99,999 | 115 (42.1%) | 38 (45.2%) |
| $100,000 to $299,999 | 82 (30.0%) | 11 (13.1%) |
| $300,000 to $499,999 | 3 (1.1%) | 3 (3.6%) |
| $500,000 to $749,999 | 0 (0.0%) | 11 (13.1%) |
| $750,000 to $999,999 | 0 (0.0%) | 0 (0.0%) |
| $1,000,000 or more | 0 (0.0%) | 0 (0.0%) |
| Total | 273 (100.0%) | 84 (100.0%) |
Household Income by Mortgage Status in Lexington
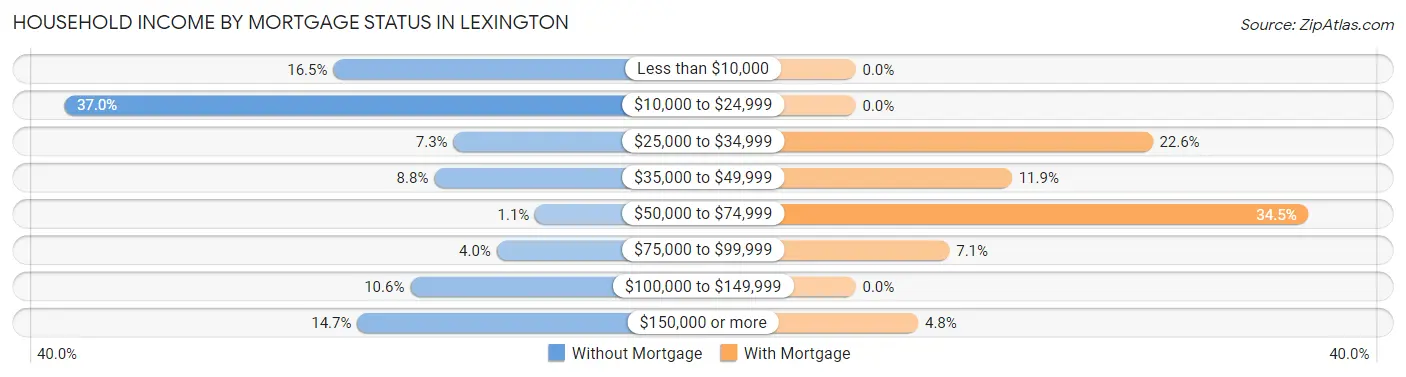
| Household Income | Without Mortgage | With Mortgage |
| Less than $10,000 | 45 (16.5%) | 0 (0.0%) |
| $10,000 to $24,999 | 101 (37.0%) | 0 (0.0%) |
| $25,000 to $34,999 | 20 (7.3%) | 19 (22.6%) |
| $35,000 to $49,999 | 24 (8.8%) | 10 (11.9%) |
| $50,000 to $74,999 | 3 (1.1%) | 29 (34.5%) |
| $75,000 to $99,999 | 11 (4.0%) | 6 (7.1%) |
| $100,000 to $149,999 | 29 (10.6%) | 0 (0.0%) |
| $150,000 or more | 40 (14.6%) | 4 (4.8%) |
| Total | 273 (100.0%) | 84 (100.0%) |
Property Value to Household Income Ratio in Lexington
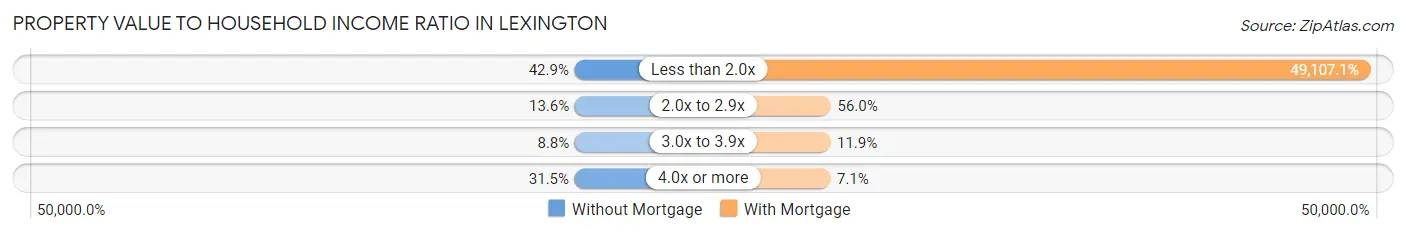
| Value-to-Income Ratio | Without Mortgage | With Mortgage |
| Less than 2.0x | 117 (42.9%) | 41,250 (49,107.1%) |
| 2.0x to 2.9x | 37 (13.6%) | 47 (55.9%) |
| 3.0x to 3.9x | 24 (8.8%) | 10 (11.9%) |
| 4.0x or more | 86 (31.5%) | 6 (7.1%) |
| Total | 273 (100.0%) | 84 (100.0%) |
Real Estate Taxes by Mortgage Status in Lexington
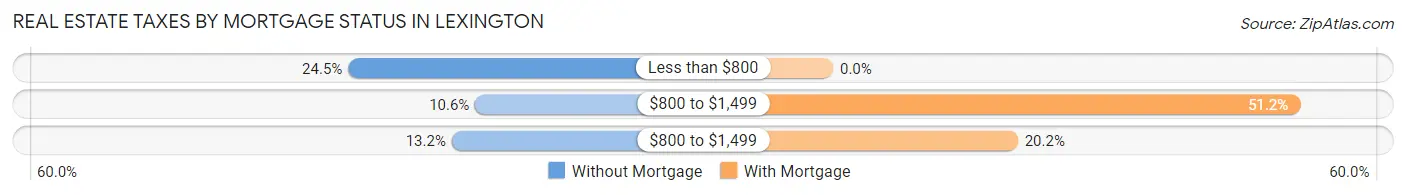
| Property Taxes | Without Mortgage | With Mortgage |
| Less than $800 | 67 (24.5%) | 0 (0.0%) |
| $800 to $1,499 | 29 (10.6%) | 43 (51.2%) |
| $800 to $1,499 | 36 (13.2%) | 17 (20.2%) |
| Total | 273 (100.0%) | 84 (100.0%) |
Health & Disability in Lexington
Health Insurance Coverage by Age in Lexington
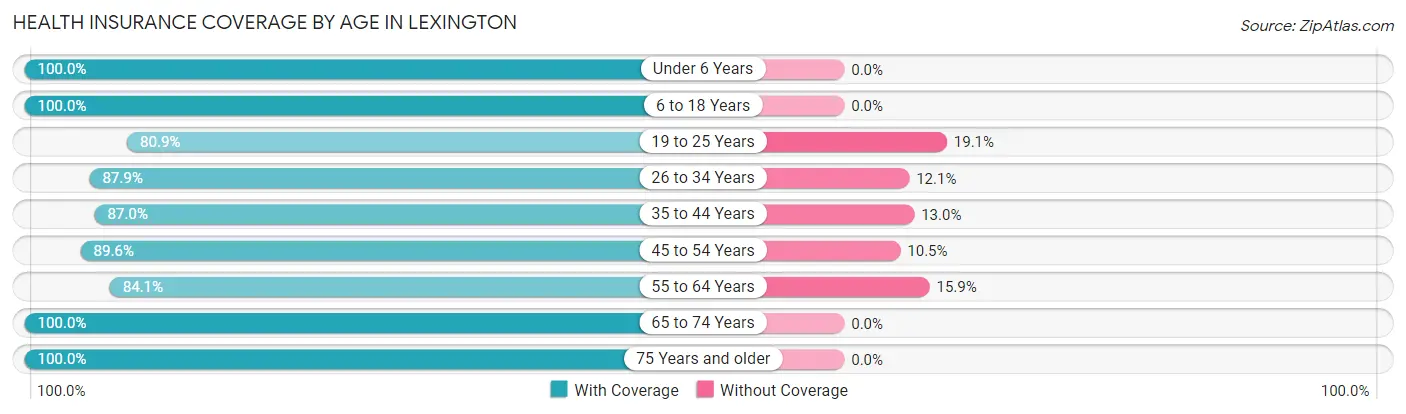
| Age Bracket | With Coverage | Without Coverage |
| Under 6 Years | 17 (100.0%) | 0 (0.0%) |
| 6 to 18 Years | 112 (100.0%) | 0 (0.0%) |
| 19 to 25 Years | 93 (80.9%) | 22 (19.1%) |
| 26 to 34 Years | 167 (87.9%) | 23 (12.1%) |
| 35 to 44 Years | 100 (87.0%) | 15 (13.0%) |
| 45 to 54 Years | 120 (89.5%) | 14 (10.4%) |
| 55 to 64 Years | 201 (84.1%) | 38 (15.9%) |
| 65 to 74 Years | 136 (100.0%) | 0 (0.0%) |
| 75 Years and older | 96 (100.0%) | 0 (0.0%) |
| Total | 1,042 (90.3%) | 112 (9.7%) |
Health Insurance Coverage by Citizenship Status in Lexington
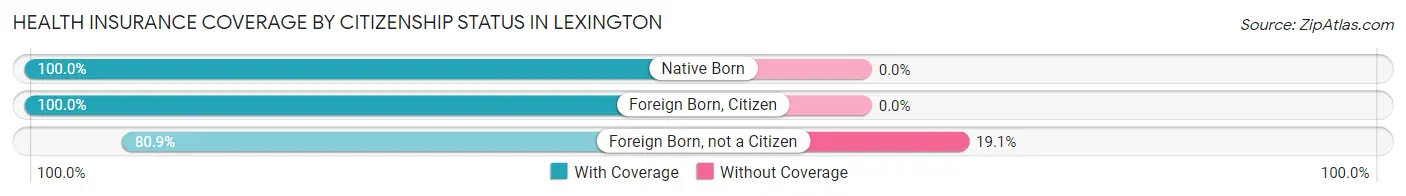
| Citizenship Status | With Coverage | Without Coverage |
| Native Born | 17 (100.0%) | 0 (0.0%) |
| Foreign Born, Citizen | 112 (100.0%) | 0 (0.0%) |
| Foreign Born, not a Citizen | 93 (80.9%) | 22 (19.1%) |
Health Insurance Coverage by Household Income in Lexington
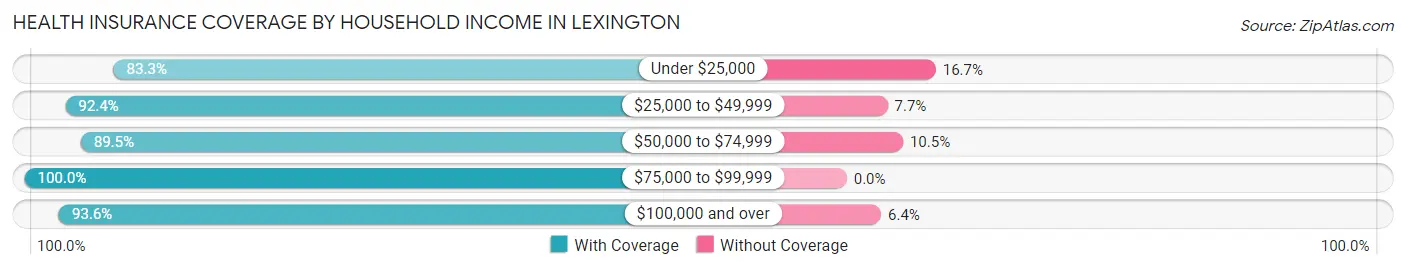
| Household Income | With Coverage | Without Coverage |
| Under $25,000 | 300 (83.3%) | 60 (16.7%) |
| $25,000 to $49,999 | 314 (92.3%) | 26 (7.6%) |
| $50,000 to $74,999 | 34 (89.5%) | 4 (10.5%) |
| $75,000 to $99,999 | 74 (100.0%) | 0 (0.0%) |
| $100,000 and over | 320 (93.6%) | 22 (6.4%) |
Public vs Private Health Insurance Coverage by Age in Lexington
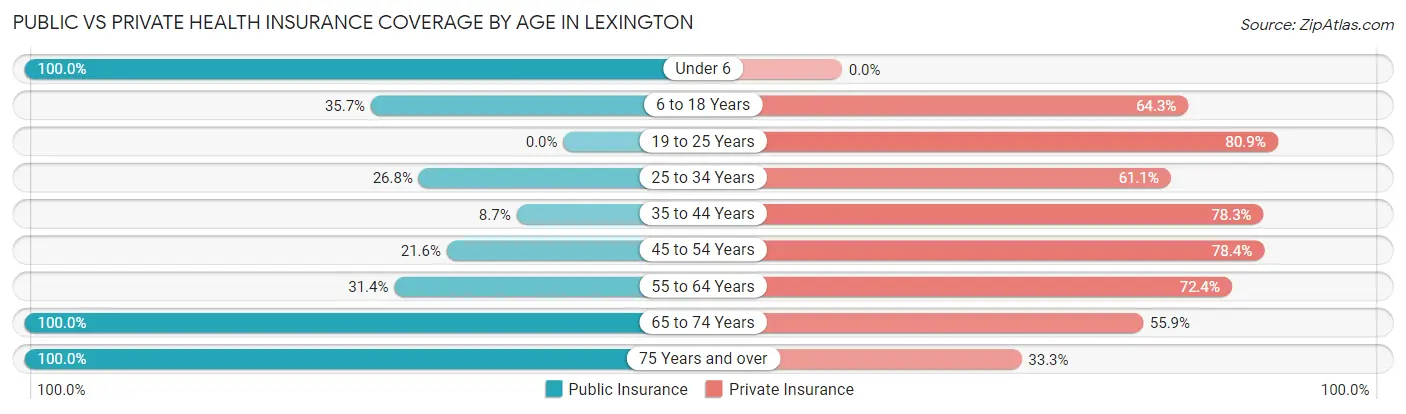
| Age Bracket | Public Insurance | Private Insurance |
| Under 6 | 17 (100.0%) | 0 (0.0%) |
| 6 to 18 Years | 40 (35.7%) | 72 (64.3%) |
| 19 to 25 Years | 0 (0.0%) | 93 (80.9%) |
| 25 to 34 Years | 51 (26.8%) | 116 (61.1%) |
| 35 to 44 Years | 10 (8.7%) | 90 (78.3%) |
| 45 to 54 Years | 29 (21.6%) | 105 (78.4%) |
| 55 to 64 Years | 75 (31.4%) | 173 (72.4%) |
| 65 to 74 Years | 136 (100.0%) | 76 (55.9%) |
| 75 Years and over | 96 (100.0%) | 32 (33.3%) |
| Total | 454 (39.3%) | 757 (65.6%) |
Disability Status by Sex by Age in Lexington
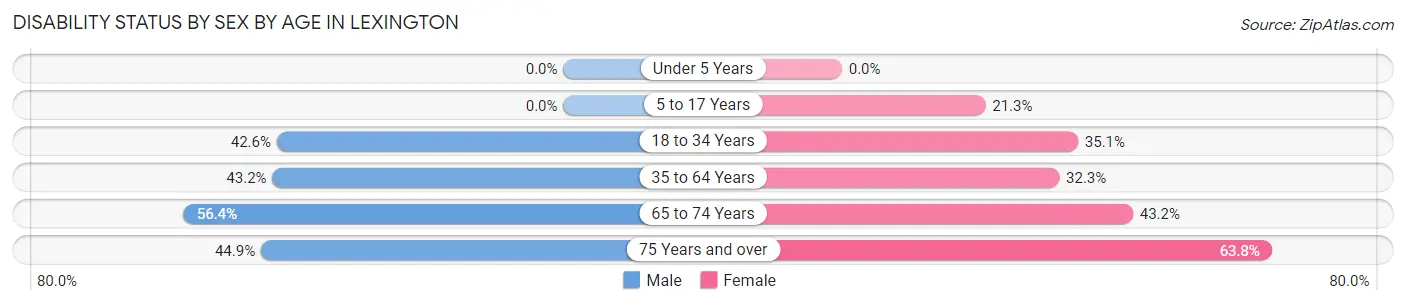
| Age Bracket | Male | Female |
| Under 5 Years | 0 (0.0%) | 0 (0.0%) |
| 5 to 17 Years | 0 (0.0%) | 13 (21.3%) |
| 18 to 34 Years | 40 (42.5%) | 75 (35.0%) |
| 35 to 64 Years | 89 (43.2%) | 91 (32.3%) |
| 65 to 74 Years | 31 (56.4%) | 35 (43.2%) |
| 75 Years and over | 22 (44.9%) | 30 (63.8%) |
Disability Class by Sex by Age in Lexington
Disability Class: Hearing Difficulty
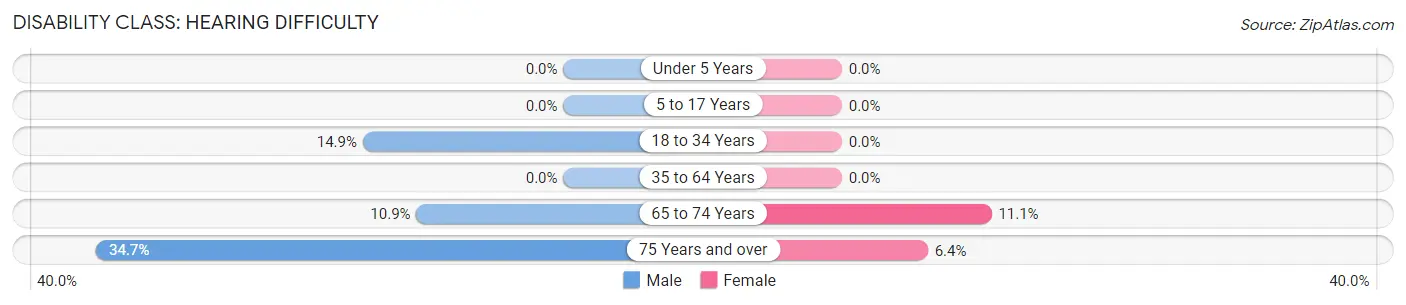
| Age Bracket | Male | Female |
| Under 5 Years | 0 (0.0%) | 0 (0.0%) |
| 5 to 17 Years | 0 (0.0%) | 0 (0.0%) |
| 18 to 34 Years | 14 (14.9%) | 0 (0.0%) |
| 35 to 64 Years | 0 (0.0%) | 0 (0.0%) |
| 65 to 74 Years | 6 (10.9%) | 9 (11.1%) |
| 75 Years and over | 17 (34.7%) | 3 (6.4%) |
Disability Class: Vision Difficulty
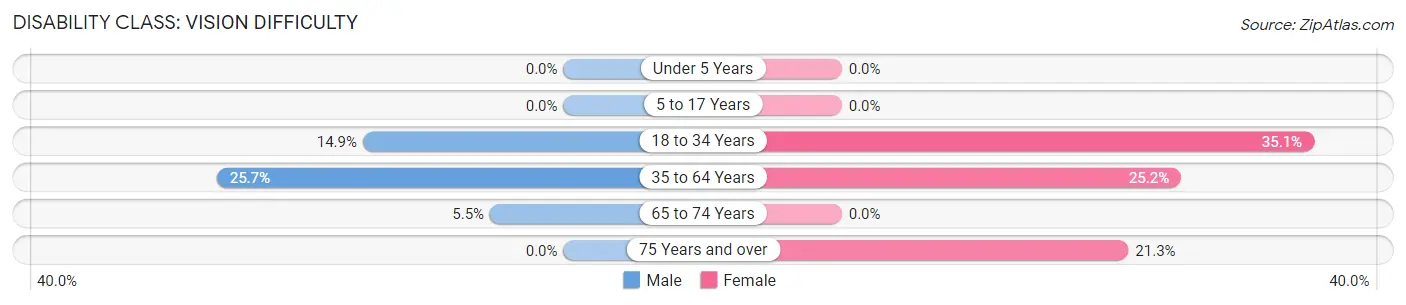
| Age Bracket | Male | Female |
| Under 5 Years | 0 (0.0%) | 0 (0.0%) |
| 5 to 17 Years | 0 (0.0%) | 0 (0.0%) |
| 18 to 34 Years | 14 (14.9%) | 75 (35.0%) |
| 35 to 64 Years | 53 (25.7%) | 71 (25.2%) |
| 65 to 74 Years | 3 (5.4%) | 0 (0.0%) |
| 75 Years and over | 0 (0.0%) | 10 (21.3%) |
Disability Class: Cognitive Difficulty
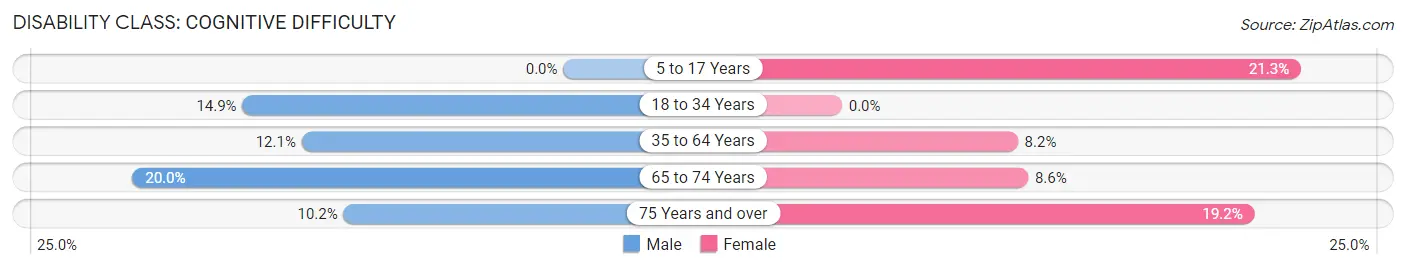
| Age Bracket | Male | Female |
| 5 to 17 Years | 0 (0.0%) | 13 (21.3%) |
| 18 to 34 Years | 14 (14.9%) | 0 (0.0%) |
| 35 to 64 Years | 25 (12.1%) | 23 (8.2%) |
| 65 to 74 Years | 11 (20.0%) | 7 (8.6%) |
| 75 Years and over | 5 (10.2%) | 9 (19.2%) |
Disability Class: Ambulatory Difficulty
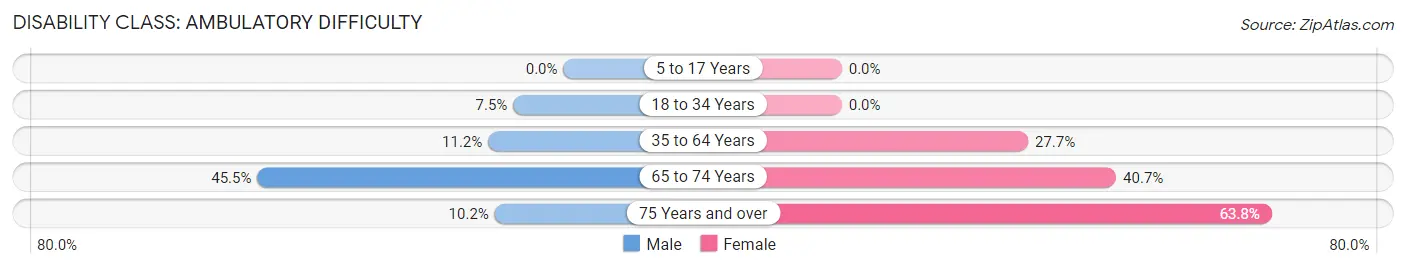
| Age Bracket | Male | Female |
| 5 to 17 Years | 0 (0.0%) | 0 (0.0%) |
| 18 to 34 Years | 7 (7.4%) | 0 (0.0%) |
| 35 to 64 Years | 23 (11.2%) | 78 (27.7%) |
| 65 to 74 Years | 25 (45.5%) | 33 (40.7%) |
| 75 Years and over | 5 (10.2%) | 30 (63.8%) |
Disability Class: Self-Care Difficulty
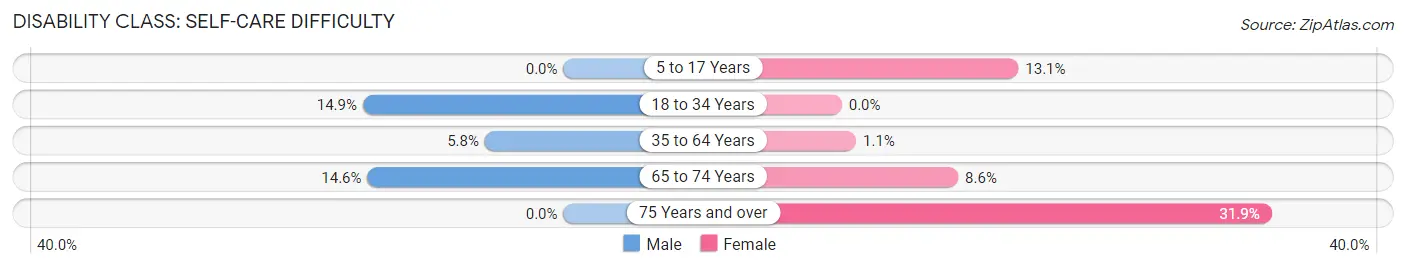
| Age Bracket | Male | Female |
| 5 to 17 Years | 0 (0.0%) | 8 (13.1%) |
| 18 to 34 Years | 14 (14.9%) | 0 (0.0%) |
| 35 to 64 Years | 12 (5.8%) | 3 (1.1%) |
| 65 to 74 Years | 8 (14.5%) | 7 (8.6%) |
| 75 Years and over | 0 (0.0%) | 15 (31.9%) |
Technology Access in Lexington
Computing Device Access in Lexington
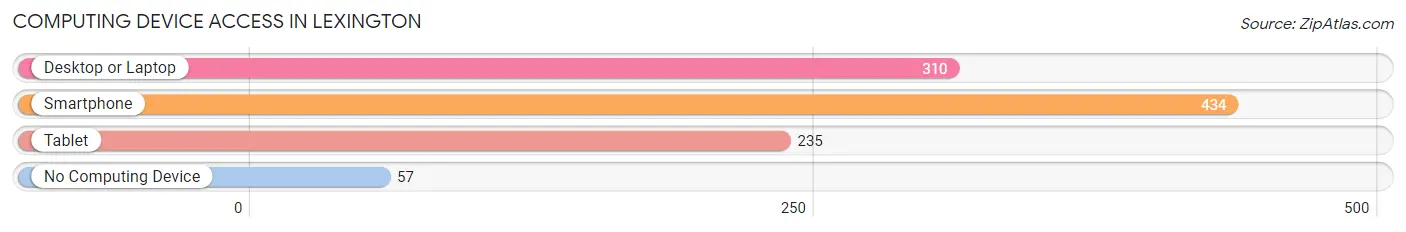
| Device Type | # Households | % Households |
| Desktop or Laptop | 310 | 60.4% |
| Smartphone | 434 | 84.6% |
| Tablet | 235 | 45.8% |
| No Computing Device | 57 | 11.1% |
| Total | 513 | 100.0% |
Internet Access in Lexington
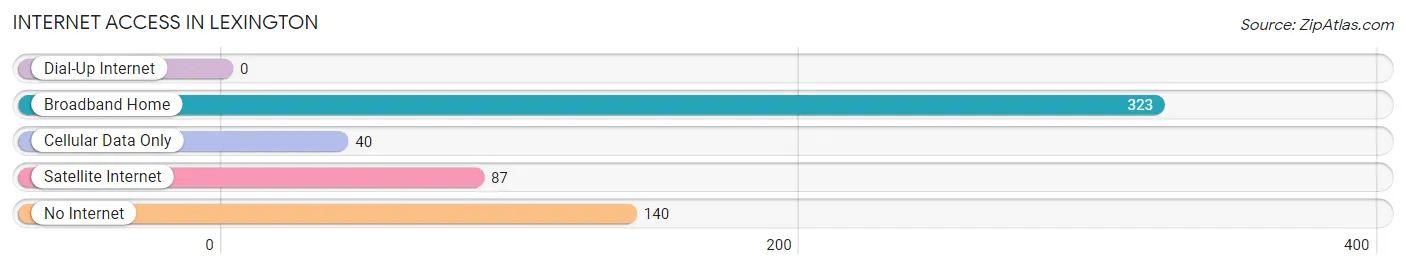
| Internet Type | # Households | % Households |
| Dial-Up Internet | 0 | 0.0% |
| Broadband Home | 323 | 63.0% |
| Cellular Data Only | 40 | 7.8% |
| Satellite Internet | 87 | 17.0% |
| No Internet | 140 | 27.3% |
| Total | 513 | 100.0% |
Lexington Summary
Lexington is a city located in Holmes County, Mississippi. It is the county seat of Holmes County and is located in the heart of the Mississippi Delta. The city has a population of 2,072 as of the 2010 census.
Geography
Lexington is located at 33°37'N 90°25'W (33.6167, -90.4167). It is situated in the Mississippi Delta, a flat alluvial plain that stretches from the Yazoo River in the north to the Mississippi River in the south. The city is located on the banks of the Yazoo River, which is a major tributary of the Mississippi River. The city is surrounded by agricultural land, with cotton and soybeans being the main crops.
History
Lexington was founded in 1837 and was named after the Battle of Lexington in the Revolutionary War. The city was incorporated in 1839 and was the county seat of Holmes County. The city was a major trading center for cotton and other agricultural products in the 19th century. The city was also a major stop on the Mississippi Central Railroad, which connected the city to Memphis and other cities in the region.
The city was the site of a major battle during the Civil War in 1863. The Battle of Lexington was fought between Union and Confederate forces and resulted in a Confederate victory. The city was also the site of a major flood in 1927, which caused extensive damage to the city.
Economy
The economy of Lexington is largely based on agriculture. Cotton and soybeans are the main crops grown in the area. The city also has a number of manufacturing and service-based businesses. The city is home to a number of small businesses, including restaurants, retail stores, and other services.
Demographics
As of the 2010 census, the population of Lexington was 2,072. The racial makeup of the city was 79.2% African American, 19.3% White, 0.3% Native American, 0.2% Asian, and 0.9% from other races. The median household income was $25,938 and the median family income was $31,250. The per capita income was $14,945.
Conclusion
Lexington is a small city located in Holmes County, Mississippi. It is the county seat of Holmes County and is located in the heart of the Mississippi Delta. The city has a population of 2,072 as of the 2010 census. The economy of Lexington is largely based on agriculture, with cotton and soybeans being the main crops. The city also has a number of manufacturing and service-based businesses. The racial makeup of the city was 79.2% African American, 19.3% White, 0.3% Native American, 0.2% Asian, and 0.9% from other races. The median household income was $25,938 and the median family income was $31,250. The per capita income was $14,945.
Common Questions
What is Per Capita Income in Lexington?
Per Capita income in Lexington is $36,654.
What is the Median Family Income in Lexington?
Median Family Income in Lexington is $38,478.
What is the Median Household income in Lexington?
Median Household Income in Lexington is $39,076.
What is Income or Wage Gap in Lexington?
Income or Wage Gap in Lexington is 37.5%.
Women in Lexington earn 62.5 cents for every dollar earned by a man.
What is Inequality or Gini Index in Lexington?
Inequality or Gini Index in Lexington is 0.59.
What is the Total Population of Lexington?
Total Population of Lexington is 1,154.
What is the Total Male Population of Lexington?
Total Male Population of Lexington is 452.
What is the Total Female Population of Lexington?
Total Female Population of Lexington is 702.
What is the Ratio of Males per 100 Females in Lexington?
There are 64.39 Males per 100 Females in Lexington.
What is the Ratio of Females per 100 Males in Lexington?
There are 155.31 Females per 100 Males in Lexington.
What is the Median Population Age in Lexington?
Median Population Age in Lexington is 47.5 Years.
What is the Average Family Size in Lexington
Average Family Size in Lexington is 3.3 People.
What is the Average Household Size in Lexington
Average Household Size in Lexington is 2.2 People.
How Large is the Labor Force in Lexington?
There are 578 People in the Labor Forcein in Lexington.
What is the Percentage of People in the Labor Force in Lexington?
54.1% of People are in the Labor Force in Lexington.
What is the Unemployment Rate in Lexington?
Unemployment Rate in Lexington is 5.4%.