Philadelphia, MS Map & Demographics
Philadelphia Map
Philadelphia Overview
$25,833
PER CAPITA INCOME
$47,023
AVG FAMILY INCOME
$38,713
AVG HOUSEHOLD INCOME
7.4%
WAGE / INCOME GAP [ % ]
92.6¢/ $1
WAGE / INCOME GAP [ $ ]
$14,039
FAMILY INCOME DEFICIT
0.51
INEQUALITY / GINI INDEX
7,065
TOTAL POPULATION
3,191
MALE POPULATION
3,874
FEMALE POPULATION
82.37
MALES / 100 FEMALES
121.40
FEMALES / 100 MALES
43.0
MEDIAN AGE
3.2
AVG FAMILY SIZE
2.4
AVG HOUSEHOLD SIZE
3,063
LABOR FORCE [ PEOPLE ]
52.6%
PERCENT IN LABOR FORCE
10.5%
UNEMPLOYMENT RATE
Philadelphia Zip Codes
Income in Philadelphia
Income Overview in Philadelphia
Per Capita Income in Philadelphia is $25,833, while median incomes of families and households are $47,023 and $38,713 respectively.
| Characteristic | Number | Measure |
| Per Capita Income | 7,065 | $25,833 |
| Median Family Income | 1,529 | $47,023 |
| Mean Family Income | 1,529 | $71,525 |
| Median Household Income | 2,843 | $38,713 |
| Mean Household Income | 2,843 | $60,590 |
| Income Deficit | 1,529 | $14,039 |
| Wage / Income Gap (%) | 7,065 | 7.37% |
| Wage / Income Gap ($) | 7,065 | 92.63¢ per $1 |
| Gini / Inequality Index | 7,065 | 0.51 |
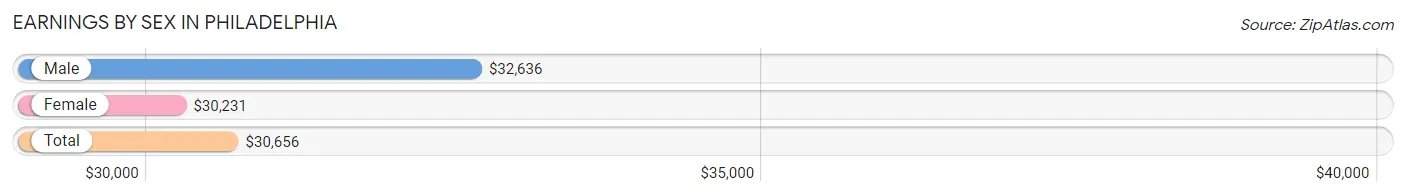
Earnings by Sex in Philadelphia
Average Earnings in Philadelphia are $30,656, $32,636 for men and $30,231 for women, a difference of 7.4%.
| Sex | Number | Average Earnings |
| Male | 1,496 (48.4%) | $32,636 |
| Female | 1,597 (51.6%) | $30,231 |
| Total | 3,093 (100.0%) | $30,656 |
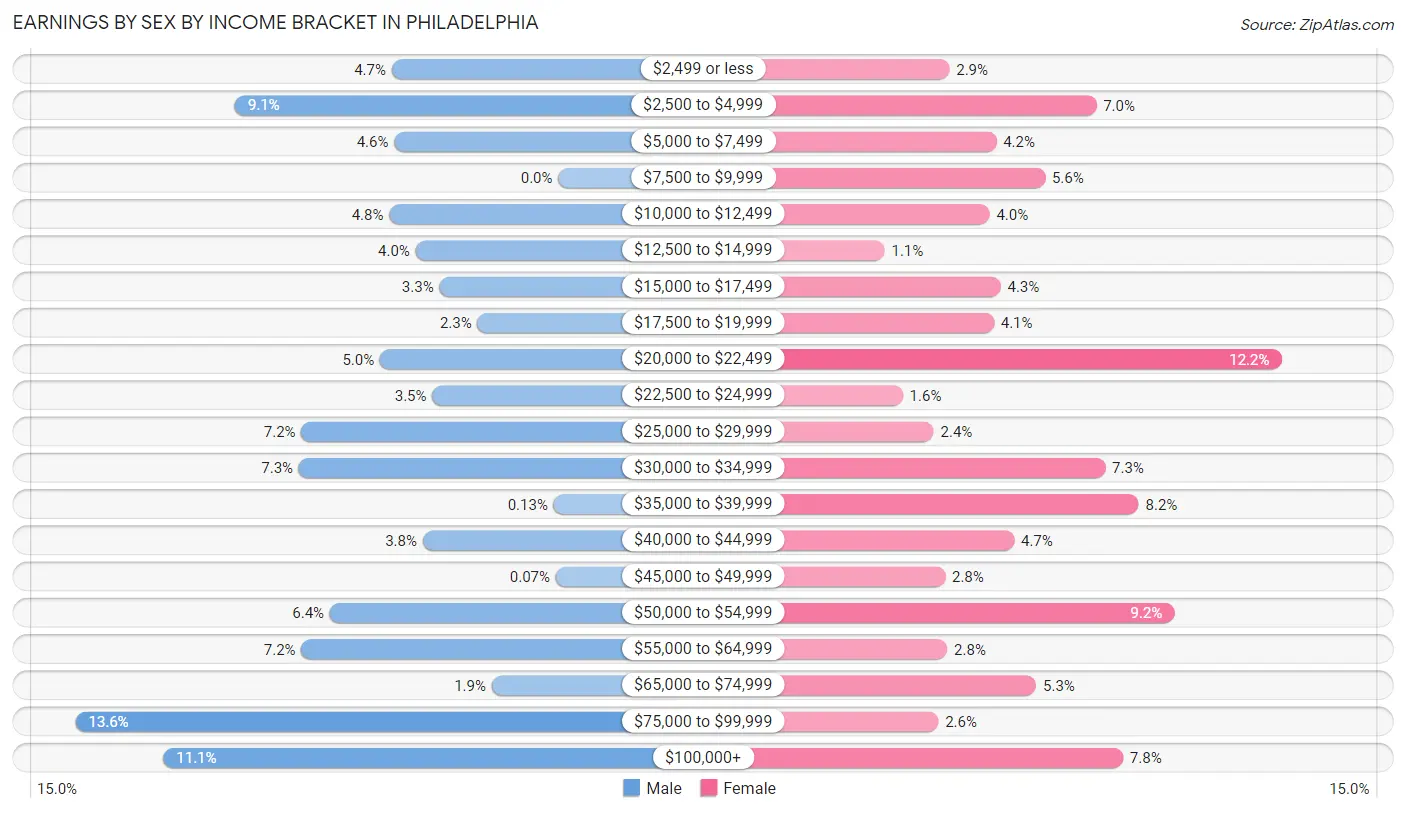
Earnings by Sex by Income Bracket in Philadelphia
The most common earnings brackets in Philadelphia are $75,000 to $99,999 for men (203 | 13.6%) and $20,000 to $22,499 for women (195 | 12.2%).
| Income | Male | Female |
| $2,499 or less | 70 (4.7%) | 46 (2.9%) |
| $2,500 to $4,999 | 136 (9.1%) | 112 (7.0%) |
| $5,000 to $7,499 | 69 (4.6%) | 67 (4.2%) |
| $7,500 to $9,999 | 0 (0.0%) | 89 (5.6%) |
| $10,000 to $12,499 | 71 (4.8%) | 64 (4.0%) |
| $12,500 to $14,999 | 60 (4.0%) | 17 (1.1%) |
| $15,000 to $17,499 | 50 (3.3%) | 69 (4.3%) |
| $17,500 to $19,999 | 34 (2.3%) | 66 (4.1%) |
| $20,000 to $22,499 | 75 (5.0%) | 195 (12.2%) |
| $22,500 to $24,999 | 53 (3.5%) | 25 (1.6%) |
| $25,000 to $29,999 | 108 (7.2%) | 39 (2.4%) |
| $30,000 to $34,999 | 109 (7.3%) | 116 (7.3%) |
| $35,000 to $39,999 | 2 (0.1%) | 131 (8.2%) |
| $40,000 to $44,999 | 57 (3.8%) | 75 (4.7%) |
| $45,000 to $49,999 | 1 (0.1%) | 44 (2.8%) |
| $50,000 to $54,999 | 96 (6.4%) | 147 (9.2%) |
| $55,000 to $64,999 | 108 (7.2%) | 45 (2.8%) |
| $65,000 to $74,999 | 28 (1.9%) | 85 (5.3%) |
| $75,000 to $99,999 | 203 (13.6%) | 41 (2.6%) |
| $100,000+ | 166 (11.1%) | 124 (7.8%) |
| Total | 1,496 (100.0%) | 1,597 (100.0%) |
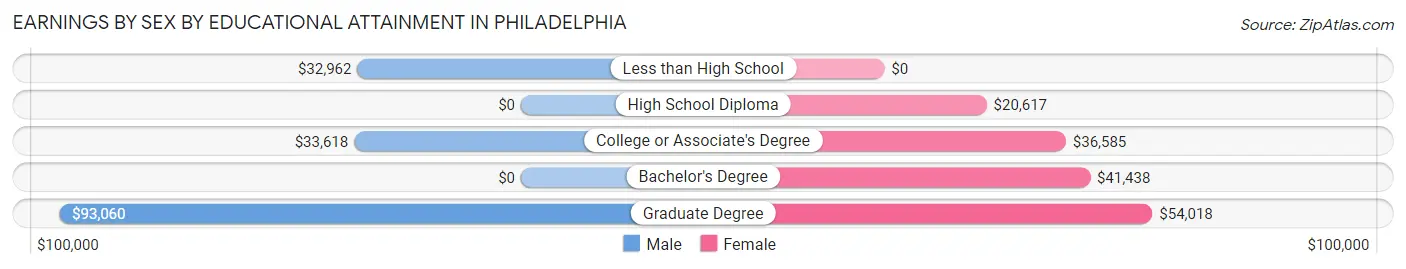
Earnings by Sex by Educational Attainment in Philadelphia
Average earnings in Philadelphia are $34,959 for men and $33,269 for women, a difference of 4.8%. Men with an educational attainment of graduate degree enjoy the highest average annual earnings of $93,060, while those with less than high school education earn the least with $32,962. Women with an educational attainment of graduate degree earn the most with the average annual earnings of $54,018, while those with high school diploma education have the smallest earnings of $20,617.
| Educational Attainment | Male Income | Female Income |
| Less than High School | $32,962 | $0 |
| High School Diploma | - | - |
| College or Associate's Degree | $33,618 | $36,585 |
| Bachelor's Degree | - | - |
| Graduate Degree | $93,060 | $54,018 |
| Total | $34,959 | $33,269 |
Family Income in Philadelphia
Family Income Brackets in Philadelphia
According to the Philadelphia family income data, there are 292 families falling into the $100,000 to $149,999 income range, which is the most common income bracket and makes up 19.1% of all families. Conversely, the $10,000 to $14,999 income bracket is the least frequent group with only 20 families (1.3%) belonging to this category.
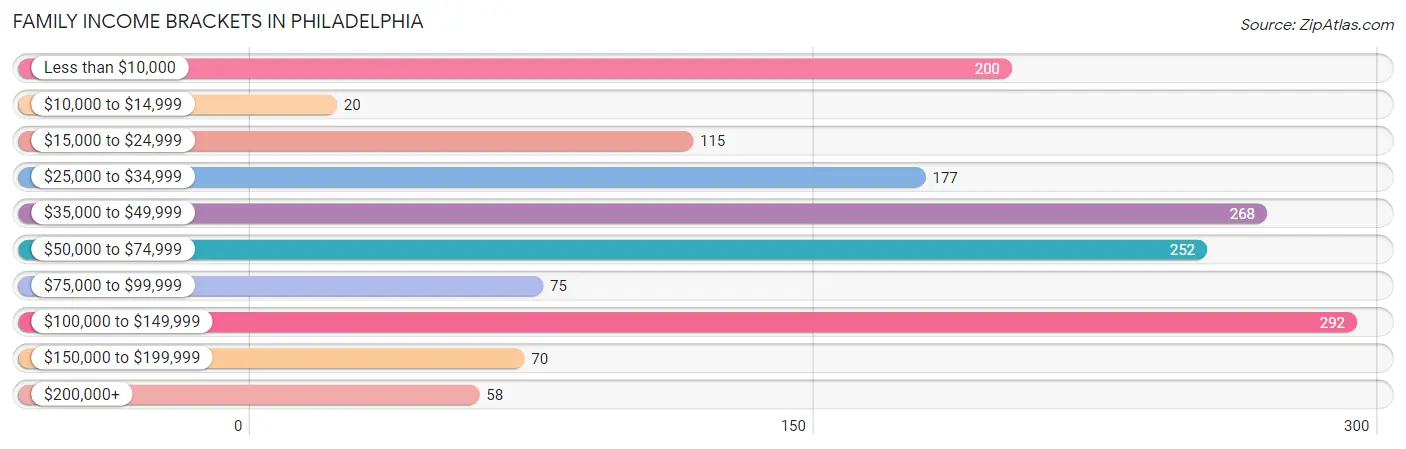
| Income Bracket | # Families | % Families |
| Less than $10,000 | 200 | 13.1% |
| $10,000 to $14,999 | 20 | 1.3% |
| $15,000 to $24,999 | 115 | 7.5% |
| $25,000 to $34,999 | 177 | 11.6% |
| $35,000 to $49,999 | 268 | 17.5% |
| $50,000 to $74,999 | 252 | 16.5% |
| $75,000 to $99,999 | 75 | 4.9% |
| $100,000 to $149,999 | 292 | 19.1% |
| $150,000 to $199,999 | 70 | 4.6% |
| $200,000+ | 58 | 3.8% |
Family Income by Famaliy Size in Philadelphia
2-person families (906 | 59.3%) account for the highest median family income in Philadelphia with $56,327 per family, while 2-person families (906 | 59.3%) have the highest median income of $28,164 per family member.
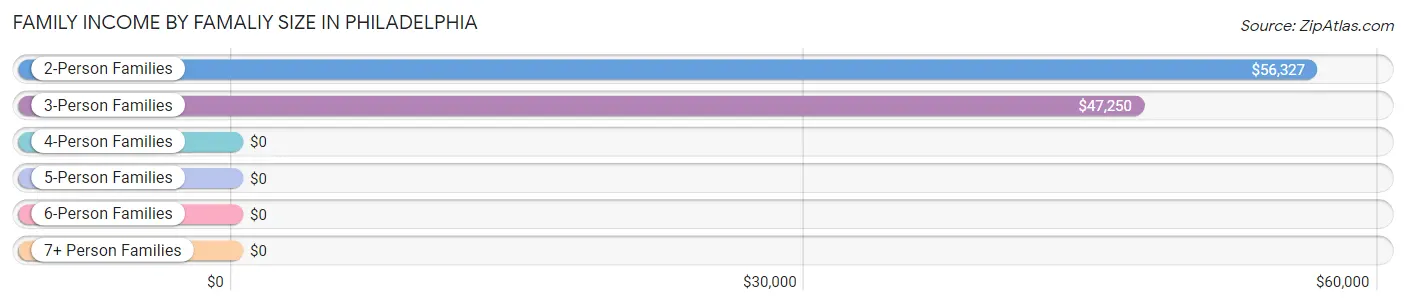
| Income Bracket | # Families | Median Income |
| 2-Person Families | 906 (59.3%) | $56,327 |
| 3-Person Families | 313 (20.5%) | $47,250 |
| 4-Person Families | 213 (13.9%) | $0 |
| 5-Person Families | 25 (1.6%) | $0 |
| 6-Person Families | 72 (4.7%) | $0 |
| 7+ Person Families | 0 (0.0%) | $0 |
| Total | 1,529 (100.0%) | $47,023 |
Family Income by Number of Earners in Philadelphia
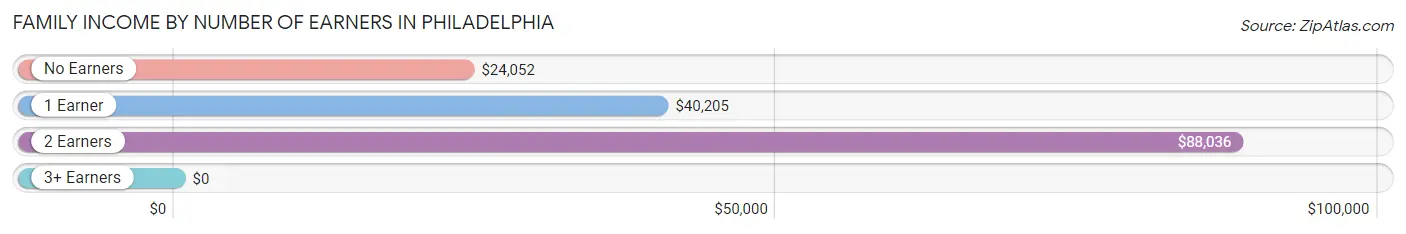
| Number of Earners | # Families | Median Income |
| No Earners | 204 (13.3%) | $24,052 |
| 1 Earner | 813 (53.2%) | $40,205 |
| 2 Earners | 376 (24.6%) | $88,036 |
| 3+ Earners | 136 (8.9%) | $0 |
| Total | 1,529 (100.0%) | $47,023 |
Household Income in Philadelphia
Household Income Brackets in Philadelphia
With 395 households falling in the category, the $35,000 to $49,999 income range is the most frequent in Philadelphia, accounting for 13.9% of all households. In contrast, only 74 households (2.6%) fall into the $200,000+ income bracket, making it the least populous group.
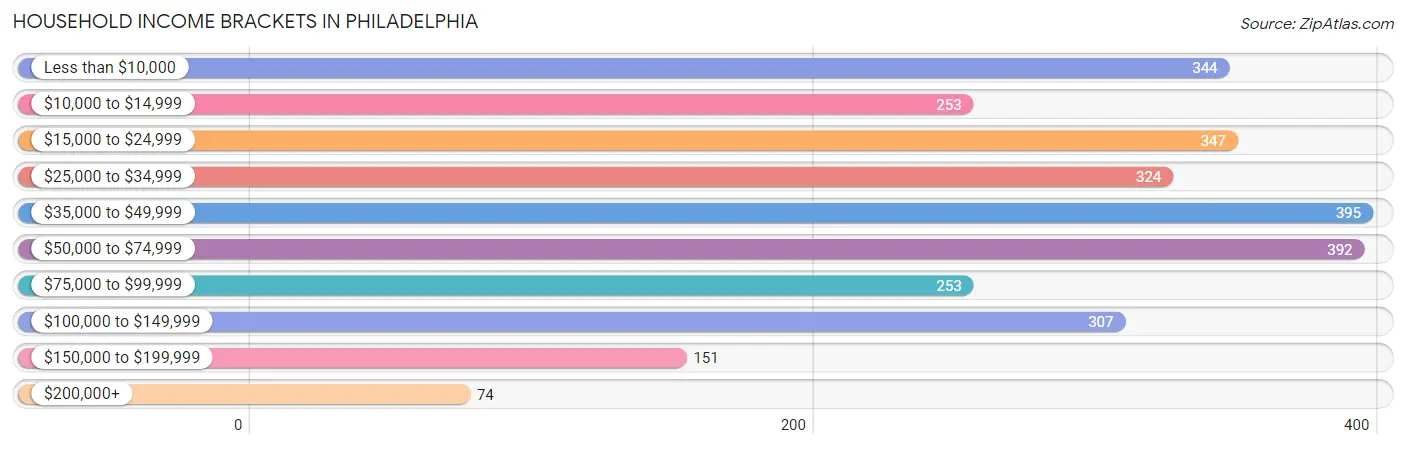
| Income Bracket | # Households | % Households |
| Less than $10,000 | 344 | 12.1% |
| $10,000 to $14,999 | 253 | 8.9% |
| $15,000 to $24,999 | 347 | 12.2% |
| $25,000 to $34,999 | 324 | 11.4% |
| $35,000 to $49,999 | 395 | 13.9% |
| $50,000 to $74,999 | 392 | 13.8% |
| $75,000 to $99,999 | 253 | 8.9% |
| $100,000 to $149,999 | 307 | 10.8% |
| $150,000 to $199,999 | 151 | 5.3% |
| $200,000+ | 74 | 2.6% |
Household Income by Householder Age in Philadelphia
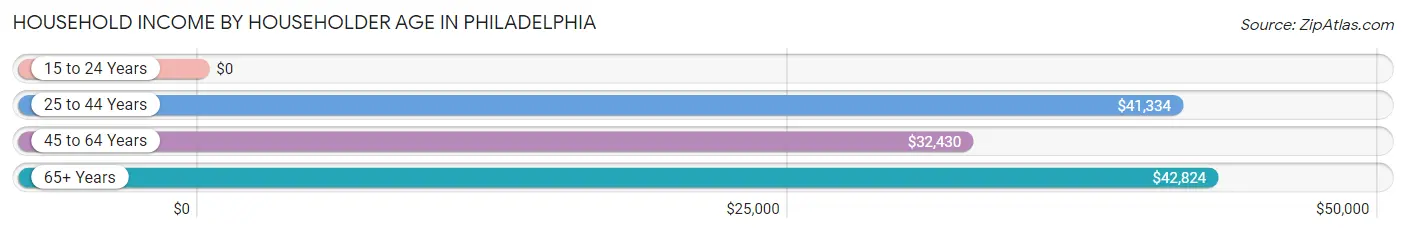
The median household income in Philadelphia is $38,713, with the highest median household income of $42,824 found in the 65+ years age bracket for the primary householder. A total of 645 households (22.7%) fall into this category. Meanwhile, the 15 to 24 years age bracket for the primary householder has the lowest median household income of $0, with 89 households (3.1%) in this group.
| Income Bracket | # Households | Median Income |
| 15 to 24 Years | 89 (3.1%) | $0 |
| 25 to 44 Years | 933 (32.8%) | $41,334 |
| 45 to 64 Years | 1,176 (41.4%) | $32,430 |
| 65+ Years | 645 (22.7%) | $42,824 |
| Total | 2,843 (100.0%) | $38,713 |
Poverty in Philadelphia
Income Below Poverty by Sex and Age in Philadelphia
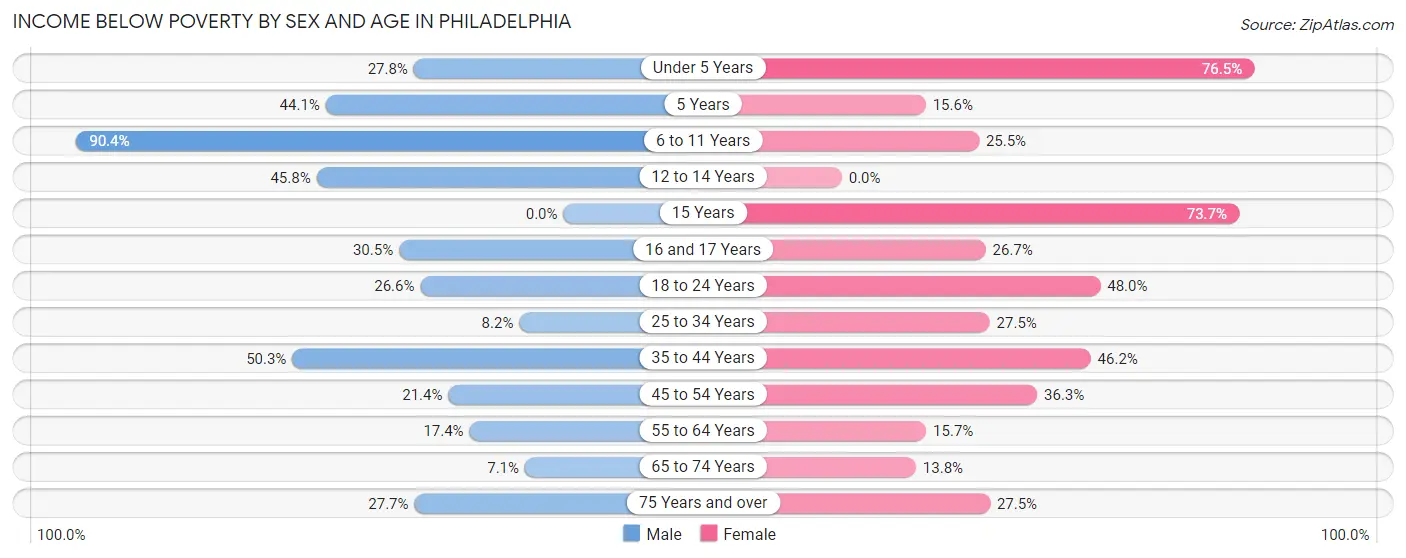
With 30.3% poverty level for males and 32.2% for females among the residents of Philadelphia, 6 to 11 year old males and under 5 year old females are the most vulnerable to poverty, with 207 males (90.4%) and 179 females (76.5%) in their respective age groups living below the poverty level.
| Age Bracket | Male | Female |
| Under 5 Years | 20 (27.8%) | 179 (76.5%) |
| 5 Years | 15 (44.1%) | 12 (15.6%) |
| 6 to 11 Years | 207 (90.4%) | 55 (25.5%) |
| 12 to 14 Years | 115 (45.8%) | 0 (0.0%) |
| 15 Years | 0 (0.0%) | 14 (73.7%) |
| 16 and 17 Years | 36 (30.5%) | 47 (26.7%) |
| 18 to 24 Years | 60 (26.6%) | 178 (48.0%) |
| 25 to 34 Years | 39 (8.2%) | 84 (27.5%) |
| 35 to 44 Years | 227 (50.3%) | 212 (46.2%) |
| 45 to 54 Years | 69 (21.4%) | 199 (36.2%) |
| 55 to 64 Years | 80 (17.4%) | 93 (15.7%) |
| 65 to 74 Years | 18 (7.1%) | 63 (13.8%) |
| 75 Years and over | 26 (27.7%) | 66 (27.5%) |
| Total | 912 (30.3%) | 1,202 (32.2%) |
Income Above Poverty by Sex and Age in Philadelphia
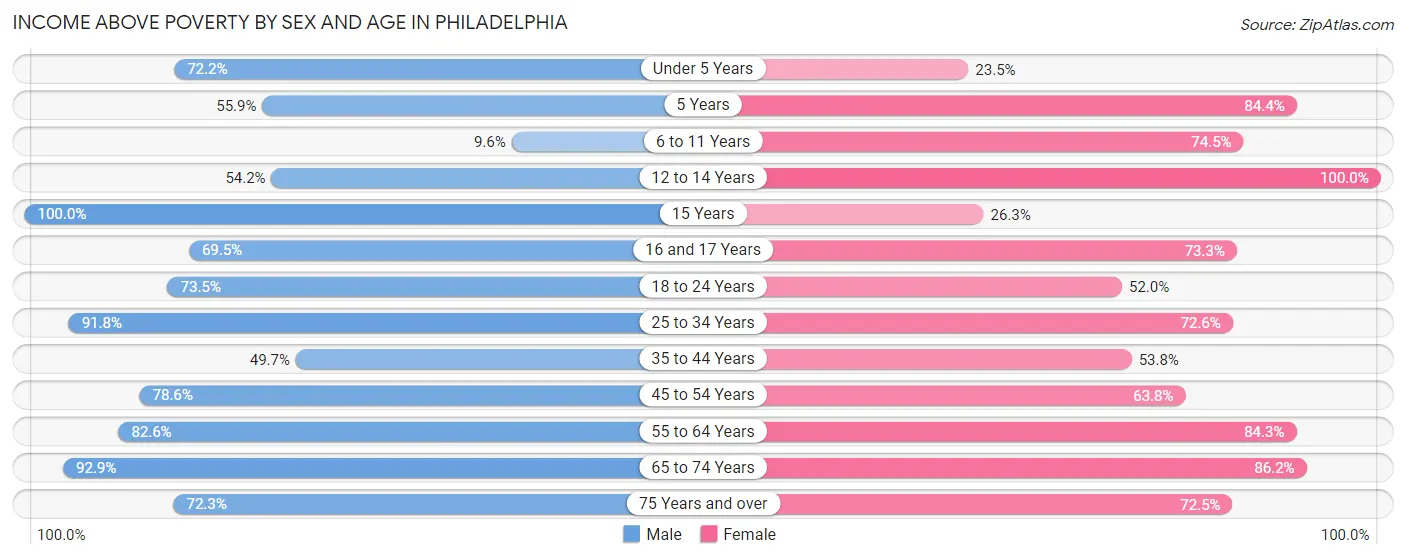
According to the poverty statistics in Philadelphia, males aged 15 years and females aged 12 to 14 years are the age groups that are most secure financially, with 100.0% of males and 100.0% of females in these age groups living above the poverty line.
| Age Bracket | Male | Female |
| Under 5 Years | 52 (72.2%) | 55 (23.5%) |
| 5 Years | 19 (55.9%) | 65 (84.4%) |
| 6 to 11 Years | 22 (9.6%) | 161 (74.5%) |
| 12 to 14 Years | 136 (54.2%) | 34 (100.0%) |
| 15 Years | 29 (100.0%) | 5 (26.3%) |
| 16 and 17 Years | 82 (69.5%) | 129 (73.3%) |
| 18 to 24 Years | 166 (73.5%) | 193 (52.0%) |
| 25 to 34 Years | 437 (91.8%) | 222 (72.6%) |
| 35 to 44 Years | 224 (49.7%) | 247 (53.8%) |
| 45 to 54 Years | 254 (78.6%) | 350 (63.7%) |
| 55 to 64 Years | 379 (82.6%) | 501 (84.3%) |
| 65 to 74 Years | 234 (92.9%) | 395 (86.2%) |
| 75 Years and over | 68 (72.3%) | 174 (72.5%) |
| Total | 2,102 (69.7%) | 2,531 (67.8%) |
Income Below Poverty Among Married-Couple Families in Philadelphia
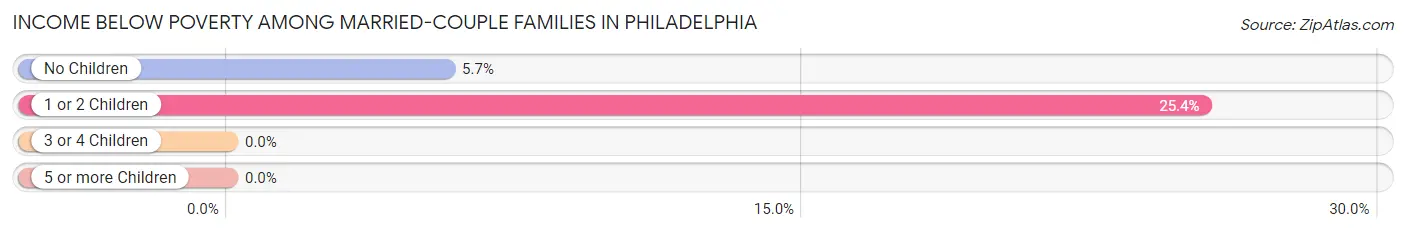
The poverty statistics for married-couple families in Philadelphia show that 12.1% or 110 of the total 912 families live below the poverty line. Families with 1 or 2 children have the highest poverty rate of 25.4%, comprising of 75 families. On the other hand, families with no children have the lowest poverty rate of 5.7%, which includes 35 families.
| Children | Above Poverty | Below Poverty |
| No Children | 582 (94.3%) | 35 (5.7%) |
| 1 or 2 Children | 220 (74.6%) | 75 (25.4%) |
| 3 or 4 Children | 0 (0.0%) | 0 (0.0%) |
| 5 or more Children | 0 (0.0%) | 0 (0.0%) |
| Total | 802 (87.9%) | 110 (12.1%) |
Income Below Poverty Among Single-Parent Households in Philadelphia
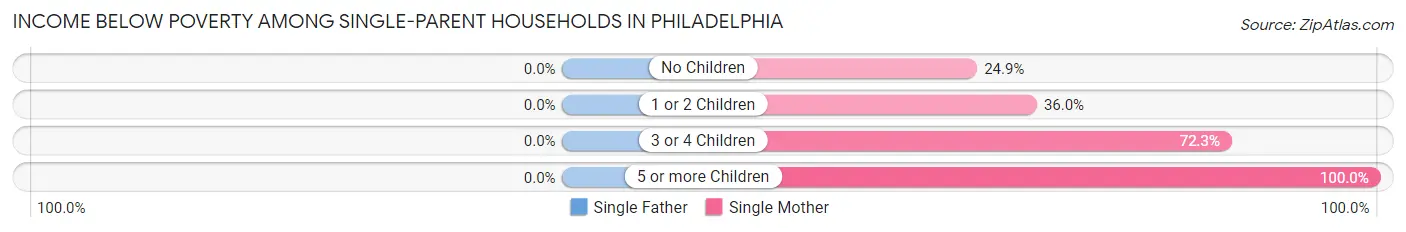
| Children | Single Father | Single Mother |
| No Children | 0 (0.0%) | 49 (24.9%) |
| 1 or 2 Children | 0 (0.0%) | 63 (36.0%) |
| 3 or 4 Children | 0 (0.0%) | 73 (72.3%) |
| 5 or more Children | 0 (0.0%) | 44 (100.0%) |
| Total | 0 (0.0%) | 229 (44.3%) |
Income Below Poverty Among Married-Couple vs Single-Parent Households in Philadelphia
The poverty data for Philadelphia shows that 110 of the married-couple family households (12.1%) and 229 of the single-parent households (37.1%) are living below the poverty level. Within the married-couple family households, those with 1 or 2 children have the highest poverty rate, with 75 households (25.4%) falling below the poverty line. Among the single-parent households, those with 5 or more children have the highest poverty rate, with 44 household (100.0%) living below poverty.
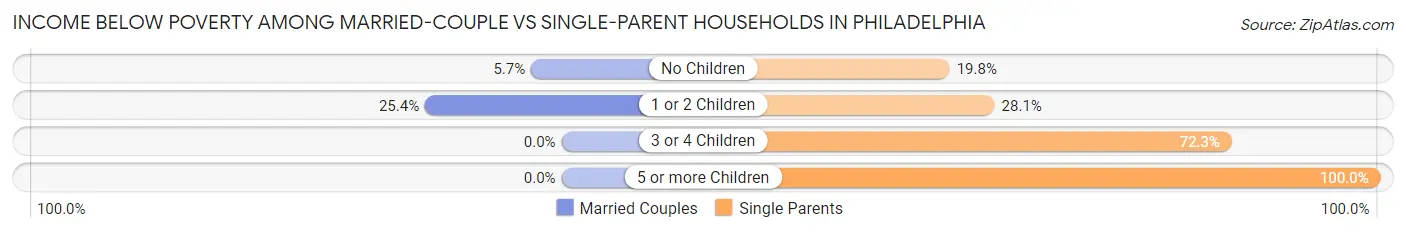
| Children | Married-Couple Families | Single-Parent Households |
| No Children | 35 (5.7%) | 49 (19.8%) |
| 1 or 2 Children | 75 (25.4%) | 63 (28.1%) |
| 3 or 4 Children | 0 (0.0%) | 73 (72.3%) |
| 5 or more Children | 0 (0.0%) | 44 (100.0%) |
| Total | 110 (12.1%) | 229 (37.1%) |
Race in Philadelphia
The most populous races in Philadelphia are Black / African American (3,590 | 50.8%), White / Caucasian (3,216 | 45.5%), and Two or more Races (142 | 2.0%).
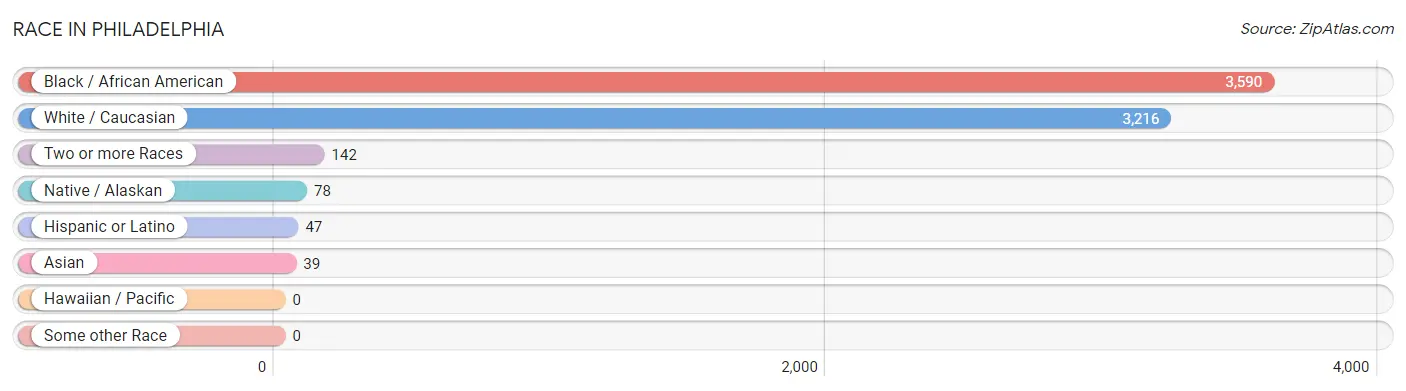
| Race | # Population | % Population |
| Asian | 39 | 0.5% |
| Black / African American | 3,590 | 50.8% |
| Hawaiian / Pacific | 0 | 0.0% |
| Hispanic or Latino | 47 | 0.7% |
| Native / Alaskan | 78 | 1.1% |
| White / Caucasian | 3,216 | 45.5% |
| Two or more Races | 142 | 2.0% |
| Some other Race | 0 | 0.0% |
| Total | 7,065 | 100.0% |
Ancestry in Philadelphia
The most populous ancestries reported in Philadelphia are American (591 | 8.4%), English (356 | 5.0%), Irish (354 | 5.0%), German (347 | 4.9%), and Dutch (149 | 2.1%), together accounting for 25.4% of all Philadelphia residents.
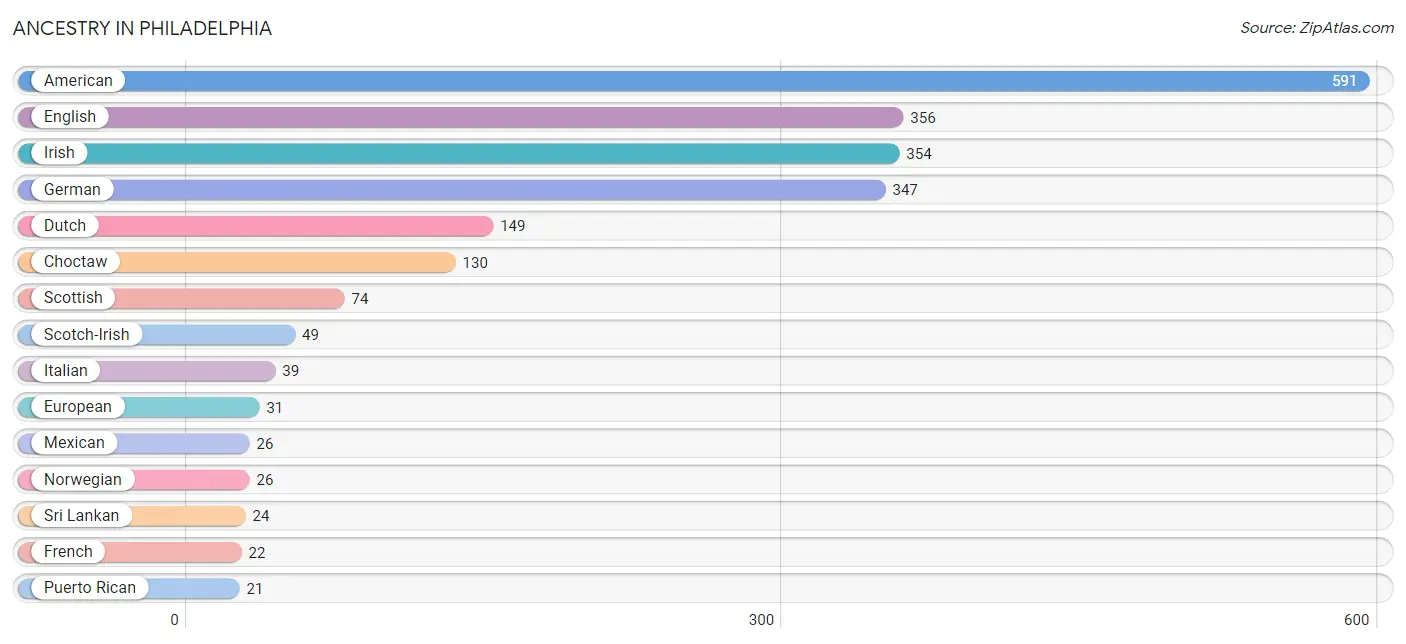
| Ancestry | # Population | % Population |
| African | 2 | 0.0% |
| American | 591 | 8.4% |
| Bhutanese | 12 | 0.2% |
| Choctaw | 130 | 1.8% |
| Dutch | 149 | 2.1% |
| English | 356 | 5.0% |
| European | 31 | 0.4% |
| French | 22 | 0.3% |
| French Canadian | 10 | 0.1% |
| German | 347 | 4.9% |
| Indian (Asian) | 3 | 0.0% |
| Irish | 354 | 5.0% |
| Italian | 39 | 0.5% |
| Mexican | 26 | 0.4% |
| Norwegian | 26 | 0.4% |
| Pakistani | 12 | 0.2% |
| Puerto Rican | 21 | 0.3% |
| Scotch-Irish | 49 | 0.7% |
| Scottish | 74 | 1.1% |
| Sri Lankan | 24 | 0.3% |
| Subsaharan African | 2 | 0.0% |
| Welsh | 10 | 0.1% | View All 22 Rows |
Immigrants in Philadelphia
The most numerous immigrant groups reported in Philadelphia came from Europe (47 | 0.7%), Western Europe (47 | 0.7%), Central America (26 | 0.4%), Latin America (26 | 0.4%), and Mexico (26 | 0.4%), together accounting for 2.5% of all Philadelphia residents.
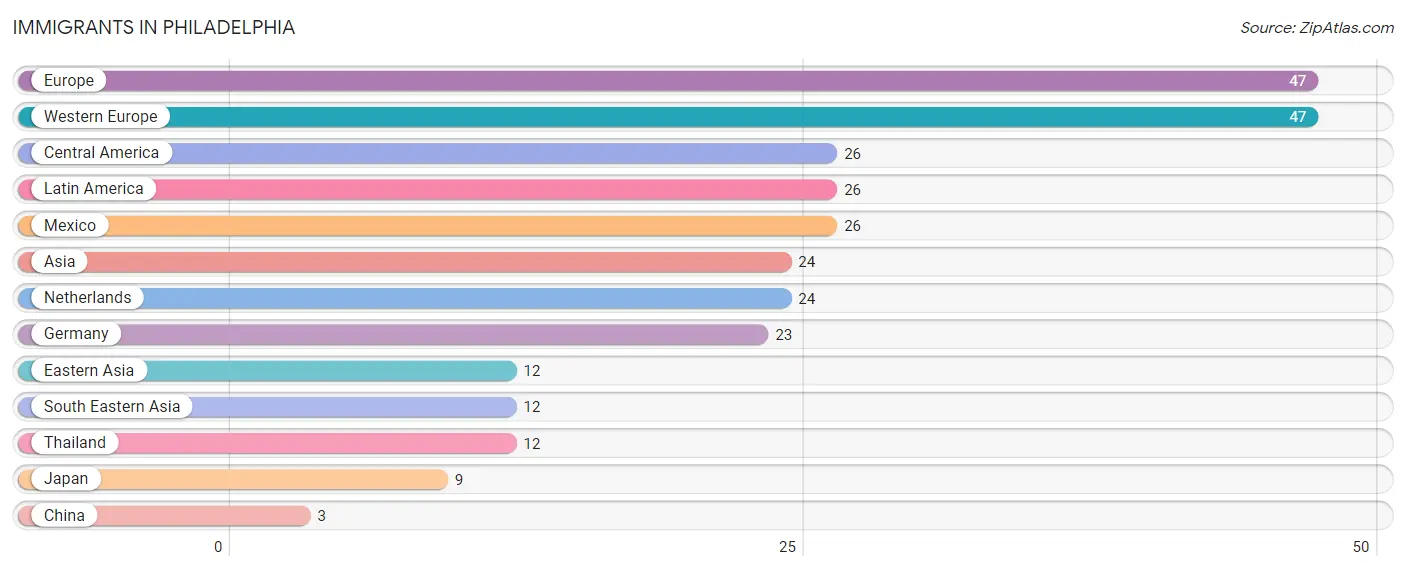
| Immigration Origin | # Population | % Population |
| Asia | 24 | 0.3% |
| Central America | 26 | 0.4% |
| China | 3 | 0.0% |
| Eastern Asia | 12 | 0.2% |
| Europe | 47 | 0.7% |
| Germany | 23 | 0.3% |
| Japan | 9 | 0.1% |
| Latin America | 26 | 0.4% |
| Mexico | 26 | 0.4% |
| Netherlands | 24 | 0.3% |
| South Eastern Asia | 12 | 0.2% |
| Thailand | 12 | 0.2% |
| Western Europe | 47 | 0.7% | View All 13 Rows |
Sex and Age in Philadelphia
Sex and Age in Philadelphia
The most populous age groups in Philadelphia are 40 to 44 Years (405 | 12.7%) for men and 60 to 64 Years (448 | 11.6%) for women.
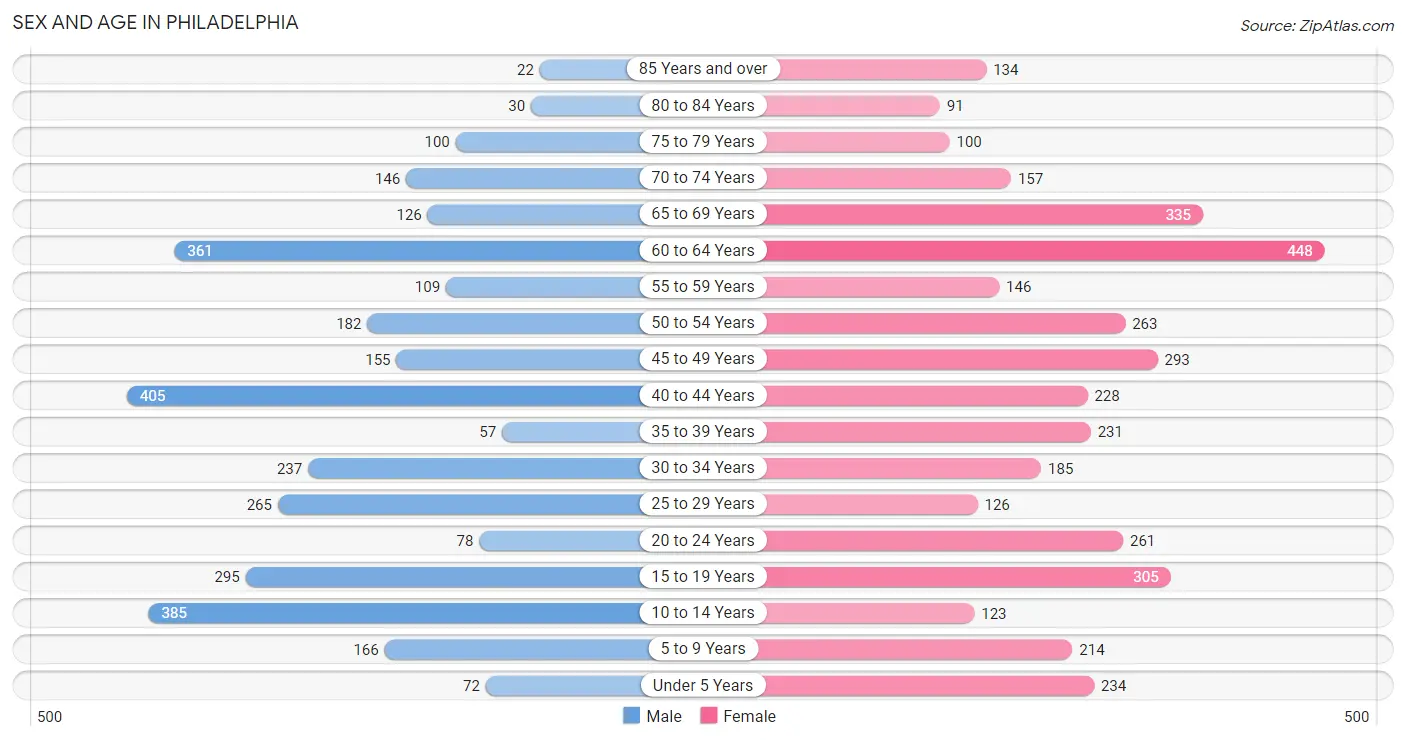
| Age Bracket | Male | Female |
| Under 5 Years | 72 (2.3%) | 234 (6.0%) |
| 5 to 9 Years | 166 (5.2%) | 214 (5.5%) |
| 10 to 14 Years | 385 (12.1%) | 123 (3.2%) |
| 15 to 19 Years | 295 (9.2%) | 305 (7.9%) |
| 20 to 24 Years | 78 (2.4%) | 261 (6.7%) |
| 25 to 29 Years | 265 (8.3%) | 126 (3.3%) |
| 30 to 34 Years | 237 (7.4%) | 185 (4.8%) |
| 35 to 39 Years | 57 (1.8%) | 231 (6.0%) |
| 40 to 44 Years | 405 (12.7%) | 228 (5.9%) |
| 45 to 49 Years | 155 (4.9%) | 293 (7.6%) |
| 50 to 54 Years | 182 (5.7%) | 263 (6.8%) |
| 55 to 59 Years | 109 (3.4%) | 146 (3.8%) |
| 60 to 64 Years | 361 (11.3%) | 448 (11.6%) |
| 65 to 69 Years | 126 (4.0%) | 335 (8.6%) |
| 70 to 74 Years | 146 (4.6%) | 157 (4.1%) |
| 75 to 79 Years | 100 (3.1%) | 100 (2.6%) |
| 80 to 84 Years | 30 (0.9%) | 91 (2.4%) |
| 85 Years and over | 22 (0.7%) | 134 (3.5%) |
| Total | 3,191 (100.0%) | 3,874 (100.0%) |
Families and Households in Philadelphia
Median Family Size in Philadelphia
The median family size in Philadelphia is 3.25 persons per family, with single female/mother families (517 | 33.8%) accounting for the largest median family size of 3.79 persons per family. On the other hand, single male/father families (100 | 6.5%) represent the smallest median family size with 2.31 persons per family.
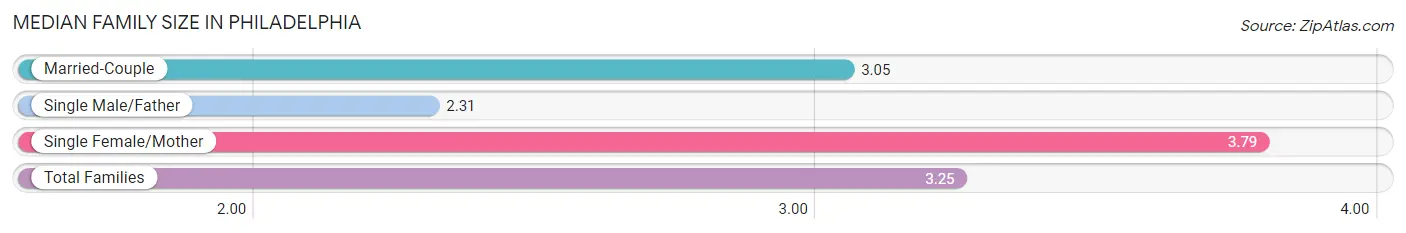
| Family Type | # Families | Family Size |
| Married-Couple | 912 (59.7%) | 3.05 |
| Single Male/Father | 100 (6.5%) | 2.31 |
| Single Female/Mother | 517 (33.8%) | 3.79 |
| Total Families | 1,529 (100.0%) | 3.25 |
Median Household Size in Philadelphia
The median household size in Philadelphia is 2.39 persons per household, with single female/mother households (517 | 18.2%) accounting for the largest median household size of 4.02 persons per household. non-family households (1,314 | 46.2%) represent the smallest median household size with 1.24 persons per household.
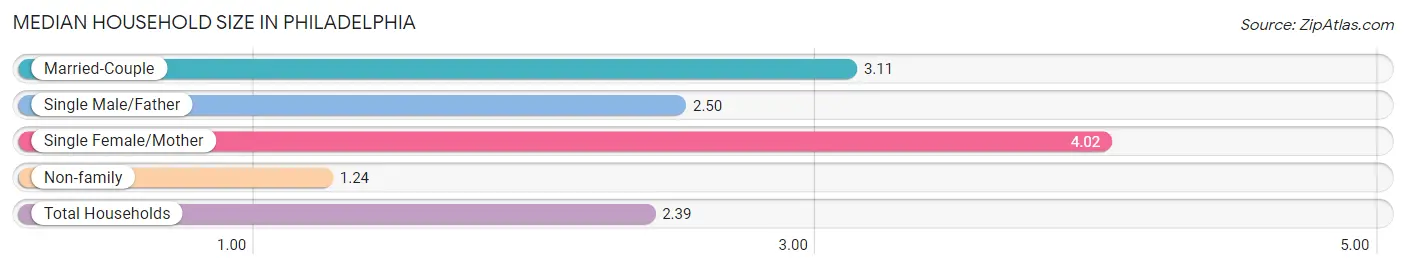
| Household Type | # Households | Household Size |
| Married-Couple | 912 (32.1%) | 3.11 |
| Single Male/Father | 100 (3.5%) | 2.50 |
| Single Female/Mother | 517 (18.2%) | 4.02 |
| Non-family | 1,314 (46.2%) | 1.24 |
| Total Households | 2,843 (100.0%) | 2.39 |
Household Size by Marriage Status in Philadelphia
Out of a total of 2,843 households in Philadelphia, 1,529 (53.8%) are family households, while 1,314 (46.2%) are nonfamily households. The most numerous type of family households are 2-person households, comprising 851, and the most common type of nonfamily households are 1-person households, comprising 1,150.
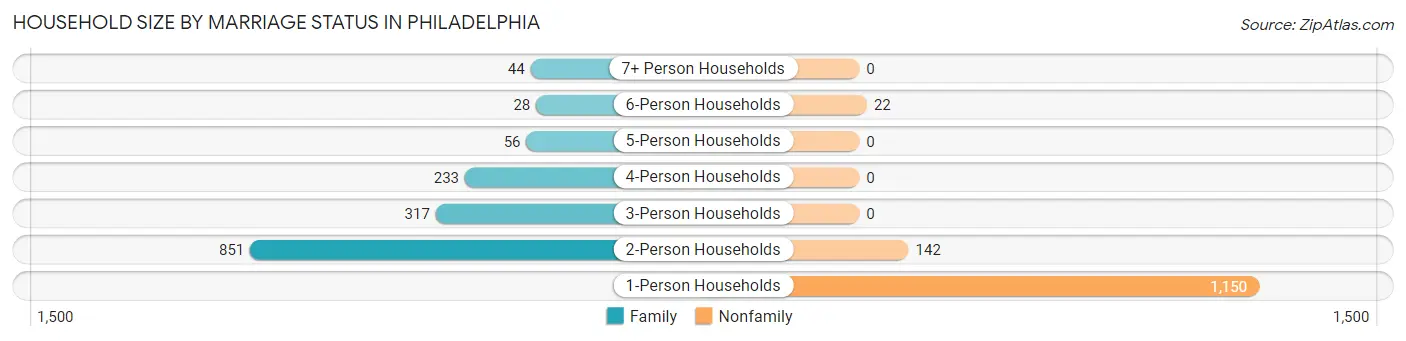
| Household Size | Family Households | Nonfamily Households |
| 1-Person Households | - | 1,150 (40.5%) |
| 2-Person Households | 851 (29.9%) | 142 (5.0%) |
| 3-Person Households | 317 (11.2%) | 0 (0.0%) |
| 4-Person Households | 233 (8.2%) | 0 (0.0%) |
| 5-Person Households | 56 (2.0%) | 0 (0.0%) |
| 6-Person Households | 28 (1.0%) | 22 (0.8%) |
| 7+ Person Households | 44 (1.5%) | 0 (0.0%) |
| Total | 1,529 (53.8%) | 1,314 (46.2%) |
Female Fertility in Philadelphia
Fertility by Age in Philadelphia
Average fertility rate in Philadelphia is 73.0 births per 1,000 women. Women in the age bracket of 20 to 34 years have the highest fertility rate with 138.0 births per 1,000 women. Women in the age bracket of 20 to 34 years acount for 64.2% of all women with births.
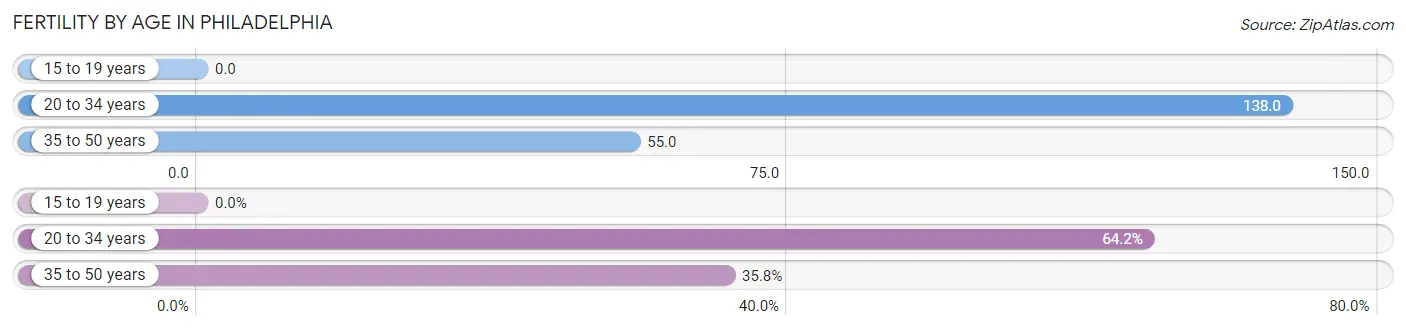
| Age Bracket | Women with Births | Births / 1,000 Women |
| 15 to 19 years | 0 (0.0%) | 0.0 |
| 20 to 34 years | 79 (64.2%) | 138.0 |
| 35 to 50 years | 44 (35.8%) | 55.0 |
| Total | 123 (100.0%) | 73.0 |
Fertility by Age by Marriage Status in Philadelphia
34.1% of women with births (123) in Philadelphia are married. The highest percentage of unmarried women with births falls into 35 to 50 years age bracket with 100.0% of them unmarried at the time of birth, while the lowest percentage of unmarried women with births belong to 20 to 34 years age bracket with 46.8% of them unmarried.
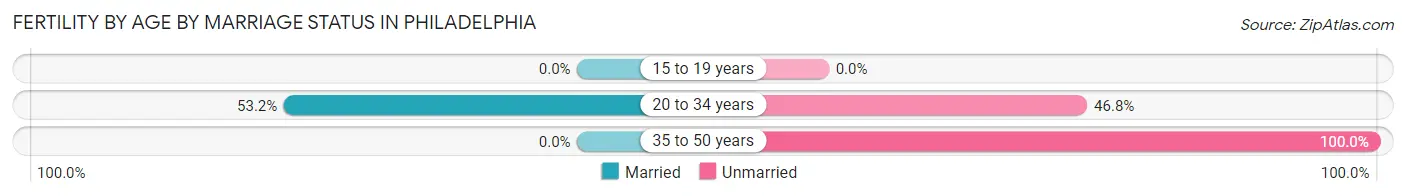
| Age Bracket | Married | Unmarried |
| 15 to 19 years | 0 (0.0%) | 0 (0.0%) |
| 20 to 34 years | 42 (53.2%) | 37 (46.8%) |
| 35 to 50 years | 0 (0.0%) | 44 (100.0%) |
| Total | 42 (34.2%) | 81 (65.8%) |
Fertility by Education in Philadelphia
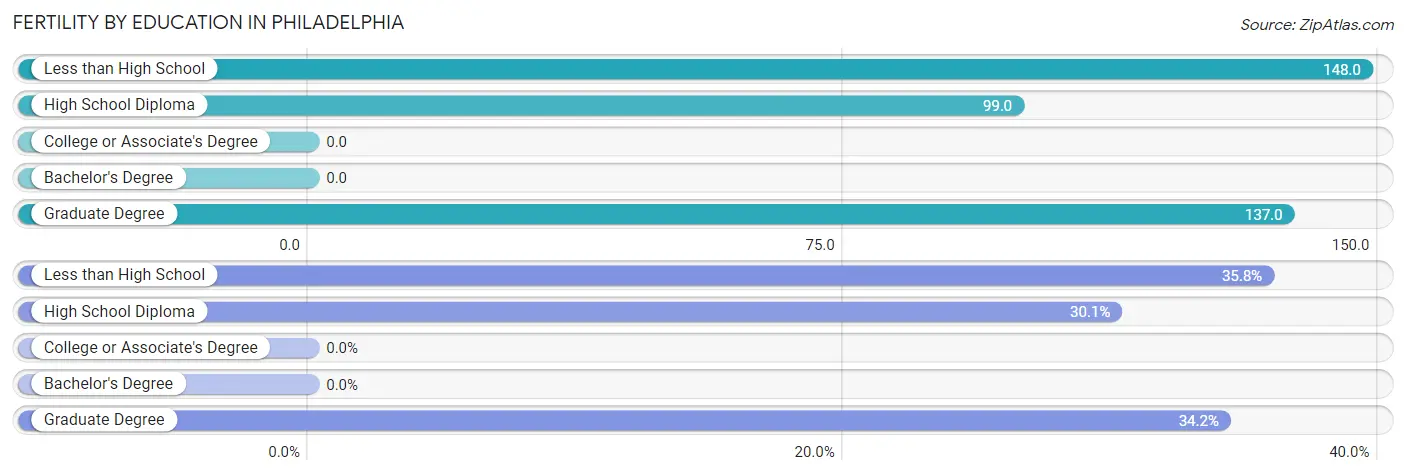
| Educational Attainment | Women with Births | Births / 1,000 Women |
| Less than High School | 44 (35.8%) | 148.0 |
| High School Diploma | 37 (30.1%) | 99.0 |
| College or Associate's Degree | 0 (0.0%) | 0.0 |
| Bachelor's Degree | 0 (0.0%) | 0.0 |
| Graduate Degree | 42 (34.2%) | 137.0 |
| Total | 123 (100.0%) | 73.0 |
Fertility by Education by Marriage Status in Philadelphia
65.8% of women with births in Philadelphia are unmarried. Women with the educational attainment of graduate degree are most likely to be married with 100.0% of them married at childbirth, while women with the educational attainment of less than high school are least likely to be married with 100.0% of them unmarried at childbirth.
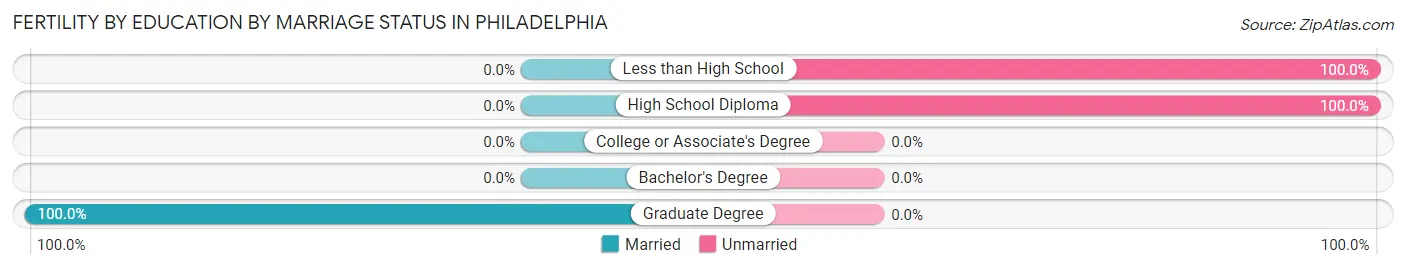
| Educational Attainment | Married | Unmarried |
| Less than High School | 0 (0.0%) | 44 (100.0%) |
| High School Diploma | 0 (0.0%) | 37 (100.0%) |
| College or Associate's Degree | 0 (0.0%) | 0 (0.0%) |
| Bachelor's Degree | 0 (0.0%) | 0 (0.0%) |
| Graduate Degree | 42 (100.0%) | 0 (0.0%) |
| Total | 42 (34.2%) | 81 (65.8%) |
Employment Characteristics in Philadelphia
Employment by Class of Employer in Philadelphia
Among the 2,652 employed individuals in Philadelphia, private company employees (1,786 | 67.3%), state government employees (289 | 10.9%), and not-for-profit organizations (143 | 5.4%) make up the most common classes of employment.
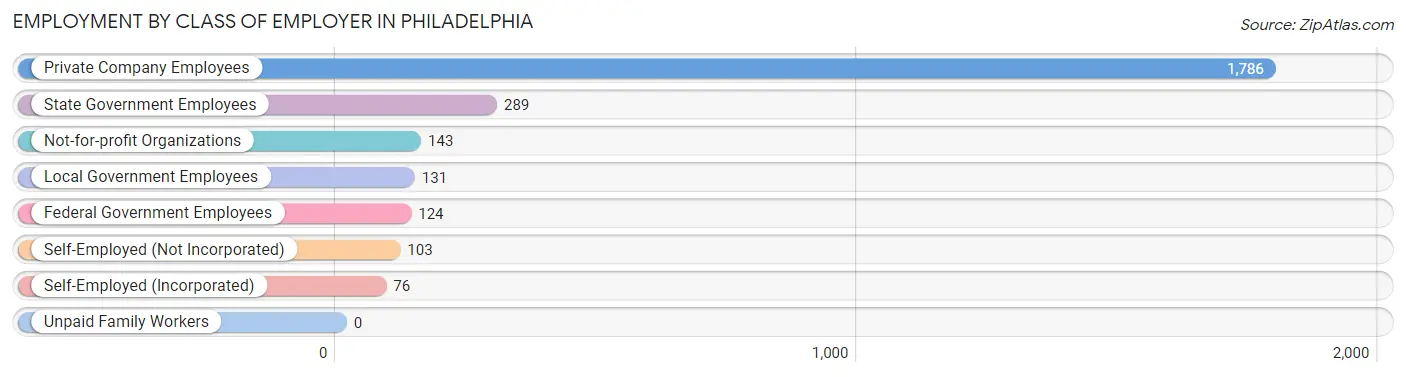
| Employer Class | # Employees | % Employees |
| Private Company Employees | 1,786 | 67.3% |
| Self-Employed (Incorporated) | 76 | 2.9% |
| Self-Employed (Not Incorporated) | 103 | 3.9% |
| Not-for-profit Organizations | 143 | 5.4% |
| Local Government Employees | 131 | 4.9% |
| State Government Employees | 289 | 10.9% |
| Federal Government Employees | 124 | 4.7% |
| Unpaid Family Workers | 0 | 0.0% |
| Total | 2,652 | 100.0% |
Employment Status by Age in Philadelphia
According to the labor force statistics for Philadelphia, out of the total population over 16 years of age (5,823), 52.6% or 3,063 individuals are in the labor force, with 10.5% or 322 of them unemployed. The age group with the highest labor force participation rate is 25 to 29 years, with 90.0% or 352 individuals in the labor force. Within the labor force, the 25 to 29 years age range has the highest percentage of unemployed individuals, with 35.1% or 124 of them being unemployed.
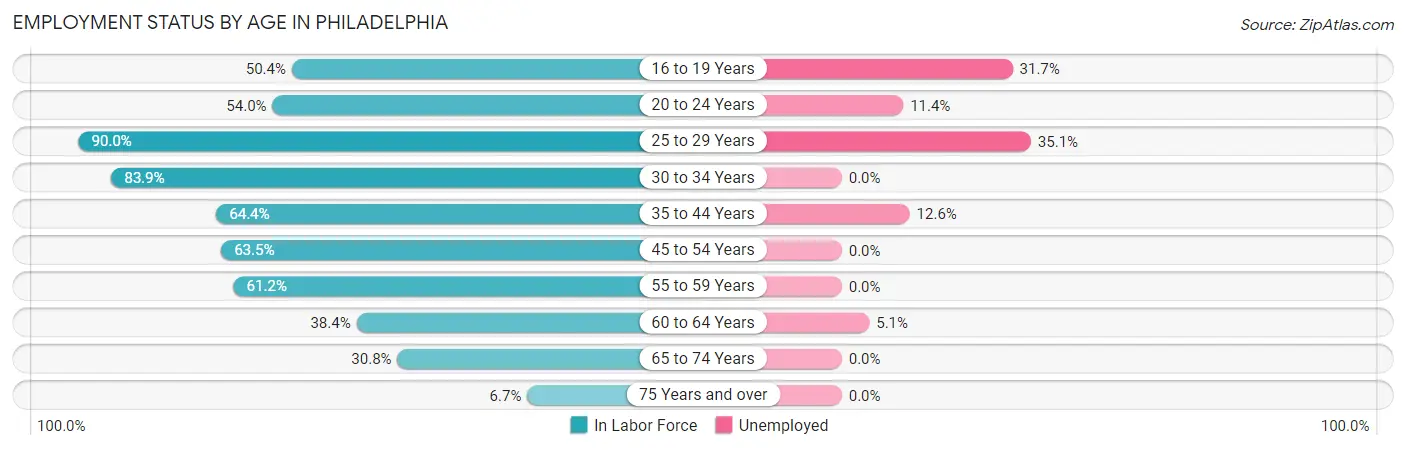
| Age Bracket | In Labor Force | Unemployed |
| 16 to 19 Years | 278 (50.4%) | 88 (31.7%) |
| 20 to 24 Years | 183 (54.0%) | 21 (11.4%) |
| 25 to 29 Years | 352 (90.0%) | 124 (35.1%) |
| 30 to 34 Years | 354 (83.9%) | 0 (0.0%) |
| 35 to 44 Years | 593 (64.4%) | 75 (12.6%) |
| 45 to 54 Years | 567 (63.5%) | 0 (0.0%) |
| 55 to 59 Years | 156 (61.2%) | 0 (0.0%) |
| 60 to 64 Years | 311 (38.4%) | 16 (5.1%) |
| 65 to 74 Years | 235 (30.8%) | 0 (0.0%) |
| 75 Years and over | 32 (6.7%) | 0 (0.0%) |
| Total | 3,063 (52.6%) | 322 (10.5%) |
Employment Status by Educational Attainment in Philadelphia
According to labor force statistics for Philadelphia, 63.2% of individuals (2,333) out of the total population between 25 and 64 years of age (3,691) are in the labor force, with 9.1% or 212 of them being unemployed. The group with the highest labor force participation rate are those with the educational attainment of bachelor's degree or higher, with 79.0% or 634 individuals in the labor force. Within the labor force, individuals with high school diploma education have the highest percentage of unemployment, with 23.6% or 189 of them being unemployed.
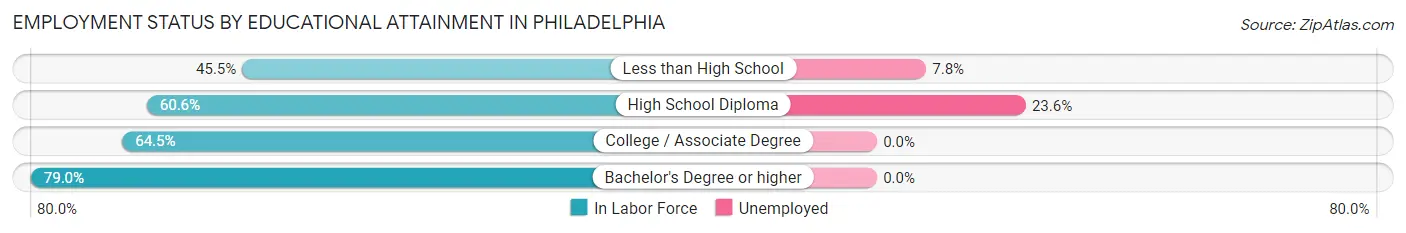
| Educational Attainment | In Labor Force | Unemployed |
| Less than High School | 269 (45.5%) | 46 (7.8%) |
| High School Diploma | 800 (60.6%) | 312 (23.6%) |
| College / Associate Degree | 630 (64.5%) | 0 (0.0%) |
| Bachelor's Degree or higher | 634 (79.0%) | 0 (0.0%) |
| Total | 2,333 (63.2%) | 336 (9.1%) |
Employment Occupations by Sex in Philadelphia
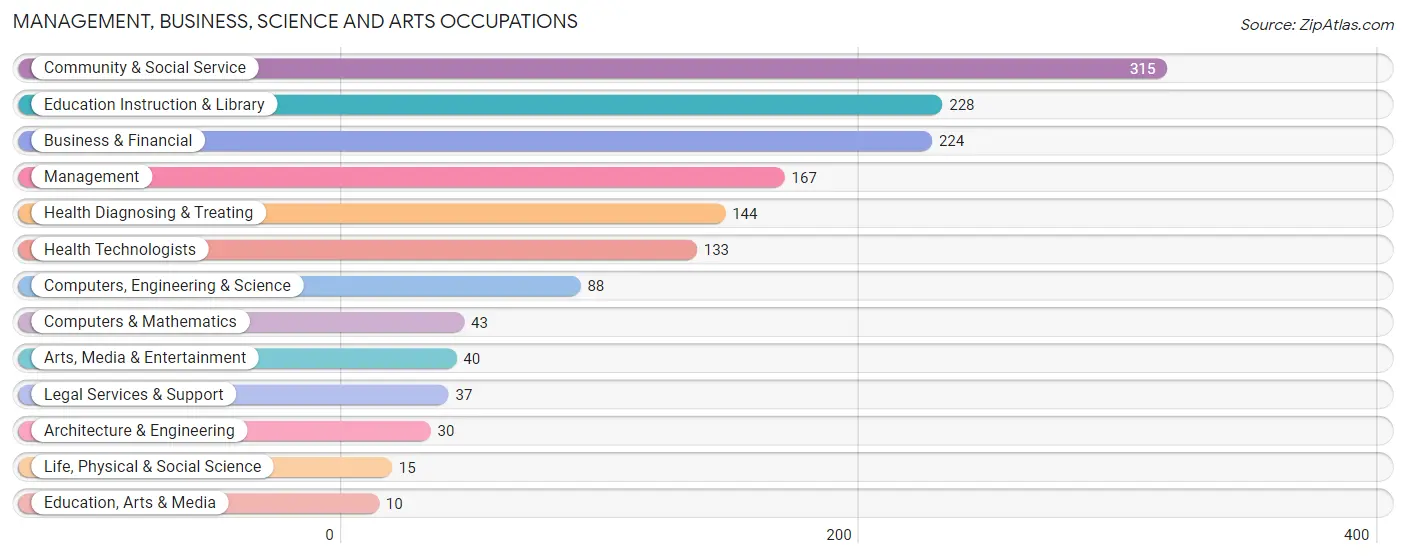
Management, Business, Science and Arts Occupations
The most common Management, Business, Science and Arts occupations in Philadelphia are Community & Social Service (315 | 11.7%), Education Instruction & Library (228 | 8.5%), Business & Financial (224 | 8.3%), Management (167 | 6.2%), and Health Diagnosing & Treating (144 | 5.3%).
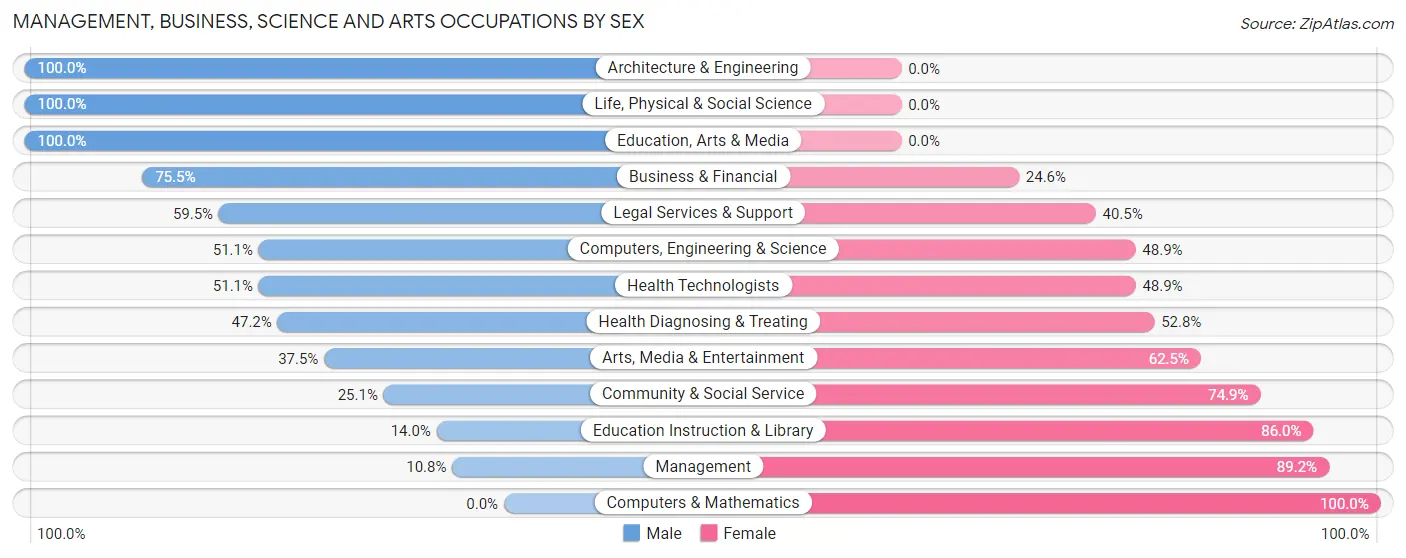
Management, Business, Science and Arts Occupations by Sex
Within the Management, Business, Science and Arts occupations in Philadelphia, the most male-oriented occupations are Architecture & Engineering (100.0%), Life, Physical & Social Science (100.0%), and Education, Arts & Media (100.0%), while the most female-oriented occupations are Computers & Mathematics (100.0%), Management (89.2%), and Education Instruction & Library (86.0%).
| Occupation | Male | Female |
| Management | 18 (10.8%) | 149 (89.2%) |
| Business & Financial | 169 (75.4%) | 55 (24.5%) |
| Computers, Engineering & Science | 45 (51.1%) | 43 (48.9%) |
| Computers & Mathematics | 0 (0.0%) | 43 (100.0%) |
| Architecture & Engineering | 30 (100.0%) | 0 (0.0%) |
| Life, Physical & Social Science | 15 (100.0%) | 0 (0.0%) |
| Community & Social Service | 79 (25.1%) | 236 (74.9%) |
| Education, Arts & Media | 10 (100.0%) | 0 (0.0%) |
| Legal Services & Support | 22 (59.5%) | 15 (40.5%) |
| Education Instruction & Library | 32 (14.0%) | 196 (86.0%) |
| Arts, Media & Entertainment | 15 (37.5%) | 25 (62.5%) |
| Health Diagnosing & Treating | 68 (47.2%) | 76 (52.8%) |
| Health Technologists | 68 (51.1%) | 65 (48.9%) |
| Total (Category) | 379 (40.4%) | 559 (59.6%) |
| Total (Overall) | 1,239 (46.0%) | 1,457 (54.0%) |
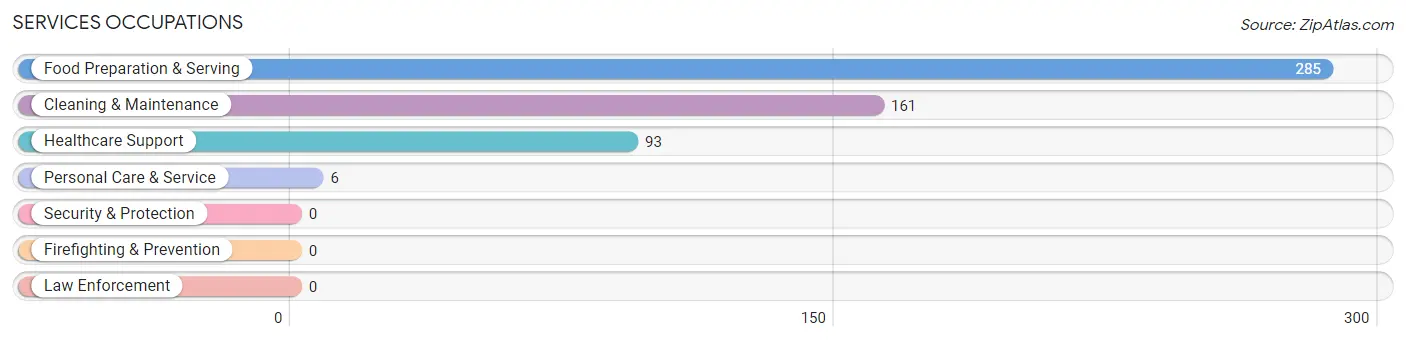
Services Occupations
The most common Services occupations in Philadelphia are Food Preparation & Serving (285 | 10.6%), Cleaning & Maintenance (161 | 6.0%), Healthcare Support (93 | 3.5%), and Personal Care & Service (6 | 0.2%).
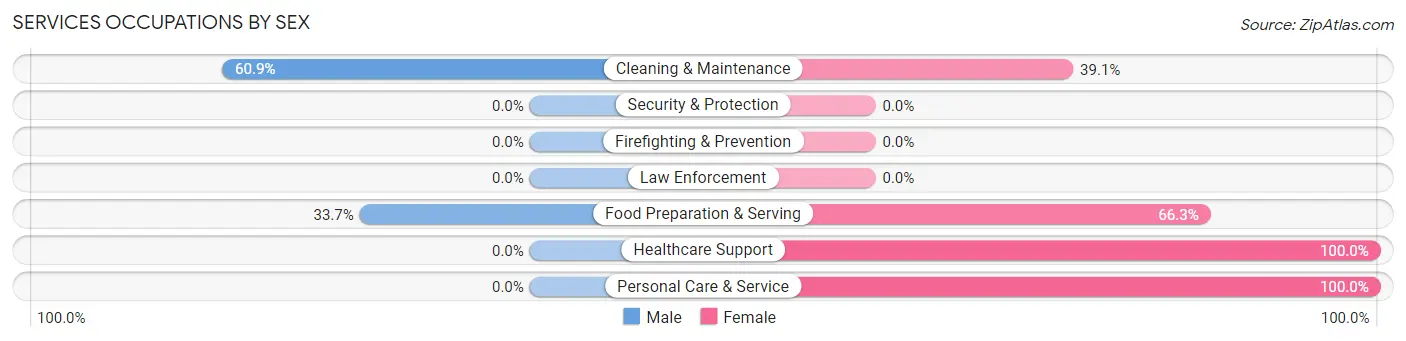
Services Occupations by Sex
Within the Services occupations in Philadelphia, the most male-oriented occupations are Cleaning & Maintenance (60.9%), and Food Preparation & Serving (33.7%), while the most female-oriented occupations are Healthcare Support (100.0%), Personal Care & Service (100.0%), and Food Preparation & Serving (66.3%).
| Occupation | Male | Female |
| Healthcare Support | 0 (0.0%) | 93 (100.0%) |
| Security & Protection | 0 (0.0%) | 0 (0.0%) |
| Firefighting & Prevention | 0 (0.0%) | 0 (0.0%) |
| Law Enforcement | 0 (0.0%) | 0 (0.0%) |
| Food Preparation & Serving | 96 (33.7%) | 189 (66.3%) |
| Cleaning & Maintenance | 98 (60.9%) | 63 (39.1%) |
| Personal Care & Service | 0 (0.0%) | 6 (100.0%) |
| Total (Category) | 194 (35.6%) | 351 (64.4%) |
| Total (Overall) | 1,239 (46.0%) | 1,457 (54.0%) |
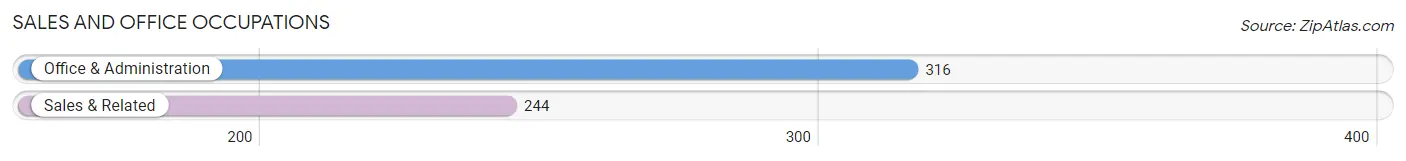
Sales and Office Occupations
The most common Sales and Office occupations in Philadelphia are Office & Administration (316 | 11.7%), and Sales & Related (244 | 9.0%).
Sales and Office Occupations by Sex
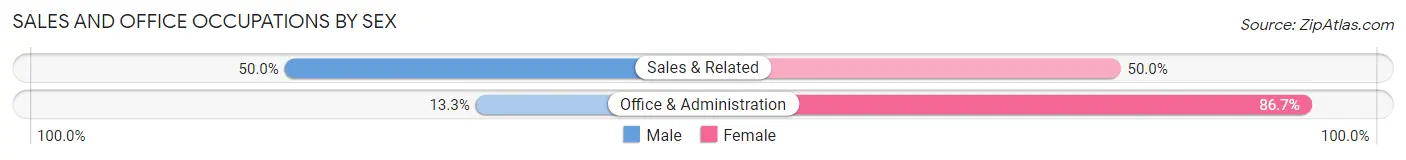
| Occupation | Male | Female |
| Sales & Related | 122 (50.0%) | 122 (50.0%) |
| Office & Administration | 42 (13.3%) | 274 (86.7%) |
| Total (Category) | 164 (29.3%) | 396 (70.7%) |
| Total (Overall) | 1,239 (46.0%) | 1,457 (54.0%) |
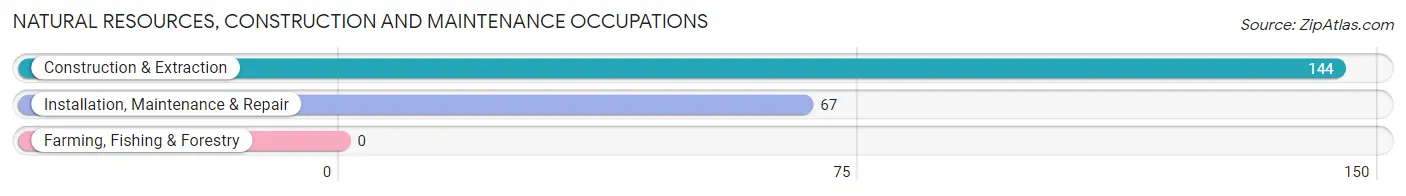
Natural Resources, Construction and Maintenance Occupations
The most common Natural Resources, Construction and Maintenance occupations in Philadelphia are Construction & Extraction (144 | 5.3%), and Installation, Maintenance & Repair (67 | 2.5%).
Natural Resources, Construction and Maintenance Occupations by Sex
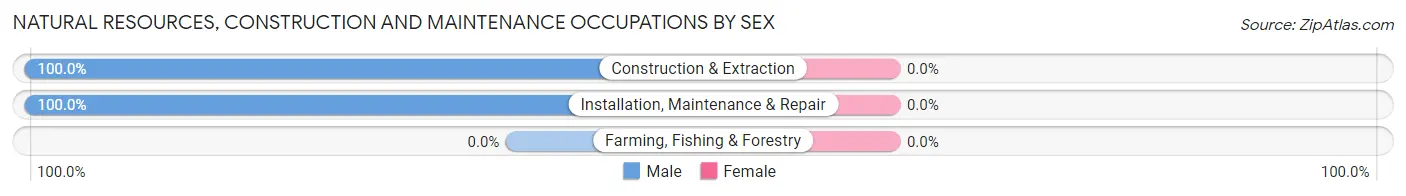
| Occupation | Male | Female |
| Farming, Fishing & Forestry | 0 (0.0%) | 0 (0.0%) |
| Construction & Extraction | 144 (100.0%) | 0 (0.0%) |
| Installation, Maintenance & Repair | 67 (100.0%) | 0 (0.0%) |
| Total (Category) | 211 (100.0%) | 0 (0.0%) |
| Total (Overall) | 1,239 (46.0%) | 1,457 (54.0%) |
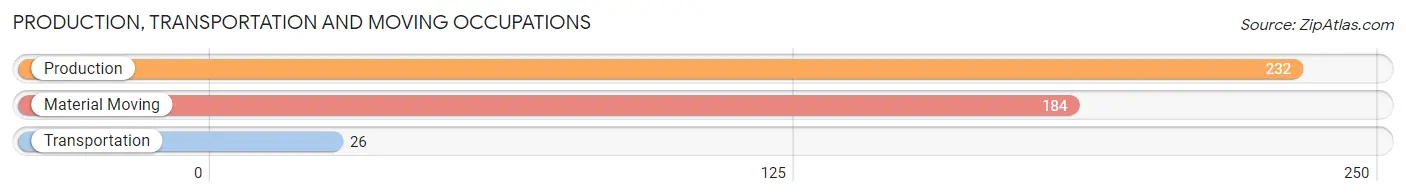
Production, Transportation and Moving Occupations
The most common Production, Transportation and Moving occupations in Philadelphia are Production (232 | 8.6%), Material Moving (184 | 6.8%), and Transportation (26 | 1.0%).
Production, Transportation and Moving Occupations by Sex
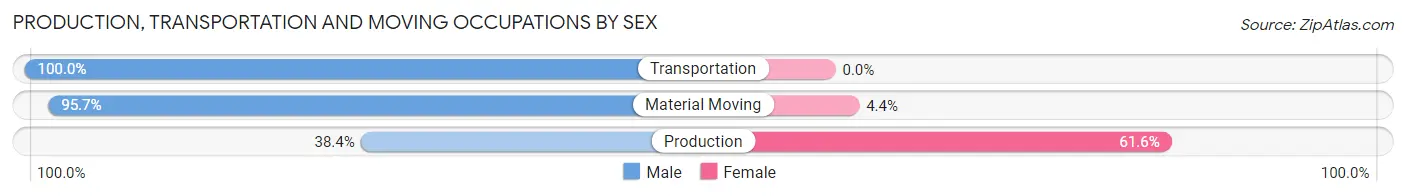
| Occupation | Male | Female |
| Production | 89 (38.4%) | 143 (61.6%) |
| Transportation | 26 (100.0%) | 0 (0.0%) |
| Material Moving | 176 (95.7%) | 8 (4.3%) |
| Total (Category) | 291 (65.8%) | 151 (34.2%) |
| Total (Overall) | 1,239 (46.0%) | 1,457 (54.0%) |
Employment Industries by Sex in Philadelphia
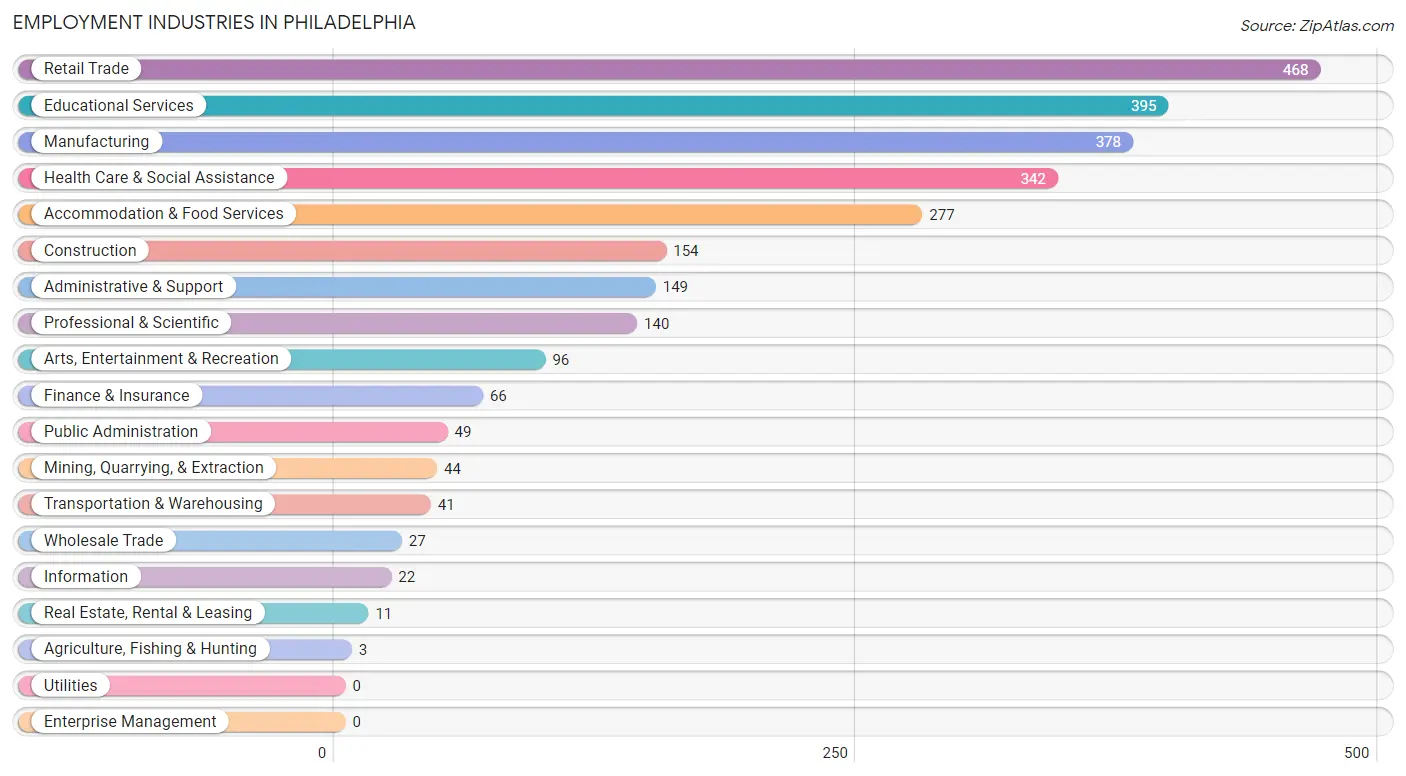
Employment Industries in Philadelphia
The major employment industries in Philadelphia include Retail Trade (468 | 17.4%), Educational Services (395 | 14.6%), Manufacturing (378 | 14.0%), Health Care & Social Assistance (342 | 12.7%), and Accommodation & Food Services (277 | 10.3%).
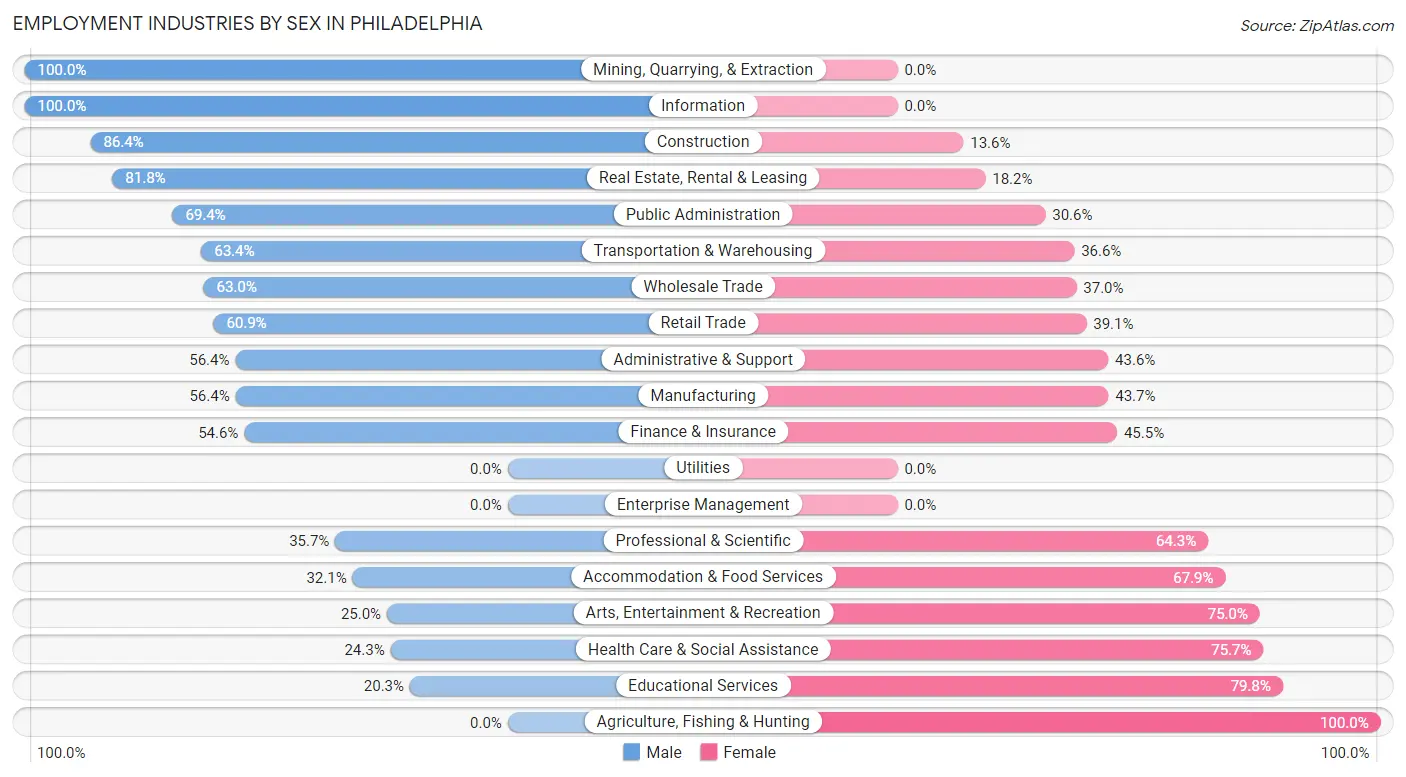
Employment Industries by Sex in Philadelphia
The Philadelphia industries that see more men than women are Mining, Quarrying, & Extraction (100.0%), Information (100.0%), and Construction (86.4%), whereas the industries that tend to have a higher number of women are Agriculture, Fishing & Hunting (100.0%), Educational Services (79.7%), and Health Care & Social Assistance (75.7%).
| Industry | Male | Female |
| Agriculture, Fishing & Hunting | 0 (0.0%) | 3 (100.0%) |
| Mining, Quarrying, & Extraction | 44 (100.0%) | 0 (0.0%) |
| Construction | 133 (86.4%) | 21 (13.6%) |
| Manufacturing | 213 (56.4%) | 165 (43.6%) |
| Wholesale Trade | 17 (63.0%) | 10 (37.0%) |
| Retail Trade | 285 (60.9%) | 183 (39.1%) |
| Transportation & Warehousing | 26 (63.4%) | 15 (36.6%) |
| Utilities | 0 (0.0%) | 0 (0.0%) |
| Information | 22 (100.0%) | 0 (0.0%) |
| Finance & Insurance | 36 (54.5%) | 30 (45.5%) |
| Real Estate, Rental & Leasing | 9 (81.8%) | 2 (18.2%) |
| Professional & Scientific | 50 (35.7%) | 90 (64.3%) |
| Enterprise Management | 0 (0.0%) | 0 (0.0%) |
| Administrative & Support | 84 (56.4%) | 65 (43.6%) |
| Educational Services | 80 (20.3%) | 315 (79.7%) |
| Health Care & Social Assistance | 83 (24.3%) | 259 (75.7%) |
| Arts, Entertainment & Recreation | 24 (25.0%) | 72 (75.0%) |
| Accommodation & Food Services | 89 (32.1%) | 188 (67.9%) |
| Public Administration | 34 (69.4%) | 15 (30.6%) |
| Total | 1,239 (46.0%) | 1,457 (54.0%) |
Education in Philadelphia
School Enrollment in Philadelphia
The most common levels of schooling among the 1,547 students in Philadelphia are high school (511 | 33.0%), middle school (369 | 23.8%), and elementary school (315 | 20.4%).
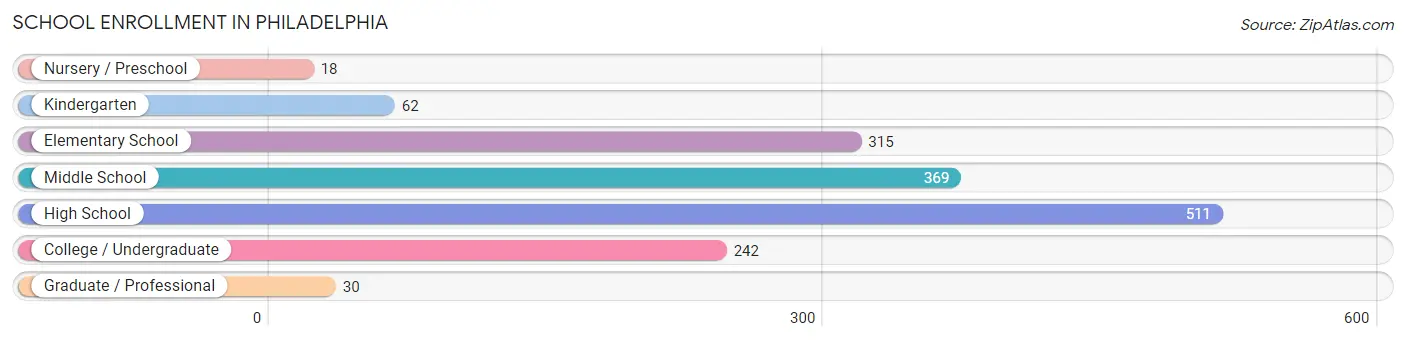
| School Level | # Students | % Students |
| Nursery / Preschool | 18 | 1.2% |
| Kindergarten | 62 | 4.0% |
| Elementary School | 315 | 20.4% |
| Middle School | 369 | 23.8% |
| High School | 511 | 33.0% |
| College / Undergraduate | 242 | 15.6% |
| Graduate / Professional | 30 | 1.9% |
| Total | 1,547 | 100.0% |
School Enrollment by Age by Funding Source in Philadelphia
Out of a total of 1,547 students who are enrolled in schools in Philadelphia, 107 (6.9%) attend a private institution, while the remaining 1,440 (93.1%) are enrolled in public schools. The age group of 35 years and over has the highest likelihood of being enrolled in private schools, with 16 (36.4% in the age bracket) enrolled. Conversely, the age group of 3 to 4 year olds has the lowest likelihood of being enrolled in a private school, with 6 (100.0% in the age bracket) attending a public institution.
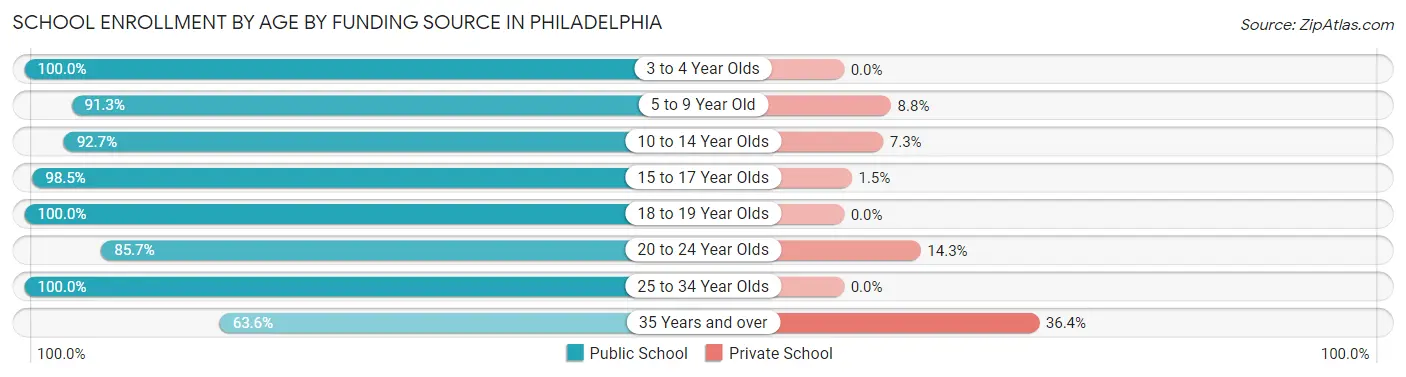
| Age Bracket | Public School | Private School |
| 3 to 4 Year Olds | 6 (100.0%) | 0 (0.0%) |
| 5 to 9 Year Old | 313 (91.2%) | 30 (8.7%) |
| 10 to 14 Year Olds | 432 (92.7%) | 34 (7.3%) |
| 15 to 17 Year Olds | 337 (98.5%) | 5 (1.5%) |
| 18 to 19 Year Olds | 173 (100.0%) | 0 (0.0%) |
| 20 to 24 Year Olds | 132 (85.7%) | 22 (14.3%) |
| 25 to 34 Year Olds | 19 (100.0%) | 0 (0.0%) |
| 35 Years and over | 28 (63.6%) | 16 (36.4%) |
| Total | 1,440 (93.1%) | 107 (6.9%) |
Educational Attainment by Field of Study in Philadelphia
Business (344 | 28.4%), education (285 | 23.5%), science & technology (251 | 20.7%), liberal arts & history (104 | 8.6%), and engineering (74 | 6.1%) are the most common fields of study among 1,213 individuals in Philadelphia who have obtained a bachelor's degree or higher.
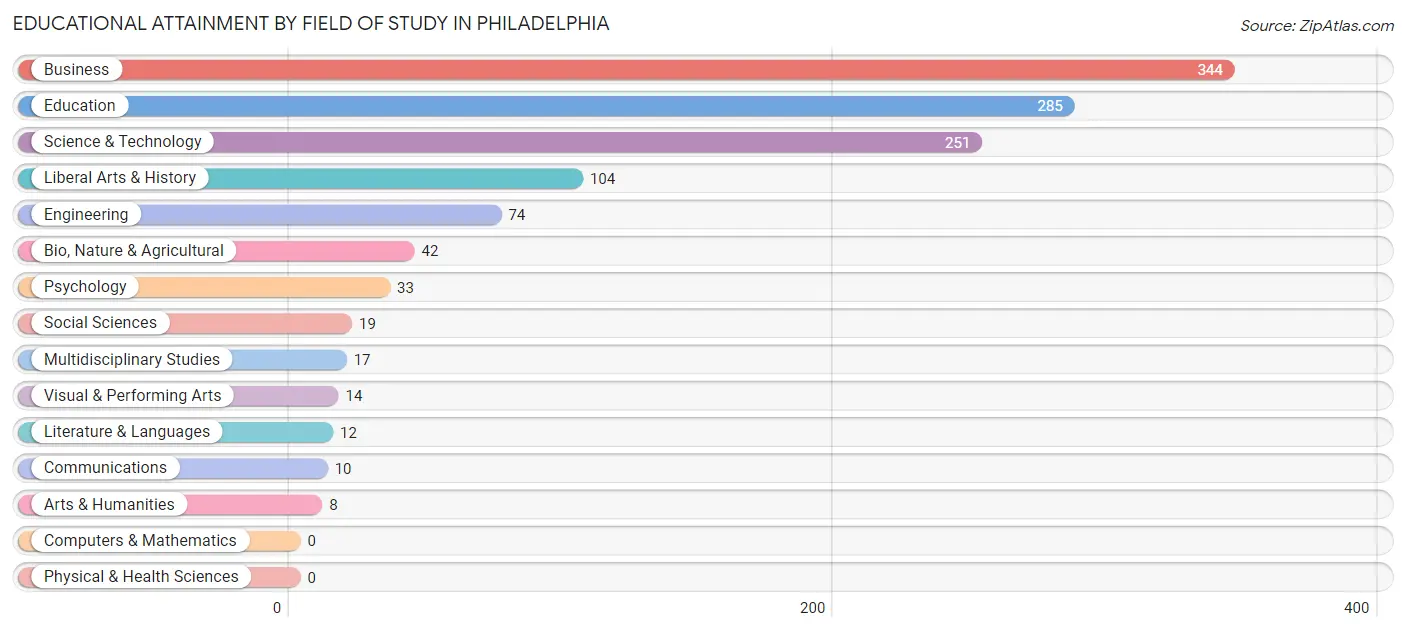
| Field of Study | # Graduates | % Graduates |
| Computers & Mathematics | 0 | 0.0% |
| Bio, Nature & Agricultural | 42 | 3.5% |
| Physical & Health Sciences | 0 | 0.0% |
| Psychology | 33 | 2.7% |
| Social Sciences | 19 | 1.6% |
| Engineering | 74 | 6.1% |
| Multidisciplinary Studies | 17 | 1.4% |
| Science & Technology | 251 | 20.7% |
| Business | 344 | 28.4% |
| Education | 285 | 23.5% |
| Literature & Languages | 12 | 1.0% |
| Liberal Arts & History | 104 | 8.6% |
| Visual & Performing Arts | 14 | 1.1% |
| Communications | 10 | 0.8% |
| Arts & Humanities | 8 | 0.7% |
| Total | 1,213 | 100.0% |
Transportation & Commute in Philadelphia
Vehicle Availability by Sex in Philadelphia
The most prevalent vehicle ownership categories in Philadelphia are males with 2 vehicles (464, accounting for 36.4%) and females with 2 vehicles (520, making up 33.7%).
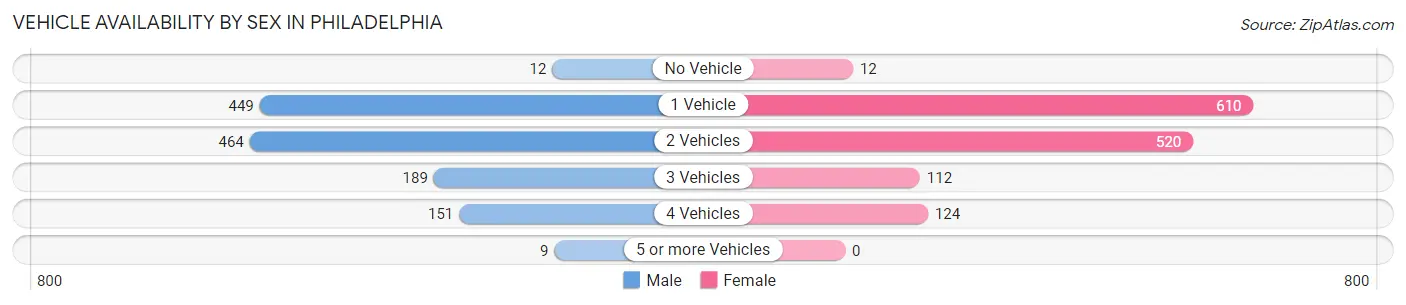
| Vehicles Available | Male | Female |
| No Vehicle | 12 (0.9%) | 12 (0.9%) |
| 1 Vehicle | 449 (35.2%) | 610 (44.3%) |
| 2 Vehicles | 464 (36.4%) | 520 (37.7%) |
| 3 Vehicles | 189 (14.8%) | 112 (8.1%) |
| 4 Vehicles | 151 (11.8%) | 124 (9.0%) |
| 5 or more Vehicles | 9 (0.7%) | 0 (0.0%) |
| Total | 1,274 (100.0%) | 1,378 (100.0%) |
Commute Time in Philadelphia
The most frequently occuring commute durations in Philadelphia are 5 to 9 minutes (982 commuters, 39.1%), less than 5 minutes (264 commuters, 10.5%), and 45 to 59 minutes (252 commuters, 10.0%).
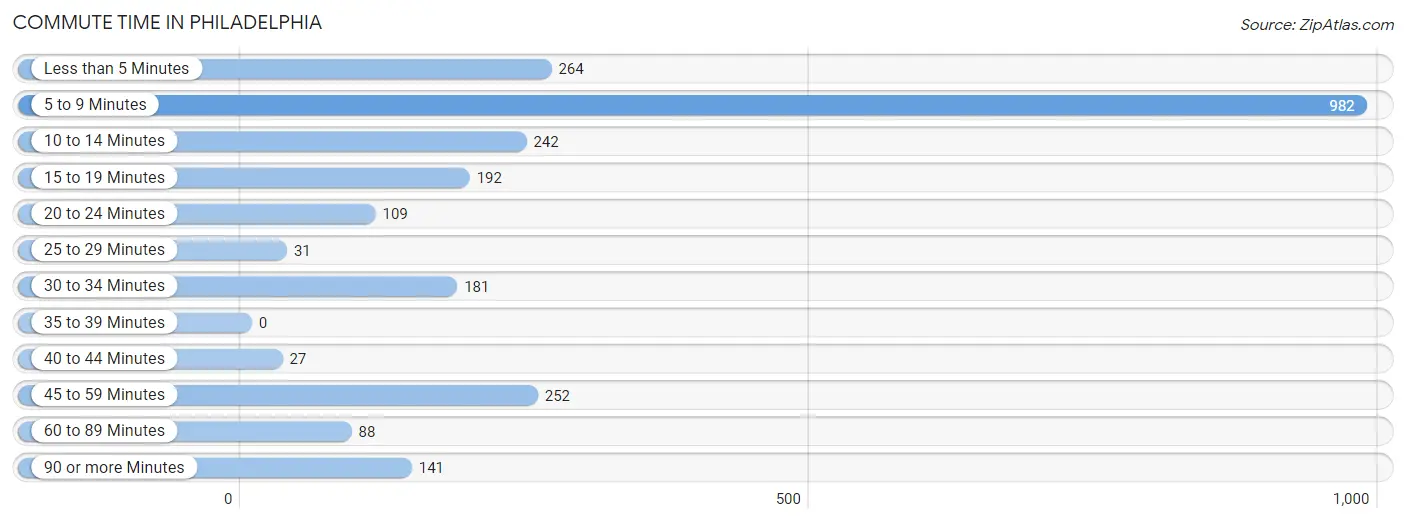
| Commute Time | # Commuters | % Commuters |
| Less than 5 Minutes | 264 | 10.5% |
| 5 to 9 Minutes | 982 | 39.1% |
| 10 to 14 Minutes | 242 | 9.7% |
| 15 to 19 Minutes | 192 | 7.6% |
| 20 to 24 Minutes | 109 | 4.3% |
| 25 to 29 Minutes | 31 | 1.2% |
| 30 to 34 Minutes | 181 | 7.2% |
| 35 to 39 Minutes | 0 | 0.0% |
| 40 to 44 Minutes | 27 | 1.1% |
| 45 to 59 Minutes | 252 | 10.0% |
| 60 to 89 Minutes | 88 | 3.5% |
| 90 or more Minutes | 141 | 5.6% |
Commute Time by Sex in Philadelphia
The most common commute times in Philadelphia are 5 to 9 minutes (369 commuters, 30.5%) for males and 5 to 9 minutes (613 commuters, 47.1%) for females.
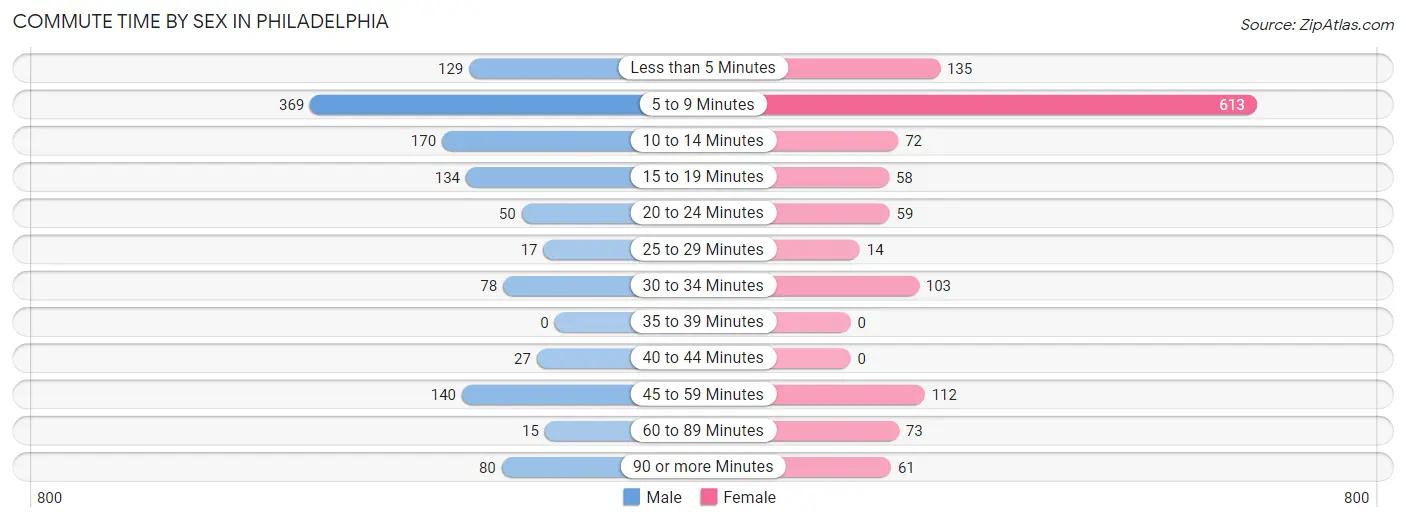
| Commute Time | Male | Female |
| Less than 5 Minutes | 129 (10.7%) | 135 (10.4%) |
| 5 to 9 Minutes | 369 (30.5%) | 613 (47.1%) |
| 10 to 14 Minutes | 170 (14.1%) | 72 (5.5%) |
| 15 to 19 Minutes | 134 (11.1%) | 58 (4.5%) |
| 20 to 24 Minutes | 50 (4.1%) | 59 (4.5%) |
| 25 to 29 Minutes | 17 (1.4%) | 14 (1.1%) |
| 30 to 34 Minutes | 78 (6.5%) | 103 (7.9%) |
| 35 to 39 Minutes | 0 (0.0%) | 0 (0.0%) |
| 40 to 44 Minutes | 27 (2.2%) | 0 (0.0%) |
| 45 to 59 Minutes | 140 (11.6%) | 112 (8.6%) |
| 60 to 89 Minutes | 15 (1.2%) | 73 (5.6%) |
| 90 or more Minutes | 80 (6.6%) | 61 (4.7%) |
Time of Departure to Work by Sex in Philadelphia
The most frequent times of departure to work in Philadelphia are 6:30 AM to 6:59 AM (219, 18.1%) for males and 7:30 AM to 7:59 AM (310, 23.8%) for females.
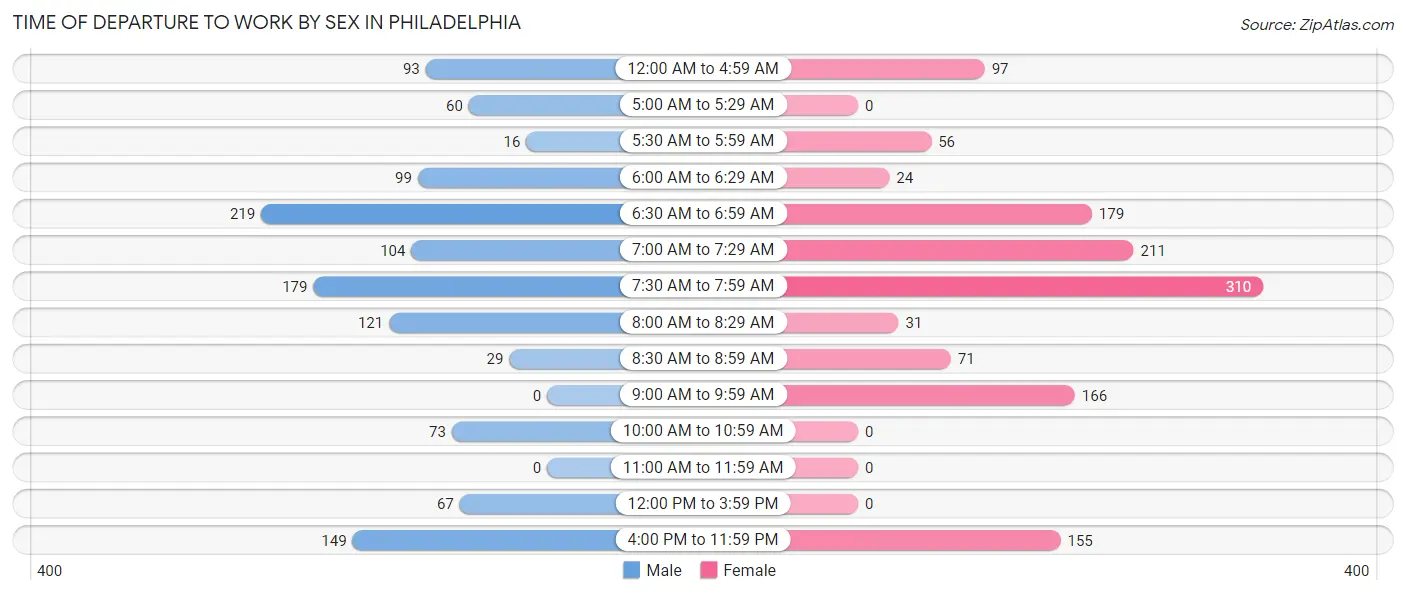
| Time of Departure | Male | Female |
| 12:00 AM to 4:59 AM | 93 (7.7%) | 97 (7.5%) |
| 5:00 AM to 5:29 AM | 60 (5.0%) | 0 (0.0%) |
| 5:30 AM to 5:59 AM | 16 (1.3%) | 56 (4.3%) |
| 6:00 AM to 6:29 AM | 99 (8.2%) | 24 (1.8%) |
| 6:30 AM to 6:59 AM | 219 (18.1%) | 179 (13.8%) |
| 7:00 AM to 7:29 AM | 104 (8.6%) | 211 (16.2%) |
| 7:30 AM to 7:59 AM | 179 (14.8%) | 310 (23.8%) |
| 8:00 AM to 8:29 AM | 121 (10.0%) | 31 (2.4%) |
| 8:30 AM to 8:59 AM | 29 (2.4%) | 71 (5.5%) |
| 9:00 AM to 9:59 AM | 0 (0.0%) | 166 (12.8%) |
| 10:00 AM to 10:59 AM | 73 (6.0%) | 0 (0.0%) |
| 11:00 AM to 11:59 AM | 0 (0.0%) | 0 (0.0%) |
| 12:00 PM to 3:59 PM | 67 (5.5%) | 0 (0.0%) |
| 4:00 PM to 11:59 PM | 149 (12.3%) | 155 (11.9%) |
| Total | 1,209 (100.0%) | 1,300 (100.0%) |
Housing Occupancy in Philadelphia
Occupancy by Ownership in Philadelphia
Of the total 2,843 dwellings in Philadelphia, owner-occupied units account for 1,726 (60.7%), while renter-occupied units make up 1,117 (39.3%).
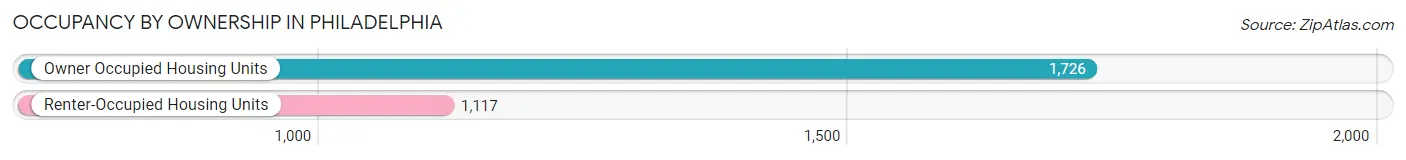
| Occupancy | # Housing Units | % Housing Units |
| Owner Occupied Housing Units | 1,726 | 60.7% |
| Renter-Occupied Housing Units | 1,117 | 39.3% |
| Total Occupied Housing Units | 2,843 | 100.0% |
Occupancy by Household Size in Philadelphia
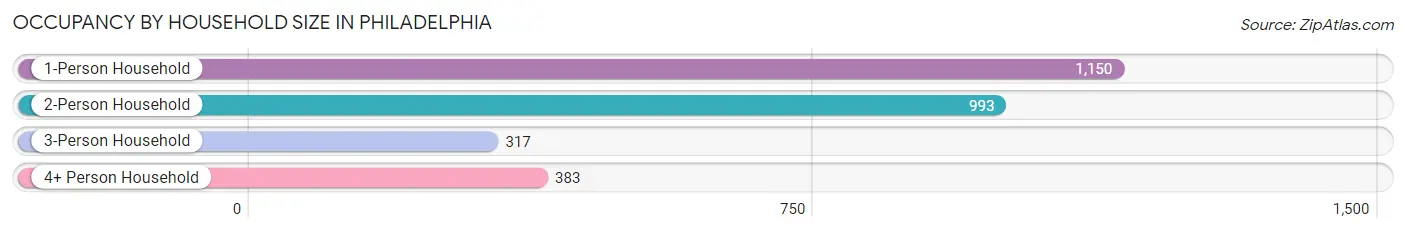
| Household Size | # Housing Units | % Housing Units |
| 1-Person Household | 1,150 | 40.5% |
| 2-Person Household | 993 | 34.9% |
| 3-Person Household | 317 | 11.2% |
| 4+ Person Household | 383 | 13.5% |
| Total Housing Units | 2,843 | 100.0% |
Occupancy by Ownership by Household Size in Philadelphia
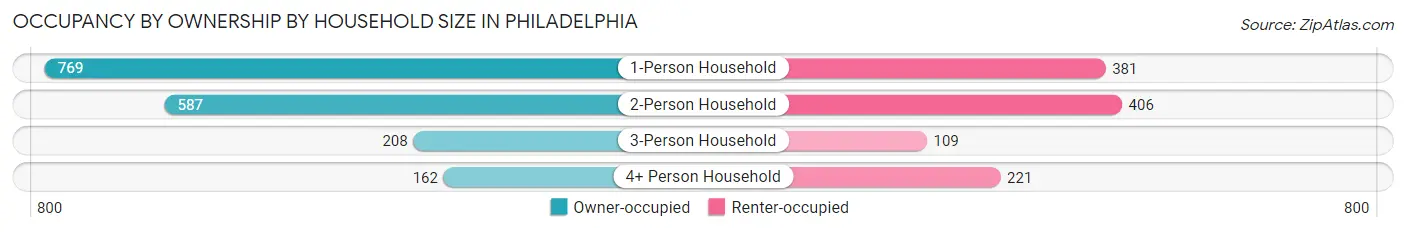
| Household Size | Owner-occupied | Renter-occupied |
| 1-Person Household | 769 (66.9%) | 381 (33.1%) |
| 2-Person Household | 587 (59.1%) | 406 (40.9%) |
| 3-Person Household | 208 (65.6%) | 109 (34.4%) |
| 4+ Person Household | 162 (42.3%) | 221 (57.7%) |
| Total Housing Units | 1,726 (60.7%) | 1,117 (39.3%) |
Occupancy by Educational Attainment in Philadelphia
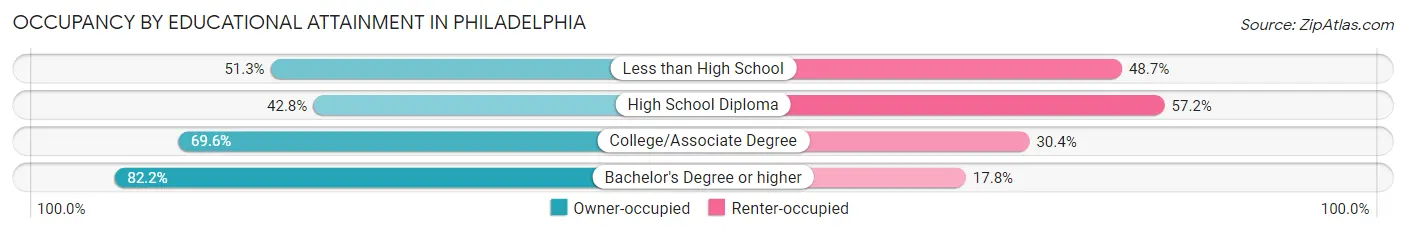
| Household Size | Owner-occupied | Renter-occupied |
| Less than High School | 204 (51.3%) | 194 (48.7%) |
| High School Diploma | 440 (42.8%) | 588 (57.2%) |
| College/Associate Degree | 458 (69.6%) | 200 (30.4%) |
| Bachelor's Degree or higher | 624 (82.2%) | 135 (17.8%) |
Occupancy by Age of Householder in Philadelphia
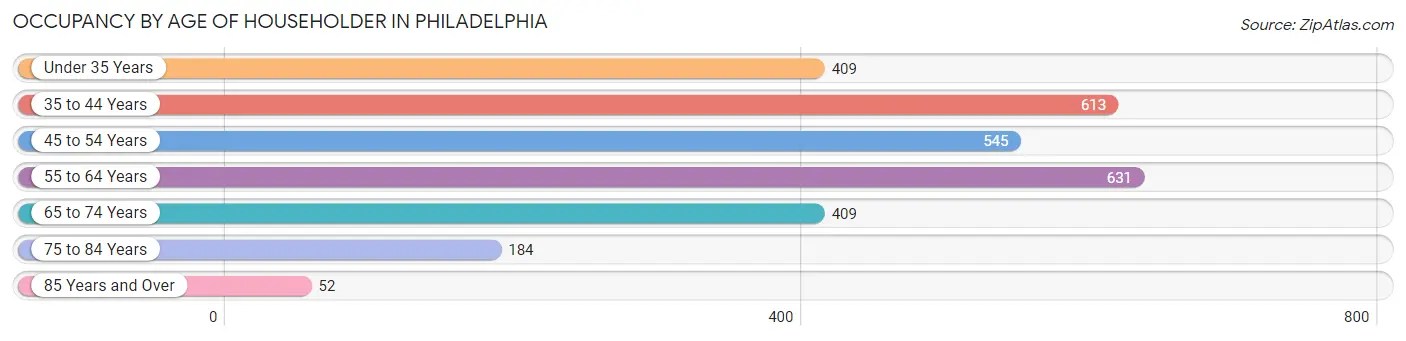
| Age Bracket | # Households | % Households |
| Under 35 Years | 409 | 14.4% |
| 35 to 44 Years | 613 | 21.6% |
| 45 to 54 Years | 545 | 19.2% |
| 55 to 64 Years | 631 | 22.2% |
| 65 to 74 Years | 409 | 14.4% |
| 75 to 84 Years | 184 | 6.5% |
| 85 Years and Over | 52 | 1.8% |
| Total | 2,843 | 100.0% |
Housing Finances in Philadelphia
Median Income by Occupancy in Philadelphia
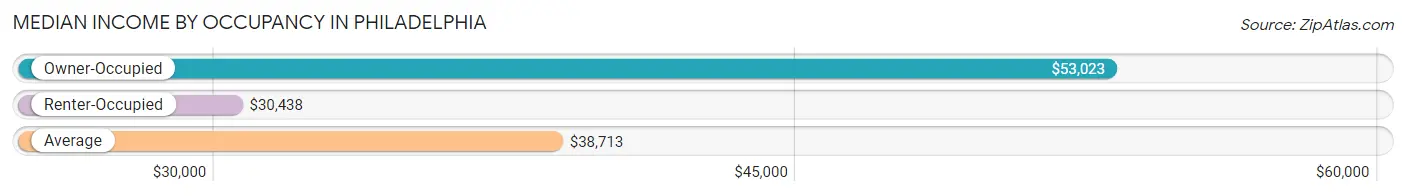
| Occupancy Type | # Households | Median Income |
| Owner-Occupied | 1,726 (60.7%) | $53,023 |
| Renter-Occupied | 1,117 (39.3%) | $30,438 |
| Average | 2,843 (100.0%) | $38,713 |
Occupancy by Householder Income Bracket in Philadelphia
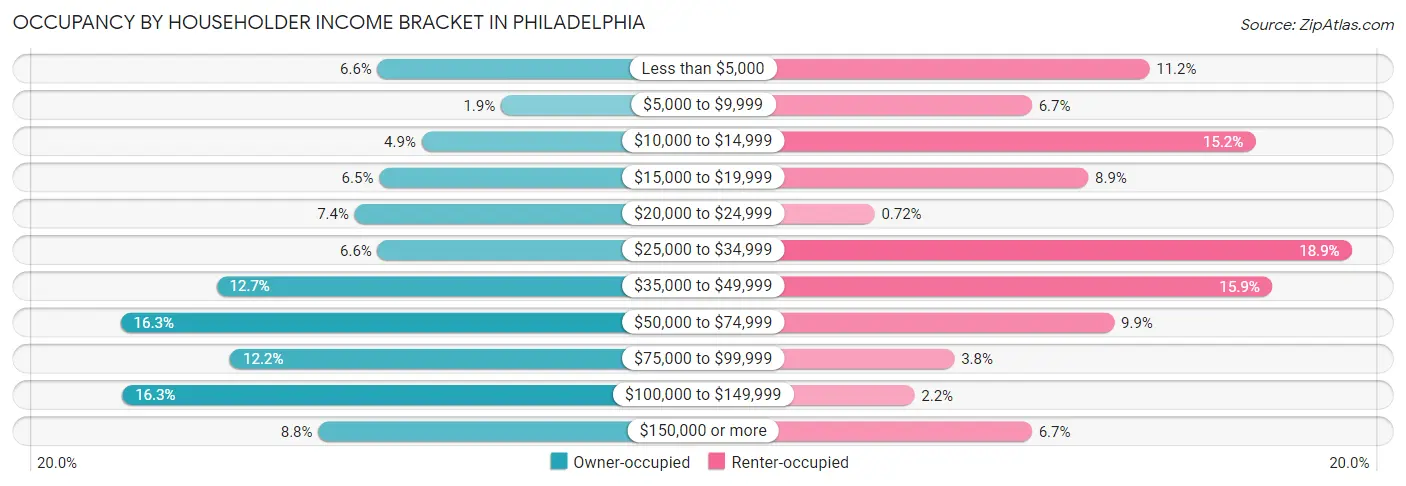
| Income Bracket | Owner-occupied | Renter-occupied |
| Less than $5,000 | 113 (6.6%) | 125 (11.2%) |
| $5,000 to $9,999 | 32 (1.8%) | 75 (6.7%) |
| $10,000 to $14,999 | 84 (4.9%) | 170 (15.2%) |
| $15,000 to $19,999 | 112 (6.5%) | 99 (8.9%) |
| $20,000 to $24,999 | 128 (7.4%) | 8 (0.7%) |
| $25,000 to $34,999 | 113 (6.6%) | 211 (18.9%) |
| $35,000 to $49,999 | 219 (12.7%) | 177 (15.9%) |
| $50,000 to $74,999 | 282 (16.3%) | 110 (9.9%) |
| $75,000 to $99,999 | 210 (12.2%) | 42 (3.8%) |
| $100,000 to $149,999 | 281 (16.3%) | 25 (2.2%) |
| $150,000 or more | 152 (8.8%) | 75 (6.7%) |
| Total | 1,726 (100.0%) | 1,117 (100.0%) |
Monthly Housing Cost Tiers in Philadelphia
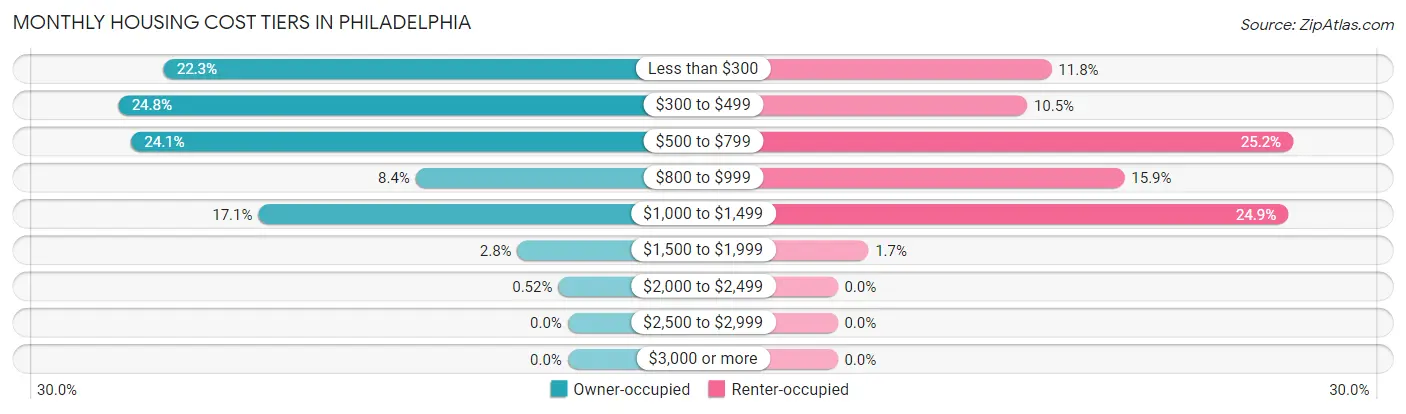
| Monthly Cost | Owner-occupied | Renter-occupied |
| Less than $300 | 385 (22.3%) | 132 (11.8%) |
| $300 to $499 | 428 (24.8%) | 117 (10.5%) |
| $500 to $799 | 416 (24.1%) | 281 (25.2%) |
| $800 to $999 | 145 (8.4%) | 177 (15.9%) |
| $1,000 to $1,499 | 295 (17.1%) | 278 (24.9%) |
| $1,500 to $1,999 | 48 (2.8%) | 19 (1.7%) |
| $2,000 to $2,499 | 9 (0.5%) | 0 (0.0%) |
| $2,500 to $2,999 | 0 (0.0%) | 0 (0.0%) |
| $3,000 or more | 0 (0.0%) | 0 (0.0%) |
| Total | 1,726 (100.0%) | 1,117 (100.0%) |
Physical Housing Characteristics in Philadelphia
Housing Structures in Philadelphia
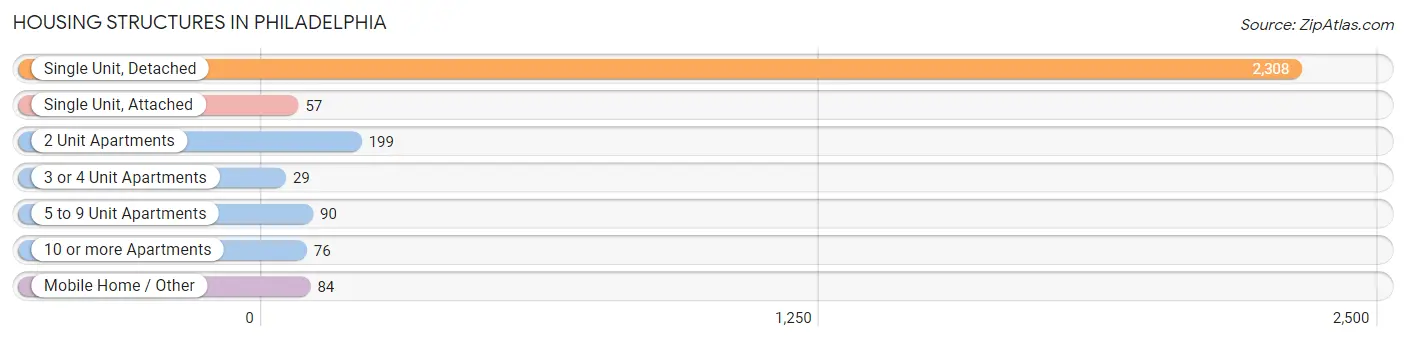
| Structure Type | # Housing Units | % Housing Units |
| Single Unit, Detached | 2,308 | 81.2% |
| Single Unit, Attached | 57 | 2.0% |
| 2 Unit Apartments | 199 | 7.0% |
| 3 or 4 Unit Apartments | 29 | 1.0% |
| 5 to 9 Unit Apartments | 90 | 3.2% |
| 10 or more Apartments | 76 | 2.7% |
| Mobile Home / Other | 84 | 2.9% |
| Total | 2,843 | 100.0% |
Housing Structures by Occupancy in Philadelphia
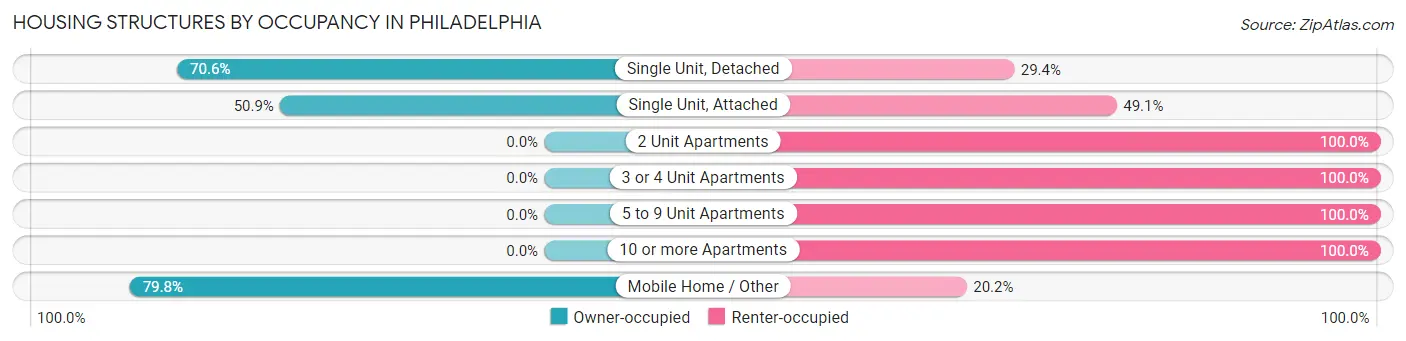
| Structure Type | Owner-occupied | Renter-occupied |
| Single Unit, Detached | 1,630 (70.6%) | 678 (29.4%) |
| Single Unit, Attached | 29 (50.9%) | 28 (49.1%) |
| 2 Unit Apartments | 0 (0.0%) | 199 (100.0%) |
| 3 or 4 Unit Apartments | 0 (0.0%) | 29 (100.0%) |
| 5 to 9 Unit Apartments | 0 (0.0%) | 90 (100.0%) |
| 10 or more Apartments | 0 (0.0%) | 76 (100.0%) |
| Mobile Home / Other | 67 (79.8%) | 17 (20.2%) |
| Total | 1,726 (60.7%) | 1,117 (39.3%) |
Housing Structures by Number of Rooms in Philadelphia
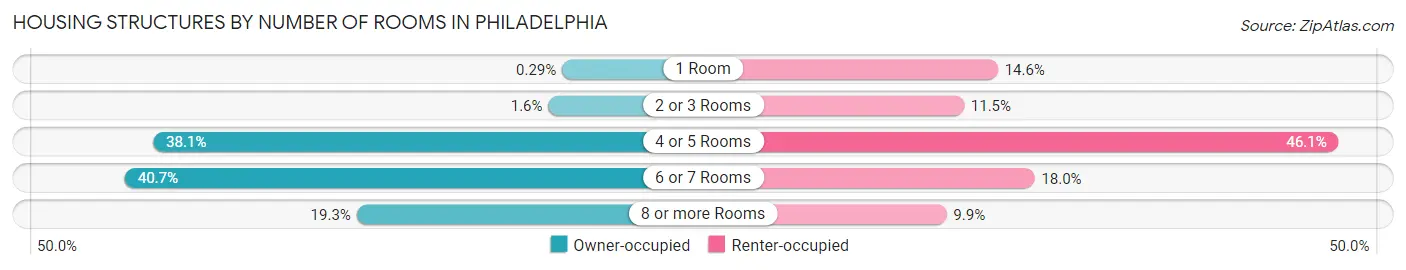
| Number of Rooms | Owner-occupied | Renter-occupied |
| 1 Room | 5 (0.3%) | 163 (14.6%) |
| 2 or 3 Rooms | 27 (1.6%) | 128 (11.5%) |
| 4 or 5 Rooms | 658 (38.1%) | 515 (46.1%) |
| 6 or 7 Rooms | 703 (40.7%) | 201 (18.0%) |
| 8 or more Rooms | 333 (19.3%) | 110 (9.9%) |
| Total | 1,726 (100.0%) | 1,117 (100.0%) |
Housing Structure by Heating Type in Philadelphia
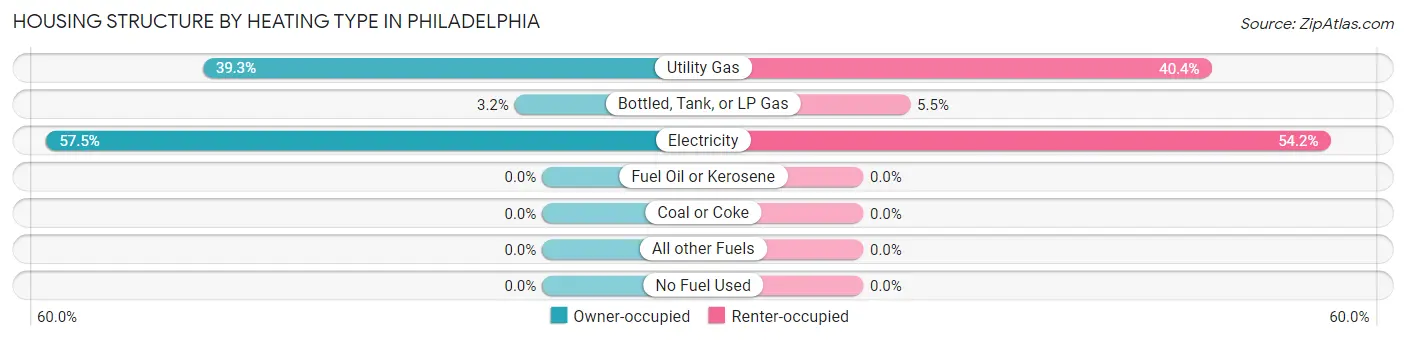
| Heating Type | Owner-occupied | Renter-occupied |
| Utility Gas | 679 (39.3%) | 451 (40.4%) |
| Bottled, Tank, or LP Gas | 55 (3.2%) | 61 (5.5%) |
| Electricity | 992 (57.5%) | 605 (54.2%) |
| Fuel Oil or Kerosene | 0 (0.0%) | 0 (0.0%) |
| Coal or Coke | 0 (0.0%) | 0 (0.0%) |
| All other Fuels | 0 (0.0%) | 0 (0.0%) |
| No Fuel Used | 0 (0.0%) | 0 (0.0%) |
| Total | 1,726 (100.0%) | 1,117 (100.0%) |
Household Vehicle Usage in Philadelphia
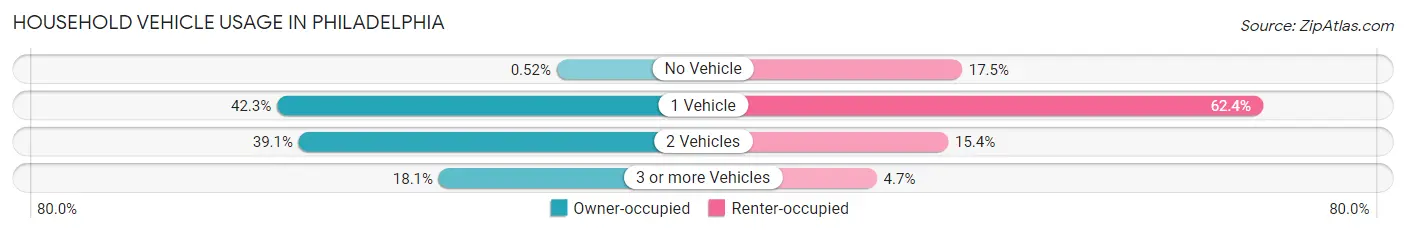
| Vehicles per Household | Owner-occupied | Renter-occupied |
| No Vehicle | 9 (0.5%) | 195 (17.5%) |
| 1 Vehicle | 730 (42.3%) | 697 (62.4%) |
| 2 Vehicles | 674 (39.1%) | 172 (15.4%) |
| 3 or more Vehicles | 313 (18.1%) | 53 (4.7%) |
| Total | 1,726 (100.0%) | 1,117 (100.0%) |
Real Estate & Mortgages in Philadelphia
Real Estate and Mortgage Overview in Philadelphia
| Characteristic | Without Mortgage | With Mortgage |
| Housing Units | 1,002 | 724 |
| Median Property Value | $110,100 | $93,000 |
| Median Household Income | $52,292 | $0 |
| Monthly Housing Costs | $341 | $0 |
| Real Estate Taxes | $929 | $104 |
Property Value by Mortgage Status in Philadelphia
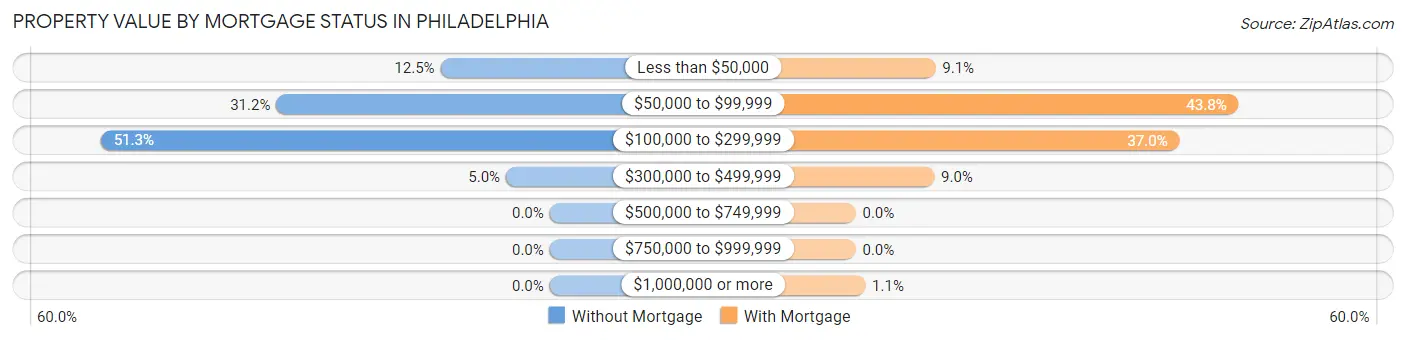
| Property Value | Without Mortgage | With Mortgage |
| Less than $50,000 | 125 (12.5%) | 66 (9.1%) |
| $50,000 to $99,999 | 313 (31.2%) | 317 (43.8%) |
| $100,000 to $299,999 | 514 (51.3%) | 268 (37.0%) |
| $300,000 to $499,999 | 50 (5.0%) | 65 (9.0%) |
| $500,000 to $749,999 | 0 (0.0%) | 0 (0.0%) |
| $750,000 to $999,999 | 0 (0.0%) | 0 (0.0%) |
| $1,000,000 or more | 0 (0.0%) | 8 (1.1%) |
| Total | 1,002 (100.0%) | 724 (100.0%) |
Household Income by Mortgage Status in Philadelphia
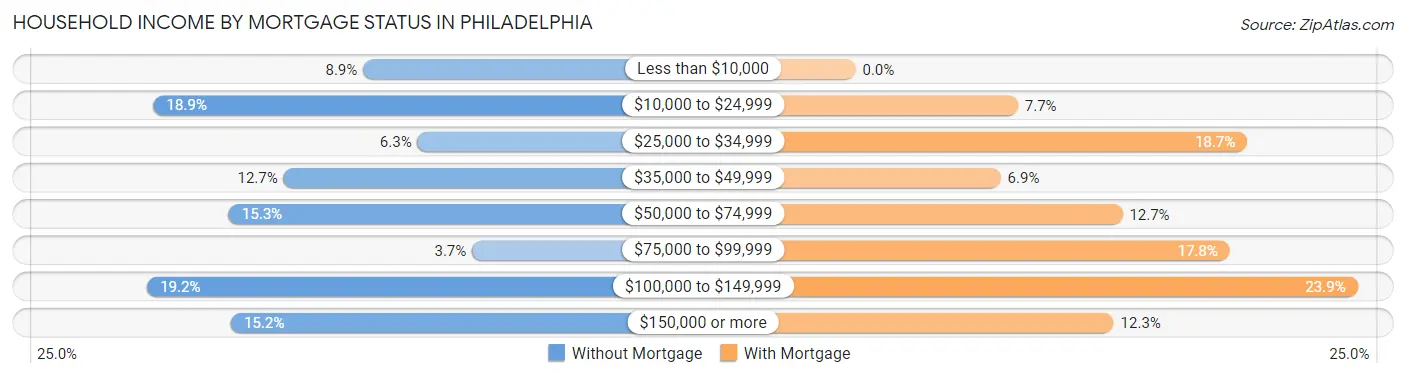
| Household Income | Without Mortgage | With Mortgage |
| Less than $10,000 | 89 (8.9%) | 0 (0.0%) |
| $10,000 to $24,999 | 189 (18.9%) | 56 (7.7%) |
| $25,000 to $34,999 | 63 (6.3%) | 135 (18.6%) |
| $35,000 to $49,999 | 127 (12.7%) | 50 (6.9%) |
| $50,000 to $74,999 | 153 (15.3%) | 92 (12.7%) |
| $75,000 to $99,999 | 37 (3.7%) | 129 (17.8%) |
| $100,000 to $149,999 | 192 (19.2%) | 173 (23.9%) |
| $150,000 or more | 152 (15.2%) | 89 (12.3%) |
| Total | 1,002 (100.0%) | 724 (100.0%) |
Property Value to Household Income Ratio in Philadelphia
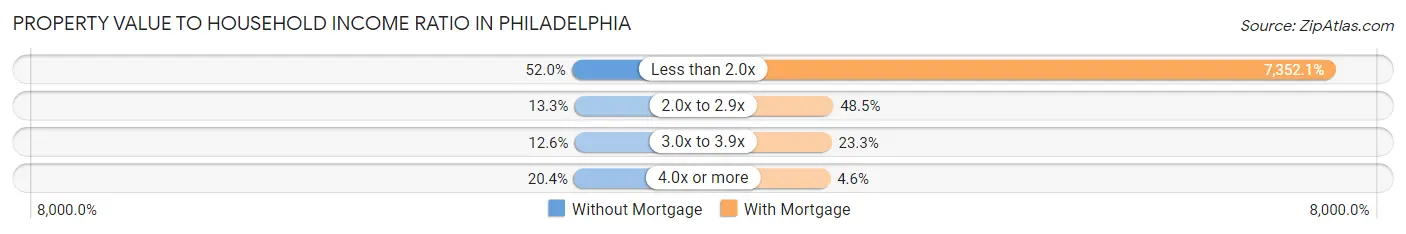
| Value-to-Income Ratio | Without Mortgage | With Mortgage |
| Less than 2.0x | 521 (52.0%) | 53,229 (7,352.1%) |
| 2.0x to 2.9x | 133 (13.3%) | 351 (48.5%) |
| 3.0x to 3.9x | 126 (12.6%) | 169 (23.3%) |
| 4.0x or more | 204 (20.4%) | 33 (4.6%) |
| Total | 1,002 (100.0%) | 724 (100.0%) |
Real Estate Taxes by Mortgage Status in Philadelphia
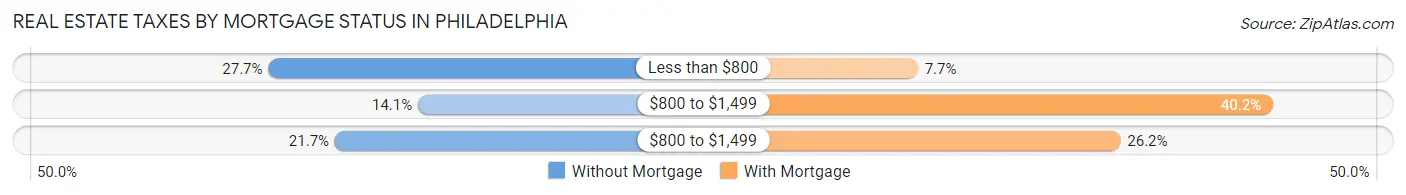
| Property Taxes | Without Mortgage | With Mortgage |
| Less than $800 | 278 (27.7%) | 56 (7.7%) |
| $800 to $1,499 | 141 (14.1%) | 291 (40.2%) |
| $800 to $1,499 | 217 (21.7%) | 190 (26.2%) |
| Total | 1,002 (100.0%) | 724 (100.0%) |
Health & Disability in Philadelphia
Health Insurance Coverage by Age in Philadelphia
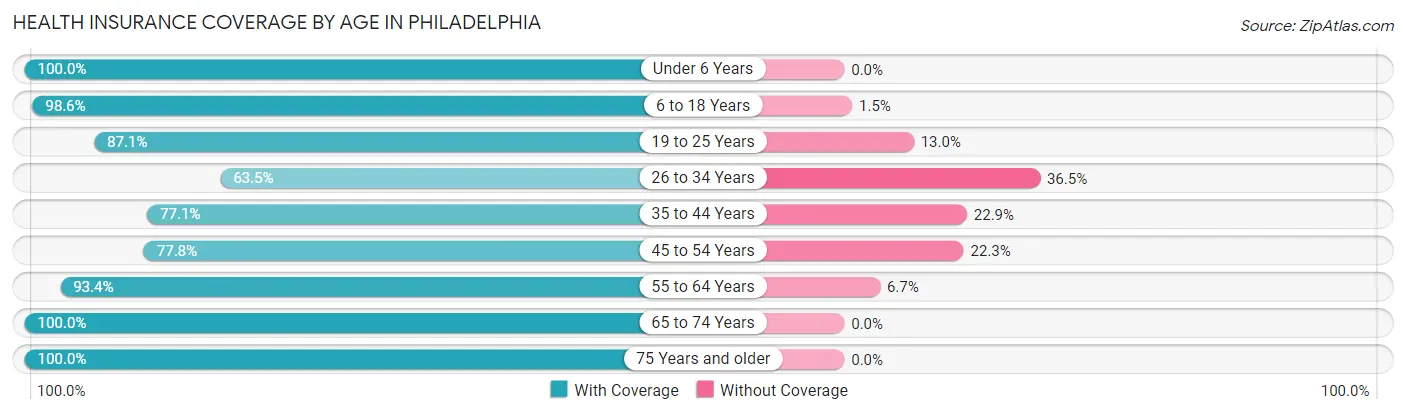
| Age Bracket | With Coverage | Without Coverage |
| Under 6 Years | 417 (100.0%) | 0 (0.0%) |
| 6 to 18 Years | 1,287 (98.6%) | 19 (1.5%) |
| 19 to 25 Years | 390 (87.1%) | 58 (13.0%) |
| 26 to 34 Years | 442 (63.5%) | 254 (36.5%) |
| 35 to 44 Years | 702 (77.1%) | 208 (22.9%) |
| 45 to 54 Years | 678 (77.7%) | 194 (22.3%) |
| 55 to 64 Years | 983 (93.3%) | 70 (6.7%) |
| 65 to 74 Years | 710 (100.0%) | 0 (0.0%) |
| 75 Years and older | 334 (100.0%) | 0 (0.0%) |
| Total | 5,943 (88.1%) | 803 (11.9%) |
Health Insurance Coverage by Citizenship Status in Philadelphia
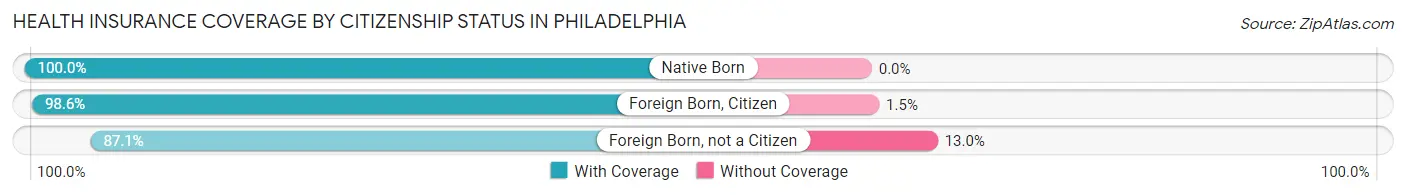
| Citizenship Status | With Coverage | Without Coverage |
| Native Born | 417 (100.0%) | 0 (0.0%) |
| Foreign Born, Citizen | 1,287 (98.6%) | 19 (1.5%) |
| Foreign Born, not a Citizen | 390 (87.1%) | 58 (13.0%) |
Health Insurance Coverage by Household Income in Philadelphia
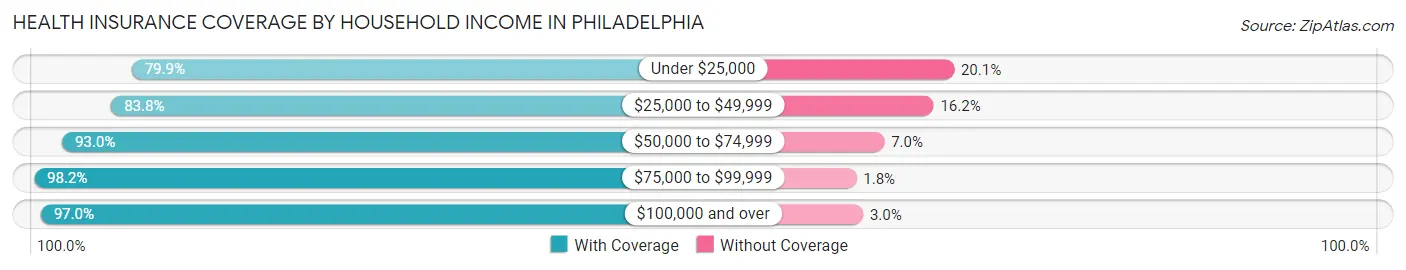
| Household Income | With Coverage | Without Coverage |
| Under $25,000 | 1,397 (79.9%) | 351 (20.1%) |
| $25,000 to $49,999 | 1,774 (83.8%) | 344 (16.2%) |
| $50,000 to $74,999 | 663 (93.0%) | 50 (7.0%) |
| $75,000 to $99,999 | 604 (98.2%) | 11 (1.8%) |
| $100,000 and over | 1,505 (97.0%) | 47 (3.0%) |
Public vs Private Health Insurance Coverage by Age in Philadelphia
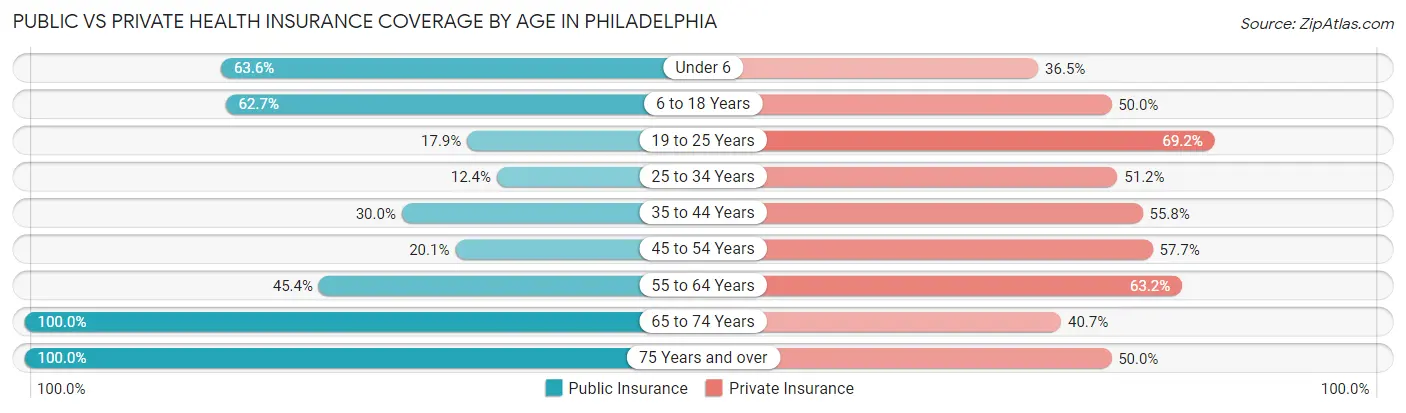
| Age Bracket | Public Insurance | Private Insurance |
| Under 6 | 265 (63.5%) | 152 (36.4%) |
| 6 to 18 Years | 819 (62.7%) | 653 (50.0%) |
| 19 to 25 Years | 80 (17.9%) | 310 (69.2%) |
| 25 to 34 Years | 86 (12.4%) | 356 (51.1%) |
| 35 to 44 Years | 273 (30.0%) | 508 (55.8%) |
| 45 to 54 Years | 175 (20.1%) | 503 (57.7%) |
| 55 to 64 Years | 478 (45.4%) | 665 (63.1%) |
| 65 to 74 Years | 710 (100.0%) | 289 (40.7%) |
| 75 Years and over | 334 (100.0%) | 167 (50.0%) |
| Total | 3,220 (47.7%) | 3,603 (53.4%) |
Disability Status by Sex by Age in Philadelphia
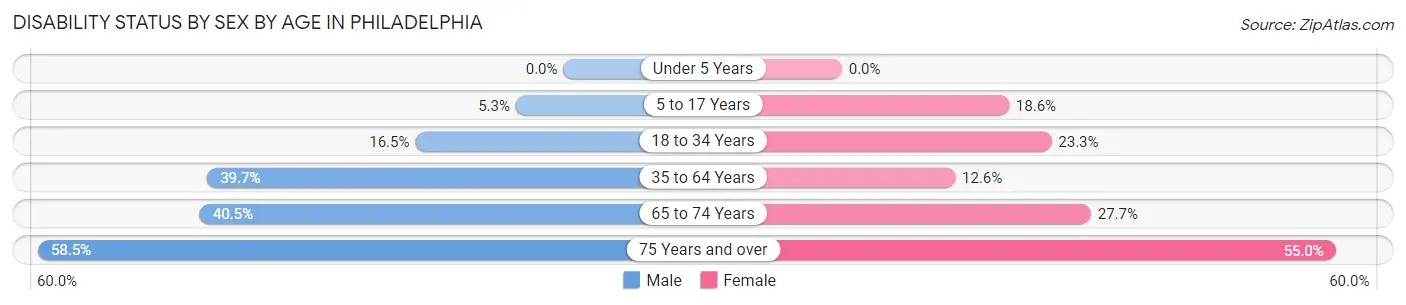
| Age Bracket | Male | Female |
| Under 5 Years | 0 (0.0%) | 0 (0.0%) |
| 5 to 17 Years | 37 (5.3%) | 99 (18.6%) |
| 18 to 34 Years | 110 (16.5%) | 155 (23.3%) |
| 35 to 64 Years | 489 (39.7%) | 202 (12.6%) |
| 65 to 74 Years | 102 (40.5%) | 127 (27.7%) |
| 75 Years and over | 55 (58.5%) | 132 (55.0%) |
Disability Class by Sex by Age in Philadelphia
Disability Class: Hearing Difficulty
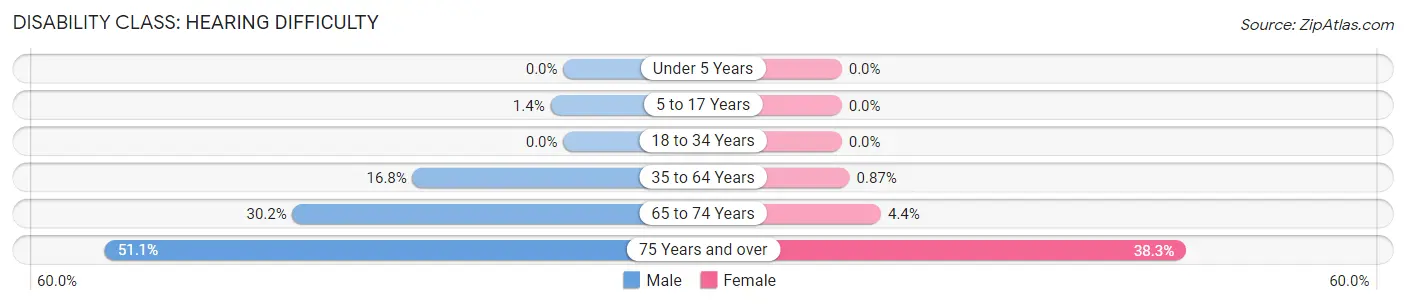
| Age Bracket | Male | Female |
| Under 5 Years | 0 (0.0%) | 0 (0.0%) |
| 5 to 17 Years | 10 (1.4%) | 0 (0.0%) |
| 18 to 34 Years | 0 (0.0%) | 0 (0.0%) |
| 35 to 64 Years | 207 (16.8%) | 14 (0.9%) |
| 65 to 74 Years | 76 (30.2%) | 20 (4.4%) |
| 75 Years and over | 48 (51.1%) | 92 (38.3%) |
Disability Class: Vision Difficulty
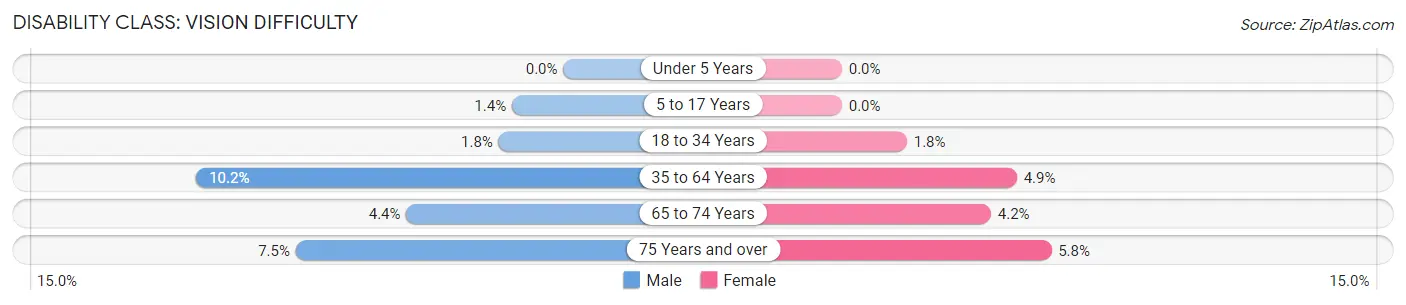
| Age Bracket | Male | Female |
| Under 5 Years | 0 (0.0%) | 0 (0.0%) |
| 5 to 17 Years | 10 (1.4%) | 0 (0.0%) |
| 18 to 34 Years | 12 (1.8%) | 12 (1.8%) |
| 35 to 64 Years | 126 (10.2%) | 78 (4.9%) |
| 65 to 74 Years | 11 (4.4%) | 19 (4.2%) |
| 75 Years and over | 7 (7.4%) | 14 (5.8%) |
Disability Class: Cognitive Difficulty
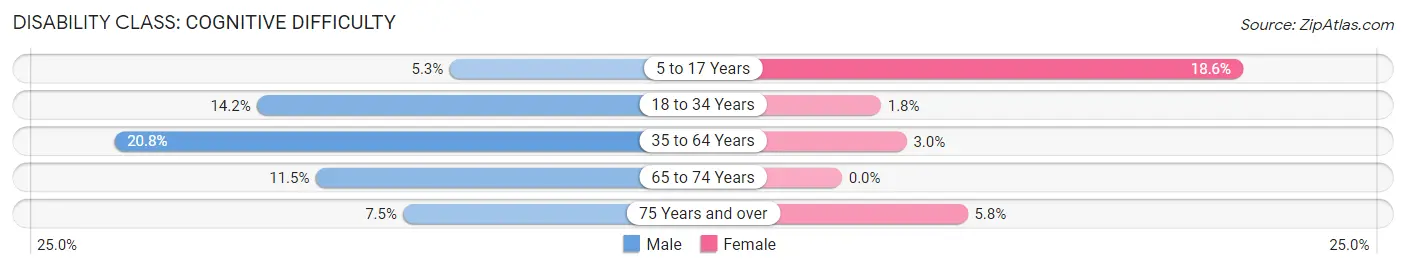
| Age Bracket | Male | Female |
| 5 to 17 Years | 37 (5.3%) | 99 (18.6%) |
| 18 to 34 Years | 95 (14.2%) | 12 (1.8%) |
| 35 to 64 Years | 257 (20.8%) | 48 (3.0%) |
| 65 to 74 Years | 29 (11.5%) | 0 (0.0%) |
| 75 Years and over | 7 (7.4%) | 14 (5.8%) |
Disability Class: Ambulatory Difficulty
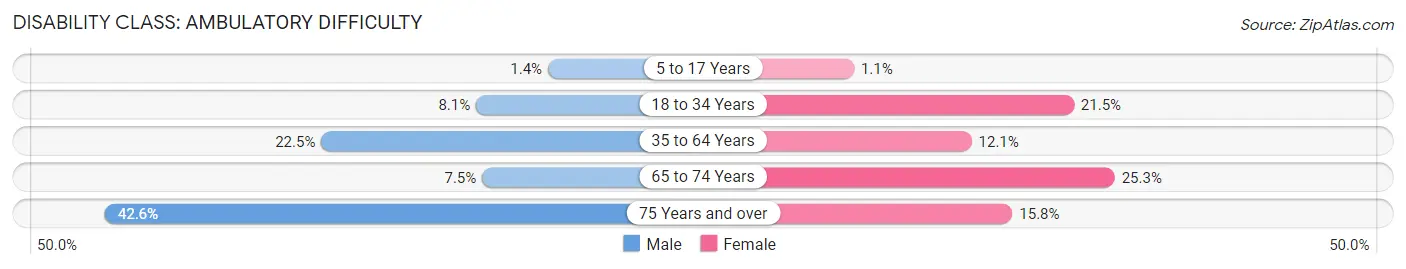
| Age Bracket | Male | Female |
| 5 to 17 Years | 10 (1.4%) | 6 (1.1%) |
| 18 to 34 Years | 54 (8.1%) | 143 (21.5%) |
| 35 to 64 Years | 277 (22.5%) | 193 (12.0%) |
| 65 to 74 Years | 19 (7.5%) | 116 (25.3%) |
| 75 Years and over | 40 (42.5%) | 38 (15.8%) |
Disability Class: Self-Care Difficulty
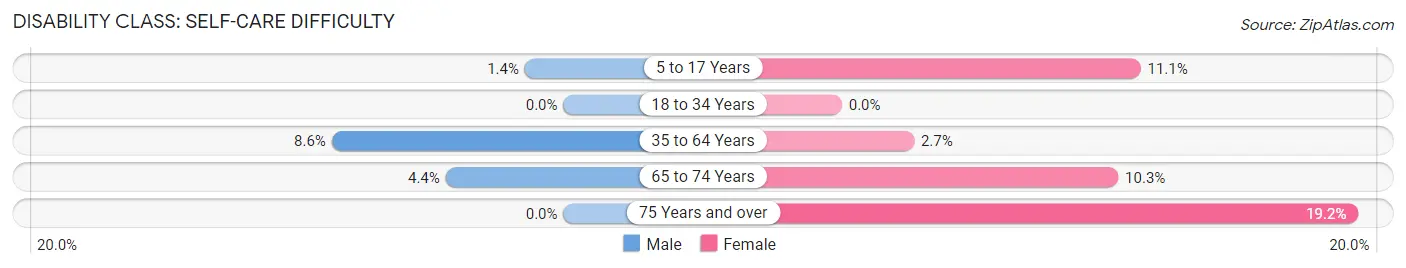
| Age Bracket | Male | Female |
| 5 to 17 Years | 10 (1.4%) | 59 (11.1%) |
| 18 to 34 Years | 0 (0.0%) | 0 (0.0%) |
| 35 to 64 Years | 106 (8.6%) | 43 (2.7%) |
| 65 to 74 Years | 11 (4.4%) | 47 (10.3%) |
| 75 Years and over | 0 (0.0%) | 46 (19.2%) |
Technology Access in Philadelphia
Computing Device Access in Philadelphia
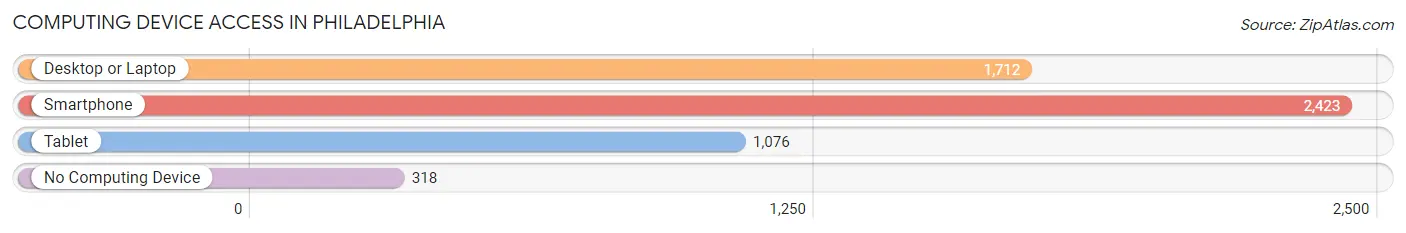
| Device Type | # Households | % Households |
| Desktop or Laptop | 1,712 | 60.2% |
| Smartphone | 2,423 | 85.2% |
| Tablet | 1,076 | 37.9% |
| No Computing Device | 318 | 11.2% |
| Total | 2,843 | 100.0% |
Internet Access in Philadelphia
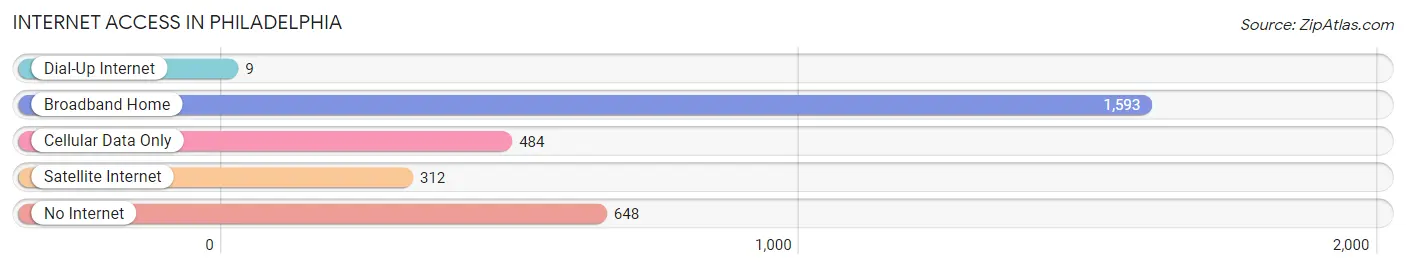
| Internet Type | # Households | % Households |
| Dial-Up Internet | 9 | 0.3% |
| Broadband Home | 1,593 | 56.0% |
| Cellular Data Only | 484 | 17.0% |
| Satellite Internet | 312 | 11.0% |
| No Internet | 648 | 22.8% |
| Total | 2,843 | 100.0% |
Philadelphia Summary
Philadelphia, Mississippi is a small city located in Neshoba County in the state of Mississippi. It is situated in the east-central part of the state, approximately 80 miles northeast of Jackson, the state capital. The city is part of the larger Meridian, Mississippi metropolitan area. As of the 2010 census, the population of Philadelphia was 7,477.
History
Philadelphia was founded in 1819 by settlers from the Choctaw Nation. The city was named after Philadelphia, Pennsylvania, and was the first county seat of Neshoba County. The city was incorporated in 1858.
During the Civil War, Philadelphia was the site of a major battle between Union and Confederate forces. The Battle of Philadelphia was fought on July 16, 1863, and resulted in a Confederate victory.
In 1964, Philadelphia was the site of the infamous murders of three civil rights workers, James Chaney, Andrew Goodman, and Michael Schwerner. The three men had been working to register African-American voters in the area. Their deaths sparked national outrage and helped to galvanize the civil rights movement.
Geography
Philadelphia is located at 33°45'N 89°10'W. The city has a total area of 8.2 square miles, all of which is land. The city is situated in the rolling hills of the Black Belt region of Mississippi. The city is located near the Noxubee River, which flows through the city.
Economy
Philadelphia's economy is largely based on agriculture and manufacturing. The city is home to several large poultry processing plants, as well as a number of smaller businesses. The city is also home to a number of retail stores, restaurants, and other businesses.
Demographics
As of the 2010 census, the population of Philadelphia was 7,477. The racial makeup of the city was 63.3% White, 34.2% African American, 0.3% Native American, 0.2% Asian, 0.1% Pacific Islander, 0.7% from other races, and 1.2% from two or more races. Hispanic or Latino of any race were 1.7% of the population.
The median income for a household in the city was $27,917, and the median income for a family was $35,938. The per capita income for the city was $15,945. About 22.2% of families and 25.7% of the population were below the poverty line, including 36.2% of those under age 18 and 18.2% of those age 65 or over.
Common Questions
What is Per Capita Income in Philadelphia?
Per Capita income in Philadelphia is $25,833.
What is the Median Family Income in Philadelphia?
Median Family Income in Philadelphia is $47,023.
What is the Median Household income in Philadelphia?
Median Household Income in Philadelphia is $38,713.
What is Income or Wage Gap in Philadelphia?
Income or Wage Gap in Philadelphia is 7.4%.
Women in Philadelphia earn 92.6 cents for every dollar earned by a man.
What is Family Income Deficit in Philadelphia?
Family Income Deficit in Philadelphia is $14,039.
Families that are below poverty line in Philadelphia earn $14,039 less on average than the poverty threshold level.
What is Inequality or Gini Index in Philadelphia?
Inequality or Gini Index in Philadelphia is 0.51.
What is the Total Population of Philadelphia?
Total Population of Philadelphia is 7,065.
What is the Total Male Population of Philadelphia?
Total Male Population of Philadelphia is 3,191.
What is the Total Female Population of Philadelphia?
Total Female Population of Philadelphia is 3,874.
What is the Ratio of Males per 100 Females in Philadelphia?
There are 82.37 Males per 100 Females in Philadelphia.
What is the Ratio of Females per 100 Males in Philadelphia?
There are 121.40 Females per 100 Males in Philadelphia.
What is the Median Population Age in Philadelphia?
Median Population Age in Philadelphia is 43.0 Years.
What is the Average Family Size in Philadelphia
Average Family Size in Philadelphia is 3.2 People.
What is the Average Household Size in Philadelphia
Average Household Size in Philadelphia is 2.4 People.
How Large is the Labor Force in Philadelphia?
There are 3,063 People in the Labor Forcein in Philadelphia.
What is the Percentage of People in the Labor Force in Philadelphia?
52.6% of People are in the Labor Force in Philadelphia.
What is the Unemployment Rate in Philadelphia?
Unemployment Rate in Philadelphia is 10.5%.