Cities with the Highest Percentage of Population Employed in Sales & Related in Illinois
RELATED REPORTS & OPTIONS
Sales & Related
Illinois
Compare Cities
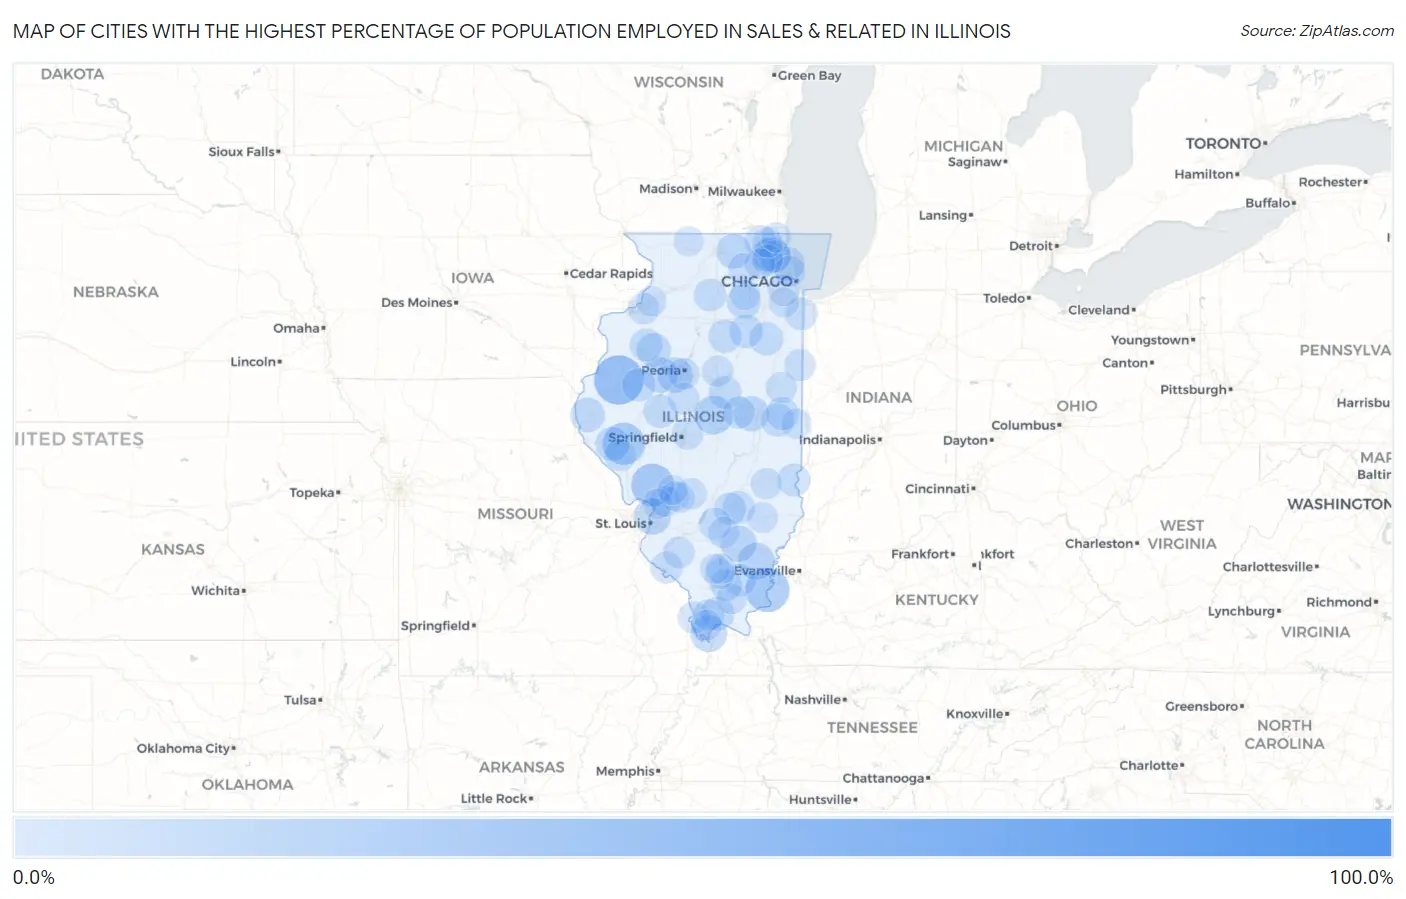
Map of Cities with the Highest Percentage of Population Employed in Sales & Related in Illinois
0.0%
100.0%
Cities with the Highest Percentage of Population Employed in Sales & Related in Illinois
| City | % Employed | vs State | vs National | |
| 1. | Millersburg | 100.0% | 9.6%(+90.4)#1 | 9.6%(+90.4)#15 |
| 2. | Lynn Center | 100.0% | 9.6%(+90.4)#2 | 9.6%(+90.4)#33 |
| 3. | Shirley | 62.5% | 9.6%(+52.9)#3 | 9.6%(+52.9)#85 |
| 4. | Janesville | 57.1% | 9.6%(+47.6)#4 | 9.6%(+47.5)#114 |
| 5. | Marley | 56.0% | 9.6%(+46.4)#5 | 9.6%(+46.4)#126 |
| 6. | Bloomfield | 54.1% | 9.6%(+44.5)#6 | 9.6%(+44.5)#143 |
| 7. | Sciota | 50.0% | 9.6%(+40.4)#7 | 9.6%(+40.4)#174 |
| 8. | Carman | 46.8% | 9.6%(+37.3)#8 | 9.6%(+37.3)#219 |
| 9. | Old Shawneetown | 40.6% | 9.6%(+31.1)#9 | 9.6%(+31.0)#303 |
| 10. | Fidelity | 38.5% | 9.6%(+28.9)#10 | 9.6%(+28.9)#343 |
| 11. | Valley City | 37.5% | 9.6%(+27.9)#11 | 9.6%(+27.9)#369 |
| 12. | Adams | 35.9% | 9.6%(+26.3)#12 | 9.6%(+26.3)#399 |
| 13. | Galt | 32.7% | 9.6%(+23.2)#13 | 9.6%(+23.1)#503 |
| 14. | Ophiem | 32.6% | 9.6%(+23.0)#14 | 9.6%(+23.0)#511 |
| 15. | Kenney | 31.4% | 9.6%(+21.8)#15 | 9.6%(+21.8)#562 |
| 16. | Lane | 31.2% | 9.6%(+21.7)#16 | 9.6%(+21.7)#567 |
| 17. | Ridgefield | 30.3% | 9.6%(+20.8)#17 | 9.6%(+20.7)#611 |
| 18. | East Lynn | 29.5% | 9.6%(+19.9)#18 | 9.6%(+19.9)#666 |
| 19. | Enfield | 28.4% | 9.6%(+18.9)#19 | 9.6%(+18.8)#742 |
| 20. | Madison | 27.9% | 9.6%(+18.3)#20 | 9.6%(+18.3)#778 |
| 21. | Preemption | 27.4% | 9.6%(+17.9)#21 | 9.6%(+17.8)#800 |
| 22. | Custer Park | 27.4% | 9.6%(+17.8)#22 | 9.6%(+17.8)#801 |
| 23. | Mound City | 27.3% | 9.6%(+17.8)#23 | 9.6%(+17.7)#803 |
| 24. | Keenes | 26.9% | 9.6%(+17.4)#24 | 9.6%(+17.3)#841 |
| 25. | Forest Lake | 26.6% | 9.6%(+17.0)#25 | 9.6%(+17.0)#868 |
| 26. | Norris | 25.8% | 9.6%(+16.3)#26 | 9.6%(+16.2)#929 |
| 27. | Seymour | 25.7% | 9.6%(+16.2)#27 | 9.6%(+16.2)#937 |
| 28. | Lake Camelot | 25.6% | 9.6%(+16.0)#28 | 9.6%(+16.0)#953 |
| 29. | Garden Prairie | 24.7% | 9.6%(+15.1)#29 | 9.6%(+15.1)#1,043 |
| 30. | Arbury Hills | 24.5% | 9.6%(+15.0)#30 | 9.6%(+14.9)#1,056 |
| 31. | Mendon | 24.3% | 9.6%(+14.7)#31 | 9.6%(+14.7)#1,086 |
| 32. | West Liberty | 24.2% | 9.6%(+14.7)#32 | 9.6%(+14.6)#1,090 |
| 33. | Burtons Bridge | 24.1% | 9.6%(+14.5)#33 | 9.6%(+14.5)#1,101 |
| 34. | Oak Run | 23.7% | 9.6%(+14.2)#34 | 9.6%(+14.2)#1,133 |
| 35. | Northfield | 23.7% | 9.6%(+14.2)#35 | 9.6%(+14.1)#1,136 |
| 36. | Millbrook | 23.7% | 9.6%(+14.2)#36 | 9.6%(+14.1)#1,140 |
| 37. | New Salem | 23.5% | 9.6%(+14.0)#37 | 9.6%(+13.9)#1,158 |
| 38. | Union Hill | 22.9% | 9.6%(+13.3)#38 | 9.6%(+13.3)#1,257 |
| 39. | Verona | 22.7% | 9.6%(+13.2)#39 | 9.6%(+13.1)#1,272 |
| 40. | Cypress | 22.7% | 9.6%(+13.2)#40 | 9.6%(+13.1)#1,274 |
| 41. | Kilbourne | 22.5% | 9.6%(+13.0)#41 | 9.6%(+12.9)#1,308 |
| 42. | Kangley | 22.5% | 9.6%(+13.0)#42 | 9.6%(+12.9)#1,309 |
| 43. | Homer | 22.3% | 9.6%(+12.7)#43 | 9.6%(+12.7)#1,338 |
| 44. | Marietta | 22.2% | 9.6%(+12.7)#44 | 9.6%(+12.6)#1,354 |
| 45. | Downs | 22.0% | 9.6%(+12.5)#45 | 9.6%(+12.4)#1,378 |
| 46. | Cameron | 21.9% | 9.6%(+12.3)#46 | 9.6%(+12.3)#1,409 |
| 47. | Mossville | 21.7% | 9.6%(+12.1)#47 | 9.6%(+12.1)#1,451 |
| 48. | Fithian | 21.6% | 9.6%(+12.1)#48 | 9.6%(+12.0)#1,460 |
| 49. | West Union | 21.6% | 9.6%(+12.0)#49 | 9.6%(+12.0)#1,470 |
| 50. | Wataga | 21.5% | 9.6%(+12.0)#50 | 9.6%(+12.0)#1,474 |
| 51. | West Brooklyn | 21.4% | 9.6%(+11.9)#51 | 9.6%(+11.8)#1,493 |
| 52. | Iola | 21.4% | 9.6%(+11.9)#52 | 9.6%(+11.8)#1,499 |
| 53. | North Barrington | 21.3% | 9.6%(+11.7)#53 | 9.6%(+11.7)#1,522 |
| 54. | Willowbrook | 21.1% | 9.6%(+11.6)#54 | 9.6%(+11.5)#1,545 |
| 55. | Farina | 20.8% | 9.6%(+11.2)#55 | 9.6%(+11.2)#1,620 |
| 56. | Galatia | 20.5% | 9.6%(+11.0)#56 | 9.6%(+11.0)#1,664 |
| 57. | Odin | 20.4% | 9.6%(+10.8)#57 | 9.6%(+10.8)#1,695 |
| 58. | De Land | 20.3% | 9.6%(+10.7)#58 | 9.6%(+10.7)#1,717 |
| 59. | Mcclure | 20.2% | 9.6%(+10.6)#59 | 9.6%(+10.6)#1,735 |
| 60. | Riverton | 20.1% | 9.6%(+10.5)#60 | 9.6%(+10.5)#1,760 |
| 61. | Time | 20.0% | 9.6%(+10.4)#61 | 9.6%(+10.4)#1,802 |
| 62. | Johnsburg | 20.0% | 9.6%(+10.4)#62 | 9.6%(+10.4)#1,804 |
| 63. | San Jose | 19.9% | 9.6%(+10.4)#63 | 9.6%(+10.3)#1,813 |
| 64. | Long Grove | 19.9% | 9.6%(+10.3)#64 | 9.6%(+10.3)#1,820 |
| 65. | Ellis Grove | 19.9% | 9.6%(+10.3)#65 | 9.6%(+10.3)#1,829 |
| 66. | Pittsburg | 19.7% | 9.6%(+10.2)#66 | 9.6%(+10.1)#1,853 |
| 67. | Creve Coeur | 19.5% | 9.6%(+9.96)#67 | 9.6%(+9.92)#1,902 |
| 68. | Tilden | 19.3% | 9.6%(+9.74)#68 | 9.6%(+9.71)#1,970 |
| 69. | Justice | 19.2% | 9.6%(+9.68)#69 | 9.6%(+9.64)#1,988 |
| 70. | Sheldon | 19.2% | 9.6%(+9.67)#70 | 9.6%(+9.64)#1,989 |
| 71. | Rankin | 19.0% | 9.6%(+9.43)#71 | 9.6%(+9.40)#2,058 |
| 72. | Cleveland | 19.0% | 9.6%(+9.43)#72 | 9.6%(+9.39)#2,065 |
| 73. | Kappa | 19.0% | 9.6%(+9.40)#73 | 9.6%(+9.37)#2,071 |
| 74. | Burlington | 18.9% | 9.6%(+9.36)#74 | 9.6%(+9.32)#2,086 |
| 75. | Hidalgo | 18.9% | 9.6%(+9.36)#75 | 9.6%(+9.32)#2,089 |
| 76. | Dongola | 18.9% | 9.6%(+9.33)#76 | 9.6%(+9.29)#2,099 |
| 77. | Kell | 18.8% | 9.6%(+9.28)#77 | 9.6%(+9.25)#2,110 |
| 78. | Donnellson | 18.8% | 9.6%(+9.19)#78 | 9.6%(+9.15)#2,136 |
| 79. | Lincolnwood | 18.5% | 9.6%(+8.97)#79 | 9.6%(+8.93)#2,208 |
| 80. | Barrington | 18.1% | 9.6%(+8.55)#80 | 9.6%(+8.51)#2,329 |
| 81. | Holiday Shores | 17.9% | 9.6%(+8.38)#81 | 9.6%(+8.35)#2,375 |
| 82. | Noble | 17.7% | 9.6%(+8.15)#82 | 9.6%(+8.12)#2,443 |
| 83. | Trivoli | 17.7% | 9.6%(+8.13)#83 | 9.6%(+8.09)#2,448 |
| 84. | East Dundee | 17.7% | 9.6%(+8.12)#84 | 9.6%(+8.08)#2,449 |
| 85. | New Burnside | 17.6% | 9.6%(+8.09)#85 | 9.6%(+8.05)#2,460 |
| 86. | Pulaski | 17.5% | 9.6%(+7.94)#86 | 9.6%(+7.90)#2,506 |
| 87. | Orient | 17.4% | 9.6%(+7.86)#87 | 9.6%(+7.83)#2,537 |
| 88. | West City | 17.4% | 9.6%(+7.83)#88 | 9.6%(+7.80)#2,551 |
| 89. | Georgetown | 17.3% | 9.6%(+7.78)#89 | 9.6%(+7.75)#2,572 |
| 90. | North City | 17.3% | 9.6%(+7.69)#90 | 9.6%(+7.66)#2,606 |
| 91. | Long Lake | 17.2% | 9.6%(+7.67)#91 | 9.6%(+7.63)#2,621 |
| 92. | Hillsdale | 17.2% | 9.6%(+7.65)#92 | 9.6%(+7.62)#2,627 |
| 93. | New Douglas | 17.1% | 9.6%(+7.53)#93 | 9.6%(+7.49)#2,683 |
| 94. | Old Mill Creek | 17.0% | 9.6%(+7.42)#94 | 9.6%(+7.39)#2,732 |
| 95. | Orland Hills | 16.9% | 9.6%(+7.38)#95 | 9.6%(+7.35)#2,745 |
| 96. | Williamson | 16.9% | 9.6%(+7.34)#96 | 9.6%(+7.31)#2,771 |
| 97. | Rosewood Heights | 16.9% | 9.6%(+7.31)#97 | 9.6%(+7.28)#2,786 |
| 98. | Sawyerville | 16.9% | 9.6%(+7.31)#98 | 9.6%(+7.27)#2,795 |
| 99. | Plano | 16.9% | 9.6%(+7.29)#99 | 9.6%(+7.26)#2,800 |
| 100. | Dakota | 16.8% | 9.6%(+7.23)#100 | 9.6%(+7.20)#2,822 |
Common Questions
What are the Top 10 Cities with the Highest Percentage of Population Employed in Sales & Related in Illinois?
Top 10 Cities with the Highest Percentage of Population Employed in Sales & Related in Illinois are:
#1
50.0%
#2
40.6%
#3
38.5%
#4
37.5%
#5
31.4%
#6
28.4%
#7
27.9%
#8
27.3%
#9
26.9%
#10
26.6%
What city has the Highest Percentage of Population Employed in Sales & Related in Illinois?
Sciota has the Highest Percentage of Population Employed in Sales & Related in Illinois with 50.0%.
What is the Percentage of Population Employed in Sales & Related in the State of Illinois?
Percentage of Population Employed in Sales & Related in Illinois is 9.6%.
What is the Percentage of Population Employed in Sales & Related in the United States?
Percentage of Population Employed in Sales & Related in the United States is 9.6%.