New Salem, IL Map & Demographics
New Salem Map
New Salem Overview
$39,756
PER CAPITA INCOME
$57,292
AVG HOUSEHOLD INCOME
0.53
INEQUALITY / GINI INDEX
210
TOTAL POPULATION
112
MALE POPULATION
98
FEMALE POPULATION
114.29
MALES / 100 FEMALES
87.50
FEMALES / 100 MALES
34.5
MEDIAN AGE
3.3
AVG FAMILY SIZE
3.0
AVG HOUSEHOLD SIZE
104
LABOR FORCE [ PEOPLE ]
67.1%
PERCENT IN LABOR FORCE
1.9%
UNEMPLOYMENT RATE
New Salem Zip Codes
New Salem Area Codes
Income in New Salem
Income Overview in New Salem
| Characteristic | Number | Measure |
| Per Capita Income | 210 | $39,756 |
| Median Family Income | 53 | $0 |
| Mean Family Income | 53 | $96,819 |
| Median Household Income | 69 | $57,292 |
| Mean Household Income | 69 | $103,678 |
| Income Deficit | 53 | $0 |
| Wage / Income Gap (%) | 210 | 0.00% |
| Wage / Income Gap ($) | 210 | 100.00¢ per $1 |
| Gini / Inequality Index | 210 | 0.53 |
Earnings by Sex in New Salem
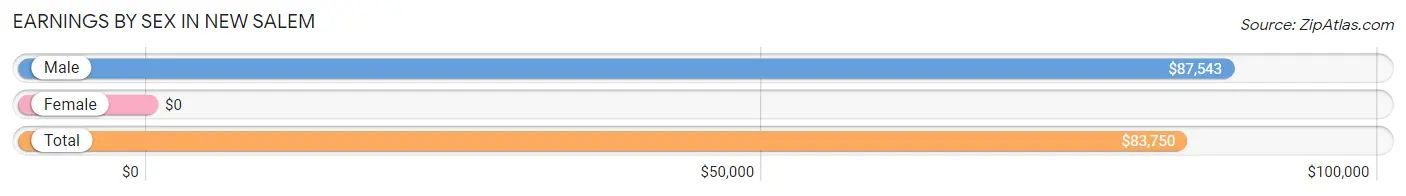
| Sex | Number | Average Earnings |
| Male | 61 (59.2%) | $87,543 |
| Female | 42 (40.8%) | $0 |
| Total | 103 (100.0%) | $83,750 |
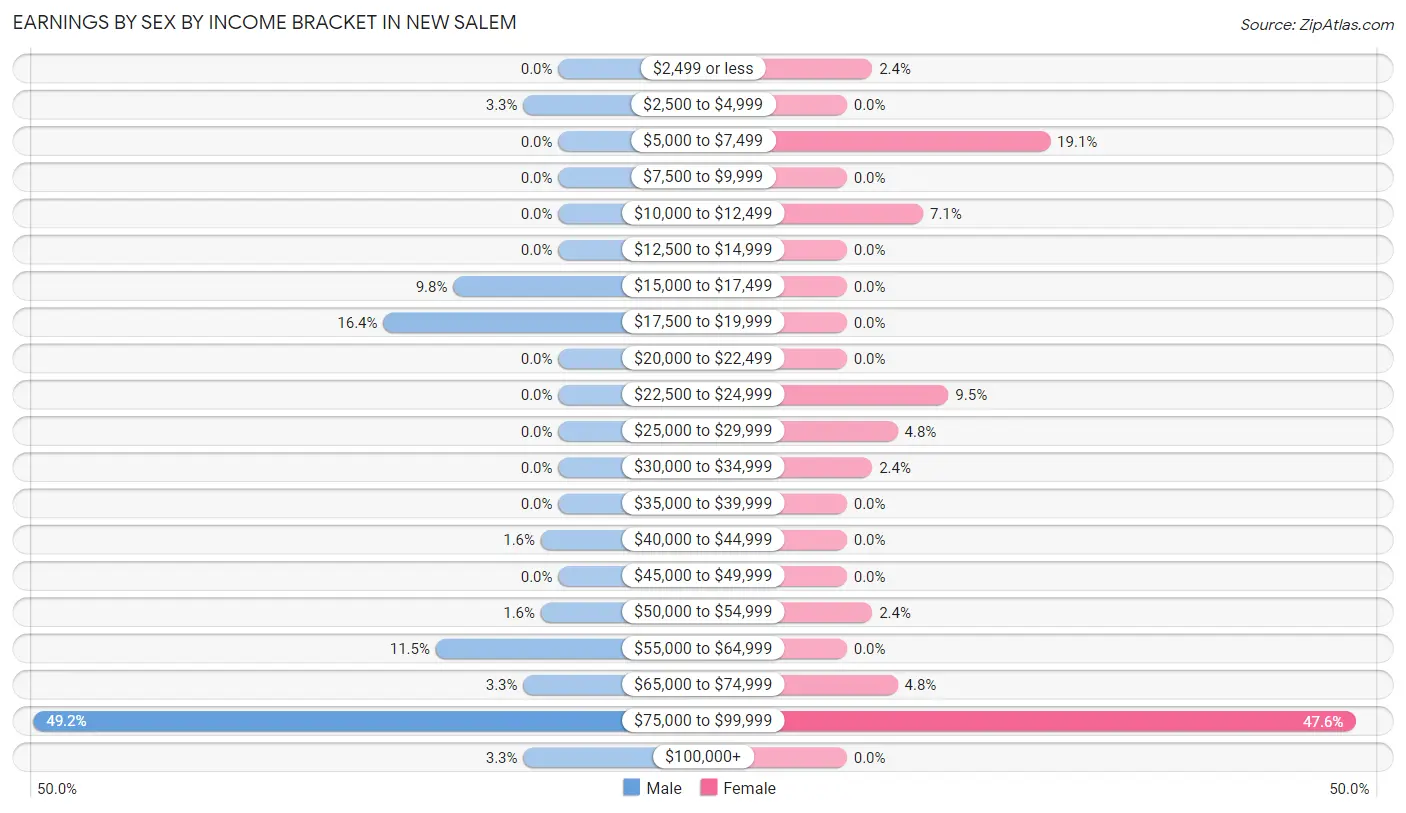
Earnings by Sex by Income Bracket in New Salem
The most common earnings brackets in New Salem are $75,000 to $99,999 for men (30 | 49.2%) and $75,000 to $99,999 for women (20 | 47.6%).
| Income | Male | Female |
| $2,499 or less | 0 (0.0%) | 1 (2.4%) |
| $2,500 to $4,999 | 2 (3.3%) | 0 (0.0%) |
| $5,000 to $7,499 | 0 (0.0%) | 8 (19.1%) |
| $7,500 to $9,999 | 0 (0.0%) | 0 (0.0%) |
| $10,000 to $12,499 | 0 (0.0%) | 3 (7.1%) |
| $12,500 to $14,999 | 0 (0.0%) | 0 (0.0%) |
| $15,000 to $17,499 | 6 (9.8%) | 0 (0.0%) |
| $17,500 to $19,999 | 10 (16.4%) | 0 (0.0%) |
| $20,000 to $22,499 | 0 (0.0%) | 0 (0.0%) |
| $22,500 to $24,999 | 0 (0.0%) | 4 (9.5%) |
| $25,000 to $29,999 | 0 (0.0%) | 2 (4.8%) |
| $30,000 to $34,999 | 0 (0.0%) | 1 (2.4%) |
| $35,000 to $39,999 | 0 (0.0%) | 0 (0.0%) |
| $40,000 to $44,999 | 1 (1.6%) | 0 (0.0%) |
| $45,000 to $49,999 | 0 (0.0%) | 0 (0.0%) |
| $50,000 to $54,999 | 1 (1.6%) | 1 (2.4%) |
| $55,000 to $64,999 | 7 (11.5%) | 0 (0.0%) |
| $65,000 to $74,999 | 2 (3.3%) | 2 (4.8%) |
| $75,000 to $99,999 | 30 (49.2%) | 20 (47.6%) |
| $100,000+ | 2 (3.3%) | 0 (0.0%) |
| Total | 61 (100.0%) | 42 (100.0%) |
Earnings by Sex by Educational Attainment in New Salem
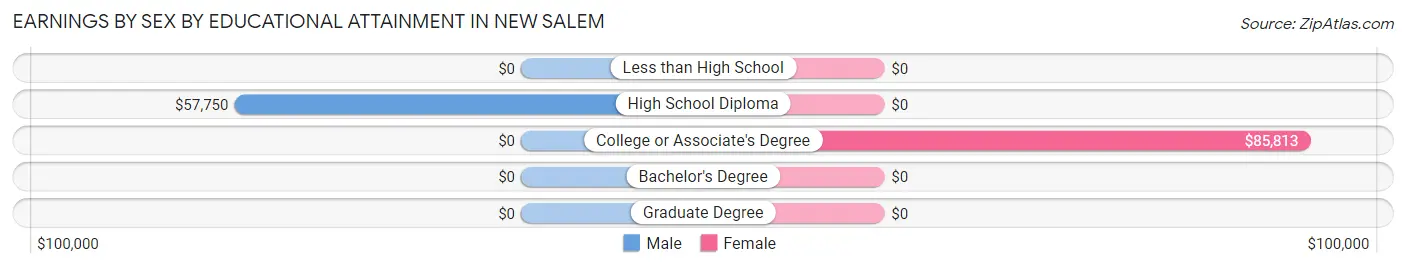
| Educational Attainment | Male Income | Female Income |
| Less than High School | - | - |
| High School Diploma | $57,750 | $0 |
| College or Associate's Degree | - | - |
| Bachelor's Degree | - | - |
| Graduate Degree | - | - |
| Total | $88,060 | $0 |
Family Income in New Salem
Family Income Brackets in New Salem
According to the New Salem family income data, there are 20 families falling into the $150,000 to $199,999 income range, which is the most common income bracket and makes up 37.7% of all families.
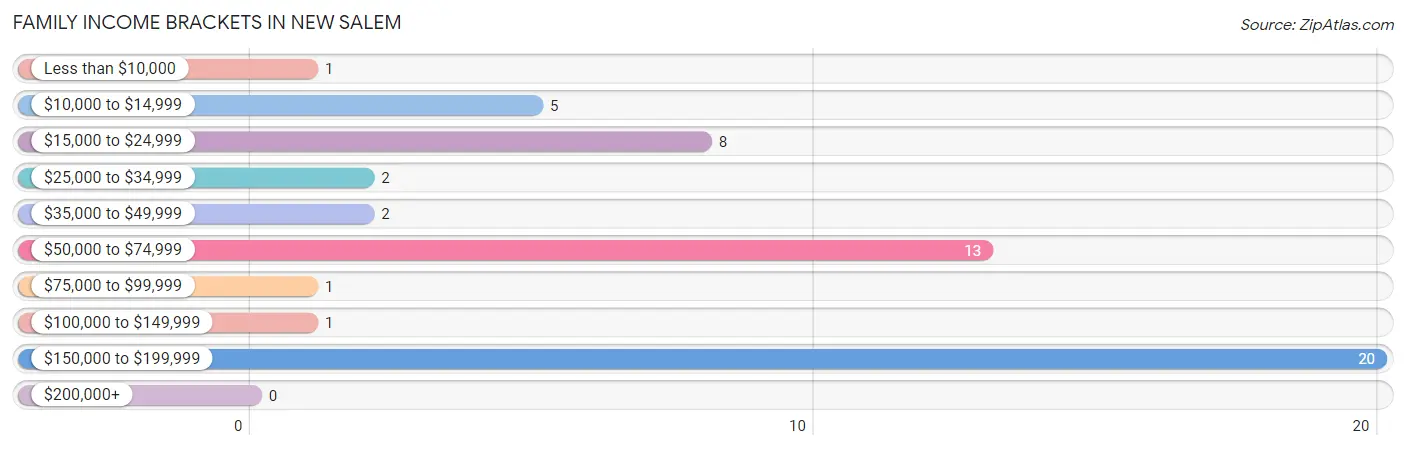
| Income Bracket | # Families | % Families |
| Less than $10,000 | 1 | 1.9% |
| $10,000 to $14,999 | 5 | 9.4% |
| $15,000 to $24,999 | 8 | 15.1% |
| $25,000 to $34,999 | 2 | 3.8% |
| $35,000 to $49,999 | 2 | 3.8% |
| $50,000 to $74,999 | 13 | 24.5% |
| $75,000 to $99,999 | 1 | 1.9% |
| $100,000 to $149,999 | 1 | 1.9% |
| $150,000 to $199,999 | 20 | 37.7% |
| $200,000+ | 0 | 0.0% |
Family Income by Famaliy Size in New Salem
3-person families (3 | 5.7%) account for the highest median family income in New Salem with $73,750 per family, while 3-person families (3 | 5.7%) have the highest median income of $24,583 per family member.
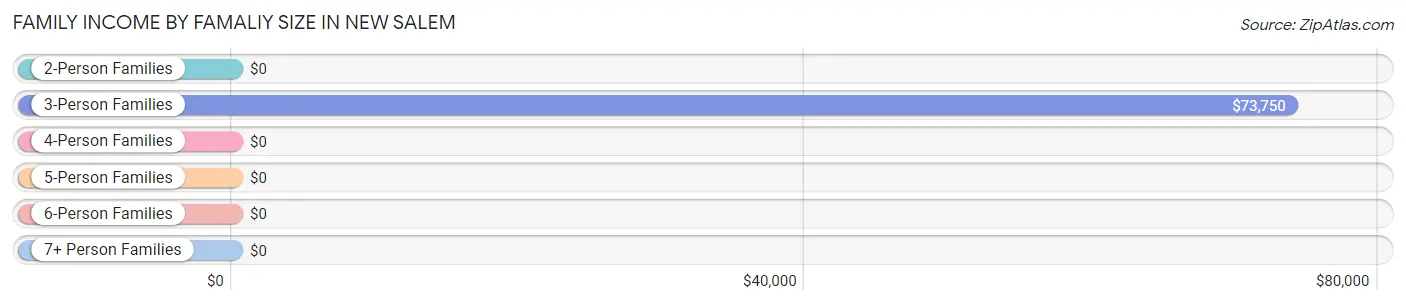
| Income Bracket | # Families | Median Income |
| 2-Person Families | 43 (81.1%) | $0 |
| 3-Person Families | 3 (5.7%) | $73,750 |
| 4-Person Families | 1 (1.9%) | $0 |
| 5-Person Families | 2 (3.8%) | $0 |
| 6-Person Families | 4 (7.5%) | $0 |
| 7+ Person Families | 0 (0.0%) | $0 |
| Total | 53 (100.0%) | $0 |
Family Income by Number of Earners in New Salem
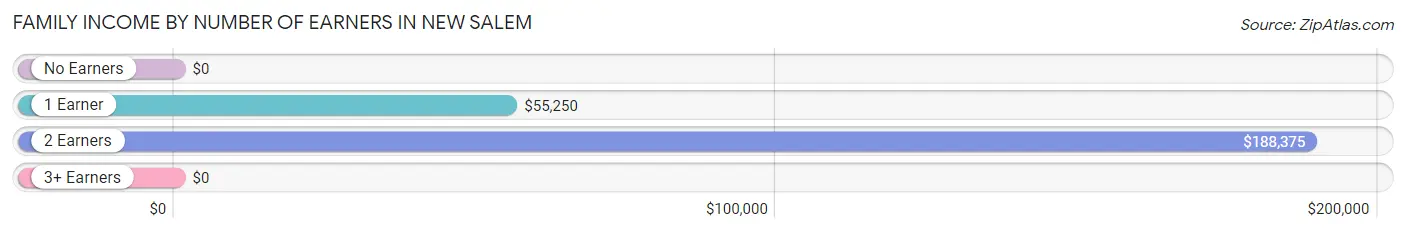
| Number of Earners | # Families | Median Income |
| No Earners | 12 (22.6%) | $0 |
| 1 Earner | 15 (28.3%) | $55,250 |
| 2 Earners | 26 (49.1%) | $188,375 |
| 3+ Earners | 0 (0.0%) | $0 |
| Total | 53 (100.0%) | $0 |
Household Income in New Salem
Household Income Brackets in New Salem
With 20 households falling in the category, the $150,000 to $199,999 income range is the most frequent in New Salem, accounting for 29.0% of all households. In contrast, only 1 households (1.5%) fall into the $100,000 to $149,999 income bracket, making it the least populous group.
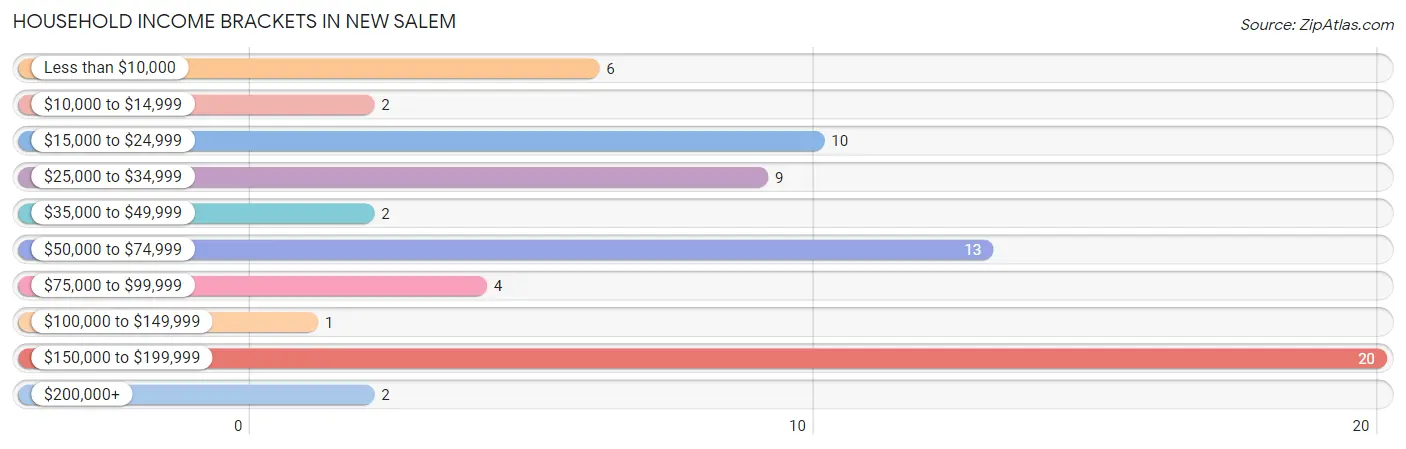
| Income Bracket | # Households | % Households |
| Less than $10,000 | 6 | 8.7% |
| $10,000 to $14,999 | 2 | 2.9% |
| $15,000 to $24,999 | 10 | 14.5% |
| $25,000 to $34,999 | 9 | 13.0% |
| $35,000 to $49,999 | 2 | 2.9% |
| $50,000 to $74,999 | 13 | 18.8% |
| $75,000 to $99,999 | 4 | 5.8% |
| $100,000 to $149,999 | 1 | 1.4% |
| $150,000 to $199,999 | 20 | 29.0% |
| $200,000+ | 2 | 2.9% |
Household Income by Householder Age in New Salem
| Income Bracket | # Households | Median Income |
| 15 to 24 Years | 1 (1.5%) | $0 |
| 25 to 44 Years | 45 (65.2%) | $0 |
| 45 to 64 Years | 9 (13.0%) | $0 |
| 65+ Years | 14 (20.3%) | $0 |
| Total | 69 (100.0%) | $57,292 |
Poverty in New Salem
Income Below Poverty by Sex and Age in New Salem
With 8.9% poverty level for males and 21.4% for females among the residents of New Salem, 35 to 44 year old males and 16 and 17 year old females are the most vulnerable to poverty, with 6 males (85.7%) and 3 females (100.0%) in their respective age groups living below the poverty level.
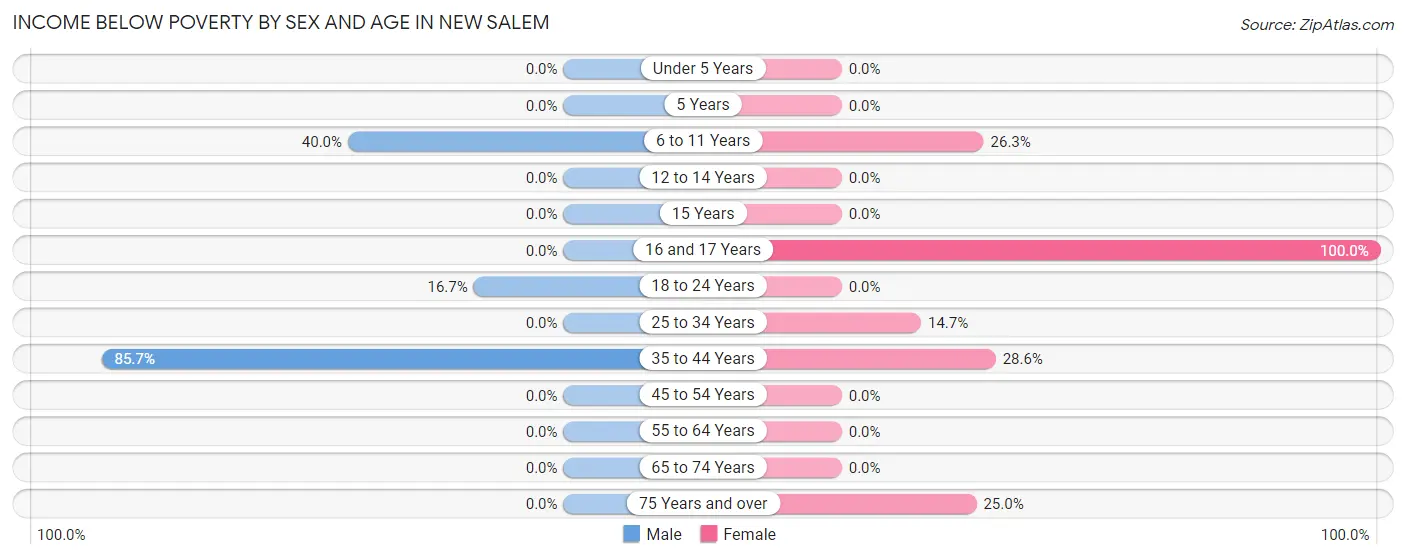
| Age Bracket | Male | Female |
| Under 5 Years | 0 (0.0%) | 0 (0.0%) |
| 5 Years | 0 (0.0%) | 0 (0.0%) |
| 6 to 11 Years | 2 (40.0%) | 5 (26.3%) |
| 12 to 14 Years | 0 (0.0%) | 0 (0.0%) |
| 15 Years | 0 (0.0%) | 0 (0.0%) |
| 16 and 17 Years | 0 (0.0%) | 3 (100.0%) |
| 18 to 24 Years | 2 (16.7%) | 0 (0.0%) |
| 25 to 34 Years | 0 (0.0%) | 5 (14.7%) |
| 35 to 44 Years | 6 (85.7%) | 6 (28.6%) |
| 45 to 54 Years | 0 (0.0%) | 0 (0.0%) |
| 55 to 64 Years | 0 (0.0%) | 0 (0.0%) |
| 65 to 74 Years | 0 (0.0%) | 0 (0.0%) |
| 75 Years and over | 0 (0.0%) | 2 (25.0%) |
| Total | 10 (8.9%) | 21 (21.4%) |
Income Above Poverty by Sex and Age in New Salem
According to the poverty statistics in New Salem, males aged under 5 years and females aged under 5 years are the age groups that are most secure financially, with 100.0% of males and 100.0% of females in these age groups living above the poverty line.
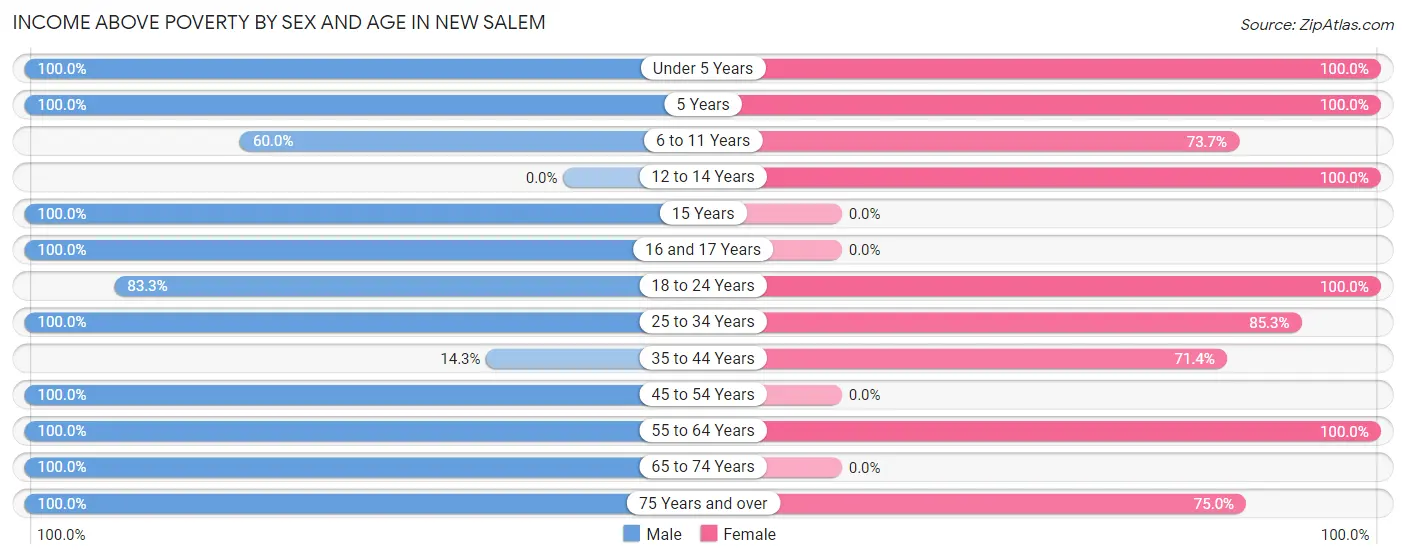
| Age Bracket | Male | Female |
| Under 5 Years | 16 (100.0%) | 4 (100.0%) |
| 5 Years | 1 (100.0%) | 1 (100.0%) |
| 6 to 11 Years | 3 (60.0%) | 14 (73.7%) |
| 12 to 14 Years | 0 (0.0%) | 1 (100.0%) |
| 15 Years | 8 (100.0%) | 0 (0.0%) |
| 16 and 17 Years | 4 (100.0%) | 0 (0.0%) |
| 18 to 24 Years | 10 (83.3%) | 1 (100.0%) |
| 25 to 34 Years | 8 (100.0%) | 29 (85.3%) |
| 35 to 44 Years | 1 (14.3%) | 15 (71.4%) |
| 45 to 54 Years | 36 (100.0%) | 0 (0.0%) |
| 55 to 64 Years | 2 (100.0%) | 6 (100.0%) |
| 65 to 74 Years | 6 (100.0%) | 0 (0.0%) |
| 75 Years and over | 7 (100.0%) | 6 (75.0%) |
| Total | 102 (91.1%) | 77 (78.6%) |
Income Below Poverty Among Married-Couple Families in New Salem
The poverty statistics for married-couple families in New Salem show that 3.5% or 1 of the total 29 families live below the poverty line. Families with 1 or 2 children have the highest poverty rate of 50.0%, comprising of 1 families. On the other hand, families with no children have the lowest poverty rate of 0.0%, which includes 0 families.
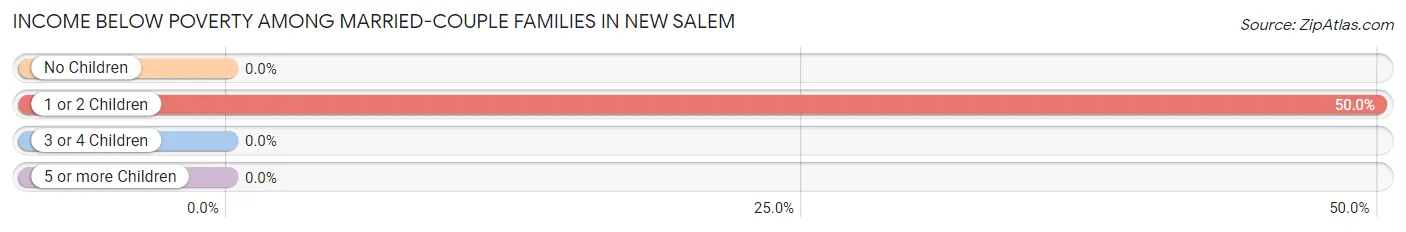
| Children | Above Poverty | Below Poverty |
| No Children | 22 (100.0%) | 0 (0.0%) |
| 1 or 2 Children | 1 (50.0%) | 1 (50.0%) |
| 3 or 4 Children | 5 (100.0%) | 0 (0.0%) |
| 5 or more Children | 0 (0.0%) | 0 (0.0%) |
| Total | 28 (96.6%) | 1 (3.5%) |
Income Below Poverty Among Single-Parent Households in New Salem
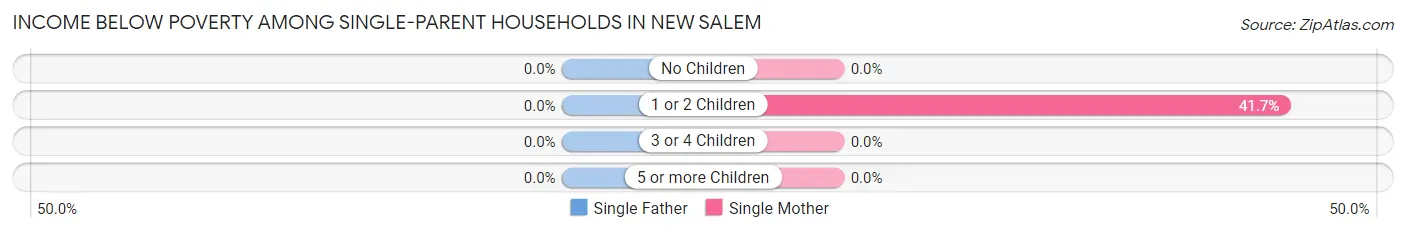
| Children | Single Father | Single Mother |
| No Children | 0 (0.0%) | 0 (0.0%) |
| 1 or 2 Children | 0 (0.0%) | 5 (41.7%) |
| 3 or 4 Children | 0 (0.0%) | 0 (0.0%) |
| 5 or more Children | 0 (0.0%) | 0 (0.0%) |
| Total | 0 (0.0%) | 5 (27.8%) |
Income Below Poverty Among Married-Couple vs Single-Parent Households in New Salem
The poverty data for New Salem shows that 1 of the married-couple family households (3.5%) and 5 of the single-parent households (20.8%) are living below the poverty level. Within the married-couple family households, those with 1 or 2 children have the highest poverty rate, with 1 households (50.0%) falling below the poverty line. Among the single-parent households, those with 1 or 2 children have the highest poverty rate, with 5 household (38.5%) living below poverty.
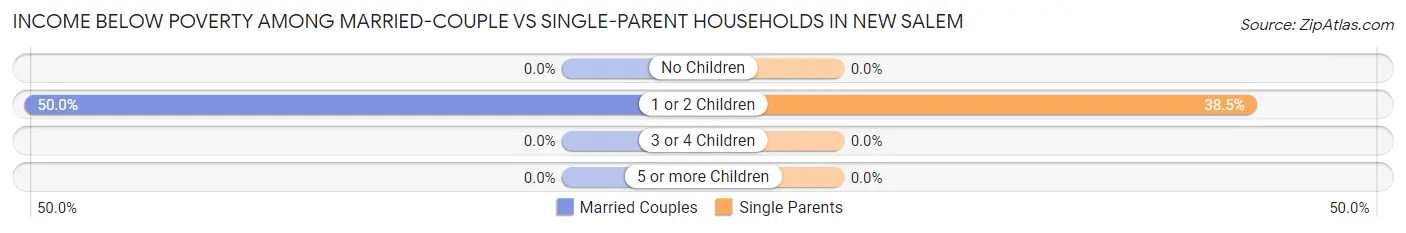
| Children | Married-Couple Families | Single-Parent Households |
| No Children | 0 (0.0%) | 0 (0.0%) |
| 1 or 2 Children | 1 (50.0%) | 5 (38.5%) |
| 3 or 4 Children | 0 (0.0%) | 0 (0.0%) |
| 5 or more Children | 0 (0.0%) | 0 (0.0%) |
| Total | 1 (3.5%) | 5 (20.8%) |
Race in New Salem
The most populous races in New Salem are White / Caucasian (206 | 98.1%), and Two or more Races (4 | 1.9%).
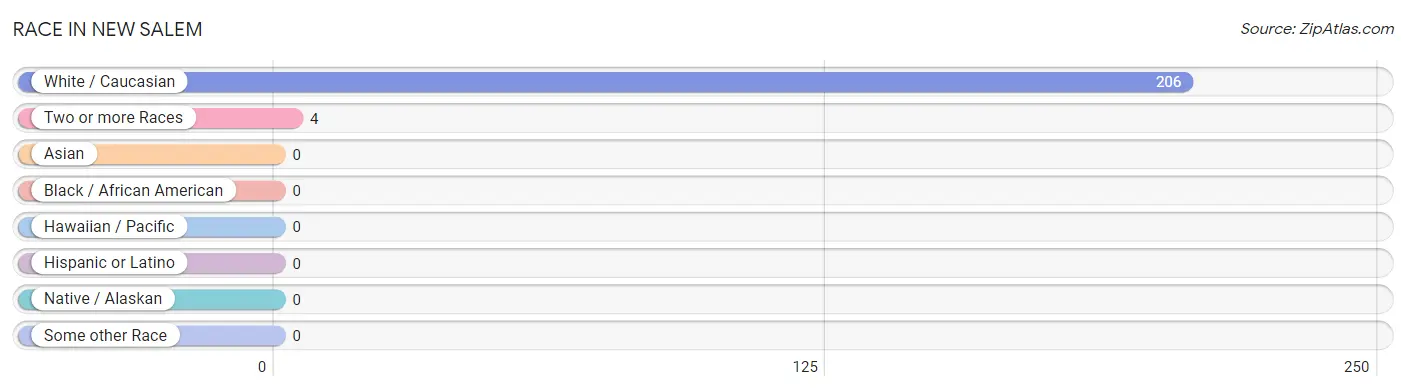
| Race | # Population | % Population |
| Asian | 0 | 0.0% |
| Black / African American | 0 | 0.0% |
| Hawaiian / Pacific | 0 | 0.0% |
| Hispanic or Latino | 0 | 0.0% |
| Native / Alaskan | 0 | 0.0% |
| White / Caucasian | 206 | 98.1% |
| Two or more Races | 4 | 1.9% |
| Some other Race | 0 | 0.0% |
| Total | 210 | 100.0% |
Ancestry in New Salem
The most populous ancestries reported in New Salem are German (71 | 33.8%), Irish (29 | 13.8%), French (12 | 5.7%), American (11 | 5.2%), and English (9 | 4.3%), together accounting for 62.9% of all New Salem residents.
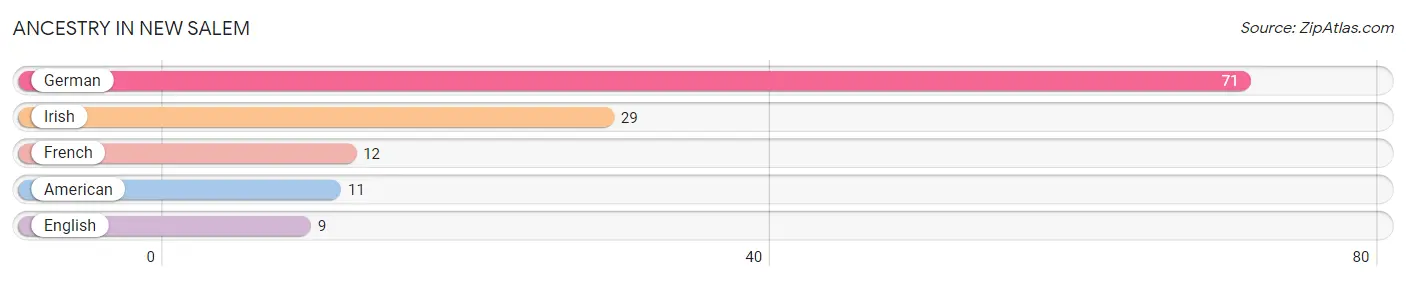
| Ancestry | # Population | % Population |
| American | 11 | 5.2% |
| English | 9 | 4.3% |
| French | 12 | 5.7% |
| German | 71 | 33.8% |
| Irish | 29 | 13.8% | View All 5 Rows |
Immigrants in New Salem

| Immigration Origin | # Population | % Population | View All 0 Rows |
Sex and Age in New Salem
Sex and Age in New Salem
The most populous age groups in New Salem are 45 to 49 Years (36 | 32.1%) for men and 30 to 34 Years (29 | 29.6%) for women.
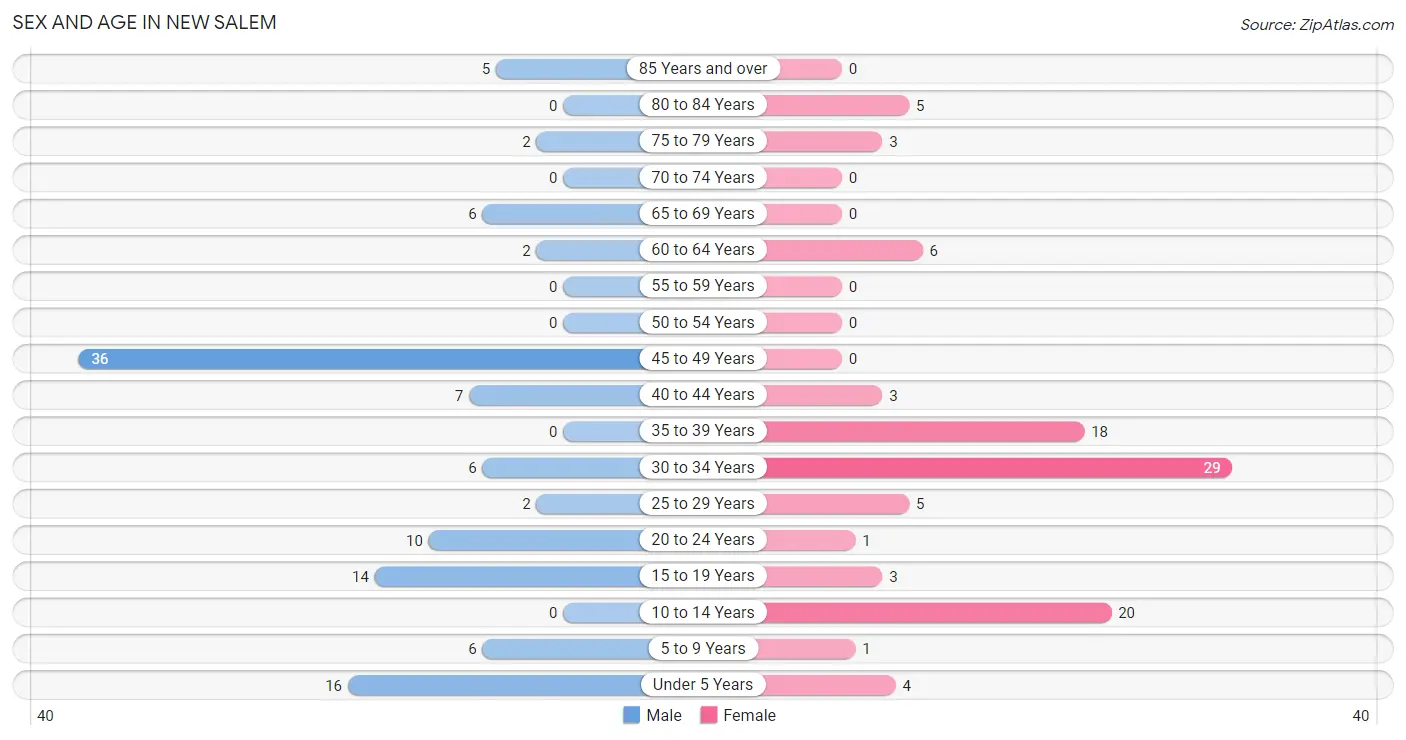
| Age Bracket | Male | Female |
| Under 5 Years | 16 (14.3%) | 4 (4.1%) |
| 5 to 9 Years | 6 (5.4%) | 1 (1.0%) |
| 10 to 14 Years | 0 (0.0%) | 20 (20.4%) |
| 15 to 19 Years | 14 (12.5%) | 3 (3.1%) |
| 20 to 24 Years | 10 (8.9%) | 1 (1.0%) |
| 25 to 29 Years | 2 (1.8%) | 5 (5.1%) |
| 30 to 34 Years | 6 (5.4%) | 29 (29.6%) |
| 35 to 39 Years | 0 (0.0%) | 18 (18.4%) |
| 40 to 44 Years | 7 (6.2%) | 3 (3.1%) |
| 45 to 49 Years | 36 (32.1%) | 0 (0.0%) |
| 50 to 54 Years | 0 (0.0%) | 0 (0.0%) |
| 55 to 59 Years | 0 (0.0%) | 0 (0.0%) |
| 60 to 64 Years | 2 (1.8%) | 6 (6.1%) |
| 65 to 69 Years | 6 (5.4%) | 0 (0.0%) |
| 70 to 74 Years | 0 (0.0%) | 0 (0.0%) |
| 75 to 79 Years | 2 (1.8%) | 3 (3.1%) |
| 80 to 84 Years | 0 (0.0%) | 5 (5.1%) |
| 85 Years and over | 5 (4.5%) | 0 (0.0%) |
| Total | 112 (100.0%) | 98 (100.0%) |
Families and Households in New Salem
Median Family Size in New Salem
The median family size in New Salem is 3.34 persons per family, with single male/father families (6 | 11.3%) accounting for the largest median family size of 3.67 persons per family. On the other hand, single female/mother families (18 | 34.0%) represent the smallest median family size with 2.94 persons per family.
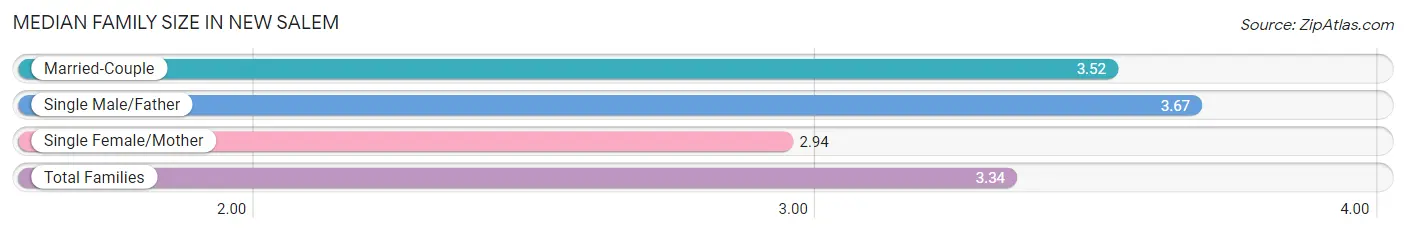
| Family Type | # Families | Family Size |
| Married-Couple | 29 (54.7%) | 3.52 |
| Single Male/Father | 6 (11.3%) | 3.67 |
| Single Female/Mother | 18 (34.0%) | 2.94 |
| Total Families | 53 (100.0%) | 3.34 |
Median Household Size in New Salem
The median household size in New Salem is 3.04 persons per household, with single male/father households (6 | 8.7%) accounting for the largest median household size of 4.83 persons per household. non-family households (16 | 23.2%) represent the smallest median household size with 1.25 persons per household.
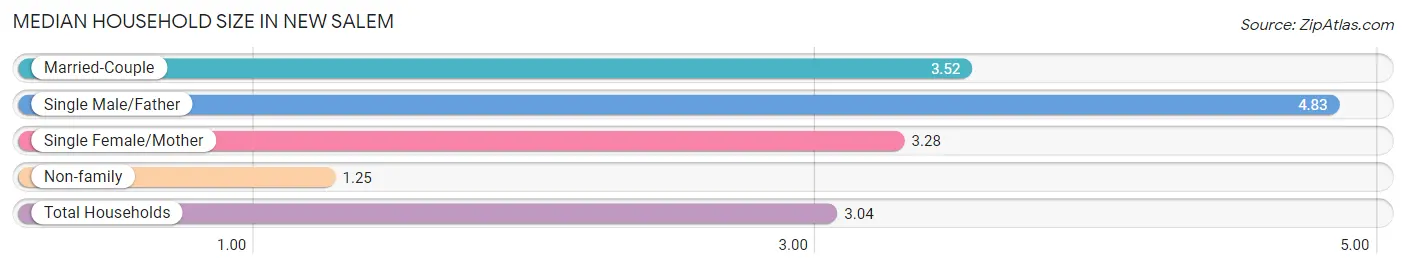
| Household Type | # Households | Household Size |
| Married-Couple | 29 (42.0%) | 3.52 |
| Single Male/Father | 6 (8.7%) | 4.83 |
| Single Female/Mother | 18 (26.1%) | 3.28 |
| Non-family | 16 (23.2%) | 1.25 |
| Total Households | 69 (100.0%) | 3.04 |
Household Size by Marriage Status in New Salem
Out of a total of 69 households in New Salem, 53 (76.8%) are family households, while 16 (23.2%) are nonfamily households. The most numerous type of family households are 2-person households, comprising 38, and the most common type of nonfamily households are 1-person households, comprising 15.
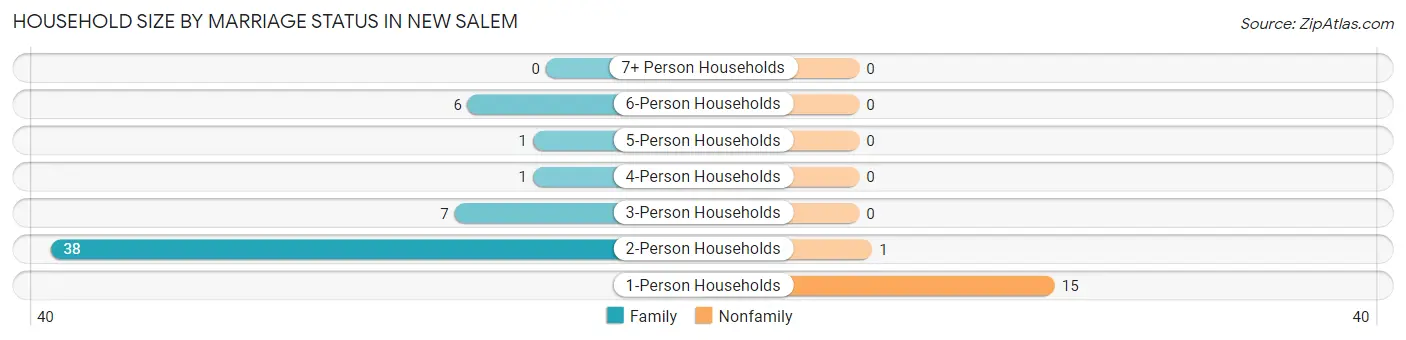
| Household Size | Family Households | Nonfamily Households |
| 1-Person Households | - | 15 (21.7%) |
| 2-Person Households | 38 (55.1%) | 1 (1.5%) |
| 3-Person Households | 7 (10.1%) | 0 (0.0%) |
| 4-Person Households | 1 (1.5%) | 0 (0.0%) |
| 5-Person Households | 1 (1.5%) | 0 (0.0%) |
| 6-Person Households | 6 (8.7%) | 0 (0.0%) |
| 7+ Person Households | 0 (0.0%) | 0 (0.0%) |
| Total | 53 (76.8%) | 16 (23.2%) |
Female Fertility in New Salem
Fertility by Age in New Salem
Average fertility rate in New Salem is 51.0 births per 1,000 women. Women in the age bracket of 35 to 50 years have the highest fertility rate with 143.0 births per 1,000 women. Women in the age bracket of 35 to 50 years acount for 100.0% of all women with births.
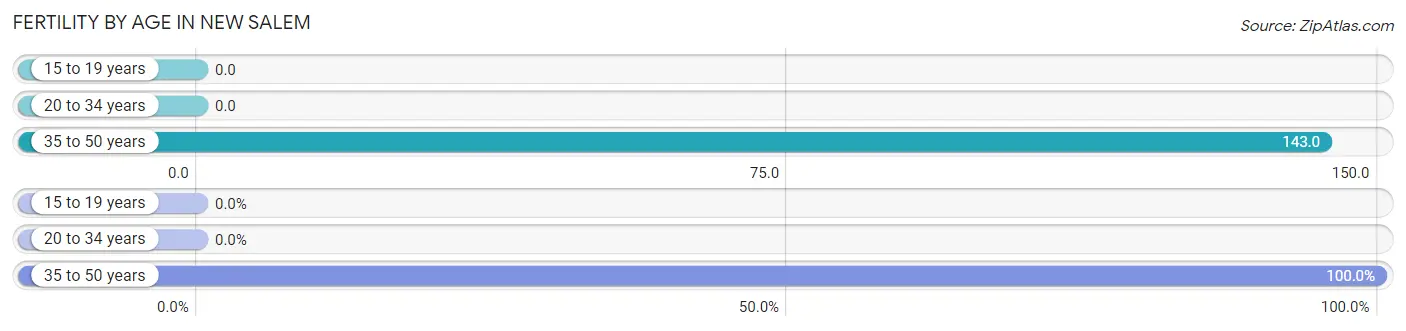
| Age Bracket | Women with Births | Births / 1,000 Women |
| 15 to 19 years | 0 (0.0%) | 0.0 |
| 20 to 34 years | 0 (0.0%) | 0.0 |
| 35 to 50 years | 3 (100.0%) | 143.0 |
| Total | 3 (100.0%) | 51.0 |
Fertility by Age by Marriage Status in New Salem
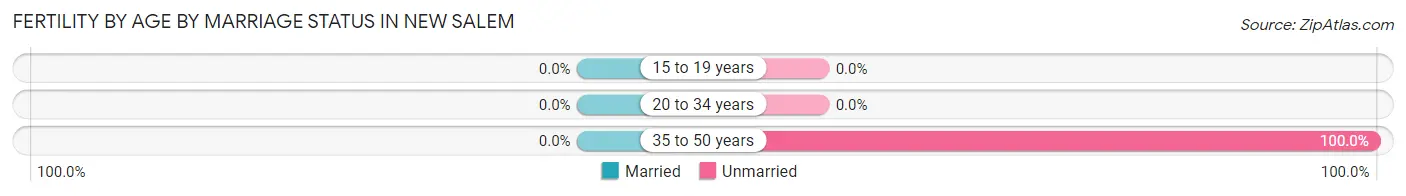
| Age Bracket | Married | Unmarried |
| 15 to 19 years | 0 (0.0%) | 0 (0.0%) |
| 20 to 34 years | 0 (0.0%) | 0 (0.0%) |
| 35 to 50 years | 0 (0.0%) | 3 (100.0%) |
| Total | 0 (0.0%) | 3 (100.0%) |
Fertility by Education in New Salem
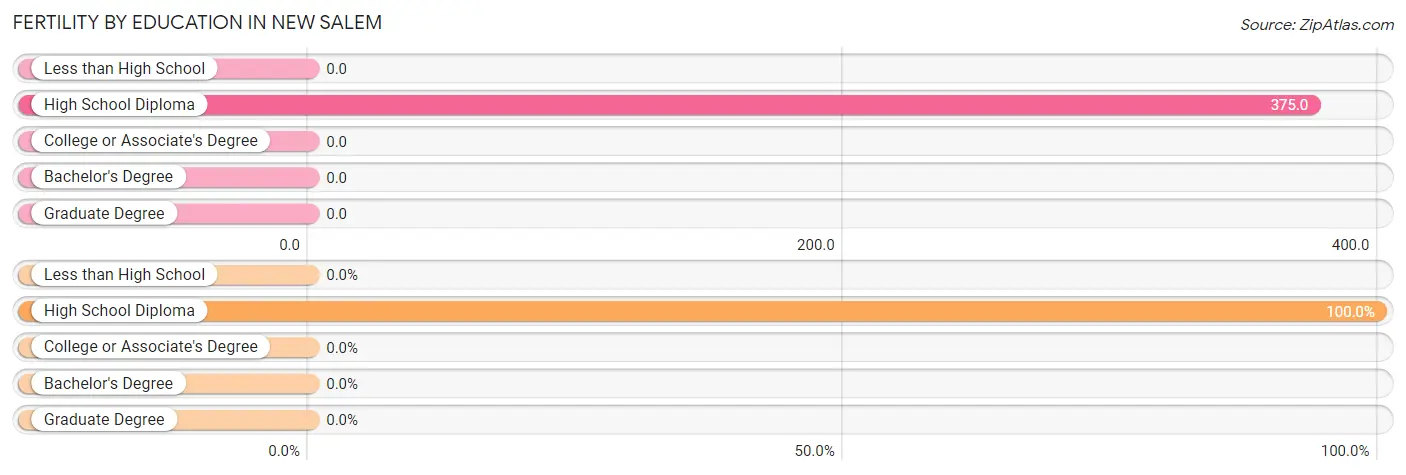
| Educational Attainment | Women with Births | Births / 1,000 Women |
| Less than High School | 0 (0.0%) | 0.0 |
| High School Diploma | 3 (100.0%) | 375.0 |
| College or Associate's Degree | 0 (0.0%) | 0.0 |
| Bachelor's Degree | 0 (0.0%) | 0.0 |
| Graduate Degree | 0 (0.0%) | 0.0 |
| Total | 3 (100.0%) | 51.0 |
Fertility by Education by Marriage Status in New Salem
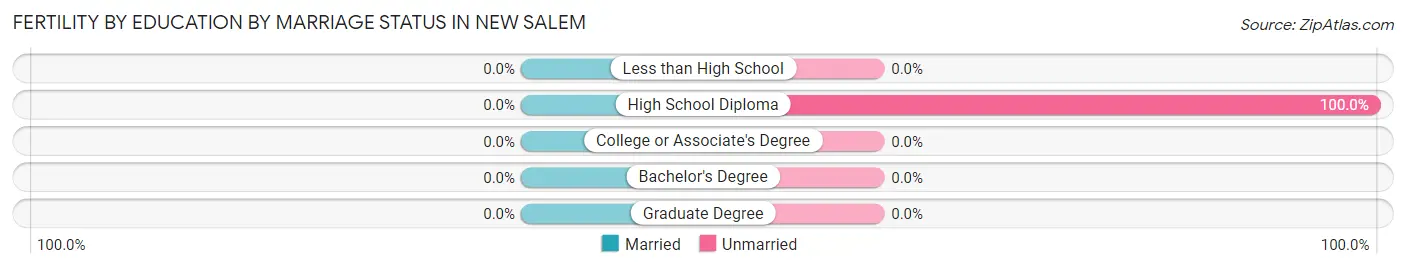
| Educational Attainment | Married | Unmarried |
| Less than High School | 0 (0.0%) | 0 (0.0%) |
| High School Diploma | 0 (0.0%) | 3 (100.0%) |
| College or Associate's Degree | 0 (0.0%) | 0 (0.0%) |
| Bachelor's Degree | 0 (0.0%) | 0 (0.0%) |
| Graduate Degree | 0 (0.0%) | 0 (0.0%) |
| Total | 0 (0.0%) | 3 (100.0%) |
Employment Characteristics in New Salem
Employment by Class of Employer in New Salem
Among the 102 employed individuals in New Salem, private company employees (66 | 64.7%), self-employed (not incorporated) (31 | 30.4%), and not-for-profit organizations (2 | 2.0%) make up the most common classes of employment.
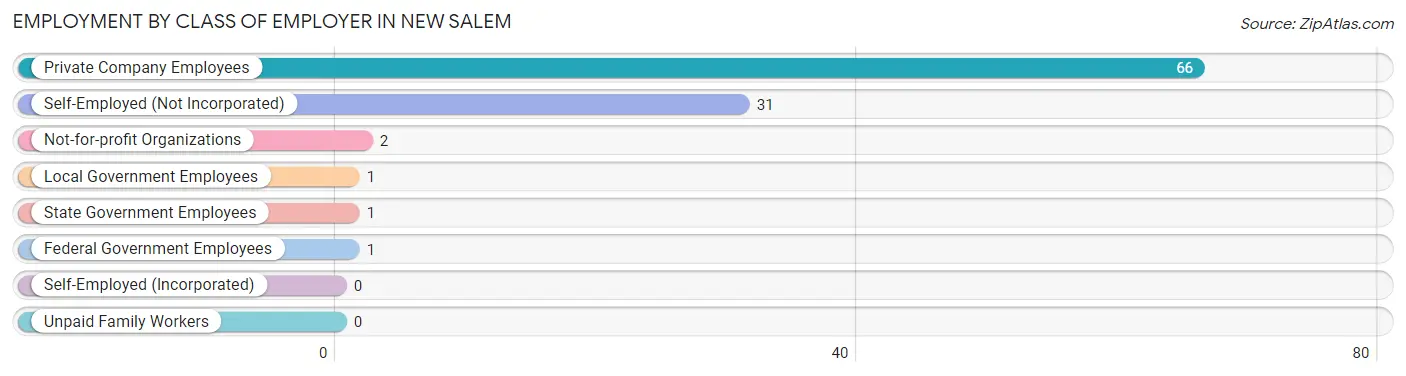
| Employer Class | # Employees | % Employees |
| Private Company Employees | 66 | 64.7% |
| Self-Employed (Incorporated) | 0 | 0.0% |
| Self-Employed (Not Incorporated) | 31 | 30.4% |
| Not-for-profit Organizations | 2 | 2.0% |
| Local Government Employees | 1 | 1.0% |
| State Government Employees | 1 | 1.0% |
| Federal Government Employees | 1 | 1.0% |
| Unpaid Family Workers | 0 | 0.0% |
| Total | 102 | 100.0% |
Employment Status by Age in New Salem
According to the labor force statistics for New Salem, out of the total population over 16 years of age (155), 67.1% or 104 individuals are in the labor force, with 1.9% or 2 of them unemployed. The age group with the highest labor force participation rate is 20 to 24 years, with 100.0% or 11 individuals in the labor force. Within the labor force, the 35 to 44 years age range has the highest percentage of unemployed individuals, with 12.5% or 1 of them being unemployed.
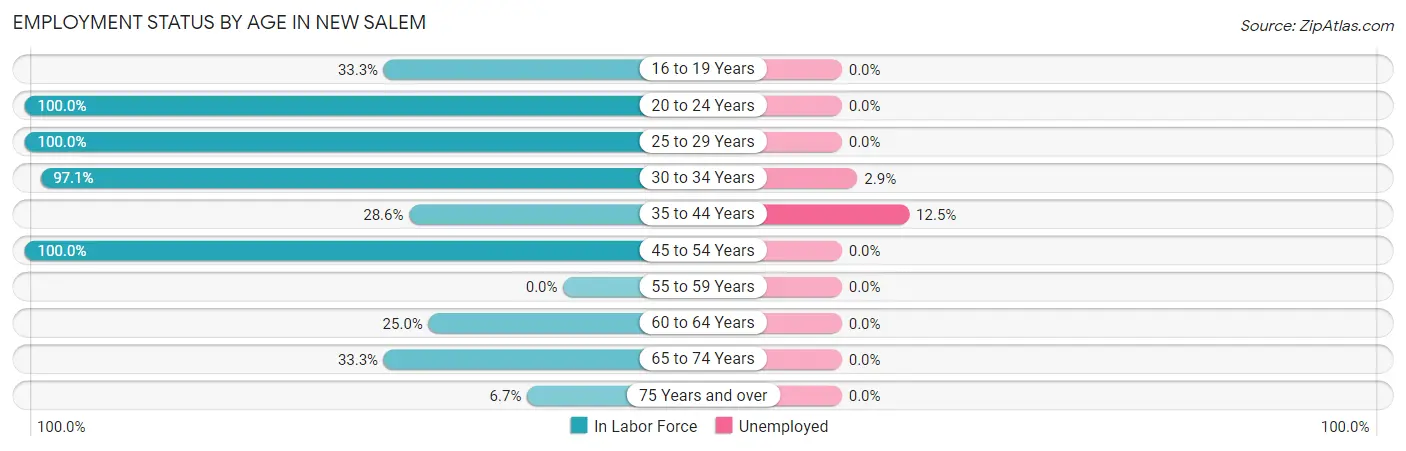
| Age Bracket | In Labor Force | Unemployed |
| 16 to 19 Years | 3 (33.3%) | 0 (0.0%) |
| 20 to 24 Years | 11 (100.0%) | 0 (0.0%) |
| 25 to 29 Years | 7 (100.0%) | 0 (0.0%) |
| 30 to 34 Years | 34 (97.1%) | 1 (2.9%) |
| 35 to 44 Years | 8 (28.6%) | 1 (12.5%) |
| 45 to 54 Years | 36 (100.0%) | 0 (0.0%) |
| 55 to 59 Years | 0 (0.0%) | 0 (0.0%) |
| 60 to 64 Years | 2 (25.0%) | 0 (0.0%) |
| 65 to 74 Years | 2 (33.3%) | 0 (0.0%) |
| 75 Years and over | 1 (6.7%) | 0 (0.0%) |
| Total | 104 (67.1%) | 2 (1.9%) |
Employment Status by Educational Attainment in New Salem
According to labor force statistics for New Salem, 76.3% of individuals (87) out of the total population between 25 and 64 years of age (114) are in the labor force, with 2.3% or 2 of them being unemployed. The group with the highest labor force participation rate are those with the educational attainment of bachelor's degree or higher, with 100.0% or 11 individuals in the labor force. Within the labor force, individuals with high school diploma education have the highest percentage of unemployment, with 5.6% or 1 of them being unemployed.
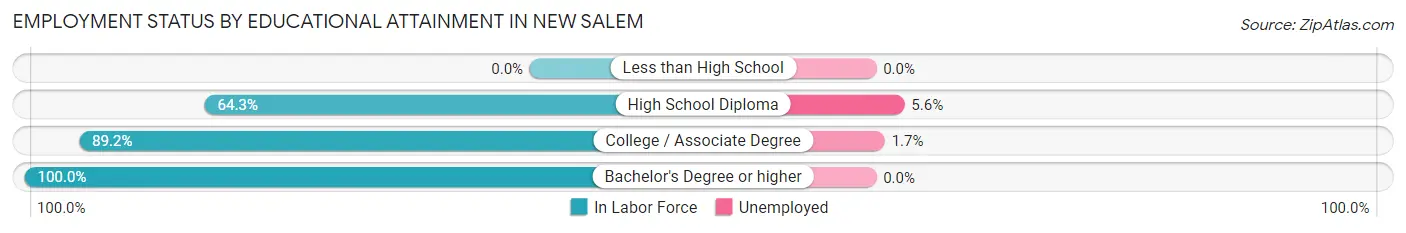
| Educational Attainment | In Labor Force | Unemployed |
| Less than High School | 0 (0.0%) | 0 (0.0%) |
| High School Diploma | 18 (64.3%) | 2 (5.6%) |
| College / Associate Degree | 58 (89.2%) | 1 (1.7%) |
| Bachelor's Degree or higher | 11 (100.0%) | 0 (0.0%) |
| Total | 87 (76.3%) | 3 (2.3%) |
Employment Occupations by Sex in New Salem
Management, Business, Science and Arts Occupations
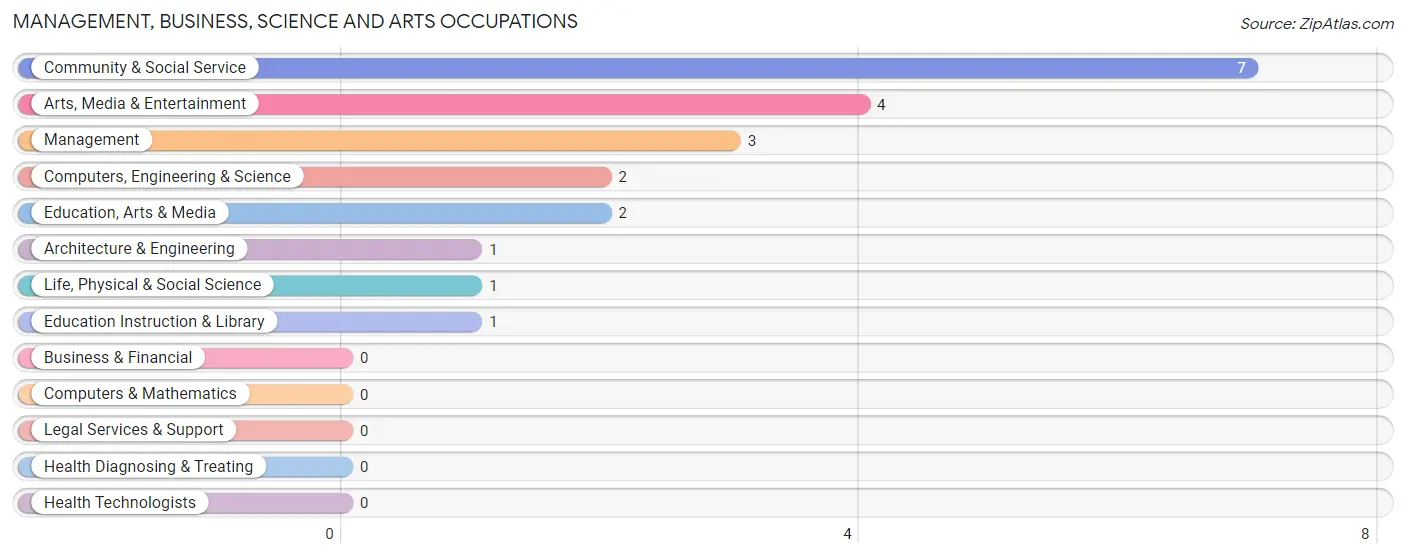
The most common Management, Business, Science and Arts occupations in New Salem are Community & Social Service (7 | 6.9%), Arts, Media & Entertainment (4 | 3.9%), Management (3 | 2.9%), Computers, Engineering & Science (2 | 2.0%), and Education, Arts & Media (2 | 2.0%).
Management, Business, Science and Arts Occupations by Sex
Within the Management, Business, Science and Arts occupations in New Salem, the most male-oriented occupations are Computers, Engineering & Science (100.0%), Architecture & Engineering (100.0%), and Life, Physical & Social Science (100.0%), while the most female-oriented occupations are Community & Social Service (100.0%), Education, Arts & Media (100.0%), and Education Instruction & Library (100.0%).
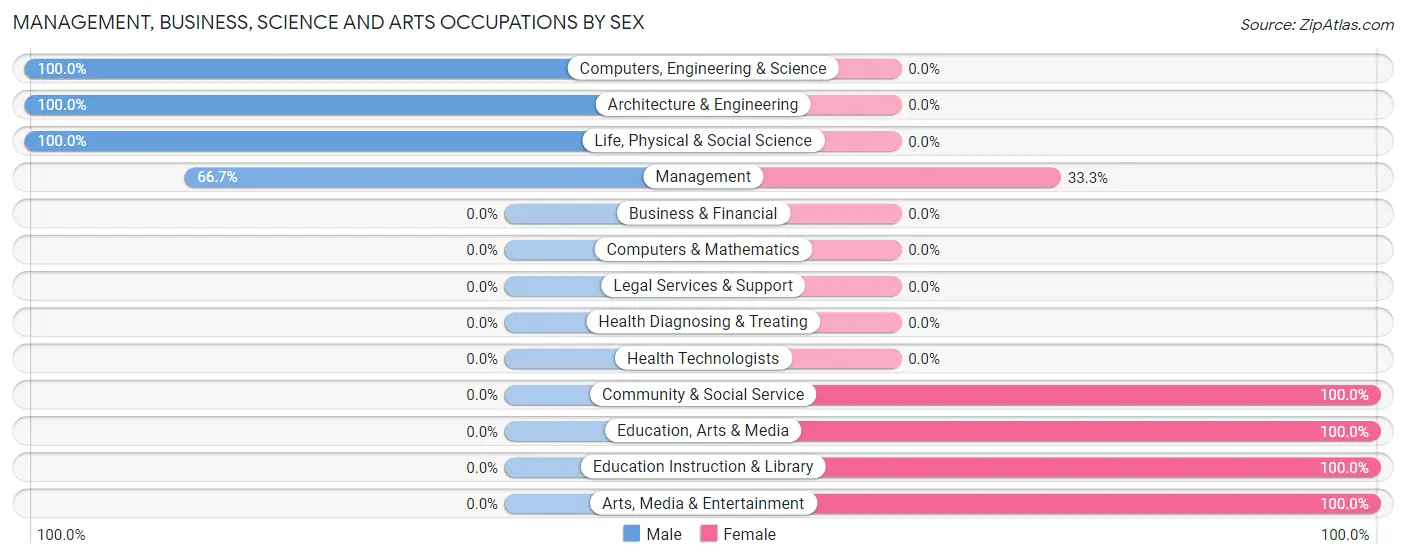
| Occupation | Male | Female |
| Management | 2 (66.7%) | 1 (33.3%) |
| Business & Financial | 0 (0.0%) | 0 (0.0%) |
| Computers, Engineering & Science | 2 (100.0%) | 0 (0.0%) |
| Computers & Mathematics | 0 (0.0%) | 0 (0.0%) |
| Architecture & Engineering | 1 (100.0%) | 0 (0.0%) |
| Life, Physical & Social Science | 1 (100.0%) | 0 (0.0%) |
| Community & Social Service | 0 (0.0%) | 7 (100.0%) |
| Education, Arts & Media | 0 (0.0%) | 2 (100.0%) |
| Legal Services & Support | 0 (0.0%) | 0 (0.0%) |
| Education Instruction & Library | 0 (0.0%) | 1 (100.0%) |
| Arts, Media & Entertainment | 0 (0.0%) | 4 (100.0%) |
| Health Diagnosing & Treating | 0 (0.0%) | 0 (0.0%) |
| Health Technologists | 0 (0.0%) | 0 (0.0%) |
| Total (Category) | 4 (33.3%) | 8 (66.7%) |
| Total (Overall) | 60 (58.8%) | 42 (41.2%) |
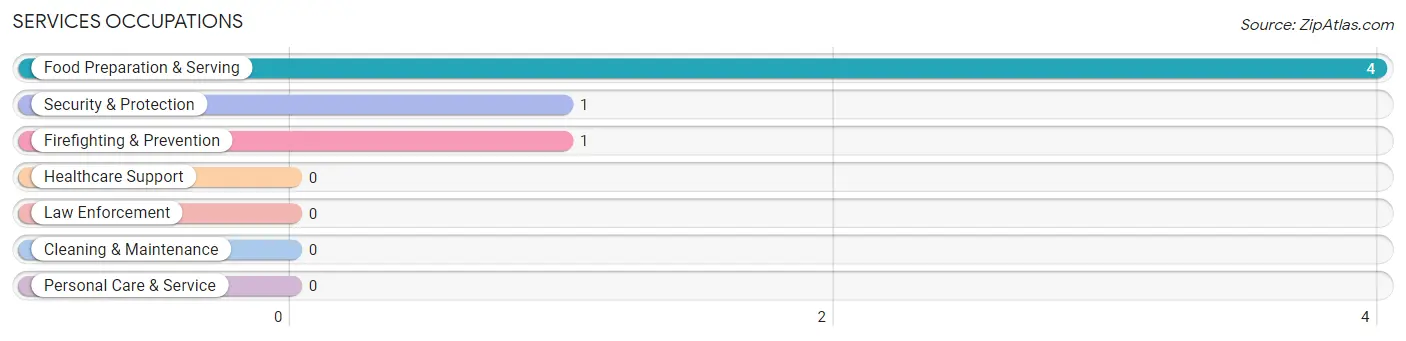
Services Occupations
The most common Services occupations in New Salem are Food Preparation & Serving (4 | 3.9%), Security & Protection (1 | 1.0%), and Firefighting & Prevention (1 | 1.0%).
Services Occupations by Sex
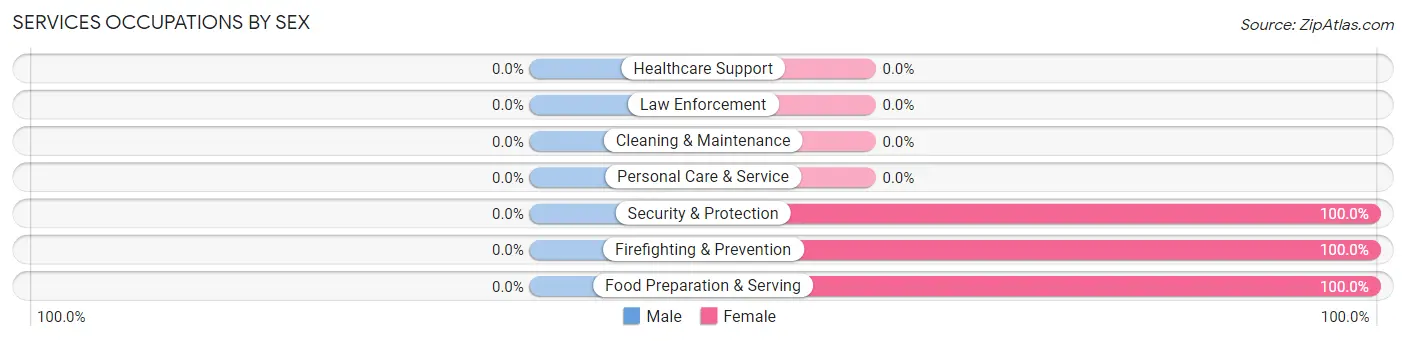
| Occupation | Male | Female |
| Healthcare Support | 0 (0.0%) | 0 (0.0%) |
| Security & Protection | 0 (0.0%) | 1 (100.0%) |
| Firefighting & Prevention | 0 (0.0%) | 1 (100.0%) |
| Law Enforcement | 0 (0.0%) | 0 (0.0%) |
| Food Preparation & Serving | 0 (0.0%) | 4 (100.0%) |
| Cleaning & Maintenance | 0 (0.0%) | 0 (0.0%) |
| Personal Care & Service | 0 (0.0%) | 0 (0.0%) |
| Total (Category) | 0 (0.0%) | 5 (100.0%) |
| Total (Overall) | 60 (58.8%) | 42 (41.2%) |
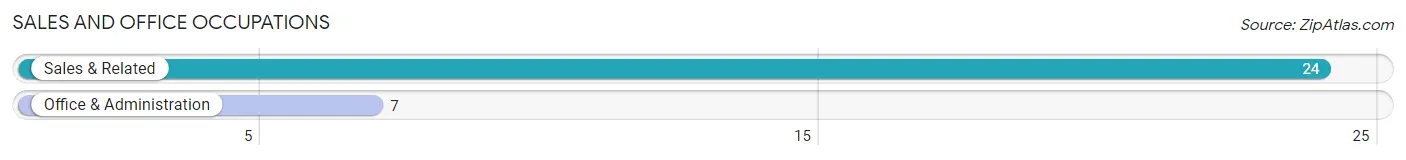
Sales and Office Occupations
The most common Sales and Office occupations in New Salem are Sales & Related (24 | 23.5%), and Office & Administration (7 | 6.9%).
Sales and Office Occupations by Sex
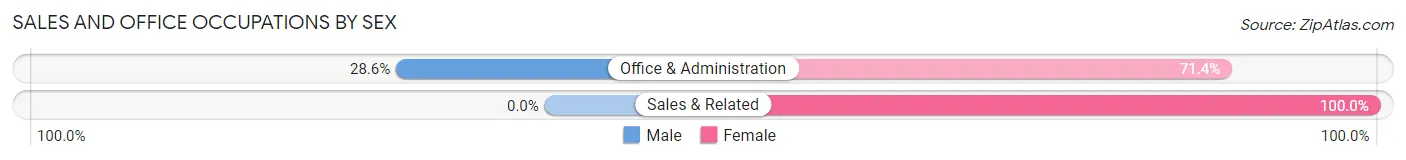
| Occupation | Male | Female |
| Sales & Related | 0 (0.0%) | 24 (100.0%) |
| Office & Administration | 2 (28.6%) | 5 (71.4%) |
| Total (Category) | 2 (6.5%) | 29 (93.5%) |
| Total (Overall) | 60 (58.8%) | 42 (41.2%) |
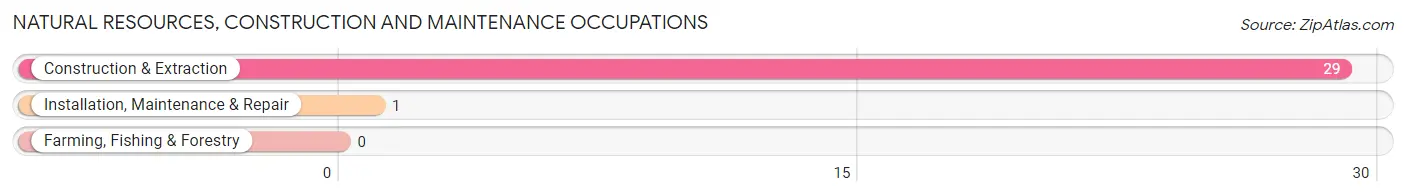
Natural Resources, Construction and Maintenance Occupations
The most common Natural Resources, Construction and Maintenance occupations in New Salem are Construction & Extraction (29 | 28.4%), and Installation, Maintenance & Repair (1 | 1.0%).
Natural Resources, Construction and Maintenance Occupations by Sex
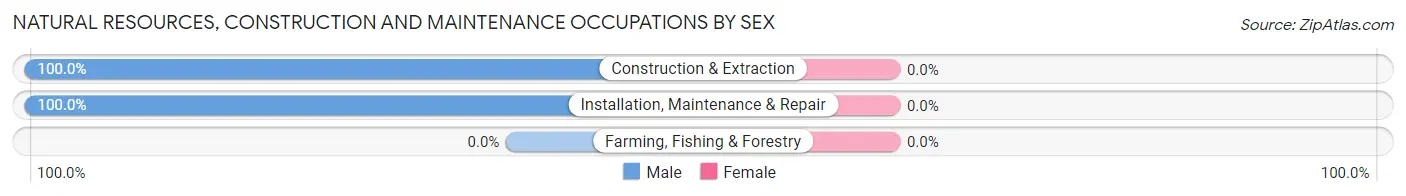
| Occupation | Male | Female |
| Farming, Fishing & Forestry | 0 (0.0%) | 0 (0.0%) |
| Construction & Extraction | 29 (100.0%) | 0 (0.0%) |
| Installation, Maintenance & Repair | 1 (100.0%) | 0 (0.0%) |
| Total (Category) | 30 (100.0%) | 0 (0.0%) |
| Total (Overall) | 60 (58.8%) | 42 (41.2%) |
Production, Transportation and Moving Occupations
The most common Production, Transportation and Moving occupations in New Salem are Transportation (13 | 12.8%), Material Moving (10 | 9.8%), and Production (1 | 1.0%).
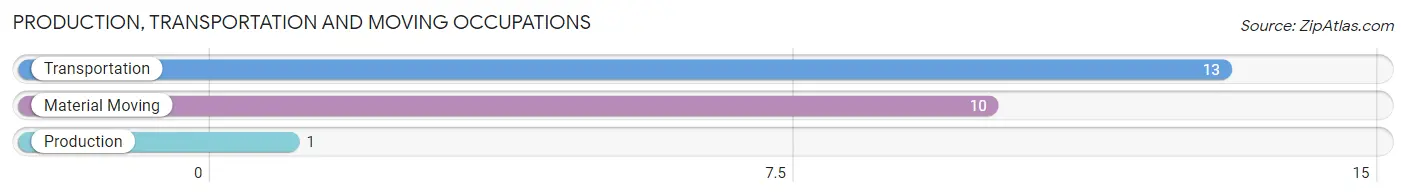
Production, Transportation and Moving Occupations by Sex
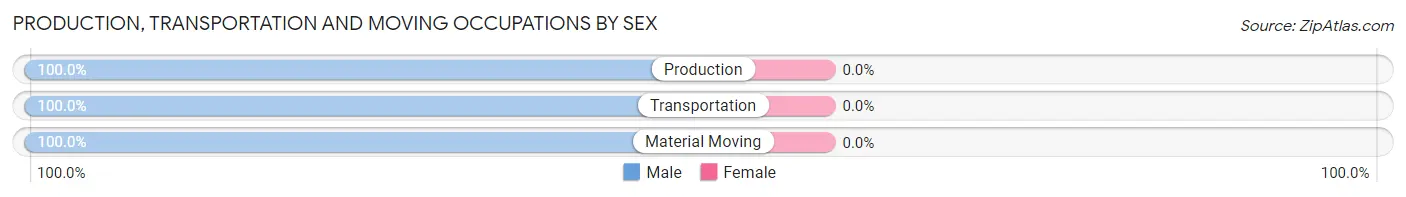
| Occupation | Male | Female |
| Production | 1 (100.0%) | 0 (0.0%) |
| Transportation | 13 (100.0%) | 0 (0.0%) |
| Material Moving | 10 (100.0%) | 0 (0.0%) |
| Total (Category) | 24 (100.0%) | 0 (0.0%) |
| Total (Overall) | 60 (58.8%) | 42 (41.2%) |
Employment Industries by Sex in New Salem
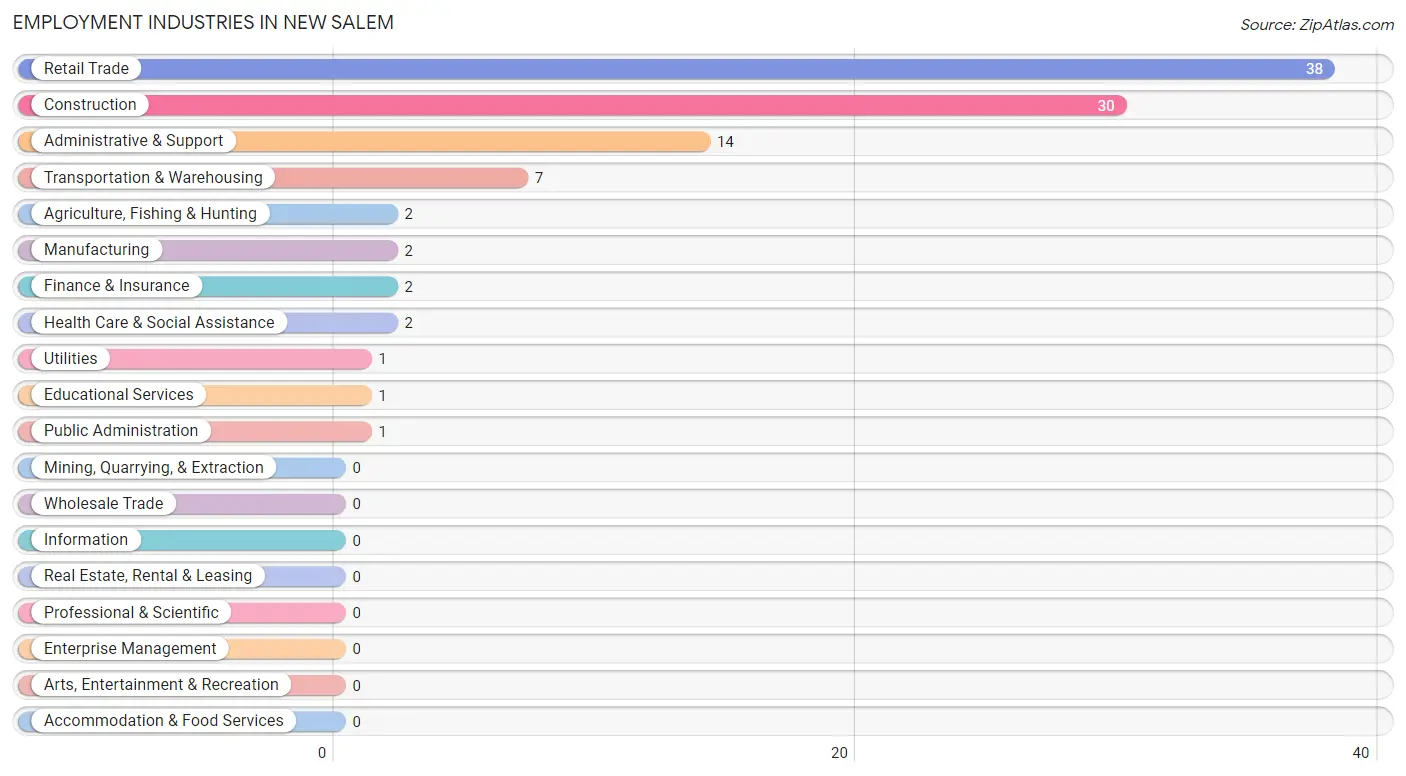
Employment Industries in New Salem
The major employment industries in New Salem include Retail Trade (38 | 37.2%), Construction (30 | 29.4%), Administrative & Support (14 | 13.7%), Transportation & Warehousing (7 | 6.9%), and Agriculture, Fishing & Hunting (2 | 2.0%).
Employment Industries by Sex in New Salem
The New Salem industries that see more men than women are Agriculture, Fishing & Hunting (100.0%), Transportation & Warehousing (100.0%), and Utilities (100.0%), whereas the industries that tend to have a higher number of women are Educational Services (100.0%), Health Care & Social Assistance (100.0%), and Retail Trade (73.7%).
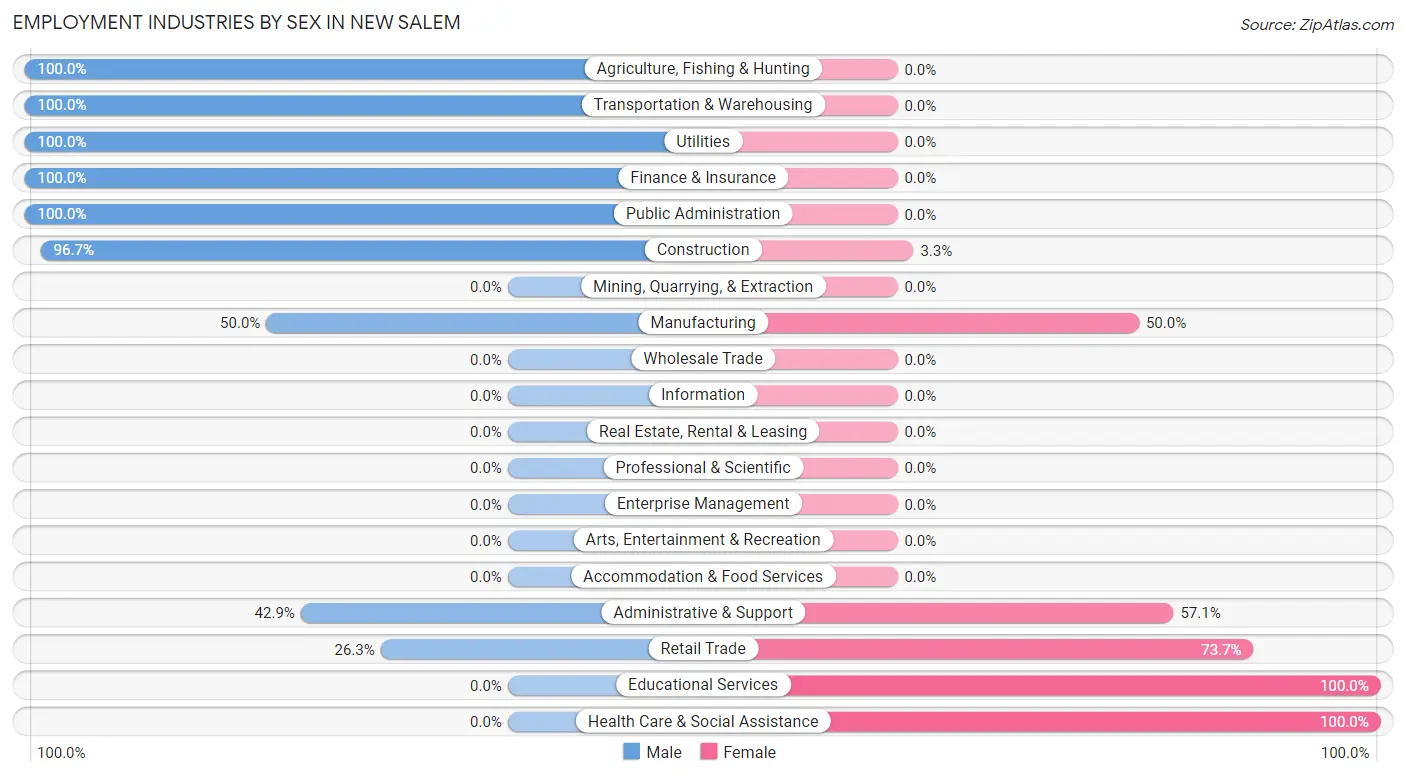
| Industry | Male | Female |
| Agriculture, Fishing & Hunting | 2 (100.0%) | 0 (0.0%) |
| Mining, Quarrying, & Extraction | 0 (0.0%) | 0 (0.0%) |
| Construction | 29 (96.7%) | 1 (3.3%) |
| Manufacturing | 1 (50.0%) | 1 (50.0%) |
| Wholesale Trade | 0 (0.0%) | 0 (0.0%) |
| Retail Trade | 10 (26.3%) | 28 (73.7%) |
| Transportation & Warehousing | 7 (100.0%) | 0 (0.0%) |
| Utilities | 1 (100.0%) | 0 (0.0%) |
| Information | 0 (0.0%) | 0 (0.0%) |
| Finance & Insurance | 2 (100.0%) | 0 (0.0%) |
| Real Estate, Rental & Leasing | 0 (0.0%) | 0 (0.0%) |
| Professional & Scientific | 0 (0.0%) | 0 (0.0%) |
| Enterprise Management | 0 (0.0%) | 0 (0.0%) |
| Administrative & Support | 6 (42.9%) | 8 (57.1%) |
| Educational Services | 0 (0.0%) | 1 (100.0%) |
| Health Care & Social Assistance | 0 (0.0%) | 2 (100.0%) |
| Arts, Entertainment & Recreation | 0 (0.0%) | 0 (0.0%) |
| Accommodation & Food Services | 0 (0.0%) | 0 (0.0%) |
| Public Administration | 1 (100.0%) | 0 (0.0%) |
| Total | 60 (58.8%) | 42 (41.2%) |
Education in New Salem
School Enrollment in New Salem
The most common levels of schooling among the 53 students in New Salem are high school (24 | 45.3%), middle school (20 | 37.7%), and kindergarten (3 | 5.7%).
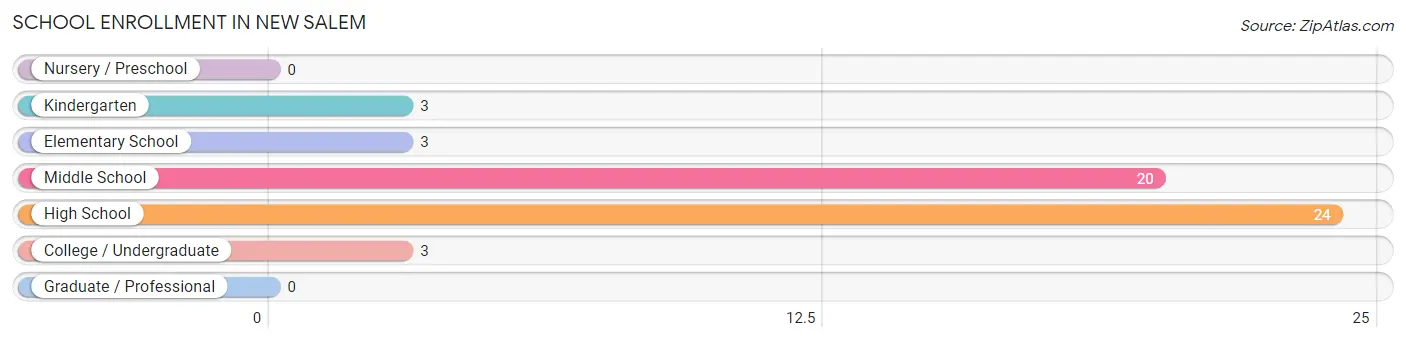
| School Level | # Students | % Students |
| Nursery / Preschool | 0 | 0.0% |
| Kindergarten | 3 | 5.7% |
| Elementary School | 3 | 5.7% |
| Middle School | 20 | 37.7% |
| High School | 24 | 45.3% |
| College / Undergraduate | 3 | 5.7% |
| Graduate / Professional | 0 | 0.0% |
| Total | 53 | 100.0% |
School Enrollment by Age by Funding Source in New Salem
Out of a total of 53 students who are enrolled in schools in New Salem, 8 (15.1%) attend a private institution, while the remaining 45 (84.9%) are enrolled in public schools. The age group of 25 to 34 year olds has the highest likelihood of being enrolled in private schools, with 1 (100.0% in the age bracket) enrolled. Conversely, the age group of 15 to 17 year olds has the lowest likelihood of being enrolled in a private school, with 15 (100.0% in the age bracket) attending a public institution.
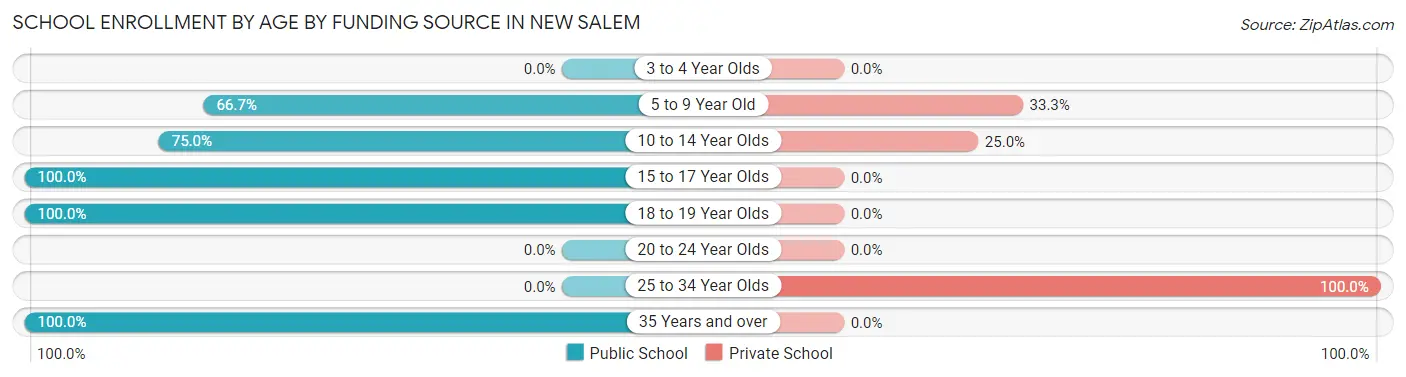
| Age Bracket | Public School | Private School |
| 3 to 4 Year Olds | 0 (0.0%) | 0 (0.0%) |
| 5 to 9 Year Old | 4 (66.7%) | 2 (33.3%) |
| 10 to 14 Year Olds | 15 (75.0%) | 5 (25.0%) |
| 15 to 17 Year Olds | 15 (100.0%) | 0 (0.0%) |
| 18 to 19 Year Olds | 2 (100.0%) | 0 (0.0%) |
| 20 to 24 Year Olds | 0 (0.0%) | 0 (0.0%) |
| 25 to 34 Year Olds | 0 (0.0%) | 1 (100.0%) |
| 35 Years and over | 9 (100.0%) | 0 (0.0%) |
| Total | 45 (84.9%) | 8 (15.1%) |
Educational Attainment by Field of Study in New Salem
Education (6 | 31.6%), business (4 | 21.0%), arts & humanities (4 | 21.0%), bio, nature & agricultural (2 | 10.5%), and visual & performing arts (2 | 10.5%) are the most common fields of study among 19 individuals in New Salem who have obtained a bachelor's degree or higher.
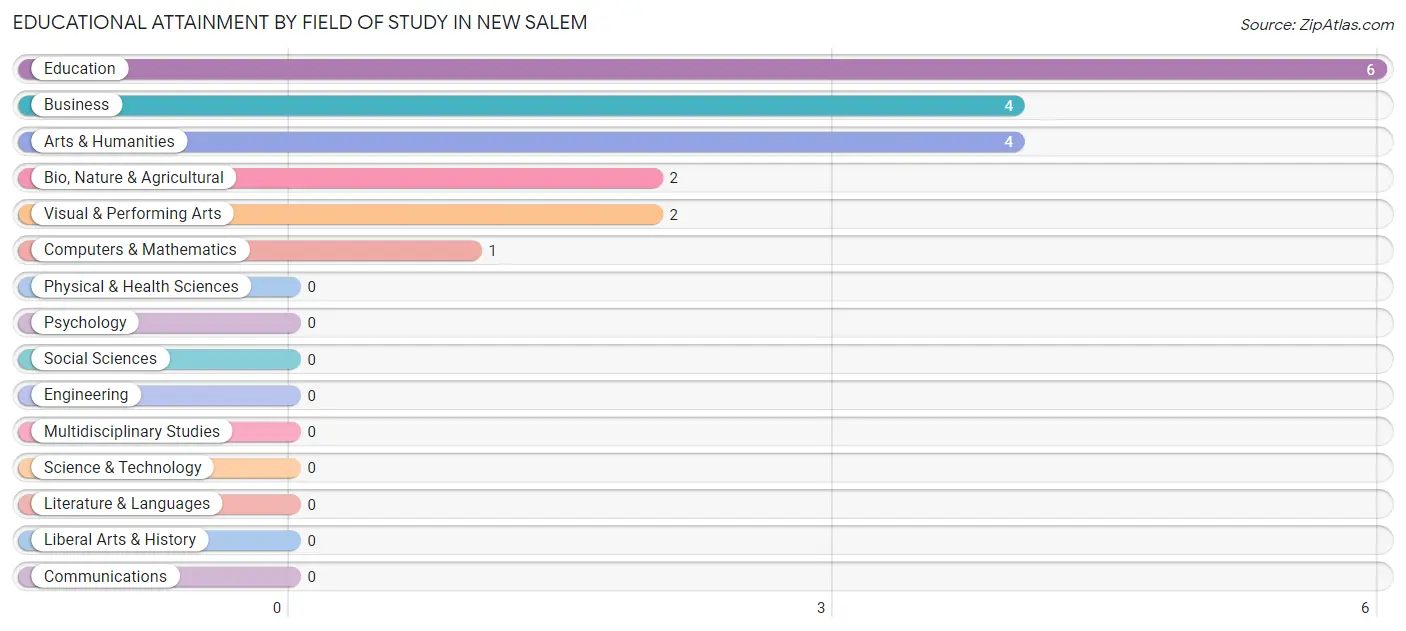
| Field of Study | # Graduates | % Graduates |
| Computers & Mathematics | 1 | 5.3% |
| Bio, Nature & Agricultural | 2 | 10.5% |
| Physical & Health Sciences | 0 | 0.0% |
| Psychology | 0 | 0.0% |
| Social Sciences | 0 | 0.0% |
| Engineering | 0 | 0.0% |
| Multidisciplinary Studies | 0 | 0.0% |
| Science & Technology | 0 | 0.0% |
| Business | 4 | 21.0% |
| Education | 6 | 31.6% |
| Literature & Languages | 0 | 0.0% |
| Liberal Arts & History | 0 | 0.0% |
| Visual & Performing Arts | 2 | 10.5% |
| Communications | 0 | 0.0% |
| Arts & Humanities | 4 | 21.0% |
| Total | 19 | 100.0% |
Transportation & Commute in New Salem
Vehicle Availability by Sex in New Salem
The most prevalent vehicle ownership categories in New Salem are males with 4 vehicles (32, accounting for 53.3%) and females with 4 vehicles (21, making up 76.2%).
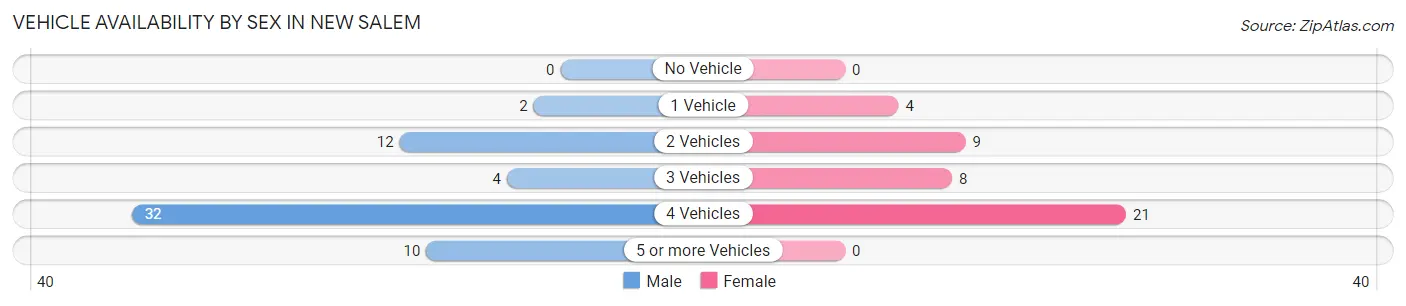
| Vehicles Available | Male | Female |
| No Vehicle | 0 (0.0%) | 0 (0.0%) |
| 1 Vehicle | 2 (3.3%) | 4 (9.5%) |
| 2 Vehicles | 12 (20.0%) | 9 (21.4%) |
| 3 Vehicles | 4 (6.7%) | 8 (19.1%) |
| 4 Vehicles | 32 (53.3%) | 21 (50.0%) |
| 5 or more Vehicles | 10 (16.7%) | 0 (0.0%) |
| Total | 60 (100.0%) | 42 (100.0%) |
Commute Time in New Salem
The most frequently occuring commute durations in New Salem are 60 to 89 minutes (20 commuters, 29.8%), 15 to 19 minutes (17 commuters, 25.4%), and 30 to 34 minutes (15 commuters, 22.4%).
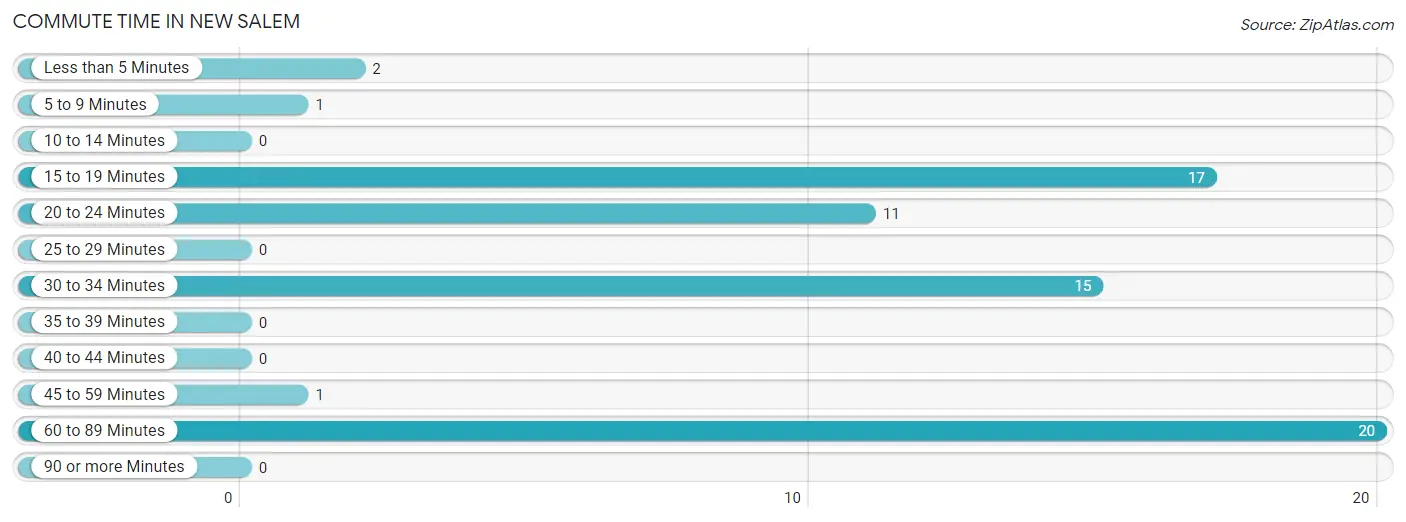
| Commute Time | # Commuters | % Commuters |
| Less than 5 Minutes | 2 | 3.0% |
| 5 to 9 Minutes | 1 | 1.5% |
| 10 to 14 Minutes | 0 | 0.0% |
| 15 to 19 Minutes | 17 | 25.4% |
| 20 to 24 Minutes | 11 | 16.4% |
| 25 to 29 Minutes | 0 | 0.0% |
| 30 to 34 Minutes | 15 | 22.4% |
| 35 to 39 Minutes | 0 | 0.0% |
| 40 to 44 Minutes | 0 | 0.0% |
| 45 to 59 Minutes | 1 | 1.5% |
| 60 to 89 Minutes | 20 | 29.8% |
| 90 or more Minutes | 0 | 0.0% |
Commute Time by Sex in New Salem
The most common commute times in New Salem are 30 to 34 minutes (11 commuters, 35.5%) for males and 60 to 89 minutes (20 commuters, 55.6%) for females.
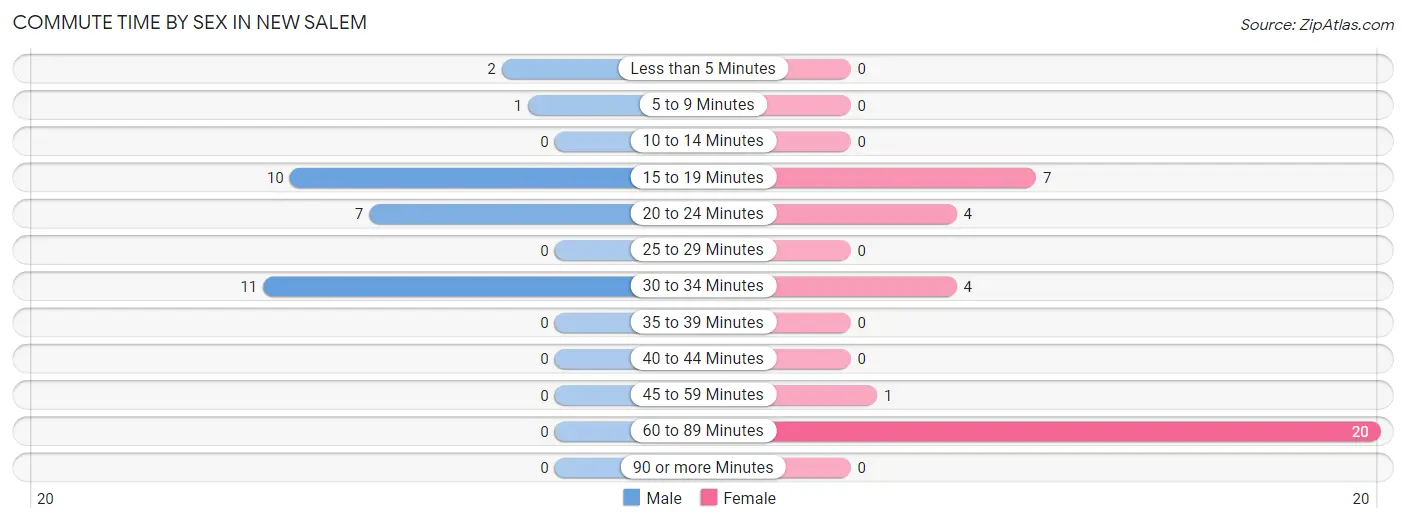
| Commute Time | Male | Female |
| Less than 5 Minutes | 2 (6.5%) | 0 (0.0%) |
| 5 to 9 Minutes | 1 (3.2%) | 0 (0.0%) |
| 10 to 14 Minutes | 0 (0.0%) | 0 (0.0%) |
| 15 to 19 Minutes | 10 (32.3%) | 7 (19.4%) |
| 20 to 24 Minutes | 7 (22.6%) | 4 (11.1%) |
| 25 to 29 Minutes | 0 (0.0%) | 0 (0.0%) |
| 30 to 34 Minutes | 11 (35.5%) | 4 (11.1%) |
| 35 to 39 Minutes | 0 (0.0%) | 0 (0.0%) |
| 40 to 44 Minutes | 0 (0.0%) | 0 (0.0%) |
| 45 to 59 Minutes | 0 (0.0%) | 1 (2.8%) |
| 60 to 89 Minutes | 0 (0.0%) | 20 (55.6%) |
| 90 or more Minutes | 0 (0.0%) | 0 (0.0%) |
Time of Departure to Work by Sex in New Salem
The most frequent times of departure to work in New Salem are 6:00 AM to 6:29 AM (14, 45.2%) for males and 6:00 AM to 6:29 AM (20, 55.6%) for females.
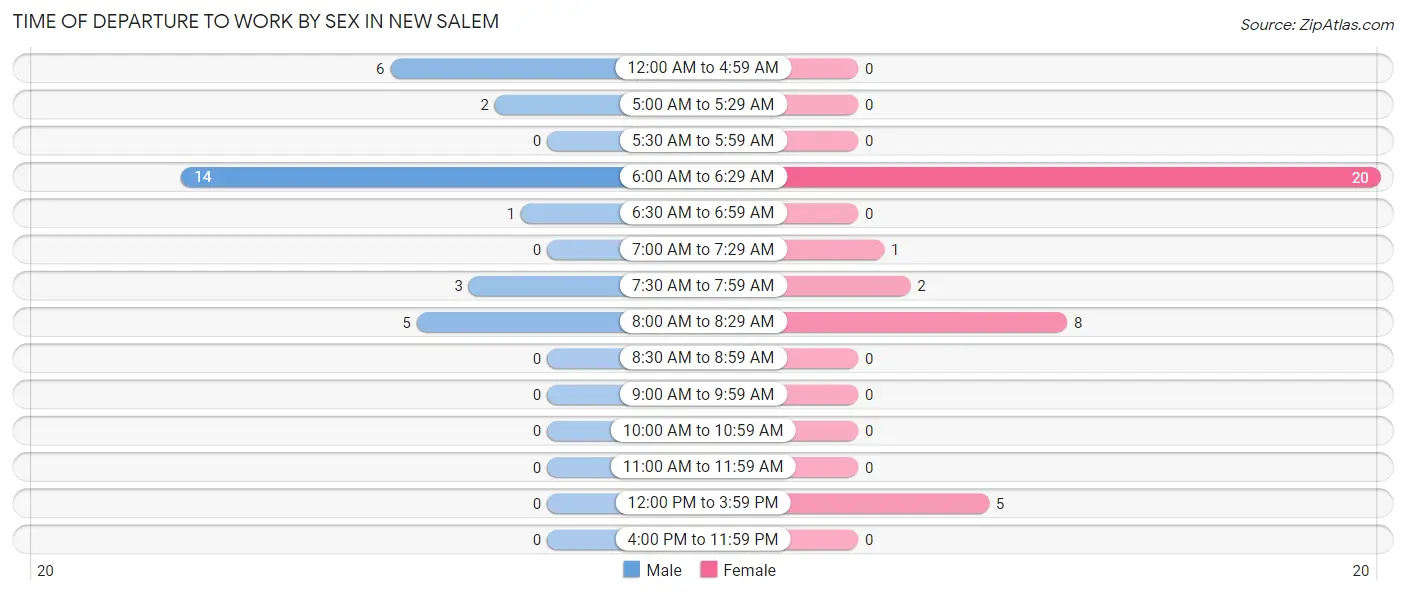
| Time of Departure | Male | Female |
| 12:00 AM to 4:59 AM | 6 (19.4%) | 0 (0.0%) |
| 5:00 AM to 5:29 AM | 2 (6.5%) | 0 (0.0%) |
| 5:30 AM to 5:59 AM | 0 (0.0%) | 0 (0.0%) |
| 6:00 AM to 6:29 AM | 14 (45.2%) | 20 (55.6%) |
| 6:30 AM to 6:59 AM | 1 (3.2%) | 0 (0.0%) |
| 7:00 AM to 7:29 AM | 0 (0.0%) | 1 (2.8%) |
| 7:30 AM to 7:59 AM | 3 (9.7%) | 2 (5.6%) |
| 8:00 AM to 8:29 AM | 5 (16.1%) | 8 (22.2%) |
| 8:30 AM to 8:59 AM | 0 (0.0%) | 0 (0.0%) |
| 9:00 AM to 9:59 AM | 0 (0.0%) | 0 (0.0%) |
| 10:00 AM to 10:59 AM | 0 (0.0%) | 0 (0.0%) |
| 11:00 AM to 11:59 AM | 0 (0.0%) | 0 (0.0%) |
| 12:00 PM to 3:59 PM | 0 (0.0%) | 5 (13.9%) |
| 4:00 PM to 11:59 PM | 0 (0.0%) | 0 (0.0%) |
| Total | 31 (100.0%) | 36 (100.0%) |
Housing Occupancy in New Salem
Occupancy by Ownership in New Salem
Of the total 69 dwellings in New Salem, owner-occupied units account for 55 (79.7%), while renter-occupied units make up 14 (20.3%).
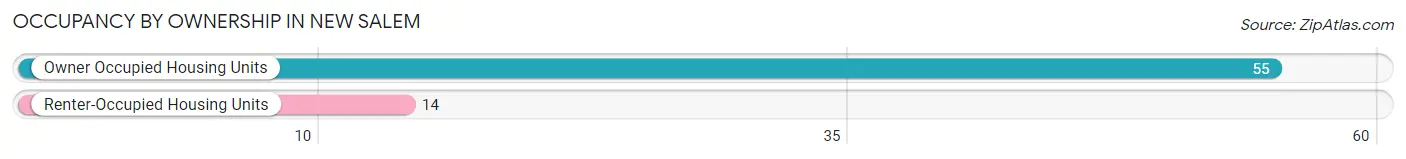
| Occupancy | # Housing Units | % Housing Units |
| Owner Occupied Housing Units | 55 | 79.7% |
| Renter-Occupied Housing Units | 14 | 20.3% |
| Total Occupied Housing Units | 69 | 100.0% |
Occupancy by Household Size in New Salem
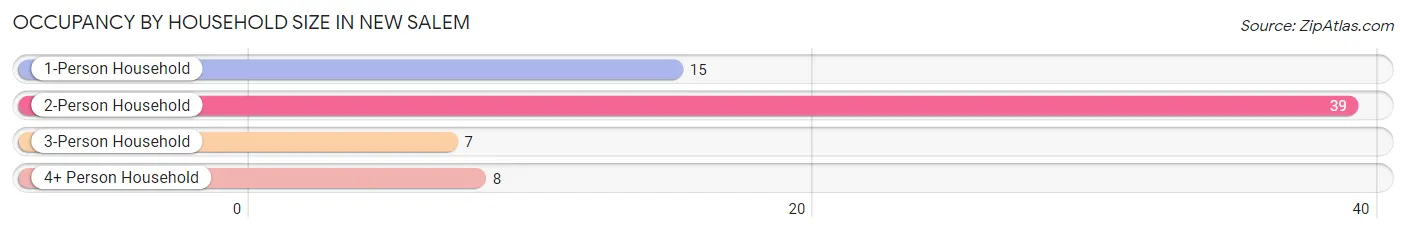
| Household Size | # Housing Units | % Housing Units |
| 1-Person Household | 15 | 21.7% |
| 2-Person Household | 39 | 56.5% |
| 3-Person Household | 7 | 10.1% |
| 4+ Person Household | 8 | 11.6% |
| Total Housing Units | 69 | 100.0% |
Occupancy by Ownership by Household Size in New Salem
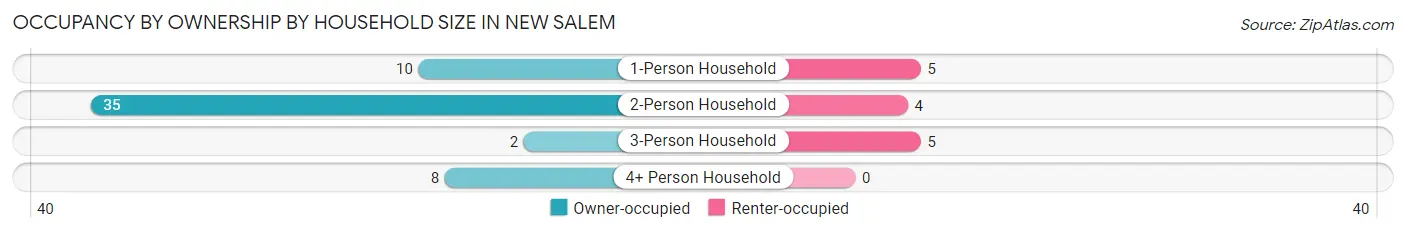
| Household Size | Owner-occupied | Renter-occupied |
| 1-Person Household | 10 (66.7%) | 5 (33.3%) |
| 2-Person Household | 35 (89.7%) | 4 (10.3%) |
| 3-Person Household | 2 (28.6%) | 5 (71.4%) |
| 4+ Person Household | 8 (100.0%) | 0 (0.0%) |
| Total Housing Units | 55 (79.7%) | 14 (20.3%) |
Occupancy by Educational Attainment in New Salem
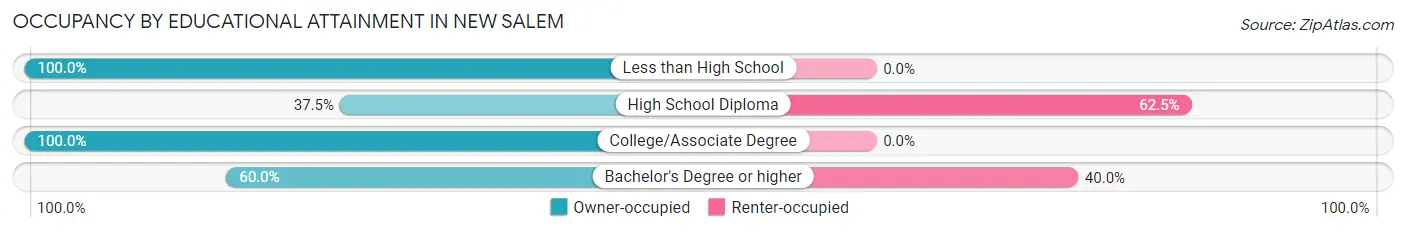
| Household Size | Owner-occupied | Renter-occupied |
| Less than High School | 2 (100.0%) | 0 (0.0%) |
| High School Diploma | 6 (37.5%) | 10 (62.5%) |
| College/Associate Degree | 41 (100.0%) | 0 (0.0%) |
| Bachelor's Degree or higher | 6 (60.0%) | 4 (40.0%) |
Occupancy by Age of Householder in New Salem
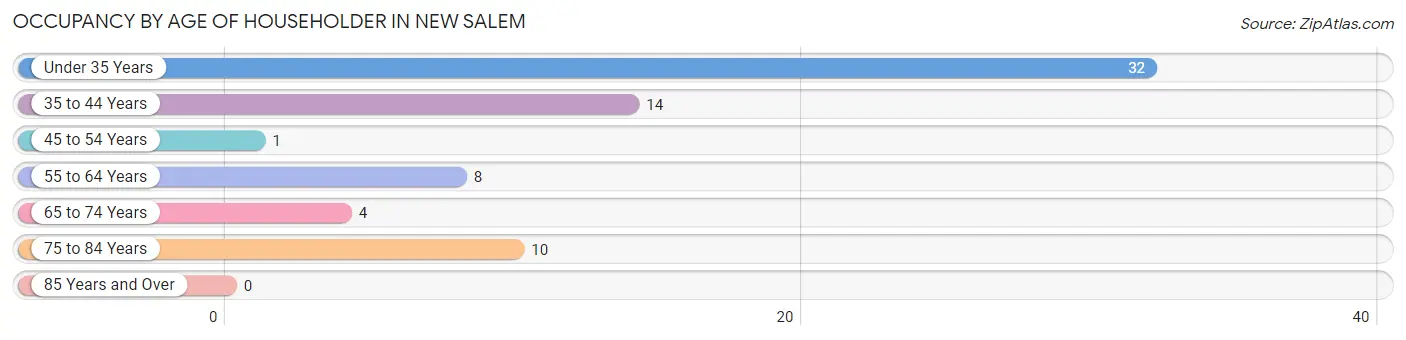
| Age Bracket | # Households | % Households |
| Under 35 Years | 32 | 46.4% |
| 35 to 44 Years | 14 | 20.3% |
| 45 to 54 Years | 1 | 1.5% |
| 55 to 64 Years | 8 | 11.6% |
| 65 to 74 Years | 4 | 5.8% |
| 75 to 84 Years | 10 | 14.5% |
| 85 Years and Over | 0 | 0.0% |
| Total | 69 | 100.0% |
Housing Finances in New Salem
Median Income by Occupancy in New Salem
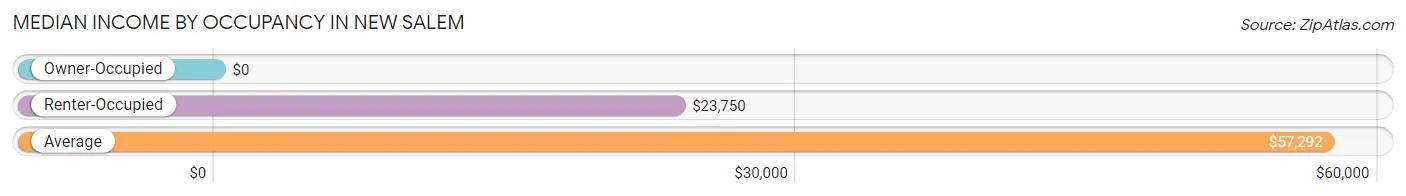
| Occupancy Type | # Households | Median Income |
| Owner-Occupied | 55 (79.7%) | $0 |
| Renter-Occupied | 14 (20.3%) | $23,750 |
| Average | 69 (100.0%) | $57,292 |
Occupancy by Householder Income Bracket in New Salem
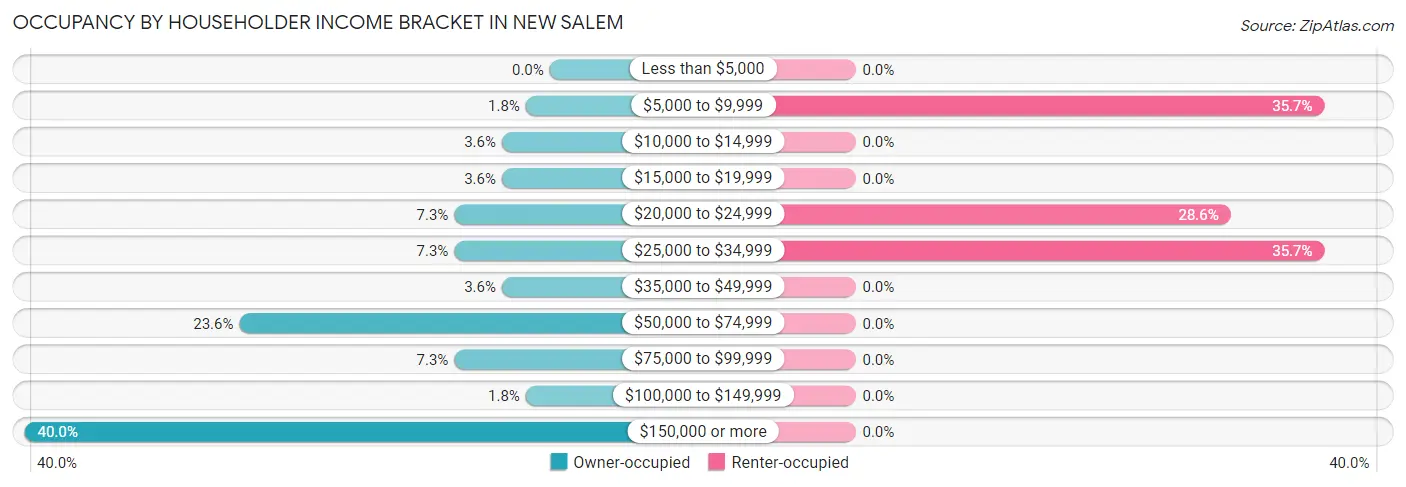
| Income Bracket | Owner-occupied | Renter-occupied |
| Less than $5,000 | 0 (0.0%) | 0 (0.0%) |
| $5,000 to $9,999 | 1 (1.8%) | 5 (35.7%) |
| $10,000 to $14,999 | 2 (3.6%) | 0 (0.0%) |
| $15,000 to $19,999 | 2 (3.6%) | 0 (0.0%) |
| $20,000 to $24,999 | 4 (7.3%) | 4 (28.6%) |
| $25,000 to $34,999 | 4 (7.3%) | 5 (35.7%) |
| $35,000 to $49,999 | 2 (3.6%) | 0 (0.0%) |
| $50,000 to $74,999 | 13 (23.6%) | 0 (0.0%) |
| $75,000 to $99,999 | 4 (7.3%) | 0 (0.0%) |
| $100,000 to $149,999 | 1 (1.8%) | 0 (0.0%) |
| $150,000 or more | 22 (40.0%) | 0 (0.0%) |
| Total | 55 (100.0%) | 14 (100.0%) |
Monthly Housing Cost Tiers in New Salem
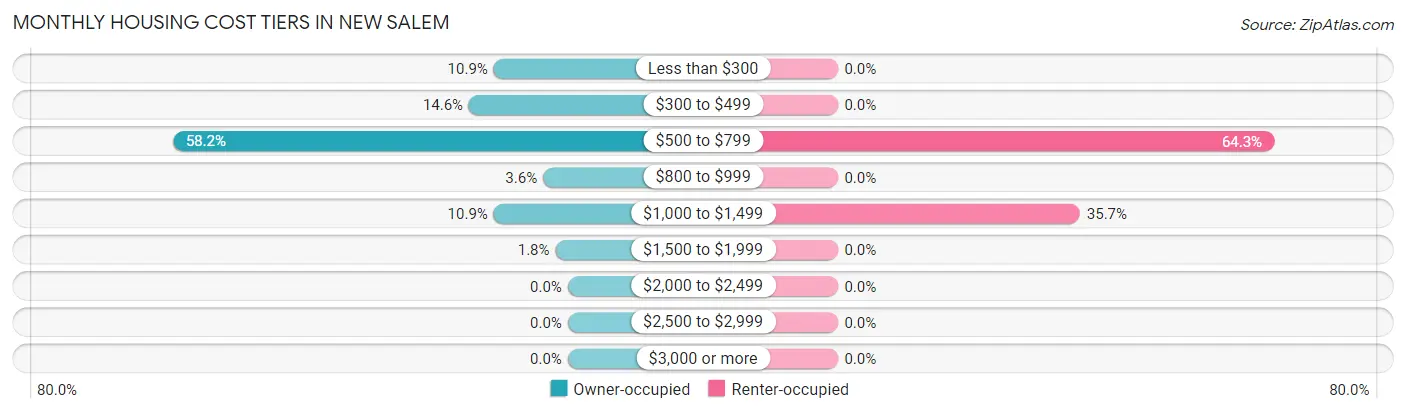
| Monthly Cost | Owner-occupied | Renter-occupied |
| Less than $300 | 6 (10.9%) | 0 (0.0%) |
| $300 to $499 | 8 (14.5%) | 0 (0.0%) |
| $500 to $799 | 32 (58.2%) | 9 (64.3%) |
| $800 to $999 | 2 (3.6%) | 0 (0.0%) |
| $1,000 to $1,499 | 6 (10.9%) | 5 (35.7%) |
| $1,500 to $1,999 | 1 (1.8%) | 0 (0.0%) |
| $2,000 to $2,499 | 0 (0.0%) | 0 (0.0%) |
| $2,500 to $2,999 | 0 (0.0%) | 0 (0.0%) |
| $3,000 or more | 0 (0.0%) | 0 (0.0%) |
| Total | 55 (100.0%) | 14 (100.0%) |
Physical Housing Characteristics in New Salem
Housing Structures in New Salem
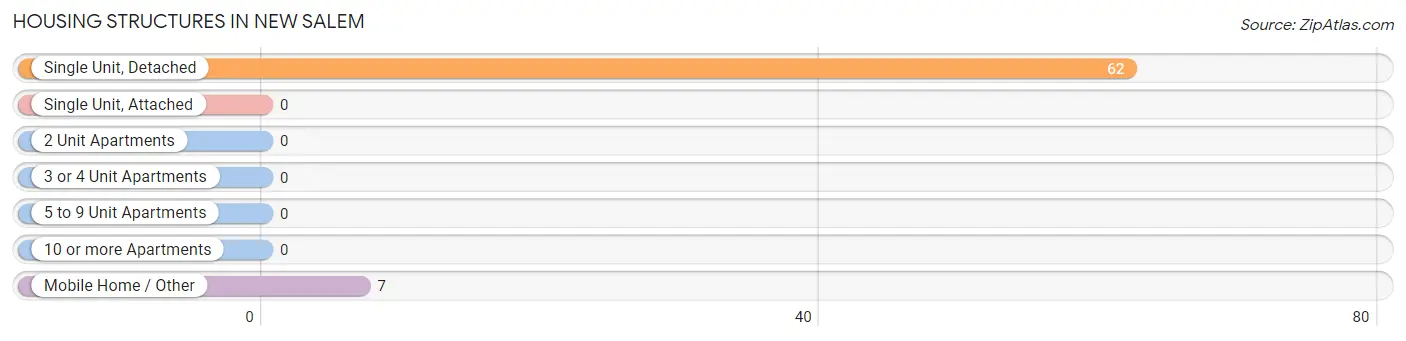
| Structure Type | # Housing Units | % Housing Units |
| Single Unit, Detached | 62 | 89.9% |
| Single Unit, Attached | 0 | 0.0% |
| 2 Unit Apartments | 0 | 0.0% |
| 3 or 4 Unit Apartments | 0 | 0.0% |
| 5 to 9 Unit Apartments | 0 | 0.0% |
| 10 or more Apartments | 0 | 0.0% |
| Mobile Home / Other | 7 | 10.1% |
| Total | 69 | 100.0% |
Housing Structures by Occupancy in New Salem
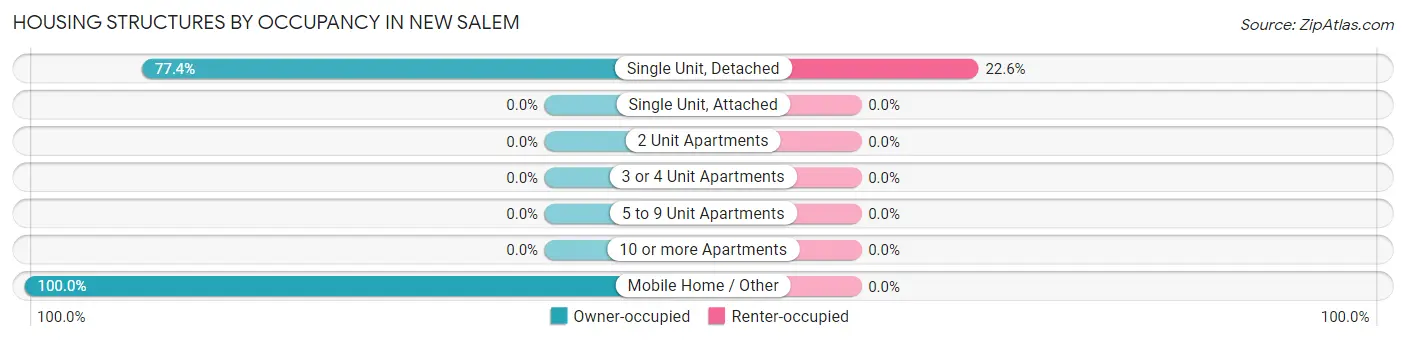
| Structure Type | Owner-occupied | Renter-occupied |
| Single Unit, Detached | 48 (77.4%) | 14 (22.6%) |
| Single Unit, Attached | 0 (0.0%) | 0 (0.0%) |
| 2 Unit Apartments | 0 (0.0%) | 0 (0.0%) |
| 3 or 4 Unit Apartments | 0 (0.0%) | 0 (0.0%) |
| 5 to 9 Unit Apartments | 0 (0.0%) | 0 (0.0%) |
| 10 or more Apartments | 0 (0.0%) | 0 (0.0%) |
| Mobile Home / Other | 7 (100.0%) | 0 (0.0%) |
| Total | 55 (79.7%) | 14 (20.3%) |
Housing Structures by Number of Rooms in New Salem
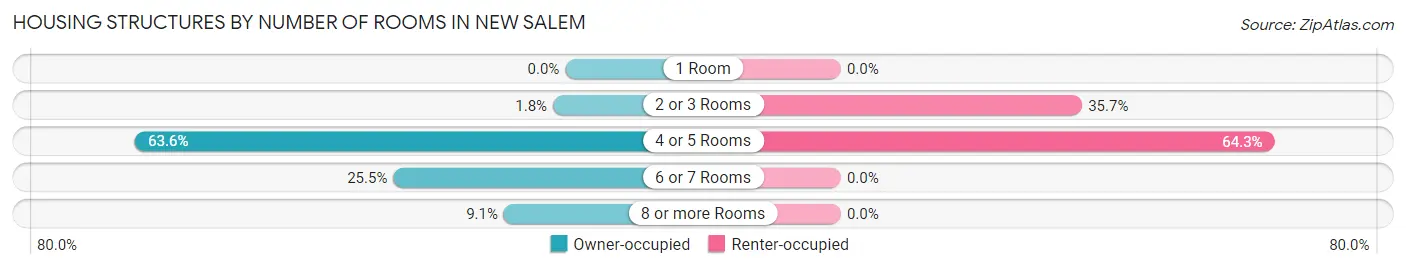
| Number of Rooms | Owner-occupied | Renter-occupied |
| 1 Room | 0 (0.0%) | 0 (0.0%) |
| 2 or 3 Rooms | 1 (1.8%) | 5 (35.7%) |
| 4 or 5 Rooms | 35 (63.6%) | 9 (64.3%) |
| 6 or 7 Rooms | 14 (25.5%) | 0 (0.0%) |
| 8 or more Rooms | 5 (9.1%) | 0 (0.0%) |
| Total | 55 (100.0%) | 14 (100.0%) |
Housing Structure by Heating Type in New Salem
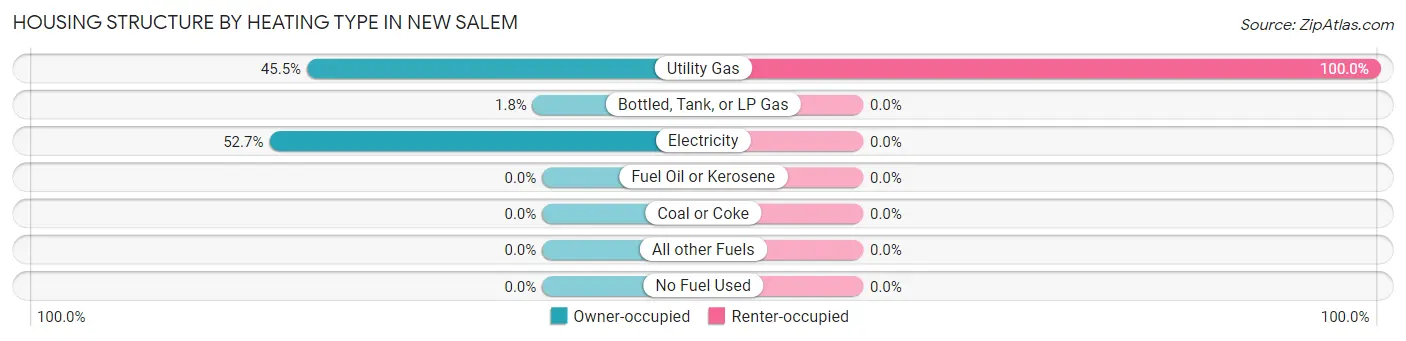
| Heating Type | Owner-occupied | Renter-occupied |
| Utility Gas | 25 (45.5%) | 14 (100.0%) |
| Bottled, Tank, or LP Gas | 1 (1.8%) | 0 (0.0%) |
| Electricity | 29 (52.7%) | 0 (0.0%) |
| Fuel Oil or Kerosene | 0 (0.0%) | 0 (0.0%) |
| Coal or Coke | 0 (0.0%) | 0 (0.0%) |
| All other Fuels | 0 (0.0%) | 0 (0.0%) |
| No Fuel Used | 0 (0.0%) | 0 (0.0%) |
| Total | 55 (100.0%) | 14 (100.0%) |
Household Vehicle Usage in New Salem
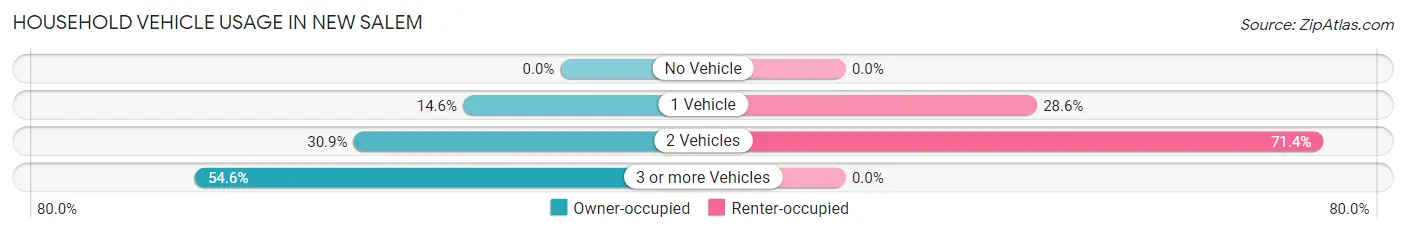
| Vehicles per Household | Owner-occupied | Renter-occupied |
| No Vehicle | 0 (0.0%) | 0 (0.0%) |
| 1 Vehicle | 8 (14.5%) | 4 (28.6%) |
| 2 Vehicles | 17 (30.9%) | 10 (71.4%) |
| 3 or more Vehicles | 30 (54.5%) | 0 (0.0%) |
| Total | 55 (100.0%) | 14 (100.0%) |
Real Estate & Mortgages in New Salem
Real Estate and Mortgage Overview in New Salem
| Characteristic | Without Mortgage | With Mortgage |
| Housing Units | 22 | 33 |
| Median Property Value | - | - |
| Median Household Income | $28,750 | $20 |
| Monthly Housing Costs | $400 | $0 |
| Real Estate Taxes | - | - |
Property Value by Mortgage Status in New Salem
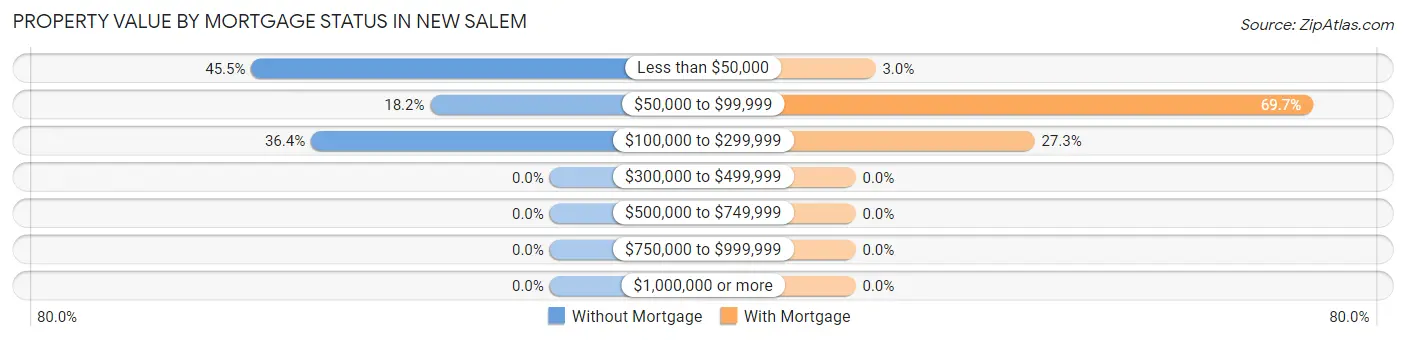
| Property Value | Without Mortgage | With Mortgage |
| Less than $50,000 | 10 (45.5%) | 1 (3.0%) |
| $50,000 to $99,999 | 4 (18.2%) | 23 (69.7%) |
| $100,000 to $299,999 | 8 (36.4%) | 9 (27.3%) |
| $300,000 to $499,999 | 0 (0.0%) | 0 (0.0%) |
| $500,000 to $749,999 | 0 (0.0%) | 0 (0.0%) |
| $750,000 to $999,999 | 0 (0.0%) | 0 (0.0%) |
| $1,000,000 or more | 0 (0.0%) | 0 (0.0%) |
| Total | 22 (100.0%) | 33 (100.0%) |
Household Income by Mortgage Status in New Salem
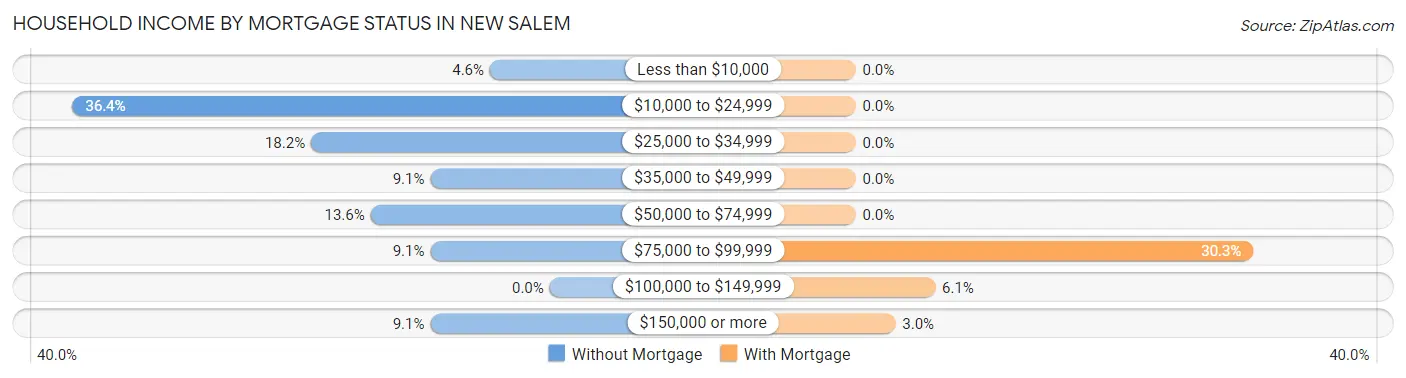
| Household Income | Without Mortgage | With Mortgage |
| Less than $10,000 | 1 (4.5%) | 0 (0.0%) |
| $10,000 to $24,999 | 8 (36.4%) | 0 (0.0%) |
| $25,000 to $34,999 | 4 (18.2%) | 0 (0.0%) |
| $35,000 to $49,999 | 2 (9.1%) | 0 (0.0%) |
| $50,000 to $74,999 | 3 (13.6%) | 0 (0.0%) |
| $75,000 to $99,999 | 2 (9.1%) | 10 (30.3%) |
| $100,000 to $149,999 | 0 (0.0%) | 2 (6.1%) |
| $150,000 or more | 2 (9.1%) | 1 (3.0%) |
| Total | 22 (100.0%) | 33 (100.0%) |
Property Value to Household Income Ratio in New Salem
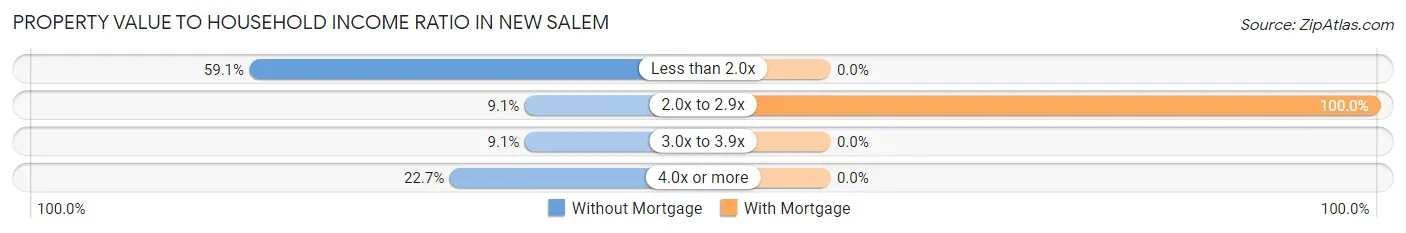
| Value-to-Income Ratio | Without Mortgage | With Mortgage |
| Less than 2.0x | 13 (59.1%) | 0 (0.0%) |
| 2.0x to 2.9x | 2 (9.1%) | 33 (100.0%) |
| 3.0x to 3.9x | 2 (9.1%) | 0 (0.0%) |
| 4.0x or more | 5 (22.7%) | 0 (0.0%) |
| Total | 22 (100.0%) | 33 (100.0%) |
Real Estate Taxes by Mortgage Status in New Salem
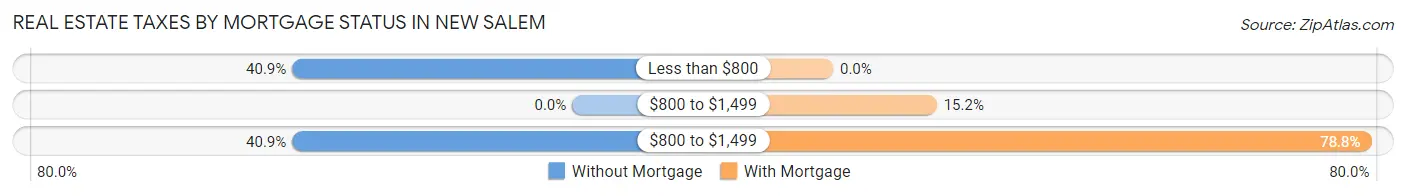
| Property Taxes | Without Mortgage | With Mortgage |
| Less than $800 | 9 (40.9%) | 0 (0.0%) |
| $800 to $1,499 | 0 (0.0%) | 5 (15.1%) |
| $800 to $1,499 | 9 (40.9%) | 26 (78.8%) |
| Total | 22 (100.0%) | 33 (100.0%) |
Health & Disability in New Salem
Health Insurance Coverage by Age in New Salem
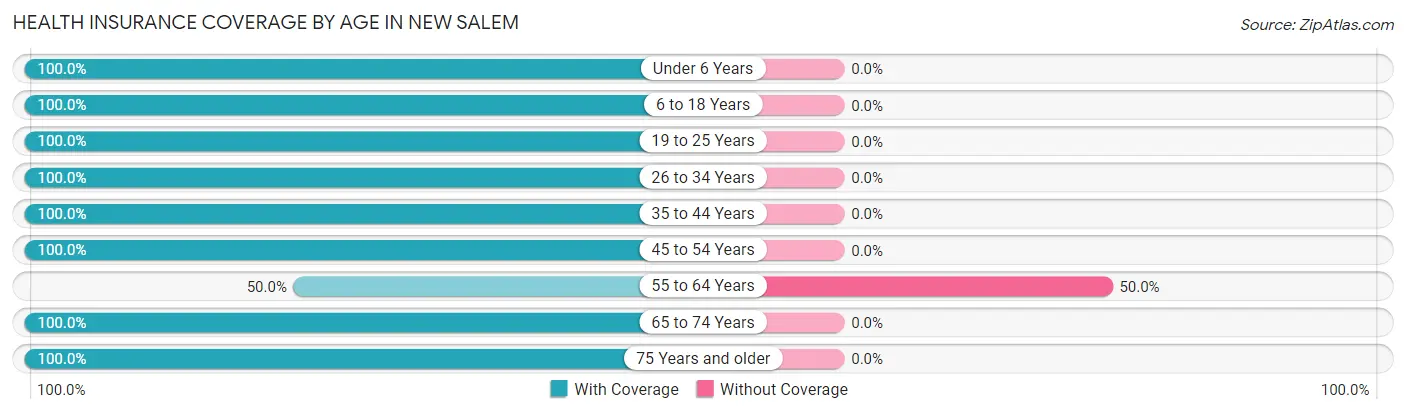
| Age Bracket | With Coverage | Without Coverage |
| Under 6 Years | 22 (100.0%) | 0 (0.0%) |
| 6 to 18 Years | 42 (100.0%) | 0 (0.0%) |
| 19 to 25 Years | 11 (100.0%) | 0 (0.0%) |
| 26 to 34 Years | 42 (100.0%) | 0 (0.0%) |
| 35 to 44 Years | 28 (100.0%) | 0 (0.0%) |
| 45 to 54 Years | 36 (100.0%) | 0 (0.0%) |
| 55 to 64 Years | 4 (50.0%) | 4 (50.0%) |
| 65 to 74 Years | 6 (100.0%) | 0 (0.0%) |
| 75 Years and older | 15 (100.0%) | 0 (0.0%) |
| Total | 206 (98.1%) | 4 (1.9%) |
Health Insurance Coverage by Citizenship Status in New Salem
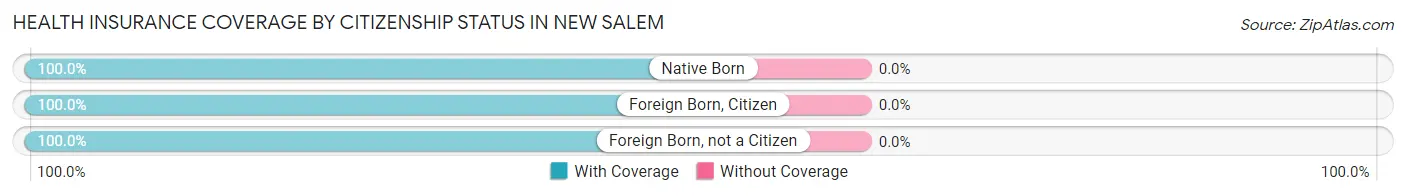
| Citizenship Status | With Coverage | Without Coverage |
| Native Born | 22 (100.0%) | 0 (0.0%) |
| Foreign Born, Citizen | 42 (100.0%) | 0 (0.0%) |
| Foreign Born, not a Citizen | 11 (100.0%) | 0 (0.0%) |
Health Insurance Coverage by Household Income in New Salem
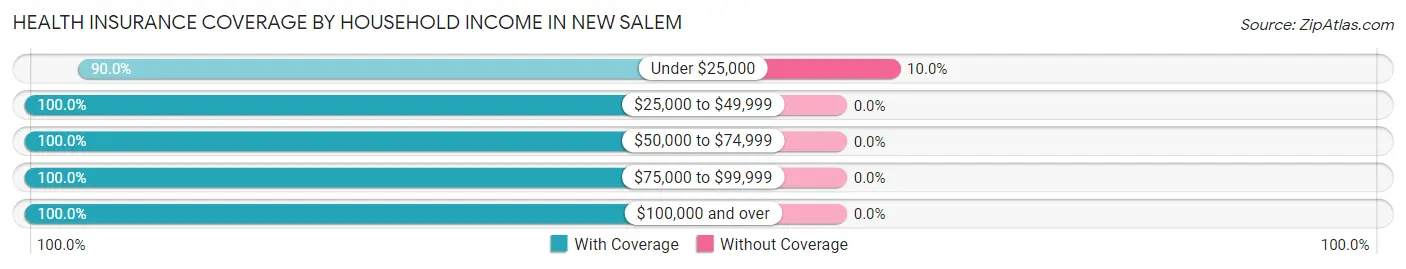
| Household Income | With Coverage | Without Coverage |
| Under $25,000 | 36 (90.0%) | 4 (10.0%) |
| $25,000 to $49,999 | 31 (100.0%) | 0 (0.0%) |
| $50,000 to $74,999 | 63 (100.0%) | 0 (0.0%) |
| $75,000 to $99,999 | 20 (100.0%) | 0 (0.0%) |
| $100,000 and over | 56 (100.0%) | 0 (0.0%) |
Public vs Private Health Insurance Coverage by Age in New Salem
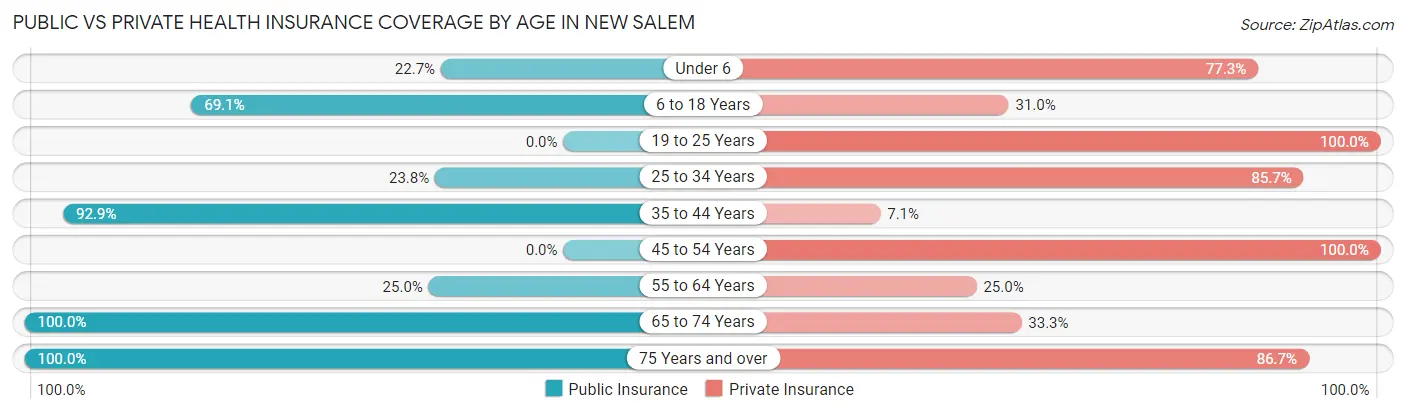
| Age Bracket | Public Insurance | Private Insurance |
| Under 6 | 5 (22.7%) | 17 (77.3%) |
| 6 to 18 Years | 29 (69.1%) | 13 (30.9%) |
| 19 to 25 Years | 0 (0.0%) | 11 (100.0%) |
| 25 to 34 Years | 10 (23.8%) | 36 (85.7%) |
| 35 to 44 Years | 26 (92.9%) | 2 (7.1%) |
| 45 to 54 Years | 0 (0.0%) | 36 (100.0%) |
| 55 to 64 Years | 2 (25.0%) | 2 (25.0%) |
| 65 to 74 Years | 6 (100.0%) | 2 (33.3%) |
| 75 Years and over | 15 (100.0%) | 13 (86.7%) |
| Total | 93 (44.3%) | 132 (62.9%) |
Disability Status by Sex by Age in New Salem
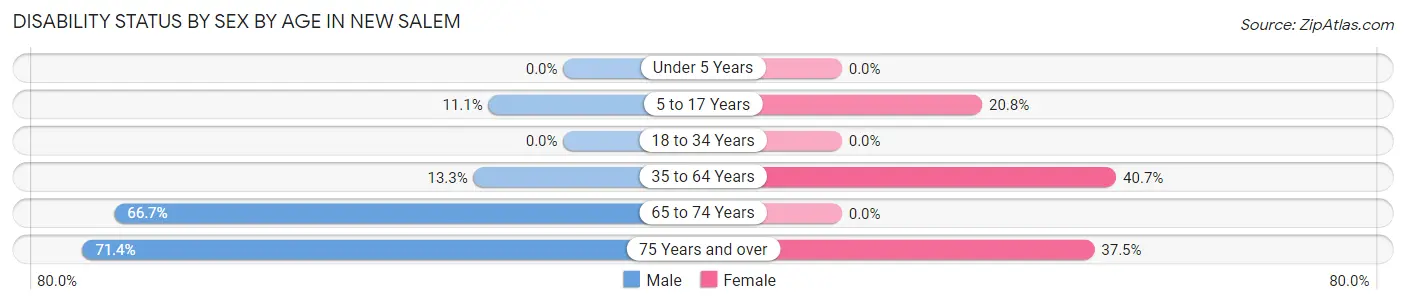
| Age Bracket | Male | Female |
| Under 5 Years | 0 (0.0%) | 0 (0.0%) |
| 5 to 17 Years | 2 (11.1%) | 5 (20.8%) |
| 18 to 34 Years | 0 (0.0%) | 0 (0.0%) |
| 35 to 64 Years | 6 (13.3%) | 11 (40.7%) |
| 65 to 74 Years | 4 (66.7%) | 0 (0.0%) |
| 75 Years and over | 5 (71.4%) | 3 (37.5%) |
Disability Class by Sex by Age in New Salem
Disability Class: Hearing Difficulty
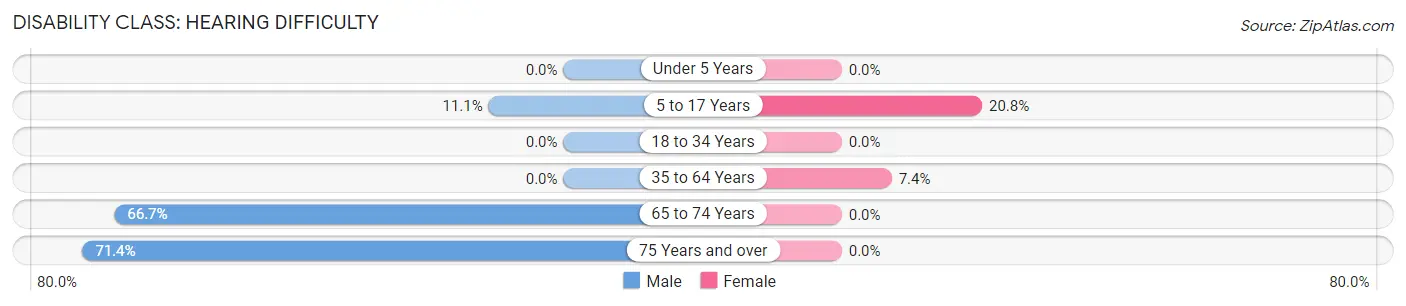
| Age Bracket | Male | Female |
| Under 5 Years | 0 (0.0%) | 0 (0.0%) |
| 5 to 17 Years | 2 (11.1%) | 5 (20.8%) |
| 18 to 34 Years | 0 (0.0%) | 0 (0.0%) |
| 35 to 64 Years | 0 (0.0%) | 2 (7.4%) |
| 65 to 74 Years | 4 (66.7%) | 0 (0.0%) |
| 75 Years and over | 5 (71.4%) | 0 (0.0%) |
Disability Class: Vision Difficulty
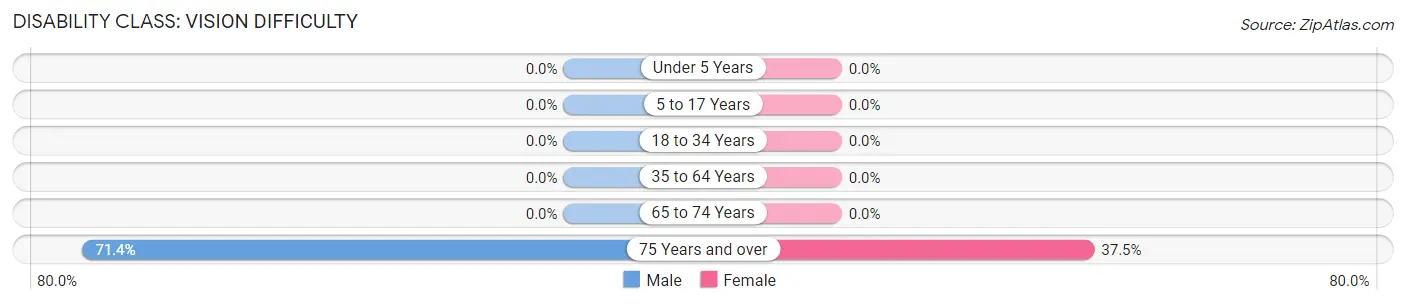
| Age Bracket | Male | Female |
| Under 5 Years | 0 (0.0%) | 0 (0.0%) |
| 5 to 17 Years | 0 (0.0%) | 0 (0.0%) |
| 18 to 34 Years | 0 (0.0%) | 0 (0.0%) |
| 35 to 64 Years | 0 (0.0%) | 0 (0.0%) |
| 65 to 74 Years | 0 (0.0%) | 0 (0.0%) |
| 75 Years and over | 5 (71.4%) | 3 (37.5%) |
Disability Class: Cognitive Difficulty
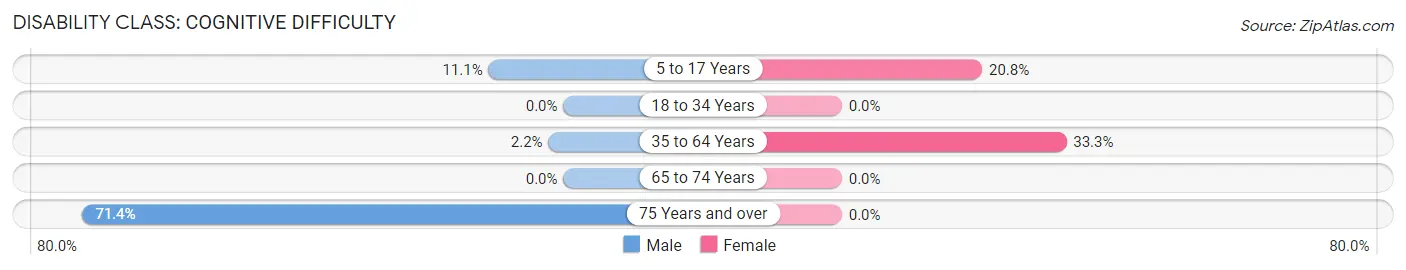
| Age Bracket | Male | Female |
| 5 to 17 Years | 2 (11.1%) | 5 (20.8%) |
| 18 to 34 Years | 0 (0.0%) | 0 (0.0%) |
| 35 to 64 Years | 1 (2.2%) | 9 (33.3%) |
| 65 to 74 Years | 0 (0.0%) | 0 (0.0%) |
| 75 Years and over | 5 (71.4%) | 0 (0.0%) |
Disability Class: Ambulatory Difficulty
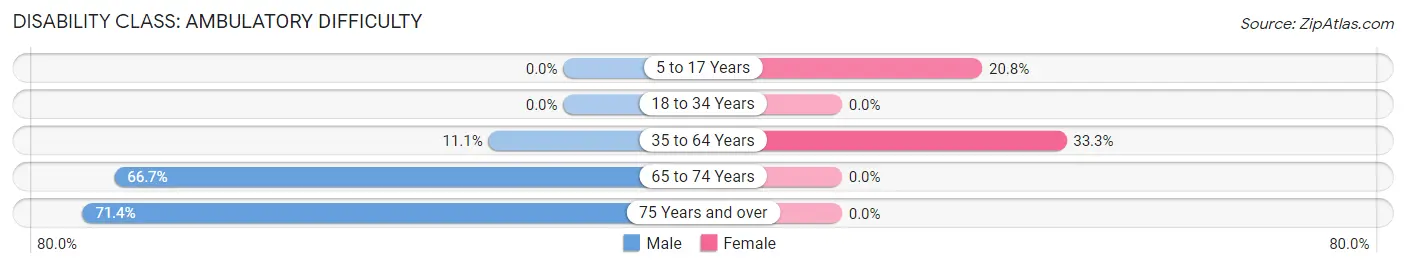
| Age Bracket | Male | Female |
| 5 to 17 Years | 0 (0.0%) | 5 (20.8%) |
| 18 to 34 Years | 0 (0.0%) | 0 (0.0%) |
| 35 to 64 Years | 5 (11.1%) | 9 (33.3%) |
| 65 to 74 Years | 4 (66.7%) | 0 (0.0%) |
| 75 Years and over | 5 (71.4%) | 0 (0.0%) |
Disability Class: Self-Care Difficulty
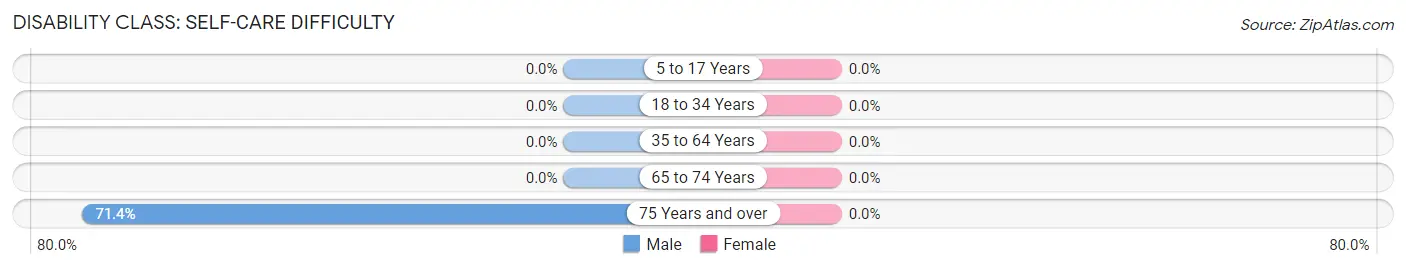
| Age Bracket | Male | Female |
| 5 to 17 Years | 0 (0.0%) | 0 (0.0%) |
| 18 to 34 Years | 0 (0.0%) | 0 (0.0%) |
| 35 to 64 Years | 0 (0.0%) | 0 (0.0%) |
| 65 to 74 Years | 0 (0.0%) | 0 (0.0%) |
| 75 Years and over | 5 (71.4%) | 0 (0.0%) |
Technology Access in New Salem
Computing Device Access in New Salem
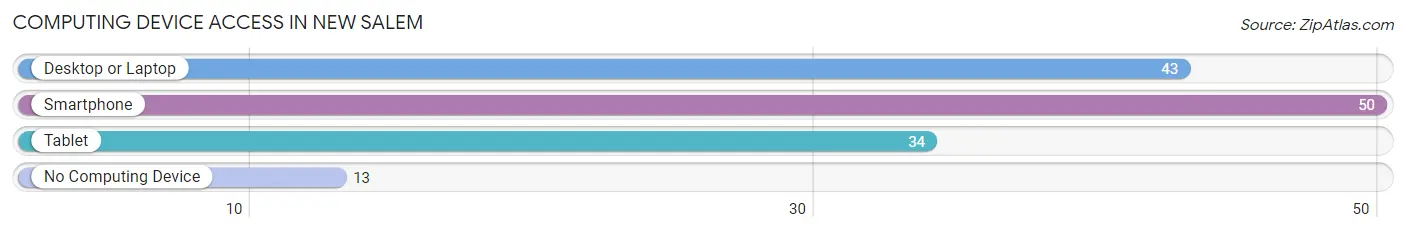
| Device Type | # Households | % Households |
| Desktop or Laptop | 43 | 62.3% |
| Smartphone | 50 | 72.5% |
| Tablet | 34 | 49.3% |
| No Computing Device | 13 | 18.8% |
| Total | 69 | 100.0% |
Internet Access in New Salem
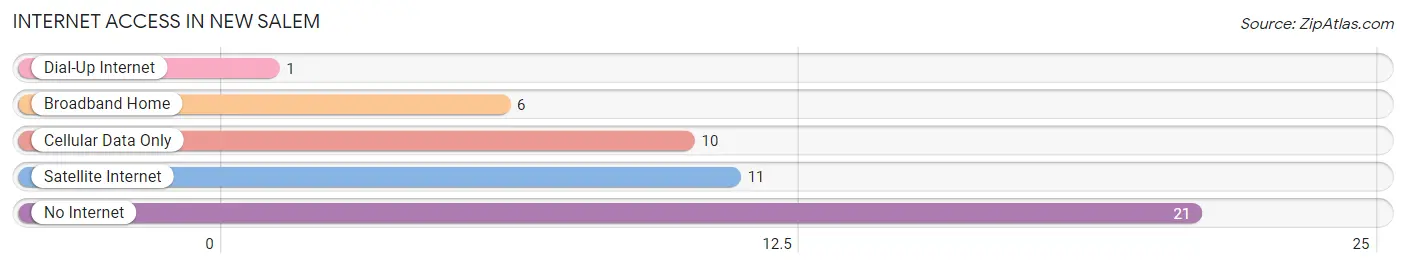
| Internet Type | # Households | % Households |
| Dial-Up Internet | 1 | 1.5% |
| Broadband Home | 6 | 8.7% |
| Cellular Data Only | 10 | 14.5% |
| Satellite Internet | 11 | 15.9% |
| No Internet | 21 | 30.4% |
| Total | 69 | 100.0% |
New Salem Summary
New Salem, Illinois is a small village located in Menard County, Illinois. It is situated on the banks of the Sangamon River, approximately 20 miles northwest of Springfield, the state capital. The village was founded in 1828 by James Rutledge, a former soldier in the War of 1812, and was named after the town of Salem, Massachusetts. The village was originally intended to be a utopian community, but it never quite achieved that goal.
History
New Salem was founded in 1828 by James Rutledge, a former soldier in the War of 1812. He had been inspired by the utopian ideals of the New England Transcendentalists, and wanted to create a similar community in the Midwest. He purchased the land from the federal government and began to build the village. The original plan was to have a central square surrounded by a grid of streets, with a church, school, and other public buildings.
The village grew slowly, but by the mid-1830s it had become a thriving community. It was home to a variety of businesses, including a blacksmith, a tannery, a grist mill, and a sawmill. It also had a post office, a hotel, and a newspaper.
In 1832, New Salem became the home of Abraham Lincoln, who had recently moved to the area from Indiana. He worked as a store clerk, postmaster, and surveyor, and was an active member of the community. He also served as a militia captain during the Black Hawk War.
In 1837, the village was incorporated as a town, and the population had grown to around 500. However, the Panic of 1837 caused the economy to collapse, and many of the businesses closed. By 1840, the population had dropped to around 200.
Geography
New Salem is located in Menard County, Illinois, approximately 20 miles northwest of Springfield, the state capital. It is situated on the banks of the Sangamon River, and is surrounded by rolling hills and farmland. The village is located in the Central Till Plains region of the state, and is part of the Decatur-Springfield-Jacksonville metropolitan area.
The climate in New Salem is typical of the Midwest, with hot, humid summers and cold, snowy winters. The average annual temperature is around 50 degrees Fahrenheit, and the average annual precipitation is around 40 inches.
Economy
The economy of New Salem is largely based on agriculture. The village is home to several farms, which produce a variety of crops, including corn, soybeans, and wheat. There are also several small businesses in the village, including a grocery store, a hardware store, and a restaurant.
The village is also home to a number of historic sites, including the Lincoln-Herndon Law Office, the New Salem State Historic Site, and the Lincoln Log Cabin State Historic Site. These sites attract tourists from around the world, and help to boost the local economy.
Demographics
As of the 2010 census, the population of New Salem was 829. The racial makeup of the village was 97.3% White, 0.7% African American, 0.2% Native American, 0.2% Asian, 0.2% from other races, and 1.6% from two or more races. Hispanic or Latino of any race were 1.2% of the population.
The median household income in New Salem was $45,000, and the median family income was $50,000. The per capita income was $20,000. About 8.3% of families and 10.2% of the population were below the poverty line, including 13.3% of those under age 18 and 8.3% of those age 65 or over.
New Salem is a small, rural village with a rich history and a strong sense of community. It is home to a variety of businesses and historic sites, and is a popular tourist destination. The village is also home to a diverse population, with a variety of backgrounds and cultures.
Common Questions
What is Per Capita Income in New Salem?
Per Capita income in New Salem is $39,756.
What is the Median Household income in New Salem?
Median Household Income in New Salem is $57,292.
What is Inequality or Gini Index in New Salem?
Inequality or Gini Index in New Salem is 0.53.
What is the Total Population of New Salem?
Total Population of New Salem is 210.
What is the Total Male Population of New Salem?
Total Male Population of New Salem is 112.
What is the Total Female Population of New Salem?
Total Female Population of New Salem is 98.
What is the Ratio of Males per 100 Females in New Salem?
There are 114.29 Males per 100 Females in New Salem.
What is the Ratio of Females per 100 Males in New Salem?
There are 87.50 Females per 100 Males in New Salem.
What is the Median Population Age in New Salem?
Median Population Age in New Salem is 34.5 Years.
What is the Average Family Size in New Salem
Average Family Size in New Salem is 3.3 People.
What is the Average Household Size in New Salem
Average Household Size in New Salem is 3.0 People.
How Large is the Labor Force in New Salem?
There are 104 People in the Labor Forcein in New Salem.
What is the Percentage of People in the Labor Force in New Salem?
67.1% of People are in the Labor Force in New Salem.
What is the Unemployment Rate in New Salem?
Unemployment Rate in New Salem is 1.9%.