Galatia, IL Map & Demographics
Galatia Map
Galatia Overview
$27,400
PER CAPITA INCOME
$61,635
AVG FAMILY INCOME
$46,875
AVG HOUSEHOLD INCOME
37.1%
WAGE / INCOME GAP [ % ]
62.9¢/ $1
WAGE / INCOME GAP [ $ ]
0.39
INEQUALITY / GINI INDEX
964
TOTAL POPULATION
431
MALE POPULATION
533
FEMALE POPULATION
80.86
MALES / 100 FEMALES
123.67
FEMALES / 100 MALES
38.1
MEDIAN AGE
3.4
AVG FAMILY SIZE
2.6
AVG HOUSEHOLD SIZE
462
LABOR FORCE [ PEOPLE ]
60.7%
PERCENT IN LABOR FORCE
5.2%
UNEMPLOYMENT RATE
Galatia Zip Codes
Galatia Area Codes
Income in Galatia
Income Overview in Galatia
Per Capita Income in Galatia is $27,400, while median incomes of families and households are $61,635 and $46,875 respectively.
| Characteristic | Number | Measure |
| Per Capita Income | 964 | $27,400 |
| Median Family Income | 237 | $61,635 |
| Mean Family Income | 237 | $80,692 |
| Median Household Income | 369 | $46,875 |
| Mean Household Income | 369 | $66,385 |
| Income Deficit | 237 | $0 |
| Wage / Income Gap (%) | 964 | 37.06% |
| Wage / Income Gap ($) | 964 | 62.94¢ per $1 |
| Gini / Inequality Index | 964 | 0.39 |
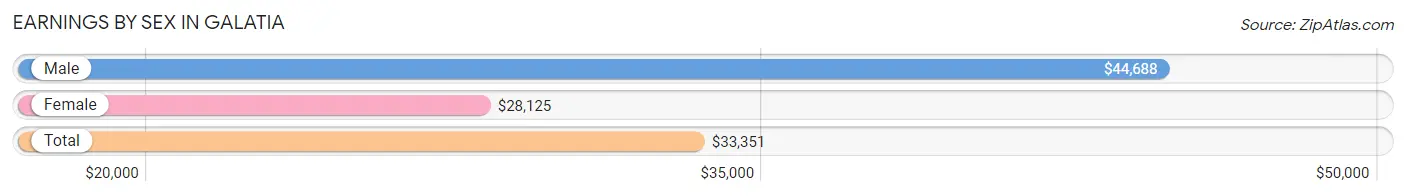
Earnings by Sex in Galatia
Average Earnings in Galatia are $33,351, $44,688 for men and $28,125 for women, a difference of 37.1%.
| Sex | Number | Average Earnings |
| Male | 209 (46.0%) | $44,688 |
| Female | 245 (54.0%) | $28,125 |
| Total | 454 (100.0%) | $33,351 |
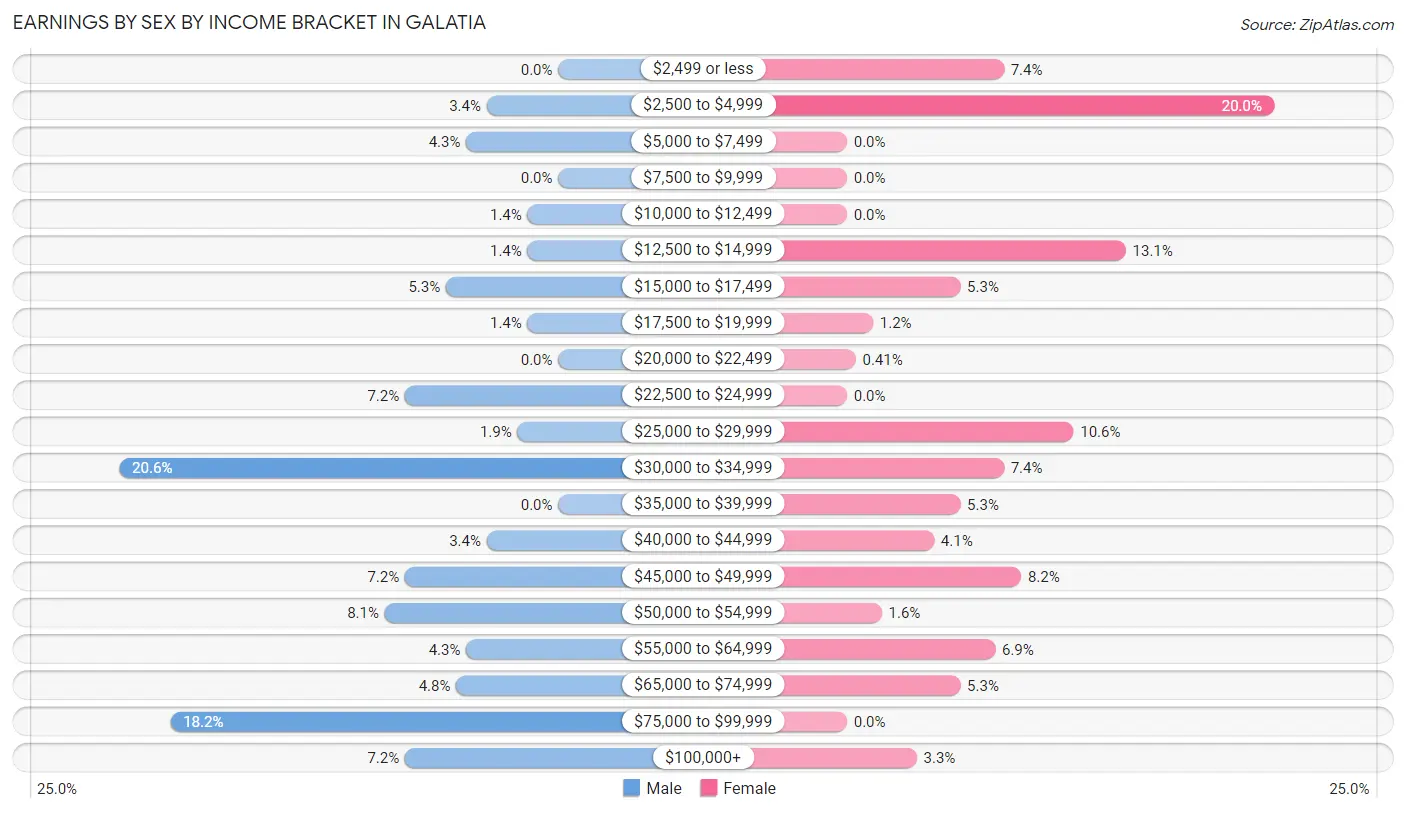
Earnings by Sex by Income Bracket in Galatia
The most common earnings brackets in Galatia are $30,000 to $34,999 for men (43 | 20.6%) and $2,500 to $4,999 for women (49 | 20.0%).
| Income | Male | Female |
| $2,499 or less | 0 (0.0%) | 18 (7.3%) |
| $2,500 to $4,999 | 7 (3.4%) | 49 (20.0%) |
| $5,000 to $7,499 | 9 (4.3%) | 0 (0.0%) |
| $7,500 to $9,999 | 0 (0.0%) | 0 (0.0%) |
| $10,000 to $12,499 | 3 (1.4%) | 0 (0.0%) |
| $12,500 to $14,999 | 3 (1.4%) | 32 (13.1%) |
| $15,000 to $17,499 | 11 (5.3%) | 13 (5.3%) |
| $17,500 to $19,999 | 3 (1.4%) | 3 (1.2%) |
| $20,000 to $22,499 | 0 (0.0%) | 1 (0.4%) |
| $22,500 to $24,999 | 15 (7.2%) | 0 (0.0%) |
| $25,000 to $29,999 | 4 (1.9%) | 26 (10.6%) |
| $30,000 to $34,999 | 43 (20.6%) | 18 (7.3%) |
| $35,000 to $39,999 | 0 (0.0%) | 13 (5.3%) |
| $40,000 to $44,999 | 7 (3.4%) | 10 (4.1%) |
| $45,000 to $49,999 | 15 (7.2%) | 20 (8.2%) |
| $50,000 to $54,999 | 17 (8.1%) | 4 (1.6%) |
| $55,000 to $64,999 | 9 (4.3%) | 17 (6.9%) |
| $65,000 to $74,999 | 10 (4.8%) | 13 (5.3%) |
| $75,000 to $99,999 | 38 (18.2%) | 0 (0.0%) |
| $100,000+ | 15 (7.2%) | 8 (3.3%) |
| Total | 209 (100.0%) | 245 (100.0%) |
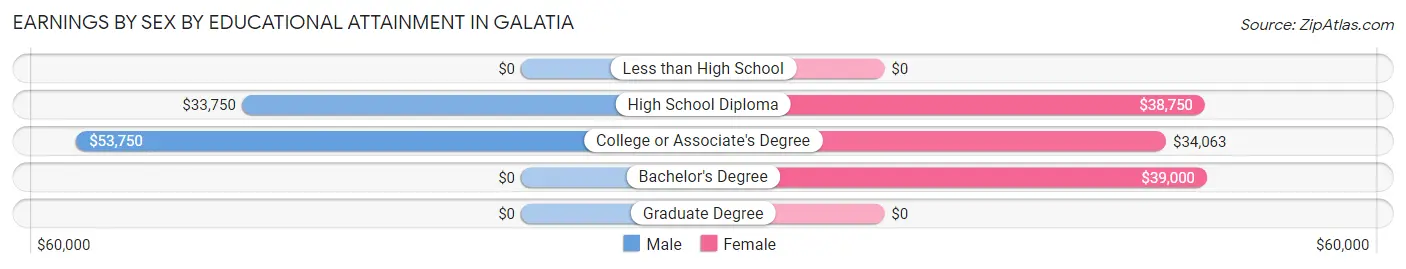
Earnings by Sex by Educational Attainment in Galatia
Average earnings in Galatia are $48,542 for men and $33,125 for women, a difference of 31.8%. Men with an educational attainment of college or associate's degree enjoy the highest average annual earnings of $53,750, while those with high school diploma education earn the least with $33,750. Women with an educational attainment of bachelor's degree earn the most with the average annual earnings of $39,000, while those with college or associate's degree education have the smallest earnings of $34,063.
| Educational Attainment | Male Income | Female Income |
| Less than High School | - | - |
| High School Diploma | $33,750 | $38,750 |
| College or Associate's Degree | $53,750 | $34,063 |
| Bachelor's Degree | - | - |
| Graduate Degree | - | - |
| Total | $48,542 | $33,125 |
Family Income in Galatia
Family Income Brackets in Galatia
According to the Galatia family income data, there are 62 families falling into the $100,000 to $149,999 income range, which is the most common income bracket and makes up 26.2% of all families.
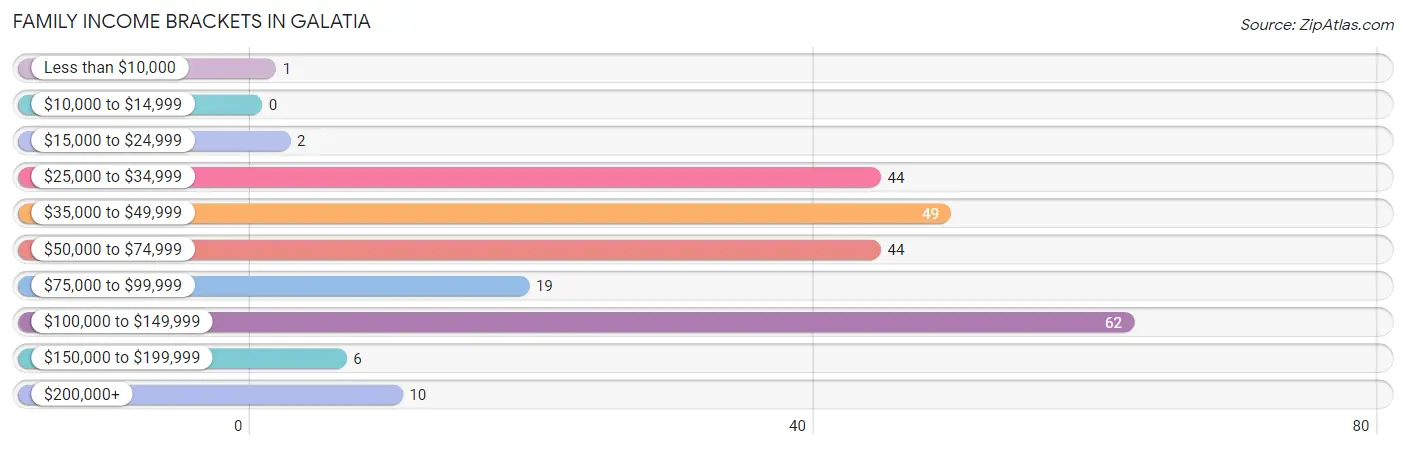
| Income Bracket | # Families | % Families |
| Less than $10,000 | 1 | 0.4% |
| $10,000 to $14,999 | 0 | 0.0% |
| $15,000 to $24,999 | 2 | 0.8% |
| $25,000 to $34,999 | 44 | 18.6% |
| $35,000 to $49,999 | 49 | 20.7% |
| $50,000 to $74,999 | 44 | 18.6% |
| $75,000 to $99,999 | 19 | 8.0% |
| $100,000 to $149,999 | 62 | 26.2% |
| $150,000 to $199,999 | 6 | 2.5% |
| $200,000+ | 10 | 4.2% |
Family Income by Famaliy Size in Galatia
2-person families (67 | 28.3%) account for the highest median family income in Galatia with $72,031 per family, while 2-person families (67 | 28.3%) have the highest median income of $36,016 per family member.
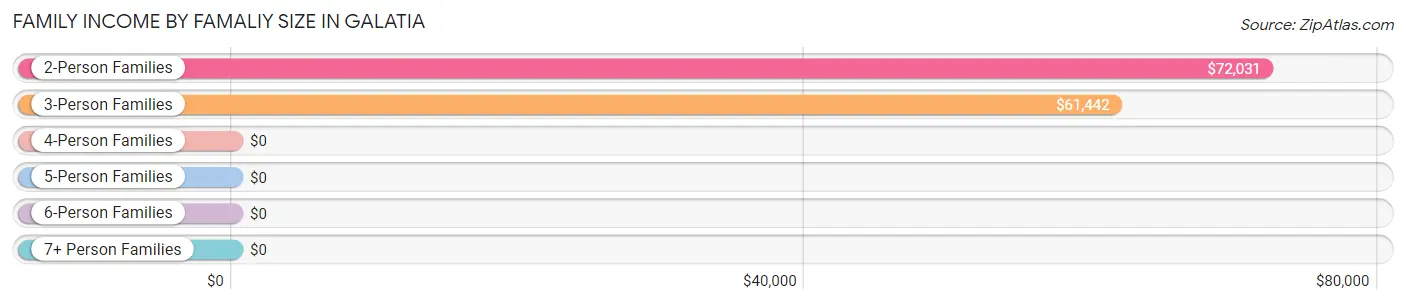
| Income Bracket | # Families | Median Income |
| 2-Person Families | 67 (28.3%) | $72,031 |
| 3-Person Families | 67 (28.3%) | $61,442 |
| 4-Person Families | 95 (40.1%) | $0 |
| 5-Person Families | 8 (3.4%) | $0 |
| 6-Person Families | 0 (0.0%) | $0 |
| 7+ Person Families | 0 (0.0%) | $0 |
| Total | 237 (100.0%) | $61,635 |
Family Income by Number of Earners in Galatia
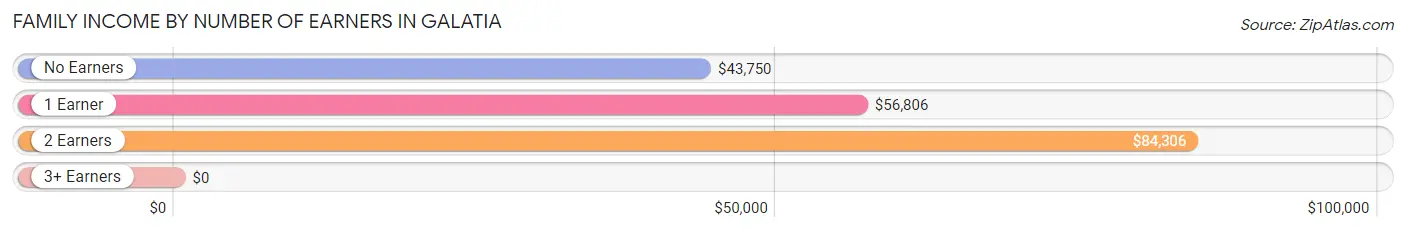
| Number of Earners | # Families | Median Income |
| No Earners | 25 (10.5%) | $43,750 |
| 1 Earner | 87 (36.7%) | $56,806 |
| 2 Earners | 113 (47.7%) | $84,306 |
| 3+ Earners | 12 (5.1%) | $0 |
| Total | 237 (100.0%) | $61,635 |
Household Income in Galatia
Household Income Brackets in Galatia
With 81 households falling in the category, the $35,000 to $49,999 income range is the most frequent in Galatia, accounting for 22.0% of all households. In contrast, only 6 households (1.6%) fall into the $150,000 to $199,999 income bracket, making it the least populous group.
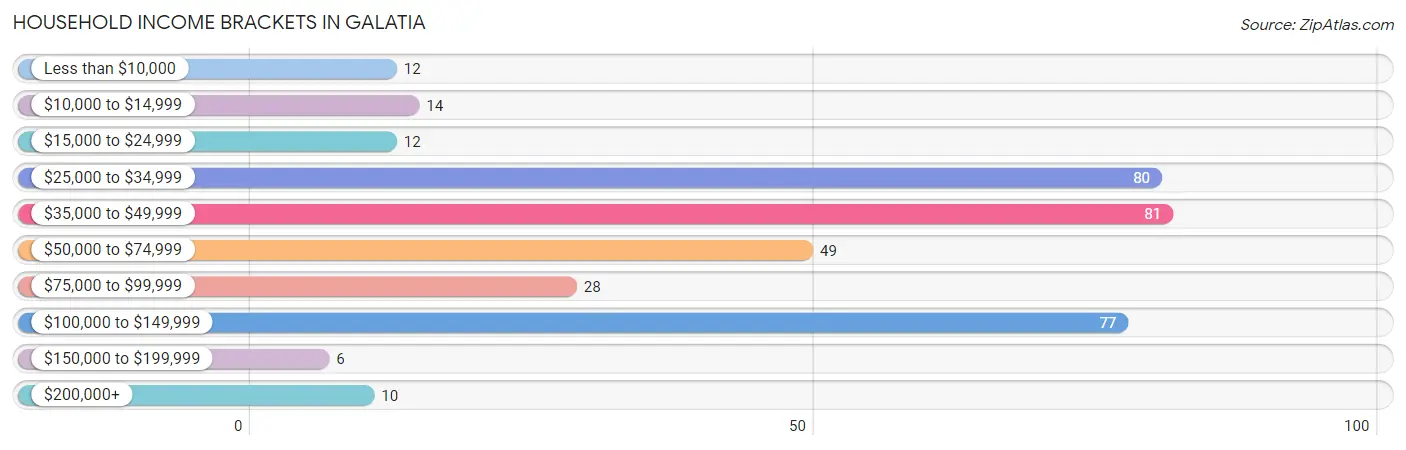
| Income Bracket | # Households | % Households |
| Less than $10,000 | 12 | 3.3% |
| $10,000 to $14,999 | 14 | 3.8% |
| $15,000 to $24,999 | 12 | 3.3% |
| $25,000 to $34,999 | 80 | 21.7% |
| $35,000 to $49,999 | 81 | 22.0% |
| $50,000 to $74,999 | 49 | 13.3% |
| $75,000 to $99,999 | 28 | 7.6% |
| $100,000 to $149,999 | 77 | 20.9% |
| $150,000 to $199,999 | 6 | 1.6% |
| $200,000+ | 10 | 2.7% |
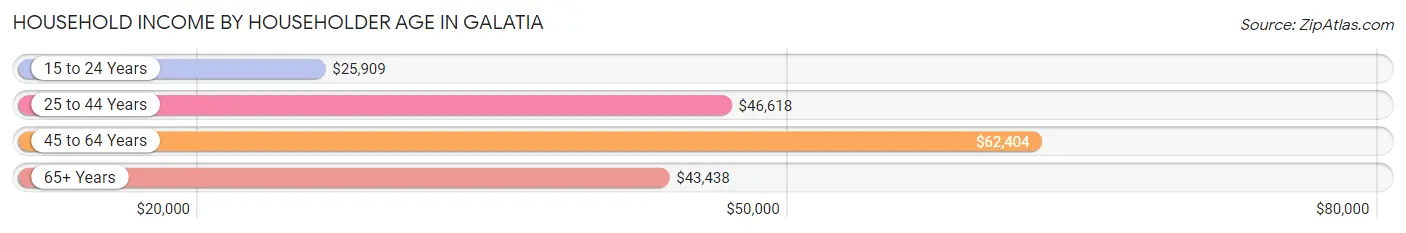
Household Income by Householder Age in Galatia
The median household income in Galatia is $46,875, with the highest median household income of $62,404 found in the 45 to 64 years age bracket for the primary householder. A total of 99 households (26.8%) fall into this category. Meanwhile, the 15 to 24 years age bracket for the primary householder has the lowest median household income of $25,909, with 18 households (4.9%) in this group.
| Income Bracket | # Households | Median Income |
| 15 to 24 Years | 18 (4.9%) | $25,909 |
| 25 to 44 Years | 122 (33.1%) | $46,618 |
| 45 to 64 Years | 99 (26.8%) | $62,404 |
| 65+ Years | 130 (35.2%) | $43,438 |
| Total | 369 (100.0%) | $46,875 |
Poverty in Galatia
Income Below Poverty by Sex and Age in Galatia
With 11.1% poverty level for males and 11.4% for females among the residents of Galatia, 15 year old males and under 5 year old females are the most vulnerable to poverty, with 22 males (66.7%) and 14 females (82.4%) in their respective age groups living below the poverty level.
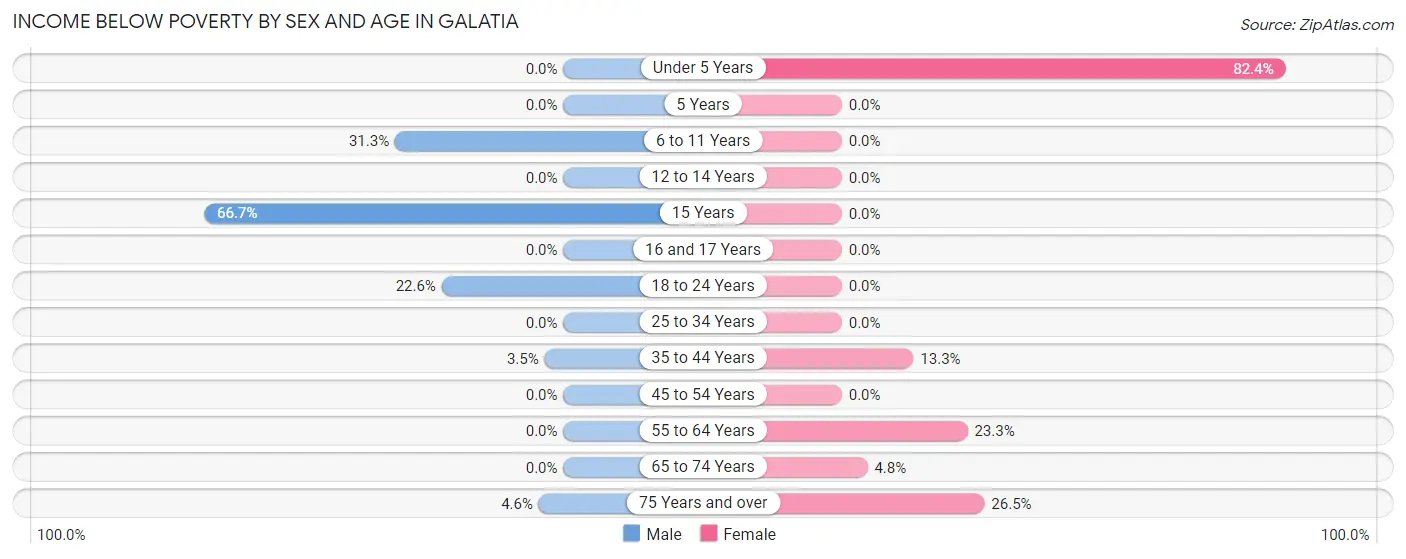
| Age Bracket | Male | Female |
| Under 5 Years | 0 (0.0%) | 14 (82.4%) |
| 5 Years | 0 (0.0%) | 0 (0.0%) |
| 6 to 11 Years | 15 (31.2%) | 0 (0.0%) |
| 12 to 14 Years | 0 (0.0%) | 0 (0.0%) |
| 15 Years | 22 (66.7%) | 0 (0.0%) |
| 16 and 17 Years | 0 (0.0%) | 0 (0.0%) |
| 18 to 24 Years | 7 (22.6%) | 0 (0.0%) |
| 25 to 34 Years | 0 (0.0%) | 0 (0.0%) |
| 35 to 44 Years | 3 (3.5%) | 21 (13.3%) |
| 45 to 54 Years | 0 (0.0%) | 0 (0.0%) |
| 55 to 64 Years | 0 (0.0%) | 14 (23.3%) |
| 65 to 74 Years | 0 (0.0%) | 3 (4.8%) |
| 75 Years and over | 1 (4.5%) | 9 (26.5%) |
| Total | 48 (11.1%) | 61 (11.4%) |
Income Above Poverty by Sex and Age in Galatia
According to the poverty statistics in Galatia, males aged under 5 years and females aged 6 to 11 years are the age groups that are most secure financially, with 100.0% of males and 100.0% of females in these age groups living above the poverty line.
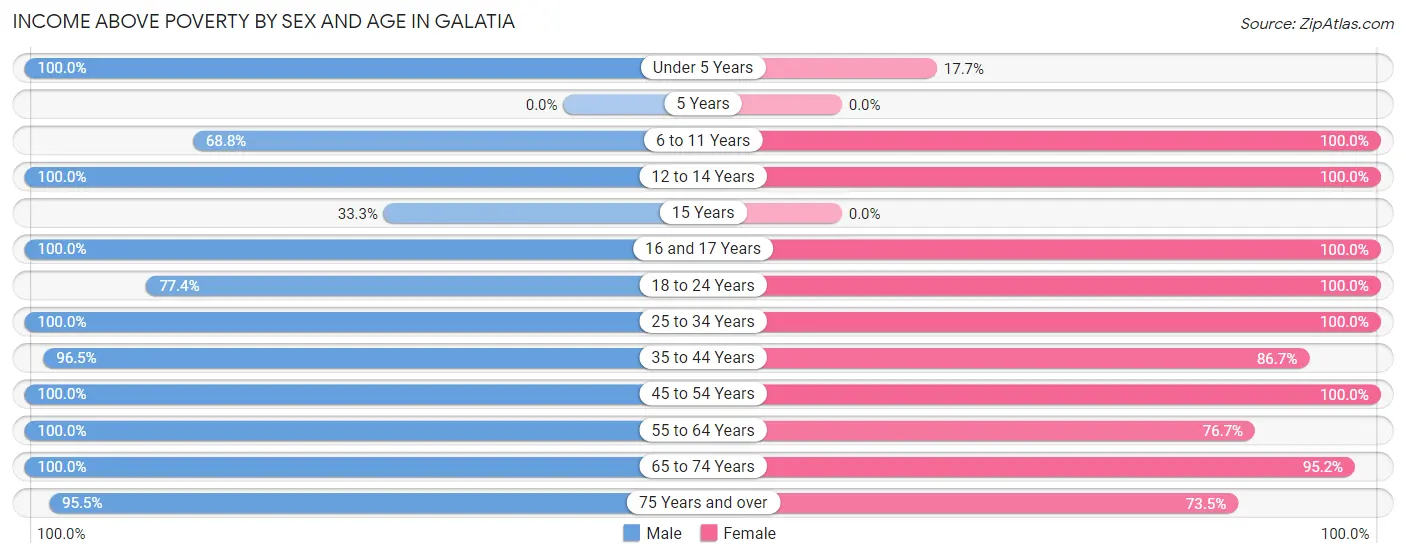
| Age Bracket | Male | Female |
| Under 5 Years | 17 (100.0%) | 3 (17.6%) |
| 5 Years | 0 (0.0%) | 0 (0.0%) |
| 6 to 11 Years | 33 (68.8%) | 43 (100.0%) |
| 12 to 14 Years | 7 (100.0%) | 38 (100.0%) |
| 15 Years | 11 (33.3%) | 0 (0.0%) |
| 16 and 17 Years | 2 (100.0%) | 5 (100.0%) |
| 18 to 24 Years | 24 (77.4%) | 77 (100.0%) |
| 25 to 34 Years | 21 (100.0%) | 21 (100.0%) |
| 35 to 44 Years | 83 (96.5%) | 137 (86.7%) |
| 45 to 54 Years | 45 (100.0%) | 17 (100.0%) |
| 55 to 64 Years | 51 (100.0%) | 46 (76.7%) |
| 65 to 74 Years | 68 (100.0%) | 60 (95.2%) |
| 75 Years and over | 21 (95.5%) | 25 (73.5%) |
| Total | 383 (88.9%) | 472 (88.6%) |
Income Below Poverty Among Married-Couple Families in Galatia
The poverty statistics for married-couple families in Galatia show that 0.7% or 1 of the total 143 families live below the poverty line. Families with no children have the highest poverty rate of 1.1%, comprising of 1 families. On the other hand, families with 1 or 2 children have the lowest poverty rate of 0.0%, which includes 0 families.
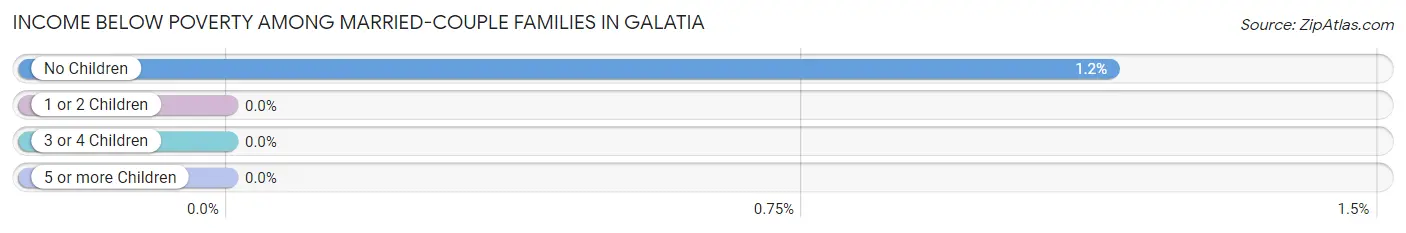
| Children | Above Poverty | Below Poverty |
| No Children | 86 (98.9%) | 1 (1.1%) |
| 1 or 2 Children | 52 (100.0%) | 0 (0.0%) |
| 3 or 4 Children | 4 (100.0%) | 0 (0.0%) |
| 5 or more Children | 0 (0.0%) | 0 (0.0%) |
| Total | 142 (99.3%) | 1 (0.7%) |
Income Below Poverty Among Single-Parent Households in Galatia
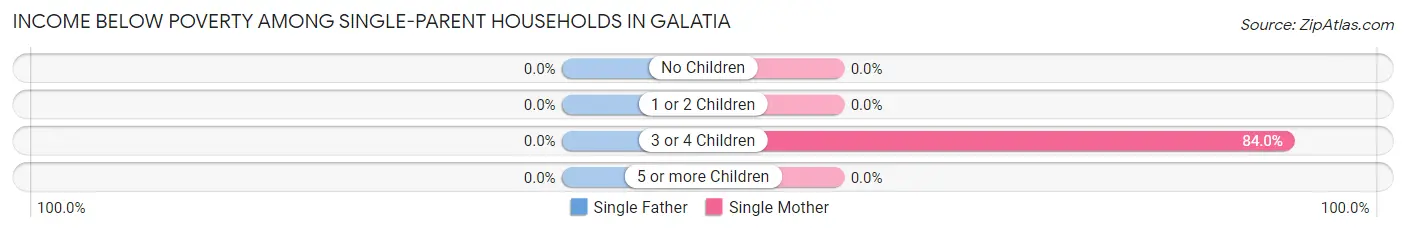
| Children | Single Father | Single Mother |
| No Children | 0 (0.0%) | 0 (0.0%) |
| 1 or 2 Children | 0 (0.0%) | 0 (0.0%) |
| 3 or 4 Children | 0 (0.0%) | 21 (84.0%) |
| 5 or more Children | 0 (0.0%) | 0 (0.0%) |
| Total | 0 (0.0%) | 21 (23.3%) |
Income Below Poverty Among Married-Couple vs Single-Parent Households in Galatia
The poverty data for Galatia shows that 1 of the married-couple family households (0.7%) and 21 of the single-parent households (22.3%) are living below the poverty level. Within the married-couple family households, those with no children have the highest poverty rate, with 1 households (1.1%) falling below the poverty line. Among the single-parent households, those with 3 or 4 children have the highest poverty rate, with 21 household (84.0%) living below poverty.
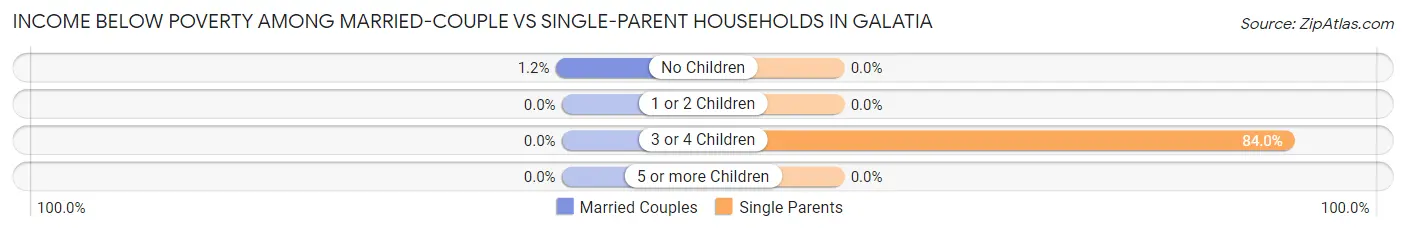
| Children | Married-Couple Families | Single-Parent Households |
| No Children | 1 (1.1%) | 0 (0.0%) |
| 1 or 2 Children | 0 (0.0%) | 0 (0.0%) |
| 3 or 4 Children | 0 (0.0%) | 21 (84.0%) |
| 5 or more Children | 0 (0.0%) | 0 (0.0%) |
| Total | 1 (0.7%) | 21 (22.3%) |
Race in Galatia
The most populous races in Galatia are White / Caucasian (914 | 94.8%), Two or more Races (36 | 3.7%), and Hawaiian / Pacific (11 | 1.1%).
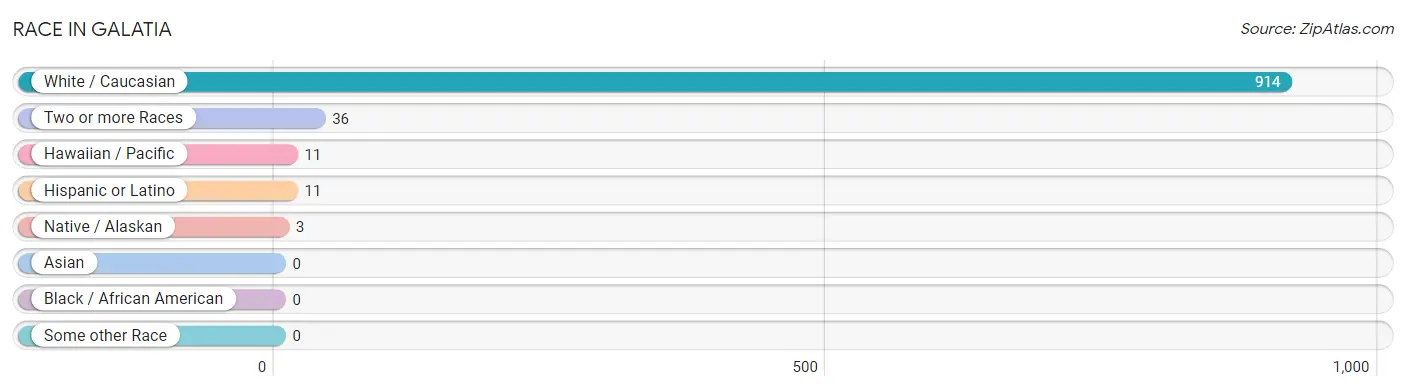
| Race | # Population | % Population |
| Asian | 0 | 0.0% |
| Black / African American | 0 | 0.0% |
| Hawaiian / Pacific | 11 | 1.1% |
| Hispanic or Latino | 11 | 1.1% |
| Native / Alaskan | 3 | 0.3% |
| White / Caucasian | 914 | 94.8% |
| Two or more Races | 36 | 3.7% |
| Some other Race | 0 | 0.0% |
| Total | 964 | 100.0% |
Ancestry in Galatia
The most populous ancestries reported in Galatia are Irish (189 | 19.6%), English (167 | 17.3%), German (111 | 11.5%), Polish (83 | 8.6%), and Russian (73 | 7.6%), together accounting for 64.6% of all Galatia residents.
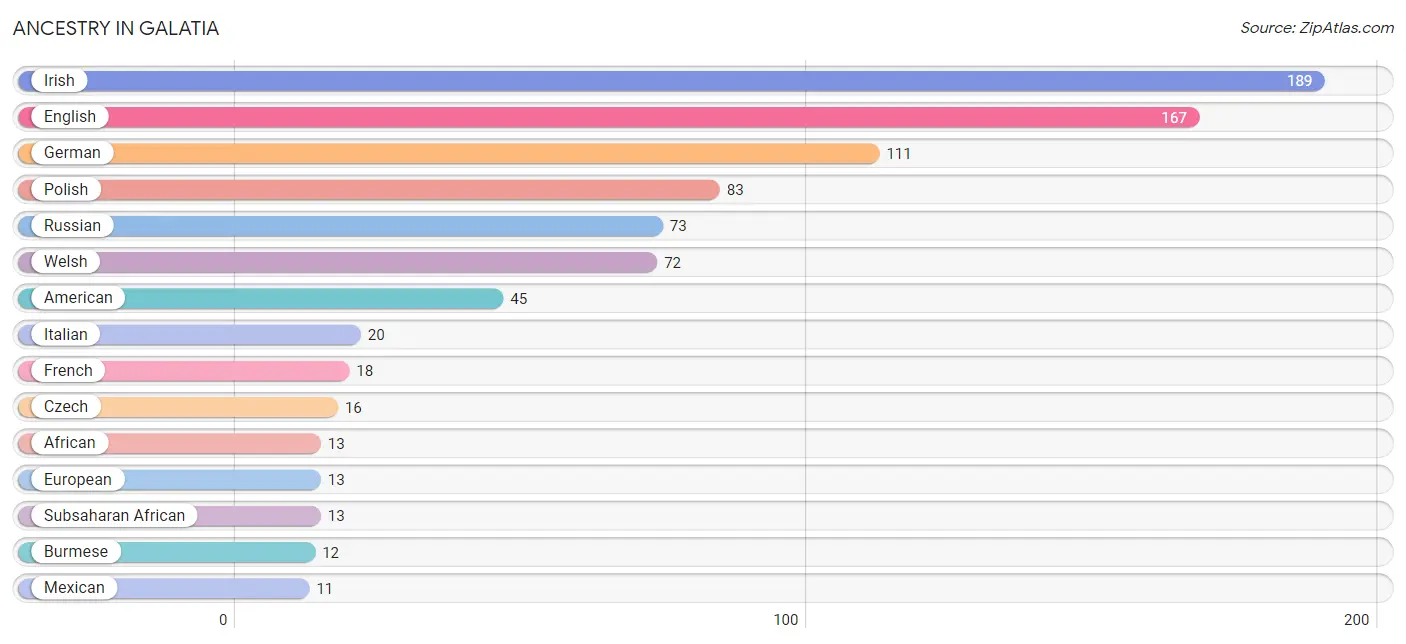
| Ancestry | # Population | % Population |
| African | 13 | 1.3% |
| American | 45 | 4.7% |
| Burmese | 12 | 1.2% |
| Czech | 16 | 1.7% |
| Dutch | 3 | 0.3% |
| English | 167 | 17.3% |
| European | 13 | 1.3% |
| French | 18 | 1.9% |
| German | 111 | 11.5% |
| Irish | 189 | 19.6% |
| Italian | 20 | 2.1% |
| Lithuanian | 8 | 0.8% |
| Mexican | 11 | 1.1% |
| Native Hawaiian | 11 | 1.1% |
| Polish | 83 | 8.6% |
| Russian | 73 | 7.6% |
| Scottish | 2 | 0.2% |
| Seminole | 3 | 0.3% |
| Subsaharan African | 13 | 1.3% |
| Welsh | 72 | 7.5% | View All 20 Rows |
Immigrants in Galatia

| Immigration Origin | # Population | % Population | View All 0 Rows |
Sex and Age in Galatia
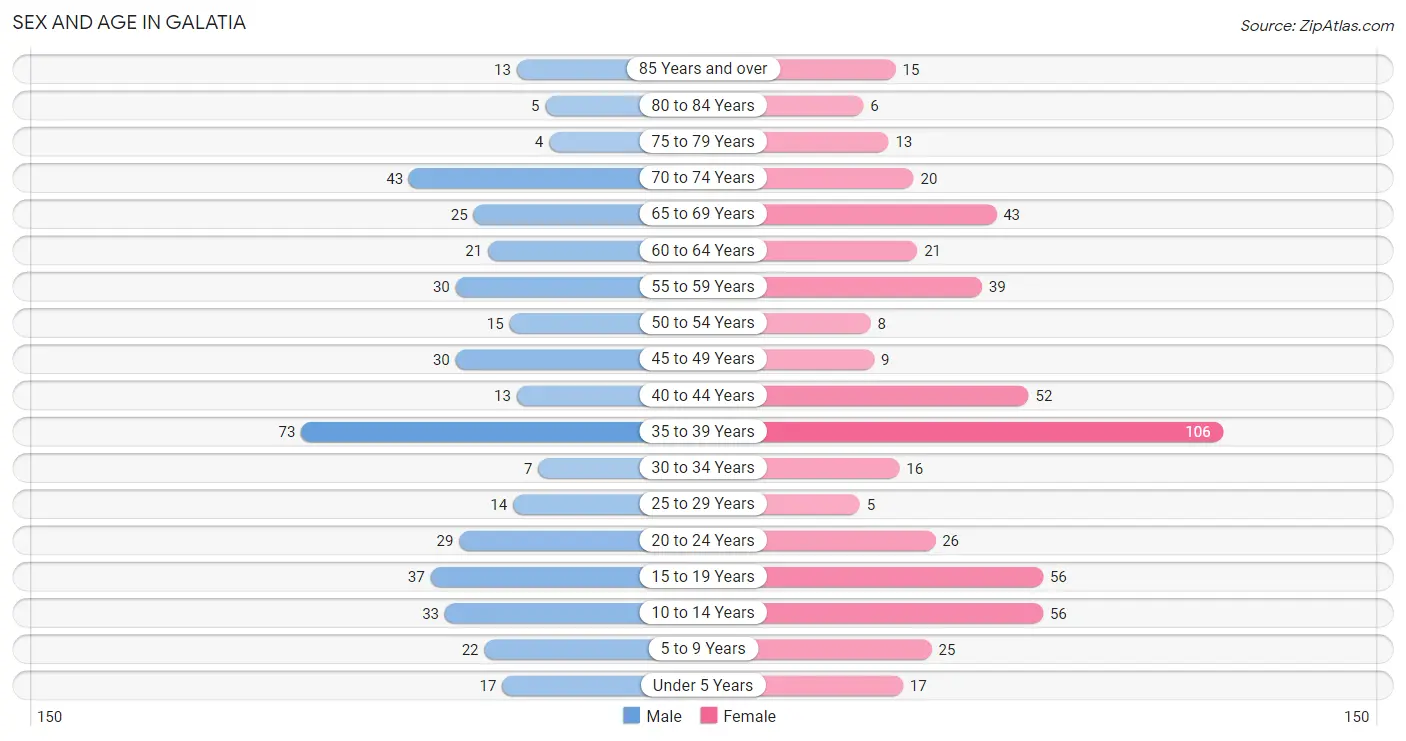
Sex and Age in Galatia
The most populous age groups in Galatia are 35 to 39 Years (73 | 16.9%) for men and 35 to 39 Years (106 | 19.9%) for women.
| Age Bracket | Male | Female |
| Under 5 Years | 17 (3.9%) | 17 (3.2%) |
| 5 to 9 Years | 22 (5.1%) | 25 (4.7%) |
| 10 to 14 Years | 33 (7.7%) | 56 (10.5%) |
| 15 to 19 Years | 37 (8.6%) | 56 (10.5%) |
| 20 to 24 Years | 29 (6.7%) | 26 (4.9%) |
| 25 to 29 Years | 14 (3.3%) | 5 (0.9%) |
| 30 to 34 Years | 7 (1.6%) | 16 (3.0%) |
| 35 to 39 Years | 73 (16.9%) | 106 (19.9%) |
| 40 to 44 Years | 13 (3.0%) | 52 (9.8%) |
| 45 to 49 Years | 30 (7.0%) | 9 (1.7%) |
| 50 to 54 Years | 15 (3.5%) | 8 (1.5%) |
| 55 to 59 Years | 30 (7.0%) | 39 (7.3%) |
| 60 to 64 Years | 21 (4.9%) | 21 (3.9%) |
| 65 to 69 Years | 25 (5.8%) | 43 (8.1%) |
| 70 to 74 Years | 43 (10.0%) | 20 (3.7%) |
| 75 to 79 Years | 4 (0.9%) | 13 (2.4%) |
| 80 to 84 Years | 5 (1.2%) | 6 (1.1%) |
| 85 Years and over | 13 (3.0%) | 15 (2.8%) |
| Total | 431 (100.0%) | 533 (100.0%) |
Families and Households in Galatia
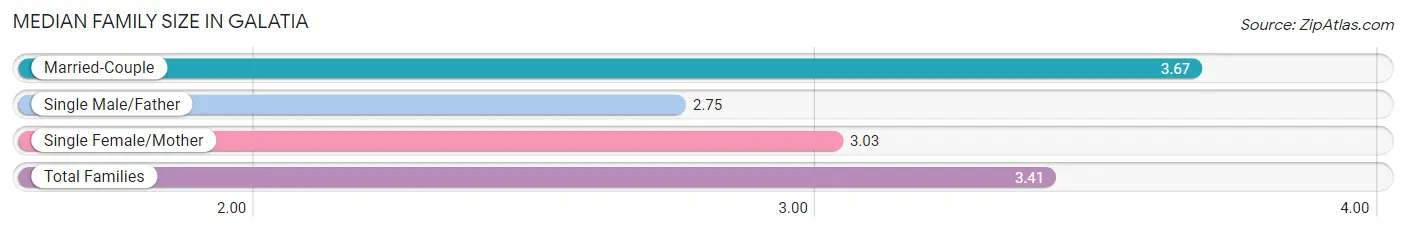
Median Family Size in Galatia
The median family size in Galatia is 3.41 persons per family, with married-couple families (143 | 60.3%) accounting for the largest median family size of 3.67 persons per family. On the other hand, single male/father families (4 | 1.7%) represent the smallest median family size with 2.75 persons per family.
| Family Type | # Families | Family Size |
| Married-Couple | 143 (60.3%) | 3.67 |
| Single Male/Father | 4 (1.7%) | 2.75 |
| Single Female/Mother | 90 (38.0%) | 3.03 |
| Total Families | 237 (100.0%) | 3.41 |
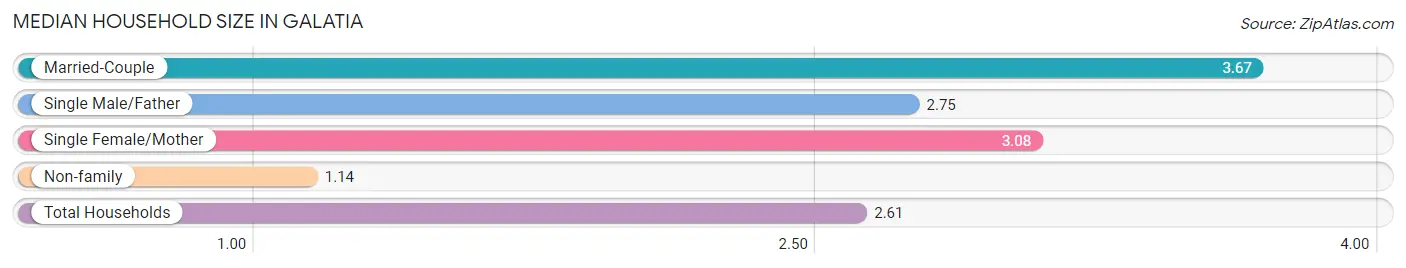
Median Household Size in Galatia
The median household size in Galatia is 2.61 persons per household, with married-couple households (143 | 38.8%) accounting for the largest median household size of 3.67 persons per household. non-family households (132 | 35.8%) represent the smallest median household size with 1.14 persons per household.
| Household Type | # Households | Household Size |
| Married-Couple | 143 (38.8%) | 3.67 |
| Single Male/Father | 4 (1.1%) | 2.75 |
| Single Female/Mother | 90 (24.4%) | 3.08 |
| Non-family | 132 (35.8%) | 1.14 |
| Total Households | 369 (100.0%) | 2.61 |
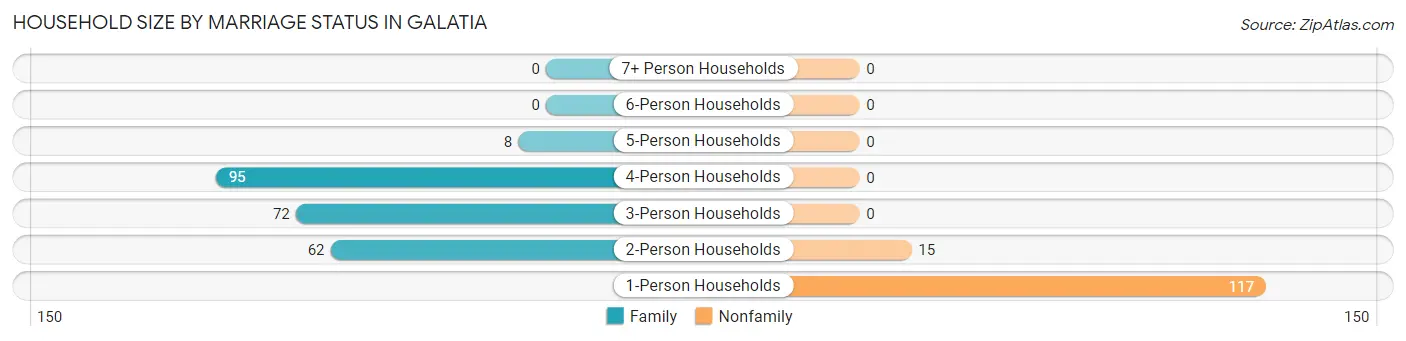
Household Size by Marriage Status in Galatia
Out of a total of 369 households in Galatia, 237 (64.2%) are family households, while 132 (35.8%) are nonfamily households. The most numerous type of family households are 4-person households, comprising 95, and the most common type of nonfamily households are 1-person households, comprising 117.
| Household Size | Family Households | Nonfamily Households |
| 1-Person Households | - | 117 (31.7%) |
| 2-Person Households | 62 (16.8%) | 15 (4.1%) |
| 3-Person Households | 72 (19.5%) | 0 (0.0%) |
| 4-Person Households | 95 (25.8%) | 0 (0.0%) |
| 5-Person Households | 8 (2.2%) | 0 (0.0%) |
| 6-Person Households | 0 (0.0%) | 0 (0.0%) |
| 7+ Person Households | 0 (0.0%) | 0 (0.0%) |
| Total | 237 (64.2%) | 132 (35.8%) |
Female Fertility in Galatia
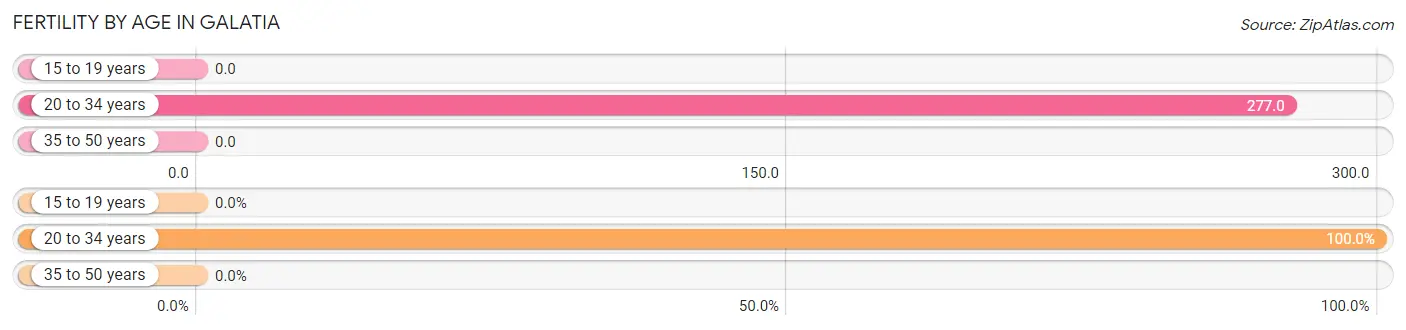
Fertility by Age in Galatia
Average fertility rate in Galatia is 47.0 births per 1,000 women. Women in the age bracket of 20 to 34 years have the highest fertility rate with 277.0 births per 1,000 women. Women in the age bracket of 20 to 34 years acount for 100.0% of all women with births.
| Age Bracket | Women with Births | Births / 1,000 Women |
| 15 to 19 years | 0 (0.0%) | 0.0 |
| 20 to 34 years | 13 (100.0%) | 277.0 |
| 35 to 50 years | 0 (0.0%) | 0.0 |
| Total | 13 (100.0%) | 47.0 |
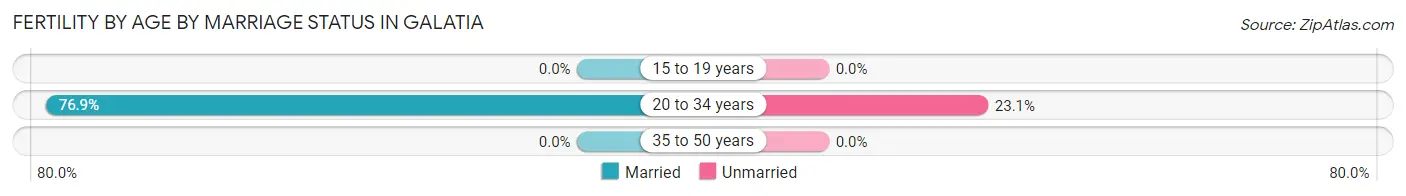
Fertility by Age by Marriage Status in Galatia
76.9% of women with births (13) in Galatia are married. The highest percentage of unmarried women with births falls into 20 to 34 years age bracket with 23.1% of them unmarried at the time of birth, while the lowest percentage of unmarried women with births belong to 20 to 34 years age bracket with 23.1% of them unmarried.
| Age Bracket | Married | Unmarried |
| 15 to 19 years | 0 (0.0%) | 0 (0.0%) |
| 20 to 34 years | 10 (76.9%) | 3 (23.1%) |
| 35 to 50 years | 0 (0.0%) | 0 (0.0%) |
| Total | 10 (76.9%) | 3 (23.1%) |
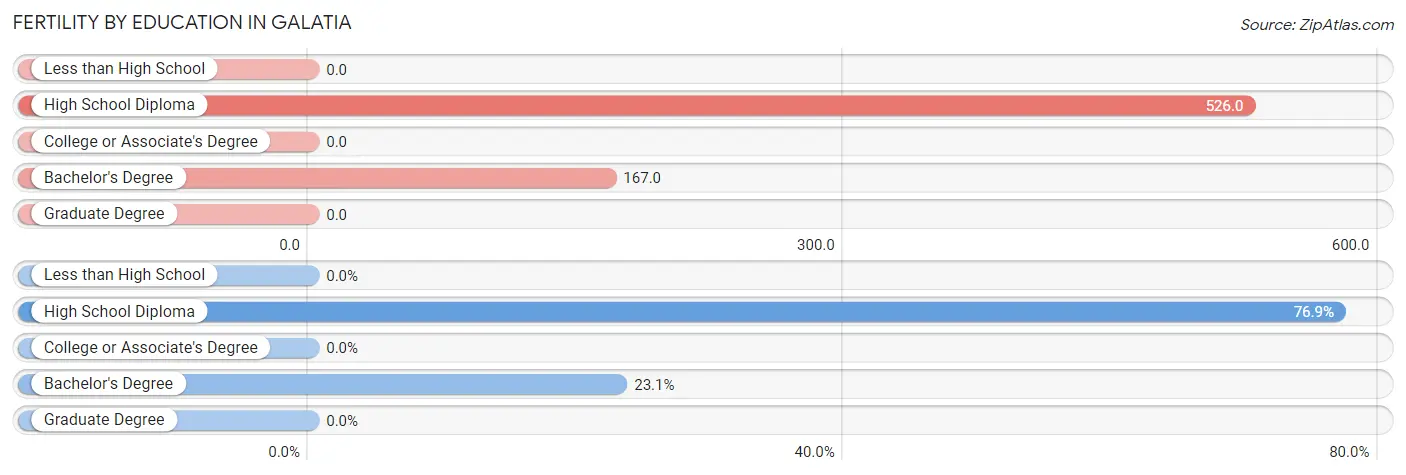
Fertility by Education in Galatia
| Educational Attainment | Women with Births | Births / 1,000 Women |
| Less than High School | 0 (0.0%) | 0.0 |
| High School Diploma | 10 (76.9%) | 526.0 |
| College or Associate's Degree | 0 (0.0%) | 0.0 |
| Bachelor's Degree | 3 (23.1%) | 167.0 |
| Graduate Degree | 0 (0.0%) | 0.0 |
| Total | 13 (100.0%) | 47.0 |
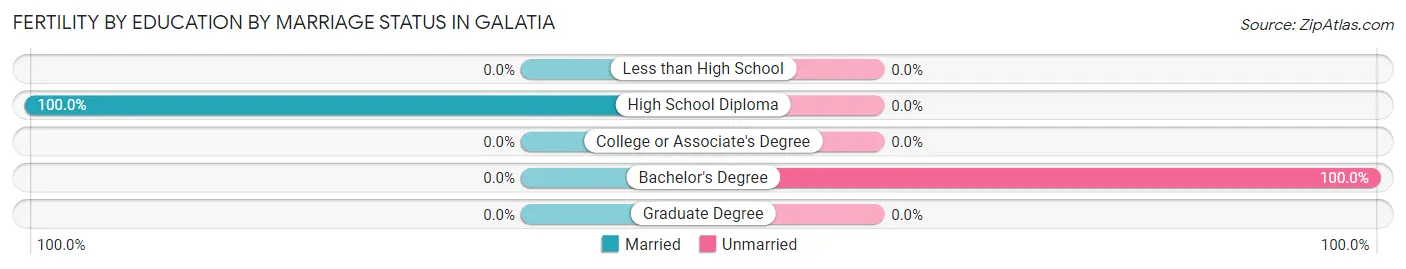
Fertility by Education by Marriage Status in Galatia
23.1% of women with births in Galatia are unmarried. Women with the educational attainment of high school diploma are most likely to be married with 100.0% of them married at childbirth, while women with the educational attainment of bachelor's degree are least likely to be married with 100.0% of them unmarried at childbirth.
| Educational Attainment | Married | Unmarried |
| Less than High School | 0 (0.0%) | 0 (0.0%) |
| High School Diploma | 10 (100.0%) | 0 (0.0%) |
| College or Associate's Degree | 0 (0.0%) | 0 (0.0%) |
| Bachelor's Degree | 0 (0.0%) | 3 (100.0%) |
| Graduate Degree | 0 (0.0%) | 0 (0.0%) |
| Total | 10 (76.9%) | 3 (23.1%) |
Employment Characteristics in Galatia
Employment by Class of Employer in Galatia
Among the 336 employed individuals in Galatia, private company employees (256 | 76.2%), not-for-profit organizations (25 | 7.4%), and state government employees (23 | 6.9%) make up the most common classes of employment.
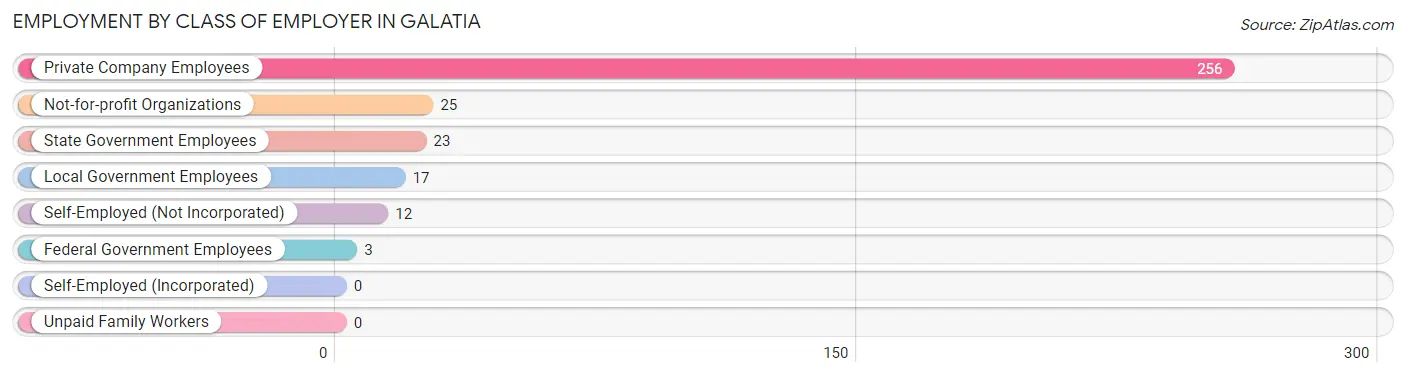
| Employer Class | # Employees | % Employees |
| Private Company Employees | 256 | 76.2% |
| Self-Employed (Incorporated) | 0 | 0.0% |
| Self-Employed (Not Incorporated) | 12 | 3.6% |
| Not-for-profit Organizations | 25 | 7.4% |
| Local Government Employees | 17 | 5.1% |
| State Government Employees | 23 | 6.9% |
| Federal Government Employees | 3 | 0.9% |
| Unpaid Family Workers | 0 | 0.0% |
| Total | 336 | 100.0% |
Employment Status by Age in Galatia
According to the labor force statistics for Galatia, out of the total population over 16 years of age (761), 60.7% or 462 individuals are in the labor force, with 5.2% or 24 of them unemployed. The age group with the highest labor force participation rate is 25 to 29 years, with 100.0% or 19 individuals in the labor force. Within the labor force, the 20 to 24 years age range has the highest percentage of unemployed individuals, with 26.0% or 13 of them being unemployed.
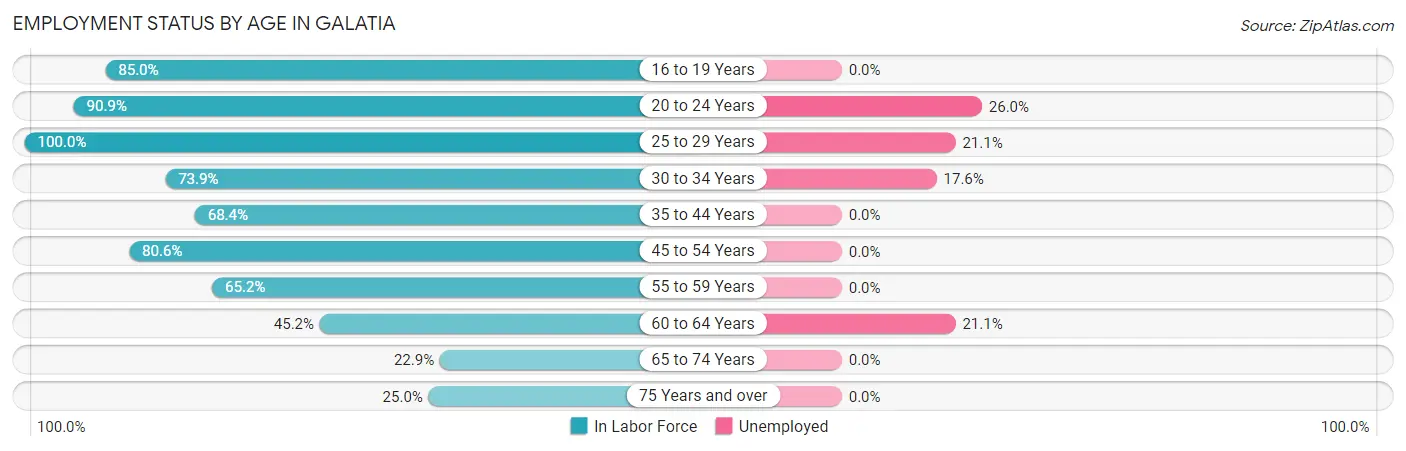
| Age Bracket | In Labor Force | Unemployed |
| 16 to 19 Years | 51 (85.0%) | 0 (0.0%) |
| 20 to 24 Years | 50 (90.9%) | 13 (26.0%) |
| 25 to 29 Years | 19 (100.0%) | 4 (21.1%) |
| 30 to 34 Years | 17 (73.9%) | 3 (17.6%) |
| 35 to 44 Years | 167 (68.4%) | 0 (0.0%) |
| 45 to 54 Years | 50 (80.6%) | 0 (0.0%) |
| 55 to 59 Years | 45 (65.2%) | 0 (0.0%) |
| 60 to 64 Years | 19 (45.2%) | 4 (21.1%) |
| 65 to 74 Years | 30 (22.9%) | 0 (0.0%) |
| 75 Years and over | 14 (25.0%) | 0 (0.0%) |
| Total | 462 (60.7%) | 24 (5.2%) |
Employment Status by Educational Attainment in Galatia
According to labor force statistics for Galatia, 69.1% of individuals (317) out of the total population between 25 and 64 years of age (459) are in the labor force, with 3.5% or 11 of them being unemployed. The group with the highest labor force participation rate are those with the educational attainment of less than high school, with 92.1% or 35 individuals in the labor force. Within the labor force, individuals with less than high school education have the highest percentage of unemployment, with 11.4% or 4 of them being unemployed.
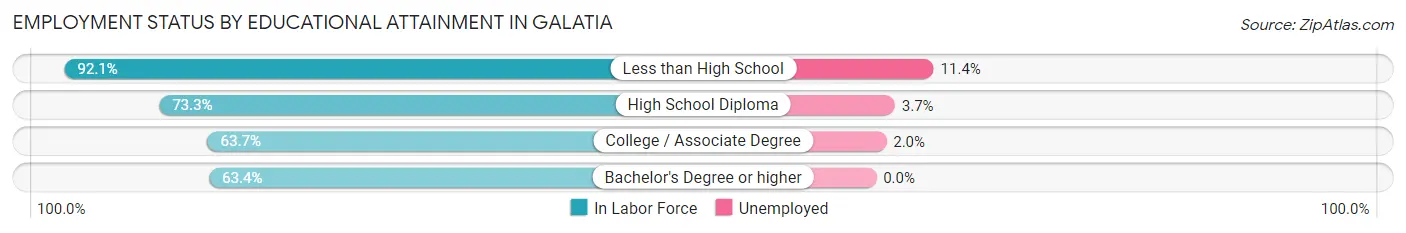
| Educational Attainment | In Labor Force | Unemployed |
| Less than High School | 35 (92.1%) | 4 (11.4%) |
| High School Diploma | 107 (73.3%) | 5 (3.7%) |
| College / Associate Degree | 149 (63.7%) | 5 (2.0%) |
| Bachelor's Degree or higher | 26 (63.4%) | 0 (0.0%) |
| Total | 317 (69.1%) | 16 (3.5%) |
Employment Occupations by Sex in Galatia
Management, Business, Science and Arts Occupations
The most common Management, Business, Science and Arts occupations in Galatia are Health Diagnosing & Treating (37 | 8.5%), Community & Social Service (25 | 5.7%), Business & Financial (21 | 4.8%), Health Technologists (21 | 4.8%), and Management (15 | 3.4%).
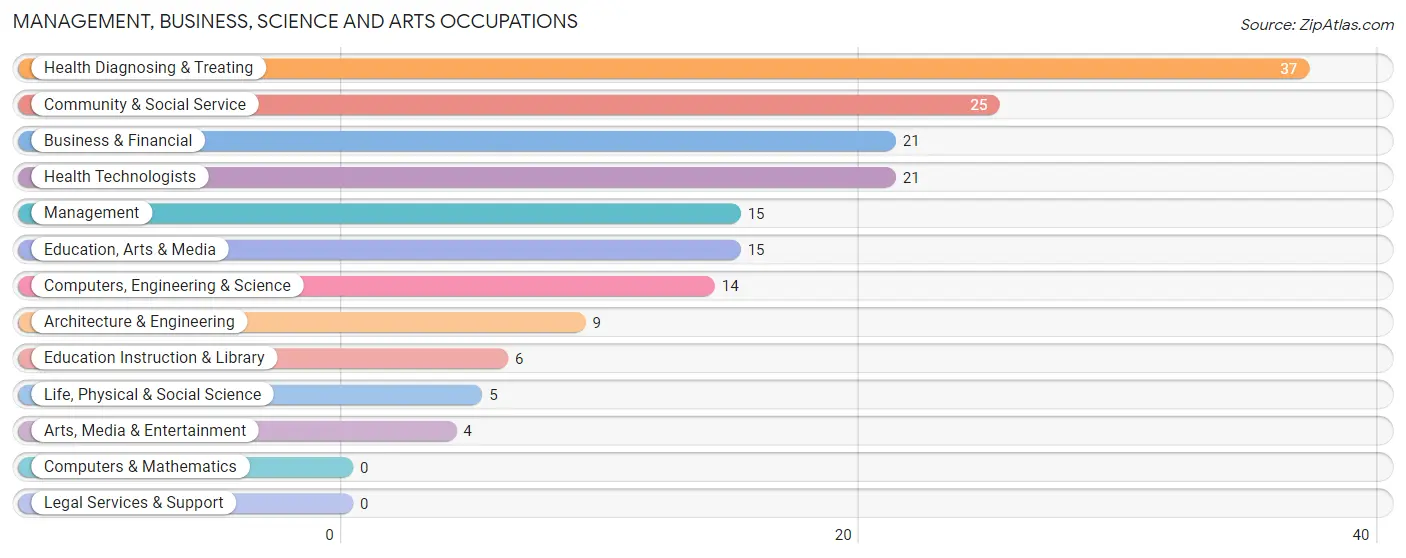
Management, Business, Science and Arts Occupations by Sex
Within the Management, Business, Science and Arts occupations in Galatia, the most male-oriented occupations are Computers, Engineering & Science (100.0%), Architecture & Engineering (100.0%), and Life, Physical & Social Science (100.0%), while the most female-oriented occupations are Health Diagnosing & Treating (100.0%), Health Technologists (100.0%), and Business & Financial (66.7%).
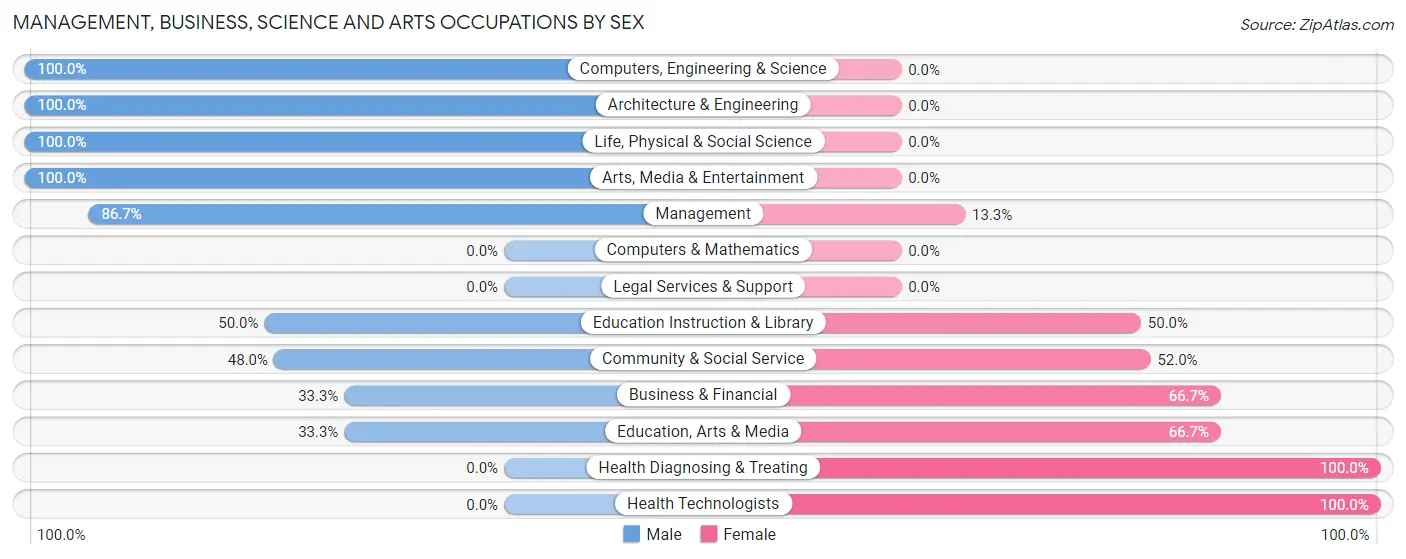
| Occupation | Male | Female |
| Management | 13 (86.7%) | 2 (13.3%) |
| Business & Financial | 7 (33.3%) | 14 (66.7%) |
| Computers, Engineering & Science | 14 (100.0%) | 0 (0.0%) |
| Computers & Mathematics | 0 (0.0%) | 0 (0.0%) |
| Architecture & Engineering | 9 (100.0%) | 0 (0.0%) |
| Life, Physical & Social Science | 5 (100.0%) | 0 (0.0%) |
| Community & Social Service | 12 (48.0%) | 13 (52.0%) |
| Education, Arts & Media | 5 (33.3%) | 10 (66.7%) |
| Legal Services & Support | 0 (0.0%) | 0 (0.0%) |
| Education Instruction & Library | 3 (50.0%) | 3 (50.0%) |
| Arts, Media & Entertainment | 4 (100.0%) | 0 (0.0%) |
| Health Diagnosing & Treating | 0 (0.0%) | 37 (100.0%) |
| Health Technologists | 0 (0.0%) | 21 (100.0%) |
| Total (Category) | 46 (41.1%) | 66 (58.9%) |
| Total (Overall) | 204 (46.6%) | 234 (53.4%) |
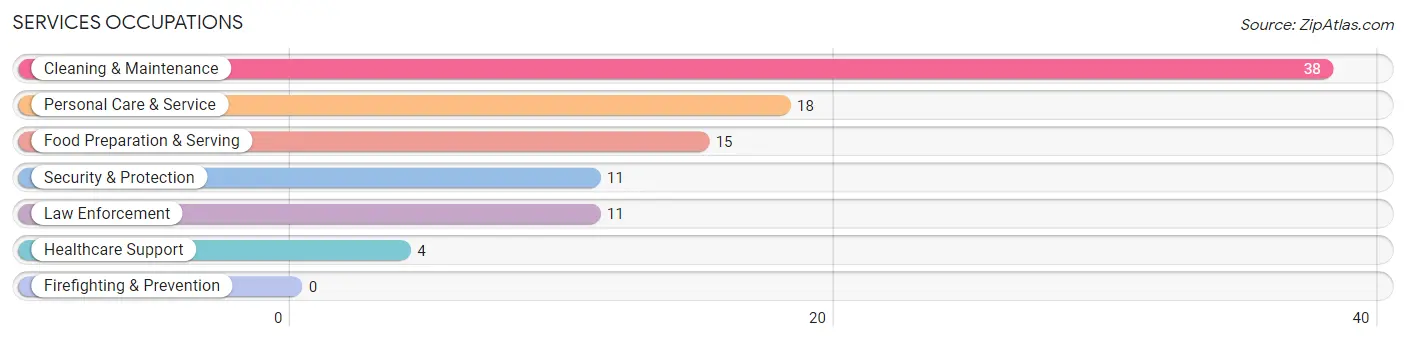
Services Occupations
The most common Services occupations in Galatia are Cleaning & Maintenance (38 | 8.7%), Personal Care & Service (18 | 4.1%), Food Preparation & Serving (15 | 3.4%), Security & Protection (11 | 2.5%), and Law Enforcement (11 | 2.5%).
Services Occupations by Sex
Within the Services occupations in Galatia, the most male-oriented occupations are Security & Protection (100.0%), Law Enforcement (100.0%), and Food Preparation & Serving (20.0%), while the most female-oriented occupations are Healthcare Support (100.0%), Personal Care & Service (88.9%), and Cleaning & Maintenance (84.2%).
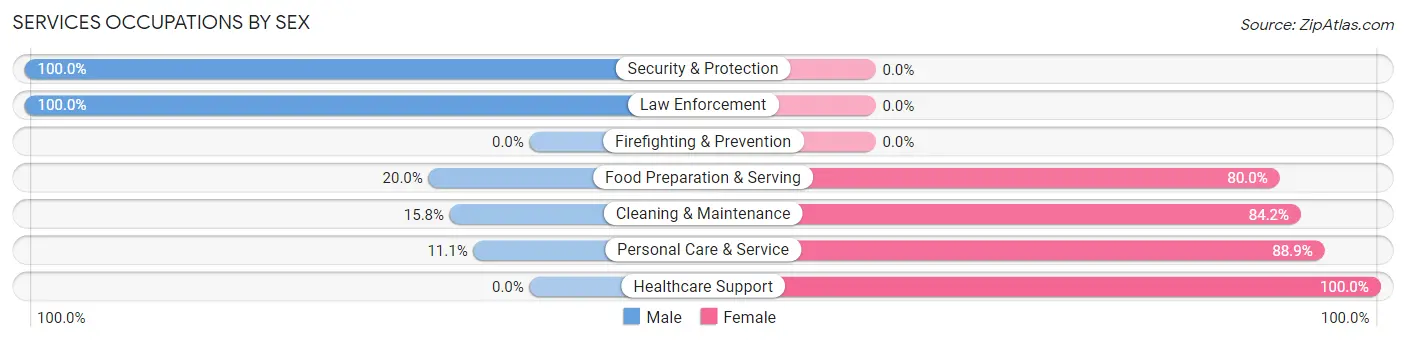
| Occupation | Male | Female |
| Healthcare Support | 0 (0.0%) | 4 (100.0%) |
| Security & Protection | 11 (100.0%) | 0 (0.0%) |
| Firefighting & Prevention | 0 (0.0%) | 0 (0.0%) |
| Law Enforcement | 11 (100.0%) | 0 (0.0%) |
| Food Preparation & Serving | 3 (20.0%) | 12 (80.0%) |
| Cleaning & Maintenance | 6 (15.8%) | 32 (84.2%) |
| Personal Care & Service | 2 (11.1%) | 16 (88.9%) |
| Total (Category) | 22 (25.6%) | 64 (74.4%) |
| Total (Overall) | 204 (46.6%) | 234 (53.4%) |
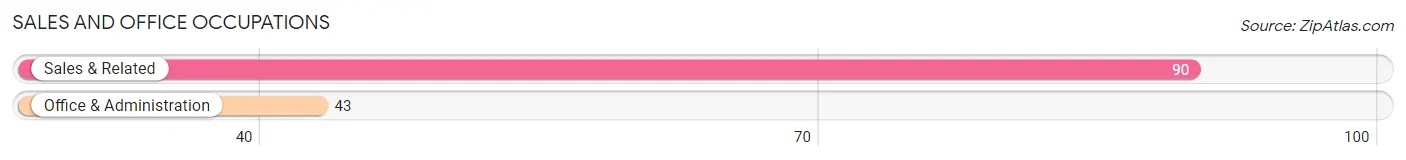
Sales and Office Occupations
The most common Sales and Office occupations in Galatia are Sales & Related (90 | 20.5%), and Office & Administration (43 | 9.8%).
Sales and Office Occupations by Sex

| Occupation | Male | Female |
| Sales & Related | 45 (50.0%) | 45 (50.0%) |
| Office & Administration | 8 (18.6%) | 35 (81.4%) |
| Total (Category) | 53 (39.9%) | 80 (60.2%) |
| Total (Overall) | 204 (46.6%) | 234 (53.4%) |
Natural Resources, Construction and Maintenance Occupations
The most common Natural Resources, Construction and Maintenance occupations in Galatia are Construction & Extraction (17 | 3.9%), and Installation, Maintenance & Repair (8 | 1.8%).
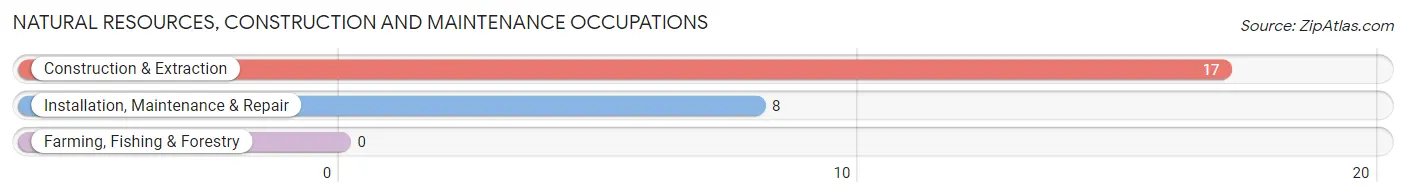
Natural Resources, Construction and Maintenance Occupations by Sex
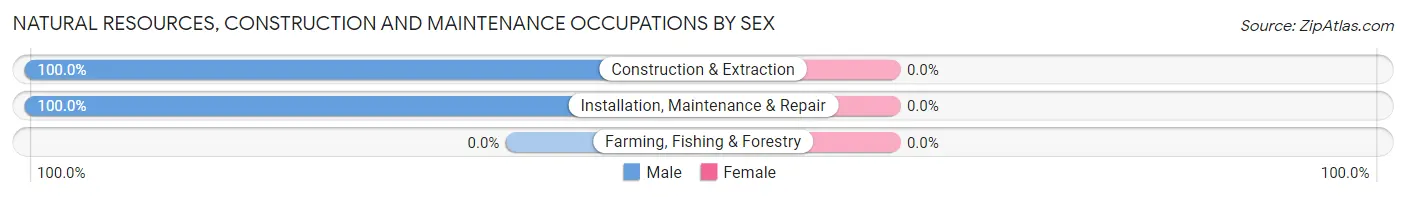
| Occupation | Male | Female |
| Farming, Fishing & Forestry | 0 (0.0%) | 0 (0.0%) |
| Construction & Extraction | 17 (100.0%) | 0 (0.0%) |
| Installation, Maintenance & Repair | 8 (100.0%) | 0 (0.0%) |
| Total (Category) | 25 (100.0%) | 0 (0.0%) |
| Total (Overall) | 204 (46.6%) | 234 (53.4%) |
Production, Transportation and Moving Occupations
The most common Production, Transportation and Moving occupations in Galatia are Transportation (34 | 7.8%), Material Moving (28 | 6.4%), and Production (20 | 4.6%).
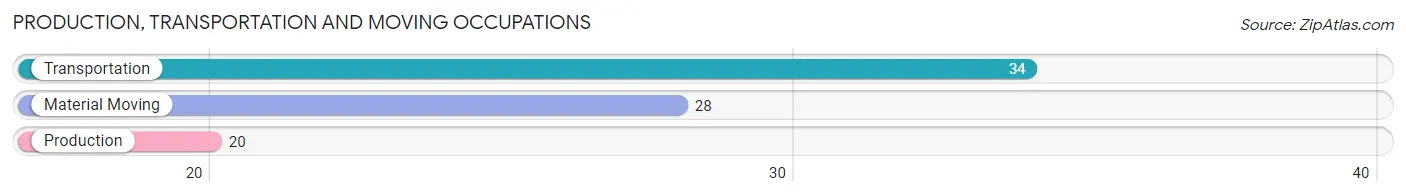
Production, Transportation and Moving Occupations by Sex
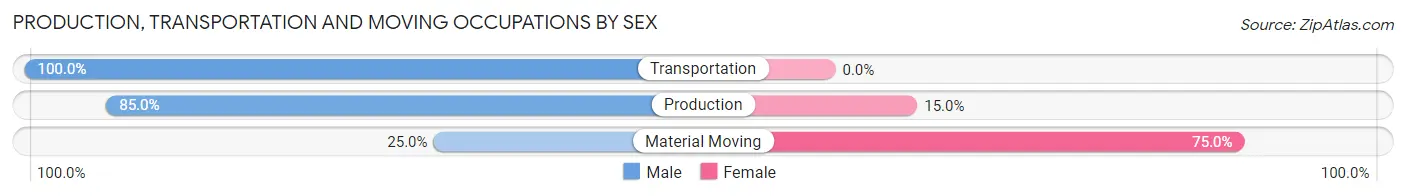
| Occupation | Male | Female |
| Production | 17 (85.0%) | 3 (15.0%) |
| Transportation | 34 (100.0%) | 0 (0.0%) |
| Material Moving | 7 (25.0%) | 21 (75.0%) |
| Total (Category) | 58 (70.7%) | 24 (29.3%) |
| Total (Overall) | 204 (46.6%) | 234 (53.4%) |
Employment Industries by Sex in Galatia
Employment Industries in Galatia
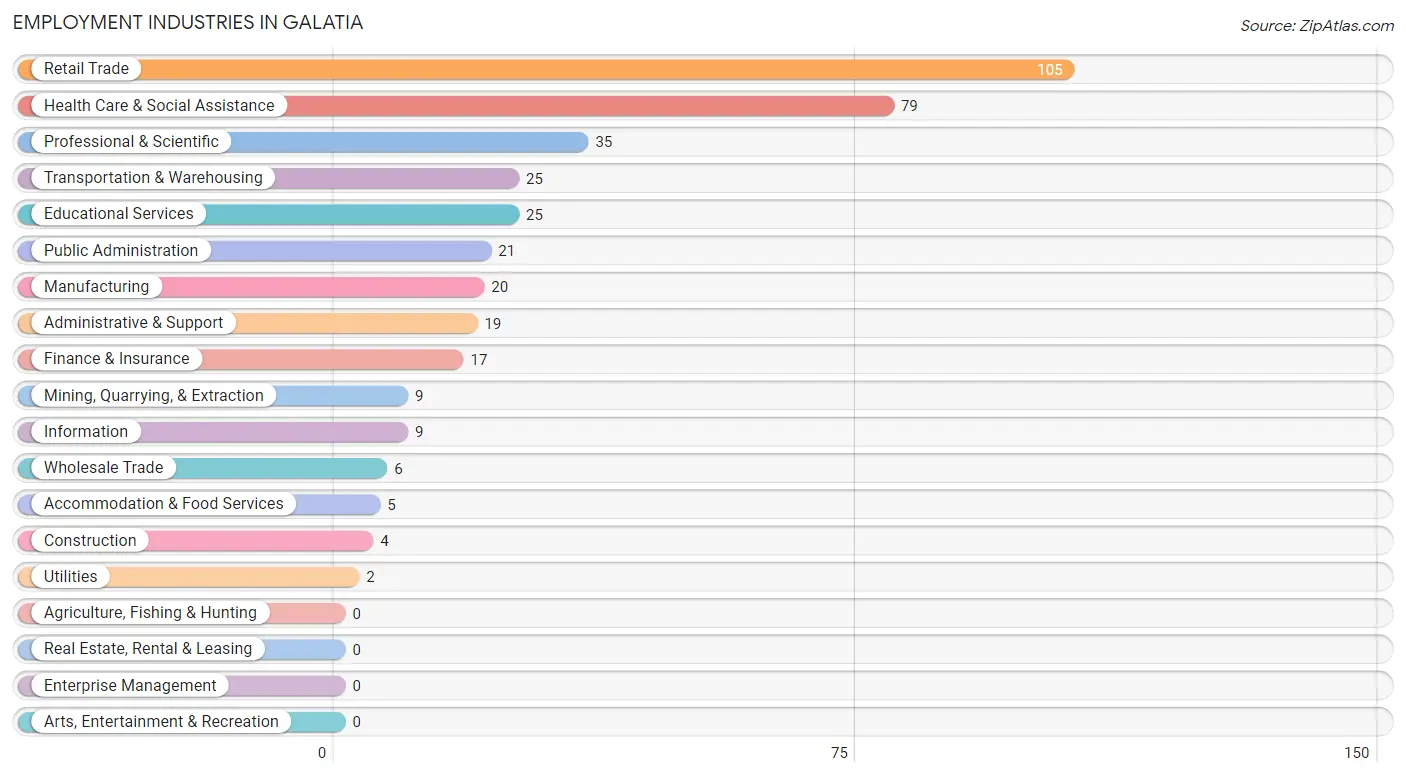
The major employment industries in Galatia include Retail Trade (105 | 24.0%), Health Care & Social Assistance (79 | 18.0%), Professional & Scientific (35 | 8.0%), Transportation & Warehousing (25 | 5.7%), and Educational Services (25 | 5.7%).
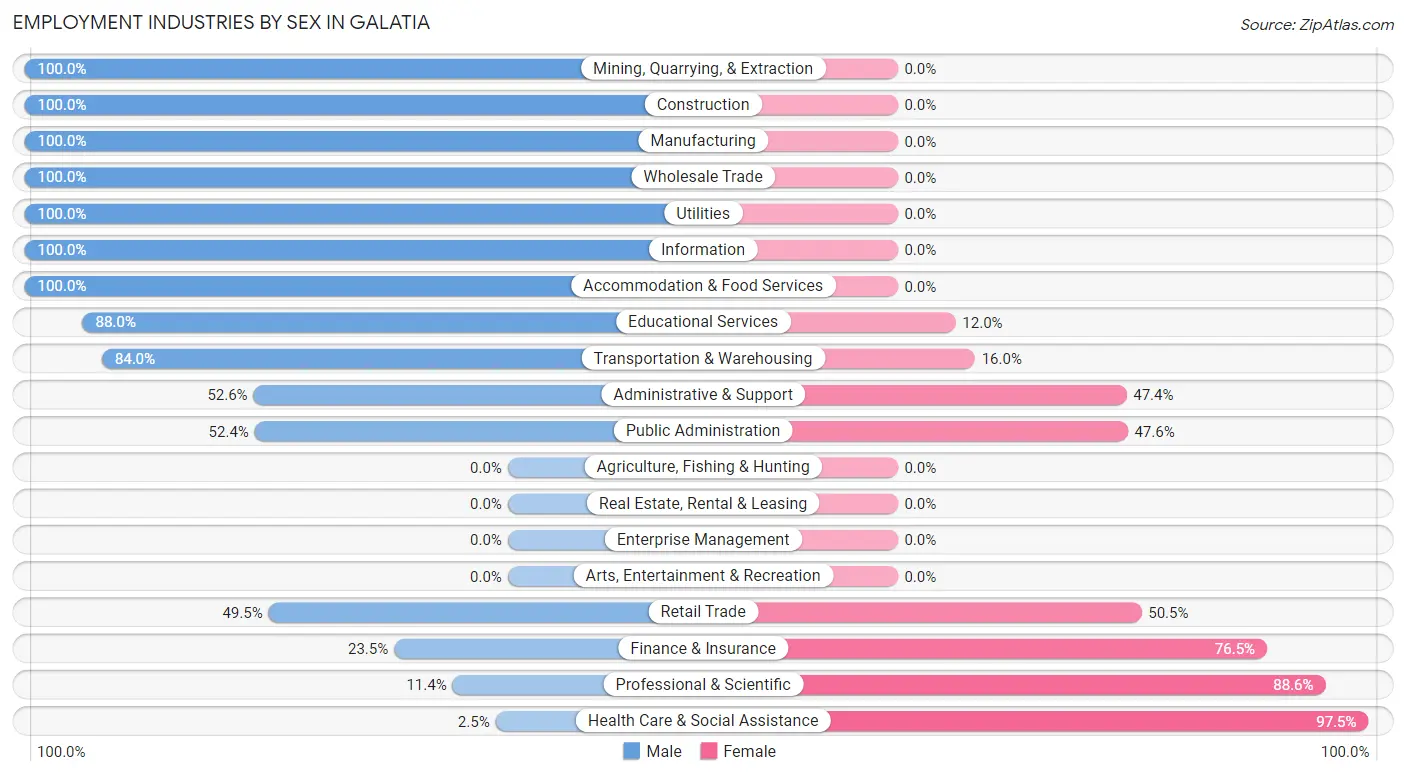
Employment Industries by Sex in Galatia
The Galatia industries that see more men than women are Mining, Quarrying, & Extraction (100.0%), Construction (100.0%), and Manufacturing (100.0%), whereas the industries that tend to have a higher number of women are Health Care & Social Assistance (97.5%), Professional & Scientific (88.6%), and Finance & Insurance (76.5%).
| Industry | Male | Female |
| Agriculture, Fishing & Hunting | 0 (0.0%) | 0 (0.0%) |
| Mining, Quarrying, & Extraction | 9 (100.0%) | 0 (0.0%) |
| Construction | 4 (100.0%) | 0 (0.0%) |
| Manufacturing | 20 (100.0%) | 0 (0.0%) |
| Wholesale Trade | 6 (100.0%) | 0 (0.0%) |
| Retail Trade | 52 (49.5%) | 53 (50.5%) |
| Transportation & Warehousing | 21 (84.0%) | 4 (16.0%) |
| Utilities | 2 (100.0%) | 0 (0.0%) |
| Information | 9 (100.0%) | 0 (0.0%) |
| Finance & Insurance | 4 (23.5%) | 13 (76.5%) |
| Real Estate, Rental & Leasing | 0 (0.0%) | 0 (0.0%) |
| Professional & Scientific | 4 (11.4%) | 31 (88.6%) |
| Enterprise Management | 0 (0.0%) | 0 (0.0%) |
| Administrative & Support | 10 (52.6%) | 9 (47.4%) |
| Educational Services | 22 (88.0%) | 3 (12.0%) |
| Health Care & Social Assistance | 2 (2.5%) | 77 (97.5%) |
| Arts, Entertainment & Recreation | 0 (0.0%) | 0 (0.0%) |
| Accommodation & Food Services | 5 (100.0%) | 0 (0.0%) |
| Public Administration | 11 (52.4%) | 10 (47.6%) |
| Total | 204 (46.6%) | 234 (53.4%) |
Education in Galatia
School Enrollment in Galatia
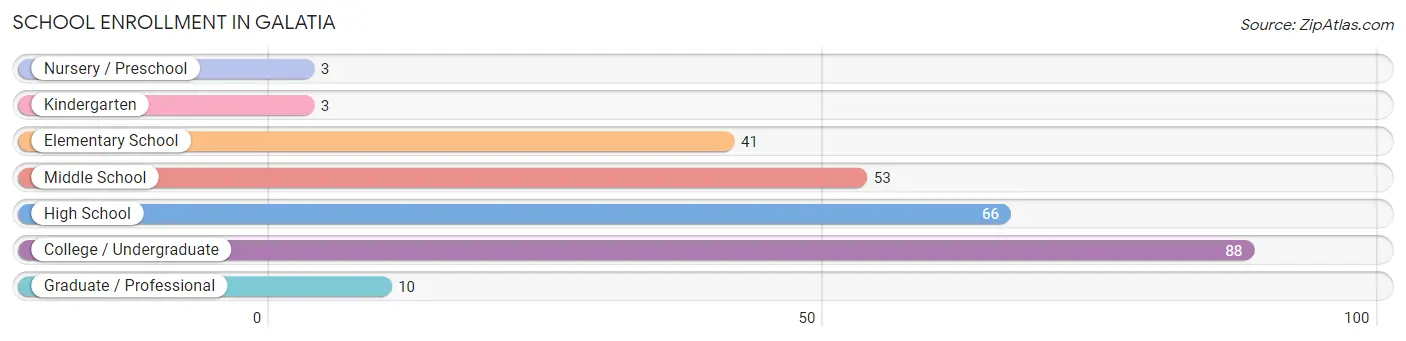
The most common levels of schooling among the 264 students in Galatia are college / undergraduate (88 | 33.3%), high school (66 | 25.0%), and middle school (53 | 20.1%).
| School Level | # Students | % Students |
| Nursery / Preschool | 3 | 1.1% |
| Kindergarten | 3 | 1.1% |
| Elementary School | 41 | 15.5% |
| Middle School | 53 | 20.1% |
| High School | 66 | 25.0% |
| College / Undergraduate | 88 | 33.3% |
| Graduate / Professional | 10 | 3.8% |
| Total | 264 | 100.0% |
School Enrollment by Age by Funding Source in Galatia
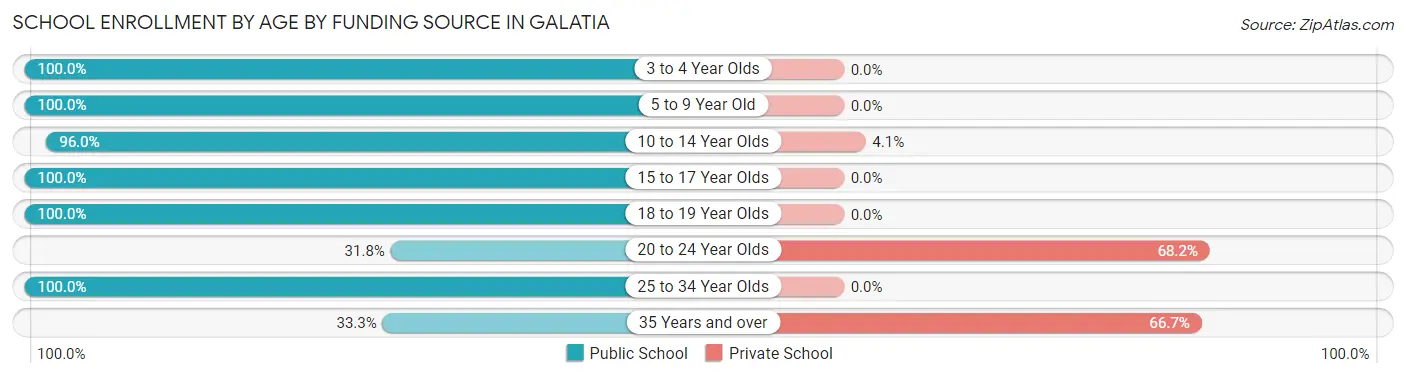
Out of a total of 264 students who are enrolled in schools in Galatia, 28 (10.6%) attend a private institution, while the remaining 236 (89.4%) are enrolled in public schools. The age group of 20 to 24 year olds has the highest likelihood of being enrolled in private schools, with 15 (68.2% in the age bracket) enrolled. Conversely, the age group of 3 to 4 year olds has the lowest likelihood of being enrolled in a private school, with 3 (100.0% in the age bracket) attending a public institution.
| Age Bracket | Public School | Private School |
| 3 to 4 Year Olds | 3 (100.0%) | 0 (0.0%) |
| 5 to 9 Year Old | 47 (100.0%) | 0 (0.0%) |
| 10 to 14 Year Olds | 71 (96.0%) | 3 (4.1%) |
| 15 to 17 Year Olds | 40 (100.0%) | 0 (0.0%) |
| 18 to 19 Year Olds | 53 (100.0%) | 0 (0.0%) |
| 20 to 24 Year Olds | 7 (31.8%) | 15 (68.2%) |
| 25 to 34 Year Olds | 10 (100.0%) | 0 (0.0%) |
| 35 Years and over | 5 (33.3%) | 10 (66.7%) |
| Total | 236 (89.4%) | 28 (10.6%) |
Educational Attainment by Field of Study in Galatia
Education (21 | 25.9%), bio, nature & agricultural (20 | 24.7%), liberal arts & history (13 | 16.1%), business (12 | 14.8%), and science & technology (10 | 12.3%) are the most common fields of study among 81 individuals in Galatia who have obtained a bachelor's degree or higher.
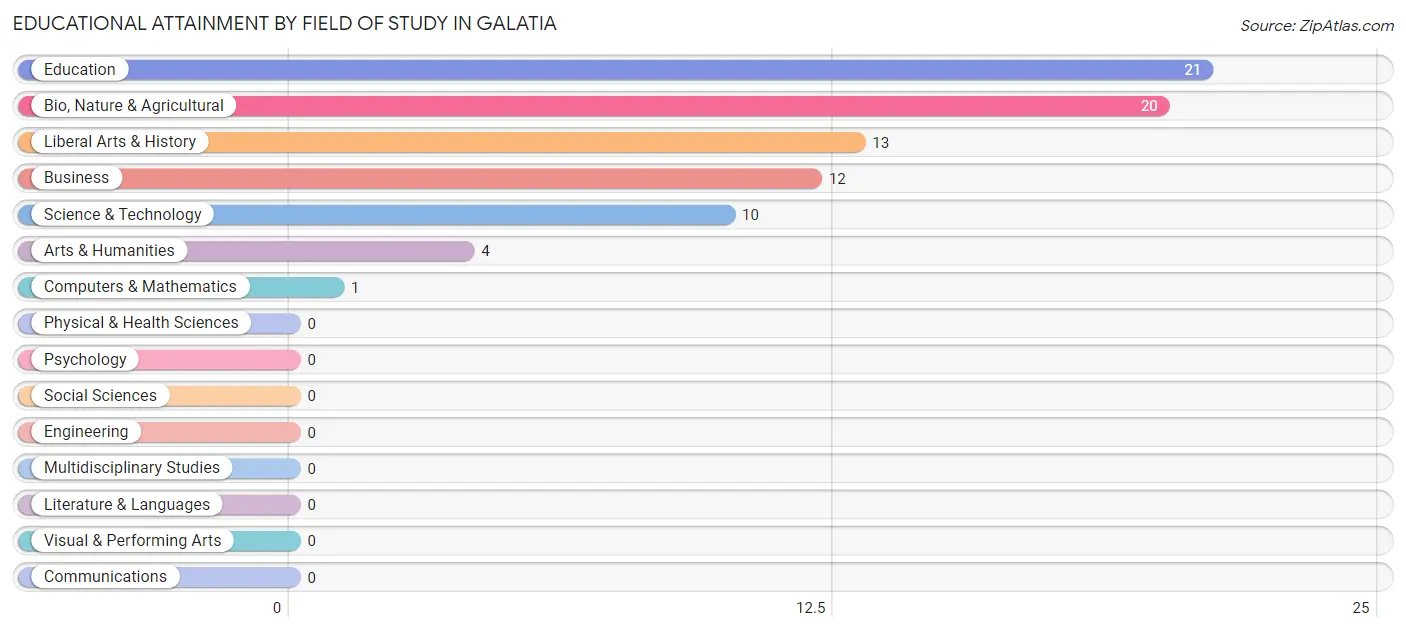
| Field of Study | # Graduates | % Graduates |
| Computers & Mathematics | 1 | 1.2% |
| Bio, Nature & Agricultural | 20 | 24.7% |
| Physical & Health Sciences | 0 | 0.0% |
| Psychology | 0 | 0.0% |
| Social Sciences | 0 | 0.0% |
| Engineering | 0 | 0.0% |
| Multidisciplinary Studies | 0 | 0.0% |
| Science & Technology | 10 | 12.3% |
| Business | 12 | 14.8% |
| Education | 21 | 25.9% |
| Literature & Languages | 0 | 0.0% |
| Liberal Arts & History | 13 | 16.1% |
| Visual & Performing Arts | 0 | 0.0% |
| Communications | 0 | 0.0% |
| Arts & Humanities | 4 | 4.9% |
| Total | 81 | 100.0% |
Transportation & Commute in Galatia
Vehicle Availability by Sex in Galatia
The most prevalent vehicle ownership categories in Galatia are males with 4 vehicles (74, accounting for 37.2%) and females with 4 vehicles (24, making up 54.0%).
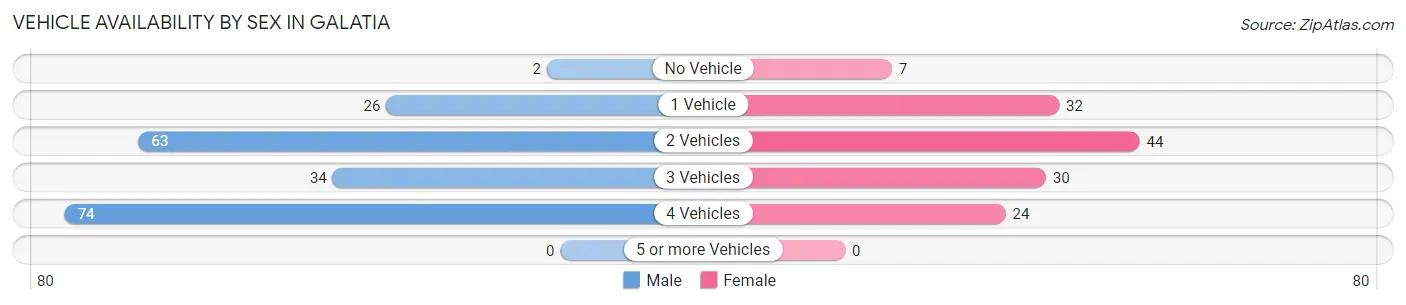
| Vehicles Available | Male | Female |
| No Vehicle | 2 (1.0%) | 7 (5.1%) |
| 1 Vehicle | 26 (13.1%) | 32 (23.4%) |
| 2 Vehicles | 63 (31.7%) | 44 (32.1%) |
| 3 Vehicles | 34 (17.1%) | 30 (21.9%) |
| 4 Vehicles | 74 (37.2%) | 24 (17.5%) |
| 5 or more Vehicles | 0 (0.0%) | 0 (0.0%) |
| Total | 199 (100.0%) | 137 (100.0%) |
Commute Time in Galatia
The most frequently occuring commute durations in Galatia are 20 to 24 minutes (103 commuters, 31.9%), 15 to 19 minutes (45 commuters, 13.9%), and 90 or more minutes (40 commuters, 12.4%).
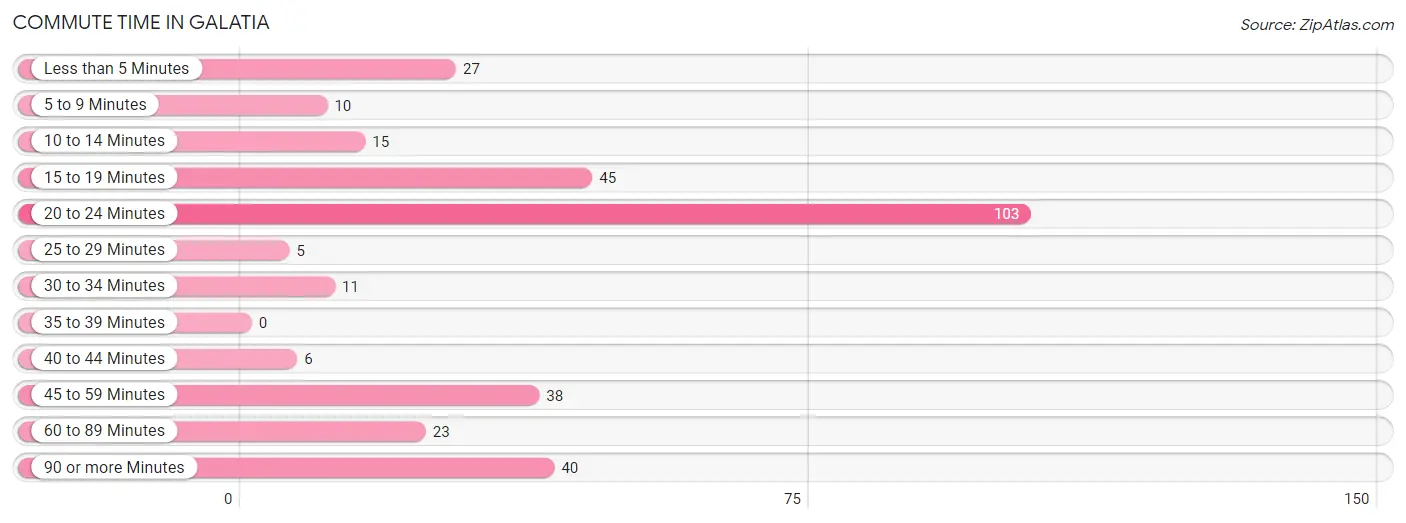
| Commute Time | # Commuters | % Commuters |
| Less than 5 Minutes | 27 | 8.4% |
| 5 to 9 Minutes | 10 | 3.1% |
| 10 to 14 Minutes | 15 | 4.6% |
| 15 to 19 Minutes | 45 | 13.9% |
| 20 to 24 Minutes | 103 | 31.9% |
| 25 to 29 Minutes | 5 | 1.5% |
| 30 to 34 Minutes | 11 | 3.4% |
| 35 to 39 Minutes | 0 | 0.0% |
| 40 to 44 Minutes | 6 | 1.9% |
| 45 to 59 Minutes | 38 | 11.8% |
| 60 to 89 Minutes | 23 | 7.1% |
| 90 or more Minutes | 40 | 12.4% |
Commute Time by Sex in Galatia
The most common commute times in Galatia are 20 to 24 minutes (56 commuters, 30.1%) for males and 20 to 24 minutes (47 commuters, 34.3%) for females.
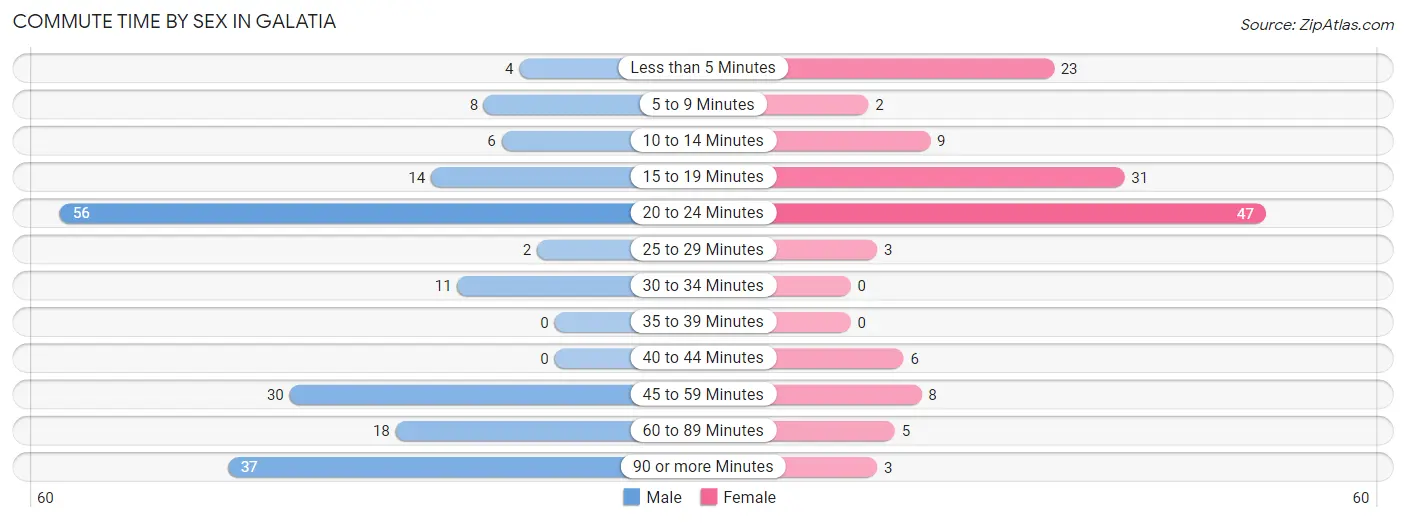
| Commute Time | Male | Female |
| Less than 5 Minutes | 4 (2.1%) | 23 (16.8%) |
| 5 to 9 Minutes | 8 (4.3%) | 2 (1.5%) |
| 10 to 14 Minutes | 6 (3.2%) | 9 (6.6%) |
| 15 to 19 Minutes | 14 (7.5%) | 31 (22.6%) |
| 20 to 24 Minutes | 56 (30.1%) | 47 (34.3%) |
| 25 to 29 Minutes | 2 (1.1%) | 3 (2.2%) |
| 30 to 34 Minutes | 11 (5.9%) | 0 (0.0%) |
| 35 to 39 Minutes | 0 (0.0%) | 0 (0.0%) |
| 40 to 44 Minutes | 0 (0.0%) | 6 (4.4%) |
| 45 to 59 Minutes | 30 (16.1%) | 8 (5.8%) |
| 60 to 89 Minutes | 18 (9.7%) | 5 (3.6%) |
| 90 or more Minutes | 37 (19.9%) | 3 (2.2%) |
Time of Departure to Work by Sex in Galatia
The most frequent times of departure to work in Galatia are 6:30 AM to 6:59 AM (49, 26.3%) for males and 7:30 AM to 7:59 AM (52, 38.0%) for females.
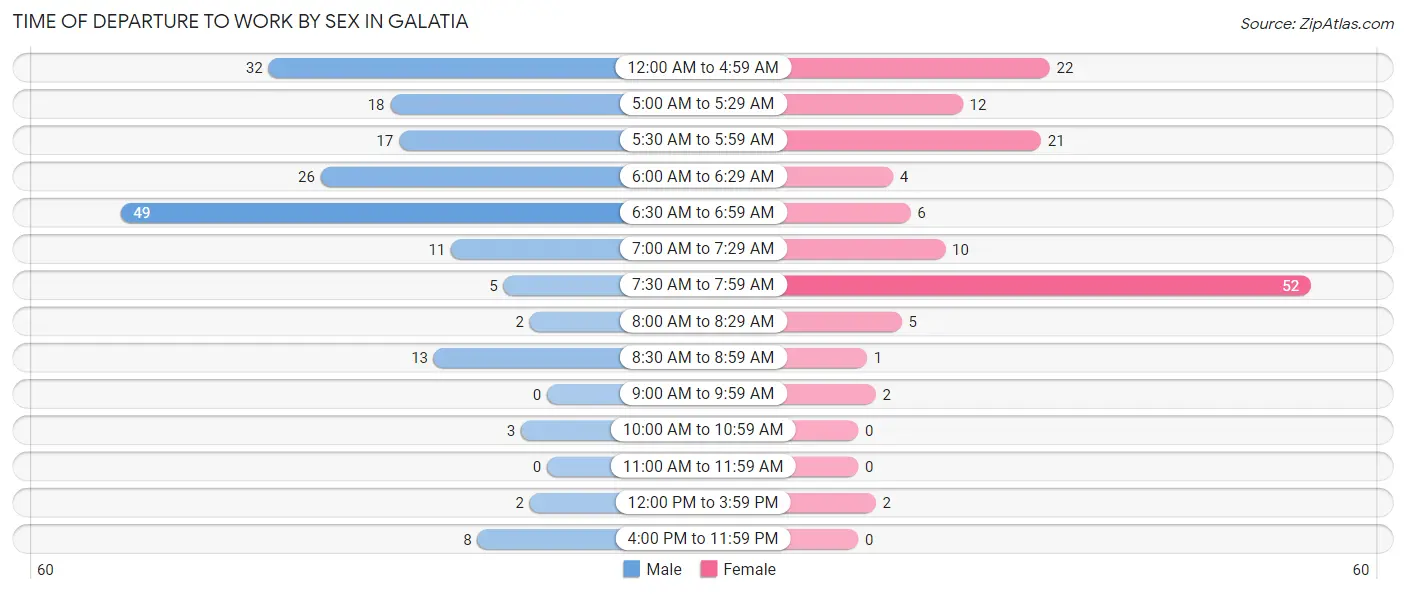
| Time of Departure | Male | Female |
| 12:00 AM to 4:59 AM | 32 (17.2%) | 22 (16.1%) |
| 5:00 AM to 5:29 AM | 18 (9.7%) | 12 (8.8%) |
| 5:30 AM to 5:59 AM | 17 (9.1%) | 21 (15.3%) |
| 6:00 AM to 6:29 AM | 26 (14.0%) | 4 (2.9%) |
| 6:30 AM to 6:59 AM | 49 (26.3%) | 6 (4.4%) |
| 7:00 AM to 7:29 AM | 11 (5.9%) | 10 (7.3%) |
| 7:30 AM to 7:59 AM | 5 (2.7%) | 52 (38.0%) |
| 8:00 AM to 8:29 AM | 2 (1.1%) | 5 (3.6%) |
| 8:30 AM to 8:59 AM | 13 (7.0%) | 1 (0.7%) |
| 9:00 AM to 9:59 AM | 0 (0.0%) | 2 (1.5%) |
| 10:00 AM to 10:59 AM | 3 (1.6%) | 0 (0.0%) |
| 11:00 AM to 11:59 AM | 0 (0.0%) | 0 (0.0%) |
| 12:00 PM to 3:59 PM | 2 (1.1%) | 2 (1.5%) |
| 4:00 PM to 11:59 PM | 8 (4.3%) | 0 (0.0%) |
| Total | 186 (100.0%) | 137 (100.0%) |
Housing Occupancy in Galatia
Occupancy by Ownership in Galatia
Of the total 369 dwellings in Galatia, owner-occupied units account for 303 (82.1%), while renter-occupied units make up 66 (17.9%).
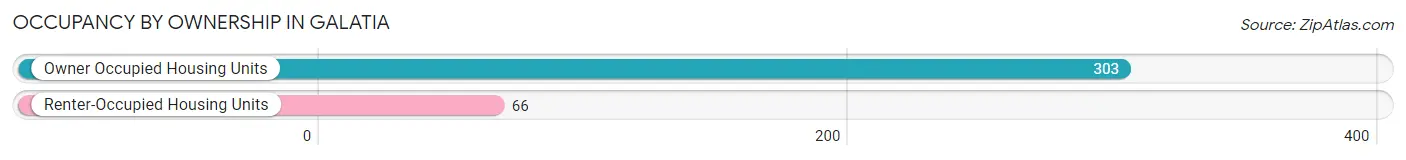
| Occupancy | # Housing Units | % Housing Units |
| Owner Occupied Housing Units | 303 | 82.1% |
| Renter-Occupied Housing Units | 66 | 17.9% |
| Total Occupied Housing Units | 369 | 100.0% |
Occupancy by Household Size in Galatia
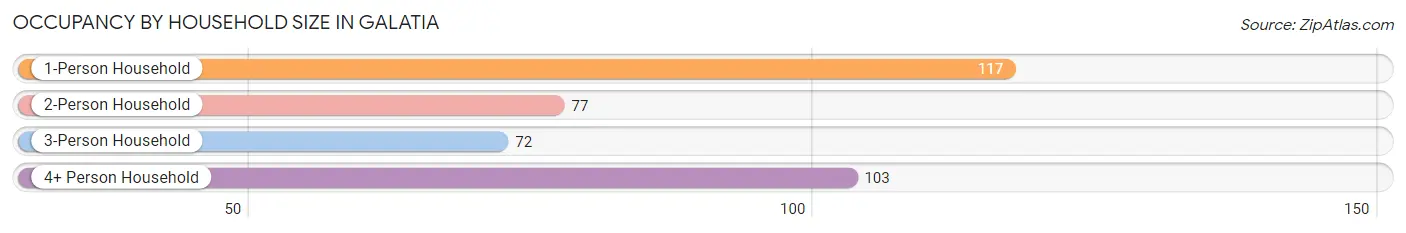
| Household Size | # Housing Units | % Housing Units |
| 1-Person Household | 117 | 31.7% |
| 2-Person Household | 77 | 20.9% |
| 3-Person Household | 72 | 19.5% |
| 4+ Person Household | 103 | 27.9% |
| Total Housing Units | 369 | 100.0% |
Occupancy by Ownership by Household Size in Galatia
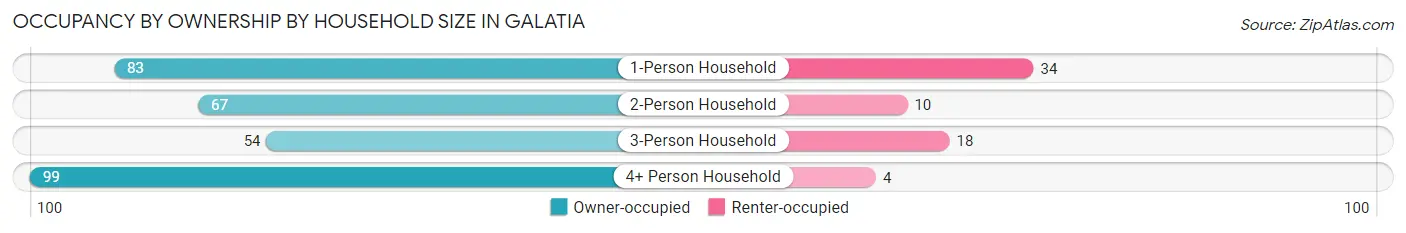
| Household Size | Owner-occupied | Renter-occupied |
| 1-Person Household | 83 (70.9%) | 34 (29.1%) |
| 2-Person Household | 67 (87.0%) | 10 (13.0%) |
| 3-Person Household | 54 (75.0%) | 18 (25.0%) |
| 4+ Person Household | 99 (96.1%) | 4 (3.9%) |
| Total Housing Units | 303 (82.1%) | 66 (17.9%) |
Occupancy by Educational Attainment in Galatia
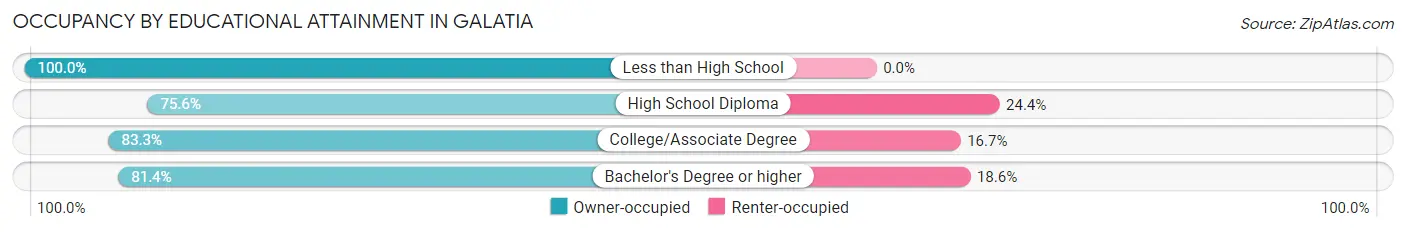
| Household Size | Owner-occupied | Renter-occupied |
| Less than High School | 33 (100.0%) | 0 (0.0%) |
| High School Diploma | 90 (75.6%) | 29 (24.4%) |
| College/Associate Degree | 145 (83.3%) | 29 (16.7%) |
| Bachelor's Degree or higher | 35 (81.4%) | 8 (18.6%) |
Occupancy by Age of Householder in Galatia
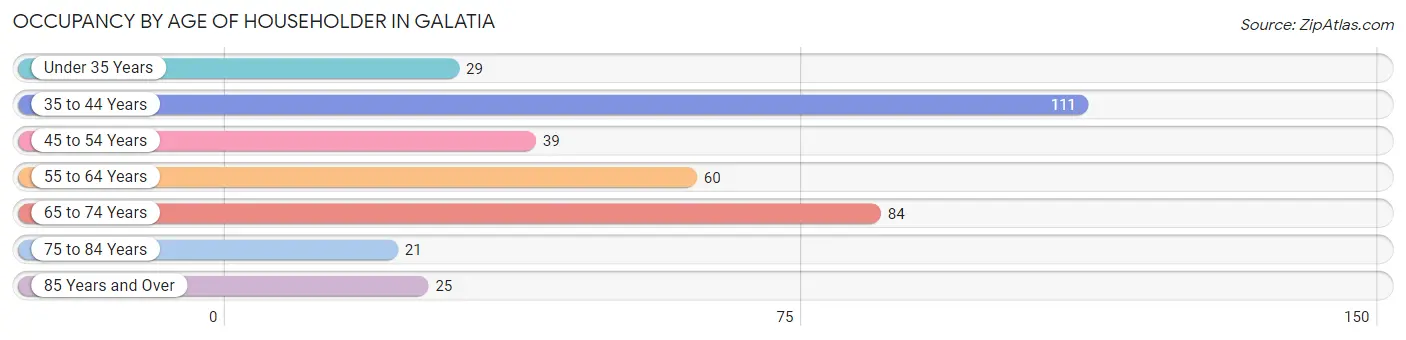
| Age Bracket | # Households | % Households |
| Under 35 Years | 29 | 7.9% |
| 35 to 44 Years | 111 | 30.1% |
| 45 to 54 Years | 39 | 10.6% |
| 55 to 64 Years | 60 | 16.3% |
| 65 to 74 Years | 84 | 22.8% |
| 75 to 84 Years | 21 | 5.7% |
| 85 Years and Over | 25 | 6.8% |
| Total | 369 | 100.0% |
Housing Finances in Galatia
Median Income by Occupancy in Galatia
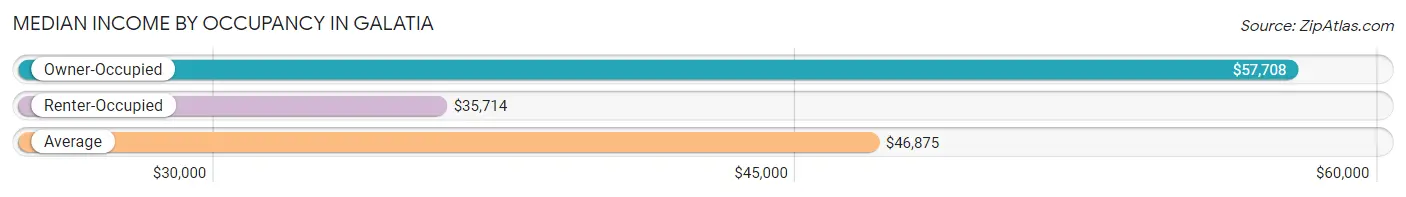
| Occupancy Type | # Households | Median Income |
| Owner-Occupied | 303 (82.1%) | $57,708 |
| Renter-Occupied | 66 (17.9%) | $35,714 |
| Average | 369 (100.0%) | $46,875 |
Occupancy by Householder Income Bracket in Galatia
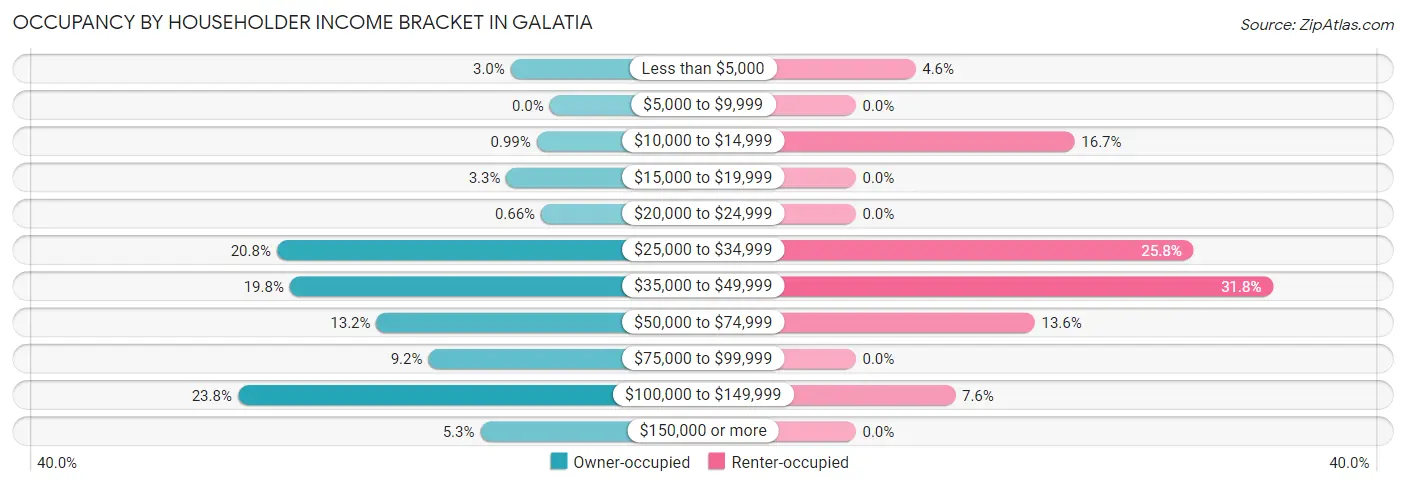
| Income Bracket | Owner-occupied | Renter-occupied |
| Less than $5,000 | 9 (3.0%) | 3 (4.5%) |
| $5,000 to $9,999 | 0 (0.0%) | 0 (0.0%) |
| $10,000 to $14,999 | 3 (1.0%) | 11 (16.7%) |
| $15,000 to $19,999 | 10 (3.3%) | 0 (0.0%) |
| $20,000 to $24,999 | 2 (0.7%) | 0 (0.0%) |
| $25,000 to $34,999 | 63 (20.8%) | 17 (25.8%) |
| $35,000 to $49,999 | 60 (19.8%) | 21 (31.8%) |
| $50,000 to $74,999 | 40 (13.2%) | 9 (13.6%) |
| $75,000 to $99,999 | 28 (9.2%) | 0 (0.0%) |
| $100,000 to $149,999 | 72 (23.8%) | 5 (7.6%) |
| $150,000 or more | 16 (5.3%) | 0 (0.0%) |
| Total | 303 (100.0%) | 66 (100.0%) |
Monthly Housing Cost Tiers in Galatia
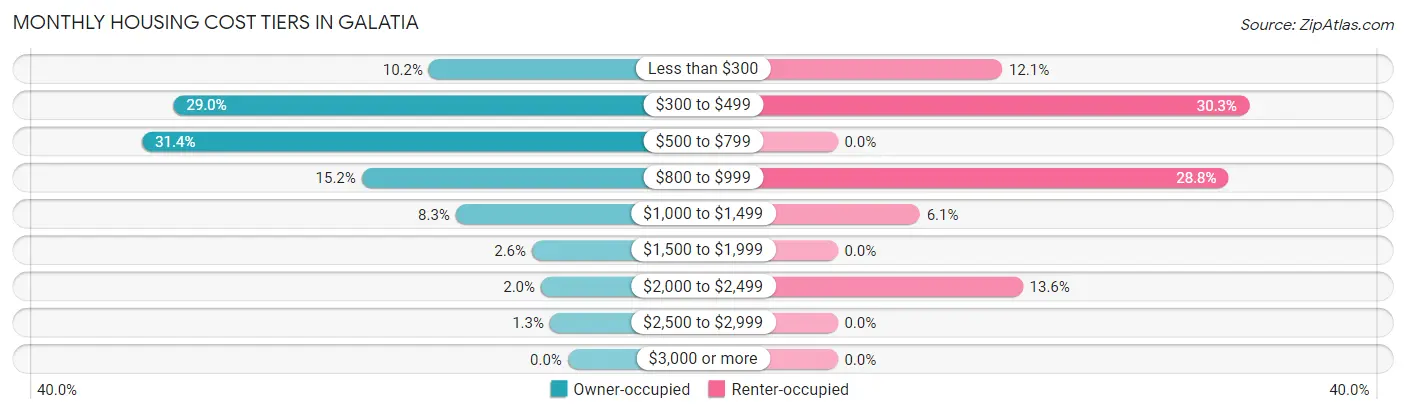
| Monthly Cost | Owner-occupied | Renter-occupied |
| Less than $300 | 31 (10.2%) | 8 (12.1%) |
| $300 to $499 | 88 (29.0%) | 20 (30.3%) |
| $500 to $799 | 95 (31.4%) | 0 (0.0%) |
| $800 to $999 | 46 (15.2%) | 19 (28.8%) |
| $1,000 to $1,499 | 25 (8.3%) | 4 (6.1%) |
| $1,500 to $1,999 | 8 (2.6%) | 0 (0.0%) |
| $2,000 to $2,499 | 6 (2.0%) | 9 (13.6%) |
| $2,500 to $2,999 | 4 (1.3%) | 0 (0.0%) |
| $3,000 or more | 0 (0.0%) | 0 (0.0%) |
| Total | 303 (100.0%) | 66 (100.0%) |
Physical Housing Characteristics in Galatia
Housing Structures in Galatia
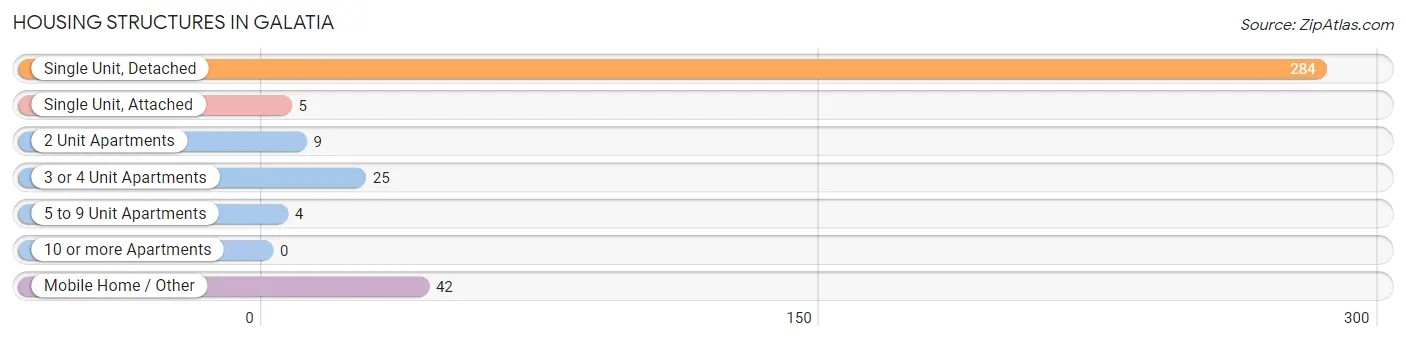
| Structure Type | # Housing Units | % Housing Units |
| Single Unit, Detached | 284 | 77.0% |
| Single Unit, Attached | 5 | 1.4% |
| 2 Unit Apartments | 9 | 2.4% |
| 3 or 4 Unit Apartments | 25 | 6.8% |
| 5 to 9 Unit Apartments | 4 | 1.1% |
| 10 or more Apartments | 0 | 0.0% |
| Mobile Home / Other | 42 | 11.4% |
| Total | 369 | 100.0% |
Housing Structures by Occupancy in Galatia
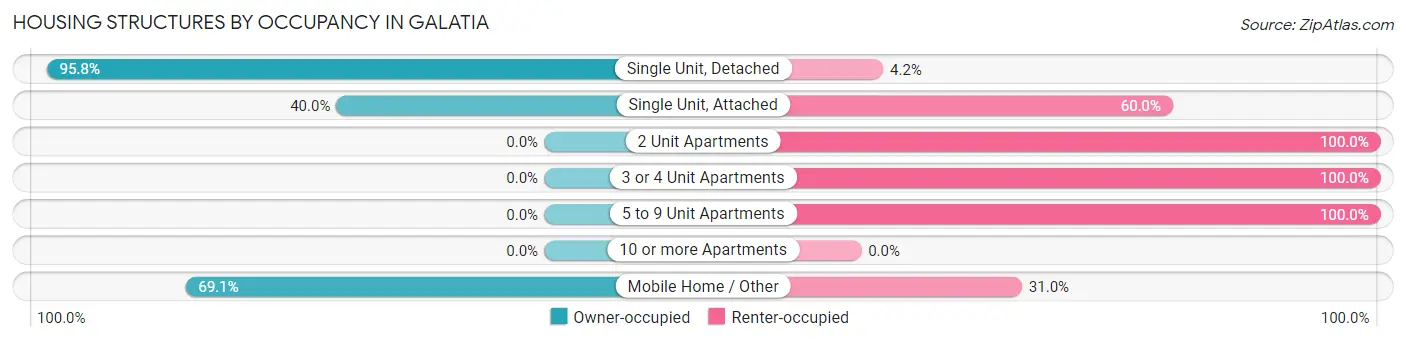
| Structure Type | Owner-occupied | Renter-occupied |
| Single Unit, Detached | 272 (95.8%) | 12 (4.2%) |
| Single Unit, Attached | 2 (40.0%) | 3 (60.0%) |
| 2 Unit Apartments | 0 (0.0%) | 9 (100.0%) |
| 3 or 4 Unit Apartments | 0 (0.0%) | 25 (100.0%) |
| 5 to 9 Unit Apartments | 0 (0.0%) | 4 (100.0%) |
| 10 or more Apartments | 0 (0.0%) | 0 (0.0%) |
| Mobile Home / Other | 29 (69.1%) | 13 (30.9%) |
| Total | 303 (82.1%) | 66 (17.9%) |
Housing Structures by Number of Rooms in Galatia
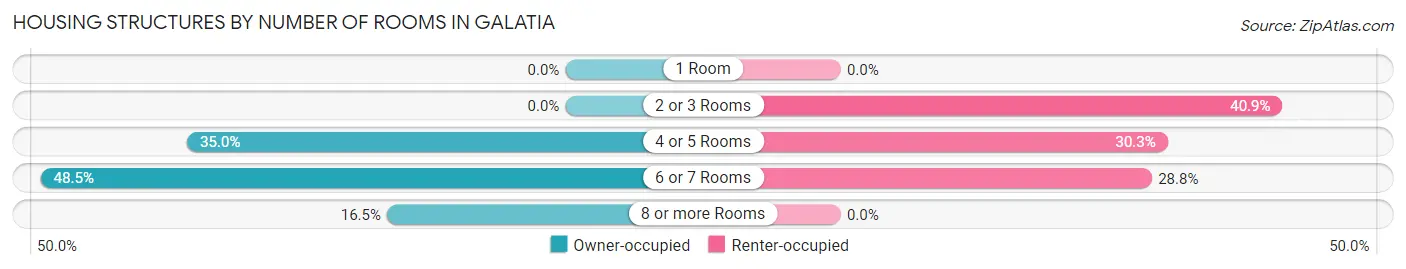
| Number of Rooms | Owner-occupied | Renter-occupied |
| 1 Room | 0 (0.0%) | 0 (0.0%) |
| 2 or 3 Rooms | 0 (0.0%) | 27 (40.9%) |
| 4 or 5 Rooms | 106 (35.0%) | 20 (30.3%) |
| 6 or 7 Rooms | 147 (48.5%) | 19 (28.8%) |
| 8 or more Rooms | 50 (16.5%) | 0 (0.0%) |
| Total | 303 (100.0%) | 66 (100.0%) |
Housing Structure by Heating Type in Galatia
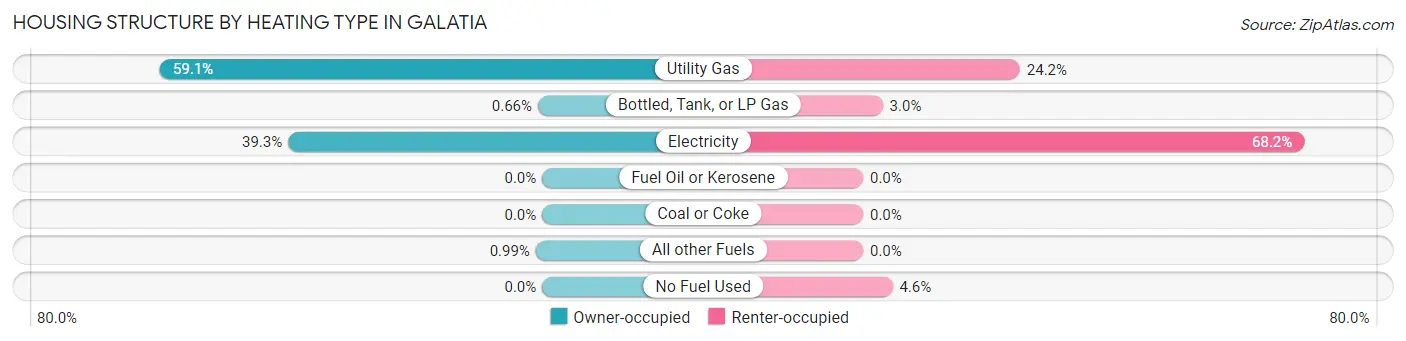
| Heating Type | Owner-occupied | Renter-occupied |
| Utility Gas | 179 (59.1%) | 16 (24.2%) |
| Bottled, Tank, or LP Gas | 2 (0.7%) | 2 (3.0%) |
| Electricity | 119 (39.3%) | 45 (68.2%) |
| Fuel Oil or Kerosene | 0 (0.0%) | 0 (0.0%) |
| Coal or Coke | 0 (0.0%) | 0 (0.0%) |
| All other Fuels | 3 (1.0%) | 0 (0.0%) |
| No Fuel Used | 0 (0.0%) | 3 (4.5%) |
| Total | 303 (100.0%) | 66 (100.0%) |
Household Vehicle Usage in Galatia
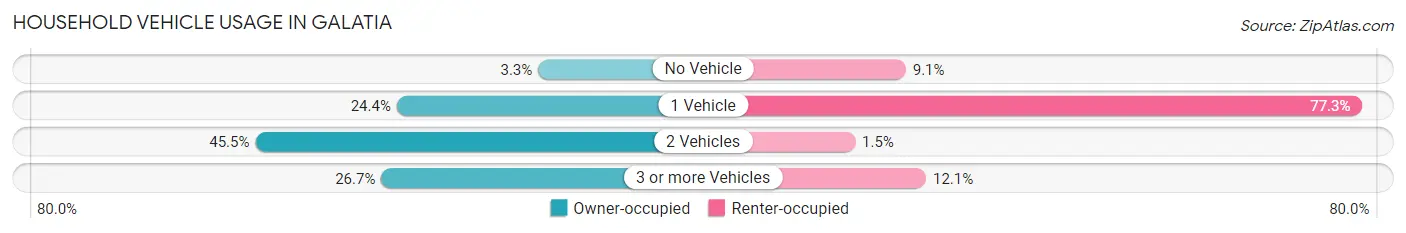
| Vehicles per Household | Owner-occupied | Renter-occupied |
| No Vehicle | 10 (3.3%) | 6 (9.1%) |
| 1 Vehicle | 74 (24.4%) | 51 (77.3%) |
| 2 Vehicles | 138 (45.5%) | 1 (1.5%) |
| 3 or more Vehicles | 81 (26.7%) | 8 (12.1%) |
| Total | 303 (100.0%) | 66 (100.0%) |
Real Estate & Mortgages in Galatia
Real Estate and Mortgage Overview in Galatia
| Characteristic | Without Mortgage | With Mortgage |
| Housing Units | 158 | 145 |
| Median Property Value | $65,000 | $69,100 |
| Median Household Income | $39,000 | $16 |
| Monthly Housing Costs | $442 | $0 |
| Real Estate Taxes | $844 | $0 |
Property Value by Mortgage Status in Galatia
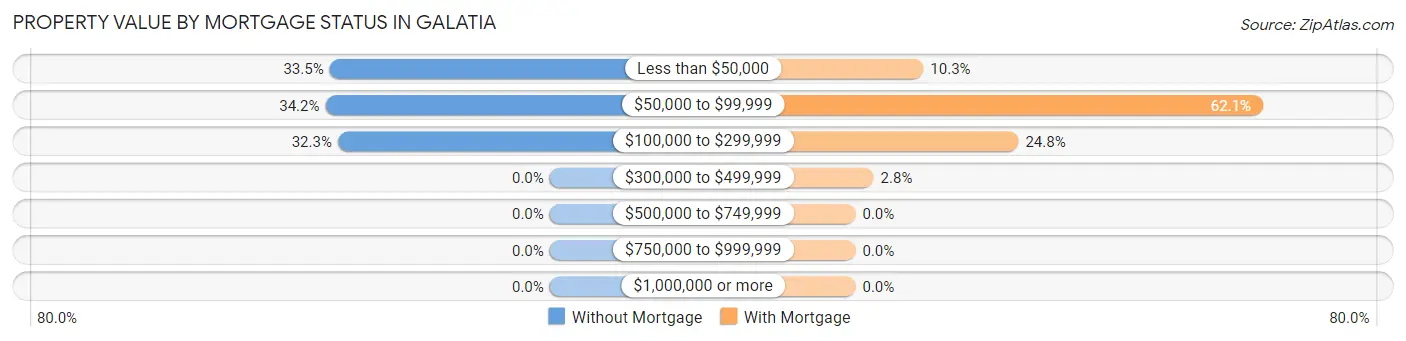
| Property Value | Without Mortgage | With Mortgage |
| Less than $50,000 | 53 (33.5%) | 15 (10.3%) |
| $50,000 to $99,999 | 54 (34.2%) | 90 (62.1%) |
| $100,000 to $299,999 | 51 (32.3%) | 36 (24.8%) |
| $300,000 to $499,999 | 0 (0.0%) | 4 (2.8%) |
| $500,000 to $749,999 | 0 (0.0%) | 0 (0.0%) |
| $750,000 to $999,999 | 0 (0.0%) | 0 (0.0%) |
| $1,000,000 or more | 0 (0.0%) | 0 (0.0%) |
| Total | 158 (100.0%) | 145 (100.0%) |
Household Income by Mortgage Status in Galatia
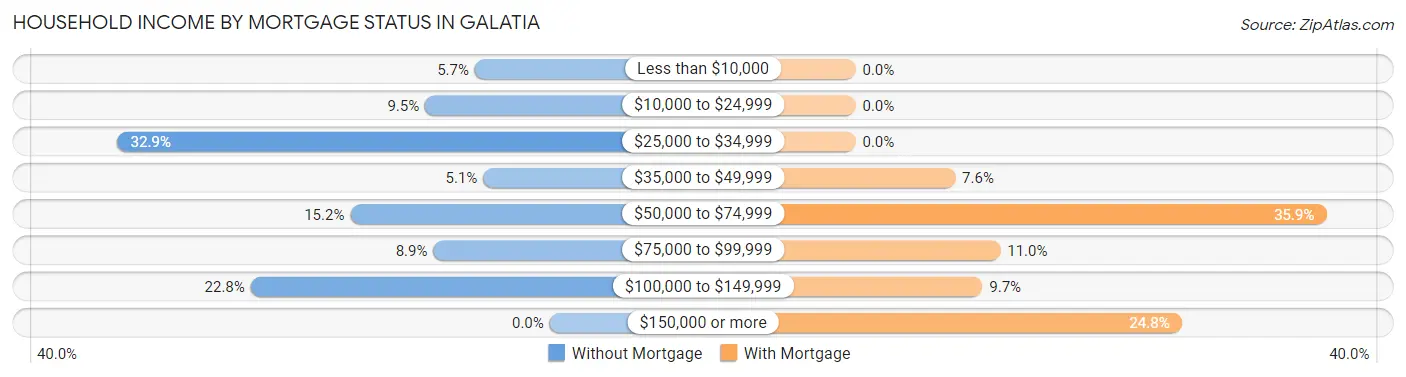
| Household Income | Without Mortgage | With Mortgage |
| Less than $10,000 | 9 (5.7%) | 0 (0.0%) |
| $10,000 to $24,999 | 15 (9.5%) | 0 (0.0%) |
| $25,000 to $34,999 | 52 (32.9%) | 0 (0.0%) |
| $35,000 to $49,999 | 8 (5.1%) | 11 (7.6%) |
| $50,000 to $74,999 | 24 (15.2%) | 52 (35.9%) |
| $75,000 to $99,999 | 14 (8.9%) | 16 (11.0%) |
| $100,000 to $149,999 | 36 (22.8%) | 14 (9.7%) |
| $150,000 or more | 0 (0.0%) | 36 (24.8%) |
| Total | 158 (100.0%) | 145 (100.0%) |
Property Value to Household Income Ratio in Galatia
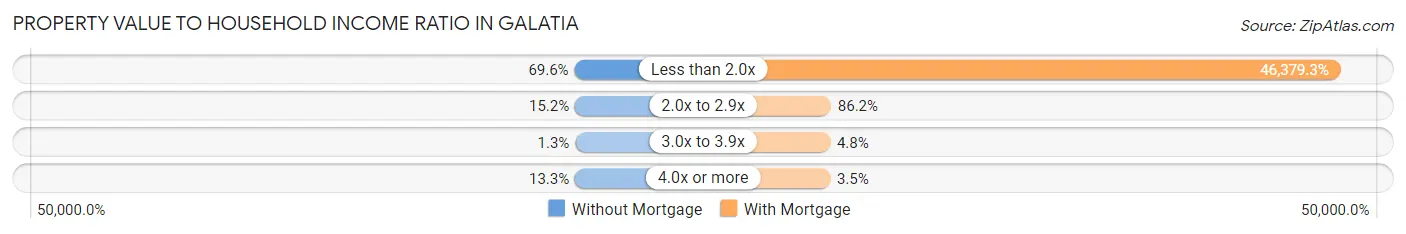
| Value-to-Income Ratio | Without Mortgage | With Mortgage |
| Less than 2.0x | 110 (69.6%) | 67,250 (46,379.3%) |
| 2.0x to 2.9x | 24 (15.2%) | 125 (86.2%) |
| 3.0x to 3.9x | 2 (1.3%) | 7 (4.8%) |
| 4.0x or more | 21 (13.3%) | 5 (3.5%) |
| Total | 158 (100.0%) | 145 (100.0%) |
Real Estate Taxes by Mortgage Status in Galatia
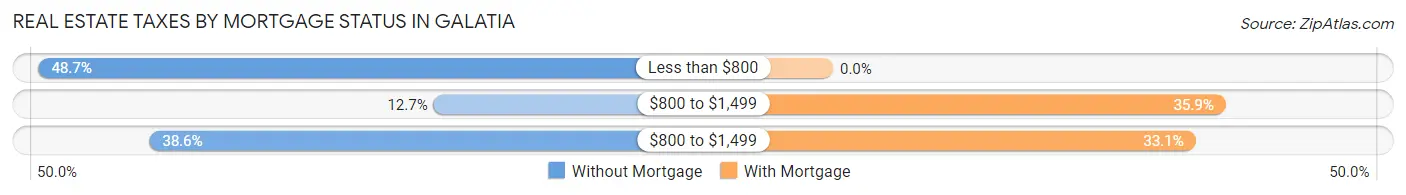
| Property Taxes | Without Mortgage | With Mortgage |
| Less than $800 | 77 (48.7%) | 0 (0.0%) |
| $800 to $1,499 | 20 (12.7%) | 52 (35.9%) |
| $800 to $1,499 | 61 (38.6%) | 48 (33.1%) |
| Total | 158 (100.0%) | 145 (100.0%) |
Health & Disability in Galatia
Health Insurance Coverage by Age in Galatia
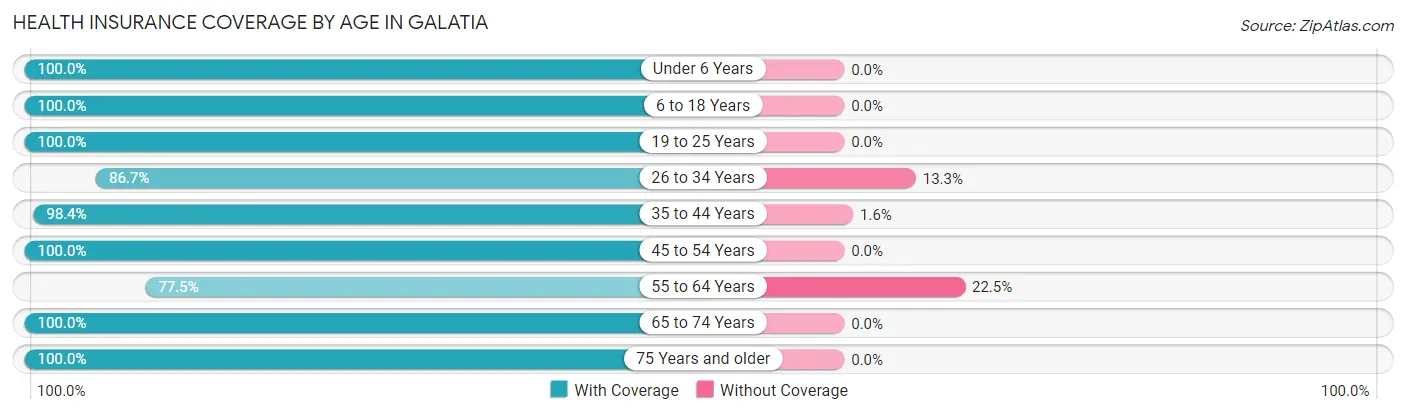
| Age Bracket | With Coverage | Without Coverage |
| Under 6 Years | 34 (100.0%) | 0 (0.0%) |
| 6 to 18 Years | 178 (100.0%) | 0 (0.0%) |
| 19 to 25 Years | 118 (100.0%) | 0 (0.0%) |
| 26 to 34 Years | 26 (86.7%) | 4 (13.3%) |
| 35 to 44 Years | 240 (98.4%) | 4 (1.6%) |
| 45 to 54 Years | 62 (100.0%) | 0 (0.0%) |
| 55 to 64 Years | 86 (77.5%) | 25 (22.5%) |
| 65 to 74 Years | 131 (100.0%) | 0 (0.0%) |
| 75 Years and older | 56 (100.0%) | 0 (0.0%) |
| Total | 931 (96.6%) | 33 (3.4%) |
Health Insurance Coverage by Citizenship Status in Galatia
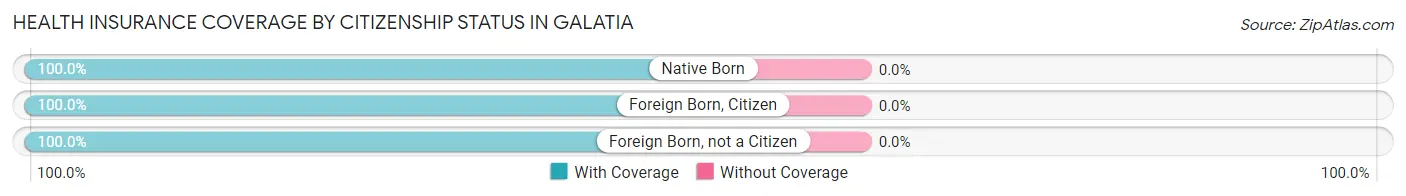
| Citizenship Status | With Coverage | Without Coverage |
| Native Born | 34 (100.0%) | 0 (0.0%) |
| Foreign Born, Citizen | 178 (100.0%) | 0 (0.0%) |
| Foreign Born, not a Citizen | 118 (100.0%) | 0 (0.0%) |
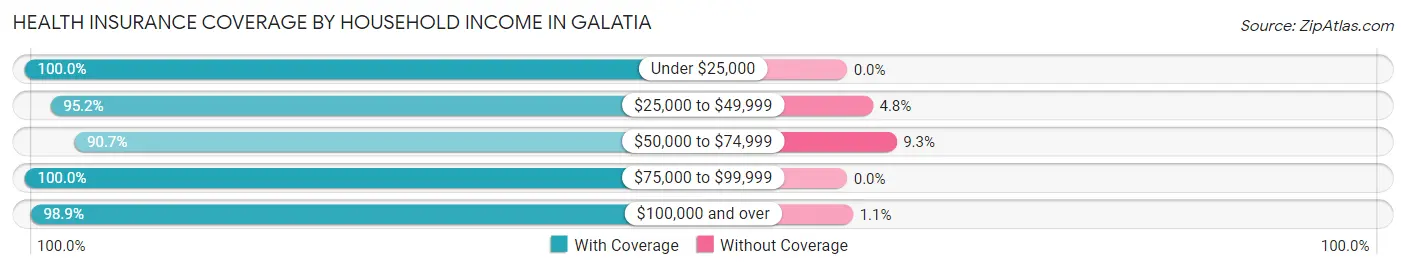
Health Insurance Coverage by Household Income in Galatia
| Household Income | With Coverage | Without Coverage |
| Under $25,000 | 41 (100.0%) | 0 (0.0%) |
| $25,000 to $49,999 | 375 (95.2%) | 19 (4.8%) |
| $50,000 to $74,999 | 98 (90.7%) | 10 (9.3%) |
| $75,000 to $99,999 | 60 (100.0%) | 0 (0.0%) |
| $100,000 and over | 357 (98.9%) | 4 (1.1%) |
Public vs Private Health Insurance Coverage by Age in Galatia
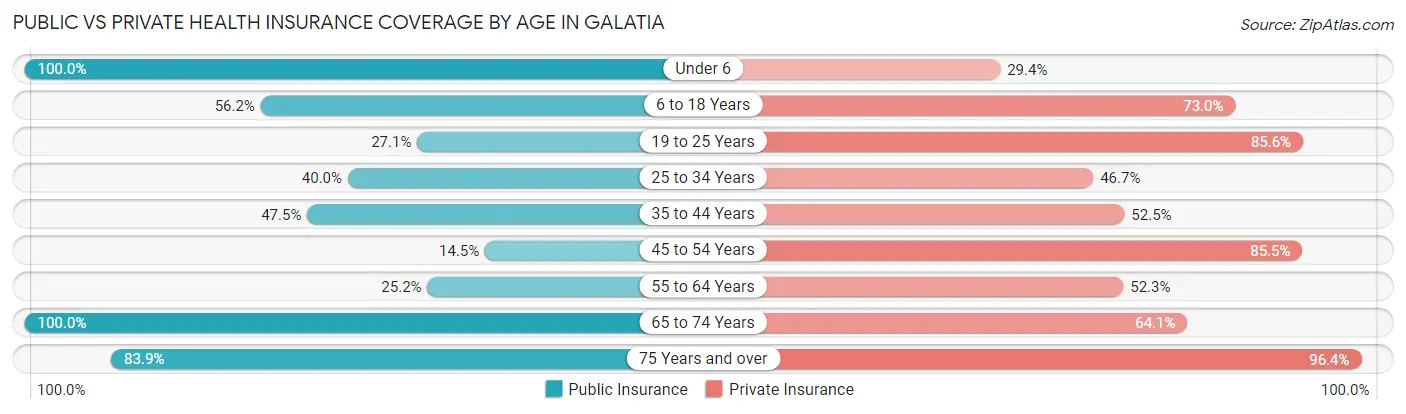
| Age Bracket | Public Insurance | Private Insurance |
| Under 6 | 34 (100.0%) | 10 (29.4%) |
| 6 to 18 Years | 100 (56.2%) | 130 (73.0%) |
| 19 to 25 Years | 32 (27.1%) | 101 (85.6%) |
| 25 to 34 Years | 12 (40.0%) | 14 (46.7%) |
| 35 to 44 Years | 116 (47.5%) | 128 (52.5%) |
| 45 to 54 Years | 9 (14.5%) | 53 (85.5%) |
| 55 to 64 Years | 28 (25.2%) | 58 (52.2%) |
| 65 to 74 Years | 131 (100.0%) | 84 (64.1%) |
| 75 Years and over | 47 (83.9%) | 54 (96.4%) |
| Total | 509 (52.8%) | 632 (65.6%) |
Disability Status by Sex by Age in Galatia
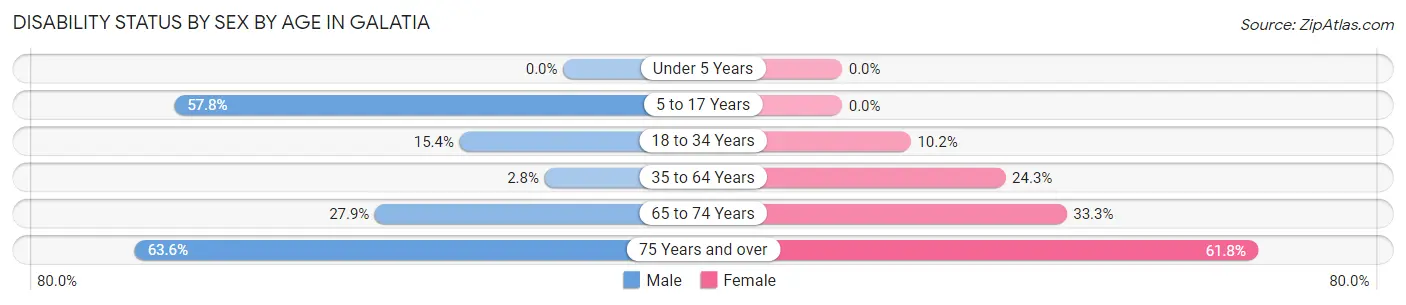
| Age Bracket | Male | Female |
| Under 5 Years | 0 (0.0%) | 0 (0.0%) |
| 5 to 17 Years | 52 (57.8%) | 0 (0.0%) |
| 18 to 34 Years | 8 (15.4%) | 10 (10.2%) |
| 35 to 64 Years | 5 (2.8%) | 57 (24.3%) |
| 65 to 74 Years | 19 (27.9%) | 21 (33.3%) |
| 75 Years and over | 14 (63.6%) | 21 (61.8%) |
Disability Class by Sex by Age in Galatia
Disability Class: Hearing Difficulty
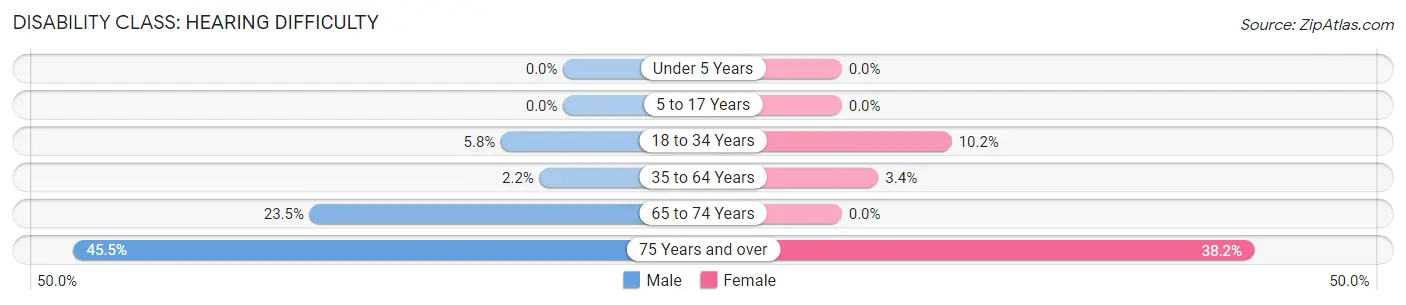
| Age Bracket | Male | Female |
| Under 5 Years | 0 (0.0%) | 0 (0.0%) |
| 5 to 17 Years | 0 (0.0%) | 0 (0.0%) |
| 18 to 34 Years | 3 (5.8%) | 10 (10.2%) |
| 35 to 64 Years | 4 (2.2%) | 8 (3.4%) |
| 65 to 74 Years | 16 (23.5%) | 0 (0.0%) |
| 75 Years and over | 10 (45.5%) | 13 (38.2%) |
Disability Class: Vision Difficulty
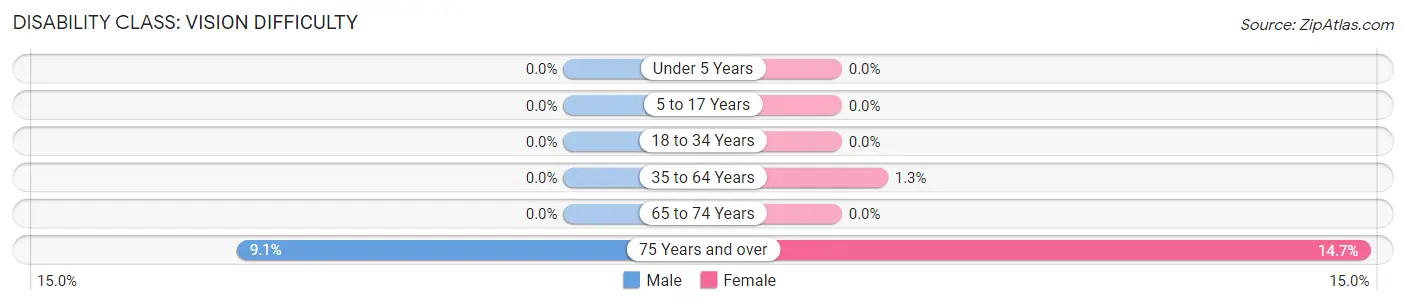
| Age Bracket | Male | Female |
| Under 5 Years | 0 (0.0%) | 0 (0.0%) |
| 5 to 17 Years | 0 (0.0%) | 0 (0.0%) |
| 18 to 34 Years | 0 (0.0%) | 0 (0.0%) |
| 35 to 64 Years | 0 (0.0%) | 3 (1.3%) |
| 65 to 74 Years | 0 (0.0%) | 0 (0.0%) |
| 75 Years and over | 2 (9.1%) | 5 (14.7%) |
Disability Class: Cognitive Difficulty
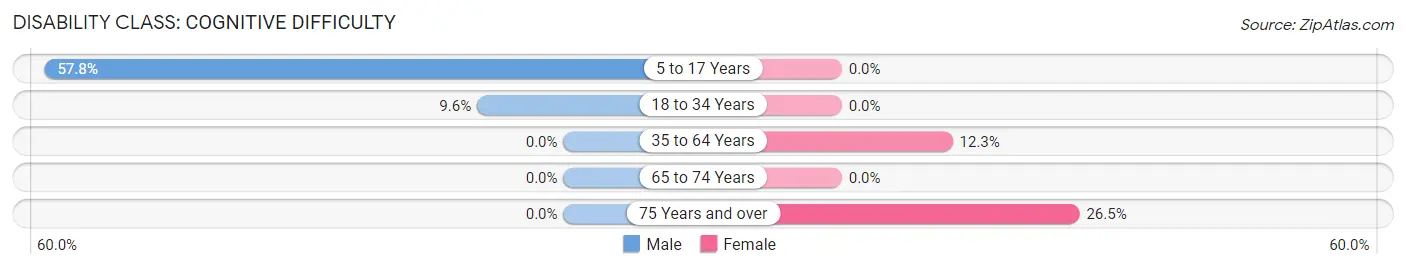
| Age Bracket | Male | Female |
| 5 to 17 Years | 52 (57.8%) | 0 (0.0%) |
| 18 to 34 Years | 5 (9.6%) | 0 (0.0%) |
| 35 to 64 Years | 0 (0.0%) | 29 (12.3%) |
| 65 to 74 Years | 0 (0.0%) | 0 (0.0%) |
| 75 Years and over | 0 (0.0%) | 9 (26.5%) |
Disability Class: Ambulatory Difficulty
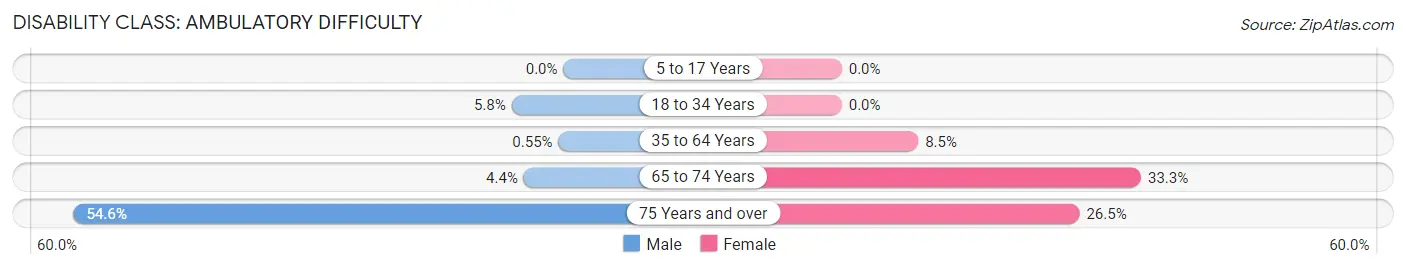
| Age Bracket | Male | Female |
| 5 to 17 Years | 0 (0.0%) | 0 (0.0%) |
| 18 to 34 Years | 3 (5.8%) | 0 (0.0%) |
| 35 to 64 Years | 1 (0.5%) | 20 (8.5%) |
| 65 to 74 Years | 3 (4.4%) | 21 (33.3%) |
| 75 Years and over | 12 (54.5%) | 9 (26.5%) |
Disability Class: Self-Care Difficulty
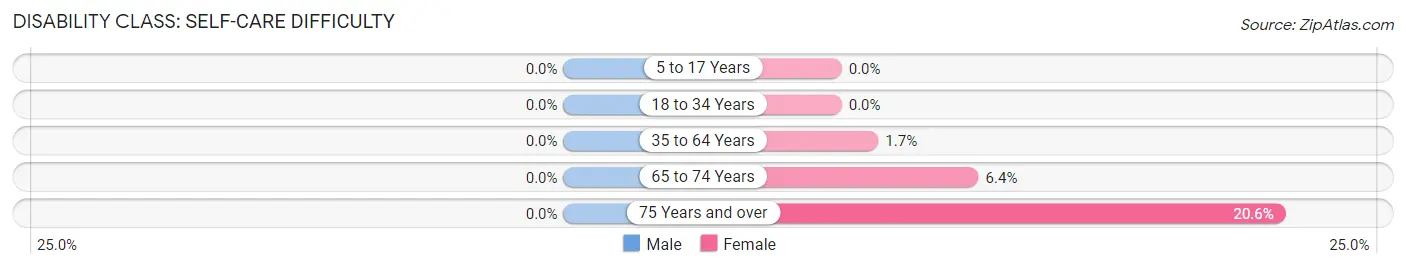
| Age Bracket | Male | Female |
| 5 to 17 Years | 0 (0.0%) | 0 (0.0%) |
| 18 to 34 Years | 0 (0.0%) | 0 (0.0%) |
| 35 to 64 Years | 0 (0.0%) | 4 (1.7%) |
| 65 to 74 Years | 0 (0.0%) | 4 (6.4%) |
| 75 Years and over | 0 (0.0%) | 7 (20.6%) |
Technology Access in Galatia
Computing Device Access in Galatia
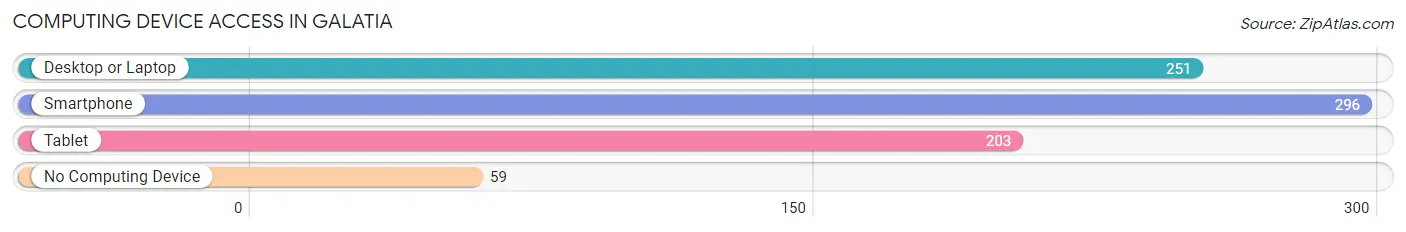
| Device Type | # Households | % Households |
| Desktop or Laptop | 251 | 68.0% |
| Smartphone | 296 | 80.2% |
| Tablet | 203 | 55.0% |
| No Computing Device | 59 | 16.0% |
| Total | 369 | 100.0% |
Internet Access in Galatia
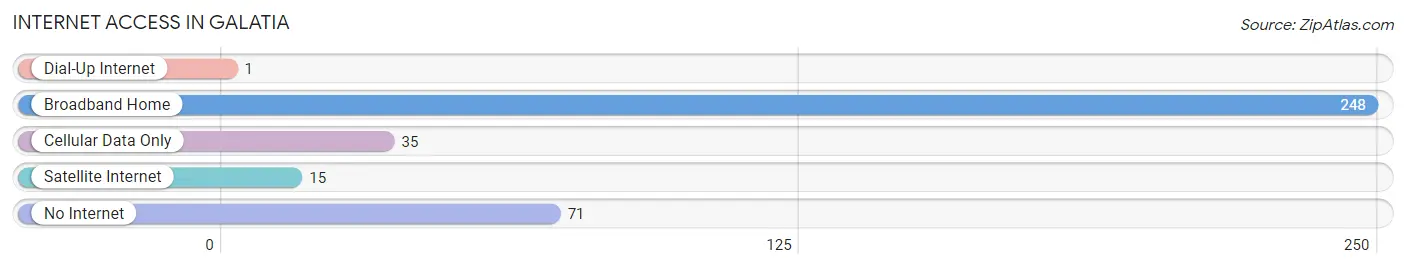
| Internet Type | # Households | % Households |
| Dial-Up Internet | 1 | 0.3% |
| Broadband Home | 248 | 67.2% |
| Cellular Data Only | 35 | 9.5% |
| Satellite Internet | 15 | 4.1% |
| No Internet | 71 | 19.2% |
| Total | 369 | 100.0% |
Galatia Summary
Galatia is a small village located in Saline County, Illinois, United States. It is situated in the southeastern corner of the state, about 25 miles south of Harrisburg and about 30 miles east of Carbondale. The population of Galatia was 1,092 at the 2010 census.
History
Galatia was founded in 1858 by a group of settlers from Galatia, Kentucky. The town was named after the ancient region of Galatia, which was located in what is now modern-day Turkey. The settlers were mostly of German descent and were attracted to the area by the abundance of coal and timber.
The first post office was established in 1859 and the first school was built in 1864. The town was incorporated in 1872 and the first mayor was elected in 1873.
The town grew steadily throughout the late 19th and early 20th centuries. The population peaked at 1,717 in 1920. The Great Depression and World War II caused a decline in population, but the town has since stabilized.
Geography
Galatia is located at 37°45'N 88°45'W (37.75, -88.75). It is situated in the southeastern corner of the state, about 25 miles south of Harrisburg and about 30 miles east of Carbondale.
The town is located in the Shawnee National Forest and is surrounded by rolling hills and forests. The Saline River runs through the town and is a popular spot for fishing and canoeing.
Economy
The economy of Galatia is largely based on agriculture and tourism. The town is home to several farms, which produce corn, soybeans, and hay. The town is also home to several small businesses, including a grocery store, a hardware store, and a restaurant.
Tourism is an important part of the local economy. The town is home to several attractions, including the Saline River, the Shawnee National Forest, and the Galatia State Fish and Wildlife Area. The town also hosts several festivals throughout the year, including the Galatia Fall Festival and the Galatia Christmas Festival.
Demographics
As of the 2010 census, the population of Galatia was 1,092. The racial makeup of the town was 97.2% White, 0.7% African American, 0.2% Native American, 0.2% Asian, 0.2% from other races, and 1.7% from two or more races. Hispanic or Latino of any race were 1.2% of the population.
The median income for a household in the town was $37,500 and the median income for a family was $45,000. The per capita income for the town was $17,845. About 11.2% of families and 14.2% of the population were below the poverty line, including 18.2% of those under age 18 and 8.3% of those age 65 or over.
Common Questions
What is Per Capita Income in Galatia?
Per Capita income in Galatia is $27,400.
What is the Median Family Income in Galatia?
Median Family Income in Galatia is $61,635.
What is the Median Household income in Galatia?
Median Household Income in Galatia is $46,875.
What is Income or Wage Gap in Galatia?
Income or Wage Gap in Galatia is 37.1%.
Women in Galatia earn 62.9 cents for every dollar earned by a man.
What is Inequality or Gini Index in Galatia?
Inequality or Gini Index in Galatia is 0.39.
What is the Total Population of Galatia?
Total Population of Galatia is 964.
What is the Total Male Population of Galatia?
Total Male Population of Galatia is 431.
What is the Total Female Population of Galatia?
Total Female Population of Galatia is 533.
What is the Ratio of Males per 100 Females in Galatia?
There are 80.86 Males per 100 Females in Galatia.
What is the Ratio of Females per 100 Males in Galatia?
There are 123.67 Females per 100 Males in Galatia.
What is the Median Population Age in Galatia?
Median Population Age in Galatia is 38.1 Years.
What is the Average Family Size in Galatia
Average Family Size in Galatia is 3.4 People.
What is the Average Household Size in Galatia
Average Household Size in Galatia is 2.6 People.
How Large is the Labor Force in Galatia?
There are 462 People in the Labor Forcein in Galatia.
What is the Percentage of People in the Labor Force in Galatia?
60.7% of People are in the Labor Force in Galatia.
What is the Unemployment Rate in Galatia?
Unemployment Rate in Galatia is 5.2%.