Georgetown, IL Map & Demographics
Georgetown Map
Georgetown Overview
$29,340
PER CAPITA INCOME
$69,958
AVG FAMILY INCOME
$54,247
AVG HOUSEHOLD INCOME
34.1%
WAGE / INCOME GAP [ % ]
65.9¢/ $1
WAGE / INCOME GAP [ $ ]
0.36
INEQUALITY / GINI INDEX
3,144
TOTAL POPULATION
1,657
MALE POPULATION
1,487
FEMALE POPULATION
111.43
MALES / 100 FEMALES
89.74
FEMALES / 100 MALES
41.5
MEDIAN AGE
3.0
AVG FAMILY SIZE
2.3
AVG HOUSEHOLD SIZE
1,577
LABOR FORCE [ PEOPLE ]
61.0%
PERCENT IN LABOR FORCE
6.8%
UNEMPLOYMENT RATE
Georgetown Zip Codes
Georgetown Area Codes
Income in Georgetown
Income Overview in Georgetown
Per Capita Income in Georgetown is $29,340, while median incomes of families and households are $69,958 and $54,247 respectively.
| Characteristic | Number | Measure |
| Per Capita Income | 3,144 | $29,340 |
| Median Family Income | 844 | $69,958 |
| Mean Family Income | 844 | $74,136 |
| Median Household Income | 1,382 | $54,247 |
| Mean Household Income | 1,382 | $63,200 |
| Income Deficit | 844 | $0 |
| Wage / Income Gap (%) | 3,144 | 34.07% |
| Wage / Income Gap ($) | 3,144 | 65.93¢ per $1 |
| Gini / Inequality Index | 3,144 | 0.36 |
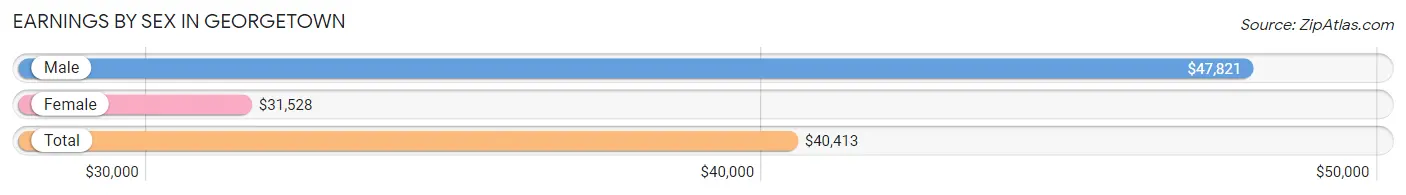
Earnings by Sex in Georgetown
Average Earnings in Georgetown are $40,413, $47,821 for men and $31,528 for women, a difference of 34.1%.
| Sex | Number | Average Earnings |
| Male | 946 (60.1%) | $47,821 |
| Female | 629 (39.9%) | $31,528 |
| Total | 1,575 (100.0%) | $40,413 |
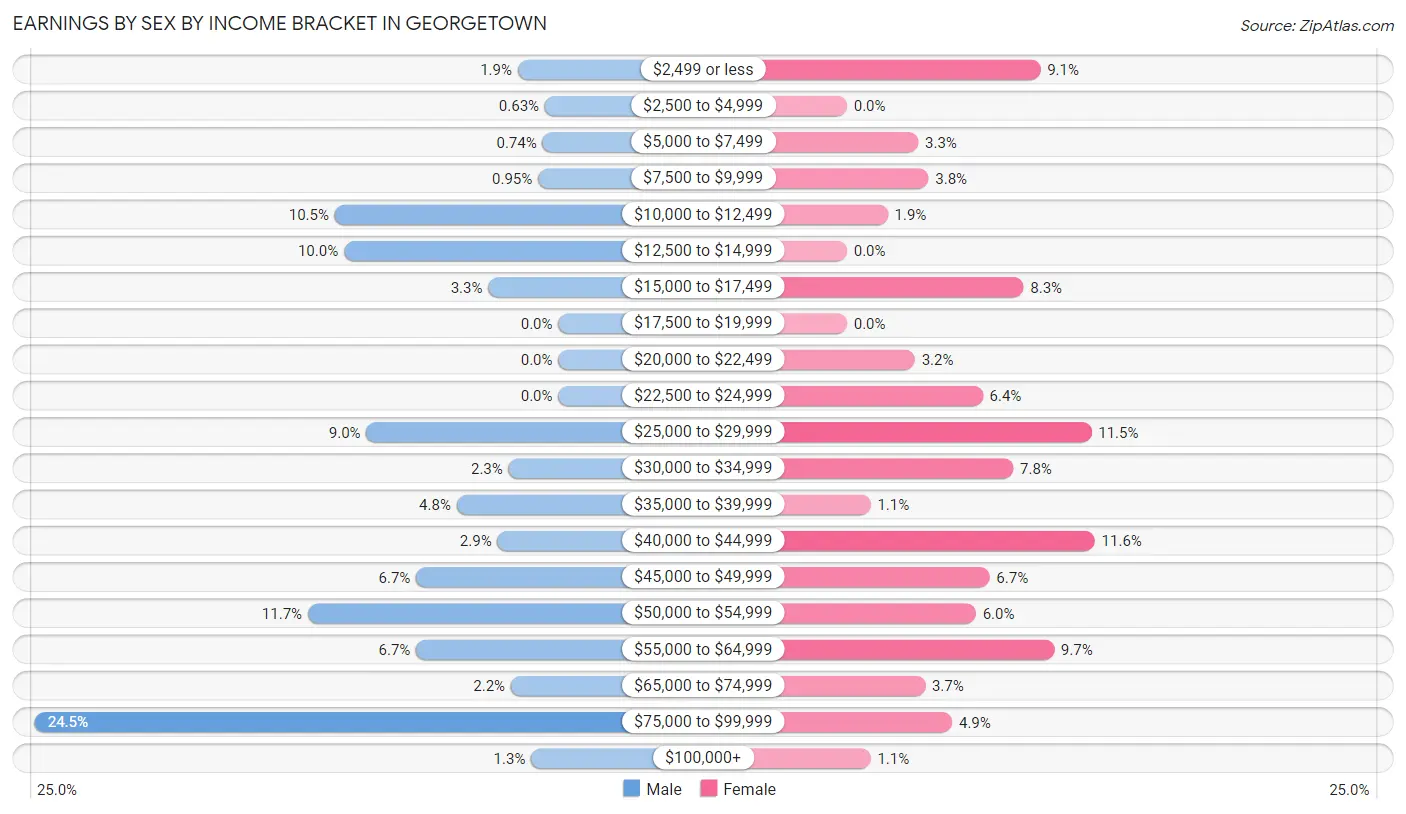
Earnings by Sex by Income Bracket in Georgetown
The most common earnings brackets in Georgetown are $75,000 to $99,999 for men (232 | 24.5%) and $40,000 to $44,999 for women (73 | 11.6%).
| Income | Male | Female |
| $2,499 or less | 18 (1.9%) | 57 (9.1%) |
| $2,500 to $4,999 | 6 (0.6%) | 0 (0.0%) |
| $5,000 to $7,499 | 7 (0.7%) | 21 (3.3%) |
| $7,500 to $9,999 | 9 (0.9%) | 24 (3.8%) |
| $10,000 to $12,499 | 99 (10.5%) | 12 (1.9%) |
| $12,500 to $14,999 | 95 (10.0%) | 0 (0.0%) |
| $15,000 to $17,499 | 31 (3.3%) | 52 (8.3%) |
| $17,500 to $19,999 | 0 (0.0%) | 0 (0.0%) |
| $20,000 to $22,499 | 0 (0.0%) | 20 (3.2%) |
| $22,500 to $24,999 | 0 (0.0%) | 40 (6.4%) |
| $25,000 to $29,999 | 85 (9.0%) | 72 (11.5%) |
| $30,000 to $34,999 | 22 (2.3%) | 49 (7.8%) |
| $35,000 to $39,999 | 45 (4.8%) | 7 (1.1%) |
| $40,000 to $44,999 | 27 (2.9%) | 73 (11.6%) |
| $45,000 to $49,999 | 63 (6.7%) | 42 (6.7%) |
| $50,000 to $54,999 | 111 (11.7%) | 38 (6.0%) |
| $55,000 to $64,999 | 63 (6.7%) | 61 (9.7%) |
| $65,000 to $74,999 | 21 (2.2%) | 23 (3.7%) |
| $75,000 to $99,999 | 232 (24.5%) | 31 (4.9%) |
| $100,000+ | 12 (1.3%) | 7 (1.1%) |
| Total | 946 (100.0%) | 629 (100.0%) |
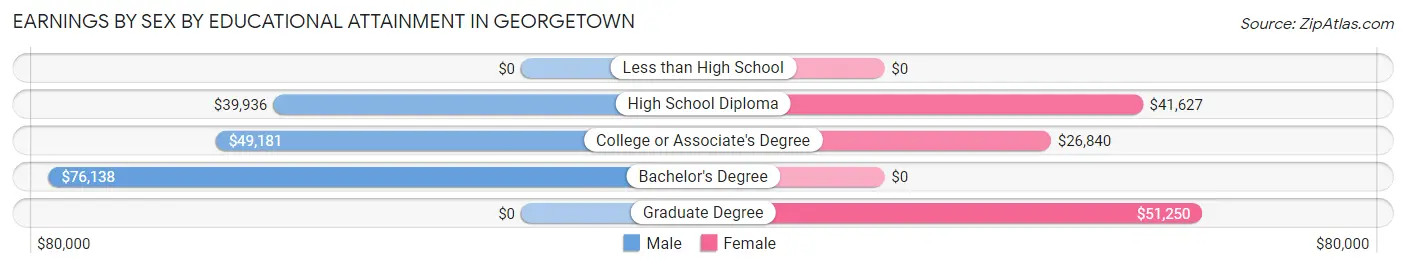
Earnings by Sex by Educational Attainment in Georgetown
Average earnings in Georgetown are $51,601 for men and $40,771 for women, a difference of 21.0%. Men with an educational attainment of bachelor's degree enjoy the highest average annual earnings of $76,138, while those with high school diploma education earn the least with $39,936. Women with an educational attainment of graduate degree earn the most with the average annual earnings of $51,250, while those with college or associate's degree education have the smallest earnings of $26,840.
| Educational Attainment | Male Income | Female Income |
| Less than High School | - | - |
| High School Diploma | $39,936 | $41,627 |
| College or Associate's Degree | $49,181 | $26,840 |
| Bachelor's Degree | $76,138 | $0 |
| Graduate Degree | - | - |
| Total | $51,601 | $40,771 |
Family Income in Georgetown
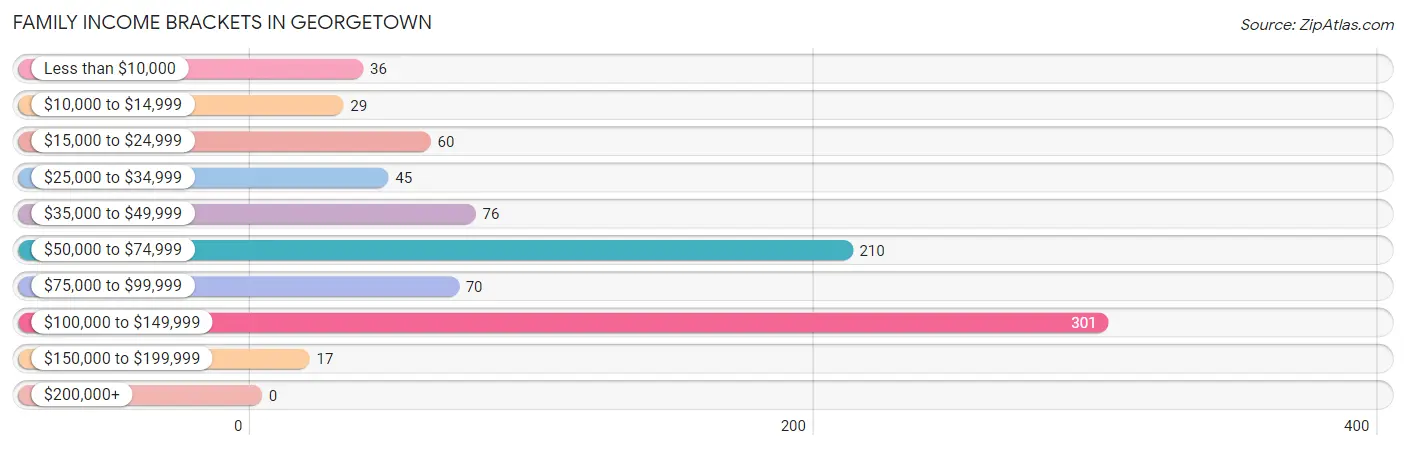
Family Income Brackets in Georgetown
According to the Georgetown family income data, there are 301 families falling into the $100,000 to $149,999 income range, which is the most common income bracket and makes up 35.7% of all families.
| Income Bracket | # Families | % Families |
| Less than $10,000 | 36 | 4.3% |
| $10,000 to $14,999 | 29 | 3.4% |
| $15,000 to $24,999 | 60 | 7.1% |
| $25,000 to $34,999 | 45 | 5.3% |
| $35,000 to $49,999 | 76 | 9.0% |
| $50,000 to $74,999 | 210 | 24.9% |
| $75,000 to $99,999 | 70 | 8.3% |
| $100,000 to $149,999 | 301 | 35.7% |
| $150,000 to $199,999 | 17 | 2.0% |
| $200,000+ | 0 | 0.0% |
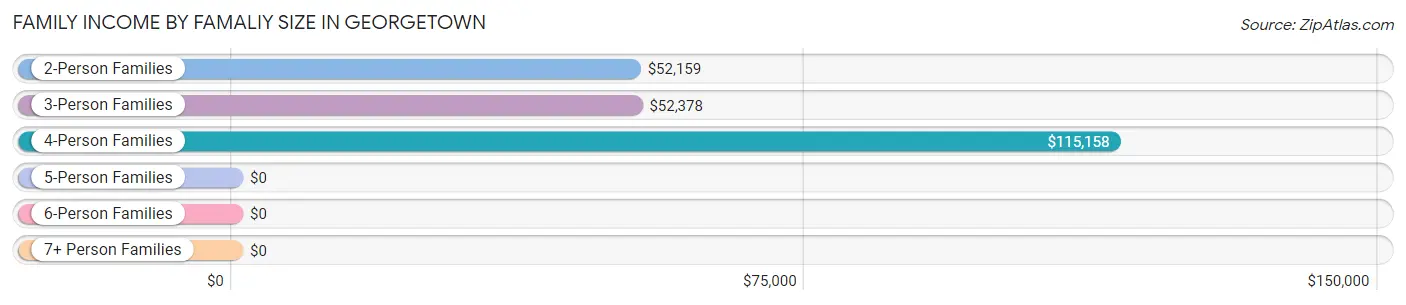
Family Income by Famaliy Size in Georgetown
4-person families (223 | 26.4%) account for the highest median family income in Georgetown with $115,158 per family, while 4-person families (223 | 26.4%) have the highest median income of $28,790 per family member.
| Income Bracket | # Families | Median Income |
| 2-Person Families | 466 (55.2%) | $52,159 |
| 3-Person Families | 120 (14.2%) | $52,378 |
| 4-Person Families | 223 (26.4%) | $115,158 |
| 5-Person Families | 3 (0.4%) | $0 |
| 6-Person Families | 32 (3.8%) | $0 |
| 7+ Person Families | 0 (0.0%) | $0 |
| Total | 844 (100.0%) | $69,958 |
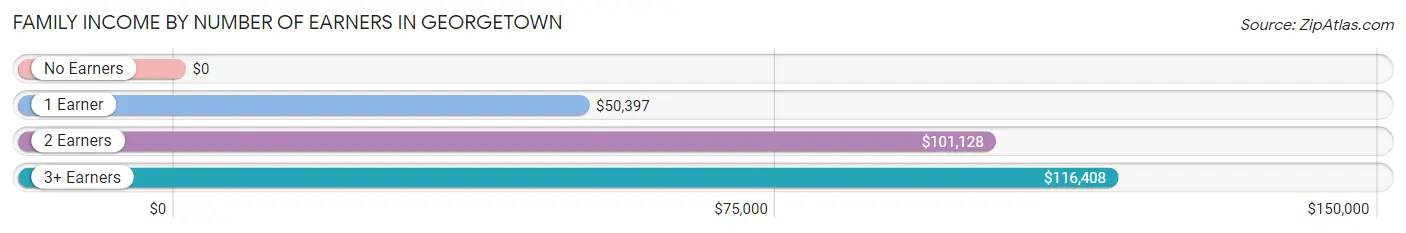
Family Income by Number of Earners in Georgetown
| Number of Earners | # Families | Median Income |
| No Earners | 143 (16.9%) | $0 |
| 1 Earner | 274 (32.5%) | $50,397 |
| 2 Earners | 309 (36.6%) | $101,128 |
| 3+ Earners | 118 (14.0%) | $116,408 |
| Total | 844 (100.0%) | $69,958 |
Household Income in Georgetown
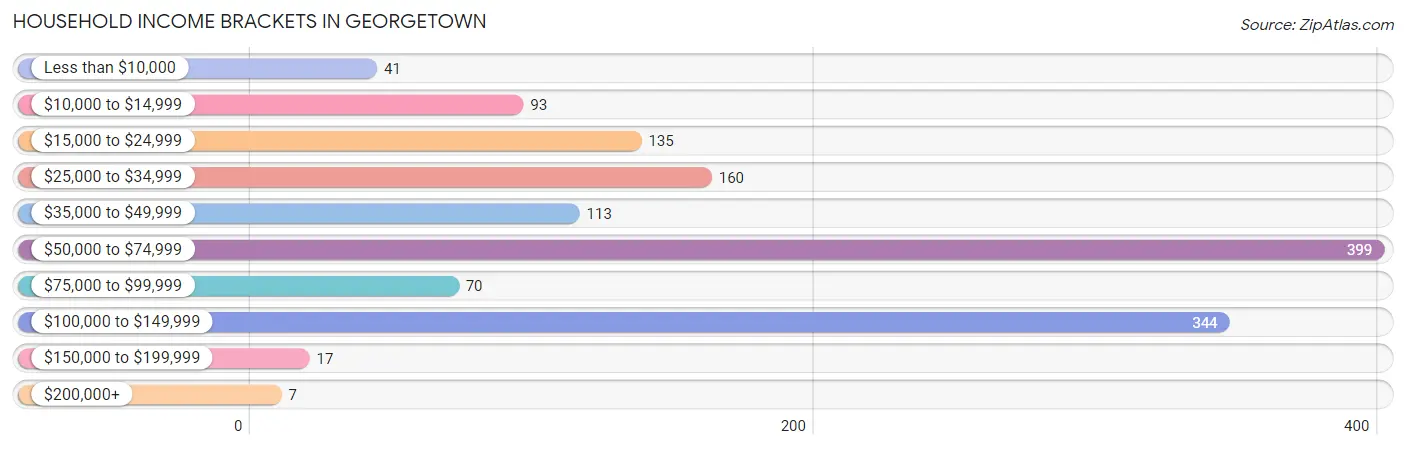
Household Income Brackets in Georgetown
With 399 households falling in the category, the $50,000 to $74,999 income range is the most frequent in Georgetown, accounting for 28.9% of all households. In contrast, only 7 households (0.5%) fall into the $200,000+ income bracket, making it the least populous group.
| Income Bracket | # Households | % Households |
| Less than $10,000 | 41 | 3.0% |
| $10,000 to $14,999 | 93 | 6.7% |
| $15,000 to $24,999 | 135 | 9.8% |
| $25,000 to $34,999 | 160 | 11.6% |
| $35,000 to $49,999 | 113 | 8.2% |
| $50,000 to $74,999 | 399 | 28.9% |
| $75,000 to $99,999 | 70 | 5.1% |
| $100,000 to $149,999 | 344 | 24.9% |
| $150,000 to $199,999 | 17 | 1.2% |
| $200,000+ | 7 | 0.5% |
Household Income by Householder Age in Georgetown
The median household income in Georgetown is $54,247, with the highest median household income of $72,530 found in the 65+ years age bracket for the primary householder. A total of 437 households (31.6%) fall into this category. Meanwhile, the 15 to 24 years age bracket for the primary householder has the lowest median household income of $28,696, with 86 households (6.2%) in this group.
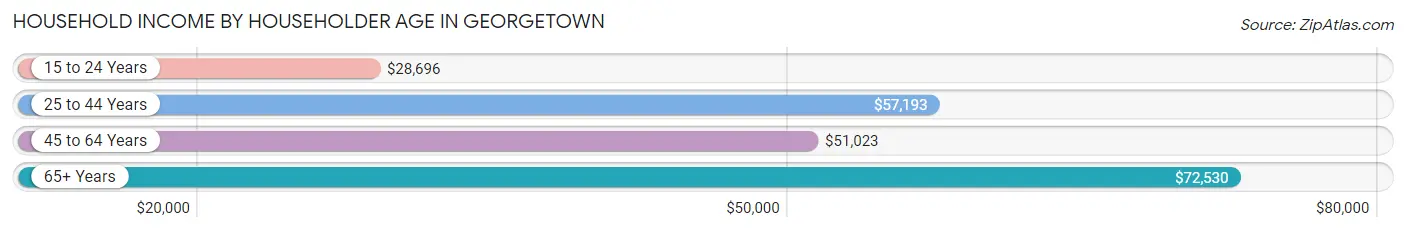
| Income Bracket | # Households | Median Income |
| 15 to 24 Years | 86 (6.2%) | $28,696 |
| 25 to 44 Years | 329 (23.8%) | $57,193 |
| 45 to 64 Years | 530 (38.4%) | $51,023 |
| 65+ Years | 437 (31.6%) | $72,530 |
| Total | 1,382 (100.0%) | $54,247 |
Poverty in Georgetown
Income Below Poverty by Sex and Age in Georgetown
With 11.8% poverty level for males and 12.4% for females among the residents of Georgetown, 65 to 74 year old males and 12 to 14 year old females are the most vulnerable to poverty, with 25 males (30.1%) and 7 females (38.9%) in their respective age groups living below the poverty level.
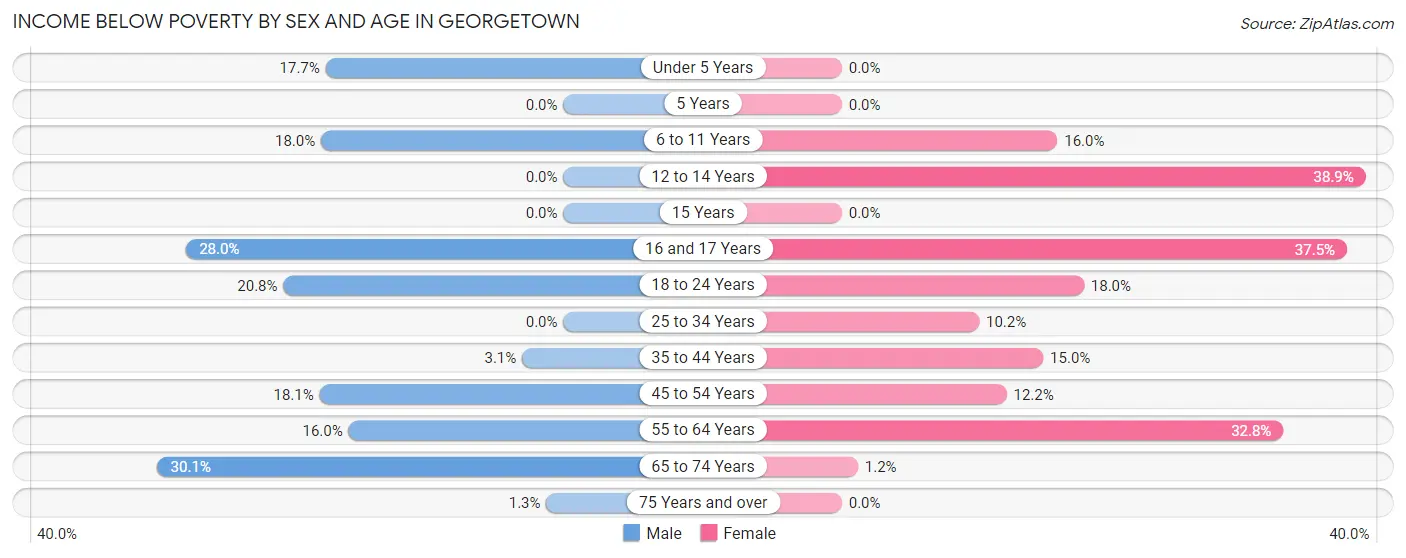
| Age Bracket | Male | Female |
| Under 5 Years | 9 (17.6%) | 0 (0.0%) |
| 5 Years | 0 (0.0%) | 0 (0.0%) |
| 6 to 11 Years | 25 (18.0%) | 28 (16.0%) |
| 12 to 14 Years | 0 (0.0%) | 7 (38.9%) |
| 15 Years | 0 (0.0%) | 0 (0.0%) |
| 16 and 17 Years | 7 (28.0%) | 9 (37.5%) |
| 18 to 24 Years | 42 (20.8%) | 23 (18.0%) |
| 25 to 34 Years | 0 (0.0%) | 21 (10.2%) |
| 35 to 44 Years | 9 (3.1%) | 16 (14.9%) |
| 45 to 54 Years | 21 (18.1%) | 17 (12.2%) |
| 55 to 64 Years | 56 (16.0%) | 58 (32.8%) |
| 65 to 74 Years | 25 (30.1%) | 3 (1.2%) |
| 75 Years and over | 2 (1.3%) | 0 (0.0%) |
| Total | 196 (11.8%) | 182 (12.4%) |
Income Above Poverty by Sex and Age in Georgetown
According to the poverty statistics in Georgetown, males aged 5 years and females aged under 5 years are the age groups that are most secure financially, with 100.0% of males and 100.0% of females in these age groups living above the poverty line.
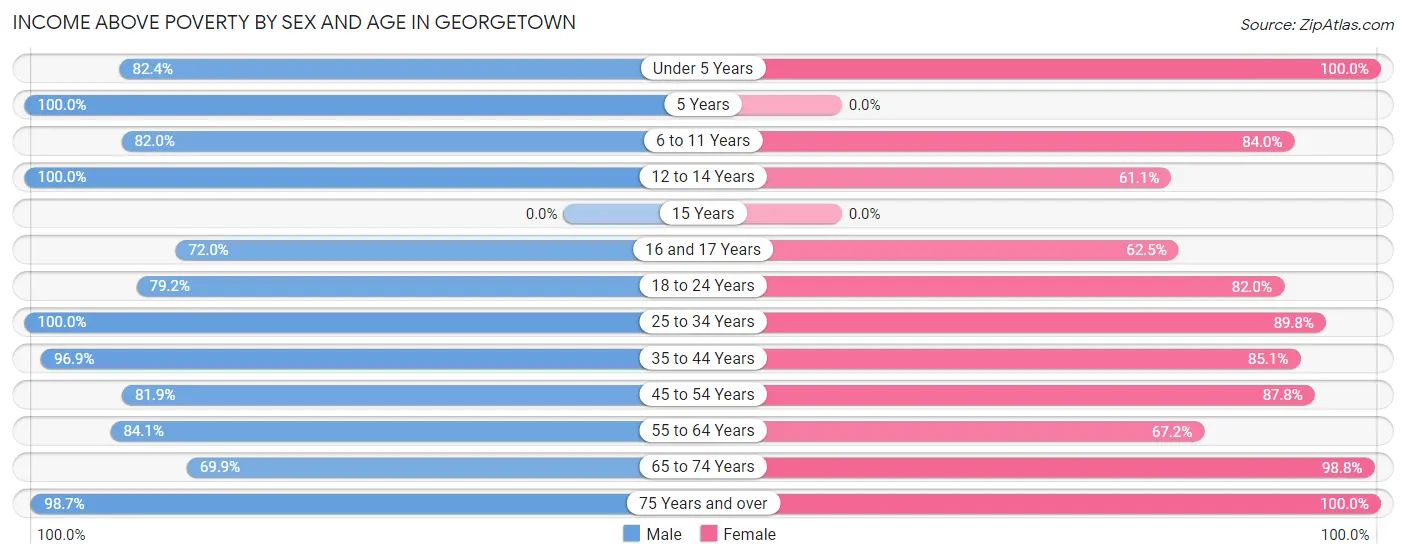
| Age Bracket | Male | Female |
| Under 5 Years | 42 (82.4%) | 87 (100.0%) |
| 5 Years | 31 (100.0%) | 0 (0.0%) |
| 6 to 11 Years | 114 (82.0%) | 147 (84.0%) |
| 12 to 14 Years | 40 (100.0%) | 11 (61.1%) |
| 15 Years | 0 (0.0%) | 0 (0.0%) |
| 16 and 17 Years | 18 (72.0%) | 15 (62.5%) |
| 18 to 24 Years | 160 (79.2%) | 105 (82.0%) |
| 25 to 34 Years | 166 (100.0%) | 185 (89.8%) |
| 35 to 44 Years | 285 (96.9%) | 91 (85.1%) |
| 45 to 54 Years | 95 (81.9%) | 122 (87.8%) |
| 55 to 64 Years | 295 (84.1%) | 119 (67.2%) |
| 65 to 74 Years | 58 (69.9%) | 250 (98.8%) |
| 75 Years and over | 157 (98.7%) | 155 (100.0%) |
| Total | 1,461 (88.2%) | 1,287 (87.6%) |
Income Below Poverty Among Married-Couple Families in Georgetown
The poverty statistics for married-couple families in Georgetown show that 5.0% or 25 of the total 501 families live below the poverty line. Families with no children have the highest poverty rate of 7.7%, comprising of 25 families. On the other hand, families with 1 or 2 children have the lowest poverty rate of 0.0%, which includes 0 families.
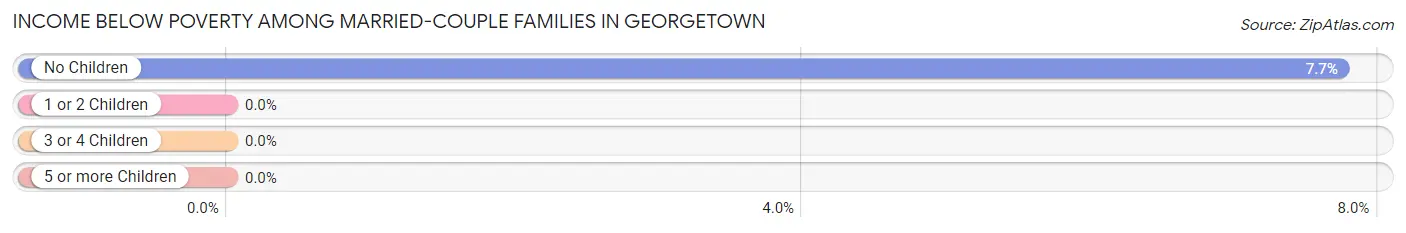
| Children | Above Poverty | Below Poverty |
| No Children | 298 (92.3%) | 25 (7.7%) |
| 1 or 2 Children | 146 (100.0%) | 0 (0.0%) |
| 3 or 4 Children | 32 (100.0%) | 0 (0.0%) |
| 5 or more Children | 0 (0.0%) | 0 (0.0%) |
| Total | 476 (95.0%) | 25 (5.0%) |
Income Below Poverty Among Single-Parent Households in Georgetown
According to the poverty data in Georgetown, 22.6% or 21 single-father households and 18.8% or 47 single-mother households are living below the poverty line. Among single-father households, those with no children have the highest poverty rate, with 21 households (40.4%) experiencing poverty. Likewise, among single-mother households, those with 3 or 4 children have the highest poverty rate, with 11 households (100.0%) falling below the poverty line.
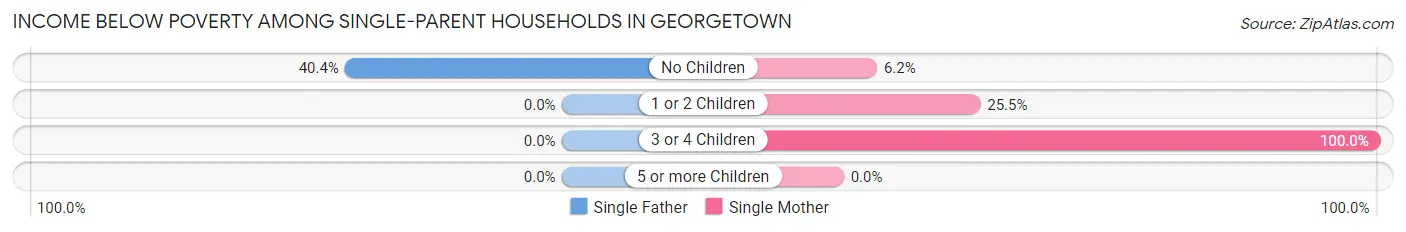
| Children | Single Father | Single Mother |
| No Children | 21 (40.4%) | 8 (6.2%) |
| 1 or 2 Children | 0 (0.0%) | 28 (25.5%) |
| 3 or 4 Children | 0 (0.0%) | 11 (100.0%) |
| 5 or more Children | 0 (0.0%) | 0 (0.0%) |
| Total | 21 (22.6%) | 47 (18.8%) |
Income Below Poverty Among Married-Couple vs Single-Parent Households in Georgetown
The poverty data for Georgetown shows that 25 of the married-couple family households (5.0%) and 68 of the single-parent households (19.8%) are living below the poverty level. Within the married-couple family households, those with no children have the highest poverty rate, with 25 households (7.7%) falling below the poverty line. Among the single-parent households, those with 3 or 4 children have the highest poverty rate, with 11 household (100.0%) living below poverty.
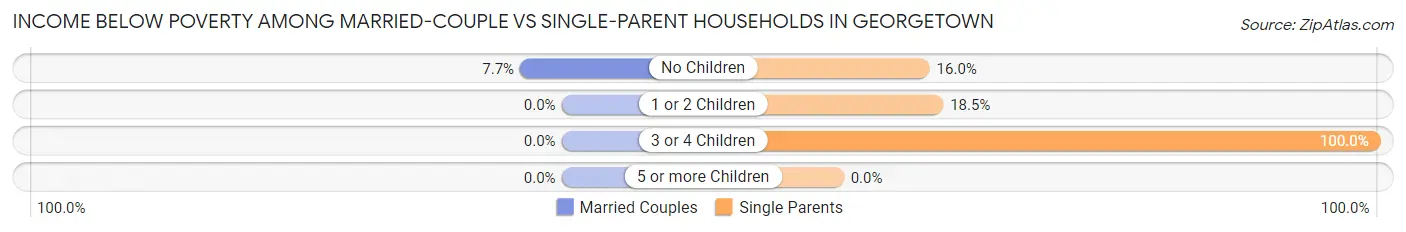
| Children | Married-Couple Families | Single-Parent Households |
| No Children | 25 (7.7%) | 29 (16.0%) |
| 1 or 2 Children | 0 (0.0%) | 28 (18.5%) |
| 3 or 4 Children | 0 (0.0%) | 11 (100.0%) |
| 5 or more Children | 0 (0.0%) | 0 (0.0%) |
| Total | 25 (5.0%) | 68 (19.8%) |
Race in Georgetown
The most populous races in Georgetown are White / Caucasian (2,890 | 91.9%), Black / African American (199 | 6.3%), and Hispanic or Latino (54 | 1.7%).
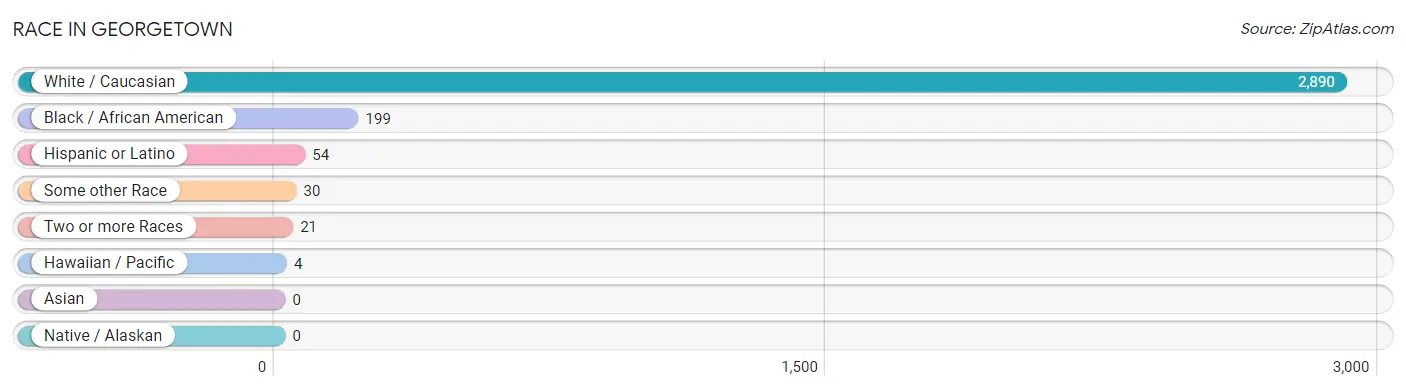
| Race | # Population | % Population |
| Asian | 0 | 0.0% |
| Black / African American | 199 | 6.3% |
| Hawaiian / Pacific | 4 | 0.1% |
| Hispanic or Latino | 54 | 1.7% |
| Native / Alaskan | 0 | 0.0% |
| White / Caucasian | 2,890 | 91.9% |
| Two or more Races | 21 | 0.7% |
| Some other Race | 30 | 0.9% |
| Total | 3,144 | 100.0% |
Ancestry in Georgetown
The most populous ancestries reported in Georgetown are Irish (510 | 16.2%), German (463 | 14.7%), English (216 | 6.9%), American (115 | 3.7%), and Scottish (70 | 2.2%), together accounting for 43.7% of all Georgetown residents.
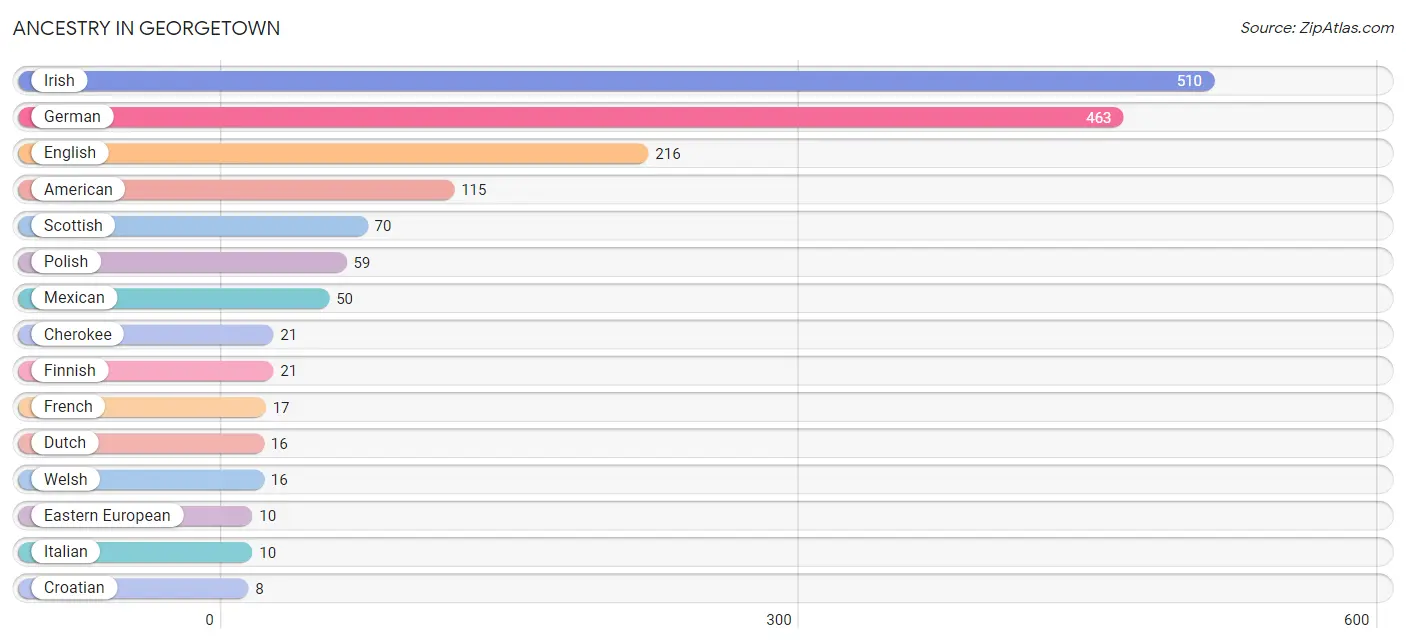
| Ancestry | # Population | % Population |
| American | 115 | 3.7% |
| Cherokee | 21 | 0.7% |
| Croatian | 8 | 0.3% |
| Dutch | 16 | 0.5% |
| Eastern European | 10 | 0.3% |
| English | 216 | 6.9% |
| Finnish | 21 | 0.7% |
| French | 17 | 0.5% |
| German | 463 | 14.7% |
| Irish | 510 | 16.2% |
| Italian | 10 | 0.3% |
| Lithuanian | 8 | 0.3% |
| Mexican | 50 | 1.6% |
| Polish | 59 | 1.9% |
| Russian | 3 | 0.1% |
| Scotch-Irish | 7 | 0.2% |
| Scottish | 70 | 2.2% |
| Slavic | 7 | 0.2% |
| Welsh | 16 | 0.5% | View All 19 Rows |
Immigrants in Georgetown
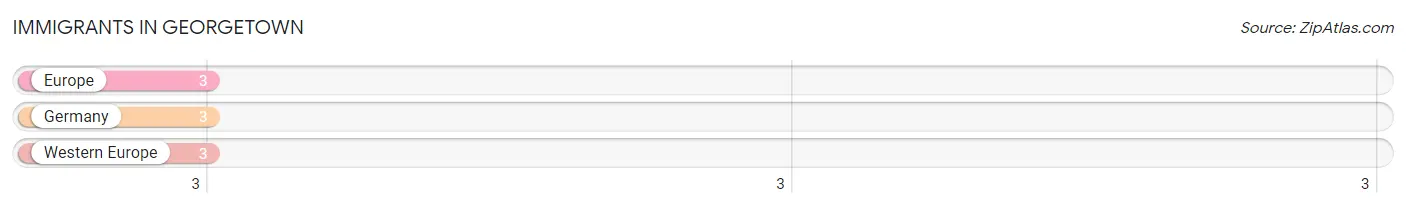
The most numerous immigrant groups reported in Georgetown came from Europe (3 | 0.1%), Germany (3 | 0.1%), and Western Europe (3 | 0.1%), together accounting for 0.3% of all Georgetown residents.
| Immigration Origin | # Population | % Population |
| Europe | 3 | 0.1% |
| Germany | 3 | 0.1% |
| Western Europe | 3 | 0.1% | View All 3 Rows |
Sex and Age in Georgetown
Sex and Age in Georgetown
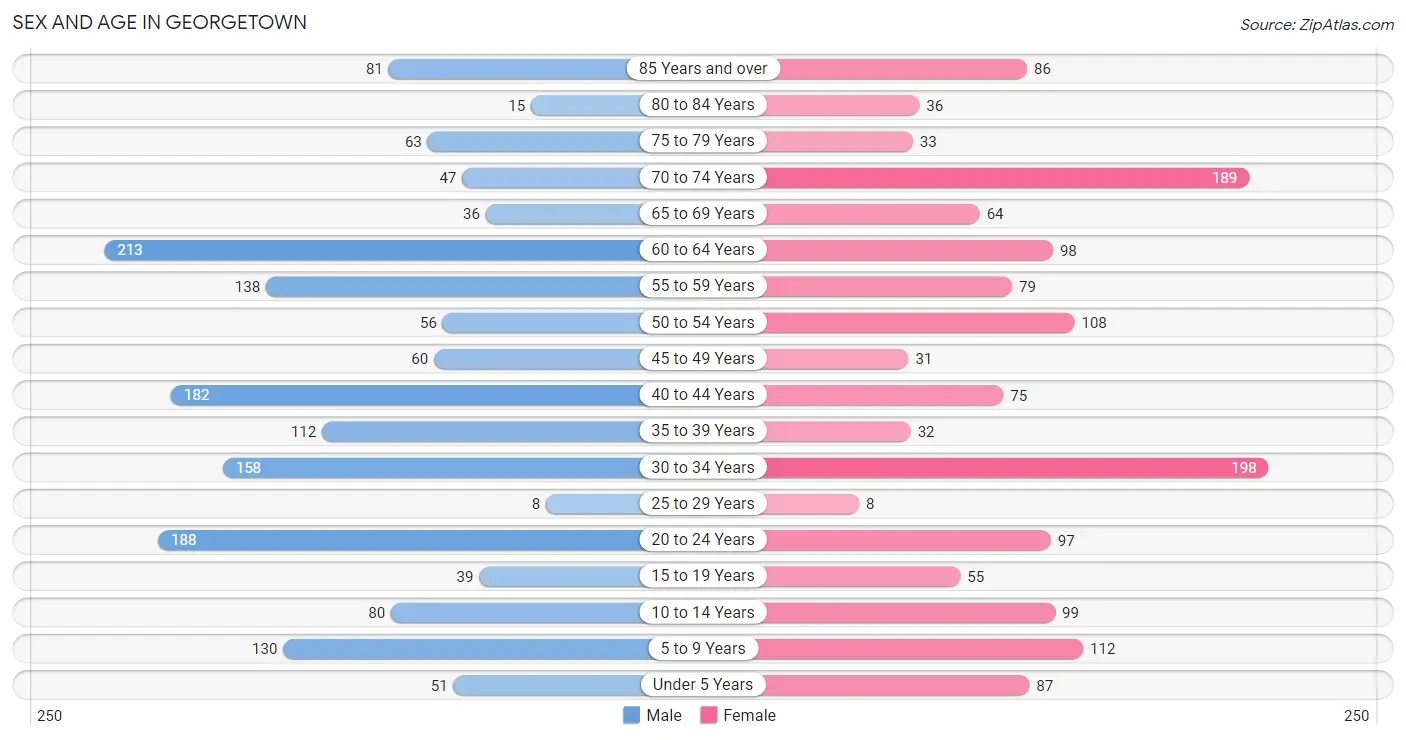
The most populous age groups in Georgetown are 60 to 64 Years (213 | 12.9%) for men and 30 to 34 Years (198 | 13.3%) for women.
| Age Bracket | Male | Female |
| Under 5 Years | 51 (3.1%) | 87 (5.9%) |
| 5 to 9 Years | 130 (7.9%) | 112 (7.5%) |
| 10 to 14 Years | 80 (4.8%) | 99 (6.7%) |
| 15 to 19 Years | 39 (2.4%) | 55 (3.7%) |
| 20 to 24 Years | 188 (11.4%) | 97 (6.5%) |
| 25 to 29 Years | 8 (0.5%) | 8 (0.5%) |
| 30 to 34 Years | 158 (9.5%) | 198 (13.3%) |
| 35 to 39 Years | 112 (6.8%) | 32 (2.1%) |
| 40 to 44 Years | 182 (11.0%) | 75 (5.0%) |
| 45 to 49 Years | 60 (3.6%) | 31 (2.1%) |
| 50 to 54 Years | 56 (3.4%) | 108 (7.3%) |
| 55 to 59 Years | 138 (8.3%) | 79 (5.3%) |
| 60 to 64 Years | 213 (12.9%) | 98 (6.6%) |
| 65 to 69 Years | 36 (2.2%) | 64 (4.3%) |
| 70 to 74 Years | 47 (2.8%) | 189 (12.7%) |
| 75 to 79 Years | 63 (3.8%) | 33 (2.2%) |
| 80 to 84 Years | 15 (0.9%) | 36 (2.4%) |
| 85 Years and over | 81 (4.9%) | 86 (5.8%) |
| Total | 1,657 (100.0%) | 1,487 (100.0%) |
Families and Households in Georgetown
Median Family Size in Georgetown
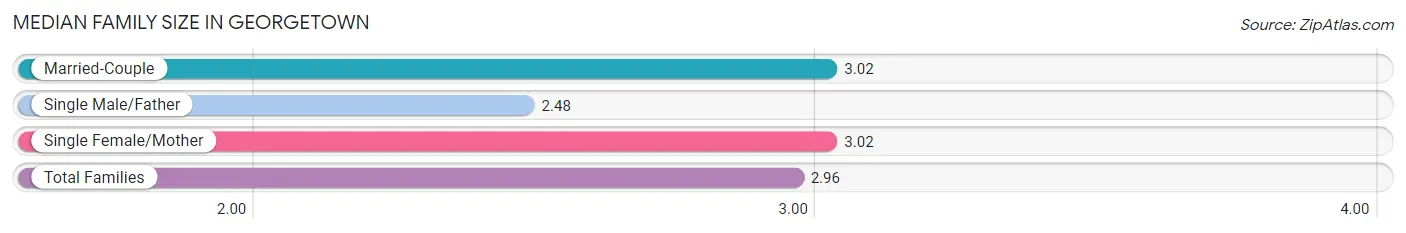
The median family size in Georgetown is 2.96 persons per family, with married-couple families (501 | 59.4%) accounting for the largest median family size of 3.02 persons per family. On the other hand, single male/father families (93 | 11.0%) represent the smallest median family size with 2.48 persons per family.
| Family Type | # Families | Family Size |
| Married-Couple | 501 (59.4%) | 3.02 |
| Single Male/Father | 93 (11.0%) | 2.48 |
| Single Female/Mother | 250 (29.6%) | 3.02 |
| Total Families | 844 (100.0%) | 2.96 |
Median Household Size in Georgetown
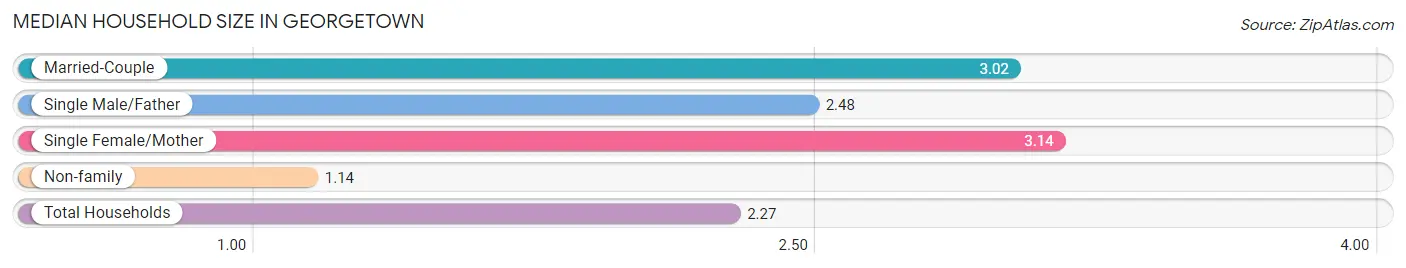
The median household size in Georgetown is 2.27 persons per household, with single female/mother households (250 | 18.1%) accounting for the largest median household size of 3.14 persons per household. non-family households (538 | 38.9%) represent the smallest median household size with 1.14 persons per household.
| Household Type | # Households | Household Size |
| Married-Couple | 501 (36.2%) | 3.02 |
| Single Male/Father | 93 (6.7%) | 2.48 |
| Single Female/Mother | 250 (18.1%) | 3.14 |
| Non-family | 538 (38.9%) | 1.14 |
| Total Households | 1,382 (100.0%) | 2.27 |
Household Size by Marriage Status in Georgetown
Out of a total of 1,382 households in Georgetown, 844 (61.1%) are family households, while 538 (38.9%) are nonfamily households. The most numerous type of family households are 2-person households, comprising 466, and the most common type of nonfamily households are 1-person households, comprising 468.
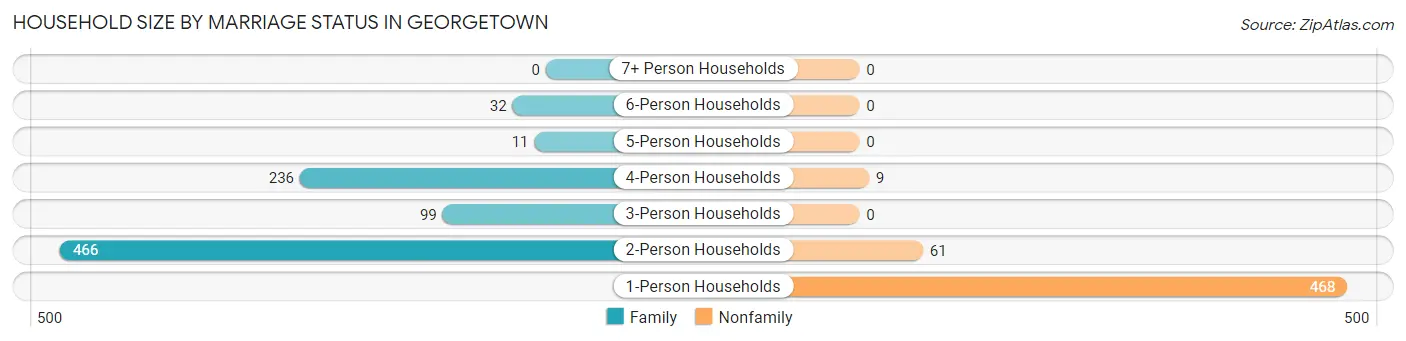
| Household Size | Family Households | Nonfamily Households |
| 1-Person Households | - | 468 (33.9%) |
| 2-Person Households | 466 (33.7%) | 61 (4.4%) |
| 3-Person Households | 99 (7.2%) | 0 (0.0%) |
| 4-Person Households | 236 (17.1%) | 9 (0.6%) |
| 5-Person Households | 11 (0.8%) | 0 (0.0%) |
| 6-Person Households | 32 (2.3%) | 0 (0.0%) |
| 7+ Person Households | 0 (0.0%) | 0 (0.0%) |
| Total | 844 (61.1%) | 538 (38.9%) |
Female Fertility in Georgetown
Fertility by Age in Georgetown
| Age Bracket | Women with Births | Births / 1,000 Women |
| 15 to 19 years | 0 (0.0%) | 0.0 |
| 20 to 34 years | 0 (0.0%) | 0.0 |
| 35 to 50 years | 0 (0.0%) | 0.0 |
| Total | 0 (0.0%) | 0.0 |
Fertility by Age by Marriage Status in Georgetown
| Age Bracket | Married | Unmarried |
| 15 to 19 years | 0 (0.0%) | 0 (0.0%) |
| 20 to 34 years | 0 (0.0%) | 0 (0.0%) |
| 35 to 50 years | 0 (0.0%) | 0 (0.0%) |
| Total | 0 (0.0%) | 0 (0.0%) |
Fertility by Education in Georgetown
| Educational Attainment | Women with Births | Births / 1,000 Women |
| Less than High School | 0 (0.0%) | 0.0 |
| High School Diploma | 0 (0.0%) | 0.0 |
| College or Associate's Degree | 0 (0.0%) | 0.0 |
| Bachelor's Degree | 0 (0.0%) | 0.0 |
| Graduate Degree | 0 (0.0%) | 0.0 |
| Total | 0 (0.0%) | 0.0 |
Fertility by Education by Marriage Status in Georgetown
| Educational Attainment | Married | Unmarried |
| Less than High School | 0 (0.0%) | 0 (0.0%) |
| High School Diploma | 0 (0.0%) | 0 (0.0%) |
| College or Associate's Degree | 0 (0.0%) | 0 (0.0%) |
| Bachelor's Degree | 0 (0.0%) | 0 (0.0%) |
| Graduate Degree | 0 (0.0%) | 0 (0.0%) |
| Total | 0 (0.0%) | 0 (0.0%) |
Employment Characteristics in Georgetown
Employment by Class of Employer in Georgetown
Among the 1,456 employed individuals in Georgetown, private company employees (1,060 | 72.8%), self-employed (not incorporated) (206 | 14.1%), and local government employees (146 | 10.0%) make up the most common classes of employment.
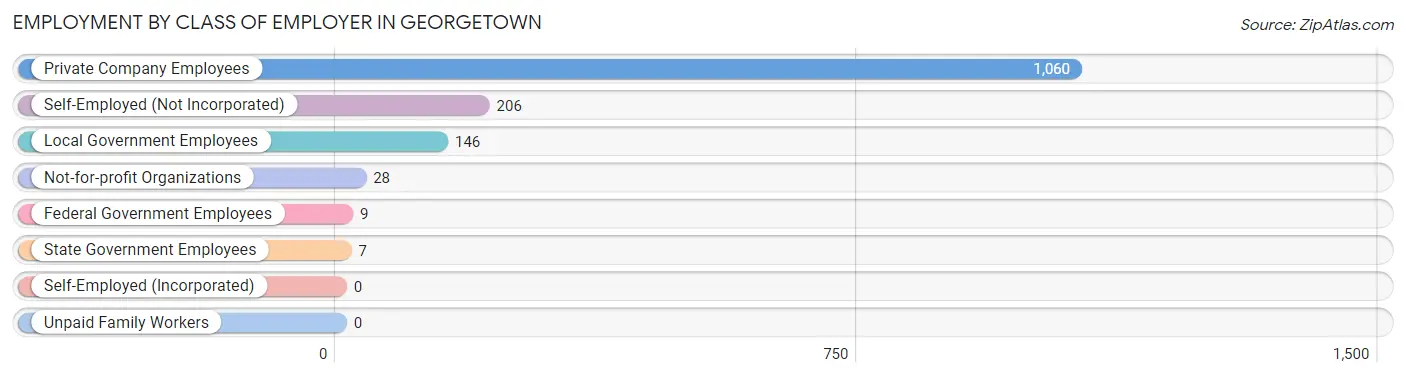
| Employer Class | # Employees | % Employees |
| Private Company Employees | 1,060 | 72.8% |
| Self-Employed (Incorporated) | 0 | 0.0% |
| Self-Employed (Not Incorporated) | 206 | 14.1% |
| Not-for-profit Organizations | 28 | 1.9% |
| Local Government Employees | 146 | 10.0% |
| State Government Employees | 7 | 0.5% |
| Federal Government Employees | 9 | 0.6% |
| Unpaid Family Workers | 0 | 0.0% |
| Total | 1,456 | 100.0% |
Employment Status by Age in Georgetown
According to the labor force statistics for Georgetown, out of the total population over 16 years of age (2,585), 61.0% or 1,577 individuals are in the labor force, with 6.8% or 107 of them unemployed. The age group with the highest labor force participation rate is 30 to 34 years, with 97.2% or 346 individuals in the labor force. Within the labor force, the 16 to 19 years age range has the highest percentage of unemployed individuals, with 62.2% or 23 of them being unemployed.
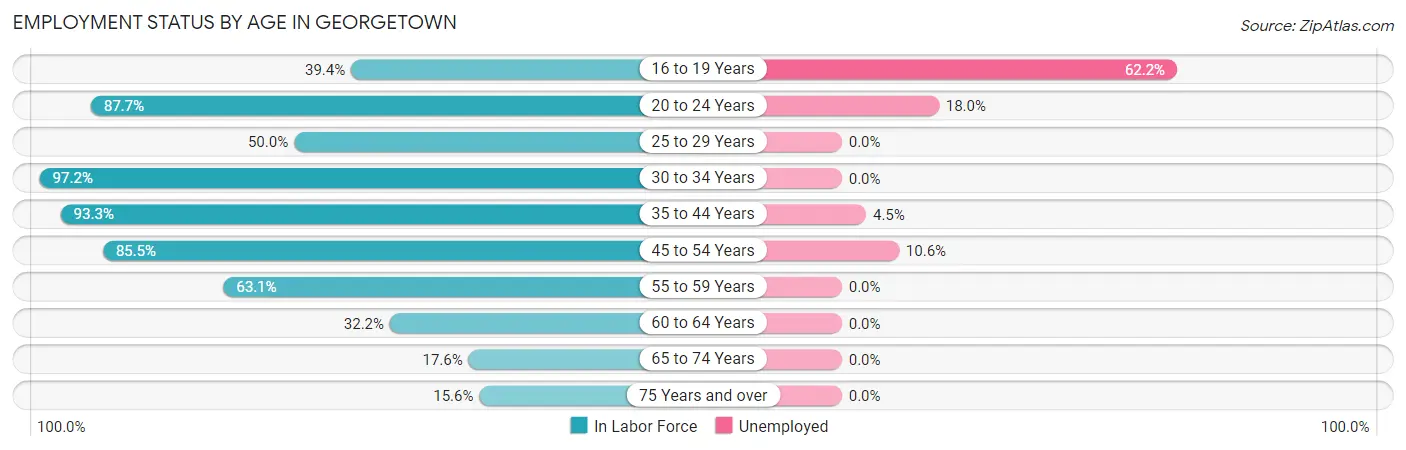
| Age Bracket | In Labor Force | Unemployed |
| 16 to 19 Years | 37 (39.4%) | 23 (62.2%) |
| 20 to 24 Years | 250 (87.7%) | 45 (18.0%) |
| 25 to 29 Years | 8 (50.0%) | 0 (0.0%) |
| 30 to 34 Years | 346 (97.2%) | 0 (0.0%) |
| 35 to 44 Years | 374 (93.3%) | 17 (4.5%) |
| 45 to 54 Years | 218 (85.5%) | 23 (10.6%) |
| 55 to 59 Years | 137 (63.1%) | 0 (0.0%) |
| 60 to 64 Years | 100 (32.2%) | 0 (0.0%) |
| 65 to 74 Years | 59 (17.6%) | 0 (0.0%) |
| 75 Years and over | 49 (15.6%) | 0 (0.0%) |
| Total | 1,577 (61.0%) | 107 (6.8%) |
Employment Status by Educational Attainment in Georgetown
According to labor force statistics for Georgetown, 76.0% of individuals (1,183) out of the total population between 25 and 64 years of age (1,556) are in the labor force, with 3.4% or 40 of them being unemployed. The group with the highest labor force participation rate are those with the educational attainment of bachelor's degree or higher, with 97.3% or 252 individuals in the labor force. Within the labor force, individuals with less than high school education have the highest percentage of unemployment, with 26.1% or 6 of them being unemployed.
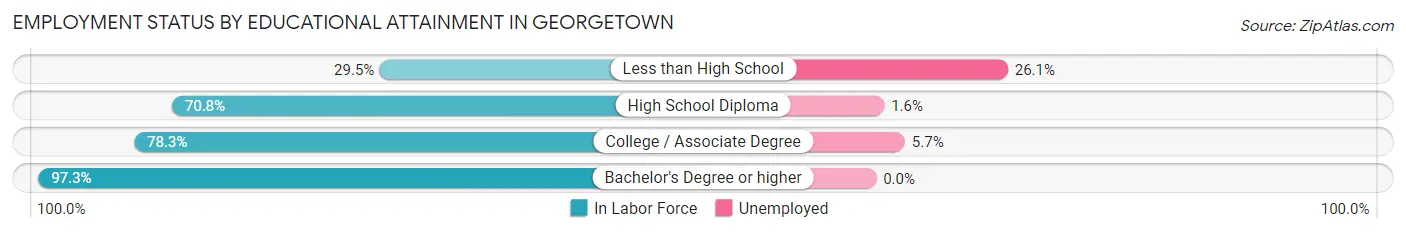
| Educational Attainment | In Labor Force | Unemployed |
| Less than High School | 23 (29.5%) | 20 (26.1%) |
| High School Diploma | 436 (70.8%) | 10 (1.6%) |
| College / Associate Degree | 472 (78.3%) | 34 (5.7%) |
| Bachelor's Degree or higher | 252 (97.3%) | 0 (0.0%) |
| Total | 1,183 (76.0%) | 53 (3.4%) |
Employment Occupations by Sex in Georgetown
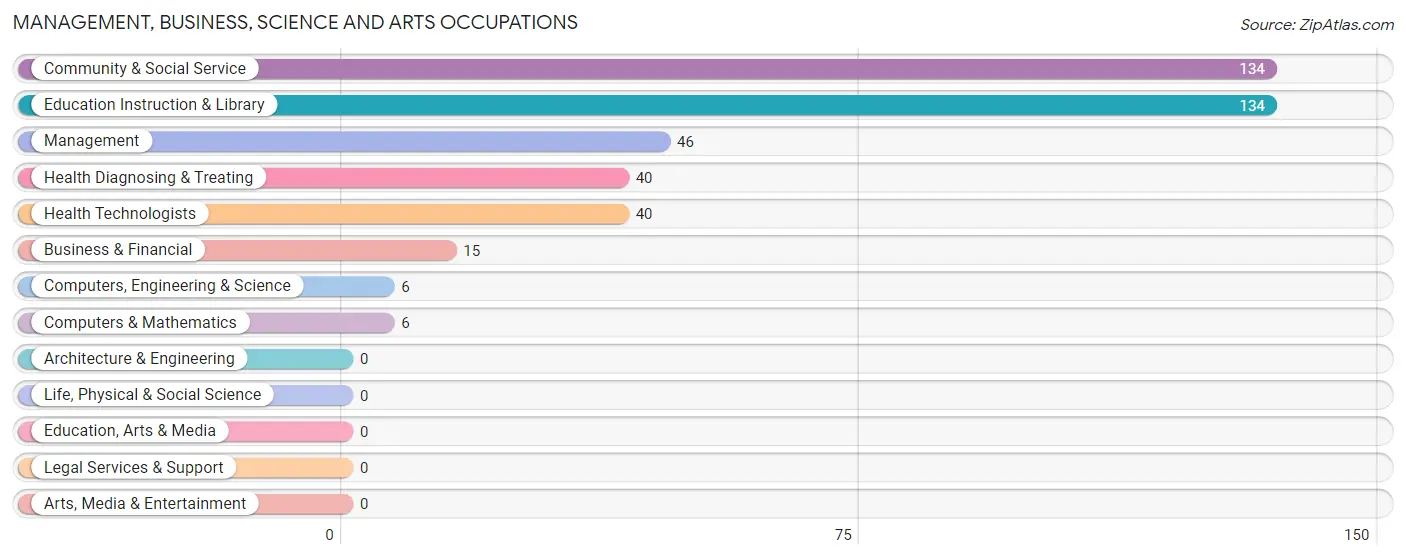
Management, Business, Science and Arts Occupations
The most common Management, Business, Science and Arts occupations in Georgetown are Community & Social Service (134 | 9.1%), Education Instruction & Library (134 | 9.1%), Management (46 | 3.1%), Health Diagnosing & Treating (40 | 2.7%), and Health Technologists (40 | 2.7%).
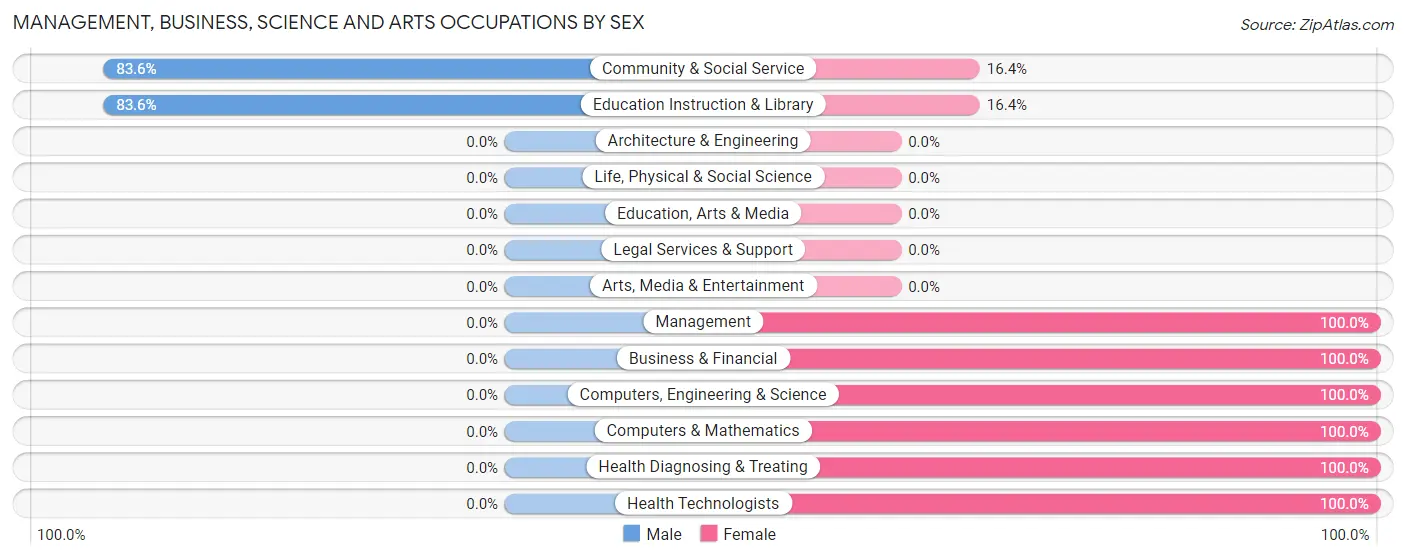
Management, Business, Science and Arts Occupations by Sex
Within the Management, Business, Science and Arts occupations in Georgetown, the most male-oriented occupations are Community & Social Service (83.6%), and Education Instruction & Library (83.6%), while the most female-oriented occupations are Management (100.0%), Business & Financial (100.0%), and Computers, Engineering & Science (100.0%).
| Occupation | Male | Female |
| Management | 0 (0.0%) | 46 (100.0%) |
| Business & Financial | 0 (0.0%) | 15 (100.0%) |
| Computers, Engineering & Science | 0 (0.0%) | 6 (100.0%) |
| Computers & Mathematics | 0 (0.0%) | 6 (100.0%) |
| Architecture & Engineering | 0 (0.0%) | 0 (0.0%) |
| Life, Physical & Social Science | 0 (0.0%) | 0 (0.0%) |
| Community & Social Service | 112 (83.6%) | 22 (16.4%) |
| Education, Arts & Media | 0 (0.0%) | 0 (0.0%) |
| Legal Services & Support | 0 (0.0%) | 0 (0.0%) |
| Education Instruction & Library | 112 (83.6%) | 22 (16.4%) |
| Arts, Media & Entertainment | 0 (0.0%) | 0 (0.0%) |
| Health Diagnosing & Treating | 0 (0.0%) | 40 (100.0%) |
| Health Technologists | 0 (0.0%) | 40 (100.0%) |
| Total (Category) | 112 (46.5%) | 129 (53.5%) |
| Total (Overall) | 905 (61.6%) | 565 (38.4%) |
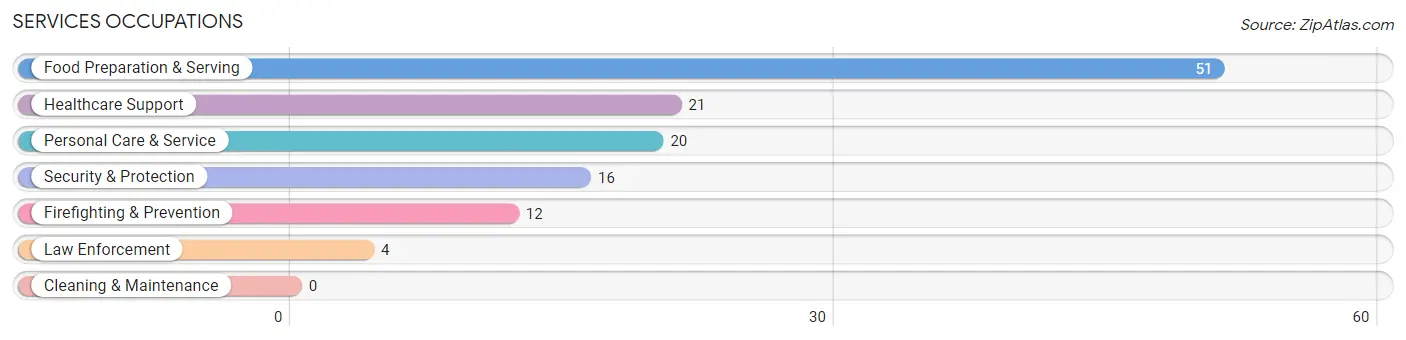
Services Occupations
The most common Services occupations in Georgetown are Food Preparation & Serving (51 | 3.5%), Healthcare Support (21 | 1.4%), Personal Care & Service (20 | 1.4%), Security & Protection (16 | 1.1%), and Firefighting & Prevention (12 | 0.8%).
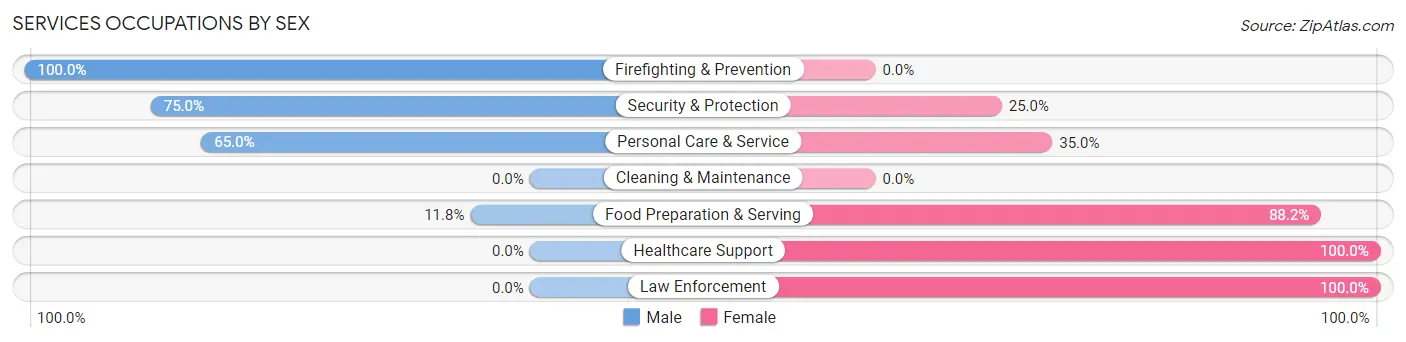
Services Occupations by Sex
Within the Services occupations in Georgetown, the most male-oriented occupations are Firefighting & Prevention (100.0%), Security & Protection (75.0%), and Personal Care & Service (65.0%), while the most female-oriented occupations are Healthcare Support (100.0%), Law Enforcement (100.0%), and Food Preparation & Serving (88.2%).
| Occupation | Male | Female |
| Healthcare Support | 0 (0.0%) | 21 (100.0%) |
| Security & Protection | 12 (75.0%) | 4 (25.0%) |
| Firefighting & Prevention | 12 (100.0%) | 0 (0.0%) |
| Law Enforcement | 0 (0.0%) | 4 (100.0%) |
| Food Preparation & Serving | 6 (11.8%) | 45 (88.2%) |
| Cleaning & Maintenance | 0 (0.0%) | 0 (0.0%) |
| Personal Care & Service | 13 (65.0%) | 7 (35.0%) |
| Total (Category) | 31 (28.7%) | 77 (71.3%) |
| Total (Overall) | 905 (61.6%) | 565 (38.4%) |
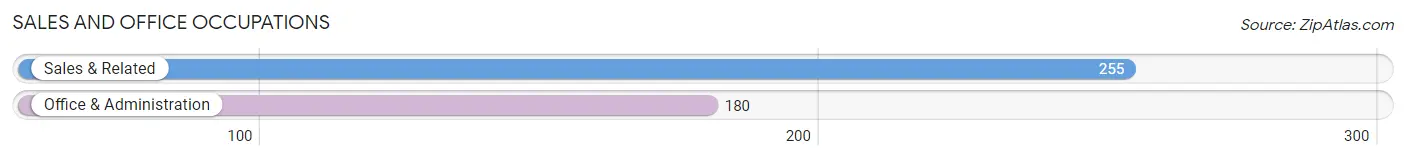
Sales and Office Occupations
The most common Sales and Office occupations in Georgetown are Sales & Related (255 | 17.3%), and Office & Administration (180 | 12.2%).
Sales and Office Occupations by Sex

| Occupation | Male | Female |
| Sales & Related | 190 (74.5%) | 65 (25.5%) |
| Office & Administration | 17 (9.4%) | 163 (90.6%) |
| Total (Category) | 207 (47.6%) | 228 (52.4%) |
| Total (Overall) | 905 (61.6%) | 565 (38.4%) |
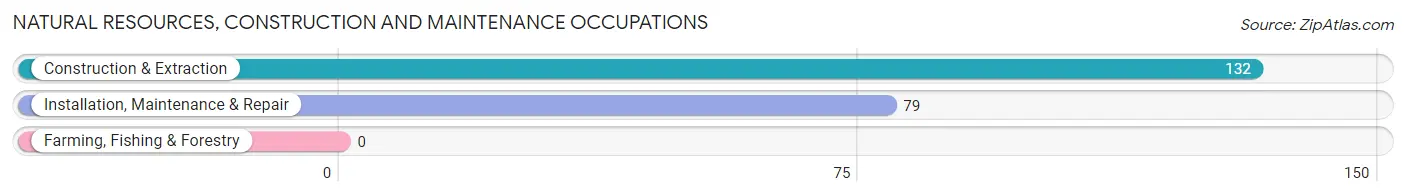
Natural Resources, Construction and Maintenance Occupations
The most common Natural Resources, Construction and Maintenance occupations in Georgetown are Construction & Extraction (132 | 9.0%), and Installation, Maintenance & Repair (79 | 5.4%).
Natural Resources, Construction and Maintenance Occupations by Sex
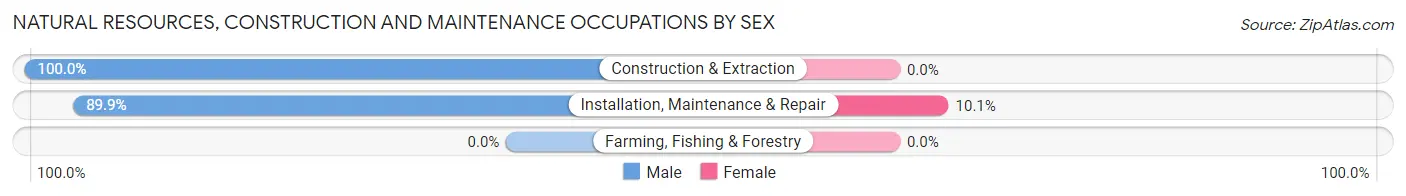
| Occupation | Male | Female |
| Farming, Fishing & Forestry | 0 (0.0%) | 0 (0.0%) |
| Construction & Extraction | 132 (100.0%) | 0 (0.0%) |
| Installation, Maintenance & Repair | 71 (89.9%) | 8 (10.1%) |
| Total (Category) | 203 (96.2%) | 8 (3.8%) |
| Total (Overall) | 905 (61.6%) | 565 (38.4%) |
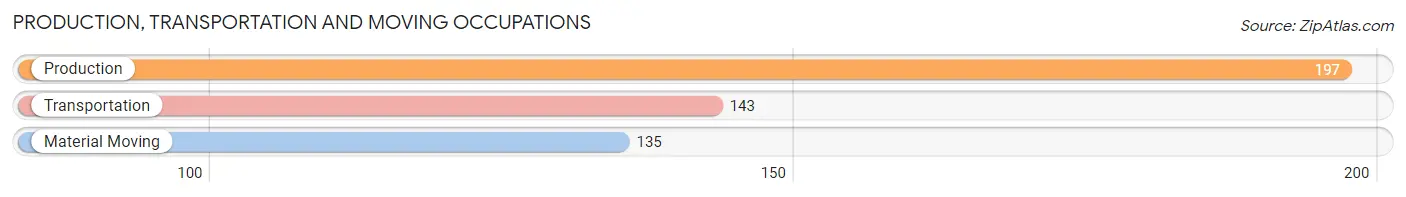
Production, Transportation and Moving Occupations
The most common Production, Transportation and Moving occupations in Georgetown are Production (197 | 13.4%), Transportation (143 | 9.7%), and Material Moving (135 | 9.2%).
Production, Transportation and Moving Occupations by Sex
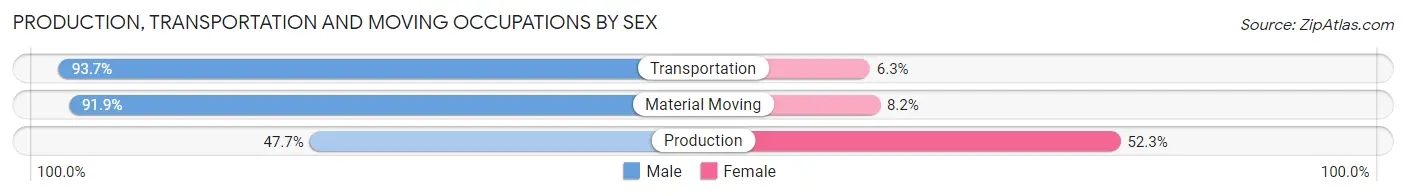
| Occupation | Male | Female |
| Production | 94 (47.7%) | 103 (52.3%) |
| Transportation | 134 (93.7%) | 9 (6.3%) |
| Material Moving | 124 (91.8%) | 11 (8.2%) |
| Total (Category) | 352 (74.1%) | 123 (25.9%) |
| Total (Overall) | 905 (61.6%) | 565 (38.4%) |
Employment Industries by Sex in Georgetown
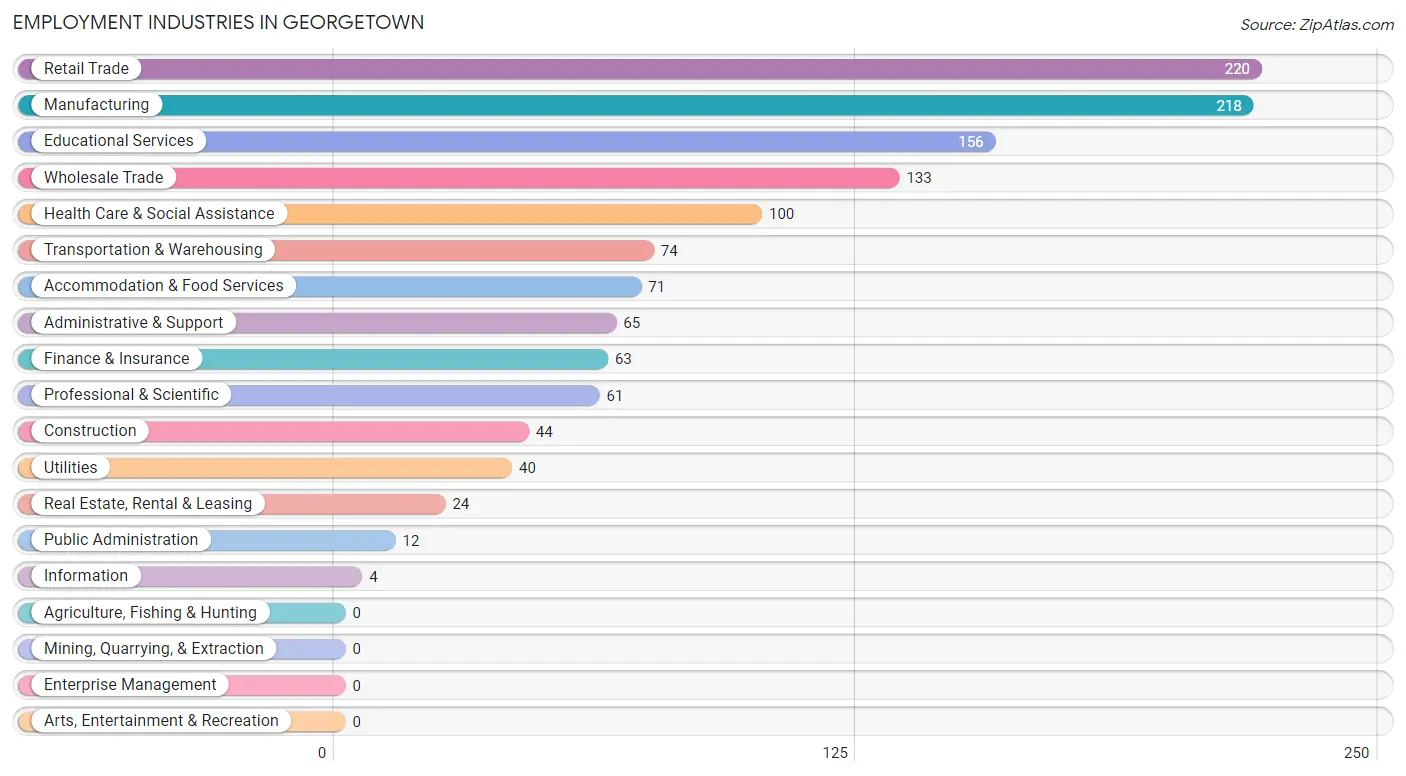
Employment Industries in Georgetown
The major employment industries in Georgetown include Retail Trade (220 | 15.0%), Manufacturing (218 | 14.8%), Educational Services (156 | 10.6%), Wholesale Trade (133 | 9.0%), and Health Care & Social Assistance (100 | 6.8%).
Employment Industries by Sex in Georgetown
The Georgetown industries that see more men than women are Construction (100.0%), Information (100.0%), and Real Estate, Rental & Leasing (100.0%), whereas the industries that tend to have a higher number of women are Utilities (100.0%), Professional & Scientific (100.0%), and Health Care & Social Assistance (100.0%).
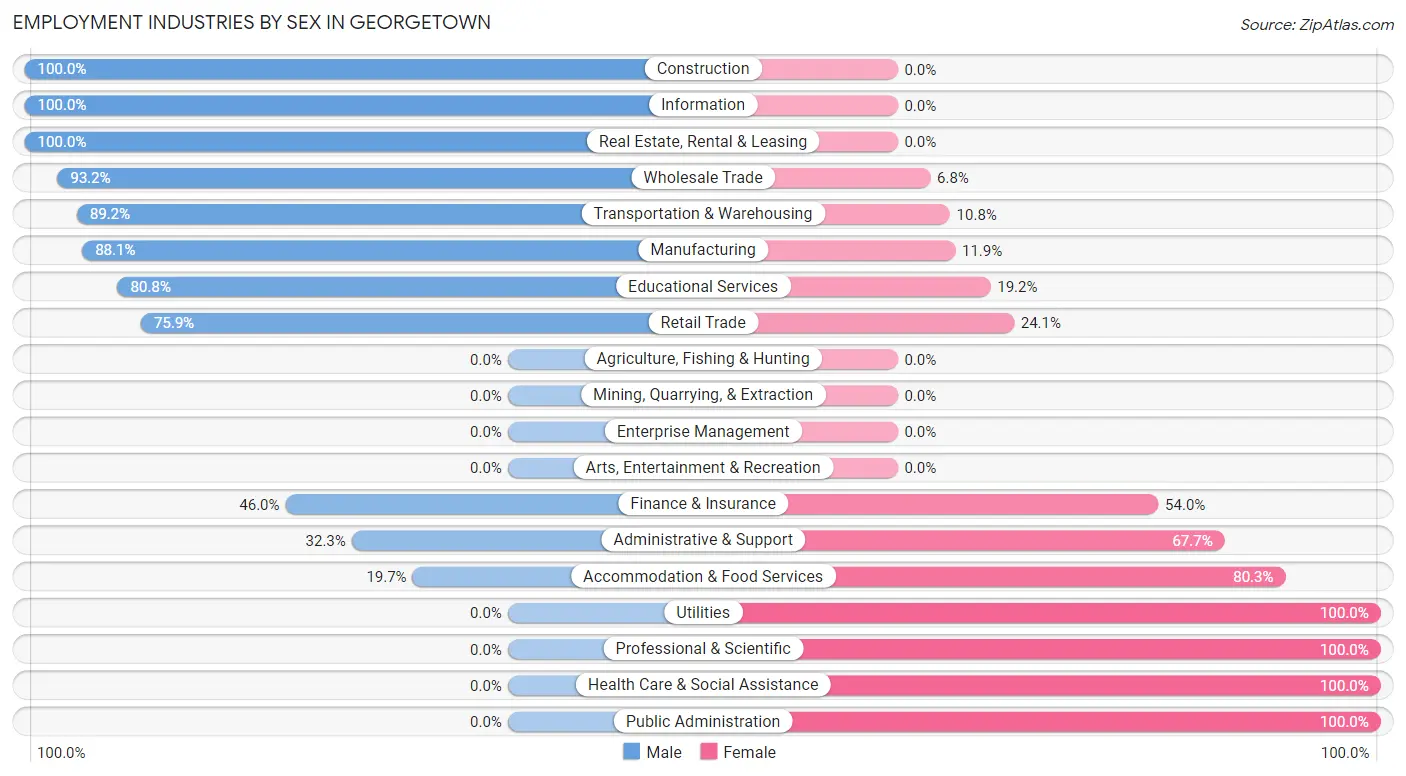
| Industry | Male | Female |
| Agriculture, Fishing & Hunting | 0 (0.0%) | 0 (0.0%) |
| Mining, Quarrying, & Extraction | 0 (0.0%) | 0 (0.0%) |
| Construction | 44 (100.0%) | 0 (0.0%) |
| Manufacturing | 192 (88.1%) | 26 (11.9%) |
| Wholesale Trade | 124 (93.2%) | 9 (6.8%) |
| Retail Trade | 167 (75.9%) | 53 (24.1%) |
| Transportation & Warehousing | 66 (89.2%) | 8 (10.8%) |
| Utilities | 0 (0.0%) | 40 (100.0%) |
| Information | 4 (100.0%) | 0 (0.0%) |
| Finance & Insurance | 29 (46.0%) | 34 (54.0%) |
| Real Estate, Rental & Leasing | 24 (100.0%) | 0 (0.0%) |
| Professional & Scientific | 0 (0.0%) | 61 (100.0%) |
| Enterprise Management | 0 (0.0%) | 0 (0.0%) |
| Administrative & Support | 21 (32.3%) | 44 (67.7%) |
| Educational Services | 126 (80.8%) | 30 (19.2%) |
| Health Care & Social Assistance | 0 (0.0%) | 100 (100.0%) |
| Arts, Entertainment & Recreation | 0 (0.0%) | 0 (0.0%) |
| Accommodation & Food Services | 14 (19.7%) | 57 (80.3%) |
| Public Administration | 0 (0.0%) | 12 (100.0%) |
| Total | 905 (61.6%) | 565 (38.4%) |
Education in Georgetown
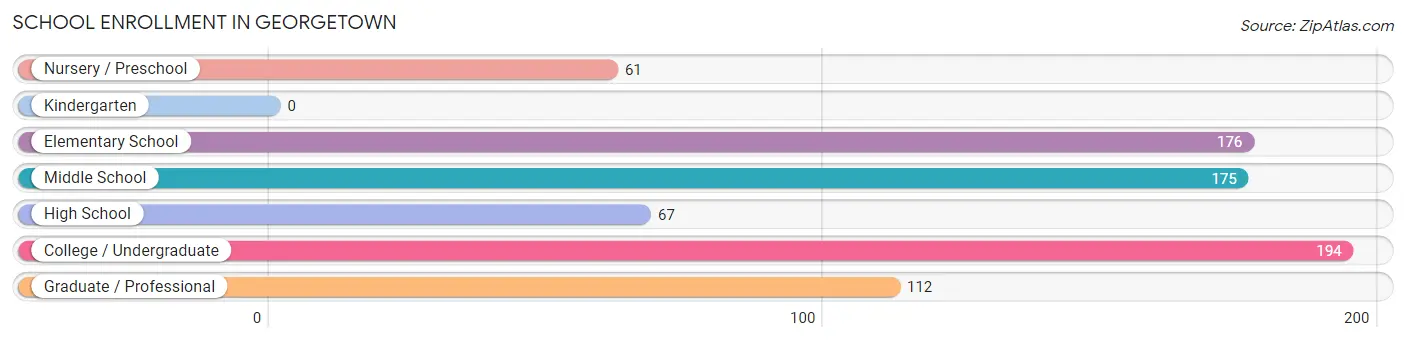
School Enrollment in Georgetown
The most common levels of schooling among the 785 students in Georgetown are college / undergraduate (194 | 24.7%), elementary school (176 | 22.4%), and middle school (175 | 22.3%).
| School Level | # Students | % Students |
| Nursery / Preschool | 61 | 7.8% |
| Kindergarten | 0 | 0.0% |
| Elementary School | 176 | 22.4% |
| Middle School | 175 | 22.3% |
| High School | 67 | 8.5% |
| College / Undergraduate | 194 | 24.7% |
| Graduate / Professional | 112 | 14.3% |
| Total | 785 | 100.0% |
School Enrollment by Age by Funding Source in Georgetown
Out of a total of 785 students who are enrolled in schools in Georgetown, 149 (19.0%) attend a private institution, while the remaining 636 (81.0%) are enrolled in public schools. The age group of 10 to 14 year olds has the highest likelihood of being enrolled in private schools, with 76 (42.5% in the age bracket) enrolled. Conversely, the age group of 3 to 4 year olds has the lowest likelihood of being enrolled in a private school, with 30 (100.0% in the age bracket) attending a public institution.
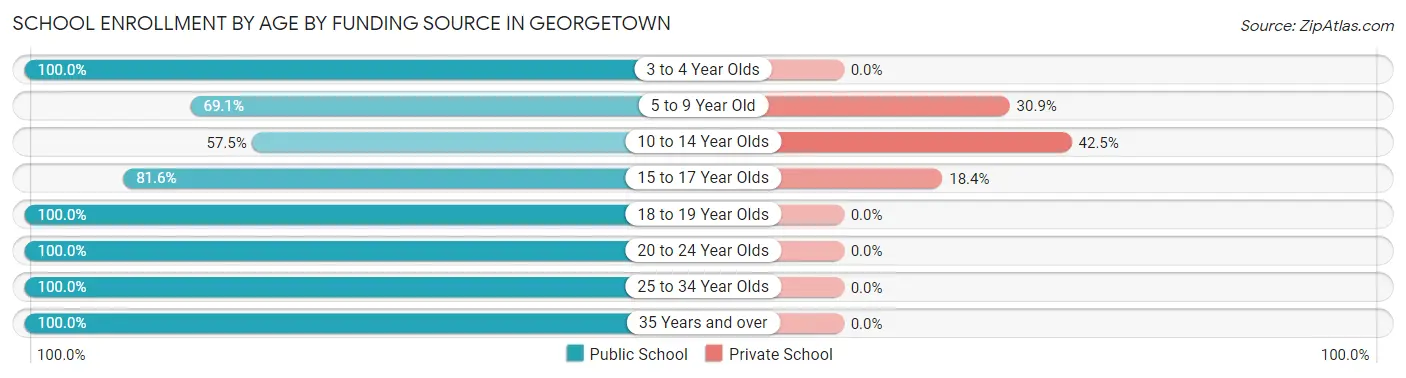
| Age Bracket | Public School | Private School |
| 3 to 4 Year Olds | 30 (100.0%) | 0 (0.0%) |
| 5 to 9 Year Old | 143 (69.1%) | 64 (30.9%) |
| 10 to 14 Year Olds | 103 (57.5%) | 76 (42.5%) |
| 15 to 17 Year Olds | 40 (81.6%) | 9 (18.4%) |
| 18 to 19 Year Olds | 14 (100.0%) | 0 (0.0%) |
| 20 to 24 Year Olds | 163 (100.0%) | 0 (0.0%) |
| 25 to 34 Year Olds | 31 (100.0%) | 0 (0.0%) |
| 35 Years and over | 112 (100.0%) | 0 (0.0%) |
| Total | 636 (81.0%) | 149 (19.0%) |
Educational Attainment by Field of Study in Georgetown
Engineering (112 | 36.1%), visual & performing arts (78 | 25.2%), education (58 | 18.7%), psychology (22 | 7.1%), and arts & humanities (20 | 6.5%) are the most common fields of study among 310 individuals in Georgetown who have obtained a bachelor's degree or higher.
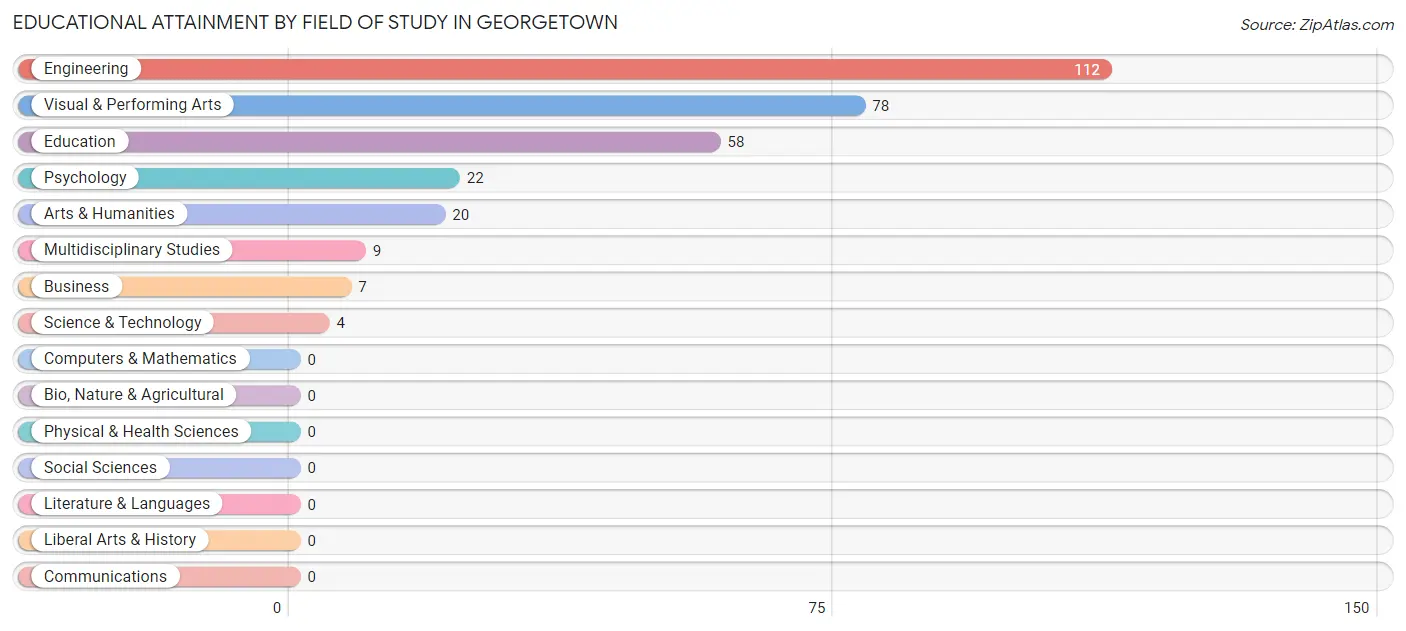
| Field of Study | # Graduates | % Graduates |
| Computers & Mathematics | 0 | 0.0% |
| Bio, Nature & Agricultural | 0 | 0.0% |
| Physical & Health Sciences | 0 | 0.0% |
| Psychology | 22 | 7.1% |
| Social Sciences | 0 | 0.0% |
| Engineering | 112 | 36.1% |
| Multidisciplinary Studies | 9 | 2.9% |
| Science & Technology | 4 | 1.3% |
| Business | 7 | 2.3% |
| Education | 58 | 18.7% |
| Literature & Languages | 0 | 0.0% |
| Liberal Arts & History | 0 | 0.0% |
| Visual & Performing Arts | 78 | 25.2% |
| Communications | 0 | 0.0% |
| Arts & Humanities | 20 | 6.5% |
| Total | 310 | 100.0% |
Transportation & Commute in Georgetown
Vehicle Availability by Sex in Georgetown
The most prevalent vehicle ownership categories in Georgetown are males with 2 vehicles (614, accounting for 68.4%) and females with 2 vehicles (165, making up 110.0%).
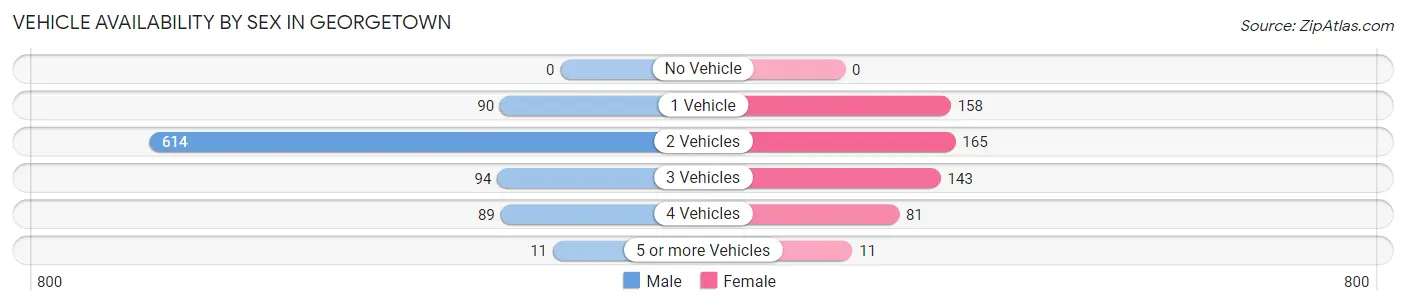
| Vehicles Available | Male | Female |
| No Vehicle | 0 (0.0%) | 0 (0.0%) |
| 1 Vehicle | 90 (10.0%) | 158 (28.3%) |
| 2 Vehicles | 614 (68.4%) | 165 (29.6%) |
| 3 Vehicles | 94 (10.5%) | 143 (25.6%) |
| 4 Vehicles | 89 (9.9%) | 81 (14.5%) |
| 5 or more Vehicles | 11 (1.2%) | 11 (2.0%) |
| Total | 898 (100.0%) | 558 (100.0%) |
Commute Time in Georgetown
The most frequently occuring commute durations in Georgetown are 30 to 34 minutes (292 commuters, 23.6%), 15 to 19 minutes (230 commuters, 18.6%), and 20 to 24 minutes (164 commuters, 13.2%).
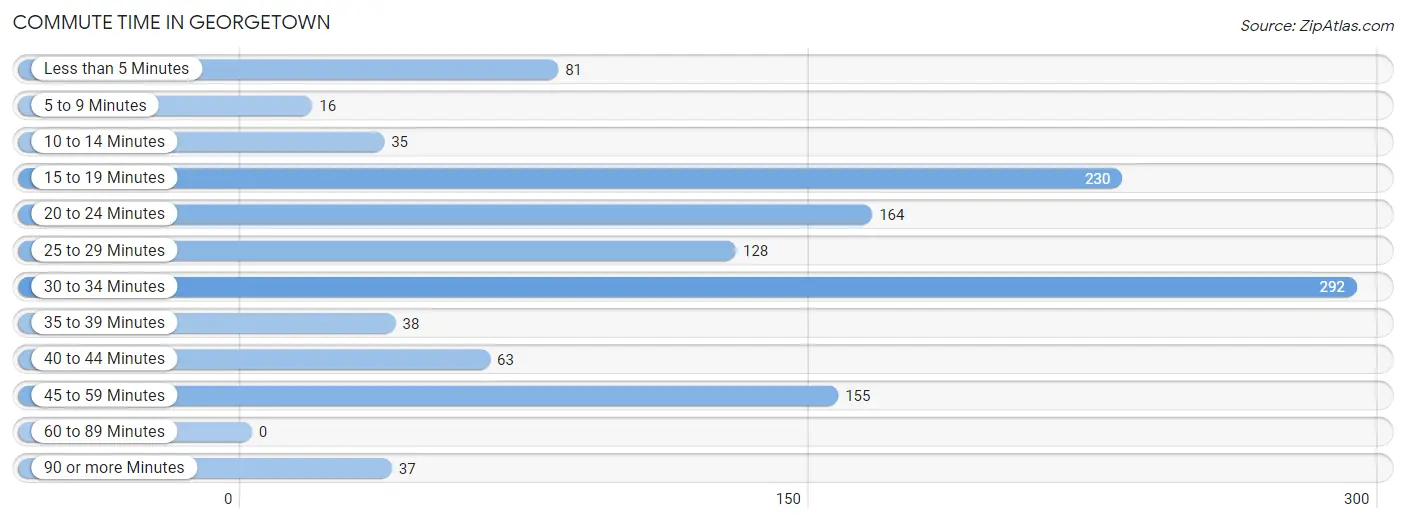
| Commute Time | # Commuters | % Commuters |
| Less than 5 Minutes | 81 | 6.5% |
| 5 to 9 Minutes | 16 | 1.3% |
| 10 to 14 Minutes | 35 | 2.8% |
| 15 to 19 Minutes | 230 | 18.6% |
| 20 to 24 Minutes | 164 | 13.2% |
| 25 to 29 Minutes | 128 | 10.3% |
| 30 to 34 Minutes | 292 | 23.6% |
| 35 to 39 Minutes | 38 | 3.1% |
| 40 to 44 Minutes | 63 | 5.1% |
| 45 to 59 Minutes | 155 | 12.5% |
| 60 to 89 Minutes | 0 | 0.0% |
| 90 or more Minutes | 37 | 3.0% |
Commute Time by Sex in Georgetown
The most common commute times in Georgetown are 30 to 34 minutes (243 commuters, 30.4%) for males and 15 to 19 minutes (81 commuters, 18.4%) for females.
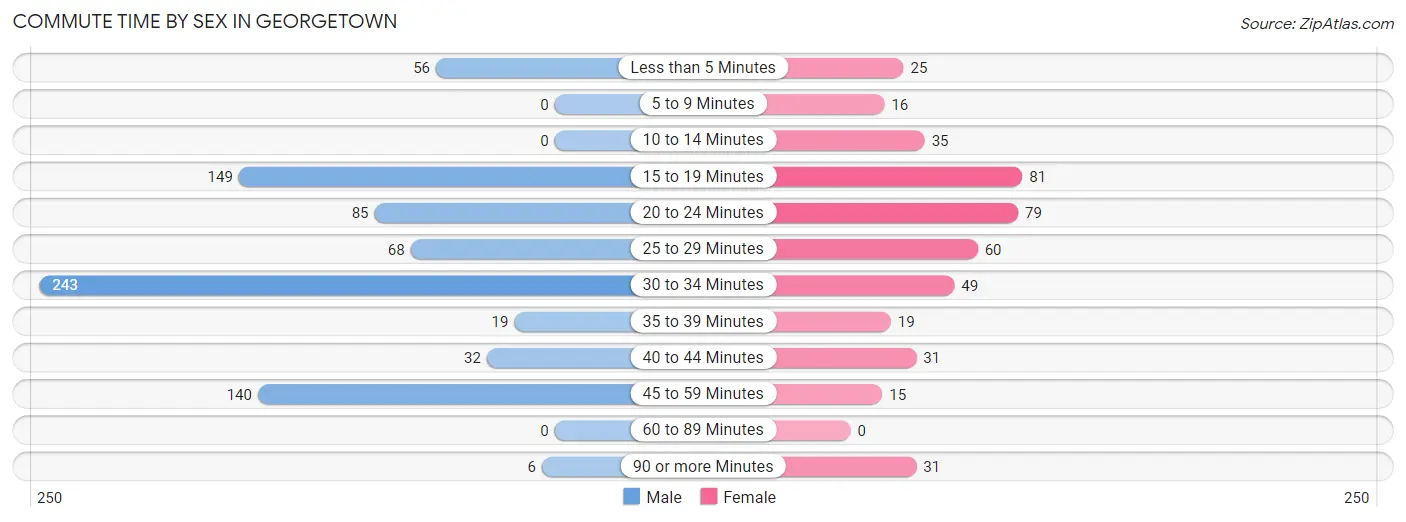
| Commute Time | Male | Female |
| Less than 5 Minutes | 56 (7.0%) | 25 (5.7%) |
| 5 to 9 Minutes | 0 (0.0%) | 16 (3.6%) |
| 10 to 14 Minutes | 0 (0.0%) | 35 (7.9%) |
| 15 to 19 Minutes | 149 (18.7%) | 81 (18.4%) |
| 20 to 24 Minutes | 85 (10.6%) | 79 (17.9%) |
| 25 to 29 Minutes | 68 (8.5%) | 60 (13.6%) |
| 30 to 34 Minutes | 243 (30.4%) | 49 (11.1%) |
| 35 to 39 Minutes | 19 (2.4%) | 19 (4.3%) |
| 40 to 44 Minutes | 32 (4.0%) | 31 (7.0%) |
| 45 to 59 Minutes | 140 (17.5%) | 15 (3.4%) |
| 60 to 89 Minutes | 0 (0.0%) | 0 (0.0%) |
| 90 or more Minutes | 6 (0.7%) | 31 (7.0%) |
Time of Departure to Work by Sex in Georgetown
The most frequent times of departure to work in Georgetown are 12:00 AM to 4:59 AM (152, 19.1%) for males and 7:30 AM to 7:59 AM (107, 24.3%) for females.
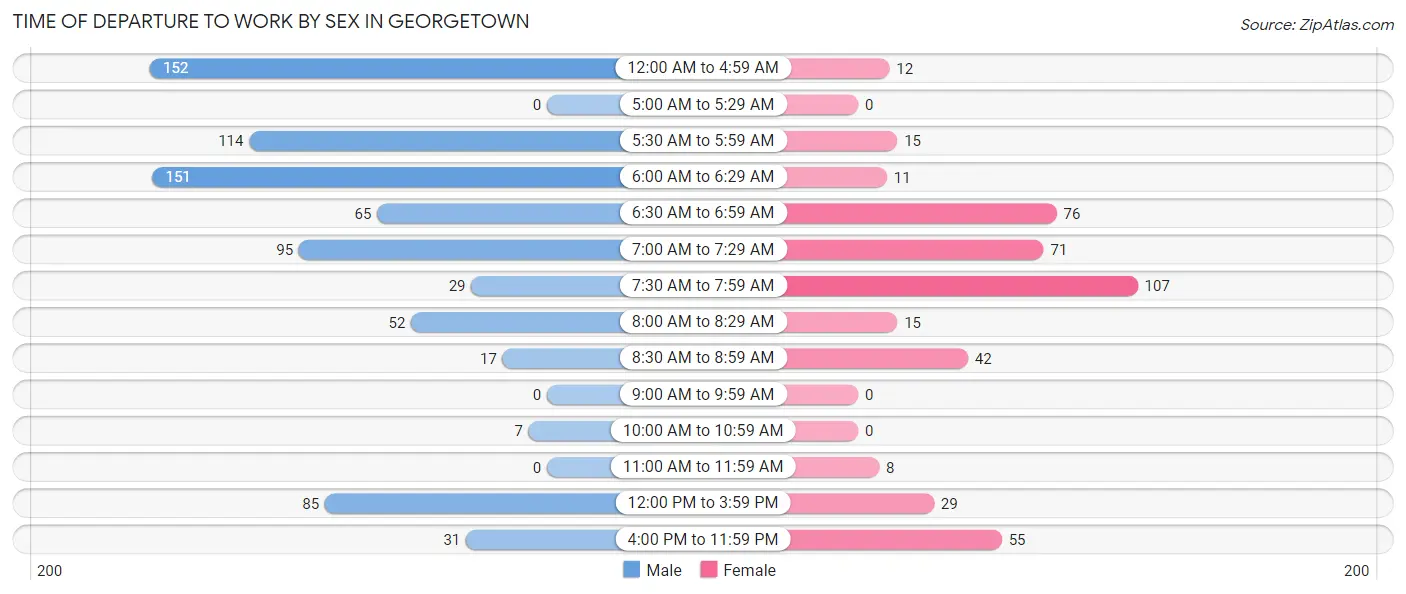
| Time of Departure | Male | Female |
| 12:00 AM to 4:59 AM | 152 (19.1%) | 12 (2.7%) |
| 5:00 AM to 5:29 AM | 0 (0.0%) | 0 (0.0%) |
| 5:30 AM to 5:59 AM | 114 (14.3%) | 15 (3.4%) |
| 6:00 AM to 6:29 AM | 151 (18.9%) | 11 (2.5%) |
| 6:30 AM to 6:59 AM | 65 (8.2%) | 76 (17.2%) |
| 7:00 AM to 7:29 AM | 95 (11.9%) | 71 (16.1%) |
| 7:30 AM to 7:59 AM | 29 (3.6%) | 107 (24.3%) |
| 8:00 AM to 8:29 AM | 52 (6.5%) | 15 (3.4%) |
| 8:30 AM to 8:59 AM | 17 (2.1%) | 42 (9.5%) |
| 9:00 AM to 9:59 AM | 0 (0.0%) | 0 (0.0%) |
| 10:00 AM to 10:59 AM | 7 (0.9%) | 0 (0.0%) |
| 11:00 AM to 11:59 AM | 0 (0.0%) | 8 (1.8%) |
| 12:00 PM to 3:59 PM | 85 (10.6%) | 29 (6.6%) |
| 4:00 PM to 11:59 PM | 31 (3.9%) | 55 (12.5%) |
| Total | 798 (100.0%) | 441 (100.0%) |
Housing Occupancy in Georgetown
Occupancy by Ownership in Georgetown
Of the total 1,382 dwellings in Georgetown, owner-occupied units account for 1,018 (73.7%), while renter-occupied units make up 364 (26.3%).
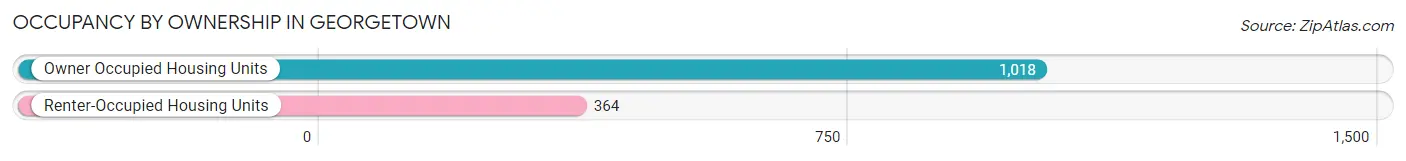
| Occupancy | # Housing Units | % Housing Units |
| Owner Occupied Housing Units | 1,018 | 73.7% |
| Renter-Occupied Housing Units | 364 | 26.3% |
| Total Occupied Housing Units | 1,382 | 100.0% |
Occupancy by Household Size in Georgetown
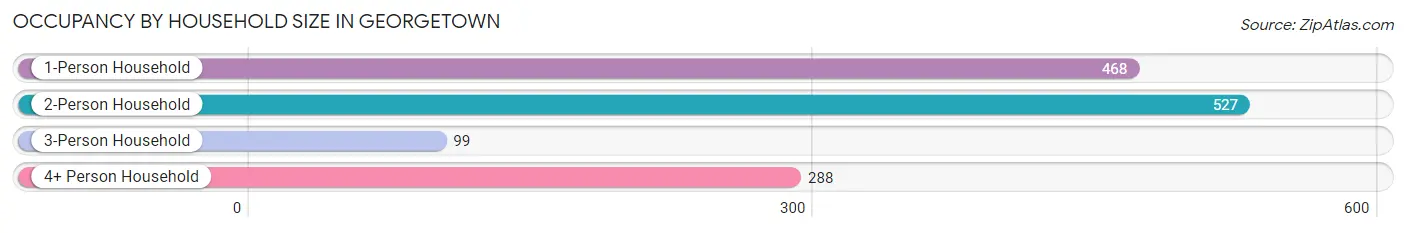
| Household Size | # Housing Units | % Housing Units |
| 1-Person Household | 468 | 33.9% |
| 2-Person Household | 527 | 38.1% |
| 3-Person Household | 99 | 7.2% |
| 4+ Person Household | 288 | 20.8% |
| Total Housing Units | 1,382 | 100.0% |
Occupancy by Ownership by Household Size in Georgetown
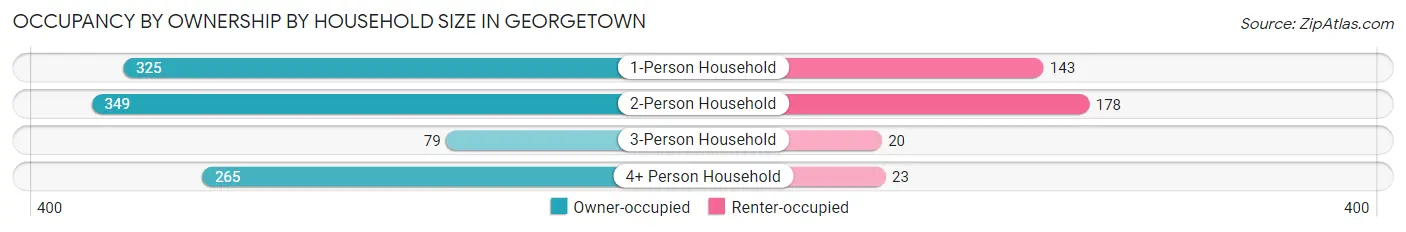
| Household Size | Owner-occupied | Renter-occupied |
| 1-Person Household | 325 (69.4%) | 143 (30.6%) |
| 2-Person Household | 349 (66.2%) | 178 (33.8%) |
| 3-Person Household | 79 (79.8%) | 20 (20.2%) |
| 4+ Person Household | 265 (92.0%) | 23 (8.0%) |
| Total Housing Units | 1,018 (73.7%) | 364 (26.3%) |
Occupancy by Educational Attainment in Georgetown
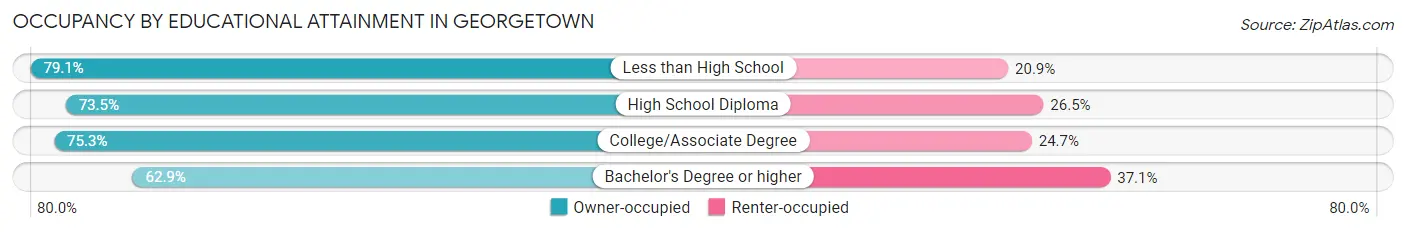
| Household Size | Owner-occupied | Renter-occupied |
| Less than High School | 68 (79.1%) | 18 (20.9%) |
| High School Diploma | 515 (73.5%) | 186 (26.5%) |
| College/Associate Degree | 369 (75.3%) | 121 (24.7%) |
| Bachelor's Degree or higher | 66 (62.9%) | 39 (37.1%) |
Occupancy by Age of Householder in Georgetown
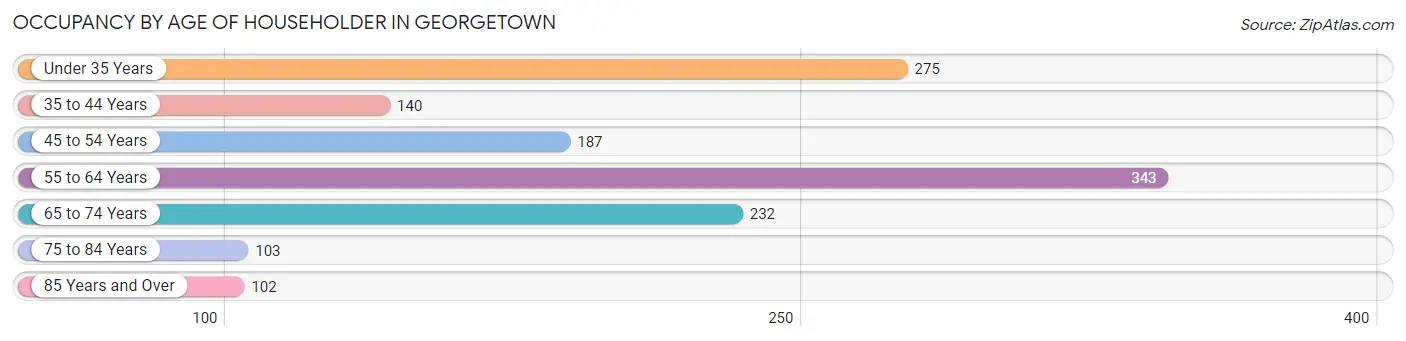
| Age Bracket | # Households | % Households |
| Under 35 Years | 275 | 19.9% |
| 35 to 44 Years | 140 | 10.1% |
| 45 to 54 Years | 187 | 13.5% |
| 55 to 64 Years | 343 | 24.8% |
| 65 to 74 Years | 232 | 16.8% |
| 75 to 84 Years | 103 | 7.4% |
| 85 Years and Over | 102 | 7.4% |
| Total | 1,382 | 100.0% |
Housing Finances in Georgetown
Median Income by Occupancy in Georgetown
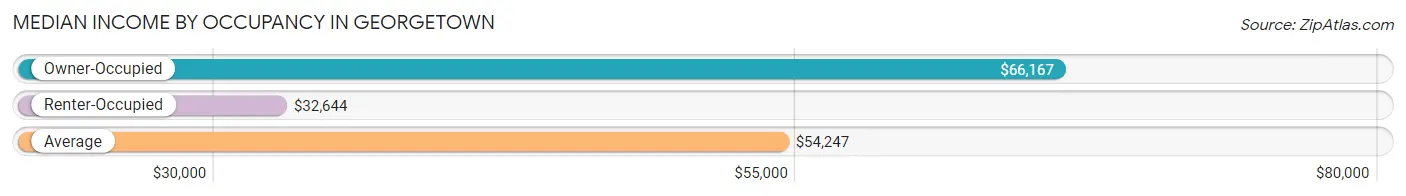
| Occupancy Type | # Households | Median Income |
| Owner-Occupied | 1,018 (73.7%) | $66,167 |
| Renter-Occupied | 364 (26.3%) | $32,644 |
| Average | 1,382 (100.0%) | $54,247 |
Occupancy by Householder Income Bracket in Georgetown
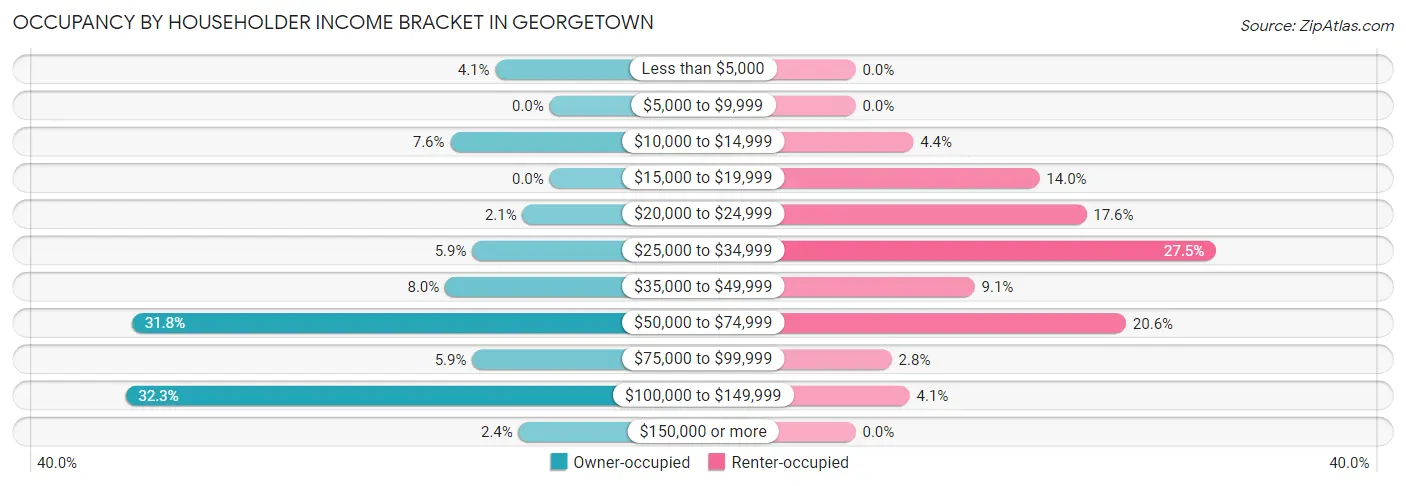
| Income Bracket | Owner-occupied | Renter-occupied |
| Less than $5,000 | 42 (4.1%) | 0 (0.0%) |
| $5,000 to $9,999 | 0 (0.0%) | 0 (0.0%) |
| $10,000 to $14,999 | 77 (7.6%) | 16 (4.4%) |
| $15,000 to $19,999 | 0 (0.0%) | 51 (14.0%) |
| $20,000 to $24,999 | 21 (2.1%) | 64 (17.6%) |
| $25,000 to $34,999 | 60 (5.9%) | 100 (27.5%) |
| $35,000 to $49,999 | 81 (8.0%) | 33 (9.1%) |
| $50,000 to $74,999 | 324 (31.8%) | 75 (20.6%) |
| $75,000 to $99,999 | 60 (5.9%) | 10 (2.8%) |
| $100,000 to $149,999 | 329 (32.3%) | 15 (4.1%) |
| $150,000 or more | 24 (2.4%) | 0 (0.0%) |
| Total | 1,018 (100.0%) | 364 (100.0%) |
Monthly Housing Cost Tiers in Georgetown
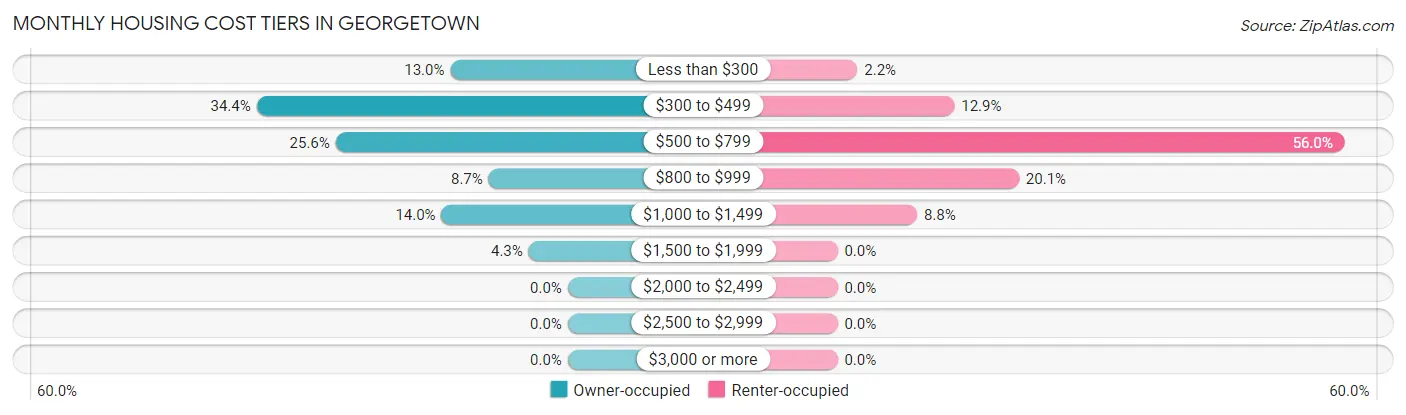
| Monthly Cost | Owner-occupied | Renter-occupied |
| Less than $300 | 132 (13.0%) | 8 (2.2%) |
| $300 to $499 | 350 (34.4%) | 47 (12.9%) |
| $500 to $799 | 261 (25.6%) | 204 (56.0%) |
| $800 to $999 | 89 (8.7%) | 73 (20.1%) |
| $1,000 to $1,499 | 142 (14.0%) | 32 (8.8%) |
| $1,500 to $1,999 | 44 (4.3%) | 0 (0.0%) |
| $2,000 to $2,499 | 0 (0.0%) | 0 (0.0%) |
| $2,500 to $2,999 | 0 (0.0%) | 0 (0.0%) |
| $3,000 or more | 0 (0.0%) | 0 (0.0%) |
| Total | 1,018 (100.0%) | 364 (100.0%) |
Physical Housing Characteristics in Georgetown
Housing Structures in Georgetown
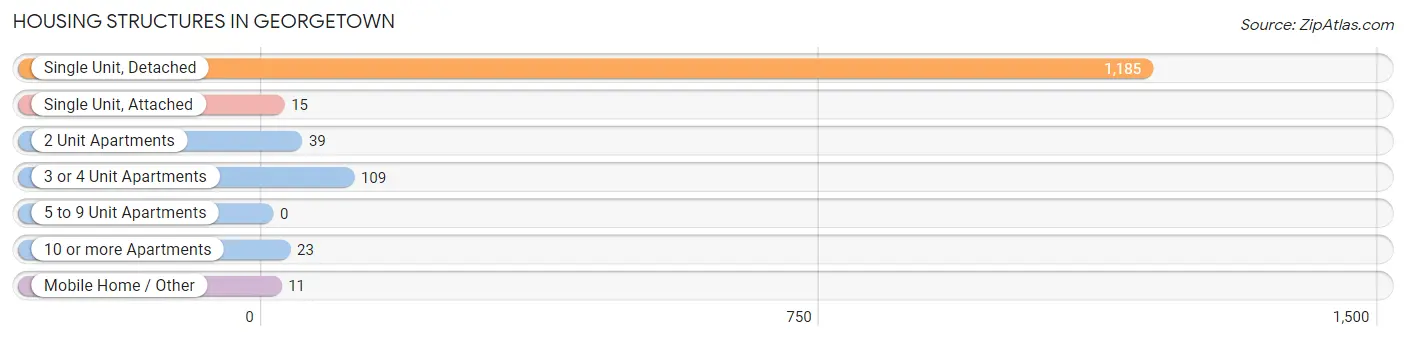
| Structure Type | # Housing Units | % Housing Units |
| Single Unit, Detached | 1,185 | 85.8% |
| Single Unit, Attached | 15 | 1.1% |
| 2 Unit Apartments | 39 | 2.8% |
| 3 or 4 Unit Apartments | 109 | 7.9% |
| 5 to 9 Unit Apartments | 0 | 0.0% |
| 10 or more Apartments | 23 | 1.7% |
| Mobile Home / Other | 11 | 0.8% |
| Total | 1,382 | 100.0% |
Housing Structures by Occupancy in Georgetown
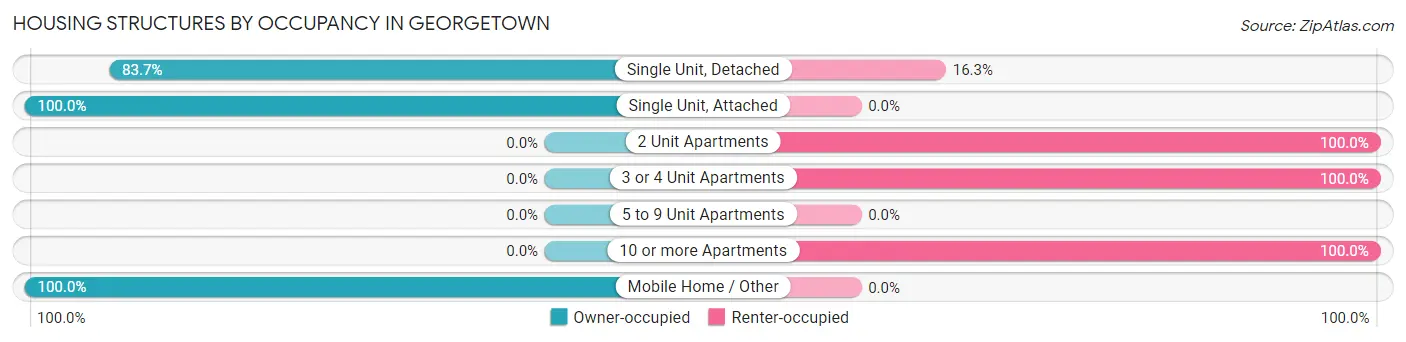
| Structure Type | Owner-occupied | Renter-occupied |
| Single Unit, Detached | 992 (83.7%) | 193 (16.3%) |
| Single Unit, Attached | 15 (100.0%) | 0 (0.0%) |
| 2 Unit Apartments | 0 (0.0%) | 39 (100.0%) |
| 3 or 4 Unit Apartments | 0 (0.0%) | 109 (100.0%) |
| 5 to 9 Unit Apartments | 0 (0.0%) | 0 (0.0%) |
| 10 or more Apartments | 0 (0.0%) | 23 (100.0%) |
| Mobile Home / Other | 11 (100.0%) | 0 (0.0%) |
| Total | 1,018 (73.7%) | 364 (26.3%) |
Housing Structures by Number of Rooms in Georgetown
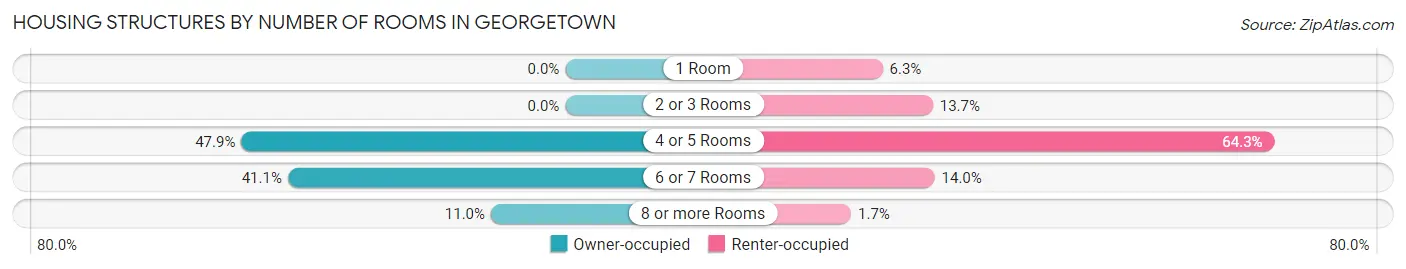
| Number of Rooms | Owner-occupied | Renter-occupied |
| 1 Room | 0 (0.0%) | 23 (6.3%) |
| 2 or 3 Rooms | 0 (0.0%) | 50 (13.7%) |
| 4 or 5 Rooms | 488 (47.9%) | 234 (64.3%) |
| 6 or 7 Rooms | 418 (41.1%) | 51 (14.0%) |
| 8 or more Rooms | 112 (11.0%) | 6 (1.7%) |
| Total | 1,018 (100.0%) | 364 (100.0%) |
Housing Structure by Heating Type in Georgetown
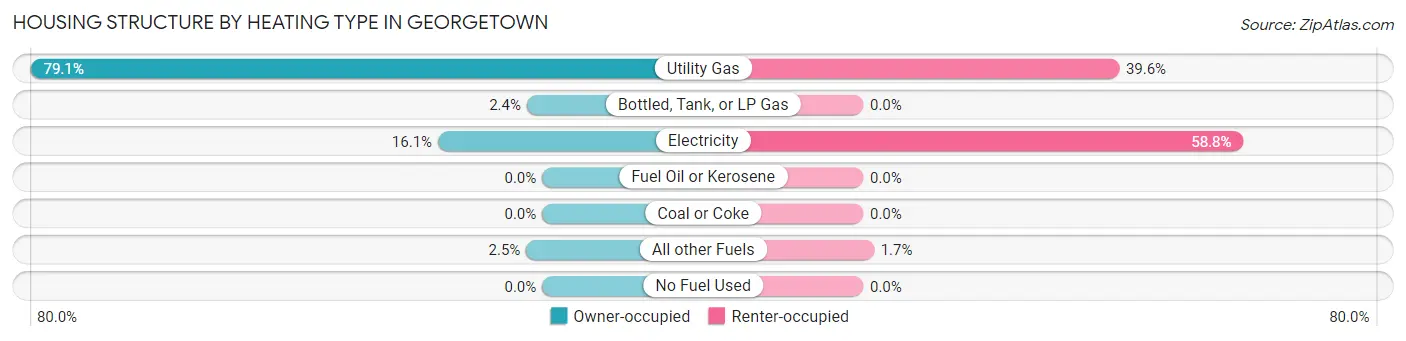
| Heating Type | Owner-occupied | Renter-occupied |
| Utility Gas | 805 (79.1%) | 144 (39.6%) |
| Bottled, Tank, or LP Gas | 24 (2.4%) | 0 (0.0%) |
| Electricity | 164 (16.1%) | 214 (58.8%) |
| Fuel Oil or Kerosene | 0 (0.0%) | 0 (0.0%) |
| Coal or Coke | 0 (0.0%) | 0 (0.0%) |
| All other Fuels | 25 (2.5%) | 6 (1.7%) |
| No Fuel Used | 0 (0.0%) | 0 (0.0%) |
| Total | 1,018 (100.0%) | 364 (100.0%) |
Household Vehicle Usage in Georgetown
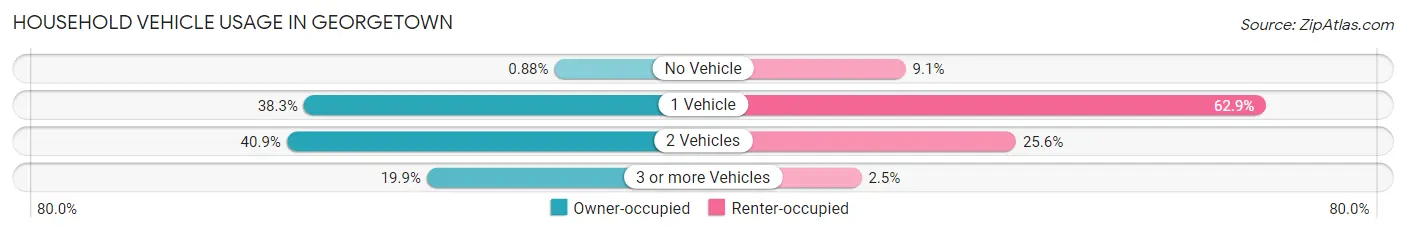
| Vehicles per Household | Owner-occupied | Renter-occupied |
| No Vehicle | 9 (0.9%) | 33 (9.1%) |
| 1 Vehicle | 390 (38.3%) | 229 (62.9%) |
| 2 Vehicles | 416 (40.9%) | 93 (25.6%) |
| 3 or more Vehicles | 203 (19.9%) | 9 (2.5%) |
| Total | 1,018 (100.0%) | 364 (100.0%) |
Real Estate & Mortgages in Georgetown
Real Estate and Mortgage Overview in Georgetown
| Characteristic | Without Mortgage | With Mortgage |
| Housing Units | 646 | 372 |
| Median Property Value | $68,100 | $70,900 |
| Median Household Income | $67,167 | $9 |
| Monthly Housing Costs | $394 | $0 |
| Real Estate Taxes | $1,078 | $16 |
Property Value by Mortgage Status in Georgetown
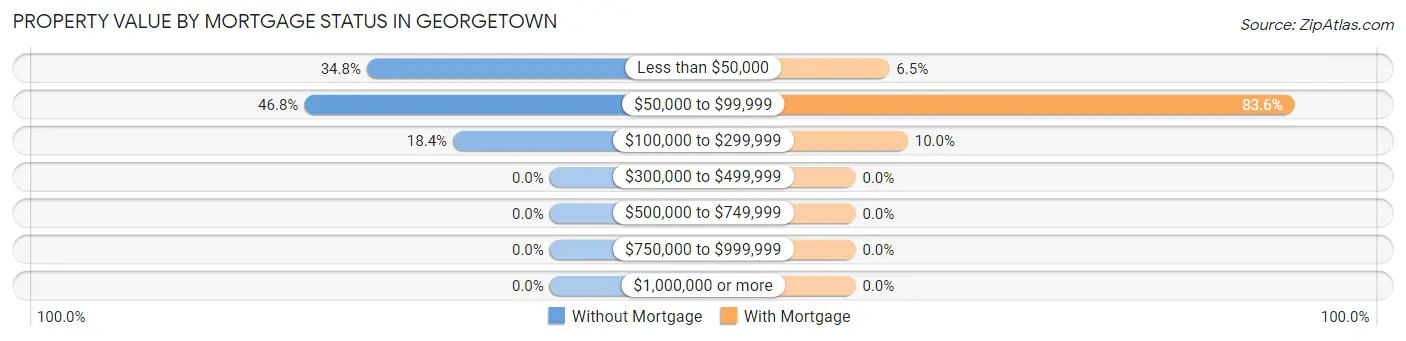
| Property Value | Without Mortgage | With Mortgage |
| Less than $50,000 | 225 (34.8%) | 24 (6.5%) |
| $50,000 to $99,999 | 302 (46.8%) | 311 (83.6%) |
| $100,000 to $299,999 | 119 (18.4%) | 37 (10.0%) |
| $300,000 to $499,999 | 0 (0.0%) | 0 (0.0%) |
| $500,000 to $749,999 | 0 (0.0%) | 0 (0.0%) |
| $750,000 to $999,999 | 0 (0.0%) | 0 (0.0%) |
| $1,000,000 or more | 0 (0.0%) | 0 (0.0%) |
| Total | 646 (100.0%) | 372 (100.0%) |
Household Income by Mortgage Status in Georgetown
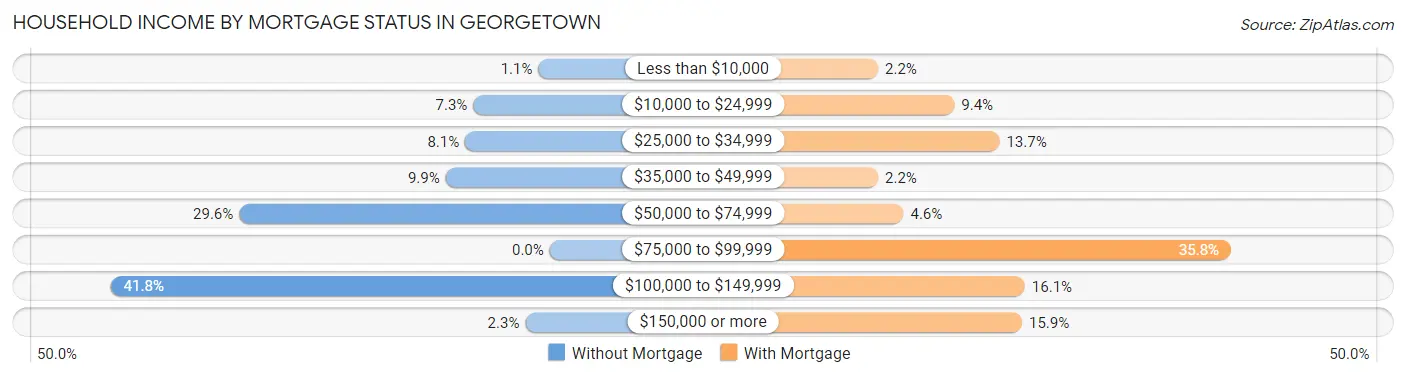
| Household Income | Without Mortgage | With Mortgage |
| Less than $10,000 | 7 (1.1%) | 8 (2.1%) |
| $10,000 to $24,999 | 47 (7.3%) | 35 (9.4%) |
| $25,000 to $34,999 | 52 (8.1%) | 51 (13.7%) |
| $35,000 to $49,999 | 64 (9.9%) | 8 (2.1%) |
| $50,000 to $74,999 | 191 (29.6%) | 17 (4.6%) |
| $75,000 to $99,999 | 0 (0.0%) | 133 (35.7%) |
| $100,000 to $149,999 | 270 (41.8%) | 60 (16.1%) |
| $150,000 or more | 15 (2.3%) | 59 (15.9%) |
| Total | 646 (100.0%) | 372 (100.0%) |
Property Value to Household Income Ratio in Georgetown
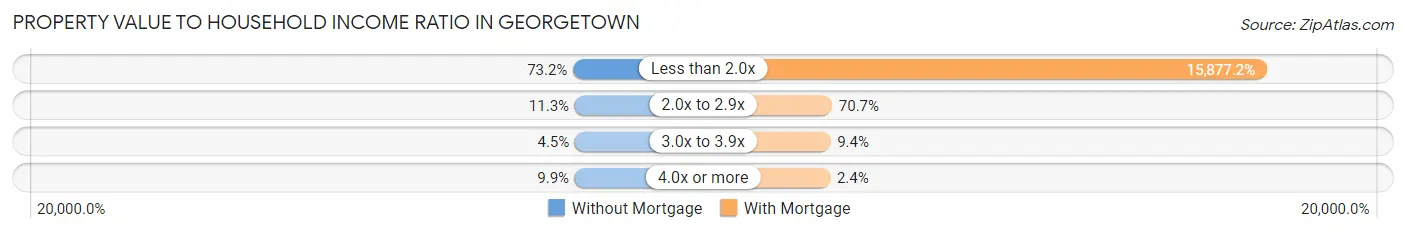
| Value-to-Income Ratio | Without Mortgage | With Mortgage |
| Less than 2.0x | 473 (73.2%) | 59,063 (15,877.2%) |
| 2.0x to 2.9x | 73 (11.3%) | 263 (70.7%) |
| 3.0x to 3.9x | 29 (4.5%) | 35 (9.4%) |
| 4.0x or more | 64 (9.9%) | 9 (2.4%) |
| Total | 646 (100.0%) | 372 (100.0%) |
Real Estate Taxes by Mortgage Status in Georgetown
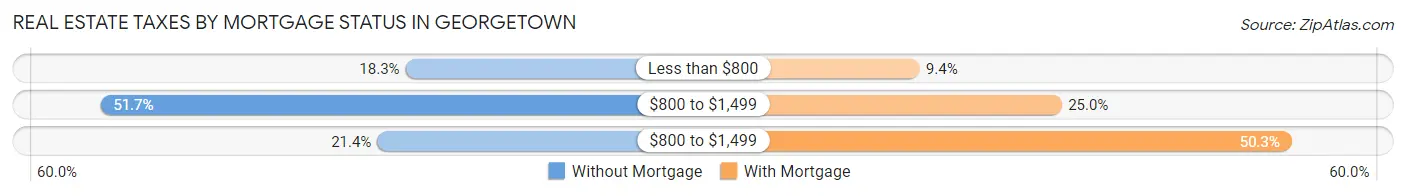
| Property Taxes | Without Mortgage | With Mortgage |
| Less than $800 | 118 (18.3%) | 35 (9.4%) |
| $800 to $1,499 | 334 (51.7%) | 93 (25.0%) |
| $800 to $1,499 | 138 (21.4%) | 187 (50.3%) |
| Total | 646 (100.0%) | 372 (100.0%) |
Health & Disability in Georgetown
Health Insurance Coverage by Age in Georgetown
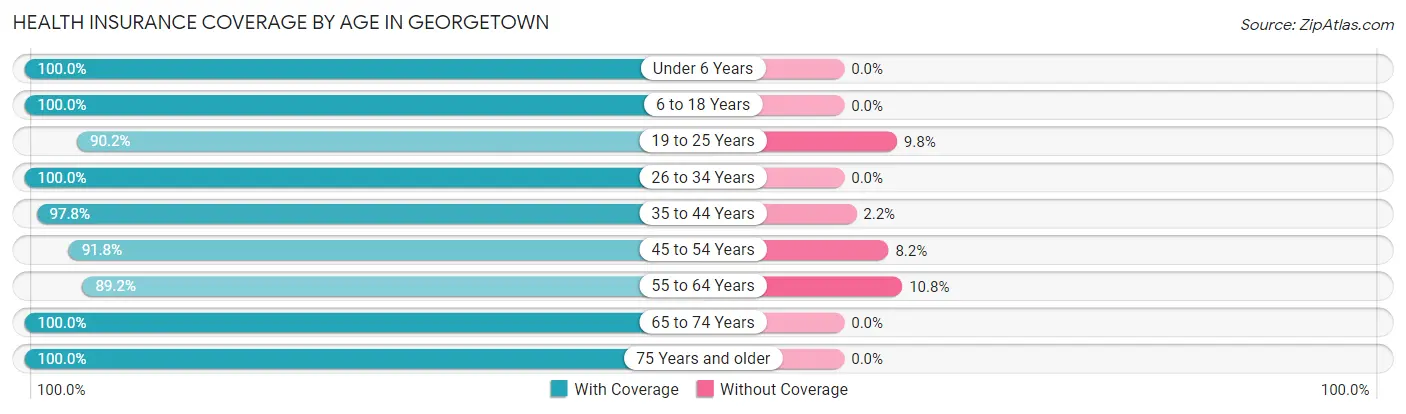
| Age Bracket | With Coverage | Without Coverage |
| Under 6 Years | 169 (100.0%) | 0 (0.0%) |
| 6 to 18 Years | 461 (100.0%) | 0 (0.0%) |
| 19 to 25 Years | 285 (90.2%) | 31 (9.8%) |
| 26 to 34 Years | 364 (100.0%) | 0 (0.0%) |
| 35 to 44 Years | 392 (97.8%) | 9 (2.2%) |
| 45 to 54 Years | 234 (91.8%) | 21 (8.2%) |
| 55 to 64 Years | 471 (89.2%) | 57 (10.8%) |
| 65 to 74 Years | 336 (100.0%) | 0 (0.0%) |
| 75 Years and older | 314 (100.0%) | 0 (0.0%) |
| Total | 3,026 (96.3%) | 118 (3.7%) |
Health Insurance Coverage by Citizenship Status in Georgetown
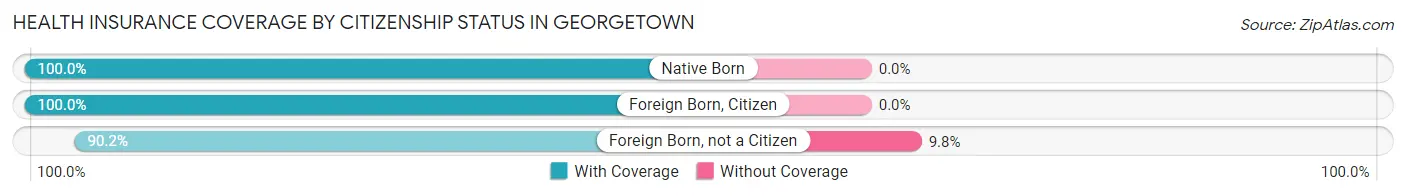
| Citizenship Status | With Coverage | Without Coverage |
| Native Born | 169 (100.0%) | 0 (0.0%) |
| Foreign Born, Citizen | 461 (100.0%) | 0 (0.0%) |
| Foreign Born, not a Citizen | 285 (90.2%) | 31 (9.8%) |
Health Insurance Coverage by Household Income in Georgetown
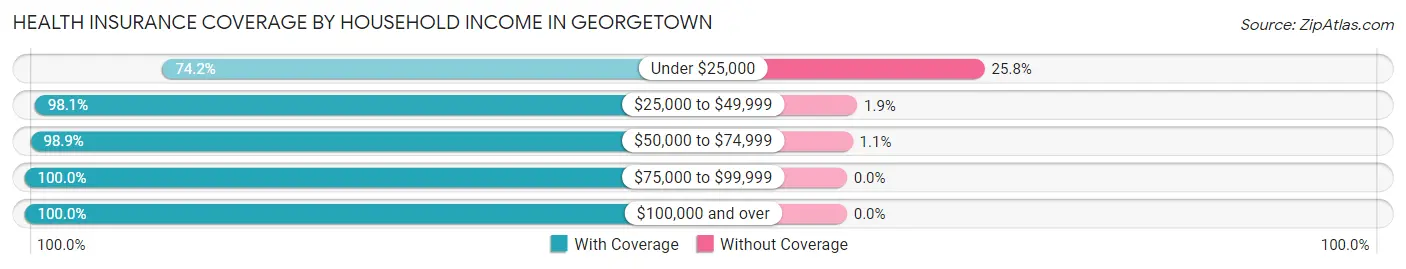
| Household Income | With Coverage | Without Coverage |
| Under $25,000 | 290 (74.2%) | 101 (25.8%) |
| $25,000 to $49,999 | 406 (98.1%) | 8 (1.9%) |
| $50,000 to $74,999 | 809 (98.9%) | 9 (1.1%) |
| $75,000 to $99,999 | 221 (100.0%) | 0 (0.0%) |
| $100,000 and over | 1,300 (100.0%) | 0 (0.0%) |
Public vs Private Health Insurance Coverage by Age in Georgetown
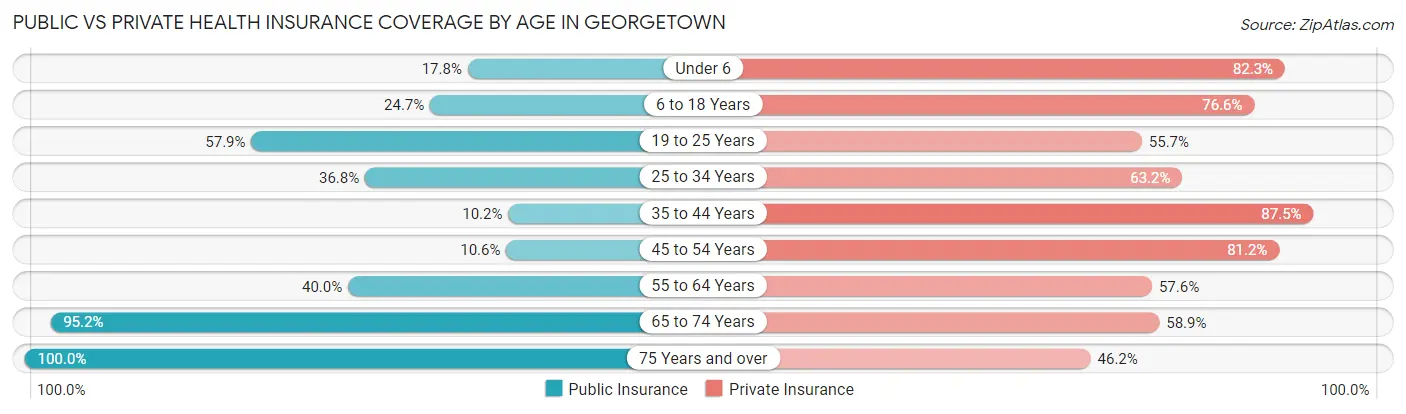
| Age Bracket | Public Insurance | Private Insurance |
| Under 6 | 30 (17.7%) | 139 (82.3%) |
| 6 to 18 Years | 114 (24.7%) | 353 (76.6%) |
| 19 to 25 Years | 183 (57.9%) | 176 (55.7%) |
| 25 to 34 Years | 134 (36.8%) | 230 (63.2%) |
| 35 to 44 Years | 41 (10.2%) | 351 (87.5%) |
| 45 to 54 Years | 27 (10.6%) | 207 (81.2%) |
| 55 to 64 Years | 211 (40.0%) | 304 (57.6%) |
| 65 to 74 Years | 320 (95.2%) | 198 (58.9%) |
| 75 Years and over | 314 (100.0%) | 145 (46.2%) |
| Total | 1,374 (43.7%) | 2,103 (66.9%) |
Disability Status by Sex by Age in Georgetown
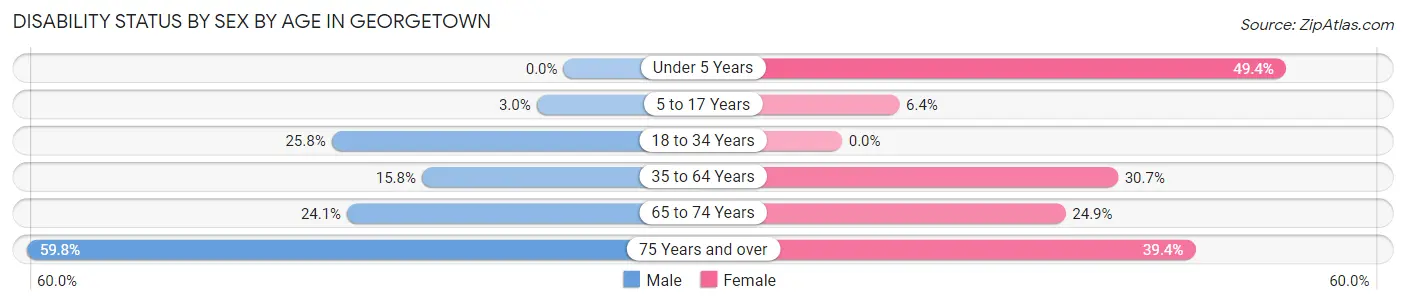
| Age Bracket | Male | Female |
| Under 5 Years | 0 (0.0%) | 43 (49.4%) |
| 5 to 17 Years | 7 (3.0%) | 15 (6.4%) |
| 18 to 34 Years | 95 (25.8%) | 0 (0.0%) |
| 35 to 64 Years | 120 (15.8%) | 130 (30.7%) |
| 65 to 74 Years | 20 (24.1%) | 63 (24.9%) |
| 75 Years and over | 95 (59.8%) | 61 (39.4%) |
Disability Class by Sex by Age in Georgetown
Disability Class: Hearing Difficulty
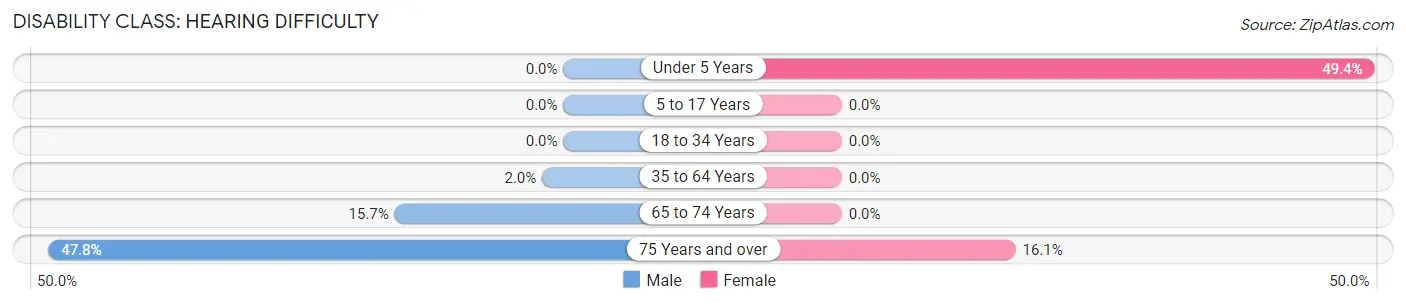
| Age Bracket | Male | Female |
| Under 5 Years | 0 (0.0%) | 43 (49.4%) |
| 5 to 17 Years | 0 (0.0%) | 0 (0.0%) |
| 18 to 34 Years | 0 (0.0%) | 0 (0.0%) |
| 35 to 64 Years | 15 (2.0%) | 0 (0.0%) |
| 65 to 74 Years | 13 (15.7%) | 0 (0.0%) |
| 75 Years and over | 76 (47.8%) | 25 (16.1%) |
Disability Class: Vision Difficulty
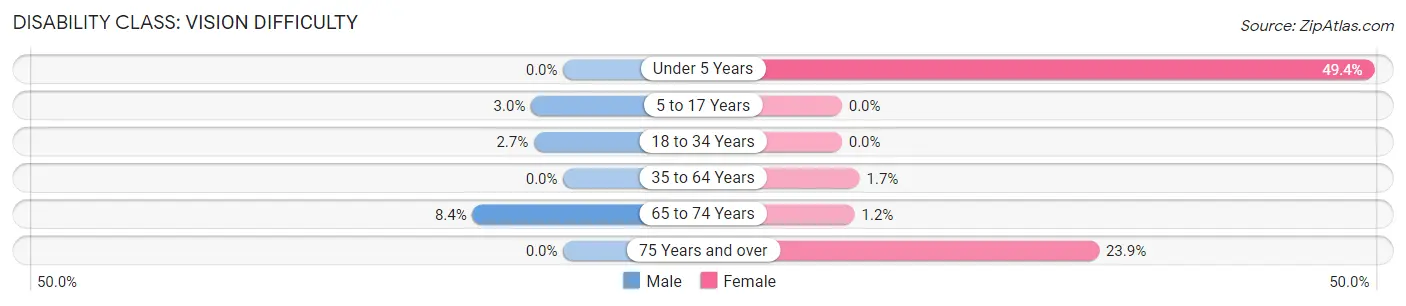
| Age Bracket | Male | Female |
| Under 5 Years | 0 (0.0%) | 43 (49.4%) |
| 5 to 17 Years | 7 (3.0%) | 0 (0.0%) |
| 18 to 34 Years | 10 (2.7%) | 0 (0.0%) |
| 35 to 64 Years | 0 (0.0%) | 7 (1.7%) |
| 65 to 74 Years | 7 (8.4%) | 3 (1.2%) |
| 75 Years and over | 0 (0.0%) | 37 (23.9%) |
Disability Class: Cognitive Difficulty
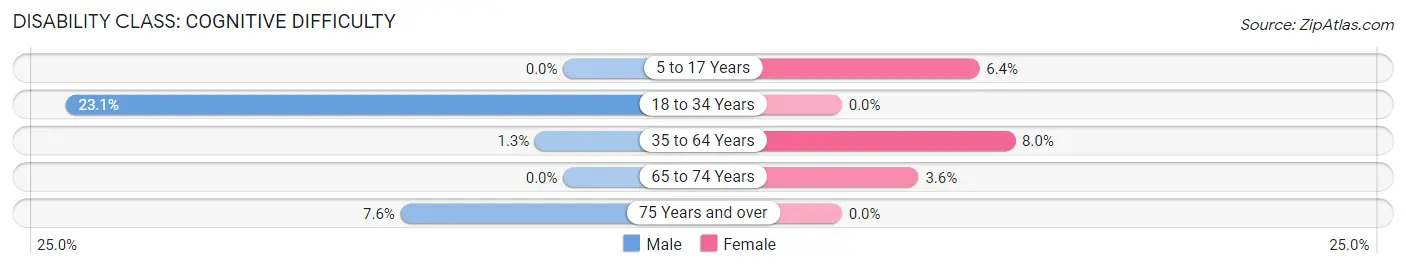
| Age Bracket | Male | Female |
| 5 to 17 Years | 0 (0.0%) | 15 (6.4%) |
| 18 to 34 Years | 85 (23.1%) | 0 (0.0%) |
| 35 to 64 Years | 10 (1.3%) | 34 (8.0%) |
| 65 to 74 Years | 0 (0.0%) | 9 (3.6%) |
| 75 Years and over | 12 (7.5%) | 0 (0.0%) |
Disability Class: Ambulatory Difficulty
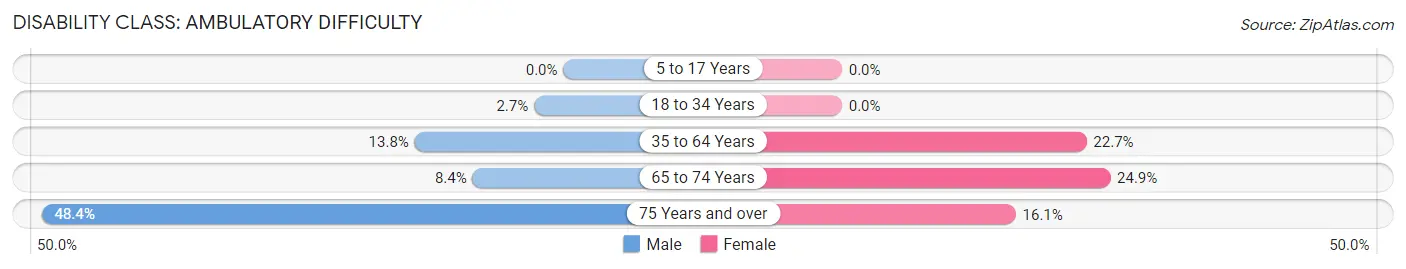
| Age Bracket | Male | Female |
| 5 to 17 Years | 0 (0.0%) | 0 (0.0%) |
| 18 to 34 Years | 10 (2.7%) | 0 (0.0%) |
| 35 to 64 Years | 105 (13.8%) | 96 (22.7%) |
| 65 to 74 Years | 7 (8.4%) | 63 (24.9%) |
| 75 Years and over | 77 (48.4%) | 25 (16.1%) |
Disability Class: Self-Care Difficulty
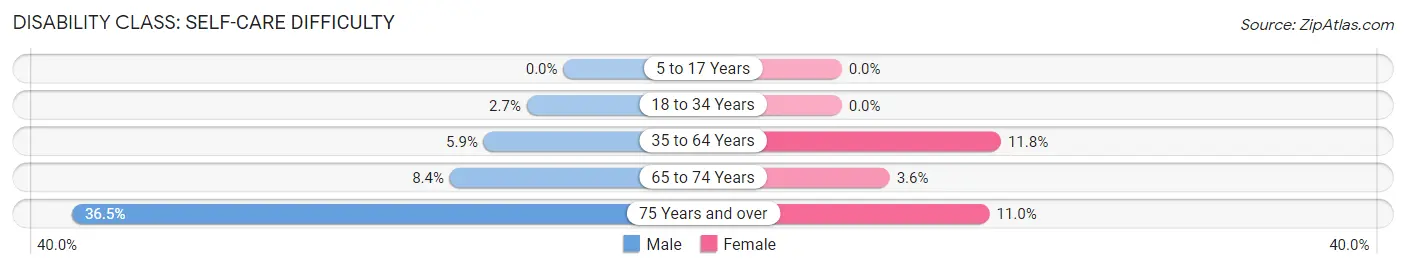
| Age Bracket | Male | Female |
| 5 to 17 Years | 0 (0.0%) | 0 (0.0%) |
| 18 to 34 Years | 10 (2.7%) | 0 (0.0%) |
| 35 to 64 Years | 45 (5.9%) | 50 (11.8%) |
| 65 to 74 Years | 7 (8.4%) | 9 (3.6%) |
| 75 Years and over | 58 (36.5%) | 17 (11.0%) |
Technology Access in Georgetown
Computing Device Access in Georgetown
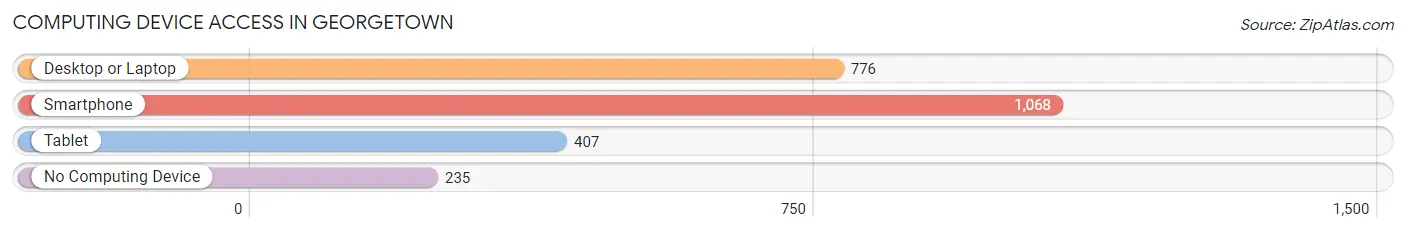
| Device Type | # Households | % Households |
| Desktop or Laptop | 776 | 56.1% |
| Smartphone | 1,068 | 77.3% |
| Tablet | 407 | 29.4% |
| No Computing Device | 235 | 17.0% |
| Total | 1,382 | 100.0% |
Internet Access in Georgetown
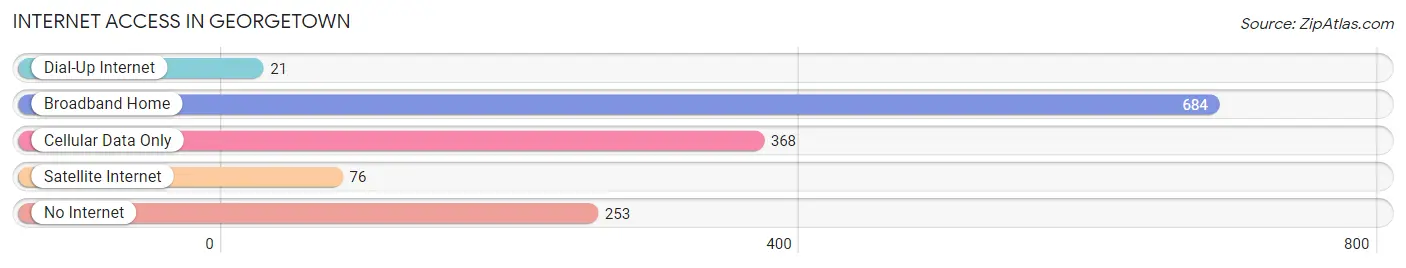
| Internet Type | # Households | % Households |
| Dial-Up Internet | 21 | 1.5% |
| Broadband Home | 684 | 49.5% |
| Cellular Data Only | 368 | 26.6% |
| Satellite Internet | 76 | 5.5% |
| No Internet | 253 | 18.3% |
| Total | 1,382 | 100.0% |
Georgetown Summary
Georgetown is a small village located in Vermilion County, Illinois, United States. The population was 1,919 at the 2010 census. It is part of the Danville, Illinois Metropolitan Statistical Area.
History
Georgetown was founded in 1837 by William and Mary Ann (Henderson) Smith. The Smiths had moved to the area from Kentucky and named the village after their hometown of Georgetown, Kentucky. The village was incorporated in 1867.
Georgetown was a major stop on the Illinois Central Railroad, which ran through the village from 1854 to 1971. The railroad was a major factor in the growth of the village, as it allowed for the transportation of goods and people.
Geography
Georgetown is located at 40°20'25" North, 87°45'25" West (40.340278, -87.756944). According to the 2010 census, the village has a total area of 1.02 square miles (2.64 km2), all land.
Economy
Georgetown's economy is largely based on agriculture. The village is home to several grain elevators, as well as a number of small businesses. The village is also home to a number of manufacturing companies, including a plastics plant and a metal fabrication plant.
Demographics
As of the census of 2000, there were 1,919 people, 745 households, and 517 families residing in the village. The population density was 1,890.2 people per square mile (728.2/km2). There were 790 housing units at an average density of 772.3 per square mile (297.7/km2). The racial makeup of the village was 98.44% White, 0.21% African American, 0.05% Native American, 0.21% Asian, 0.05% Pacific Islander, 0.21% from other races, and 0.84% from two or more races. Hispanic or Latino of any race were 0.47% of the population.
There were 745 households, out of which 33.2% had children under the age of 18 living with them, 54.2% were married couples living together, 10.3% had a female householder with no husband present, and 31.2% were non-families. 27.2% of all households were made up of individuals, and 14.2% had someone living alone who was 65 years of age or older. The average household size was 2.56 and the average family size was 3.12.
In the village, the population was spread out, with 27.2% under the age of 18, 8.2% from 18 to 24, 28.2% from 25 to 44, 21.2% from 45 to 64, and 15.2% who were 65 years of age or older. The median age was 36 years. For every 100 females, there were 92.2 males. For every 100 females age 18 and over, there were 87.2 males.
The median income for a household in the village was $37,500, and the median income for a family was $45,000. Males had a median income of $31,250 versus $21,250 for females. The per capita income for the village was $17,845. About 5.2% of families and 7.2% of the population were below the poverty line, including 8.2% of those under age 18 and 8.2% of those age 65 or over.
Common Questions
What is Per Capita Income in Georgetown?
Per Capita income in Georgetown is $29,340.
What is the Median Family Income in Georgetown?
Median Family Income in Georgetown is $69,958.
What is the Median Household income in Georgetown?
Median Household Income in Georgetown is $54,247.
What is Income or Wage Gap in Georgetown?
Income or Wage Gap in Georgetown is 34.1%.
Women in Georgetown earn 65.9 cents for every dollar earned by a man.
What is Inequality or Gini Index in Georgetown?
Inequality or Gini Index in Georgetown is 0.36.
What is the Total Population of Georgetown?
Total Population of Georgetown is 3,144.
What is the Total Male Population of Georgetown?
Total Male Population of Georgetown is 1,657.
What is the Total Female Population of Georgetown?
Total Female Population of Georgetown is 1,487.
What is the Ratio of Males per 100 Females in Georgetown?
There are 111.43 Males per 100 Females in Georgetown.
What is the Ratio of Females per 100 Males in Georgetown?
There are 89.74 Females per 100 Males in Georgetown.
What is the Median Population Age in Georgetown?
Median Population Age in Georgetown is 41.5 Years.
What is the Average Family Size in Georgetown
Average Family Size in Georgetown is 3.0 People.
What is the Average Household Size in Georgetown
Average Household Size in Georgetown is 2.3 People.
How Large is the Labor Force in Georgetown?
There are 1,577 People in the Labor Forcein in Georgetown.
What is the Percentage of People in the Labor Force in Georgetown?
61.0% of People are in the Labor Force in Georgetown.
What is the Unemployment Rate in Georgetown?
Unemployment Rate in Georgetown is 6.8%.