Noble, IL Map & Demographics
Noble Map
Noble Overview
$22,621
PER CAPITA INCOME
$59,063
AVG FAMILY INCOME
$42,875
AVG HOUSEHOLD INCOME
52.9%
WAGE / INCOME GAP [ % ]
47.1¢/ $1
WAGE / INCOME GAP [ $ ]
0.42
INEQUALITY / GINI INDEX
649
TOTAL POPULATION
318
MALE POPULATION
331
FEMALE POPULATION
96.07
MALES / 100 FEMALES
104.09
FEMALES / 100 MALES
38.0
MEDIAN AGE
3.0
AVG FAMILY SIZE
2.2
AVG HOUSEHOLD SIZE
277
LABOR FORCE [ PEOPLE ]
51.6%
PERCENT IN LABOR FORCE
8.3%
UNEMPLOYMENT RATE
Noble Zip Codes
Noble Area Codes
Income in Noble
Income Overview in Noble
Per Capita Income in Noble is $22,621, while median incomes of families and households are $59,063 and $42,875 respectively.
| Characteristic | Number | Measure |
| Per Capita Income | 649 | $22,621 |
| Median Family Income | 161 | $59,063 |
| Mean Family Income | 161 | $62,350 |
| Median Household Income | 289 | $42,875 |
| Mean Household Income | 289 | $50,849 |
| Income Deficit | 161 | $0 |
| Wage / Income Gap (%) | 649 | 52.91% |
| Wage / Income Gap ($) | 649 | 47.09¢ per $1 |
| Gini / Inequality Index | 649 | 0.42 |
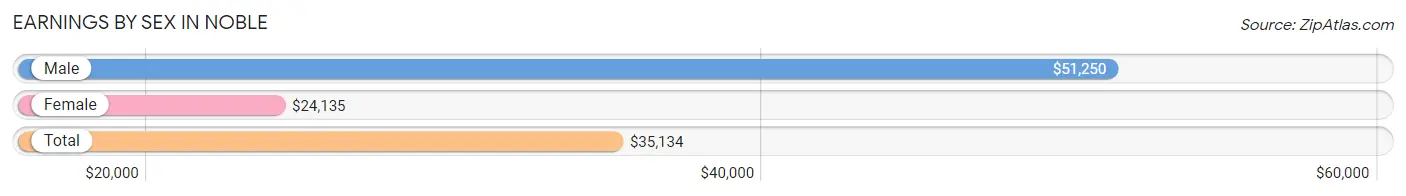
Earnings by Sex in Noble
Average Earnings in Noble are $35,134, $51,250 for men and $24,135 for women, a difference of 52.9%.
| Sex | Number | Average Earnings |
| Male | 130 (48.3%) | $51,250 |
| Female | 139 (51.7%) | $24,135 |
| Total | 269 (100.0%) | $35,134 |
Earnings by Sex by Income Bracket in Noble
The most common earnings brackets in Noble are $55,000 to $64,999 for men (38 | 29.2%) and $5,000 to $7,499 for women (16 | 11.5%).
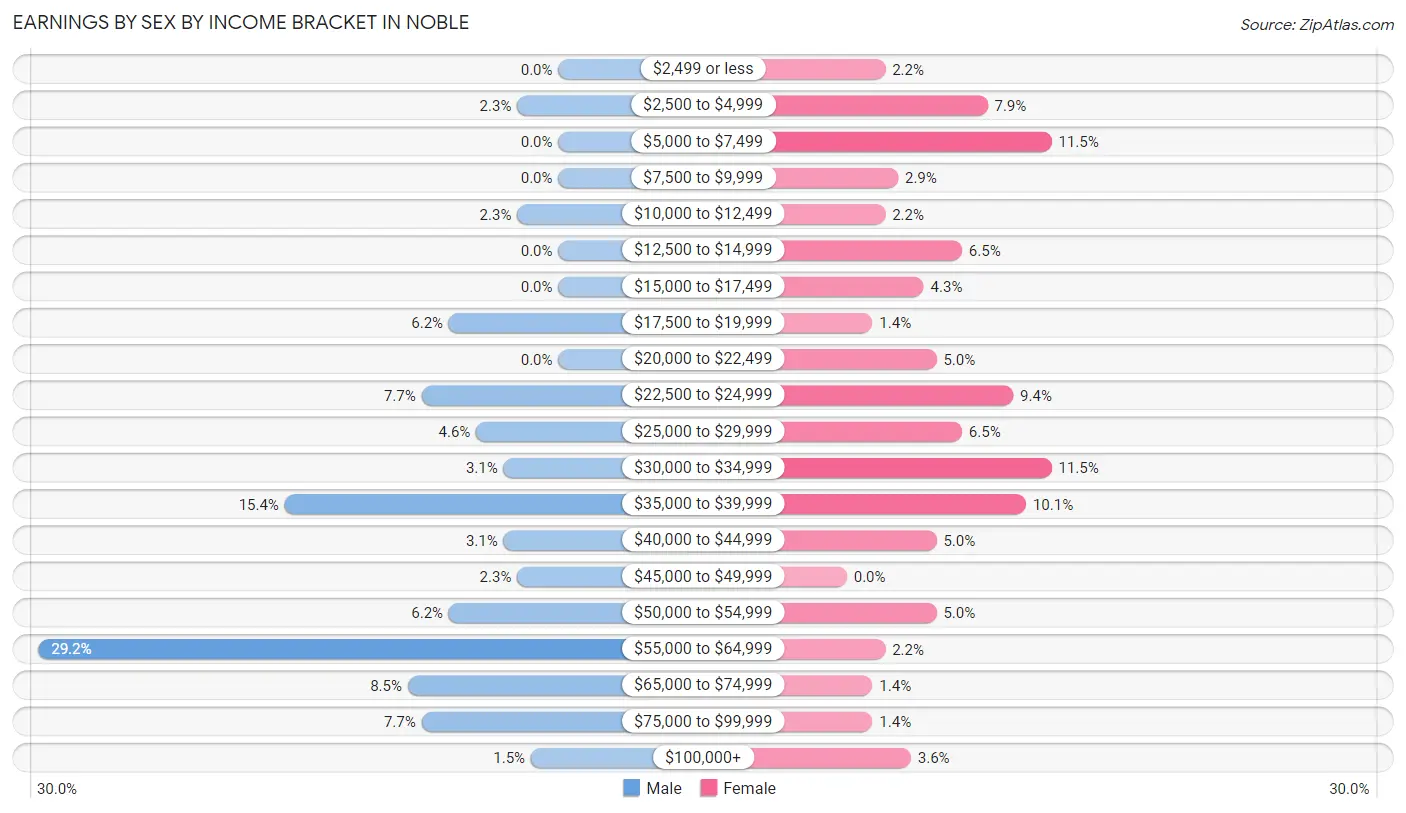
| Income | Male | Female |
| $2,499 or less | 0 (0.0%) | 3 (2.2%) |
| $2,500 to $4,999 | 3 (2.3%) | 11 (7.9%) |
| $5,000 to $7,499 | 0 (0.0%) | 16 (11.5%) |
| $7,500 to $9,999 | 0 (0.0%) | 4 (2.9%) |
| $10,000 to $12,499 | 3 (2.3%) | 3 (2.2%) |
| $12,500 to $14,999 | 0 (0.0%) | 9 (6.5%) |
| $15,000 to $17,499 | 0 (0.0%) | 6 (4.3%) |
| $17,500 to $19,999 | 8 (6.1%) | 2 (1.4%) |
| $20,000 to $22,499 | 0 (0.0%) | 7 (5.0%) |
| $22,500 to $24,999 | 10 (7.7%) | 13 (9.3%) |
| $25,000 to $29,999 | 6 (4.6%) | 9 (6.5%) |
| $30,000 to $34,999 | 4 (3.1%) | 16 (11.5%) |
| $35,000 to $39,999 | 20 (15.4%) | 14 (10.1%) |
| $40,000 to $44,999 | 4 (3.1%) | 7 (5.0%) |
| $45,000 to $49,999 | 3 (2.3%) | 0 (0.0%) |
| $50,000 to $54,999 | 8 (6.1%) | 7 (5.0%) |
| $55,000 to $64,999 | 38 (29.2%) | 3 (2.2%) |
| $65,000 to $74,999 | 11 (8.5%) | 2 (1.4%) |
| $75,000 to $99,999 | 10 (7.7%) | 2 (1.4%) |
| $100,000+ | 2 (1.5%) | 5 (3.6%) |
| Total | 130 (100.0%) | 139 (100.0%) |
Earnings by Sex by Educational Attainment in Noble
Average earnings in Noble are $55,083 for men and $26,719 for women, a difference of 51.5%. Men with an educational attainment of graduate degree enjoy the highest average annual earnings of $60,625, while those with high school diploma education earn the least with $47,500. Women with an educational attainment of high school diploma earn the most with the average annual earnings of $30,250, while those with college or associate's degree education have the smallest earnings of $23,558.
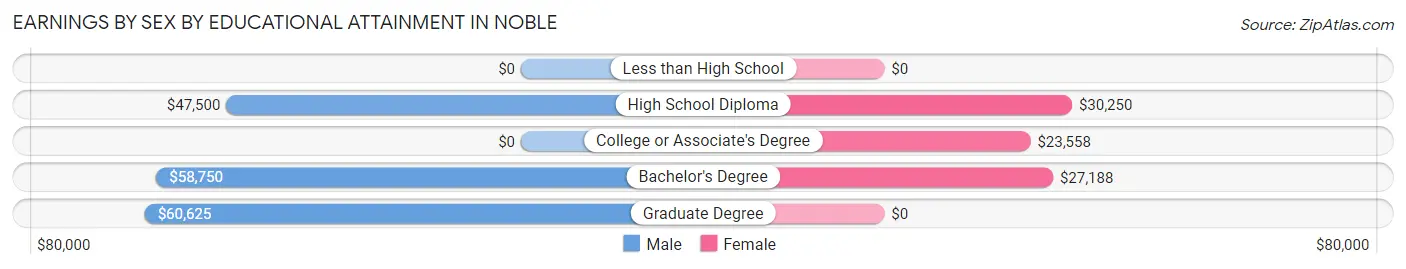
| Educational Attainment | Male Income | Female Income |
| Less than High School | - | - |
| High School Diploma | $47,500 | $30,250 |
| College or Associate's Degree | - | - |
| Bachelor's Degree | $58,750 | $27,188 |
| Graduate Degree | $60,625 | $0 |
| Total | $55,083 | $26,719 |
Family Income in Noble
Family Income Brackets in Noble
According to the Noble family income data, there are 43 families falling into the $50,000 to $74,999 income range, which is the most common income bracket and makes up 26.7% of all families. Conversely, the $200,000+ income bracket is the least frequent group with only 1 families (0.6%) belonging to this category.
| Income Bracket | # Families | % Families |
| Less than $10,000 | 18 | 11.2% |
| $10,000 to $14,999 | 6 | 3.7% |
| $15,000 to $24,999 | 9 | 5.6% |
| $25,000 to $34,999 | 25 | 15.5% |
| $35,000 to $49,999 | 5 | 3.1% |
| $50,000 to $74,999 | 43 | 26.7% |
| $75,000 to $99,999 | 27 | 16.8% |
| $100,000 to $149,999 | 21 | 13.0% |
| $150,000 to $199,999 | 6 | 3.7% |
| $200,000+ | 1 | 0.6% |
Family Income by Famaliy Size in Noble
4-person families (36 | 22.4%) account for the highest median family income in Noble with $63,333 per family, while 2-person families (89 | 55.3%) have the highest median income of $29,271 per family member.
| Income Bracket | # Families | Median Income |
| 2-Person Families | 89 (55.3%) | $58,542 |
| 3-Person Families | 33 (20.5%) | $31,625 |
| 4-Person Families | 36 (22.4%) | $63,333 |
| 5-Person Families | 2 (1.2%) | $0 |
| 6-Person Families | 1 (0.6%) | $0 |
| 7+ Person Families | 0 (0.0%) | $0 |
| Total | 161 (100.0%) | $59,063 |
Family Income by Number of Earners in Noble
The median family income in Noble is $59,063, with families comprising 3+ earners (11) having the highest median family income of $115,625, while families with no earners (49) have the lowest median family income of $28,472, accounting for 6.8% and 30.4% of families, respectively.
| Number of Earners | # Families | Median Income |
| No Earners | 49 (30.4%) | $28,472 |
| 1 Earner | 39 (24.2%) | $55,625 |
| 2 Earners | 62 (38.5%) | $81,250 |
| 3+ Earners | 11 (6.8%) | $115,625 |
| Total | 161 (100.0%) | $59,063 |
Household Income in Noble
Household Income Brackets in Noble
With 72 households falling in the category, the $50,000 to $74,999 income range is the most frequent in Noble, accounting for 24.9% of all households. In contrast, only 1 households (0.4%) fall into the $200,000+ income bracket, making it the least populous group.
| Income Bracket | # Households | % Households |
| Less than $10,000 | 36 | 12.5% |
| $10,000 to $14,999 | 25 | 8.7% |
| $15,000 to $24,999 | 24 | 8.3% |
| $25,000 to $34,999 | 34 | 11.8% |
| $35,000 to $49,999 | 35 | 12.1% |
| $50,000 to $74,999 | 72 | 24.9% |
| $75,000 to $99,999 | 33 | 11.4% |
| $100,000 to $149,999 | 23 | 8.0% |
| $150,000 to $199,999 | 6 | 2.1% |
| $200,000+ | 1 | 0.3% |
Household Income by Householder Age in Noble
The median household income in Noble is $42,875, with the highest median household income of $57,708 found in the 25 to 44 years age bracket for the primary householder. A total of 90 households (31.1%) fall into this category. Meanwhile, the 15 to 24 years age bracket for the primary householder has the lowest median household income of $0, with 14 households (4.8%) in this group.
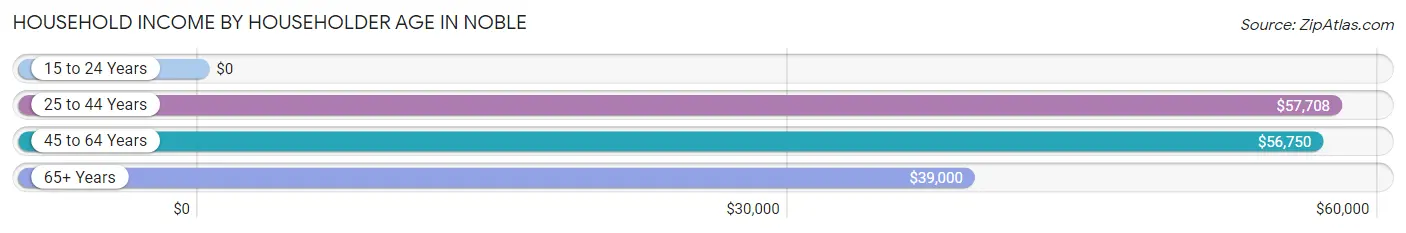
| Income Bracket | # Households | Median Income |
| 15 to 24 Years | 14 (4.8%) | $0 |
| 25 to 44 Years | 90 (31.1%) | $57,708 |
| 45 to 64 Years | 93 (32.2%) | $56,750 |
| 65+ Years | 92 (31.8%) | $39,000 |
| Total | 289 (100.0%) | $42,875 |
Poverty in Noble
Income Below Poverty by Sex and Age in Noble
With 19.2% poverty level for males and 26.0% for females among the residents of Noble, under 5 year old males and 15 year old females are the most vulnerable to poverty, with 13 males (86.7%) and 4 females (100.0%) in their respective age groups living below the poverty level.
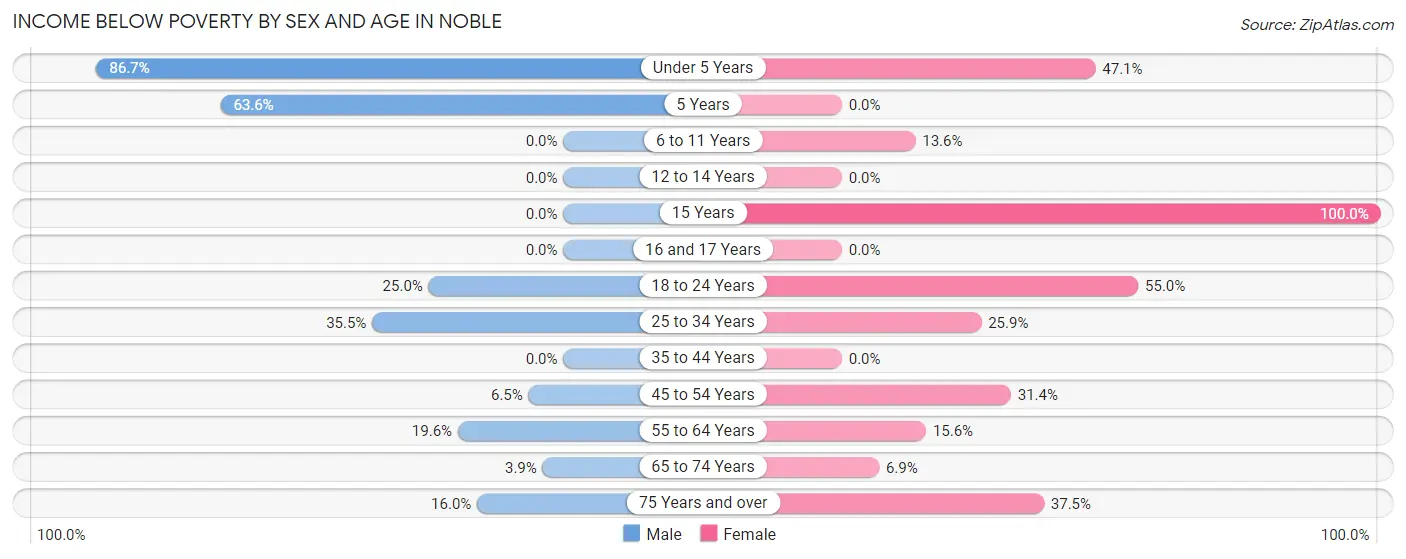
| Age Bracket | Male | Female |
| Under 5 Years | 13 (86.7%) | 8 (47.1%) |
| 5 Years | 7 (63.6%) | 0 (0.0%) |
| 6 to 11 Years | 0 (0.0%) | 3 (13.6%) |
| 12 to 14 Years | 0 (0.0%) | 0 (0.0%) |
| 15 Years | 0 (0.0%) | 4 (100.0%) |
| 16 and 17 Years | 0 (0.0%) | 0 (0.0%) |
| 18 to 24 Years | 3 (25.0%) | 11 (55.0%) |
| 25 to 34 Years | 22 (35.5%) | 22 (25.9%) |
| 35 to 44 Years | 0 (0.0%) | 0 (0.0%) |
| 45 to 54 Years | 2 (6.5%) | 16 (31.4%) |
| 55 to 64 Years | 9 (19.6%) | 5 (15.6%) |
| 65 to 74 Years | 1 (3.8%) | 2 (6.9%) |
| 75 Years and over | 4 (16.0%) | 15 (37.5%) |
| Total | 61 (19.2%) | 86 (26.0%) |
Income Above Poverty by Sex and Age in Noble
According to the poverty statistics in Noble, males aged 6 to 11 years and females aged 12 to 14 years are the age groups that are most secure financially, with 100.0% of males and 100.0% of females in these age groups living above the poverty line.
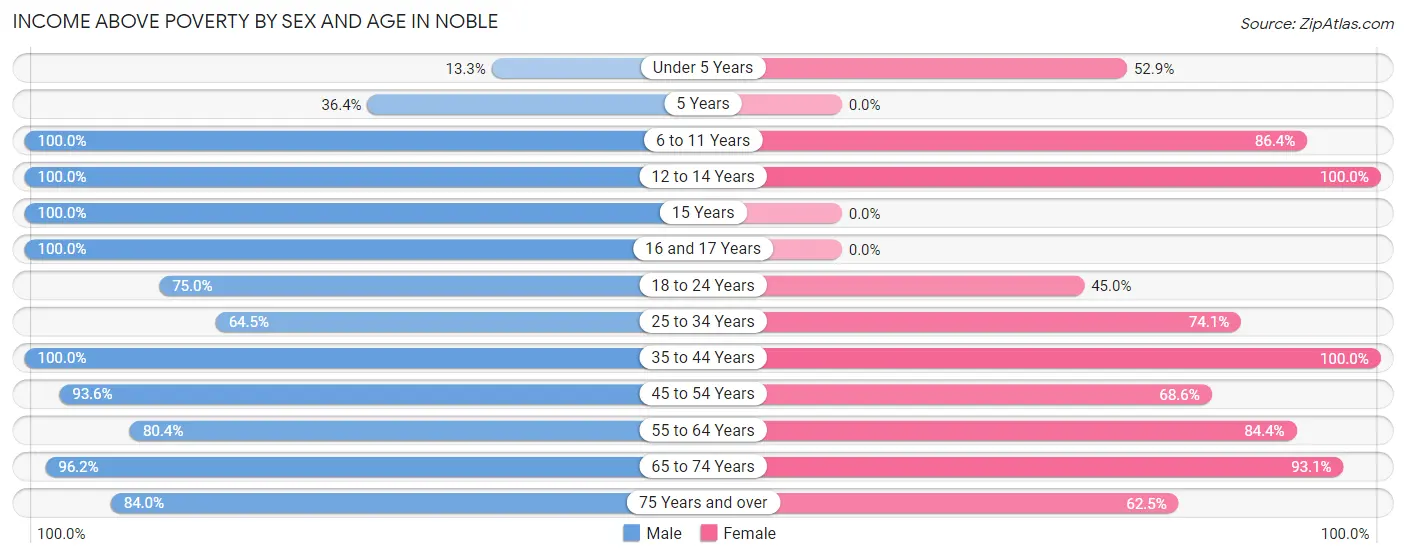
| Age Bracket | Male | Female |
| Under 5 Years | 2 (13.3%) | 9 (52.9%) |
| 5 Years | 4 (36.4%) | 0 (0.0%) |
| 6 to 11 Years | 27 (100.0%) | 19 (86.4%) |
| 12 to 14 Years | 6 (100.0%) | 5 (100.0%) |
| 15 Years | 5 (100.0%) | 0 (0.0%) |
| 16 and 17 Years | 12 (100.0%) | 0 (0.0%) |
| 18 to 24 Years | 9 (75.0%) | 9 (45.0%) |
| 25 to 34 Years | 40 (64.5%) | 63 (74.1%) |
| 35 to 44 Years | 40 (100.0%) | 26 (100.0%) |
| 45 to 54 Years | 29 (93.5%) | 35 (68.6%) |
| 55 to 64 Years | 37 (80.4%) | 27 (84.4%) |
| 65 to 74 Years | 25 (96.2%) | 27 (93.1%) |
| 75 Years and over | 21 (84.0%) | 25 (62.5%) |
| Total | 257 (80.8%) | 245 (74.0%) |
Income Below Poverty Among Married-Couple Families in Noble
The poverty statistics for married-couple families in Noble show that 0.8% or 1 of the total 121 families live below the poverty line. Families with no children have the highest poverty rate of 1.3%, comprising of 1 families. On the other hand, families with 1 or 2 children have the lowest poverty rate of 0.0%, which includes 0 families.
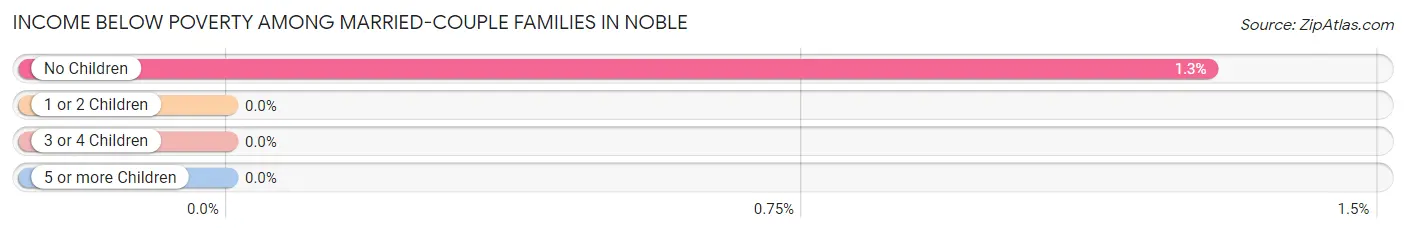
| Children | Above Poverty | Below Poverty |
| No Children | 77 (98.7%) | 1 (1.3%) |
| 1 or 2 Children | 42 (100.0%) | 0 (0.0%) |
| 3 or 4 Children | 1 (100.0%) | 0 (0.0%) |
| 5 or more Children | 0 (0.0%) | 0 (0.0%) |
| Total | 120 (99.2%) | 1 (0.8%) |
Income Below Poverty Among Single-Parent Households in Noble
According to the poverty data in Noble, 85.7% or 6 single-father households and 75.8% or 25 single-mother households are living below the poverty line. Among single-father households, those with 1 or 2 children have the highest poverty rate, with 4 households (100.0%) experiencing poverty. Likewise, among single-mother households, those with 3 or 4 children have the highest poverty rate, with 2 households (100.0%) falling below the poverty line.
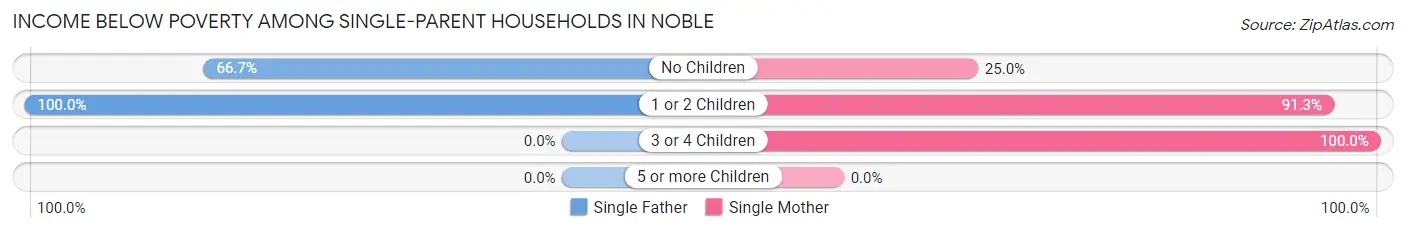
| Children | Single Father | Single Mother |
| No Children | 2 (66.7%) | 2 (25.0%) |
| 1 or 2 Children | 4 (100.0%) | 21 (91.3%) |
| 3 or 4 Children | 0 (0.0%) | 2 (100.0%) |
| 5 or more Children | 0 (0.0%) | 0 (0.0%) |
| Total | 6 (85.7%) | 25 (75.8%) |
Income Below Poverty Among Married-Couple vs Single-Parent Households in Noble
The poverty data for Noble shows that 1 of the married-couple family households (0.8%) and 31 of the single-parent households (77.5%) are living below the poverty level. Within the married-couple family households, those with no children have the highest poverty rate, with 1 households (1.3%) falling below the poverty line. Among the single-parent households, those with 3 or 4 children have the highest poverty rate, with 2 household (100.0%) living below poverty.
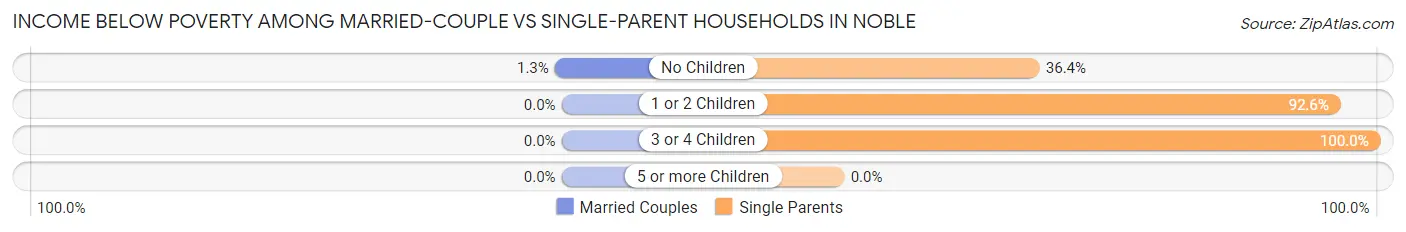
| Children | Married-Couple Families | Single-Parent Households |
| No Children | 1 (1.3%) | 4 (36.4%) |
| 1 or 2 Children | 0 (0.0%) | 25 (92.6%) |
| 3 or 4 Children | 0 (0.0%) | 2 (100.0%) |
| 5 or more Children | 0 (0.0%) | 0 (0.0%) |
| Total | 1 (0.8%) | 31 (77.5%) |
Race in Noble
The most populous races in Noble are White / Caucasian (626 | 96.5%), Two or more Races (17 | 2.6%), and Black / African American (3 | 0.5%).
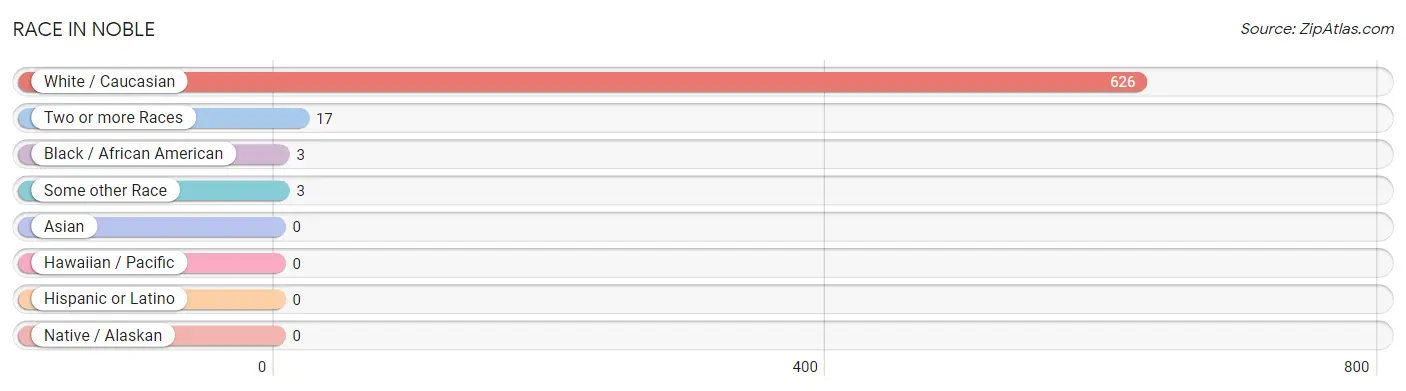
| Race | # Population | % Population |
| Asian | 0 | 0.0% |
| Black / African American | 3 | 0.5% |
| Hawaiian / Pacific | 0 | 0.0% |
| Hispanic or Latino | 0 | 0.0% |
| Native / Alaskan | 0 | 0.0% |
| White / Caucasian | 626 | 96.5% |
| Two or more Races | 17 | 2.6% |
| Some other Race | 3 | 0.5% |
| Total | 649 | 100.0% |
Ancestry in Noble
The most populous ancestries reported in Noble are German (148 | 22.8%), Irish (87 | 13.4%), American (45 | 6.9%), British (41 | 6.3%), and Norwegian (38 | 5.9%), together accounting for 55.3% of all Noble residents.
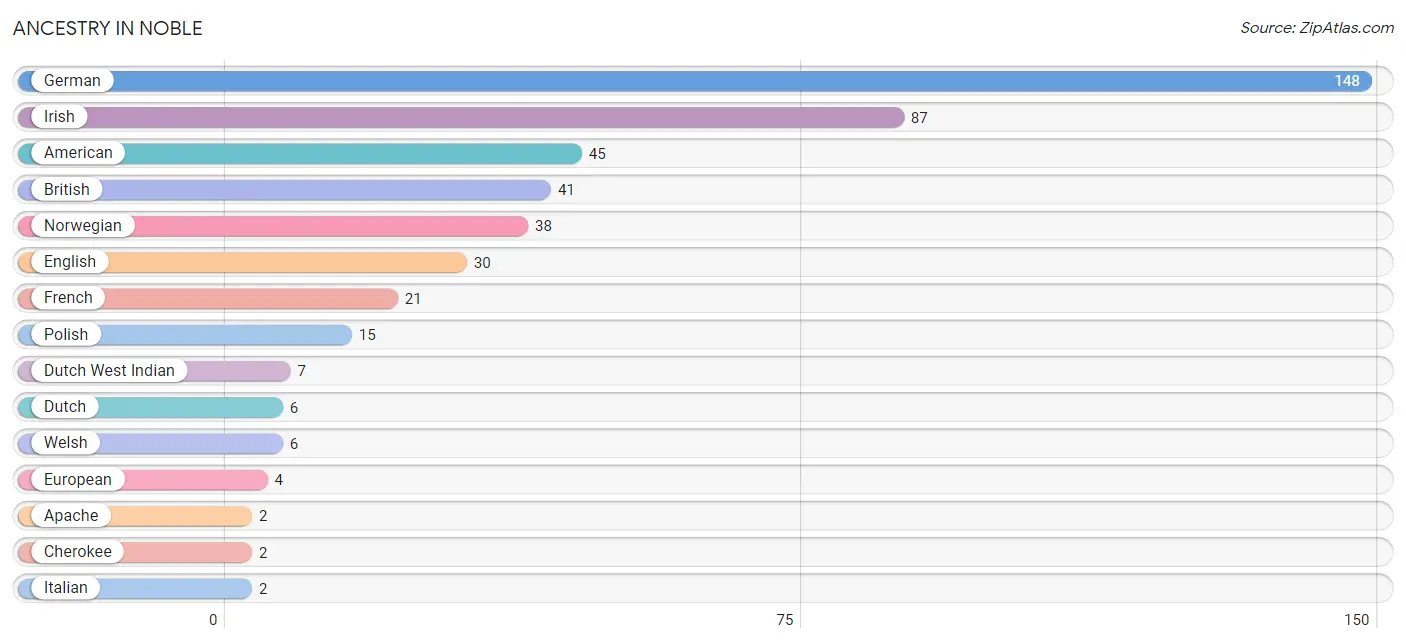
| Ancestry | # Population | % Population |
| American | 45 | 6.9% |
| Apache | 2 | 0.3% |
| British | 41 | 6.3% |
| Cherokee | 2 | 0.3% |
| Chippewa | 1 | 0.2% |
| Dutch | 6 | 0.9% |
| Dutch West Indian | 7 | 1.1% |
| English | 30 | 4.6% |
| European | 4 | 0.6% |
| French | 21 | 3.2% |
| German | 148 | 22.8% |
| Irish | 87 | 13.4% |
| Italian | 2 | 0.3% |
| Norwegian | 38 | 5.9% |
| Polish | 15 | 2.3% |
| Scotch-Irish | 1 | 0.2% |
| Scottish | 2 | 0.3% |
| Swedish | 1 | 0.2% |
| Welsh | 6 | 0.9% | View All 19 Rows |
Immigrants in Noble

| Immigration Origin | # Population | % Population | View All 0 Rows |
Sex and Age in Noble
Sex and Age in Noble
The most populous age groups in Noble are 30 to 34 Years (43 | 13.5%) for men and 30 to 34 Years (48 | 14.5%) for women.
| Age Bracket | Male | Female |
| Under 5 Years | 15 (4.7%) | 17 (5.1%) |
| 5 to 9 Years | 36 (11.3%) | 13 (3.9%) |
| 10 to 14 Years | 8 (2.5%) | 14 (4.2%) |
| 15 to 19 Years | 20 (6.3%) | 7 (2.1%) |
| 20 to 24 Years | 9 (2.8%) | 17 (5.1%) |
| 25 to 29 Years | 19 (6.0%) | 37 (11.2%) |
| 30 to 34 Years | 43 (13.5%) | 48 (14.5%) |
| 35 to 39 Years | 17 (5.3%) | 16 (4.8%) |
| 40 to 44 Years | 23 (7.2%) | 10 (3.0%) |
| 45 to 49 Years | 15 (4.7%) | 16 (4.8%) |
| 50 to 54 Years | 16 (5.0%) | 35 (10.6%) |
| 55 to 59 Years | 25 (7.9%) | 11 (3.3%) |
| 60 to 64 Years | 21 (6.6%) | 21 (6.3%) |
| 65 to 69 Years | 10 (3.1%) | 14 (4.2%) |
| 70 to 74 Years | 16 (5.0%) | 15 (4.5%) |
| 75 to 79 Years | 10 (3.1%) | 10 (3.0%) |
| 80 to 84 Years | 15 (4.7%) | 8 (2.4%) |
| 85 Years and over | 0 (0.0%) | 22 (6.7%) |
| Total | 318 (100.0%) | 331 (100.0%) |
Families and Households in Noble
Median Family Size in Noble
The median family size in Noble is 2.99 persons per family, with single male/father families (7 | 4.3%) accounting for the largest median family size of 4 persons per family. On the other hand, single female/mother families (33 | 20.5%) represent the smallest median family size with 2.42 persons per family.
| Family Type | # Families | Family Size |
| Married-Couple | 121 (75.2%) | 3.09 |
| Single Male/Father | 7 (4.3%) | 4.00 |
| Single Female/Mother | 33 (20.5%) | 2.42 |
| Total Families | 161 (100.0%) | 2.99 |
Median Household Size in Noble
The median household size in Noble is 2.25 persons per household, with single male/father households (7 | 2.4%) accounting for the largest median household size of 6.57 persons per household. non-family households (128 | 44.3%) represent the smallest median household size with 1.14 persons per household.
| Household Type | # Households | Household Size |
| Married-Couple | 121 (41.9%) | 3.09 |
| Single Male/Father | 7 (2.4%) | 6.57 |
| Single Female/Mother | 33 (11.4%) | 2.52 |
| Non-family | 128 (44.3%) | 1.14 |
| Total Households | 289 (100.0%) | 2.25 |
Household Size by Marriage Status in Noble
Out of a total of 289 households in Noble, 161 (55.7%) are family households, while 128 (44.3%) are nonfamily households. The most numerous type of family households are 2-person households, comprising 85, and the most common type of nonfamily households are 1-person households, comprising 110.
| Household Size | Family Households | Nonfamily Households |
| 1-Person Households | - | 110 (38.1%) |
| 2-Person Households | 85 (29.4%) | 18 (6.2%) |
| 3-Person Households | 33 (11.4%) | 0 (0.0%) |
| 4-Person Households | 36 (12.5%) | 0 (0.0%) |
| 5-Person Households | 6 (2.1%) | 0 (0.0%) |
| 6-Person Households | 1 (0.4%) | 0 (0.0%) |
| 7+ Person Households | 0 (0.0%) | 0 (0.0%) |
| Total | 161 (55.7%) | 128 (44.3%) |
Female Fertility in Noble
Fertility by Age in Noble
Average fertility rate in Noble is 12.0 births per 1,000 women. Women in the age bracket of 20 to 34 years have the highest fertility rate with 20.0 births per 1,000 women. Women in the age bracket of 20 to 34 years acount for 100.0% of all women with births.
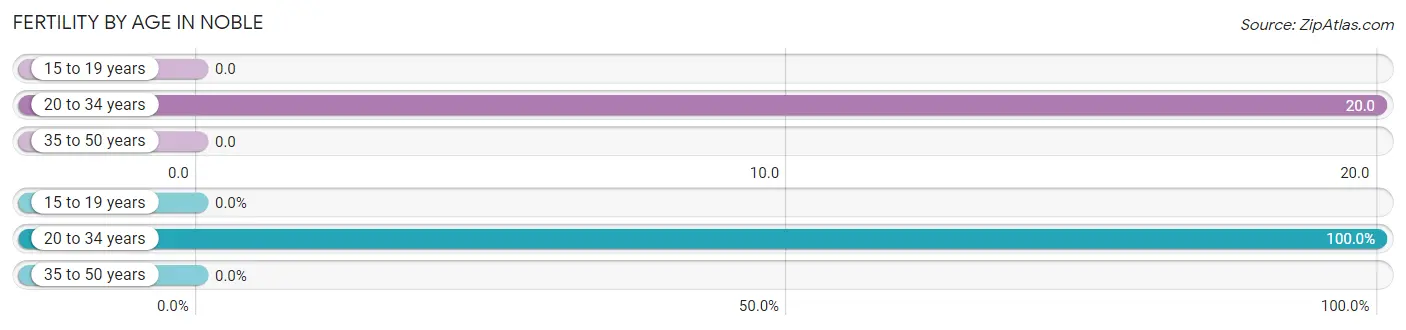
| Age Bracket | Women with Births | Births / 1,000 Women |
| 15 to 19 years | 0 (0.0%) | 0.0 |
| 20 to 34 years | 2 (100.0%) | 20.0 |
| 35 to 50 years | 0 (0.0%) | 0.0 |
| Total | 2 (100.0%) | 12.0 |
Fertility by Age by Marriage Status in Noble
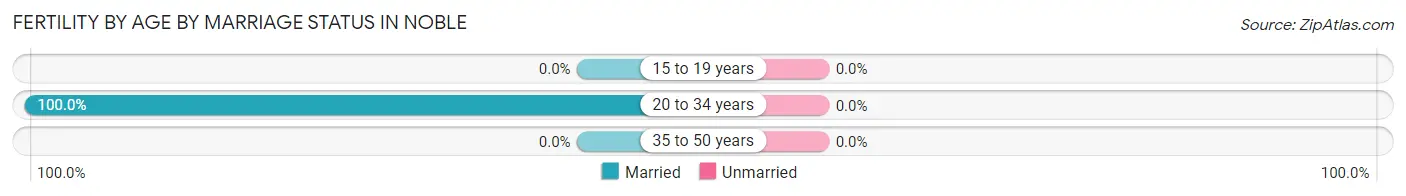
| Age Bracket | Married | Unmarried |
| 15 to 19 years | 0 (0.0%) | 0 (0.0%) |
| 20 to 34 years | 2 (100.0%) | 0 (0.0%) |
| 35 to 50 years | 0 (0.0%) | 0 (0.0%) |
| Total | 2 (100.0%) | 0 (0.0%) |
Fertility by Education in Noble
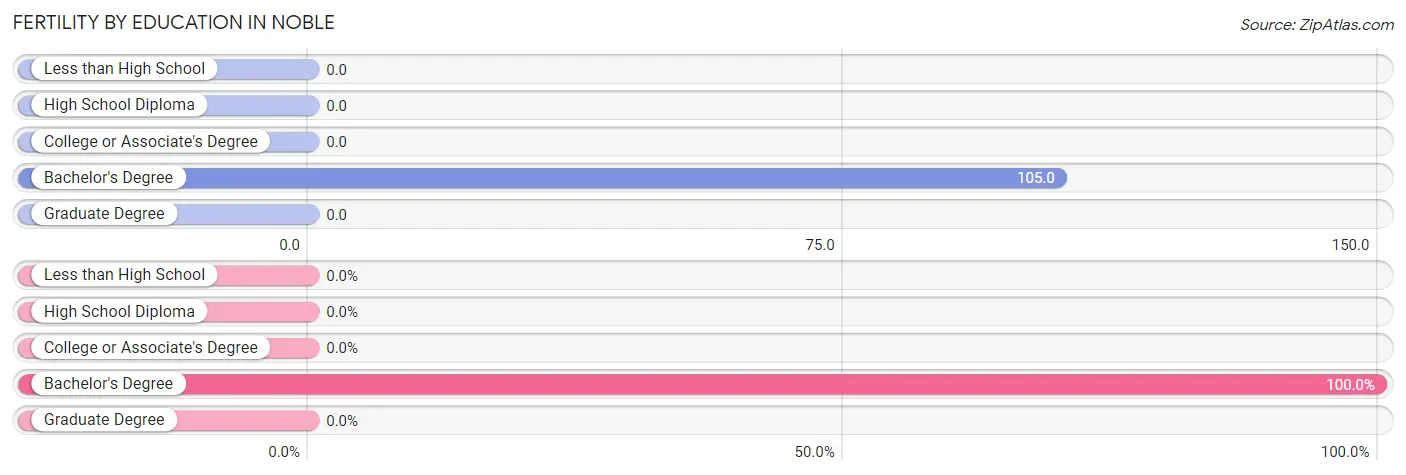
| Educational Attainment | Women with Births | Births / 1,000 Women |
| Less than High School | 0 (0.0%) | 0.0 |
| High School Diploma | 0 (0.0%) | 0.0 |
| College or Associate's Degree | 0 (0.0%) | 0.0 |
| Bachelor's Degree | 2 (100.0%) | 105.0 |
| Graduate Degree | 0 (0.0%) | 0.0 |
| Total | 2 (100.0%) | 12.0 |
Fertility by Education by Marriage Status in Noble
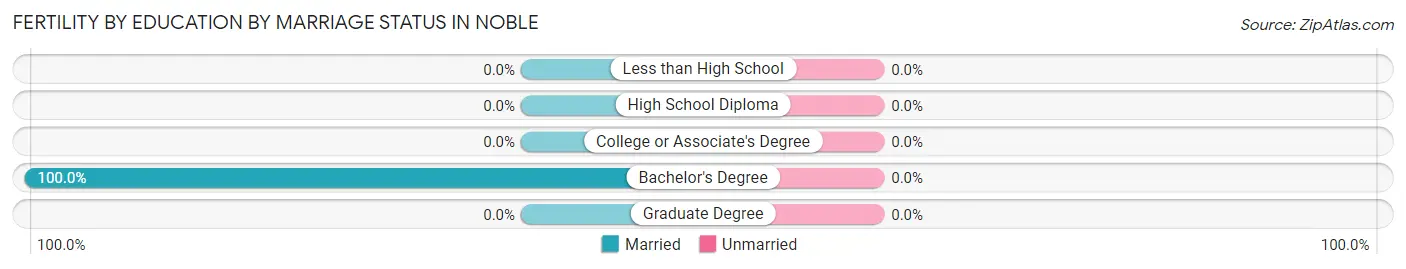
| Educational Attainment | Married | Unmarried |
| Less than High School | 0 (0.0%) | 0 (0.0%) |
| High School Diploma | 0 (0.0%) | 0 (0.0%) |
| College or Associate's Degree | 0 (0.0%) | 0 (0.0%) |
| Bachelor's Degree | 2 (100.0%) | 0 (0.0%) |
| Graduate Degree | 0 (0.0%) | 0 (0.0%) |
| Total | 2 (100.0%) | 0 (0.0%) |
Employment Characteristics in Noble
Employment by Class of Employer in Noble
Among the 254 employed individuals in Noble, private company employees (204 | 80.3%), self-employed (not incorporated) (15 | 5.9%), and local government employees (12 | 4.7%) make up the most common classes of employment.
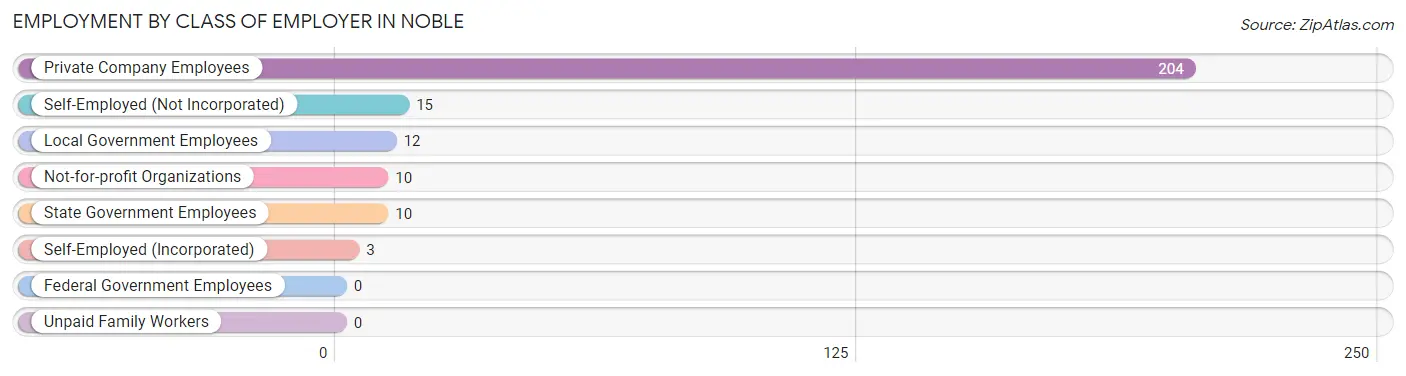
| Employer Class | # Employees | % Employees |
| Private Company Employees | 204 | 80.3% |
| Self-Employed (Incorporated) | 3 | 1.2% |
| Self-Employed (Not Incorporated) | 15 | 5.9% |
| Not-for-profit Organizations | 10 | 3.9% |
| Local Government Employees | 12 | 4.7% |
| State Government Employees | 10 | 3.9% |
| Federal Government Employees | 0 | 0.0% |
| Unpaid Family Workers | 0 | 0.0% |
| Total | 254 | 100.0% |
Employment Status by Age in Noble
According to the labor force statistics for Noble, out of the total population over 16 years of age (537), 51.6% or 277 individuals are in the labor force, with 8.3% or 23 of them unemployed. The age group with the highest labor force participation rate is 20 to 24 years, with 100.0% or 26 individuals in the labor force. Within the labor force, the 30 to 34 years age range has the highest percentage of unemployed individuals, with 18.8% or 6 of them being unemployed.
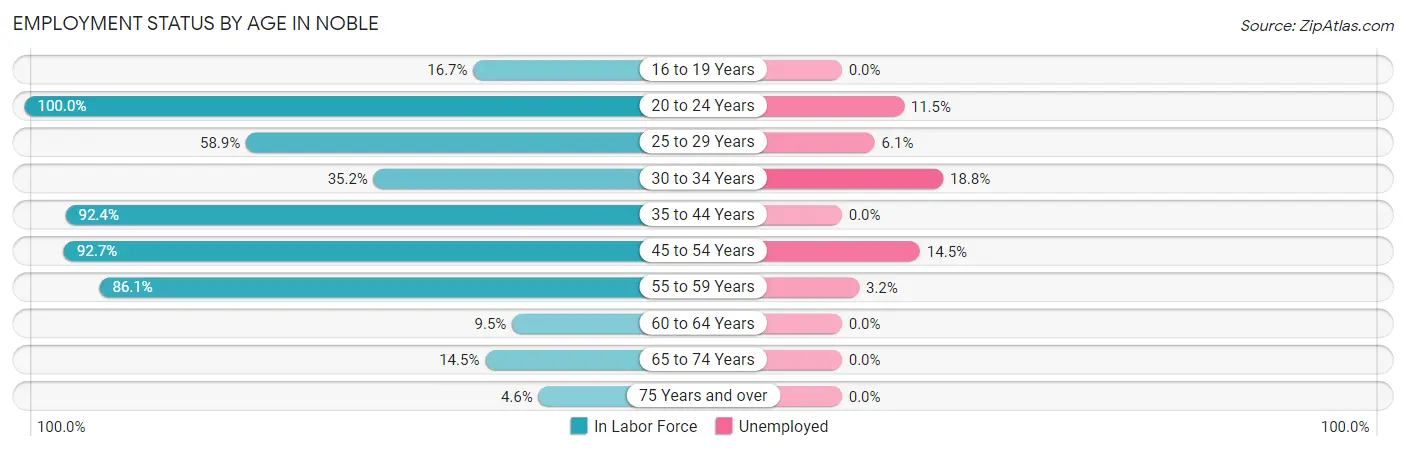
| Age Bracket | In Labor Force | Unemployed |
| 16 to 19 Years | 3 (16.7%) | 0 (0.0%) |
| 20 to 24 Years | 26 (100.0%) | 3 (11.5%) |
| 25 to 29 Years | 33 (58.9%) | 2 (6.1%) |
| 30 to 34 Years | 32 (35.2%) | 6 (18.8%) |
| 35 to 44 Years | 61 (92.4%) | 0 (0.0%) |
| 45 to 54 Years | 76 (92.7%) | 11 (14.5%) |
| 55 to 59 Years | 31 (86.1%) | 1 (3.2%) |
| 60 to 64 Years | 4 (9.5%) | 0 (0.0%) |
| 65 to 74 Years | 8 (14.5%) | 0 (0.0%) |
| 75 Years and over | 3 (4.6%) | 0 (0.0%) |
| Total | 277 (51.6%) | 23 (8.3%) |
Employment Status by Educational Attainment in Noble
According to labor force statistics for Noble, 63.5% of individuals (237) out of the total population between 25 and 64 years of age (373) are in the labor force, with 8.4% or 20 of them being unemployed. The group with the highest labor force participation rate are those with the educational attainment of bachelor's degree or higher, with 100.0% or 35 individuals in the labor force. Within the labor force, individuals with less than high school education have the highest percentage of unemployment, with 72.7% or 8 of them being unemployed.
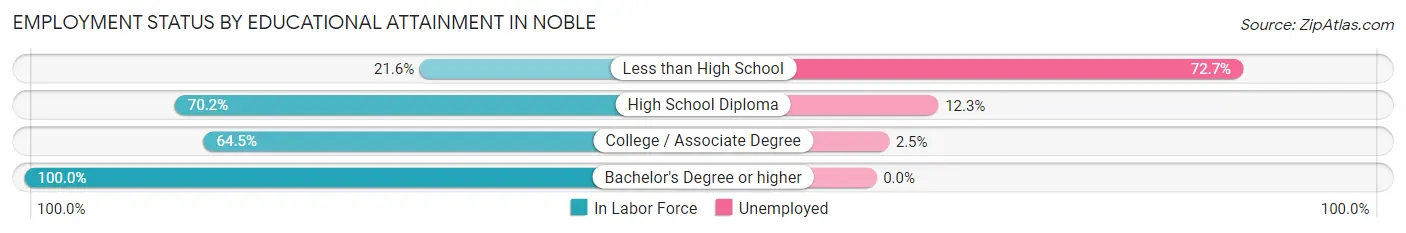
| Educational Attainment | In Labor Force | Unemployed |
| Less than High School | 11 (21.6%) | 37 (72.7%) |
| High School Diploma | 73 (70.2%) | 13 (12.3%) |
| College / Associate Degree | 118 (64.5%) | 5 (2.5%) |
| Bachelor's Degree or higher | 35 (100.0%) | 0 (0.0%) |
| Total | 237 (63.5%) | 31 (8.4%) |
Employment Occupations by Sex in Noble
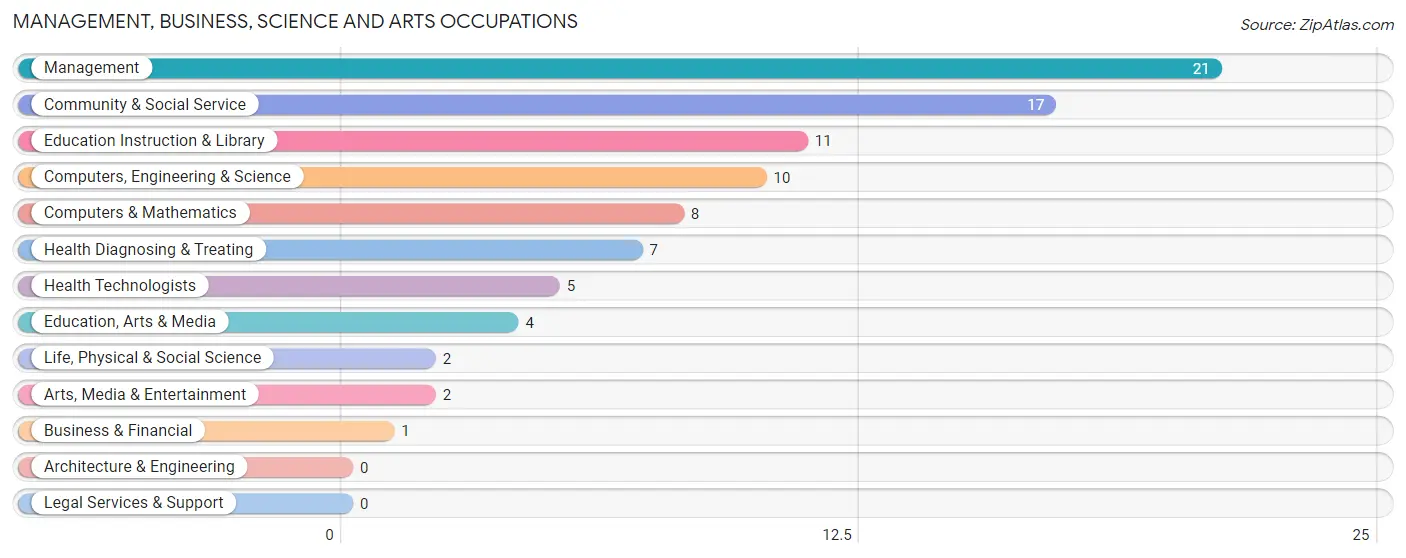
Management, Business, Science and Arts Occupations
The most common Management, Business, Science and Arts occupations in Noble are Management (21 | 8.3%), Community & Social Service (17 | 6.7%), Education Instruction & Library (11 | 4.3%), Computers, Engineering & Science (10 | 3.9%), and Computers & Mathematics (8 | 3.2%).
Management, Business, Science and Arts Occupations by Sex
Within the Management, Business, Science and Arts occupations in Noble, the most male-oriented occupations are Computers, Engineering & Science (100.0%), Computers & Mathematics (100.0%), and Life, Physical & Social Science (100.0%), while the most female-oriented occupations are Business & Financial (100.0%), Health Diagnosing & Treating (85.7%), and Health Technologists (80.0%).
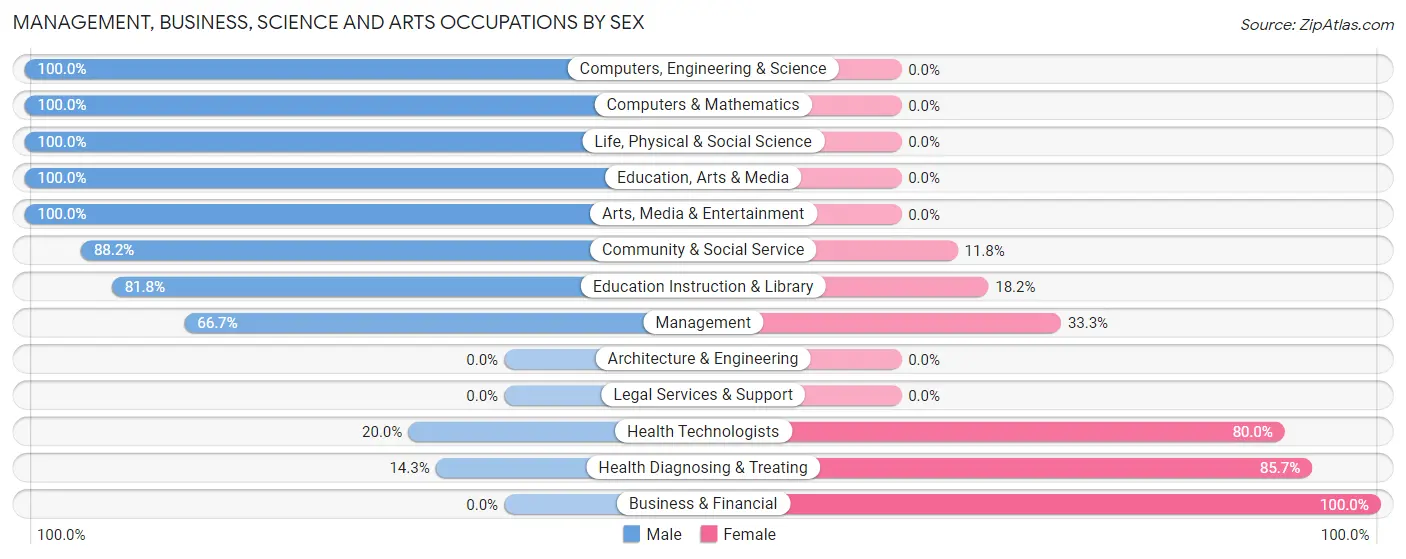
| Occupation | Male | Female |
| Management | 14 (66.7%) | 7 (33.3%) |
| Business & Financial | 0 (0.0%) | 1 (100.0%) |
| Computers, Engineering & Science | 10 (100.0%) | 0 (0.0%) |
| Computers & Mathematics | 8 (100.0%) | 0 (0.0%) |
| Architecture & Engineering | 0 (0.0%) | 0 (0.0%) |
| Life, Physical & Social Science | 2 (100.0%) | 0 (0.0%) |
| Community & Social Service | 15 (88.2%) | 2 (11.8%) |
| Education, Arts & Media | 4 (100.0%) | 0 (0.0%) |
| Legal Services & Support | 0 (0.0%) | 0 (0.0%) |
| Education Instruction & Library | 9 (81.8%) | 2 (18.2%) |
| Arts, Media & Entertainment | 2 (100.0%) | 0 (0.0%) |
| Health Diagnosing & Treating | 1 (14.3%) | 6 (85.7%) |
| Health Technologists | 1 (20.0%) | 4 (80.0%) |
| Total (Category) | 40 (71.4%) | 16 (28.6%) |
| Total (Overall) | 120 (47.2%) | 134 (52.8%) |
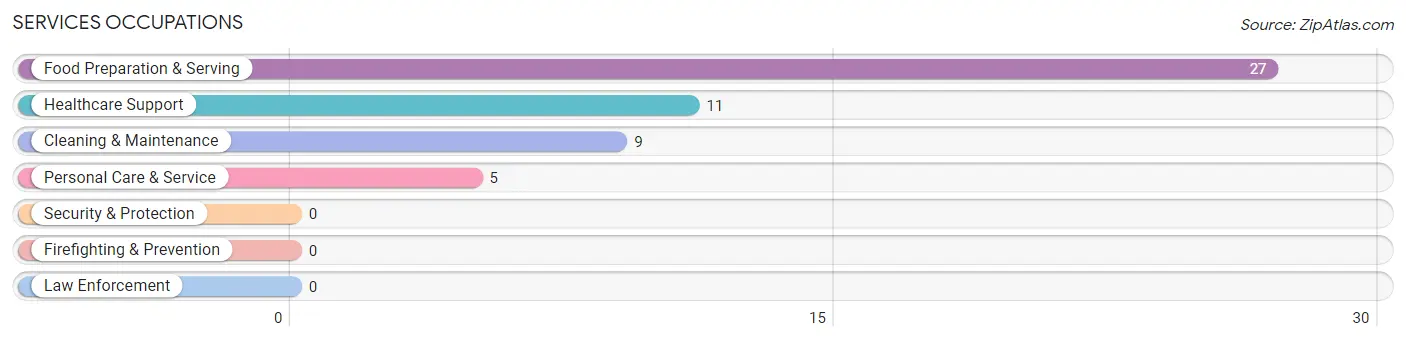
Services Occupations
The most common Services occupations in Noble are Food Preparation & Serving (27 | 10.6%), Healthcare Support (11 | 4.3%), Cleaning & Maintenance (9 | 3.5%), and Personal Care & Service (5 | 2.0%).
Services Occupations by Sex
Within the Services occupations in Noble, the most male-oriented occupations are Healthcare Support (54.5%), Cleaning & Maintenance (22.2%), and Personal Care & Service (20.0%), while the most female-oriented occupations are Food Preparation & Serving (100.0%), Personal Care & Service (80.0%), and Cleaning & Maintenance (77.8%).
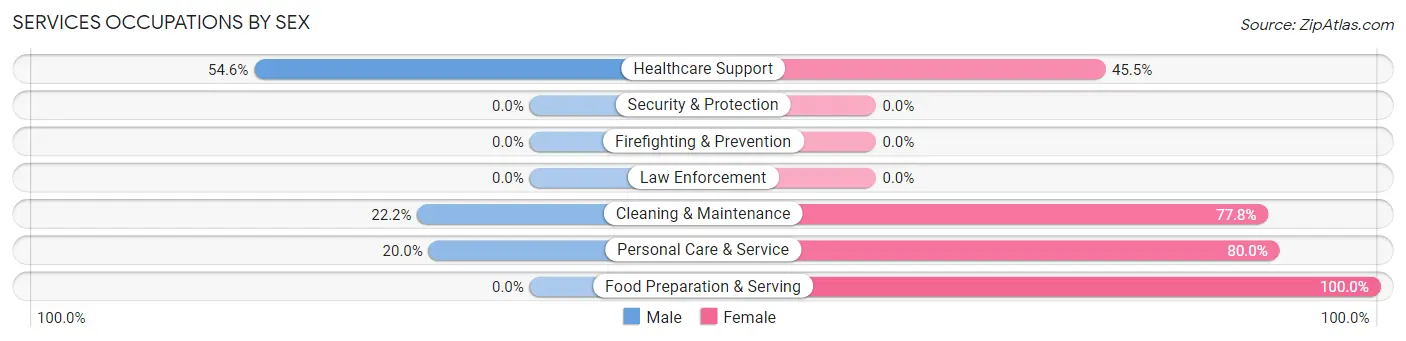
| Occupation | Male | Female |
| Healthcare Support | 6 (54.5%) | 5 (45.5%) |
| Security & Protection | 0 (0.0%) | 0 (0.0%) |
| Firefighting & Prevention | 0 (0.0%) | 0 (0.0%) |
| Law Enforcement | 0 (0.0%) | 0 (0.0%) |
| Food Preparation & Serving | 0 (0.0%) | 27 (100.0%) |
| Cleaning & Maintenance | 2 (22.2%) | 7 (77.8%) |
| Personal Care & Service | 1 (20.0%) | 4 (80.0%) |
| Total (Category) | 9 (17.3%) | 43 (82.7%) |
| Total (Overall) | 120 (47.2%) | 134 (52.8%) |
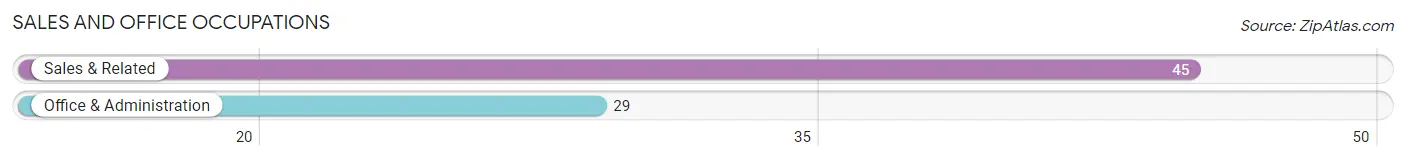
Sales and Office Occupations
The most common Sales and Office occupations in Noble are Sales & Related (45 | 17.7%), and Office & Administration (29 | 11.4%).
Sales and Office Occupations by Sex
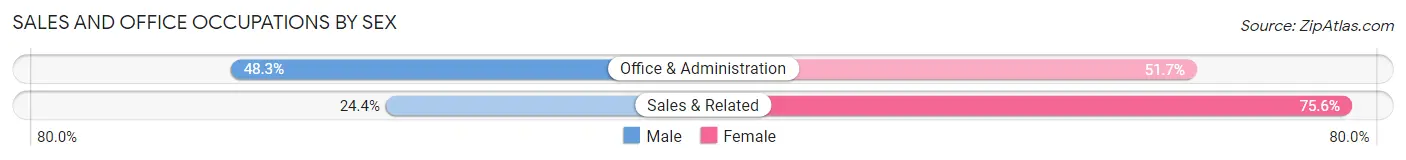
| Occupation | Male | Female |
| Sales & Related | 11 (24.4%) | 34 (75.6%) |
| Office & Administration | 14 (48.3%) | 15 (51.7%) |
| Total (Category) | 25 (33.8%) | 49 (66.2%) |
| Total (Overall) | 120 (47.2%) | 134 (52.8%) |
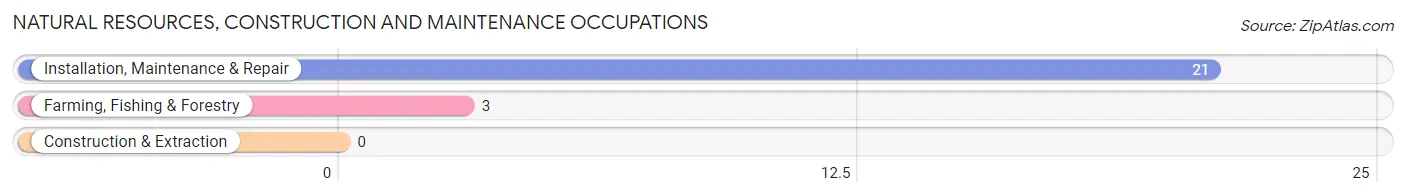
Natural Resources, Construction and Maintenance Occupations
The most common Natural Resources, Construction and Maintenance occupations in Noble are Installation, Maintenance & Repair (21 | 8.3%), and Farming, Fishing & Forestry (3 | 1.2%).
Natural Resources, Construction and Maintenance Occupations by Sex
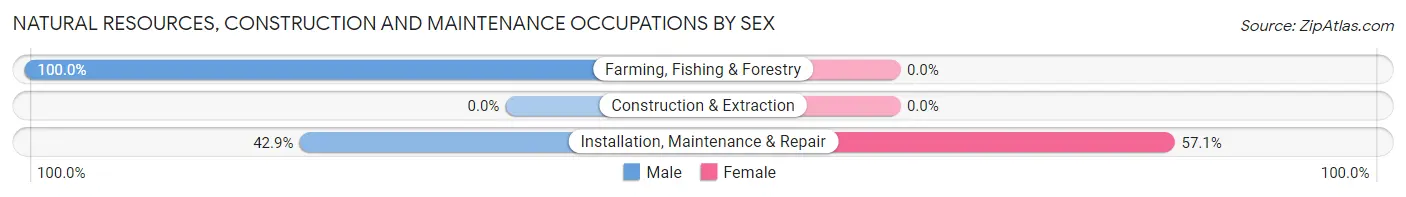
| Occupation | Male | Female |
| Farming, Fishing & Forestry | 3 (100.0%) | 0 (0.0%) |
| Construction & Extraction | 0 (0.0%) | 0 (0.0%) |
| Installation, Maintenance & Repair | 9 (42.9%) | 12 (57.1%) |
| Total (Category) | 12 (50.0%) | 12 (50.0%) |
| Total (Overall) | 120 (47.2%) | 134 (52.8%) |
Production, Transportation and Moving Occupations
The most common Production, Transportation and Moving occupations in Noble are Production (21 | 8.3%), Material Moving (15 | 5.9%), and Transportation (12 | 4.7%).
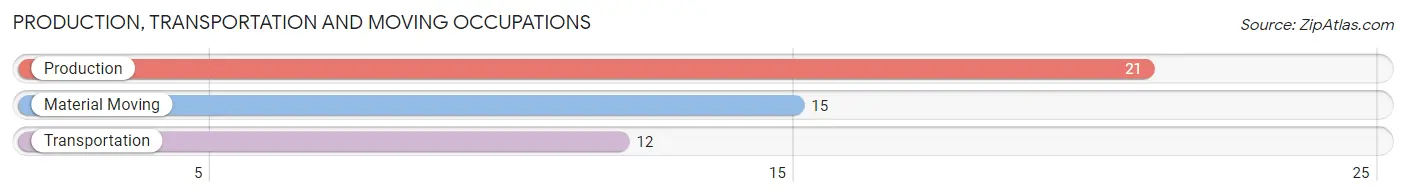
Production, Transportation and Moving Occupations by Sex
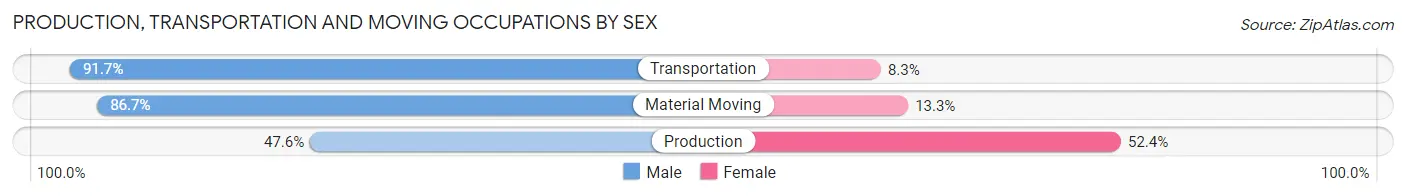
| Occupation | Male | Female |
| Production | 10 (47.6%) | 11 (52.4%) |
| Transportation | 11 (91.7%) | 1 (8.3%) |
| Material Moving | 13 (86.7%) | 2 (13.3%) |
| Total (Category) | 34 (70.8%) | 14 (29.2%) |
| Total (Overall) | 120 (47.2%) | 134 (52.8%) |
Employment Industries by Sex in Noble
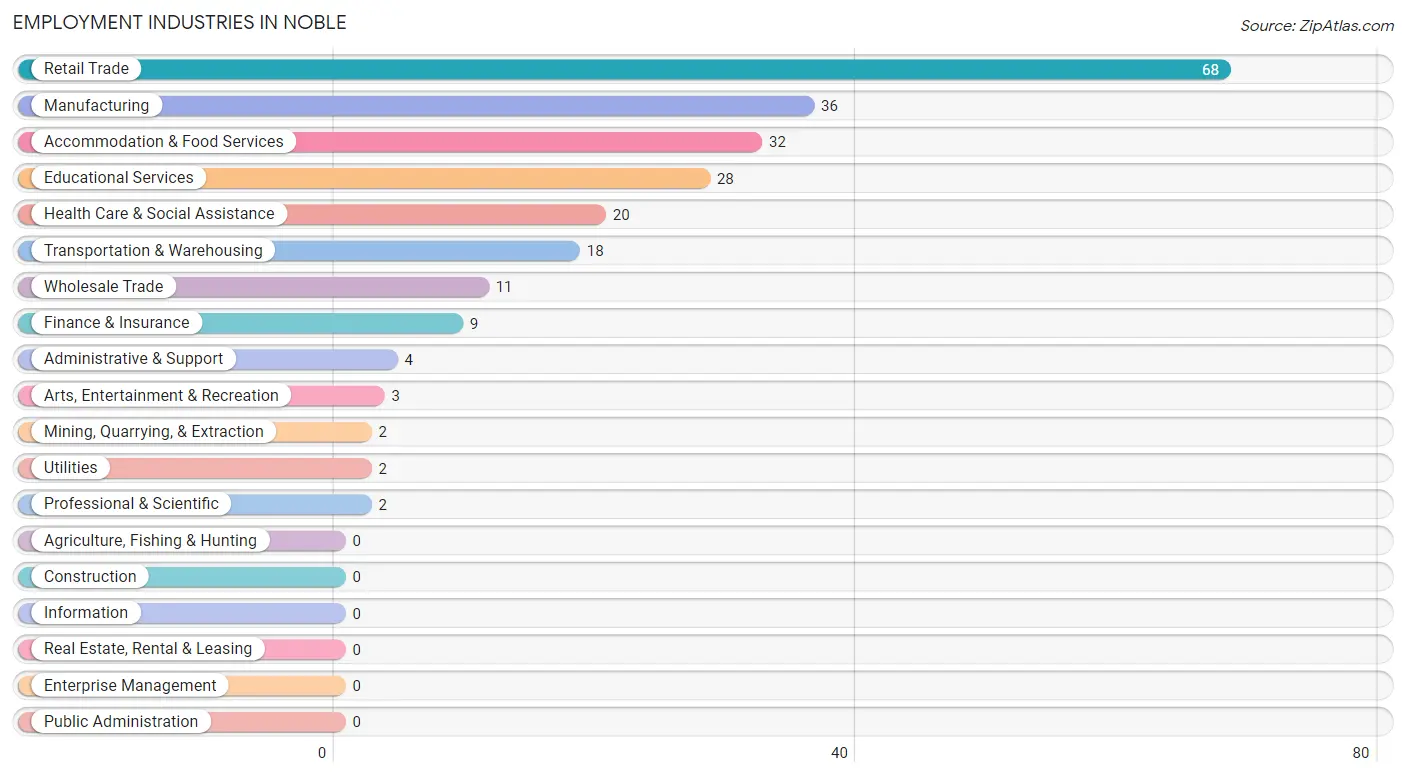
Employment Industries in Noble
The major employment industries in Noble include Retail Trade (68 | 26.8%), Manufacturing (36 | 14.2%), Accommodation & Food Services (32 | 12.6%), Educational Services (28 | 11.0%), and Health Care & Social Assistance (20 | 7.9%).
Employment Industries by Sex in Noble
The Noble industries that see more men than women are Mining, Quarrying, & Extraction (100.0%), Utilities (100.0%), and Professional & Scientific (100.0%), whereas the industries that tend to have a higher number of women are Retail Trade (79.4%), Accommodation & Food Services (78.1%), and Arts, Entertainment & Recreation (66.7%).
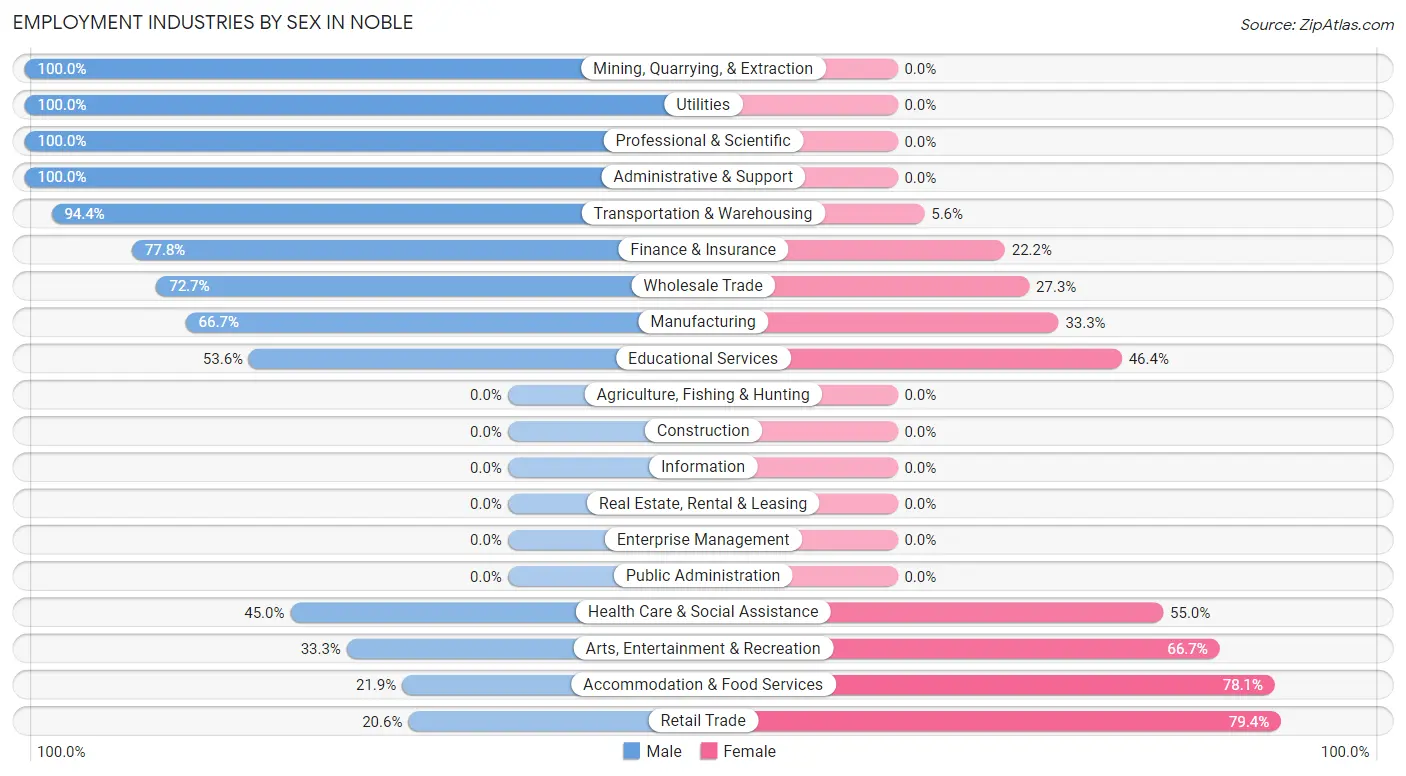
| Industry | Male | Female |
| Agriculture, Fishing & Hunting | 0 (0.0%) | 0 (0.0%) |
| Mining, Quarrying, & Extraction | 2 (100.0%) | 0 (0.0%) |
| Construction | 0 (0.0%) | 0 (0.0%) |
| Manufacturing | 24 (66.7%) | 12 (33.3%) |
| Wholesale Trade | 8 (72.7%) | 3 (27.3%) |
| Retail Trade | 14 (20.6%) | 54 (79.4%) |
| Transportation & Warehousing | 17 (94.4%) | 1 (5.6%) |
| Utilities | 2 (100.0%) | 0 (0.0%) |
| Information | 0 (0.0%) | 0 (0.0%) |
| Finance & Insurance | 7 (77.8%) | 2 (22.2%) |
| Real Estate, Rental & Leasing | 0 (0.0%) | 0 (0.0%) |
| Professional & Scientific | 2 (100.0%) | 0 (0.0%) |
| Enterprise Management | 0 (0.0%) | 0 (0.0%) |
| Administrative & Support | 4 (100.0%) | 0 (0.0%) |
| Educational Services | 15 (53.6%) | 13 (46.4%) |
| Health Care & Social Assistance | 9 (45.0%) | 11 (55.0%) |
| Arts, Entertainment & Recreation | 1 (33.3%) | 2 (66.7%) |
| Accommodation & Food Services | 7 (21.9%) | 25 (78.1%) |
| Public Administration | 0 (0.0%) | 0 (0.0%) |
| Total | 120 (47.2%) | 134 (52.8%) |
Education in Noble
School Enrollment in Noble
The most common levels of schooling among the 84 students in Noble are elementary school (22 | 26.2%), middle school (22 | 26.2%), and high school (17 | 20.2%).
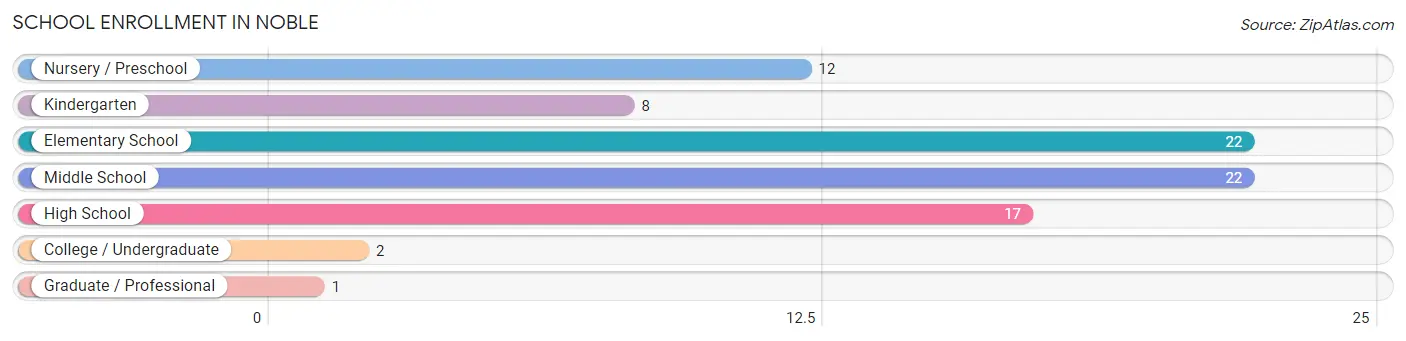
| School Level | # Students | % Students |
| Nursery / Preschool | 12 | 14.3% |
| Kindergarten | 8 | 9.5% |
| Elementary School | 22 | 26.2% |
| Middle School | 22 | 26.2% |
| High School | 17 | 20.2% |
| College / Undergraduate | 2 | 2.4% |
| Graduate / Professional | 1 | 1.2% |
| Total | 84 | 100.0% |
School Enrollment by Age by Funding Source in Noble
Out of a total of 84 students who are enrolled in schools in Noble, 6 (7.1%) attend a private institution, while the remaining 78 (92.9%) are enrolled in public schools. The age group of 10 to 14 year olds has the highest likelihood of being enrolled in private schools, with 6 (27.3% in the age bracket) enrolled. Conversely, the age group of 3 to 4 year olds has the lowest likelihood of being enrolled in a private school, with 5 (100.0% in the age bracket) attending a public institution.
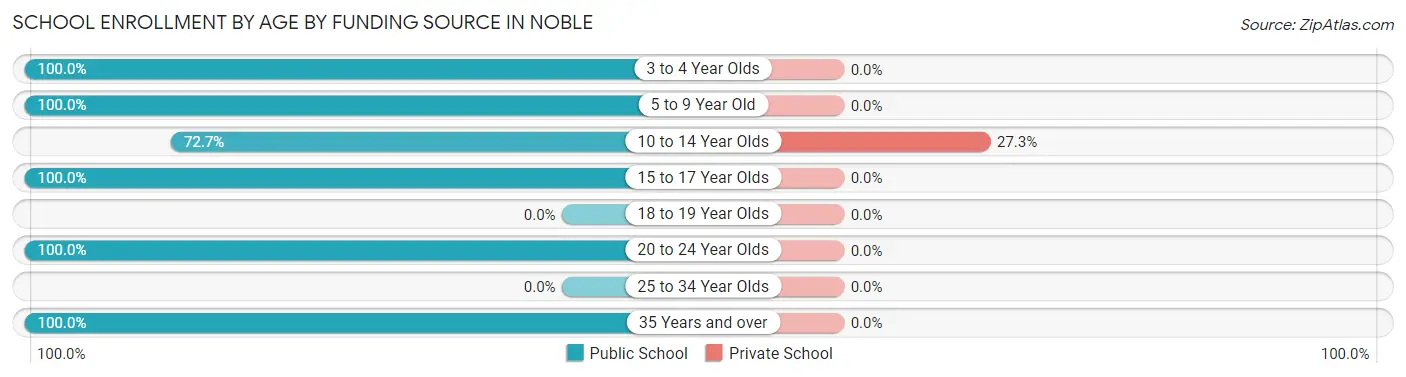
| Age Bracket | Public School | Private School |
| 3 to 4 Year Olds | 5 (100.0%) | 0 (0.0%) |
| 5 to 9 Year Old | 37 (100.0%) | 0 (0.0%) |
| 10 to 14 Year Olds | 16 (72.7%) | 6 (27.3%) |
| 15 to 17 Year Olds | 17 (100.0%) | 0 (0.0%) |
| 18 to 19 Year Olds | 0 (0.0%) | 0 (0.0%) |
| 20 to 24 Year Olds | 2 (100.0%) | 0 (0.0%) |
| 25 to 34 Year Olds | 0 (0.0%) | 0 (0.0%) |
| 35 Years and over | 1 (100.0%) | 0 (0.0%) |
| Total | 78 (92.9%) | 6 (7.1%) |
Educational Attainment by Field of Study in Noble
Education (31 | 64.6%), business (5 | 10.4%), liberal arts & history (4 | 8.3%), social sciences (3 | 6.2%), and science & technology (2 | 4.2%) are the most common fields of study among 48 individuals in Noble who have obtained a bachelor's degree or higher.
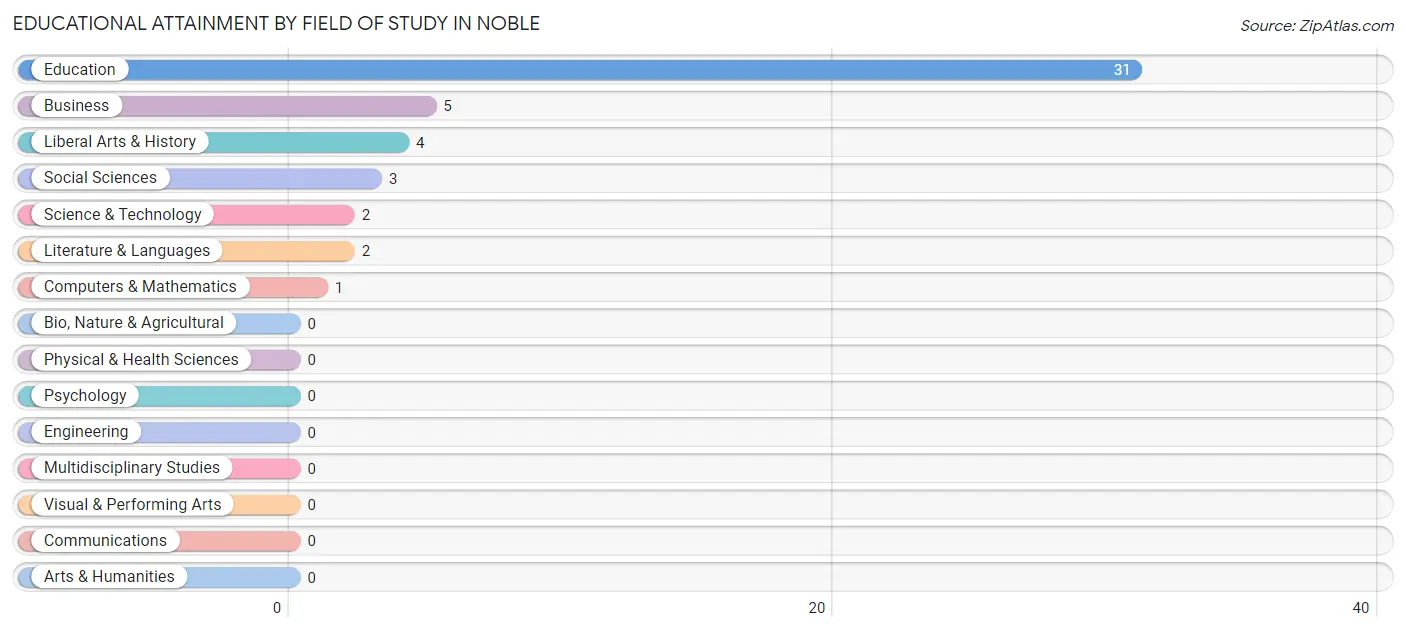
| Field of Study | # Graduates | % Graduates |
| Computers & Mathematics | 1 | 2.1% |
| Bio, Nature & Agricultural | 0 | 0.0% |
| Physical & Health Sciences | 0 | 0.0% |
| Psychology | 0 | 0.0% |
| Social Sciences | 3 | 6.2% |
| Engineering | 0 | 0.0% |
| Multidisciplinary Studies | 0 | 0.0% |
| Science & Technology | 2 | 4.2% |
| Business | 5 | 10.4% |
| Education | 31 | 64.6% |
| Literature & Languages | 2 | 4.2% |
| Liberal Arts & History | 4 | 8.3% |
| Visual & Performing Arts | 0 | 0.0% |
| Communications | 0 | 0.0% |
| Arts & Humanities | 0 | 0.0% |
| Total | 48 | 100.0% |
Transportation & Commute in Noble
Vehicle Availability by Sex in Noble
The most prevalent vehicle ownership categories in Noble are males with 2 vehicles (71, accounting for 59.2%) and females with 2 vehicles (73, making up 53.0%).
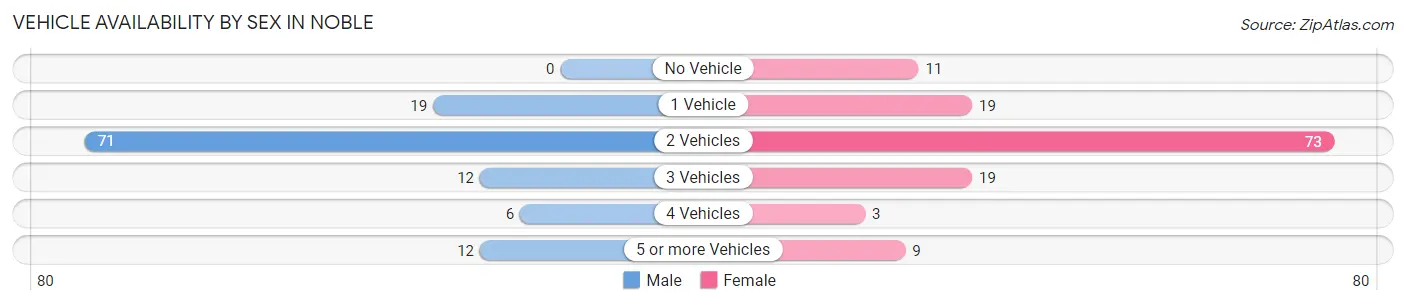
| Vehicles Available | Male | Female |
| No Vehicle | 0 (0.0%) | 11 (8.2%) |
| 1 Vehicle | 19 (15.8%) | 19 (14.2%) |
| 2 Vehicles | 71 (59.2%) | 73 (54.5%) |
| 3 Vehicles | 12 (10.0%) | 19 (14.2%) |
| 4 Vehicles | 6 (5.0%) | 3 (2.2%) |
| 5 or more Vehicles | 12 (10.0%) | 9 (6.7%) |
| Total | 120 (100.0%) | 134 (100.0%) |
Commute Time in Noble
The most frequently occuring commute durations in Noble are 10 to 14 minutes (77 commuters, 31.3%), 15 to 19 minutes (52 commuters, 21.1%), and 5 to 9 minutes (35 commuters, 14.2%).
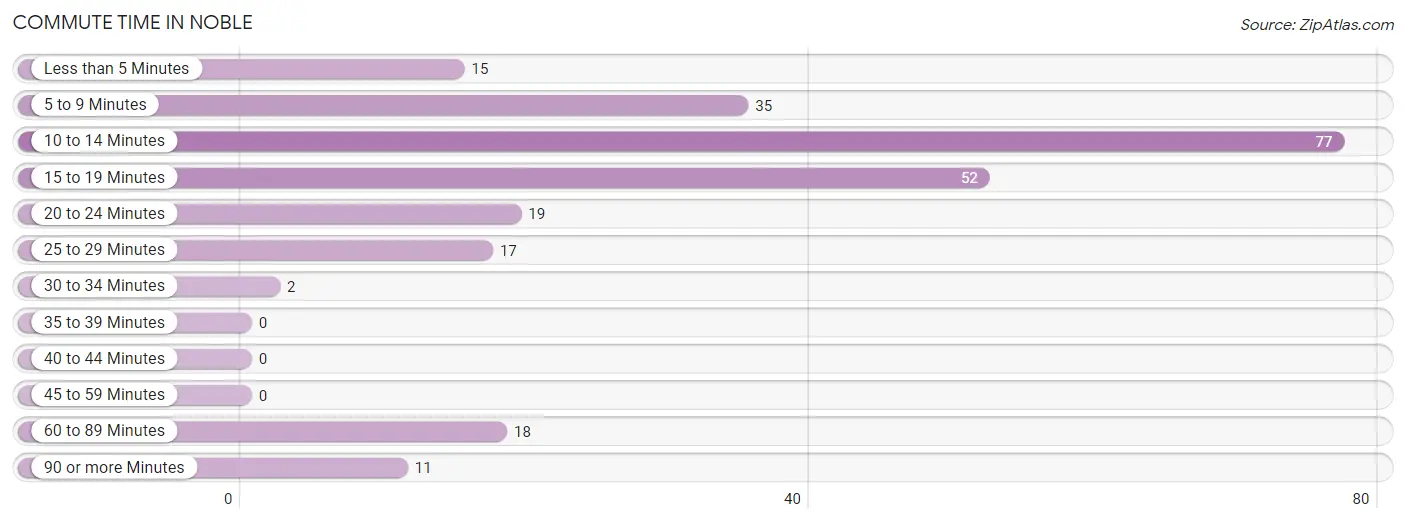
| Commute Time | # Commuters | % Commuters |
| Less than 5 Minutes | 15 | 6.1% |
| 5 to 9 Minutes | 35 | 14.2% |
| 10 to 14 Minutes | 77 | 31.3% |
| 15 to 19 Minutes | 52 | 21.1% |
| 20 to 24 Minutes | 19 | 7.7% |
| 25 to 29 Minutes | 17 | 6.9% |
| 30 to 34 Minutes | 2 | 0.8% |
| 35 to 39 Minutes | 0 | 0.0% |
| 40 to 44 Minutes | 0 | 0.0% |
| 45 to 59 Minutes | 0 | 0.0% |
| 60 to 89 Minutes | 18 | 7.3% |
| 90 or more Minutes | 11 | 4.5% |
Commute Time by Sex in Noble
The most common commute times in Noble are 10 to 14 minutes (39 commuters, 33.1%) for males and 10 to 14 minutes (38 commuters, 29.7%) for females.
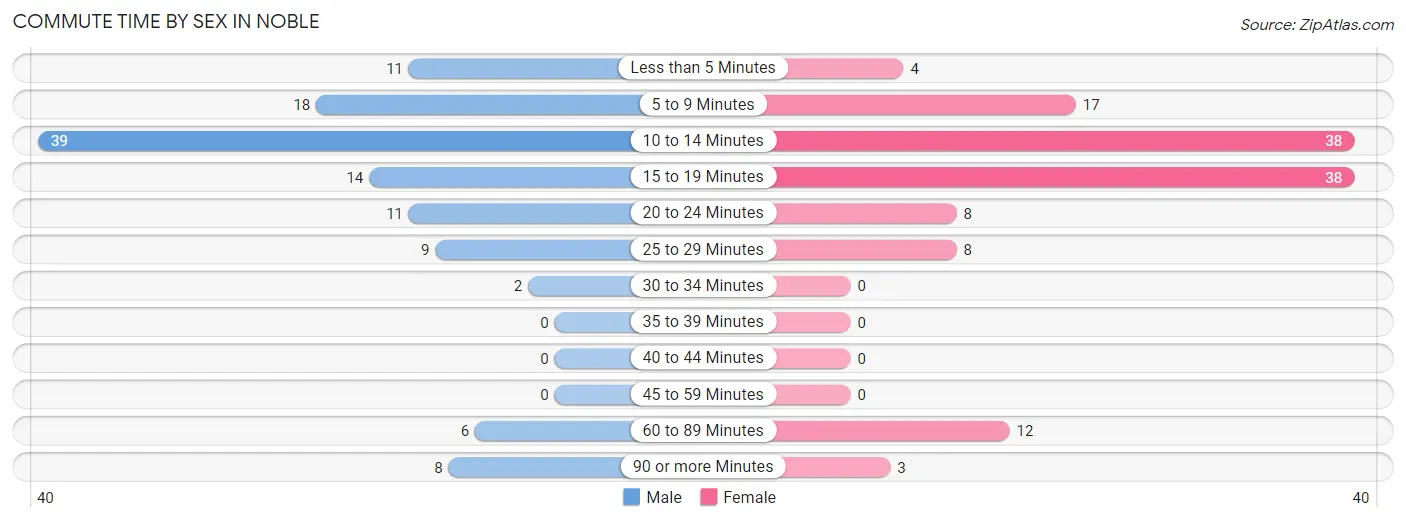
| Commute Time | Male | Female |
| Less than 5 Minutes | 11 (9.3%) | 4 (3.1%) |
| 5 to 9 Minutes | 18 (15.2%) | 17 (13.3%) |
| 10 to 14 Minutes | 39 (33.1%) | 38 (29.7%) |
| 15 to 19 Minutes | 14 (11.9%) | 38 (29.7%) |
| 20 to 24 Minutes | 11 (9.3%) | 8 (6.2%) |
| 25 to 29 Minutes | 9 (7.6%) | 8 (6.2%) |
| 30 to 34 Minutes | 2 (1.7%) | 0 (0.0%) |
| 35 to 39 Minutes | 0 (0.0%) | 0 (0.0%) |
| 40 to 44 Minutes | 0 (0.0%) | 0 (0.0%) |
| 45 to 59 Minutes | 0 (0.0%) | 0 (0.0%) |
| 60 to 89 Minutes | 6 (5.1%) | 12 (9.4%) |
| 90 or more Minutes | 8 (6.8%) | 3 (2.3%) |
Time of Departure to Work by Sex in Noble
The most frequent times of departure to work in Noble are 12:00 AM to 4:59 AM (27, 22.9%) for males and 7:30 AM to 7:59 AM (28, 21.9%) for females.
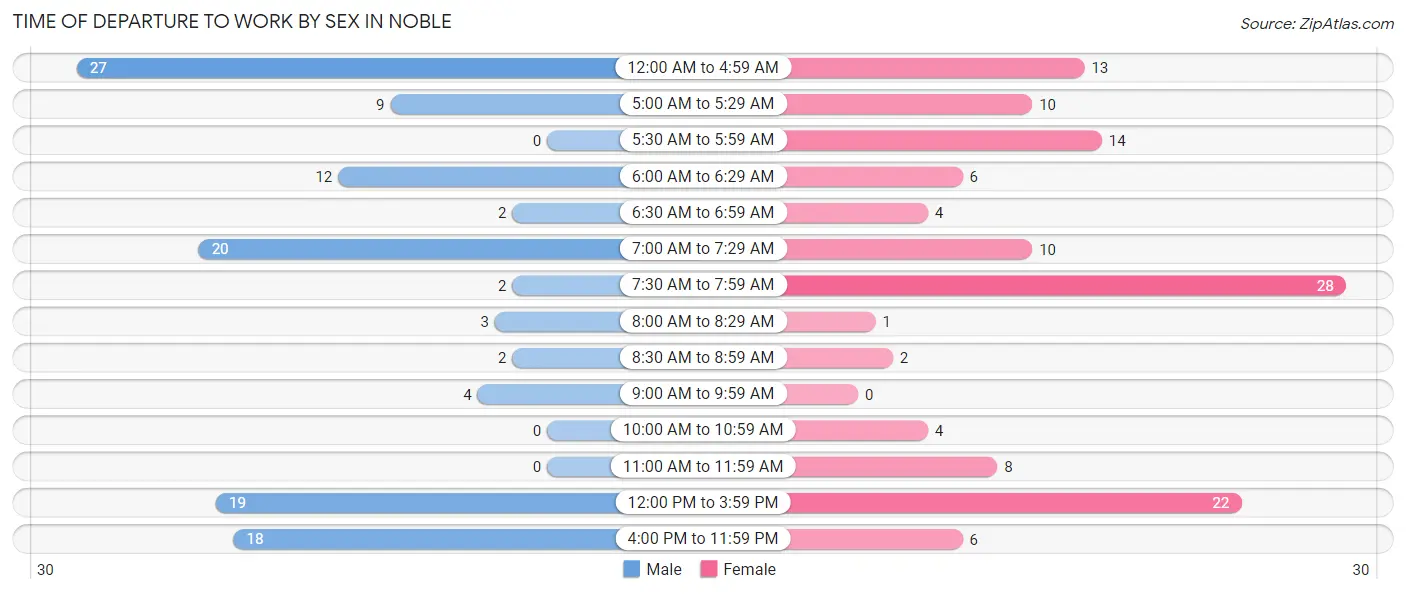
| Time of Departure | Male | Female |
| 12:00 AM to 4:59 AM | 27 (22.9%) | 13 (10.2%) |
| 5:00 AM to 5:29 AM | 9 (7.6%) | 10 (7.8%) |
| 5:30 AM to 5:59 AM | 0 (0.0%) | 14 (10.9%) |
| 6:00 AM to 6:29 AM | 12 (10.2%) | 6 (4.7%) |
| 6:30 AM to 6:59 AM | 2 (1.7%) | 4 (3.1%) |
| 7:00 AM to 7:29 AM | 20 (17.0%) | 10 (7.8%) |
| 7:30 AM to 7:59 AM | 2 (1.7%) | 28 (21.9%) |
| 8:00 AM to 8:29 AM | 3 (2.5%) | 1 (0.8%) |
| 8:30 AM to 8:59 AM | 2 (1.7%) | 2 (1.6%) |
| 9:00 AM to 9:59 AM | 4 (3.4%) | 0 (0.0%) |
| 10:00 AM to 10:59 AM | 0 (0.0%) | 4 (3.1%) |
| 11:00 AM to 11:59 AM | 0 (0.0%) | 8 (6.2%) |
| 12:00 PM to 3:59 PM | 19 (16.1%) | 22 (17.2%) |
| 4:00 PM to 11:59 PM | 18 (15.2%) | 6 (4.7%) |
| Total | 118 (100.0%) | 128 (100.0%) |
Housing Occupancy in Noble
Occupancy by Ownership in Noble
Of the total 289 dwellings in Noble, owner-occupied units account for 209 (72.3%), while renter-occupied units make up 80 (27.7%).
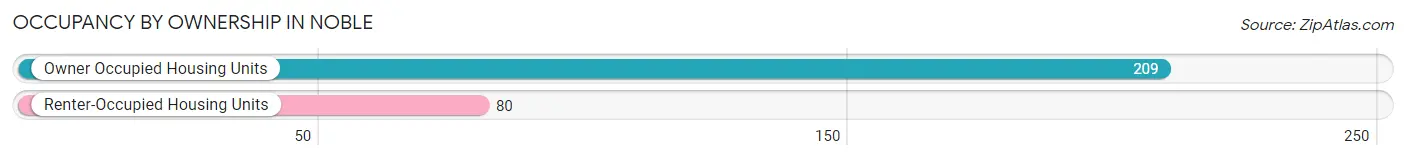
| Occupancy | # Housing Units | % Housing Units |
| Owner Occupied Housing Units | 209 | 72.3% |
| Renter-Occupied Housing Units | 80 | 27.7% |
| Total Occupied Housing Units | 289 | 100.0% |
Occupancy by Household Size in Noble
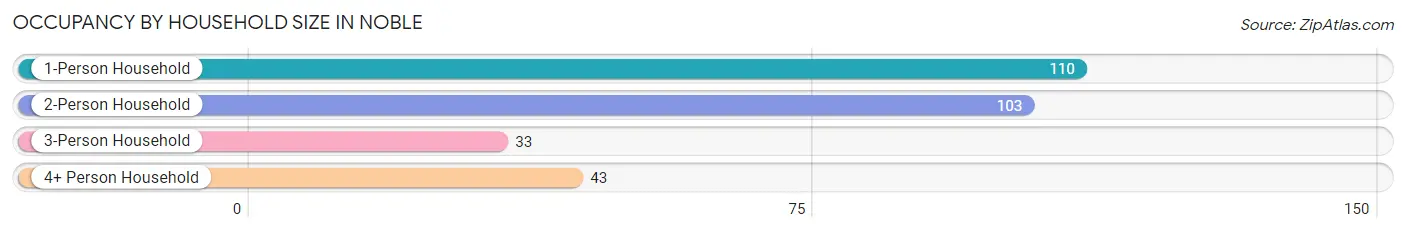
| Household Size | # Housing Units | % Housing Units |
| 1-Person Household | 110 | 38.1% |
| 2-Person Household | 103 | 35.6% |
| 3-Person Household | 33 | 11.4% |
| 4+ Person Household | 43 | 14.9% |
| Total Housing Units | 289 | 100.0% |
Occupancy by Ownership by Household Size in Noble
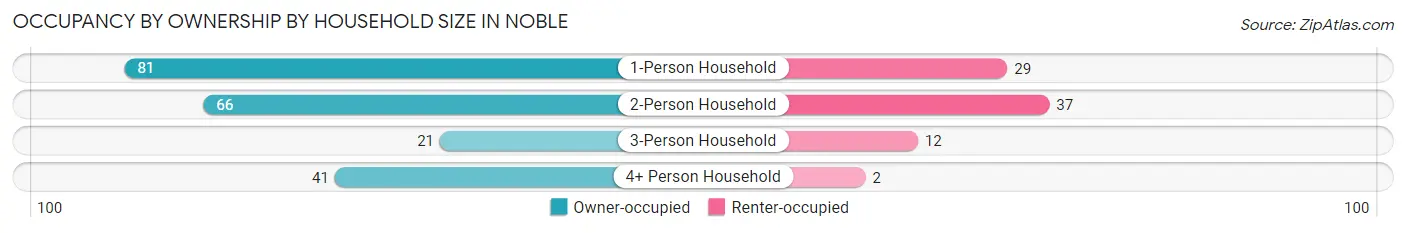
| Household Size | Owner-occupied | Renter-occupied |
| 1-Person Household | 81 (73.6%) | 29 (26.4%) |
| 2-Person Household | 66 (64.1%) | 37 (35.9%) |
| 3-Person Household | 21 (63.6%) | 12 (36.4%) |
| 4+ Person Household | 41 (95.4%) | 2 (4.6%) |
| Total Housing Units | 209 (72.3%) | 80 (27.7%) |
Occupancy by Educational Attainment in Noble
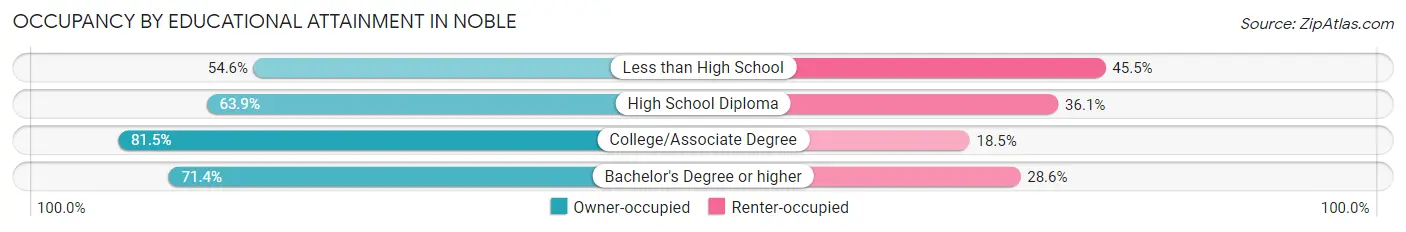
| Household Size | Owner-occupied | Renter-occupied |
| Less than High School | 12 (54.5%) | 10 (45.5%) |
| High School Diploma | 62 (63.9%) | 35 (36.1%) |
| College/Associate Degree | 110 (81.5%) | 25 (18.5%) |
| Bachelor's Degree or higher | 25 (71.4%) | 10 (28.6%) |
Occupancy by Age of Householder in Noble
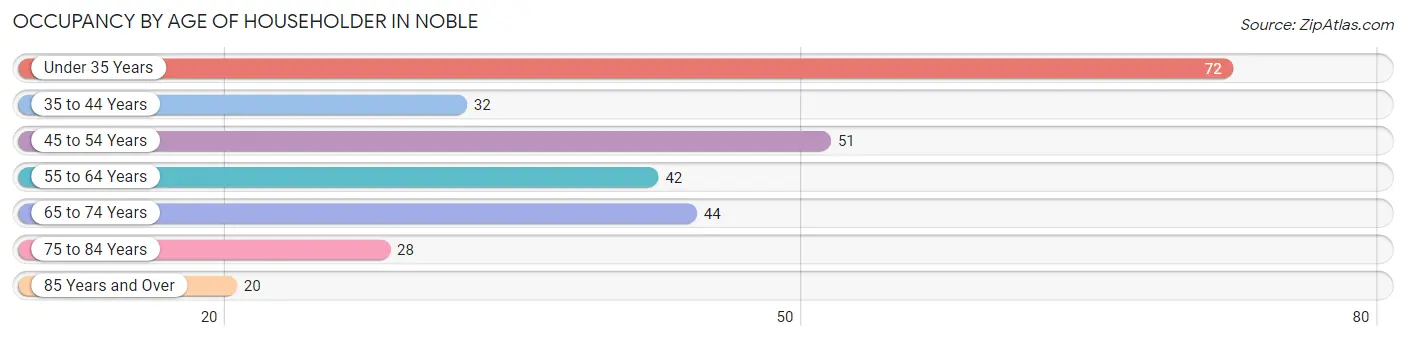
| Age Bracket | # Households | % Households |
| Under 35 Years | 72 | 24.9% |
| 35 to 44 Years | 32 | 11.1% |
| 45 to 54 Years | 51 | 17.6% |
| 55 to 64 Years | 42 | 14.5% |
| 65 to 74 Years | 44 | 15.2% |
| 75 to 84 Years | 28 | 9.7% |
| 85 Years and Over | 20 | 6.9% |
| Total | 289 | 100.0% |
Housing Finances in Noble
Median Income by Occupancy in Noble
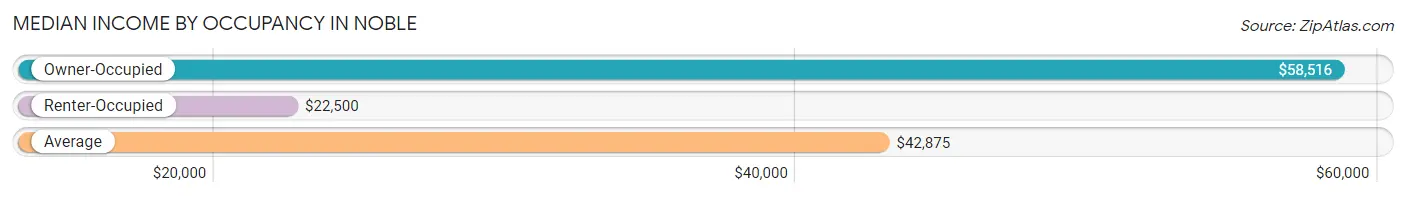
| Occupancy Type | # Households | Median Income |
| Owner-Occupied | 209 (72.3%) | $58,516 |
| Renter-Occupied | 80 (27.7%) | $22,500 |
| Average | 289 (100.0%) | $42,875 |
Occupancy by Householder Income Bracket in Noble
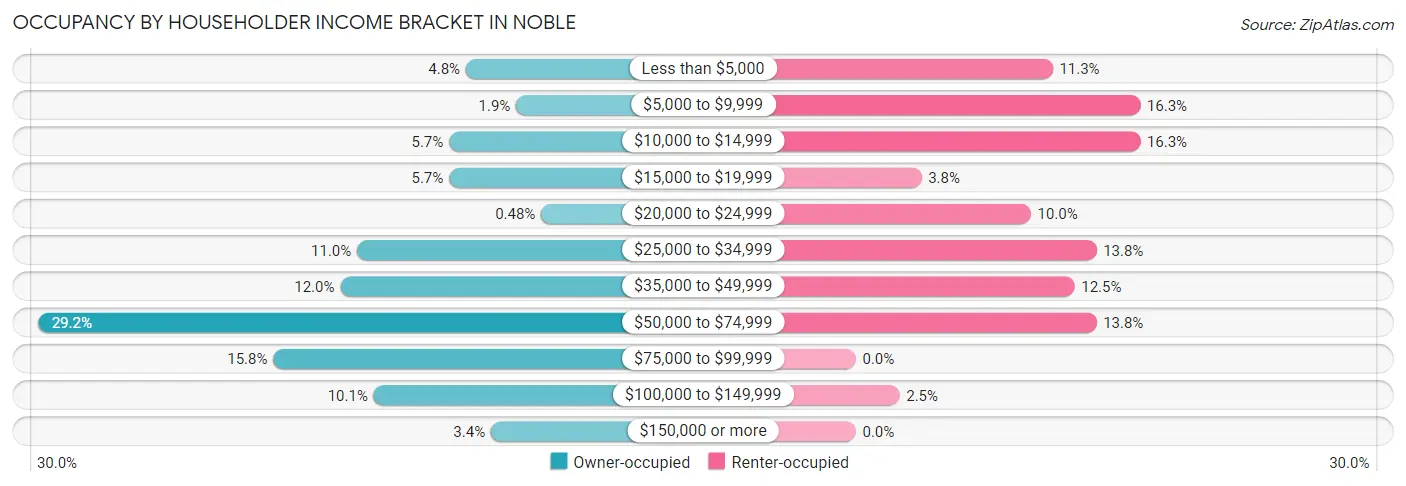
| Income Bracket | Owner-occupied | Renter-occupied |
| Less than $5,000 | 10 (4.8%) | 9 (11.3%) |
| $5,000 to $9,999 | 4 (1.9%) | 13 (16.3%) |
| $10,000 to $14,999 | 12 (5.7%) | 13 (16.3%) |
| $15,000 to $19,999 | 12 (5.7%) | 3 (3.7%) |
| $20,000 to $24,999 | 1 (0.5%) | 8 (10.0%) |
| $25,000 to $34,999 | 23 (11.0%) | 11 (13.8%) |
| $35,000 to $49,999 | 25 (12.0%) | 10 (12.5%) |
| $50,000 to $74,999 | 61 (29.2%) | 11 (13.8%) |
| $75,000 to $99,999 | 33 (15.8%) | 0 (0.0%) |
| $100,000 to $149,999 | 21 (10.1%) | 2 (2.5%) |
| $150,000 or more | 7 (3.4%) | 0 (0.0%) |
| Total | 209 (100.0%) | 80 (100.0%) |
Monthly Housing Cost Tiers in Noble
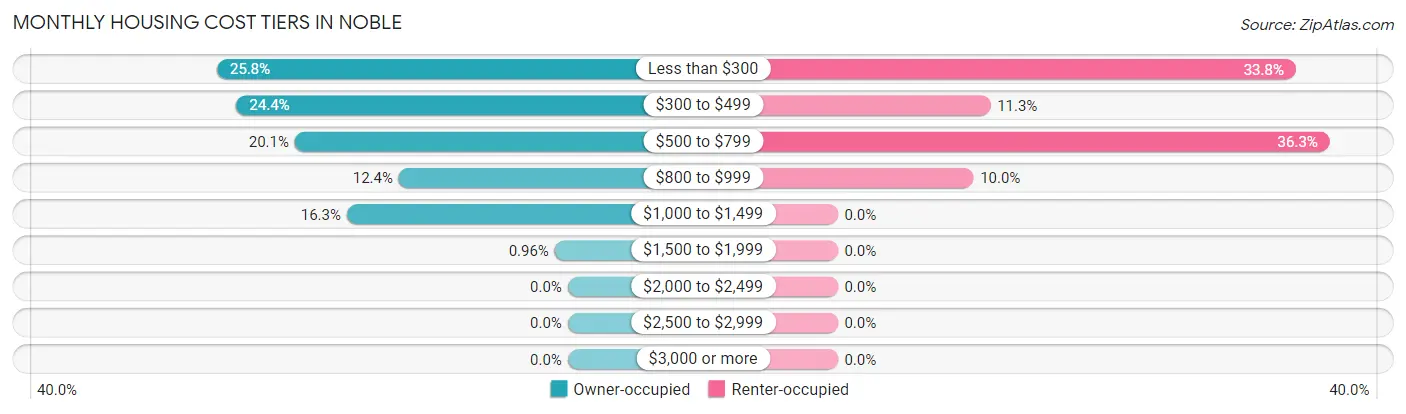
| Monthly Cost | Owner-occupied | Renter-occupied |
| Less than $300 | 54 (25.8%) | 27 (33.8%) |
| $300 to $499 | 51 (24.4%) | 9 (11.3%) |
| $500 to $799 | 42 (20.1%) | 29 (36.2%) |
| $800 to $999 | 26 (12.4%) | 8 (10.0%) |
| $1,000 to $1,499 | 34 (16.3%) | 0 (0.0%) |
| $1,500 to $1,999 | 2 (1.0%) | 0 (0.0%) |
| $2,000 to $2,499 | 0 (0.0%) | 0 (0.0%) |
| $2,500 to $2,999 | 0 (0.0%) | 0 (0.0%) |
| $3,000 or more | 0 (0.0%) | 0 (0.0%) |
| Total | 209 (100.0%) | 80 (100.0%) |
Physical Housing Characteristics in Noble
Housing Structures in Noble
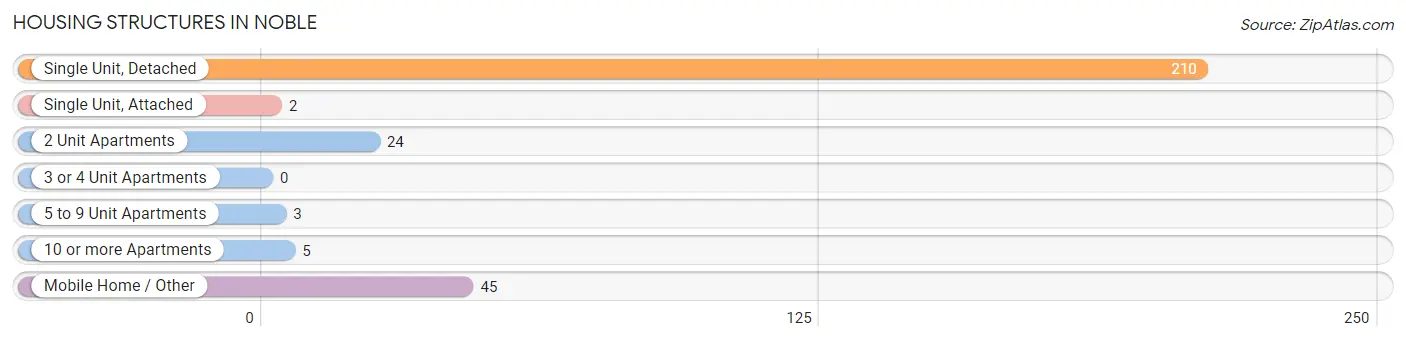
| Structure Type | # Housing Units | % Housing Units |
| Single Unit, Detached | 210 | 72.7% |
| Single Unit, Attached | 2 | 0.7% |
| 2 Unit Apartments | 24 | 8.3% |
| 3 or 4 Unit Apartments | 0 | 0.0% |
| 5 to 9 Unit Apartments | 3 | 1.0% |
| 10 or more Apartments | 5 | 1.7% |
| Mobile Home / Other | 45 | 15.6% |
| Total | 289 | 100.0% |
Housing Structures by Occupancy in Noble
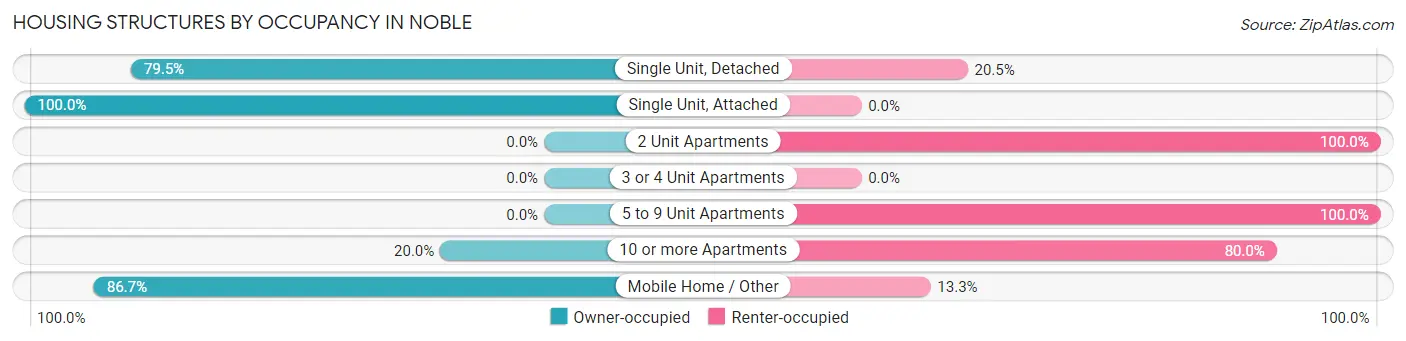
| Structure Type | Owner-occupied | Renter-occupied |
| Single Unit, Detached | 167 (79.5%) | 43 (20.5%) |
| Single Unit, Attached | 2 (100.0%) | 0 (0.0%) |
| 2 Unit Apartments | 0 (0.0%) | 24 (100.0%) |
| 3 or 4 Unit Apartments | 0 (0.0%) | 0 (0.0%) |
| 5 to 9 Unit Apartments | 0 (0.0%) | 3 (100.0%) |
| 10 or more Apartments | 1 (20.0%) | 4 (80.0%) |
| Mobile Home / Other | 39 (86.7%) | 6 (13.3%) |
| Total | 209 (72.3%) | 80 (27.7%) |
Housing Structures by Number of Rooms in Noble
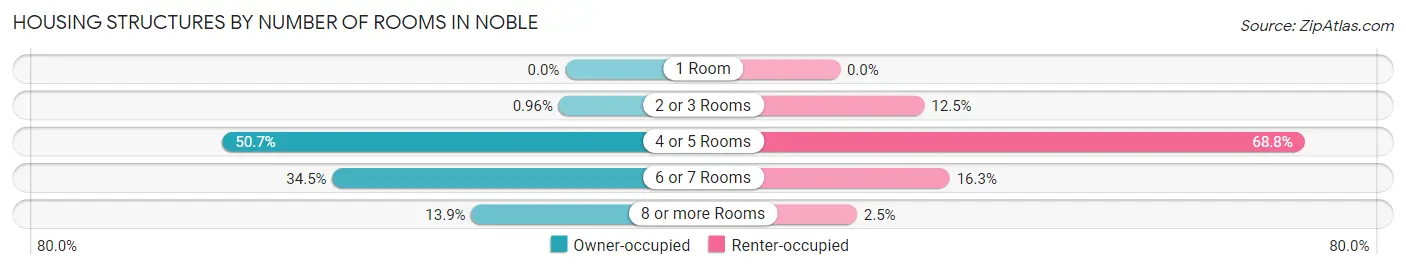
| Number of Rooms | Owner-occupied | Renter-occupied |
| 1 Room | 0 (0.0%) | 0 (0.0%) |
| 2 or 3 Rooms | 2 (1.0%) | 10 (12.5%) |
| 4 or 5 Rooms | 106 (50.7%) | 55 (68.8%) |
| 6 or 7 Rooms | 72 (34.4%) | 13 (16.3%) |
| 8 or more Rooms | 29 (13.9%) | 2 (2.5%) |
| Total | 209 (100.0%) | 80 (100.0%) |
Housing Structure by Heating Type in Noble
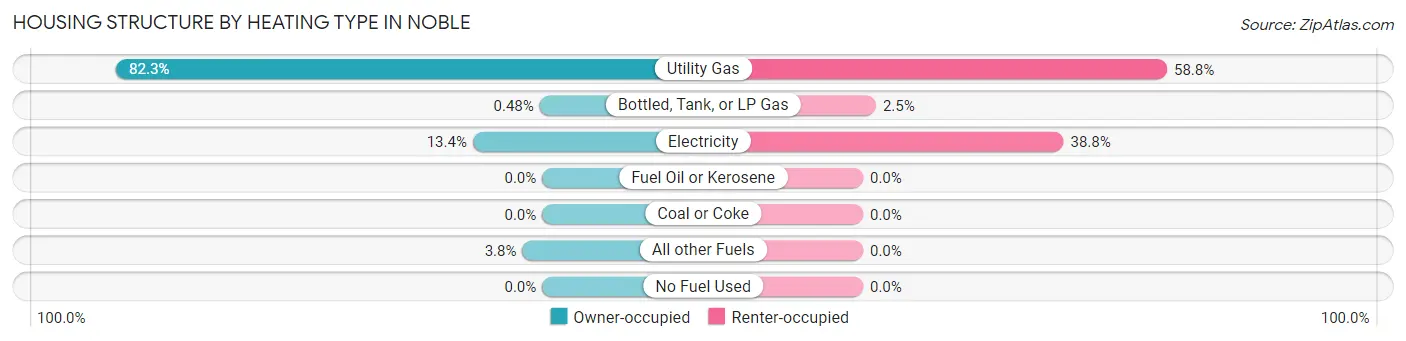
| Heating Type | Owner-occupied | Renter-occupied |
| Utility Gas | 172 (82.3%) | 47 (58.8%) |
| Bottled, Tank, or LP Gas | 1 (0.5%) | 2 (2.5%) |
| Electricity | 28 (13.4%) | 31 (38.8%) |
| Fuel Oil or Kerosene | 0 (0.0%) | 0 (0.0%) |
| Coal or Coke | 0 (0.0%) | 0 (0.0%) |
| All other Fuels | 8 (3.8%) | 0 (0.0%) |
| No Fuel Used | 0 (0.0%) | 0 (0.0%) |
| Total | 209 (100.0%) | 80 (100.0%) |
Household Vehicle Usage in Noble
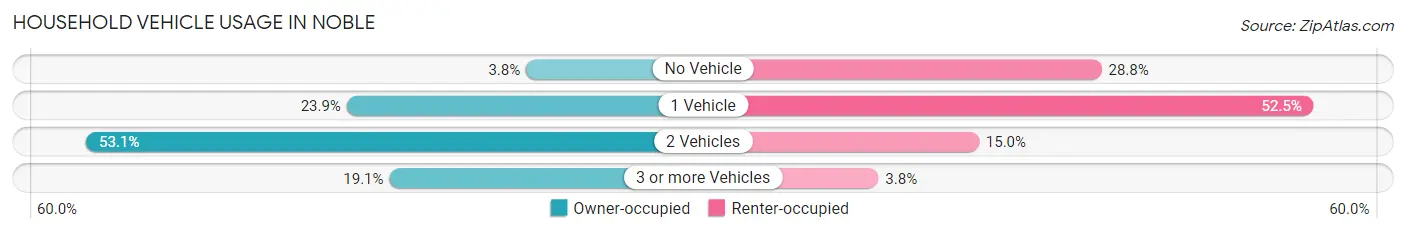
| Vehicles per Household | Owner-occupied | Renter-occupied |
| No Vehicle | 8 (3.8%) | 23 (28.7%) |
| 1 Vehicle | 50 (23.9%) | 42 (52.5%) |
| 2 Vehicles | 111 (53.1%) | 12 (15.0%) |
| 3 or more Vehicles | 40 (19.1%) | 3 (3.7%) |
| Total | 209 (100.0%) | 80 (100.0%) |
Real Estate & Mortgages in Noble
Real Estate and Mortgage Overview in Noble
| Characteristic | Without Mortgage | With Mortgage |
| Housing Units | 129 | 80 |
| Median Property Value | $39,800 | $75,000 |
| Median Household Income | $39,306 | $4 |
| Monthly Housing Costs | $348 | $0 |
| Real Estate Taxes | $700 | $0 |
Property Value by Mortgage Status in Noble
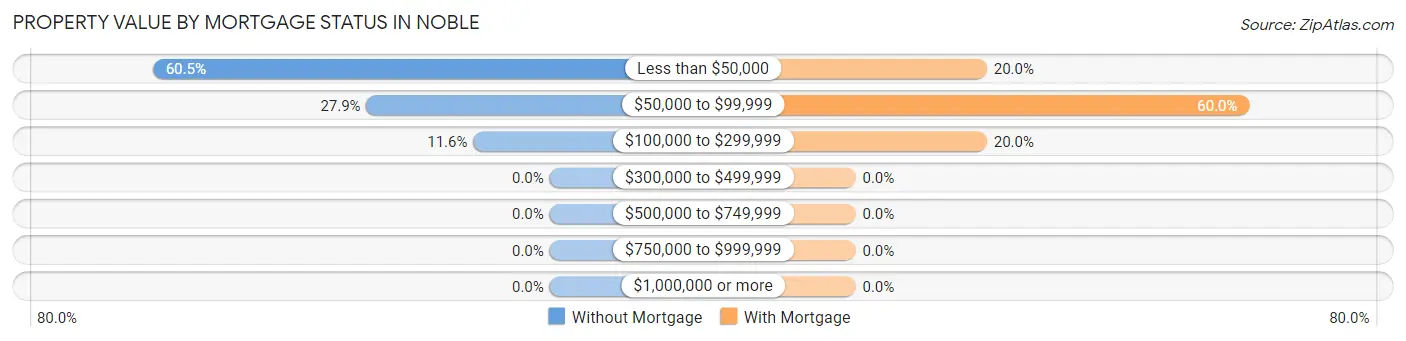
| Property Value | Without Mortgage | With Mortgage |
| Less than $50,000 | 78 (60.5%) | 16 (20.0%) |
| $50,000 to $99,999 | 36 (27.9%) | 48 (60.0%) |
| $100,000 to $299,999 | 15 (11.6%) | 16 (20.0%) |
| $300,000 to $499,999 | 0 (0.0%) | 0 (0.0%) |
| $500,000 to $749,999 | 0 (0.0%) | 0 (0.0%) |
| $750,000 to $999,999 | 0 (0.0%) | 0 (0.0%) |
| $1,000,000 or more | 0 (0.0%) | 0 (0.0%) |
| Total | 129 (100.0%) | 80 (100.0%) |
Household Income by Mortgage Status in Noble
| Household Income | Without Mortgage | With Mortgage |
| Less than $10,000 | 13 (10.1%) | 0 (0.0%) |
| $10,000 to $24,999 | 23 (17.8%) | 1 (1.3%) |
| $25,000 to $34,999 | 21 (16.3%) | 2 (2.5%) |
| $35,000 to $49,999 | 24 (18.6%) | 2 (2.5%) |
| $50,000 to $74,999 | 25 (19.4%) | 1 (1.3%) |
| $75,000 to $99,999 | 10 (7.7%) | 36 (45.0%) |
| $100,000 to $149,999 | 10 (7.7%) | 23 (28.7%) |
| $150,000 or more | 3 (2.3%) | 11 (13.8%) |
| Total | 129 (100.0%) | 80 (100.0%) |
Property Value to Household Income Ratio in Noble
| Value-to-Income Ratio | Without Mortgage | With Mortgage |
| Less than 2.0x | 87 (67.4%) | 72,500 (90,625.0%) |
| 2.0x to 2.9x | 11 (8.5%) | 71 (88.7%) |
| 3.0x to 3.9x | 2 (1.5%) | 6 (7.5%) |
| 4.0x or more | 22 (17.1%) | 0 (0.0%) |
| Total | 129 (100.0%) | 80 (100.0%) |
Real Estate Taxes by Mortgage Status in Noble
| Property Taxes | Without Mortgage | With Mortgage |
| Less than $800 | 48 (37.2%) | 0 (0.0%) |
| $800 to $1,499 | 22 (17.1%) | 29 (36.2%) |
| $800 to $1,499 | 18 (14.0%) | 18 (22.5%) |
| Total | 129 (100.0%) | 80 (100.0%) |
Health & Disability in Noble
Health Insurance Coverage by Age in Noble
| Age Bracket | With Coverage | Without Coverage |
| Under 6 Years | 43 (100.0%) | 0 (0.0%) |
| 6 to 18 Years | 84 (100.0%) | 0 (0.0%) |
| 19 to 25 Years | 29 (100.0%) | 0 (0.0%) |
| 26 to 34 Years | 111 (75.5%) | 36 (24.5%) |
| 35 to 44 Years | 53 (80.3%) | 13 (19.7%) |
| 45 to 54 Years | 62 (75.6%) | 20 (24.4%) |
| 55 to 64 Years | 73 (93.6%) | 5 (6.4%) |
| 65 to 74 Years | 55 (100.0%) | 0 (0.0%) |
| 75 Years and older | 65 (100.0%) | 0 (0.0%) |
| Total | 575 (88.6%) | 74 (11.4%) |
Health Insurance Coverage by Citizenship Status in Noble
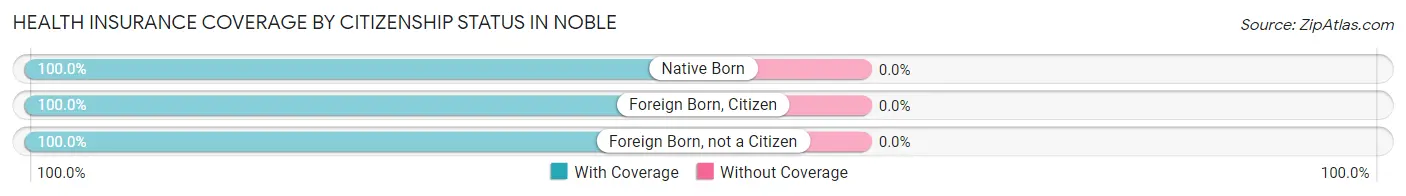
| Citizenship Status | With Coverage | Without Coverage |
| Native Born | 43 (100.0%) | 0 (0.0%) |
| Foreign Born, Citizen | 84 (100.0%) | 0 (0.0%) |
| Foreign Born, not a Citizen | 29 (100.0%) | 0 (0.0%) |
Health Insurance Coverage by Household Income in Noble
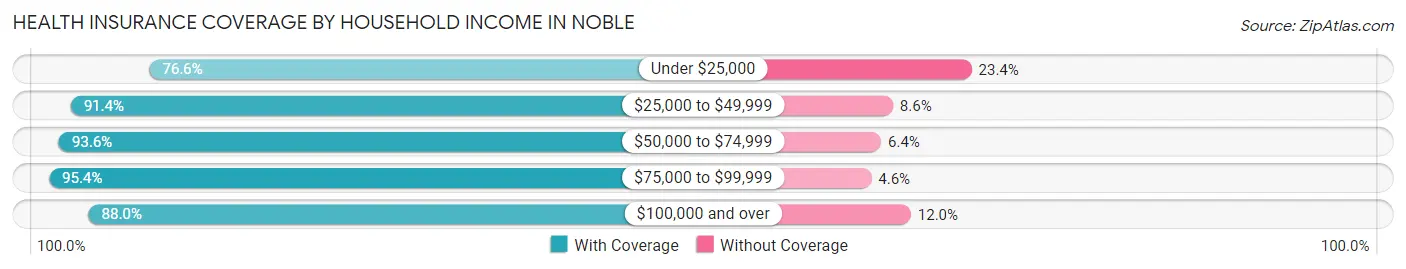
| Household Income | With Coverage | Without Coverage |
| Under $25,000 | 118 (76.6%) | 36 (23.4%) |
| $25,000 to $49,999 | 148 (91.4%) | 14 (8.6%) |
| $50,000 to $74,999 | 160 (93.6%) | 11 (6.4%) |
| $75,000 to $99,999 | 83 (95.4%) | 4 (4.6%) |
| $100,000 and over | 66 (88.0%) | 9 (12.0%) |
Public vs Private Health Insurance Coverage by Age in Noble
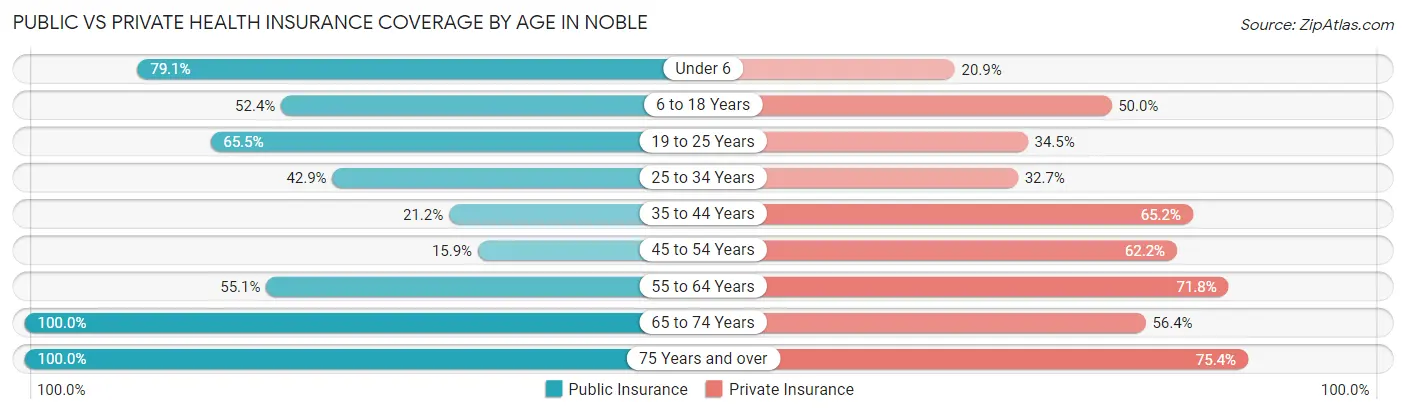
| Age Bracket | Public Insurance | Private Insurance |
| Under 6 | 34 (79.1%) | 9 (20.9%) |
| 6 to 18 Years | 44 (52.4%) | 42 (50.0%) |
| 19 to 25 Years | 19 (65.5%) | 10 (34.5%) |
| 25 to 34 Years | 63 (42.9%) | 48 (32.7%) |
| 35 to 44 Years | 14 (21.2%) | 43 (65.1%) |
| 45 to 54 Years | 13 (15.9%) | 51 (62.2%) |
| 55 to 64 Years | 43 (55.1%) | 56 (71.8%) |
| 65 to 74 Years | 55 (100.0%) | 31 (56.4%) |
| 75 Years and over | 65 (100.0%) | 49 (75.4%) |
| Total | 350 (53.9%) | 339 (52.2%) |
Disability Status by Sex by Age in Noble
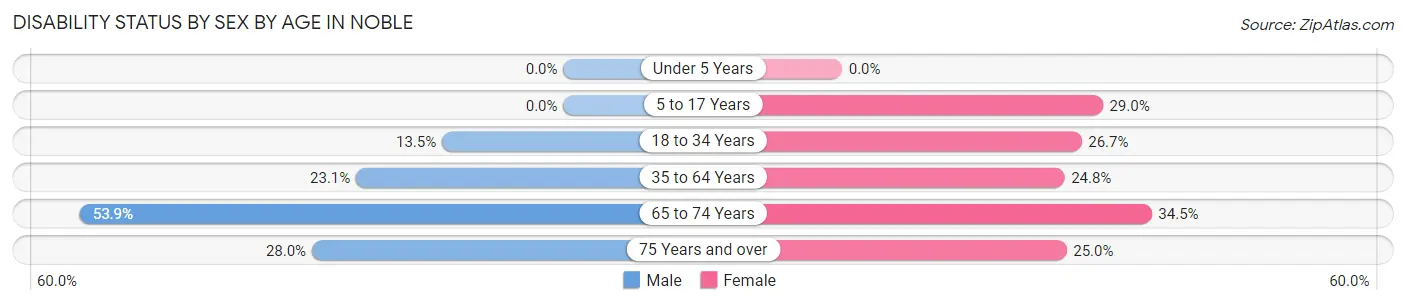
| Age Bracket | Male | Female |
| Under 5 Years | 0 (0.0%) | 0 (0.0%) |
| 5 to 17 Years | 0 (0.0%) | 9 (29.0%) |
| 18 to 34 Years | 10 (13.5%) | 28 (26.7%) |
| 35 to 64 Years | 27 (23.1%) | 27 (24.8%) |
| 65 to 74 Years | 14 (53.8%) | 10 (34.5%) |
| 75 Years and over | 7 (28.0%) | 10 (25.0%) |
Disability Class by Sex by Age in Noble
Disability Class: Hearing Difficulty
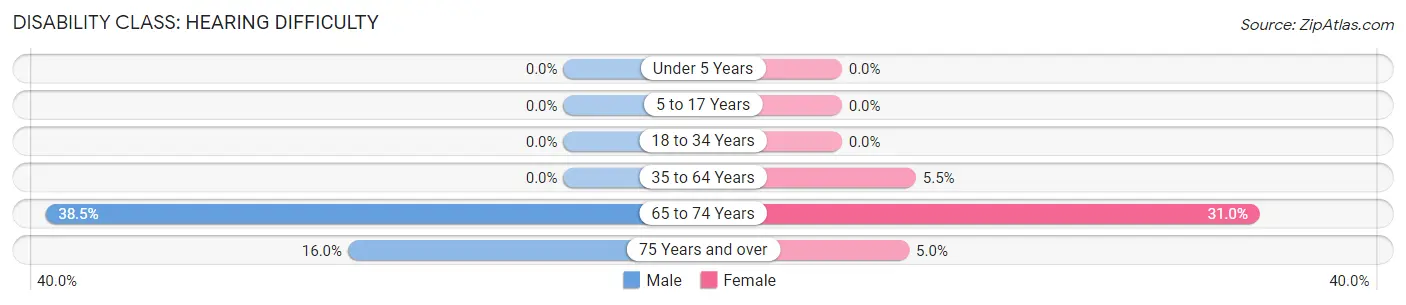
| Age Bracket | Male | Female |
| Under 5 Years | 0 (0.0%) | 0 (0.0%) |
| 5 to 17 Years | 0 (0.0%) | 0 (0.0%) |
| 18 to 34 Years | 0 (0.0%) | 0 (0.0%) |
| 35 to 64 Years | 0 (0.0%) | 6 (5.5%) |
| 65 to 74 Years | 10 (38.5%) | 9 (31.0%) |
| 75 Years and over | 4 (16.0%) | 2 (5.0%) |
Disability Class: Vision Difficulty
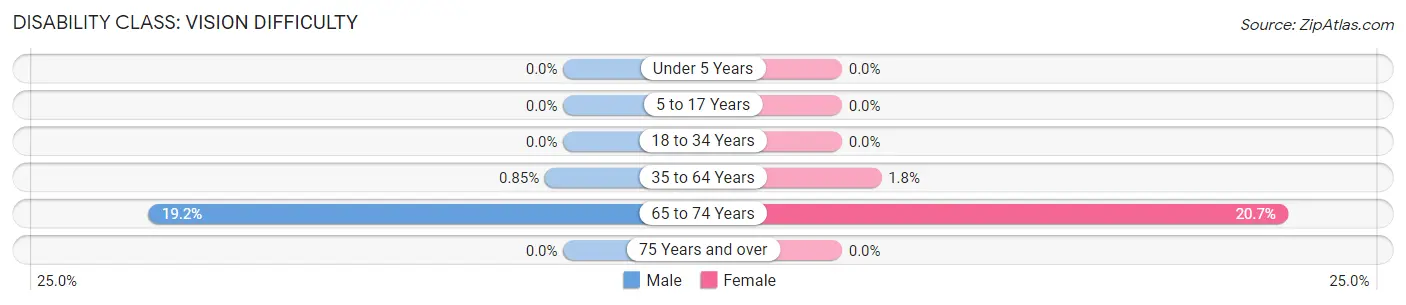
| Age Bracket | Male | Female |
| Under 5 Years | 0 (0.0%) | 0 (0.0%) |
| 5 to 17 Years | 0 (0.0%) | 0 (0.0%) |
| 18 to 34 Years | 0 (0.0%) | 0 (0.0%) |
| 35 to 64 Years | 1 (0.9%) | 2 (1.8%) |
| 65 to 74 Years | 5 (19.2%) | 6 (20.7%) |
| 75 Years and over | 0 (0.0%) | 0 (0.0%) |
Disability Class: Cognitive Difficulty
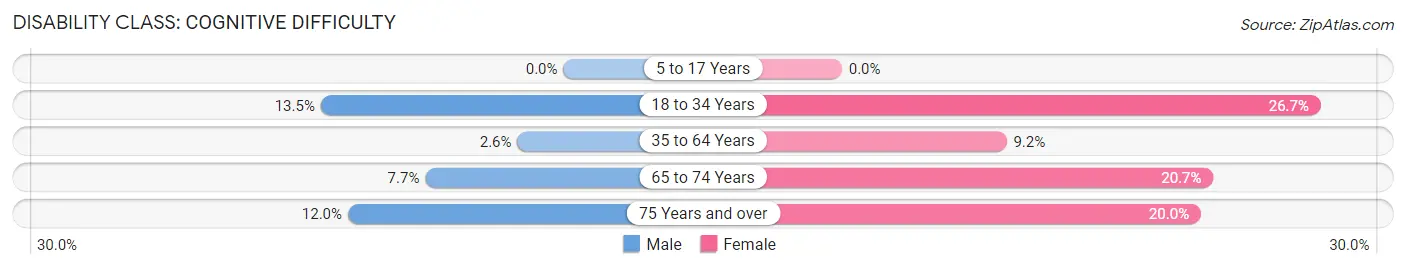
| Age Bracket | Male | Female |
| 5 to 17 Years | 0 (0.0%) | 0 (0.0%) |
| 18 to 34 Years | 10 (13.5%) | 28 (26.7%) |
| 35 to 64 Years | 3 (2.6%) | 10 (9.2%) |
| 65 to 74 Years | 2 (7.7%) | 6 (20.7%) |
| 75 Years and over | 3 (12.0%) | 8 (20.0%) |
Disability Class: Ambulatory Difficulty
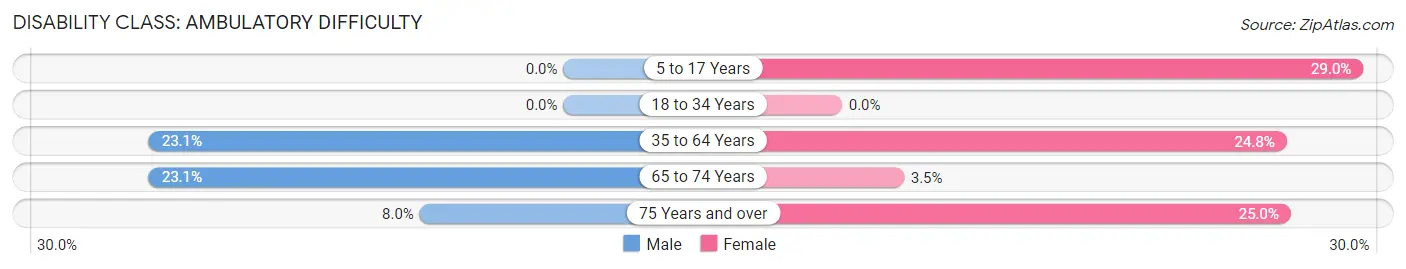
| Age Bracket | Male | Female |
| 5 to 17 Years | 0 (0.0%) | 9 (29.0%) |
| 18 to 34 Years | 0 (0.0%) | 0 (0.0%) |
| 35 to 64 Years | 27 (23.1%) | 27 (24.8%) |
| 65 to 74 Years | 6 (23.1%) | 1 (3.5%) |
| 75 Years and over | 2 (8.0%) | 10 (25.0%) |
Disability Class: Self-Care Difficulty
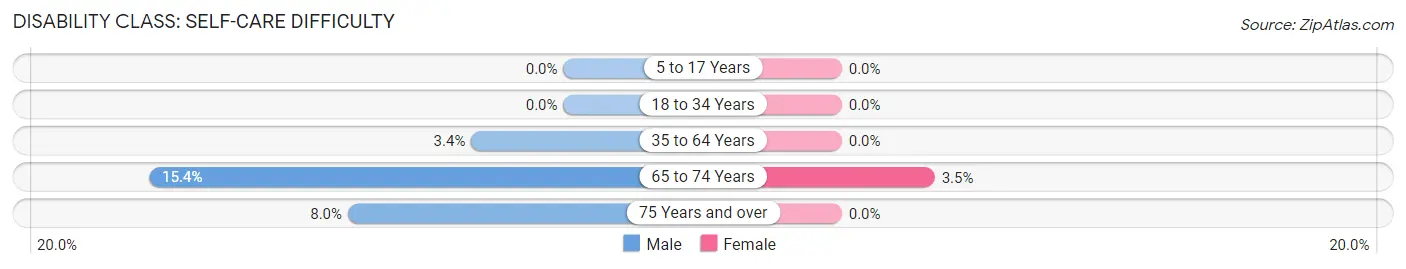
| Age Bracket | Male | Female |
| 5 to 17 Years | 0 (0.0%) | 0 (0.0%) |
| 18 to 34 Years | 0 (0.0%) | 0 (0.0%) |
| 35 to 64 Years | 4 (3.4%) | 0 (0.0%) |
| 65 to 74 Years | 4 (15.4%) | 1 (3.5%) |
| 75 Years and over | 2 (8.0%) | 0 (0.0%) |
Technology Access in Noble
Computing Device Access in Noble
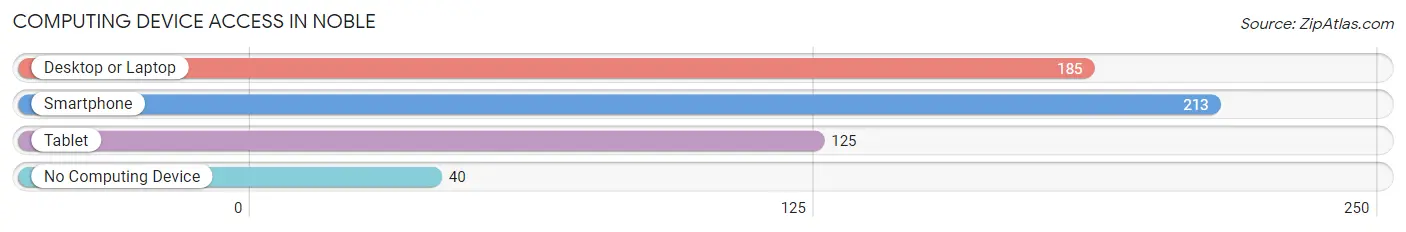
| Device Type | # Households | % Households |
| Desktop or Laptop | 185 | 64.0% |
| Smartphone | 213 | 73.7% |
| Tablet | 125 | 43.2% |
| No Computing Device | 40 | 13.8% |
| Total | 289 | 100.0% |
Internet Access in Noble
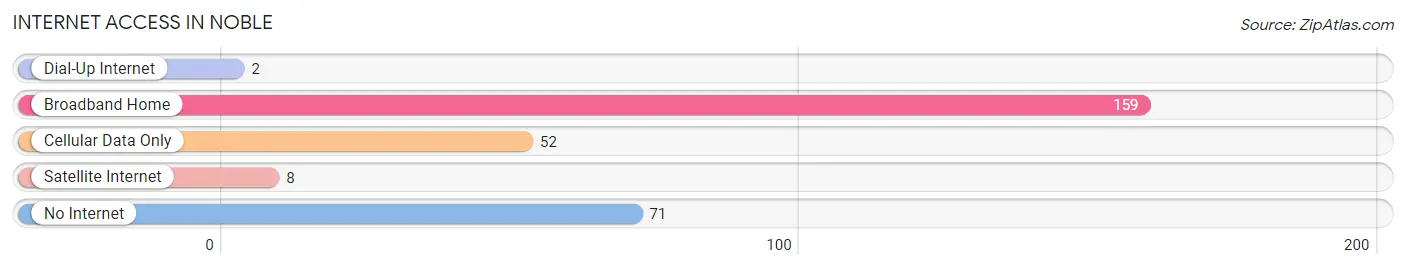
| Internet Type | # Households | % Households |
| Dial-Up Internet | 2 | 0.7% |
| Broadband Home | 159 | 55.0% |
| Cellular Data Only | 52 | 18.0% |
| Satellite Internet | 8 | 2.8% |
| No Internet | 71 | 24.6% |
| Total | 289 | 100.0% |
Noble Summary
Noble, Illinois is a small village located in the northeastern corner of Lake County, Illinois. It is situated on the banks of the Des Plaines River, just south of the Wisconsin border. The village has a population of approximately 1,400 people and is part of the Chicago metropolitan area.
History
The area that is now Noble was first settled in the early 1800s by a group of settlers from New England. The village was originally known as “Noble’s Grove” and was named after one of the settlers, John Noble. The village was officially incorporated in 1872.
In the late 1800s, the village was a popular destination for wealthy Chicagoans looking to escape the hustle and bustle of the city. The village was known for its picturesque scenery and its many resorts and hotels.
In the early 1900s, the village began to experience a decline in population as many of the wealthy Chicagoans moved away. The village was also affected by the Great Depression and World War II.
Geography
Noble is located in the northeastern corner of Lake County, Illinois. It is situated on the banks of the Des Plaines River, just south of the Wisconsin border. The village is located approximately 40 miles north of Chicago and is part of the Chicago metropolitan area.
The village is surrounded by rolling hills and is home to several small lakes and ponds. The village is also home to a variety of wildlife, including deer, foxes, and coyotes.
Economy
The economy of Noble is largely based on agriculture and tourism. The village is home to several small farms and orchards, as well as several wineries and vineyards. The village is also home to several small businesses, including restaurants, shops, and galleries.
The village is also home to several small manufacturing companies, including a furniture factory and a metal fabrication plant. The village is also home to a small airport, which serves as a hub for private and corporate aircraft.
Demographics
As of the 2010 census, the population of Noble was 1,400 people. The racial makeup of the village was 94.3% White, 1.3% African American, 0.3% Native American, 0.7% Asian, 0.1% Pacific Islander, and 3.3% from other races. The median household income was $50,000 and the median family income was $60,000.
Conclusion
Noble, Illinois is a small village located in the northeastern corner of Lake County, Illinois. It is situated on the banks of the Des Plaines River, just south of the Wisconsin border. The village has a population of approximately 1,400 people and is part of the Chicago metropolitan area. The economy of Noble is largely based on agriculture and tourism, and the village is home to several small businesses, farms, and manufacturing companies. The racial makeup of the village is 94.3% White, 1.3% African American, 0.3% Native American, 0.7% Asian, 0.1% Pacific Islander, and 3.3% from other races. The median household income was $50,000 and the median family income was $60,000.
Common Questions
What is Per Capita Income in Noble?
Per Capita income in Noble is $22,621.
What is the Median Family Income in Noble?
Median Family Income in Noble is $59,063.
What is the Median Household income in Noble?
Median Household Income in Noble is $42,875.
What is Income or Wage Gap in Noble?
Income or Wage Gap in Noble is 52.9%.
Women in Noble earn 47.1 cents for every dollar earned by a man.
What is Inequality or Gini Index in Noble?
Inequality or Gini Index in Noble is 0.42.
What is the Total Population of Noble?
Total Population of Noble is 649.
What is the Total Male Population of Noble?
Total Male Population of Noble is 318.
What is the Total Female Population of Noble?
Total Female Population of Noble is 331.
What is the Ratio of Males per 100 Females in Noble?
There are 96.07 Males per 100 Females in Noble.
What is the Ratio of Females per 100 Males in Noble?
There are 104.09 Females per 100 Males in Noble.
What is the Median Population Age in Noble?
Median Population Age in Noble is 38.0 Years.
What is the Average Family Size in Noble
Average Family Size in Noble is 3.0 People.
What is the Average Household Size in Noble
Average Household Size in Noble is 2.2 People.
How Large is the Labor Force in Noble?
There are 277 People in the Labor Forcein in Noble.
What is the Percentage of People in the Labor Force in Noble?
51.6% of People are in the Labor Force in Noble.
What is the Unemployment Rate in Noble?
Unemployment Rate in Noble is 8.3%.