Garden Prairie, IL Map & Demographics
Garden Prairie Map
Garden Prairie Overview
$16,445
PER CAPITA INCOME
$37,303
AVG HOUSEHOLD INCOME
0.26
INEQUALITY / GINI INDEX
328
TOTAL POPULATION
226
MALE POPULATION
102
FEMALE POPULATION
221.57
MALES / 100 FEMALES
45.13
FEMALES / 100 MALES
19.5
MEDIAN AGE
5.3
AVG FAMILY SIZE
3.3
AVG HOUSEHOLD SIZE
73
LABOR FORCE [ PEOPLE ]
41.2%
PERCENT IN LABOR FORCE
Garden Prairie Zip Codes
Garden Prairie Area Codes
Income in Garden Prairie
Income Overview in Garden Prairie
| Characteristic | Number | Measure |
| Per Capita Income | 328 | $16,445 |
| Median Family Income | 44 | $0 |
| Mean Family Income | 44 | $0 |
| Median Household Income | 100 | $37,303 |
| Mean Household Income | 100 | $54,112 |
| Income Deficit | 44 | $0 |
| Wage / Income Gap (%) | 328 | 0.00% |
| Wage / Income Gap ($) | 328 | 100.00¢ per $1 |
| Gini / Inequality Index | 328 | 0.26 |
Earnings by Sex in Garden Prairie
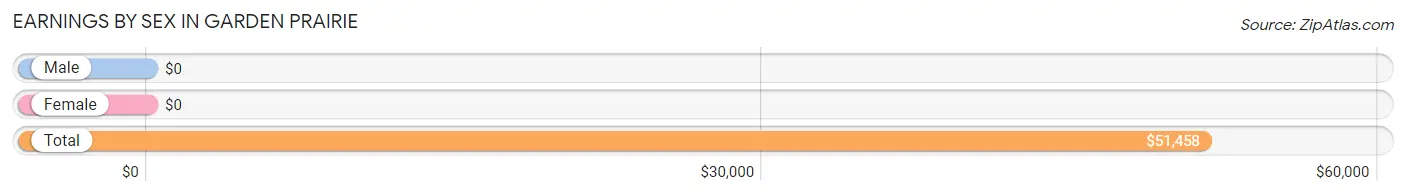
| Sex | Number | Average Earnings |
| Male | 47 (64.4%) | $0 |
| Female | 26 (35.6%) | $0 |
| Total | 73 (100.0%) | $51,458 |
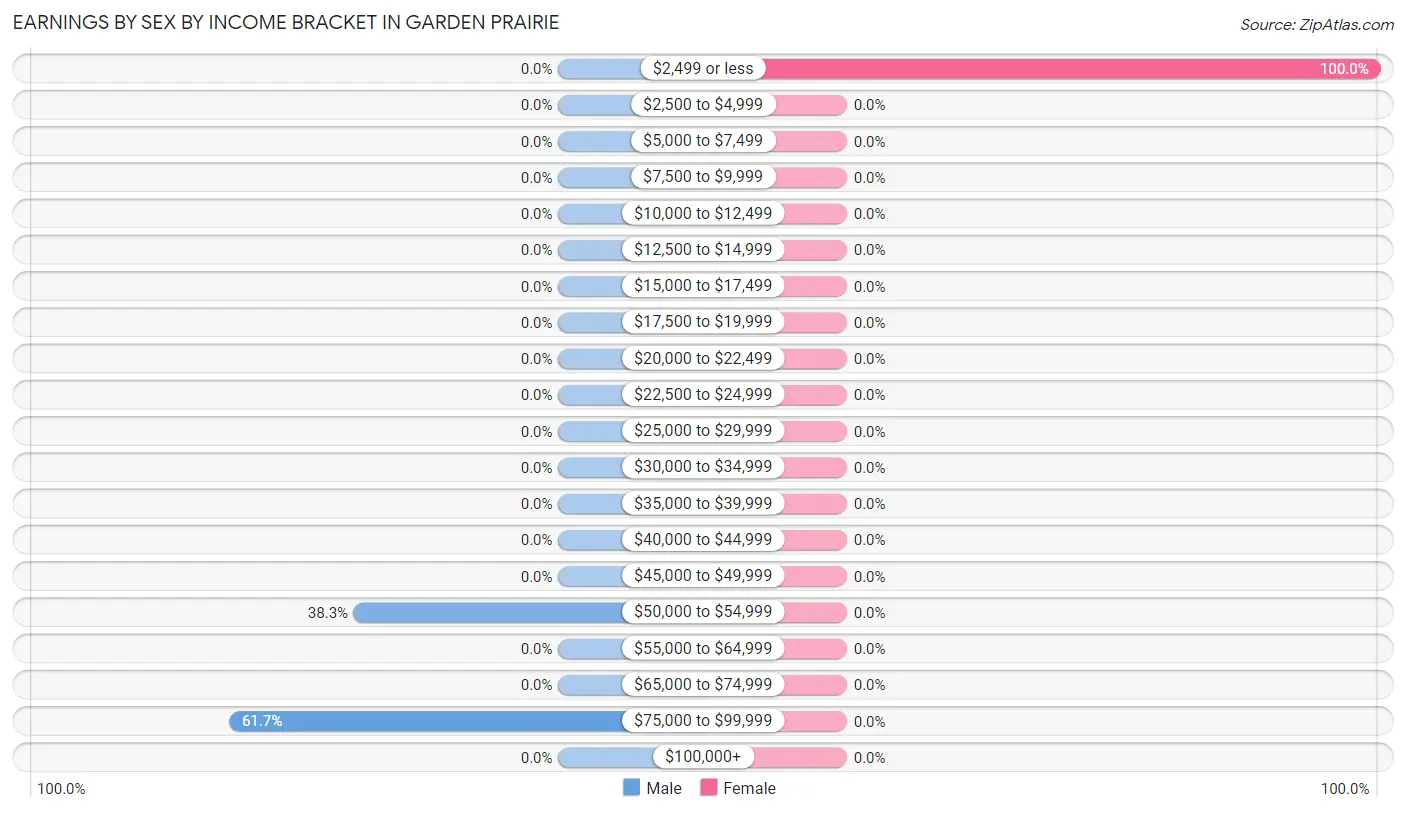
Earnings by Sex by Income Bracket in Garden Prairie
The most common earnings brackets in Garden Prairie are $75,000 to $99,999 for men (29 | 61.7%) and $2,499 or less for women (26 | 100.0%).
| Income | Male | Female |
| $2,499 or less | 0 (0.0%) | 26 (100.0%) |
| $2,500 to $4,999 | 0 (0.0%) | 0 (0.0%) |
| $5,000 to $7,499 | 0 (0.0%) | 0 (0.0%) |
| $7,500 to $9,999 | 0 (0.0%) | 0 (0.0%) |
| $10,000 to $12,499 | 0 (0.0%) | 0 (0.0%) |
| $12,500 to $14,999 | 0 (0.0%) | 0 (0.0%) |
| $15,000 to $17,499 | 0 (0.0%) | 0 (0.0%) |
| $17,500 to $19,999 | 0 (0.0%) | 0 (0.0%) |
| $20,000 to $22,499 | 0 (0.0%) | 0 (0.0%) |
| $22,500 to $24,999 | 0 (0.0%) | 0 (0.0%) |
| $25,000 to $29,999 | 0 (0.0%) | 0 (0.0%) |
| $30,000 to $34,999 | 0 (0.0%) | 0 (0.0%) |
| $35,000 to $39,999 | 0 (0.0%) | 0 (0.0%) |
| $40,000 to $44,999 | 0 (0.0%) | 0 (0.0%) |
| $45,000 to $49,999 | 0 (0.0%) | 0 (0.0%) |
| $50,000 to $54,999 | 18 (38.3%) | 0 (0.0%) |
| $55,000 to $64,999 | 0 (0.0%) | 0 (0.0%) |
| $65,000 to $74,999 | 0 (0.0%) | 0 (0.0%) |
| $75,000 to $99,999 | 29 (61.7%) | 0 (0.0%) |
| $100,000+ | 0 (0.0%) | 0 (0.0%) |
| Total | 47 (100.0%) | 26 (100.0%) |
Earnings by Sex by Educational Attainment in Garden Prairie
| Educational Attainment | Male Income | Female Income |
| Less than High School | - | - |
| High School Diploma | - | - |
| College or Associate's Degree | - | - |
| Bachelor's Degree | - | - |
| Graduate Degree | - | - |
| Total | - | - |
Family Income in Garden Prairie
Family Income Brackets in Garden Prairie
According to the Garden Prairie family income data, there are 29 families falling into the $75,000 to $99,999 income range, which is the most common income bracket and makes up 65.9% of all families.
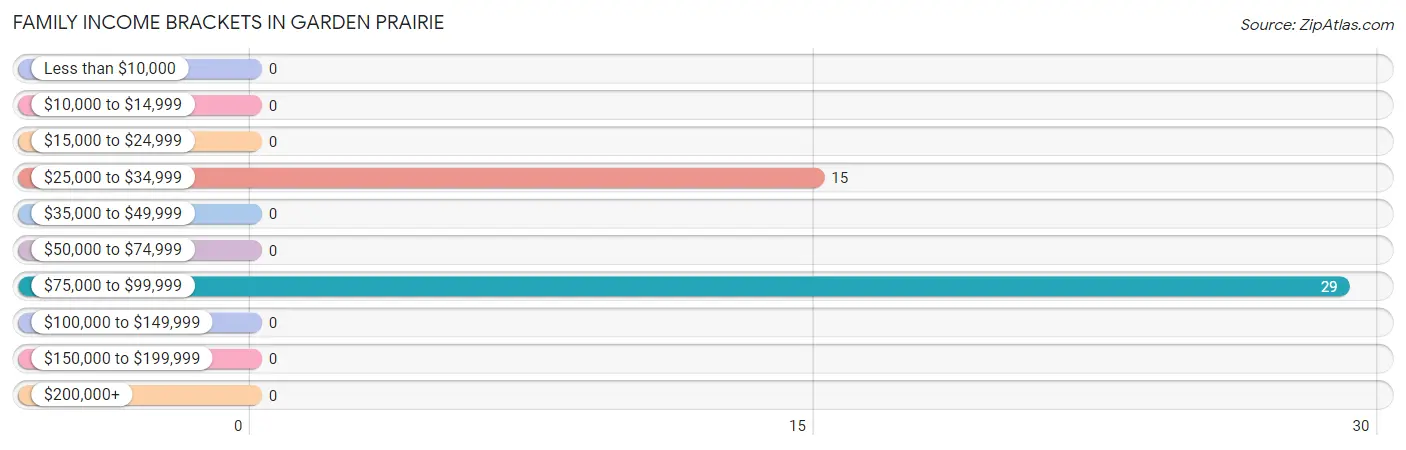
| Income Bracket | # Families | % Families |
| Less than $10,000 | 0 | 0.0% |
| $10,000 to $14,999 | 0 | 0.0% |
| $15,000 to $24,999 | 0 | 0.0% |
| $25,000 to $34,999 | 15 | 34.1% |
| $35,000 to $49,999 | 0 | 0.0% |
| $50,000 to $74,999 | 0 | 0.0% |
| $75,000 to $99,999 | 29 | 65.9% |
| $100,000 to $149,999 | 0 | 0.0% |
| $150,000 to $199,999 | 0 | 0.0% |
| $200,000+ | 0 | 0.0% |
Family Income by Famaliy Size in Garden Prairie
| Income Bracket | # Families | Median Income |
| 2-Person Families | 15 (34.1%) | $0 |
| 3-Person Families | 0 (0.0%) | $0 |
| 4-Person Families | 0 (0.0%) | $0 |
| 5-Person Families | 0 (0.0%) | $0 |
| 6-Person Families | 0 (0.0%) | $0 |
| 7+ Person Families | 29 (65.9%) | $0 |
| Total | 44 (100.0%) | $0 |
Family Income by Number of Earners in Garden Prairie
| Number of Earners | # Families | Median Income |
| No Earners | 15 (34.1%) | $0 |
| 1 Earner | 0 (0.0%) | $0 |
| 2 Earners | 29 (65.9%) | $0 |
| 3+ Earners | 0 (0.0%) | $0 |
| Total | 44 (100.0%) | $0 |
Household Income in Garden Prairie
Household Income Brackets in Garden Prairie
With 38 households falling in the category, the $35,000 to $49,999 income range is the most frequent in Garden Prairie, accounting for 38.0% of all households.
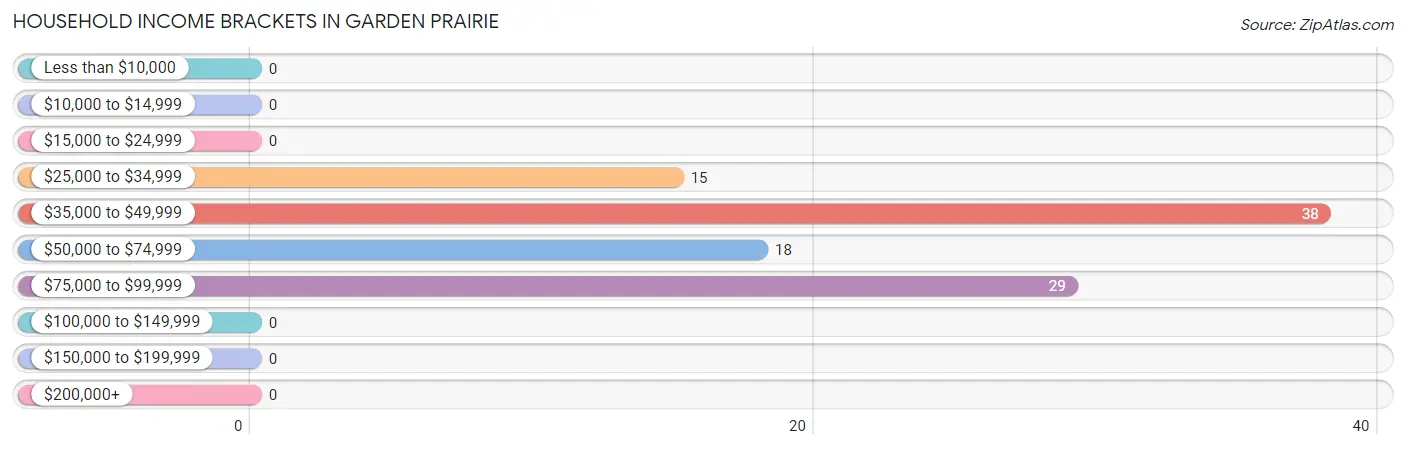
| Income Bracket | # Households | % Households |
| Less than $10,000 | 0 | 0.0% |
| $10,000 to $14,999 | 0 | 0.0% |
| $15,000 to $24,999 | 0 | 0.0% |
| $25,000 to $34,999 | 15 | 15.0% |
| $35,000 to $49,999 | 38 | 38.0% |
| $50,000 to $74,999 | 18 | 18.0% |
| $75,000 to $99,999 | 29 | 29.0% |
| $100,000 to $149,999 | 0 | 0.0% |
| $150,000 to $199,999 | 0 | 0.0% |
| $200,000+ | 0 | 0.0% |
Household Income by Householder Age in Garden Prairie
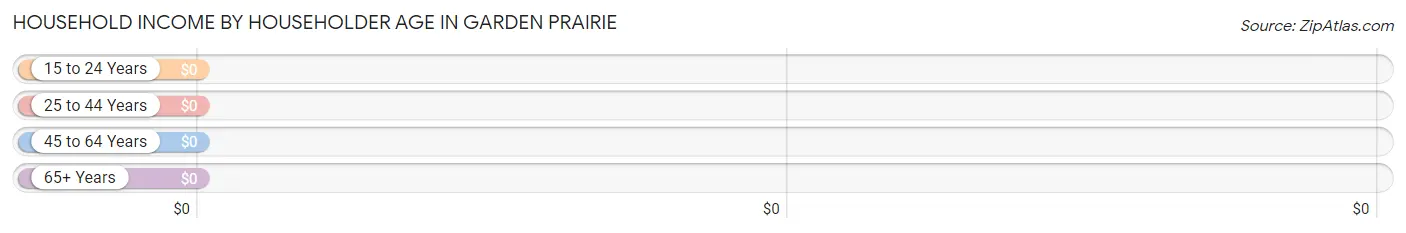
| Income Bracket | # Households | Median Income |
| 15 to 24 Years | 0 (0.0%) | $0 |
| 25 to 44 Years | 18 (18.0%) | $0 |
| 45 to 64 Years | 29 (29.0%) | $0 |
| 65+ Years | 53 (53.0%) | $0 |
| Total | 100 (100.0%) | $37,303 |
Poverty in Garden Prairie
Income Below Poverty by Sex and Age in Garden Prairie
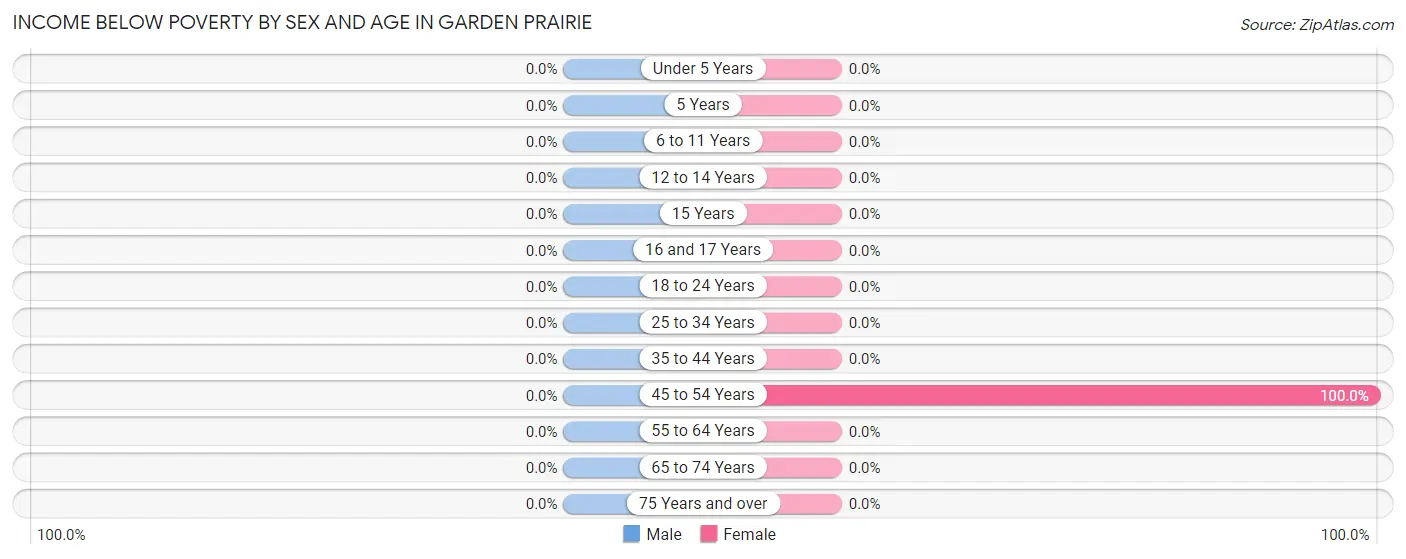
| Age Bracket | Male | Female |
| Under 5 Years | 0 (0.0%) | 0 (0.0%) |
| 5 Years | 0 (0.0%) | 0 (0.0%) |
| 6 to 11 Years | 0 (0.0%) | 0 (0.0%) |
| 12 to 14 Years | 0 (0.0%) | 0 (0.0%) |
| 15 Years | 0 (0.0%) | 0 (0.0%) |
| 16 and 17 Years | 0 (0.0%) | 0 (0.0%) |
| 18 to 24 Years | 0 (0.0%) | 0 (0.0%) |
| 25 to 34 Years | 0 (0.0%) | 0 (0.0%) |
| 35 to 44 Years | 0 (0.0%) | 0 (0.0%) |
| 45 to 54 Years | 0 (0.0%) | 37 (100.0%) |
| 55 to 64 Years | 0 (0.0%) | 0 (0.0%) |
| 65 to 74 Years | 0 (0.0%) | 0 (0.0%) |
| 75 Years and over | 0 (0.0%) | 0 (0.0%) |
| Total | 0 (0.0%) | 37 (36.3%) |
Income Above Poverty by Sex and Age in Garden Prairie
According to the poverty statistics in Garden Prairie, males aged under 5 years and females aged 12 to 14 years are the age groups that are most secure financially, with 100.0% of males and 100.0% of females in these age groups living above the poverty line.
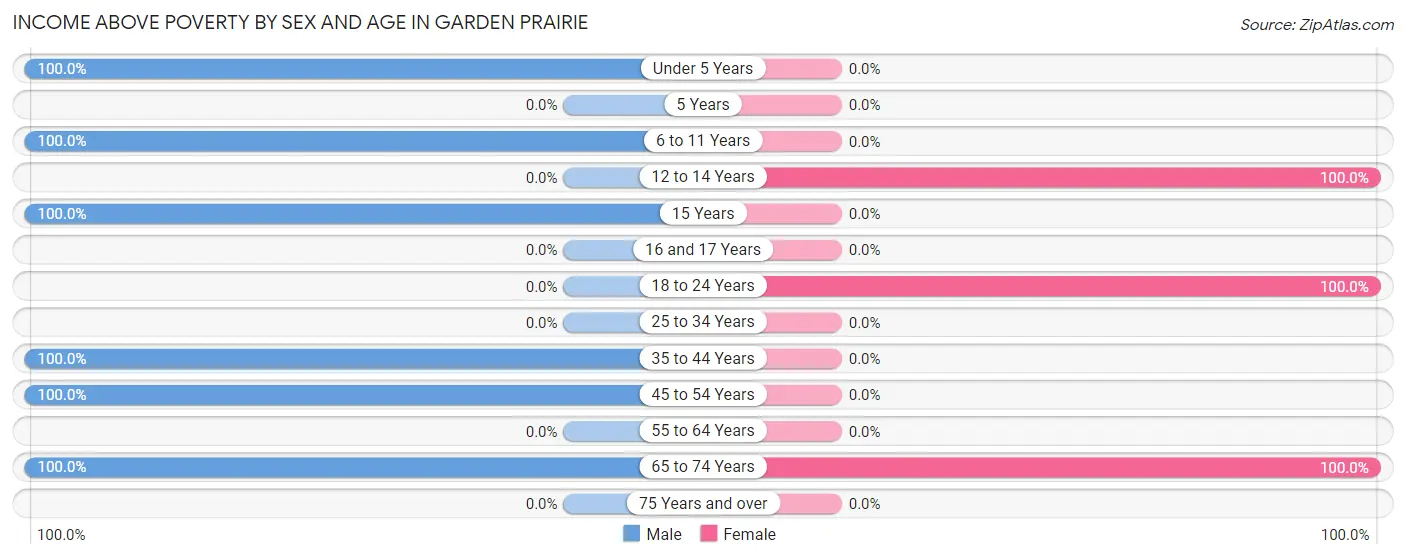
| Age Bracket | Male | Female |
| Under 5 Years | 47 (100.0%) | 0 (0.0%) |
| 5 Years | 0 (0.0%) | 0 (0.0%) |
| 6 to 11 Years | 29 (100.0%) | 0 (0.0%) |
| 12 to 14 Years | 0 (0.0%) | 25 (100.0%) |
| 15 Years | 50 (100.0%) | 0 (0.0%) |
| 16 and 17 Years | 0 (0.0%) | 0 (0.0%) |
| 18 to 24 Years | 0 (0.0%) | 26 (100.0%) |
| 25 to 34 Years | 0 (0.0%) | 0 (0.0%) |
| 35 to 44 Years | 18 (100.0%) | 0 (0.0%) |
| 45 to 54 Years | 29 (100.0%) | 0 (0.0%) |
| 55 to 64 Years | 0 (0.0%) | 0 (0.0%) |
| 65 to 74 Years | 53 (100.0%) | 14 (100.0%) |
| 75 Years and over | 0 (0.0%) | 0 (0.0%) |
| Total | 226 (100.0%) | 65 (63.7%) |
Income Below Poverty Among Married-Couple Families in Garden Prairie
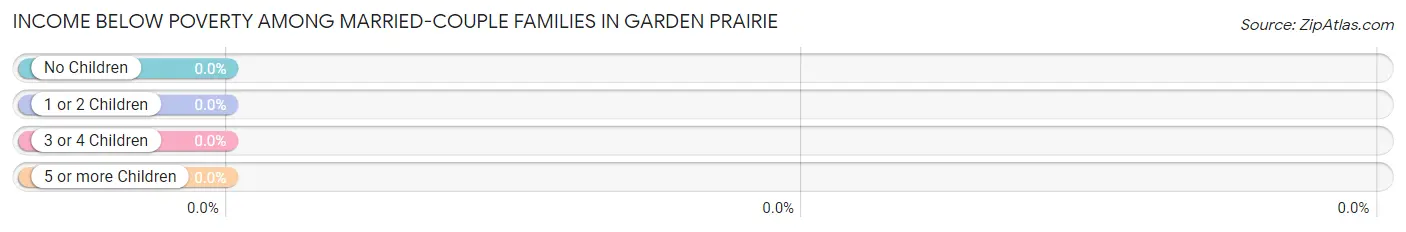
| Children | Above Poverty | Below Poverty |
| No Children | 15 (100.0%) | 0 (0.0%) |
| 1 or 2 Children | 0 (0.0%) | 0 (0.0%) |
| 3 or 4 Children | 0 (0.0%) | 0 (0.0%) |
| 5 or more Children | 0 (0.0%) | 0 (0.0%) |
| Total | 15 (100.0%) | 0 (0.0%) |
Income Below Poverty Among Single-Parent Households in Garden Prairie
| Children | Single Father | Single Mother |
| No Children | 0 (0.0%) | 0 (0.0%) |
| 1 or 2 Children | 0 (0.0%) | 0 (0.0%) |
| 3 or 4 Children | 0 (0.0%) | 0 (0.0%) |
| 5 or more Children | 0 (0.0%) | 0 (0.0%) |
| Total | 0 (0.0%) | 0 (0.0%) |
Income Below Poverty Among Married-Couple vs Single-Parent Households in Garden Prairie
| Children | Married-Couple Families | Single-Parent Households |
| No Children | 0 (0.0%) | 0 (0.0%) |
| 1 or 2 Children | 0 (0.0%) | 0 (0.0%) |
| 3 or 4 Children | 0 (0.0%) | 0 (0.0%) |
| 5 or more Children | 0 (0.0%) | 0 (0.0%) |
| Total | 0 (0.0%) | 0 (0.0%) |
Race in Garden Prairie
The most populous races in Garden Prairie are , and White / Caucasian (328 | 100.0%).
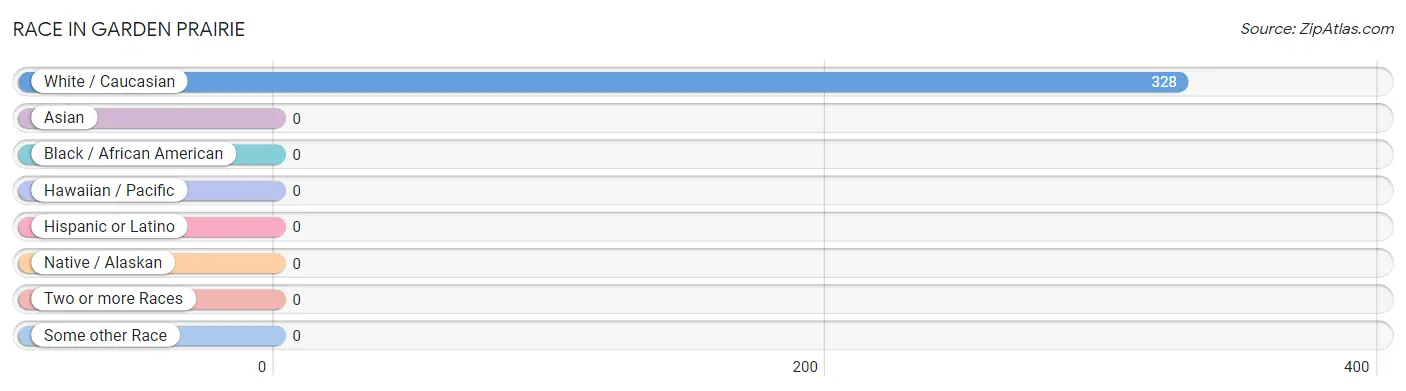
| Race | # Population | % Population |
| Asian | 0 | 0.0% |
| Black / African American | 0 | 0.0% |
| Hawaiian / Pacific | 0 | 0.0% |
| Hispanic or Latino | 0 | 0.0% |
| Native / Alaskan | 0 | 0.0% |
| White / Caucasian | 328 | 100.0% |
| Two or more Races | 0 | 0.0% |
| Some other Race | 0 | 0.0% |
| Total | 328 | 100.0% |
Ancestry in Garden Prairie
The most populous ancestries reported in Garden Prairie are German (224 | 68.3%), Irish (206 | 62.8%), American (37 | 11.3%), Scandinavian (15 | 4.6%), and Italian (14 | 4.3%), together accounting for 151.2% of all Garden Prairie residents.
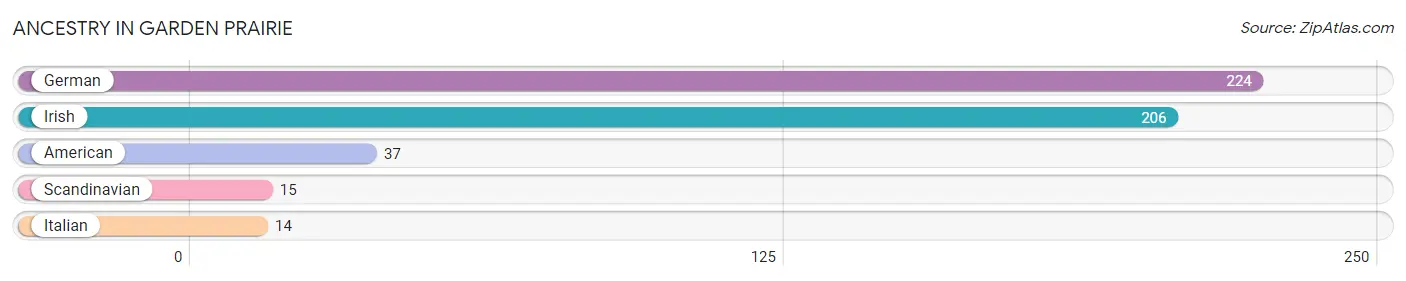
| Ancestry | # Population | % Population |
| American | 37 | 11.3% |
| German | 224 | 68.3% |
| Irish | 206 | 62.8% |
| Italian | 14 | 4.3% |
| Scandinavian | 15 | 4.6% | View All 5 Rows |
Immigrants in Garden Prairie

| Immigration Origin | # Population | % Population | View All 0 Rows |
Sex and Age in Garden Prairie
Sex and Age in Garden Prairie
The most populous age groups in Garden Prairie are 65 to 69 Years (53 | 23.4%) for men and 45 to 49 Years (37 | 36.3%) for women.
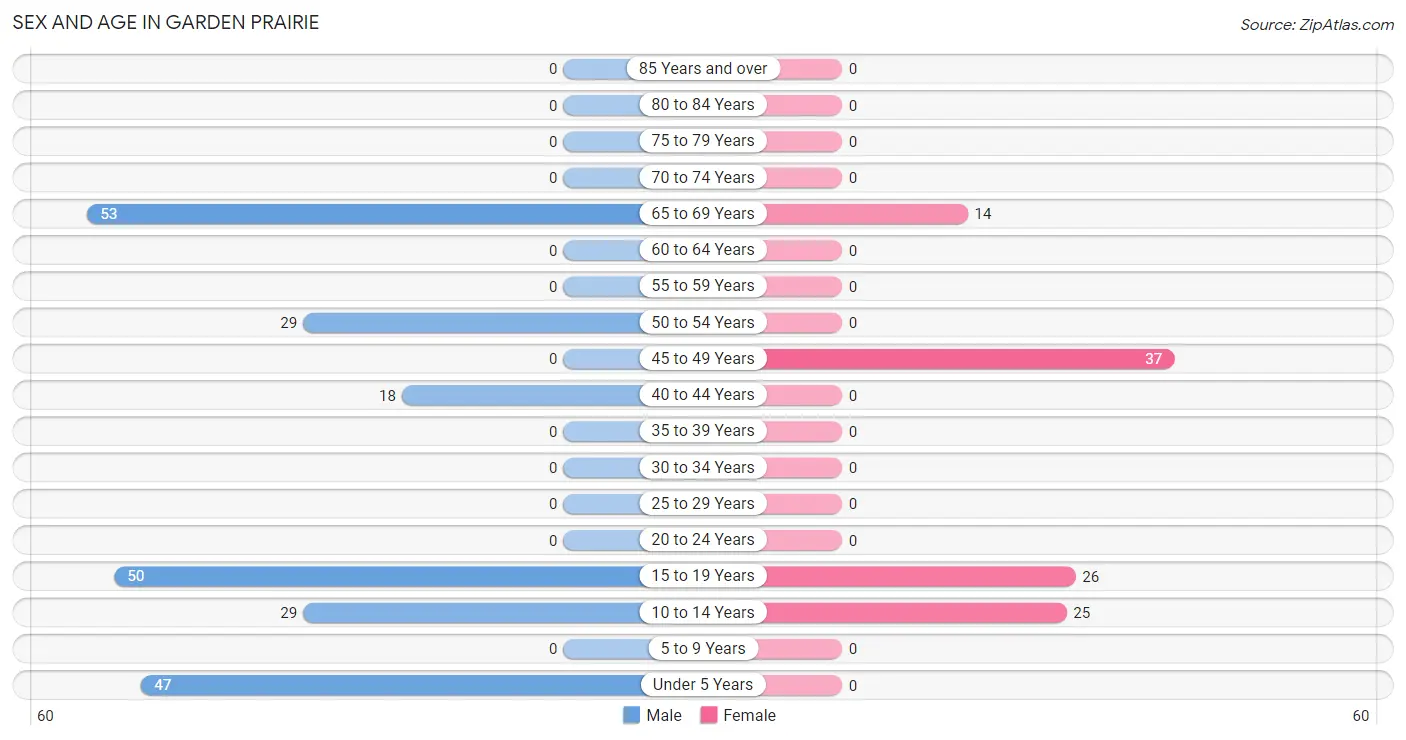
| Age Bracket | Male | Female |
| Under 5 Years | 47 (20.8%) | 0 (0.0%) |
| 5 to 9 Years | 0 (0.0%) | 0 (0.0%) |
| 10 to 14 Years | 29 (12.8%) | 25 (24.5%) |
| 15 to 19 Years | 50 (22.1%) | 26 (25.5%) |
| 20 to 24 Years | 0 (0.0%) | 0 (0.0%) |
| 25 to 29 Years | 0 (0.0%) | 0 (0.0%) |
| 30 to 34 Years | 0 (0.0%) | 0 (0.0%) |
| 35 to 39 Years | 0 (0.0%) | 0 (0.0%) |
| 40 to 44 Years | 18 (8.0%) | 0 (0.0%) |
| 45 to 49 Years | 0 (0.0%) | 37 (36.3%) |
| 50 to 54 Years | 29 (12.8%) | 0 (0.0%) |
| 55 to 59 Years | 0 (0.0%) | 0 (0.0%) |
| 60 to 64 Years | 0 (0.0%) | 0 (0.0%) |
| 65 to 69 Years | 53 (23.4%) | 14 (13.7%) |
| 70 to 74 Years | 0 (0.0%) | 0 (0.0%) |
| 75 to 79 Years | 0 (0.0%) | 0 (0.0%) |
| 80 to 84 Years | 0 (0.0%) | 0 (0.0%) |
| 85 Years and over | 0 (0.0%) | 0 (0.0%) |
| Total | 226 (100.0%) | 102 (100.0%) |
Families and Households in Garden Prairie
Median Family Size in Garden Prairie
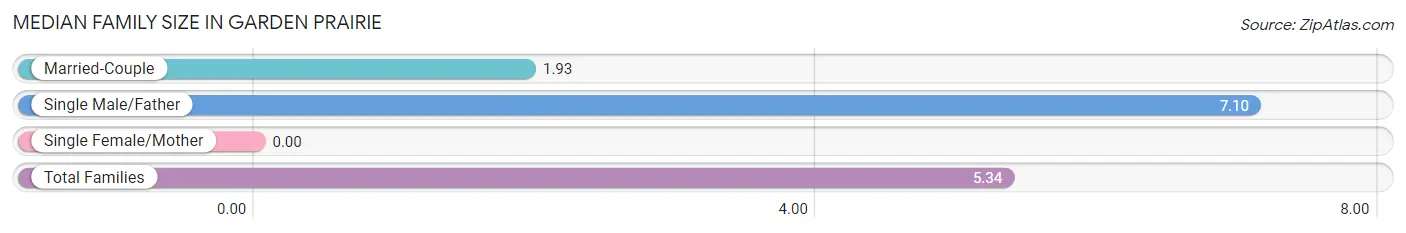
| Family Type | # Families | Family Size |
| Married-Couple | 15 (34.1%) | 1.93 |
| Single Male/Father | 29 (65.9%) | 7.10 |
| Single Female/Mother | 0 (0.0%) | - |
| Total Families | 44 (100.0%) | 5.34 |
Median Household Size in Garden Prairie
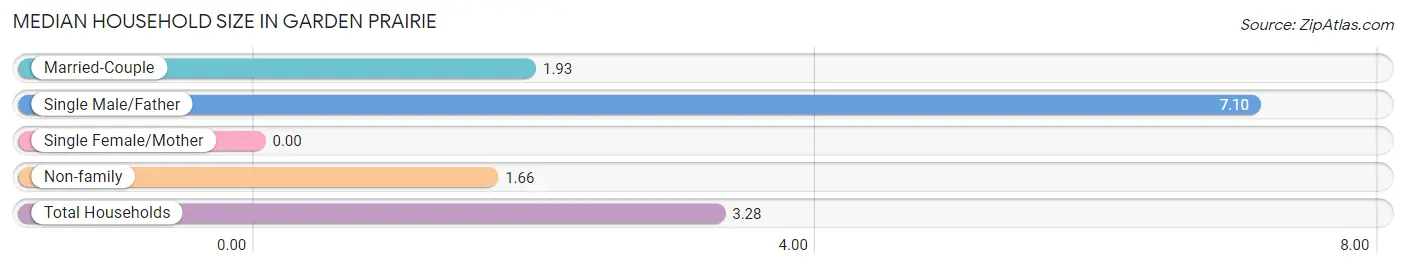
| Household Type | # Households | Household Size |
| Married-Couple | 15 (15.0%) | 1.93 |
| Single Male/Father | 29 (29.0%) | 7.10 |
| Single Female/Mother | 0 (0.0%) | - |
| Non-family | 56 (56.0%) | 1.66 |
| Total Households | 100 (100.0%) | 3.28 |
Household Size by Marriage Status in Garden Prairie
Out of a total of 100 households in Garden Prairie, 44 (44.0%) are family households, while 56 (56.0%) are nonfamily households. The most numerous type of family households are 7+ person households, comprising 29, and the most common type of nonfamily households are 2-person households, comprising 38.
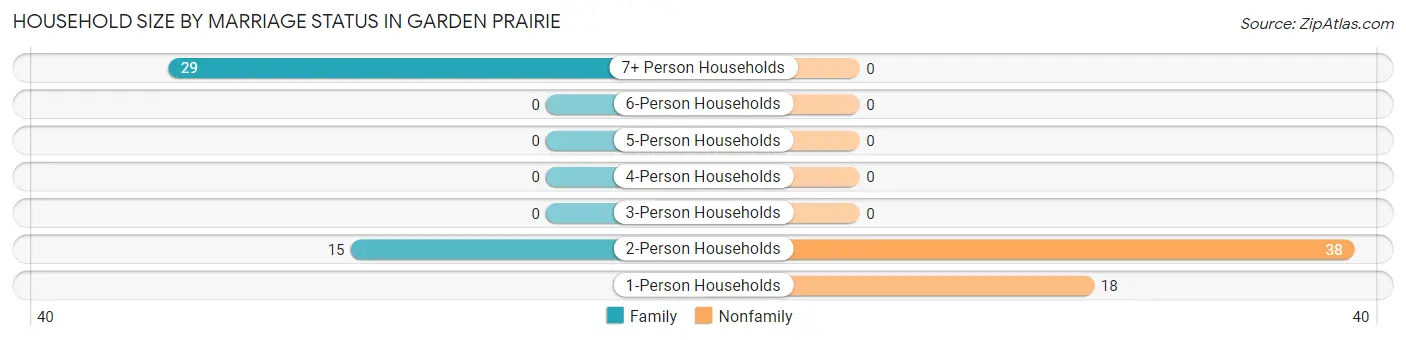
| Household Size | Family Households | Nonfamily Households |
| 1-Person Households | - | 18 (18.0%) |
| 2-Person Households | 15 (15.0%) | 38 (38.0%) |
| 3-Person Households | 0 (0.0%) | 0 (0.0%) |
| 4-Person Households | 0 (0.0%) | 0 (0.0%) |
| 5-Person Households | 0 (0.0%) | 0 (0.0%) |
| 6-Person Households | 0 (0.0%) | 0 (0.0%) |
| 7+ Person Households | 29 (29.0%) | 0 (0.0%) |
| Total | 44 (44.0%) | 56 (56.0%) |
Female Fertility in Garden Prairie
Fertility by Age in Garden Prairie
Average fertility rate in Garden Prairie is 413.0 births per 1,000 women. Women in the age bracket of 15 to 19 years have the highest fertility rate with 1,000.0 births per 1,000 women. Women in the age bracket of 15 to 19 years acount for 100.0% of all women with births.
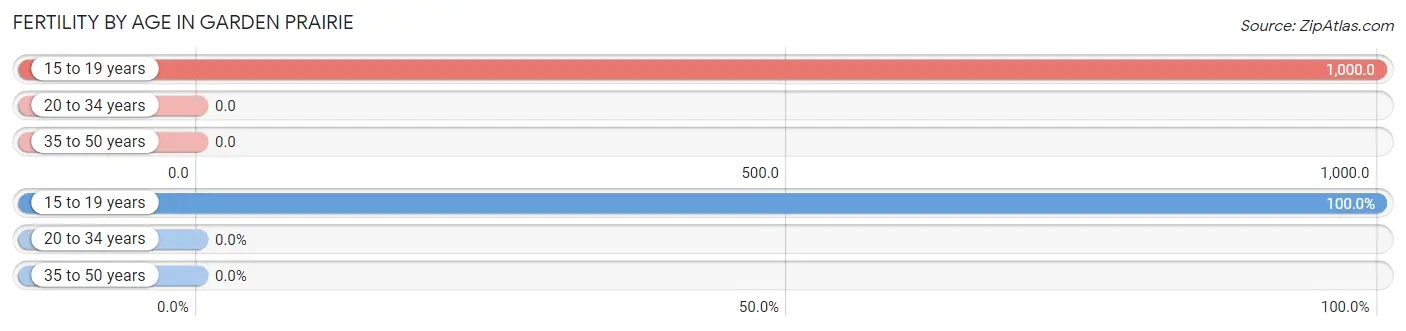
| Age Bracket | Women with Births | Births / 1,000 Women |
| 15 to 19 years | 26 (100.0%) | 1,000.0 |
| 20 to 34 years | 0 (0.0%) | 0.0 |
| 35 to 50 years | 0 (0.0%) | 0.0 |
| Total | 26 (100.0%) | 413.0 |
Fertility by Age by Marriage Status in Garden Prairie
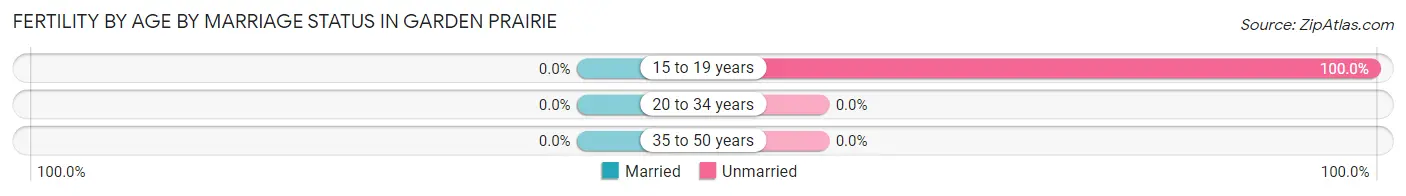
| Age Bracket | Married | Unmarried |
| 15 to 19 years | 0 (0.0%) | 26 (100.0%) |
| 20 to 34 years | 0 (0.0%) | 0 (0.0%) |
| 35 to 50 years | 0 (0.0%) | 0 (0.0%) |
| Total | 0 (0.0%) | 26 (100.0%) |
Fertility by Education in Garden Prairie
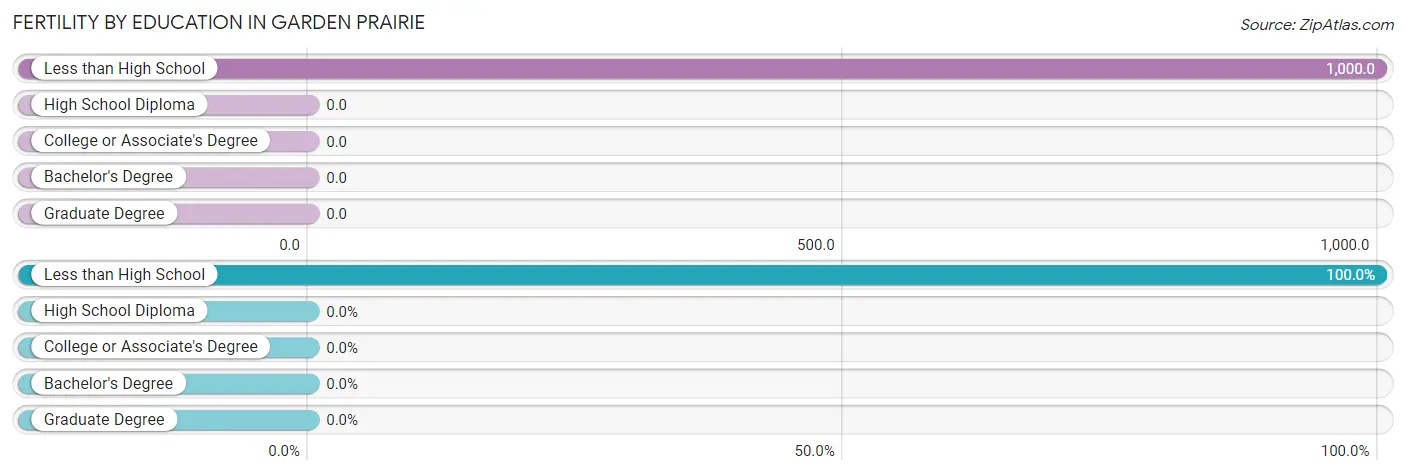
| Educational Attainment | Women with Births | Births / 1,000 Women |
| Less than High School | 26 (100.0%) | 1,000.0 |
| High School Diploma | 0 (0.0%) | 0.0 |
| College or Associate's Degree | 0 (0.0%) | 0.0 |
| Bachelor's Degree | 0 (0.0%) | 0.0 |
| Graduate Degree | 0 (0.0%) | 0.0 |
| Total | 26 (100.0%) | 413.0 |
Fertility by Education by Marriage Status in Garden Prairie
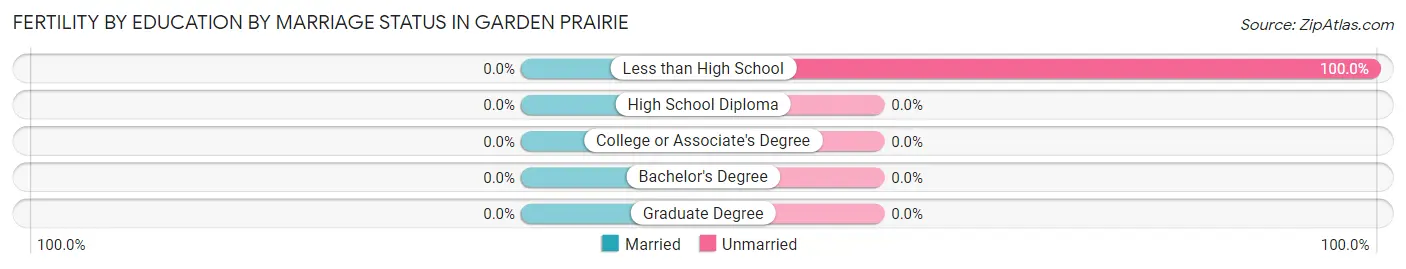
| Educational Attainment | Married | Unmarried |
| Less than High School | 0 (0.0%) | 26 (100.0%) |
| High School Diploma | 0 (0.0%) | 0 (0.0%) |
| College or Associate's Degree | 0 (0.0%) | 0 (0.0%) |
| Bachelor's Degree | 0 (0.0%) | 0 (0.0%) |
| Graduate Degree | 0 (0.0%) | 0 (0.0%) |
| Total | 0 (0.0%) | 26 (100.0%) |
Employment Characteristics in Garden Prairie
Employment by Class of Employer in Garden Prairie
Among the 47 employed individuals in Garden Prairie, , and private company employees (47 | 100.0%) make up the most common classes of employment.
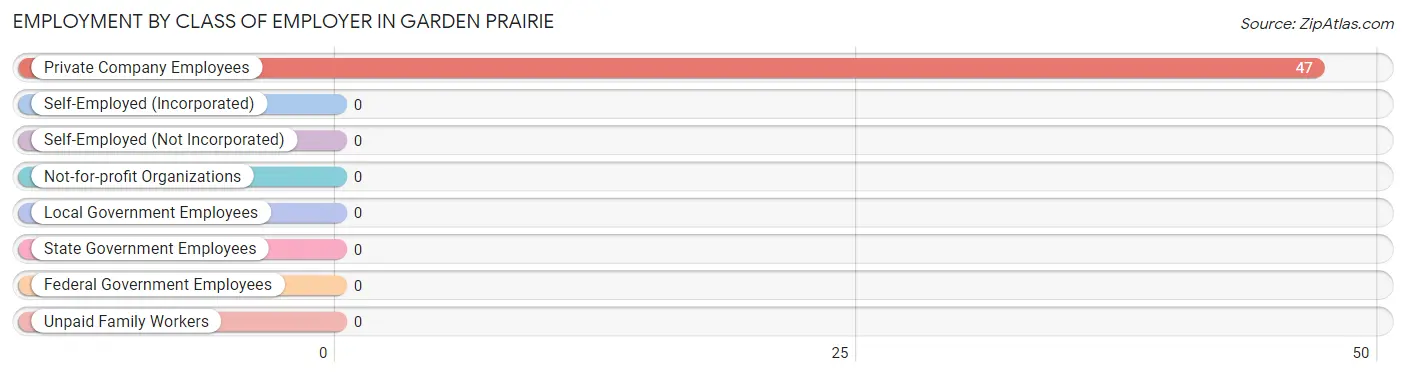
| Employer Class | # Employees | % Employees |
| Private Company Employees | 47 | 100.0% |
| Self-Employed (Incorporated) | 0 | 0.0% |
| Self-Employed (Not Incorporated) | 0 | 0.0% |
| Not-for-profit Organizations | 0 | 0.0% |
| Local Government Employees | 0 | 0.0% |
| State Government Employees | 0 | 0.0% |
| Federal Government Employees | 0 | 0.0% |
| Unpaid Family Workers | 0 | 0.0% |
| Total | 47 | 100.0% |
Employment Status by Age in Garden Prairie
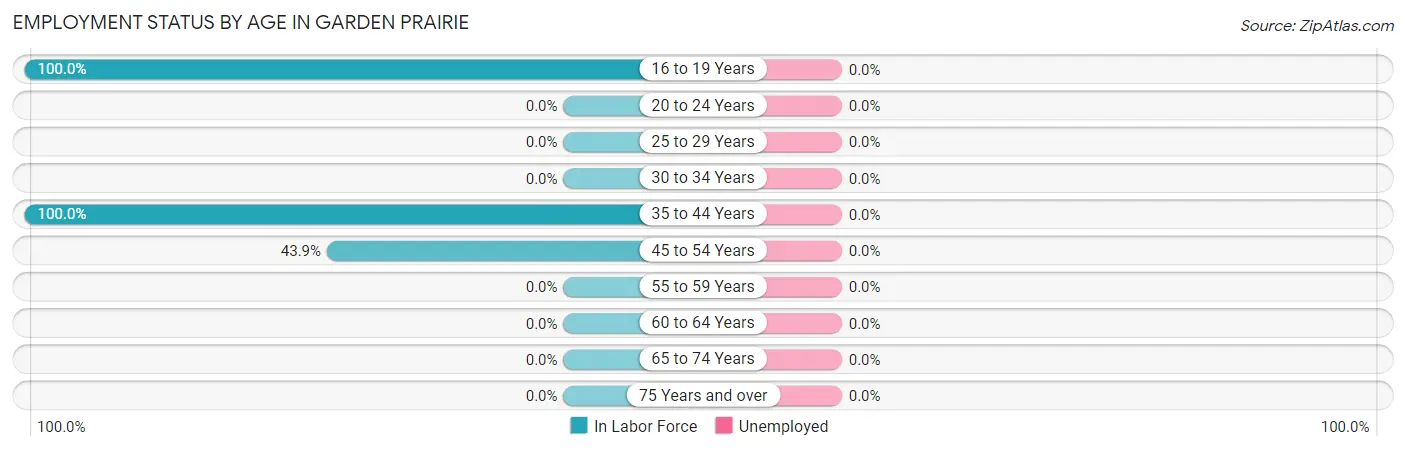
| Age Bracket | In Labor Force | Unemployed |
| 16 to 19 Years | 26 (100.0%) | 0 (0.0%) |
| 20 to 24 Years | 0 (0.0%) | 0 (0.0%) |
| 25 to 29 Years | 0 (0.0%) | 0 (0.0%) |
| 30 to 34 Years | 0 (0.0%) | 0 (0.0%) |
| 35 to 44 Years | 18 (100.0%) | 0 (0.0%) |
| 45 to 54 Years | 29 (43.9%) | 0 (0.0%) |
| 55 to 59 Years | 0 (0.0%) | 0 (0.0%) |
| 60 to 64 Years | 0 (0.0%) | 0 (0.0%) |
| 65 to 74 Years | 0 (0.0%) | 0 (0.0%) |
| 75 Years and over | 0 (0.0%) | 0 (0.0%) |
| Total | 73 (41.2%) | 0 (0.0%) |
Employment Status by Educational Attainment in Garden Prairie
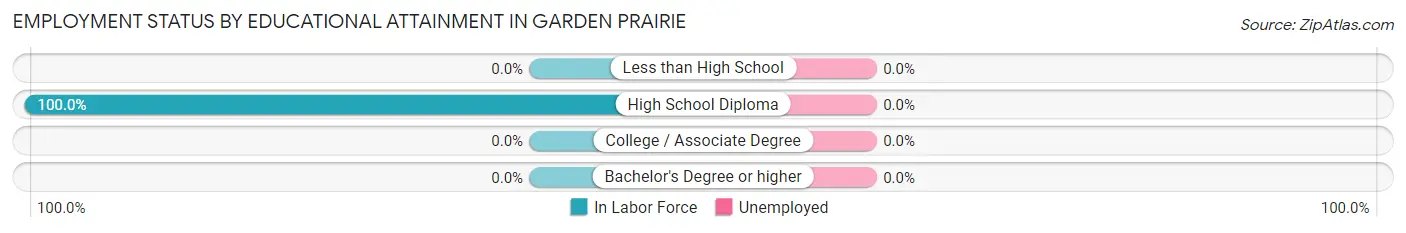
| Educational Attainment | In Labor Force | Unemployed |
| Less than High School | 0 (0.0%) | 0 (0.0%) |
| High School Diploma | 47 (100.0%) | 0 (0.0%) |
| College / Associate Degree | 0 (0.0%) | 0 (0.0%) |
| Bachelor's Degree or higher | 0 (0.0%) | 0 (0.0%) |
| Total | 47 (56.0%) | 0 (0.0%) |
Employment Occupations by Sex in Garden Prairie
Management, Business, Science and Arts Occupations
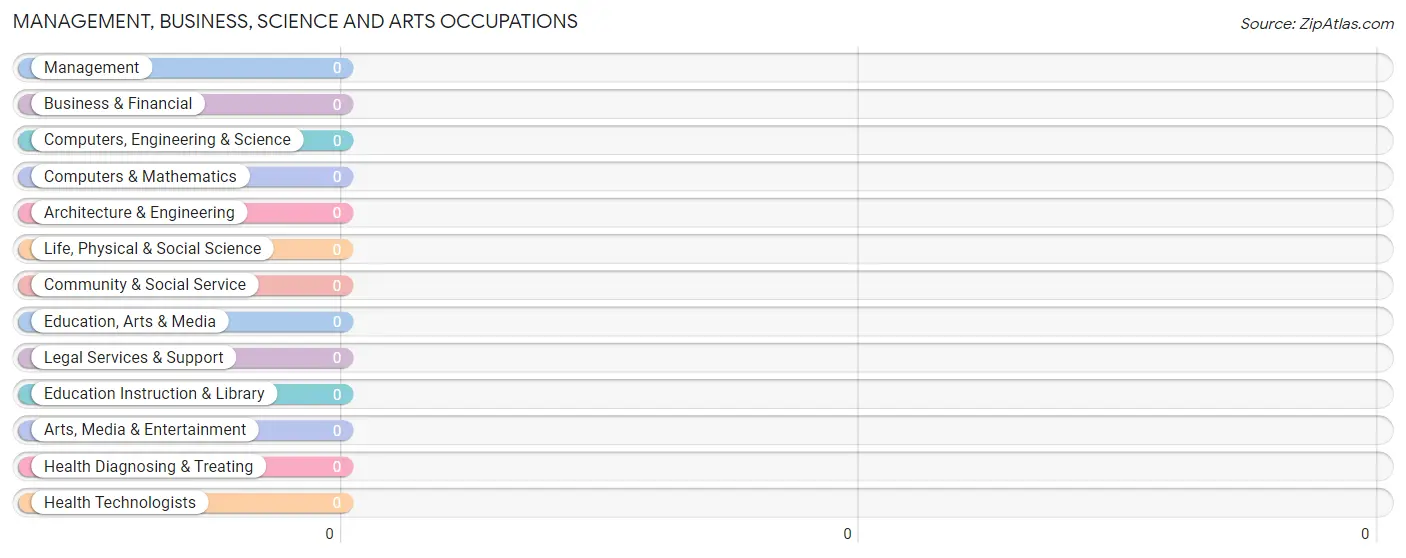
Management, Business, Science and Arts Occupations by Sex
| Occupation | Male | Female |
| Management | 0 (0.0%) | 0 (0.0%) |
| Business & Financial | 0 (0.0%) | 0 (0.0%) |
| Computers, Engineering & Science | 0 (0.0%) | 0 (0.0%) |
| Computers & Mathematics | 0 (0.0%) | 0 (0.0%) |
| Architecture & Engineering | 0 (0.0%) | 0 (0.0%) |
| Life, Physical & Social Science | 0 (0.0%) | 0 (0.0%) |
| Community & Social Service | 0 (0.0%) | 0 (0.0%) |
| Education, Arts & Media | 0 (0.0%) | 0 (0.0%) |
| Legal Services & Support | 0 (0.0%) | 0 (0.0%) |
| Education Instruction & Library | 0 (0.0%) | 0 (0.0%) |
| Arts, Media & Entertainment | 0 (0.0%) | 0 (0.0%) |
| Health Diagnosing & Treating | 0 (0.0%) | 0 (0.0%) |
| Health Technologists | 0 (0.0%) | 0 (0.0%) |
| Total (Category) | 0 (0.0%) | 0 (0.0%) |
| Total (Overall) | 47 (64.4%) | 26 (35.6%) |
Services Occupations
The most common Services occupations in Garden Prairie are , and Food Preparation & Serving (26 | 35.6%).
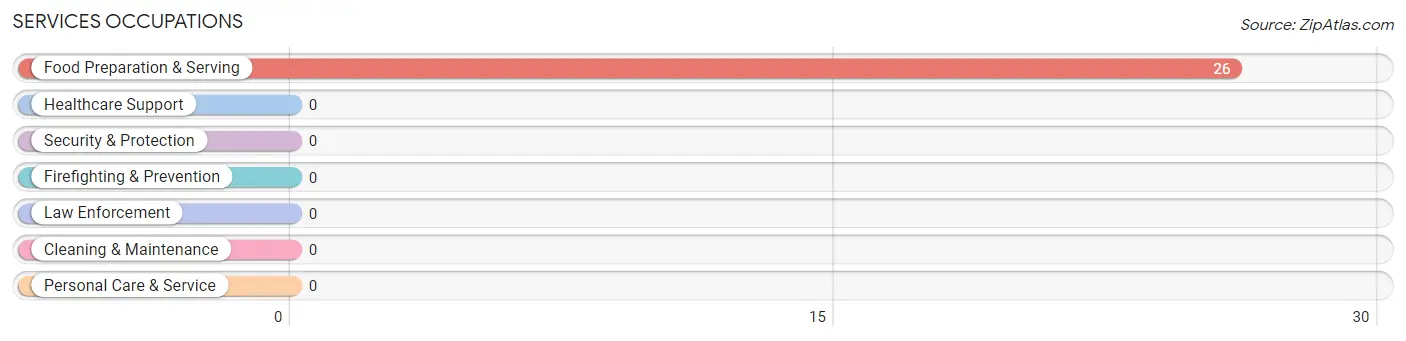
Services Occupations by Sex
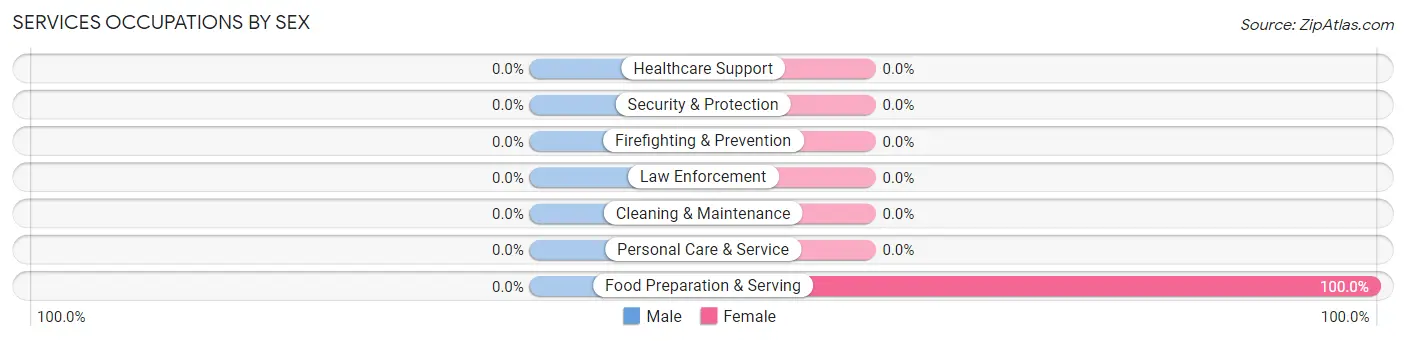
| Occupation | Male | Female |
| Healthcare Support | 0 (0.0%) | 0 (0.0%) |
| Security & Protection | 0 (0.0%) | 0 (0.0%) |
| Firefighting & Prevention | 0 (0.0%) | 0 (0.0%) |
| Law Enforcement | 0 (0.0%) | 0 (0.0%) |
| Food Preparation & Serving | 0 (0.0%) | 26 (100.0%) |
| Cleaning & Maintenance | 0 (0.0%) | 0 (0.0%) |
| Personal Care & Service | 0 (0.0%) | 0 (0.0%) |
| Total (Category) | 0 (0.0%) | 26 (100.0%) |
| Total (Overall) | 47 (64.4%) | 26 (35.6%) |
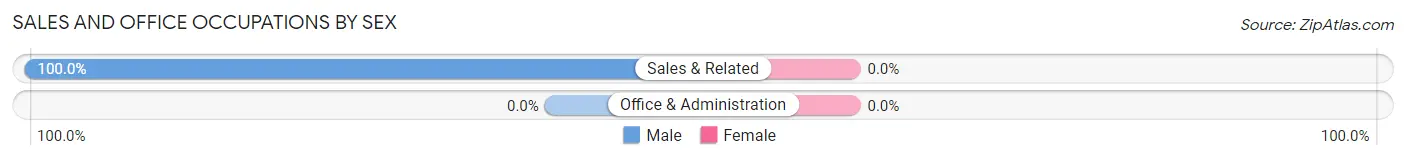
Sales and Office Occupations
The most common Sales and Office occupations in Garden Prairie are , and Sales & Related (18 | 24.7%).
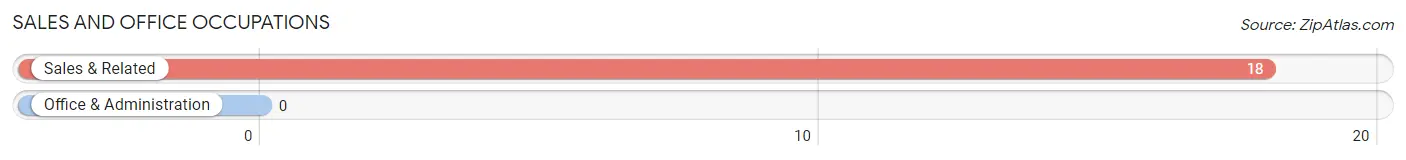
Sales and Office Occupations by Sex
| Occupation | Male | Female |
| Sales & Related | 18 (100.0%) | 0 (0.0%) |
| Office & Administration | 0 (0.0%) | 0 (0.0%) |
| Total (Category) | 18 (100.0%) | 0 (0.0%) |
| Total (Overall) | 47 (64.4%) | 26 (35.6%) |
Natural Resources, Construction and Maintenance Occupations
The most common Natural Resources, Construction and Maintenance occupations in Garden Prairie are , and Construction & Extraction (29 | 39.7%).
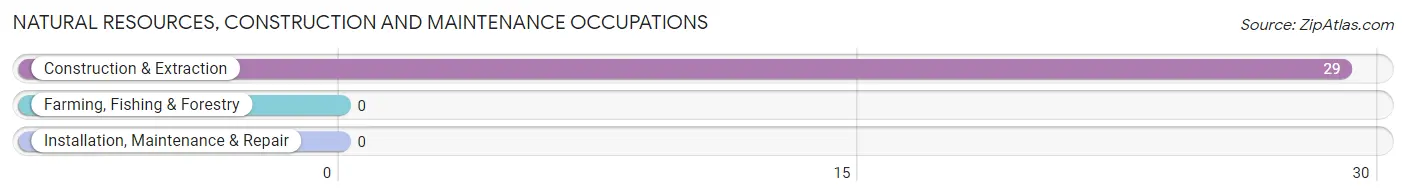
Natural Resources, Construction and Maintenance Occupations by Sex
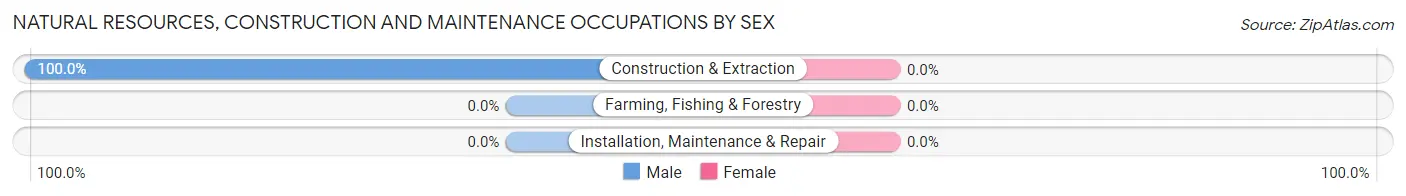
| Occupation | Male | Female |
| Farming, Fishing & Forestry | 0 (0.0%) | 0 (0.0%) |
| Construction & Extraction | 29 (100.0%) | 0 (0.0%) |
| Installation, Maintenance & Repair | 0 (0.0%) | 0 (0.0%) |
| Total (Category) | 29 (100.0%) | 0 (0.0%) |
| Total (Overall) | 47 (64.4%) | 26 (35.6%) |
Production, Transportation and Moving Occupations
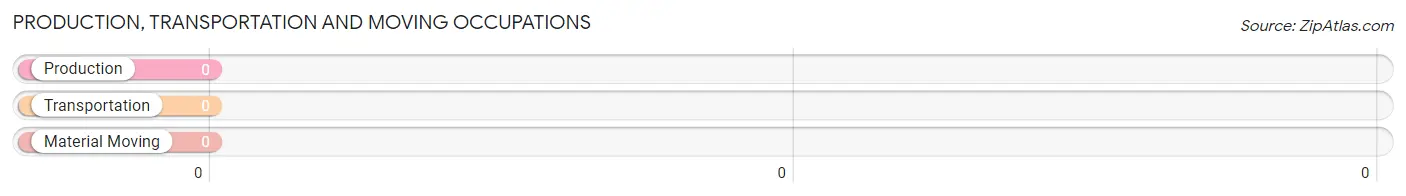
Production, Transportation and Moving Occupations by Sex
| Occupation | Male | Female |
| Production | 0 (0.0%) | 0 (0.0%) |
| Transportation | 0 (0.0%) | 0 (0.0%) |
| Material Moving | 0 (0.0%) | 0 (0.0%) |
| Total (Category) | 0 (0.0%) | 0 (0.0%) |
| Total (Overall) | 47 (64.4%) | 26 (35.6%) |
Employment Industries by Sex in Garden Prairie
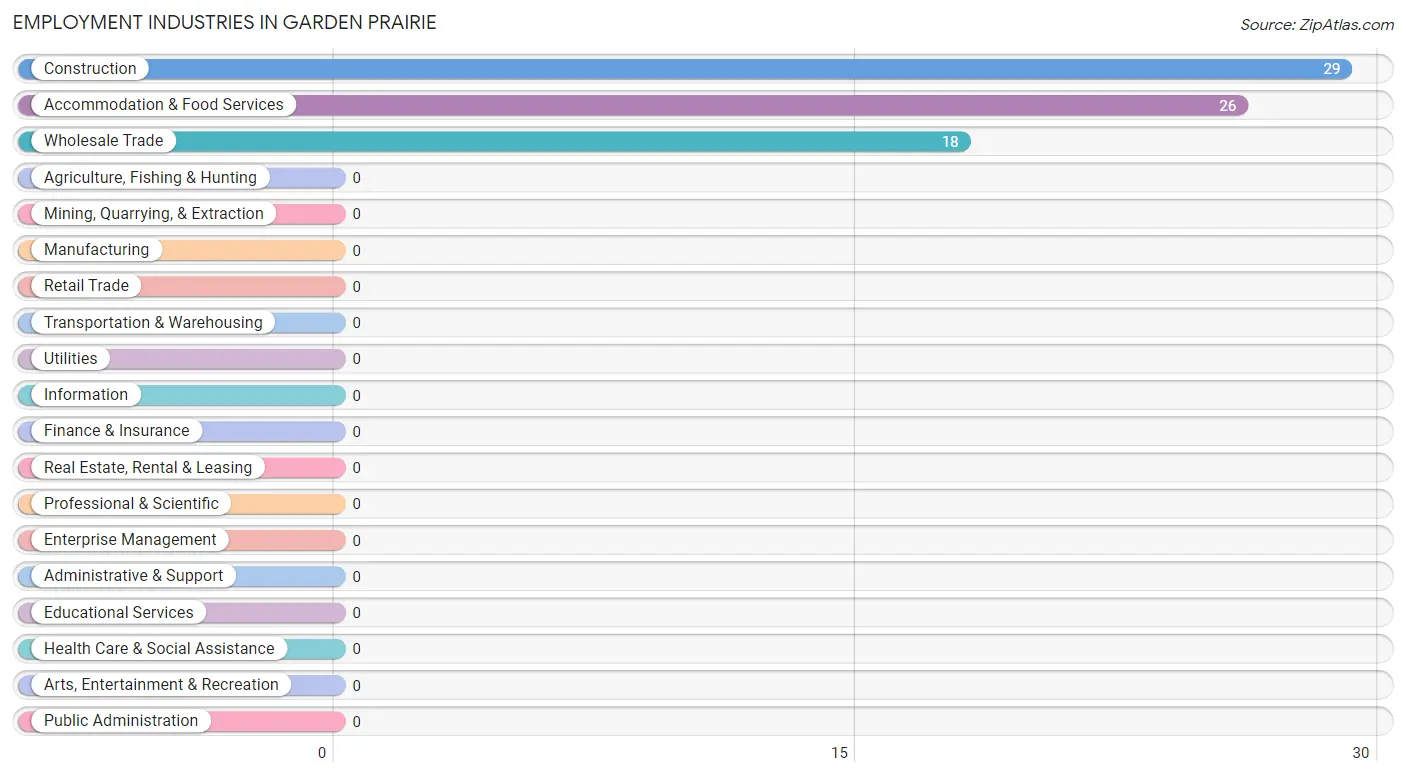
Employment Industries in Garden Prairie
The major employment industries in Garden Prairie include Construction (29 | 39.7%), Accommodation & Food Services (26 | 35.6%), and Wholesale Trade (18 | 24.7%).
Employment Industries by Sex in Garden Prairie
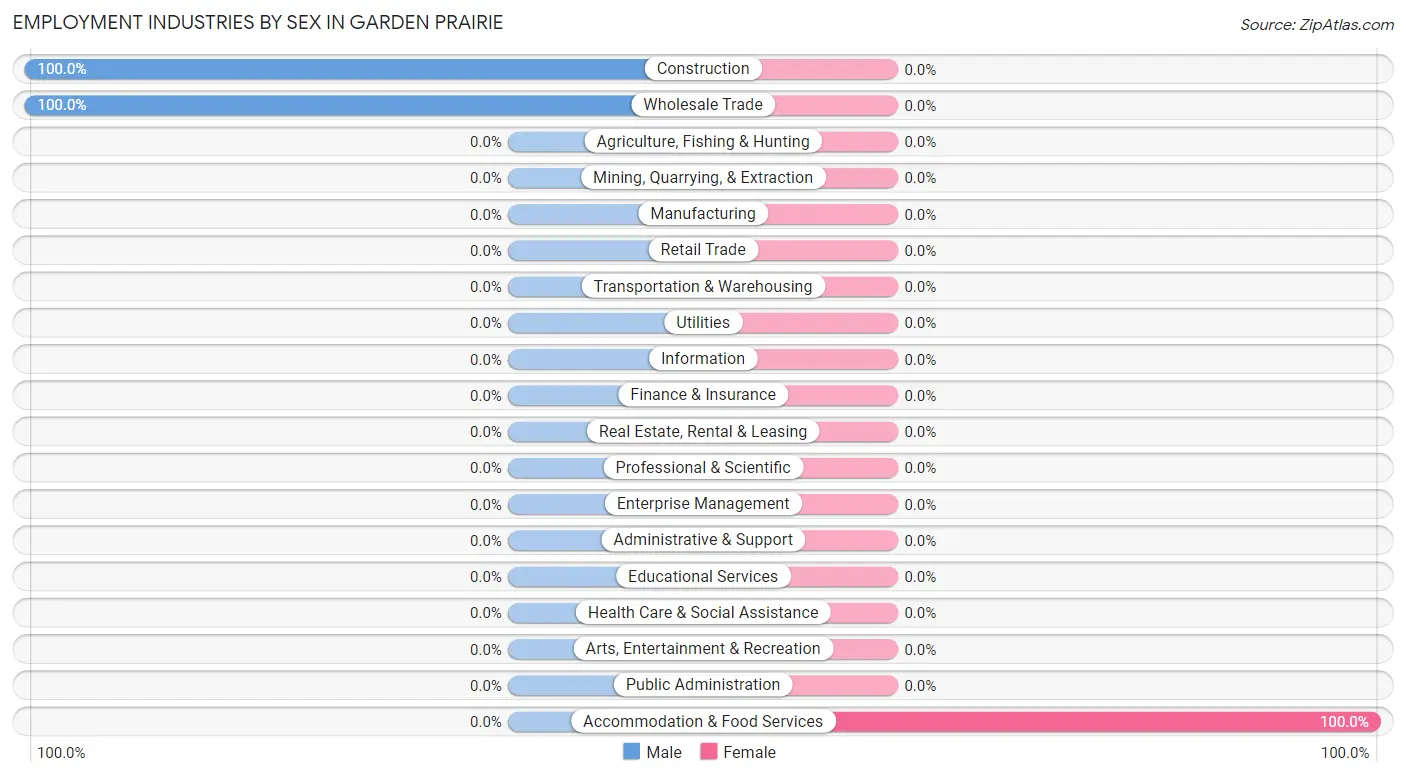
| Industry | Male | Female |
| Agriculture, Fishing & Hunting | 0 (0.0%) | 0 (0.0%) |
| Mining, Quarrying, & Extraction | 0 (0.0%) | 0 (0.0%) |
| Construction | 29 (100.0%) | 0 (0.0%) |
| Manufacturing | 0 (0.0%) | 0 (0.0%) |
| Wholesale Trade | 18 (100.0%) | 0 (0.0%) |
| Retail Trade | 0 (0.0%) | 0 (0.0%) |
| Transportation & Warehousing | 0 (0.0%) | 0 (0.0%) |
| Utilities | 0 (0.0%) | 0 (0.0%) |
| Information | 0 (0.0%) | 0 (0.0%) |
| Finance & Insurance | 0 (0.0%) | 0 (0.0%) |
| Real Estate, Rental & Leasing | 0 (0.0%) | 0 (0.0%) |
| Professional & Scientific | 0 (0.0%) | 0 (0.0%) |
| Enterprise Management | 0 (0.0%) | 0 (0.0%) |
| Administrative & Support | 0 (0.0%) | 0 (0.0%) |
| Educational Services | 0 (0.0%) | 0 (0.0%) |
| Health Care & Social Assistance | 0 (0.0%) | 0 (0.0%) |
| Arts, Entertainment & Recreation | 0 (0.0%) | 0 (0.0%) |
| Accommodation & Food Services | 0 (0.0%) | 26 (100.0%) |
| Public Administration | 0 (0.0%) | 0 (0.0%) |
| Total | 47 (64.4%) | 26 (35.6%) |
Education in Garden Prairie
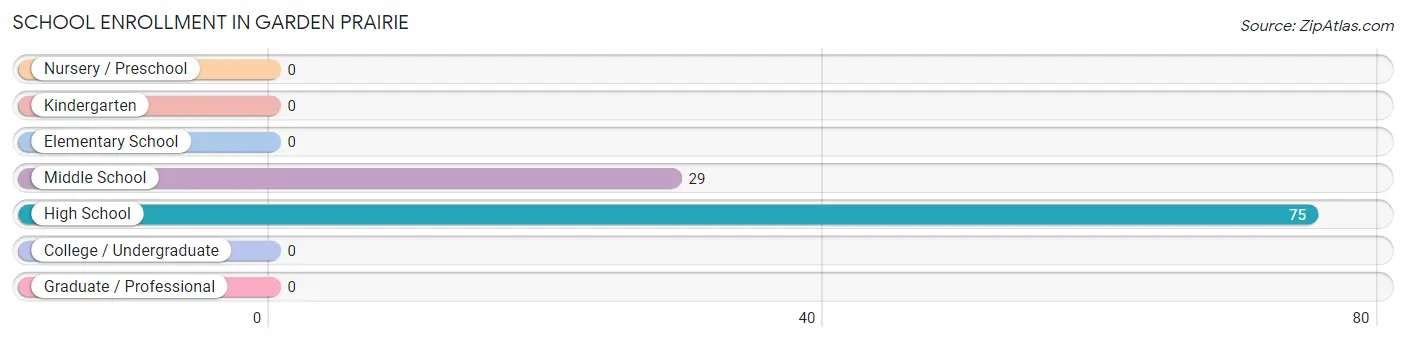
School Enrollment in Garden Prairie
The most common levels of schooling among the 104 students in Garden Prairie are high school (75 | 72.1%), and middle school (29 | 27.9%).
| School Level | # Students | % Students |
| Nursery / Preschool | 0 | 0.0% |
| Kindergarten | 0 | 0.0% |
| Elementary School | 0 | 0.0% |
| Middle School | 29 | 27.9% |
| High School | 75 | 72.1% |
| College / Undergraduate | 0 | 0.0% |
| Graduate / Professional | 0 | 0.0% |
| Total | 104 | 100.0% |
School Enrollment by Age by Funding Source in Garden Prairie
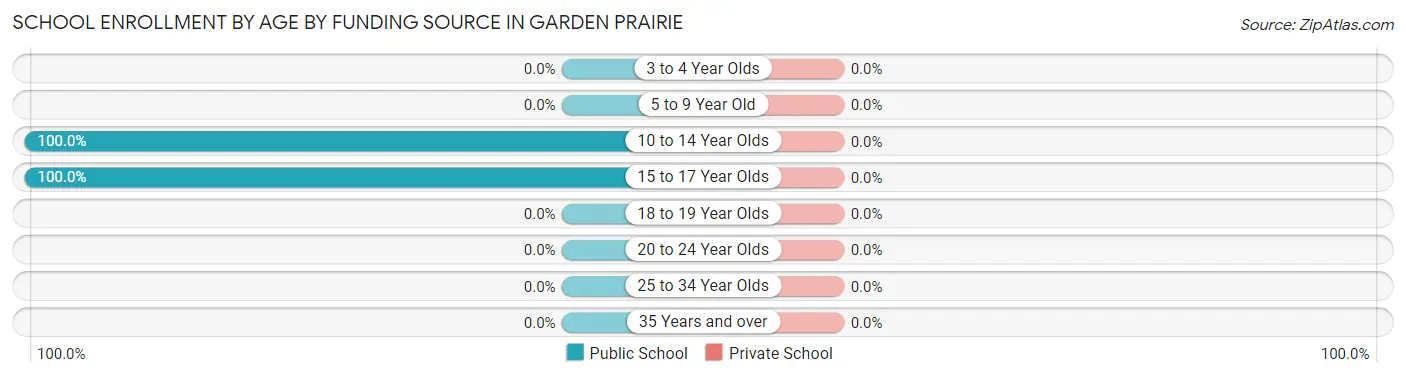
| Age Bracket | Public School | Private School |
| 3 to 4 Year Olds | 0 (0.0%) | 0 (0.0%) |
| 5 to 9 Year Old | 0 (0.0%) | 0 (0.0%) |
| 10 to 14 Year Olds | 54 (100.0%) | 0 (0.0%) |
| 15 to 17 Year Olds | 50 (100.0%) | 0 (0.0%) |
| 18 to 19 Year Olds | 0 (0.0%) | 0 (0.0%) |
| 20 to 24 Year Olds | 0 (0.0%) | 0 (0.0%) |
| 25 to 34 Year Olds | 0 (0.0%) | 0 (0.0%) |
| 35 Years and over | 0 (0.0%) | 0 (0.0%) |
| Total | 104 (100.0%) | 0 (0.0%) |
Educational Attainment by Field of Study in Garden Prairie
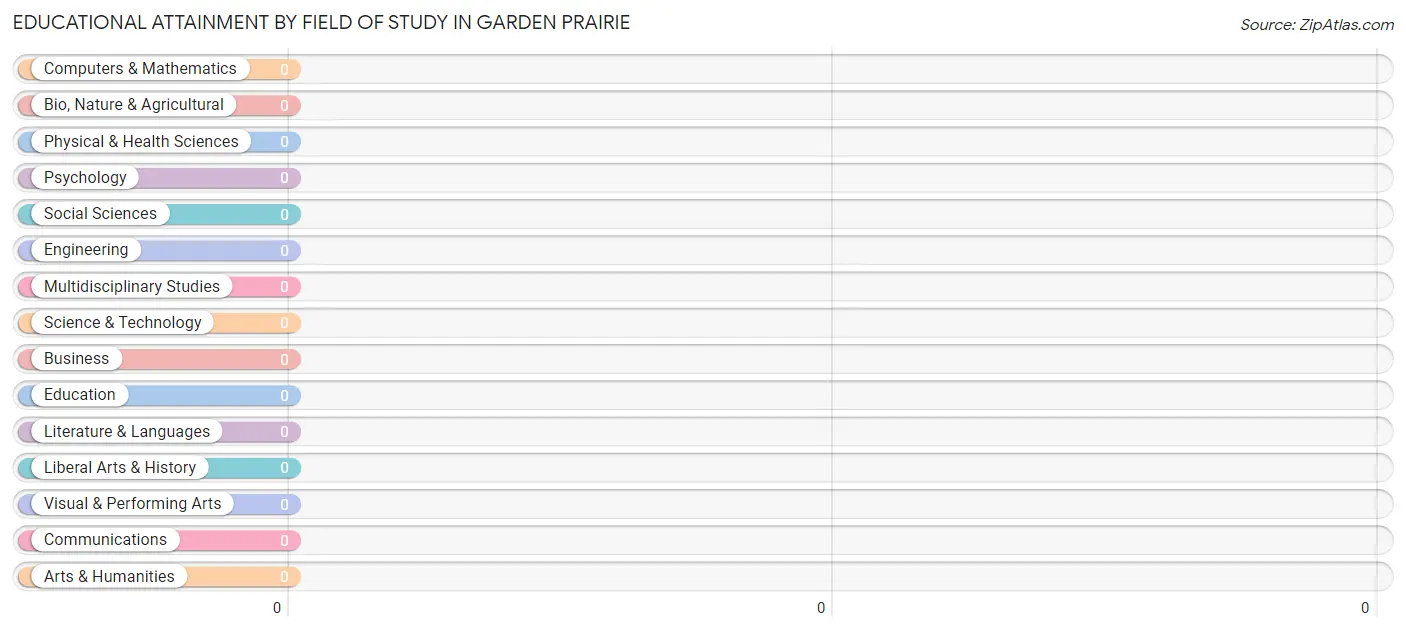
| Field of Study | # Graduates | % Graduates |
| Computers & Mathematics | 0 | 0.0% |
| Bio, Nature & Agricultural | 0 | 0.0% |
| Physical & Health Sciences | 0 | 0.0% |
| Psychology | 0 | 0.0% |
| Social Sciences | 0 | 0.0% |
| Engineering | 0 | 0.0% |
| Multidisciplinary Studies | 0 | 0.0% |
| Science & Technology | 0 | 0.0% |
| Business | 0 | 0.0% |
| Education | 0 | 0.0% |
| Literature & Languages | 0 | 0.0% |
| Liberal Arts & History | 0 | 0.0% |
| Visual & Performing Arts | 0 | 0.0% |
| Communications | 0 | 0.0% |
| Arts & Humanities | 0 | 0.0% |
| Total | 0 | 0.0% |
Transportation & Commute in Garden Prairie
Vehicle Availability by Sex in Garden Prairie
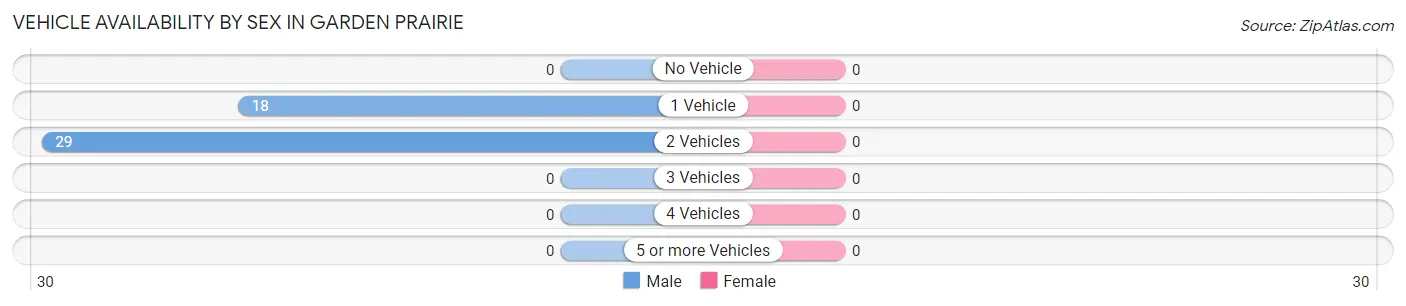
| Vehicles Available | Male | Female |
| No Vehicle | 0 (0.0%) | 0 (0.0%) |
| 1 Vehicle | 18 (38.3%) | 0 (0.0%) |
| 2 Vehicles | 29 (61.7%) | 0 (0.0%) |
| 3 Vehicles | 0 (0.0%) | 0 (0.0%) |
| 4 Vehicles | 0 (0.0%) | 0 (0.0%) |
| 5 or more Vehicles | 0 (0.0%) | 0 (0.0%) |
| Total | 47 (100.0%) | 0 (0.0%) |
Commute Time in Garden Prairie
The most frequently occuring commute durations in Garden Prairie are 45 to 59 minutes (29 commuters, 61.7%), 20 to 24 minutes (18 commuters, 38.3%), and less than 5 minutes (0 commuters, 0.0%).
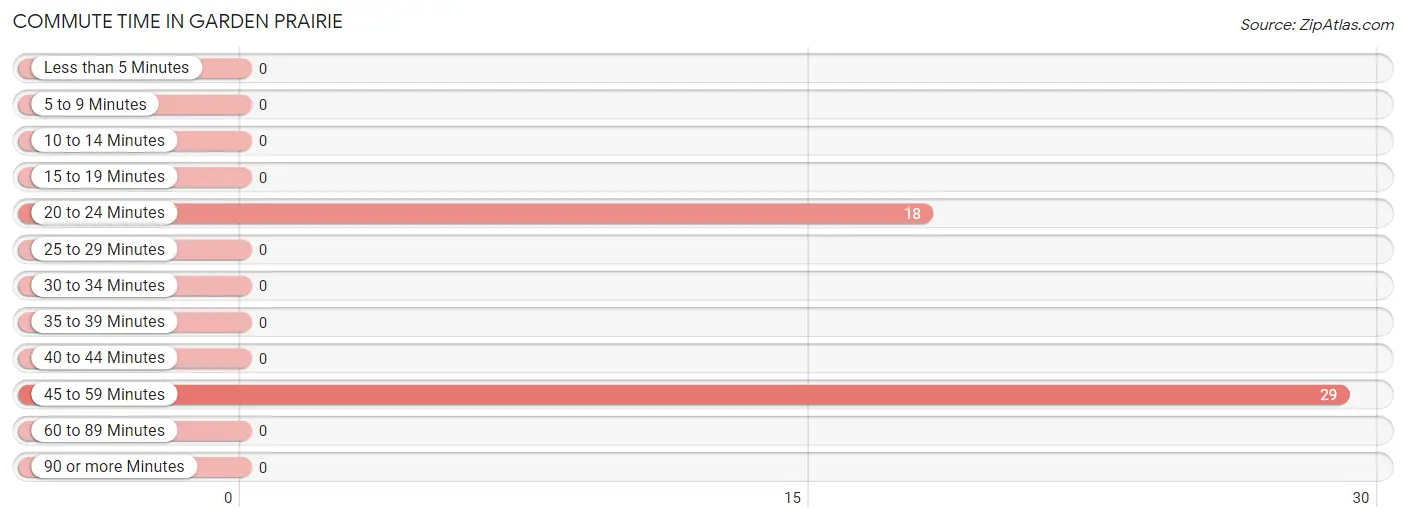
| Commute Time | # Commuters | % Commuters |
| Less than 5 Minutes | 0 | 0.0% |
| 5 to 9 Minutes | 0 | 0.0% |
| 10 to 14 Minutes | 0 | 0.0% |
| 15 to 19 Minutes | 0 | 0.0% |
| 20 to 24 Minutes | 18 | 38.3% |
| 25 to 29 Minutes | 0 | 0.0% |
| 30 to 34 Minutes | 0 | 0.0% |
| 35 to 39 Minutes | 0 | 0.0% |
| 40 to 44 Minutes | 0 | 0.0% |
| 45 to 59 Minutes | 29 | 61.7% |
| 60 to 89 Minutes | 0 | 0.0% |
| 90 or more Minutes | 0 | 0.0% |
Commute Time by Sex in Garden Prairie
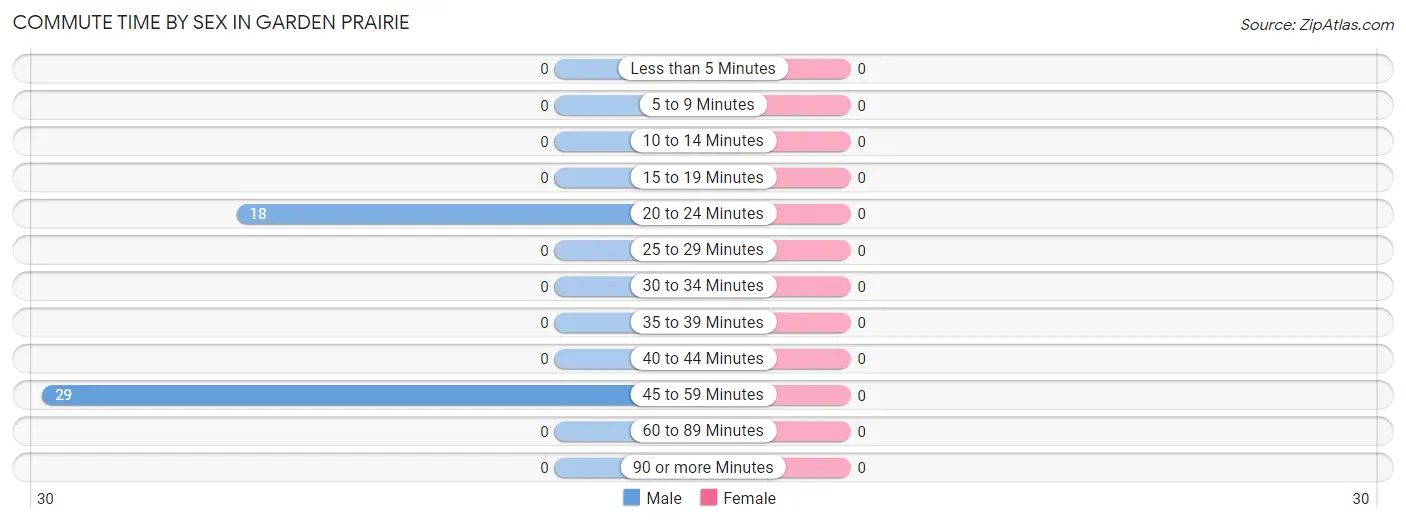
| Commute Time | Male | Female |
| Less than 5 Minutes | 0 (0.0%) | 0 (0.0%) |
| 5 to 9 Minutes | 0 (0.0%) | 0 (0.0%) |
| 10 to 14 Minutes | 0 (0.0%) | 0 (0.0%) |
| 15 to 19 Minutes | 0 (0.0%) | 0 (0.0%) |
| 20 to 24 Minutes | 18 (38.3%) | 0 (0.0%) |
| 25 to 29 Minutes | 0 (0.0%) | 0 (0.0%) |
| 30 to 34 Minutes | 0 (0.0%) | 0 (0.0%) |
| 35 to 39 Minutes | 0 (0.0%) | 0 (0.0%) |
| 40 to 44 Minutes | 0 (0.0%) | 0 (0.0%) |
| 45 to 59 Minutes | 29 (61.7%) | 0 (0.0%) |
| 60 to 89 Minutes | 0 (0.0%) | 0 (0.0%) |
| 90 or more Minutes | 0 (0.0%) | 0 (0.0%) |
Time of Departure to Work by Sex in Garden Prairie
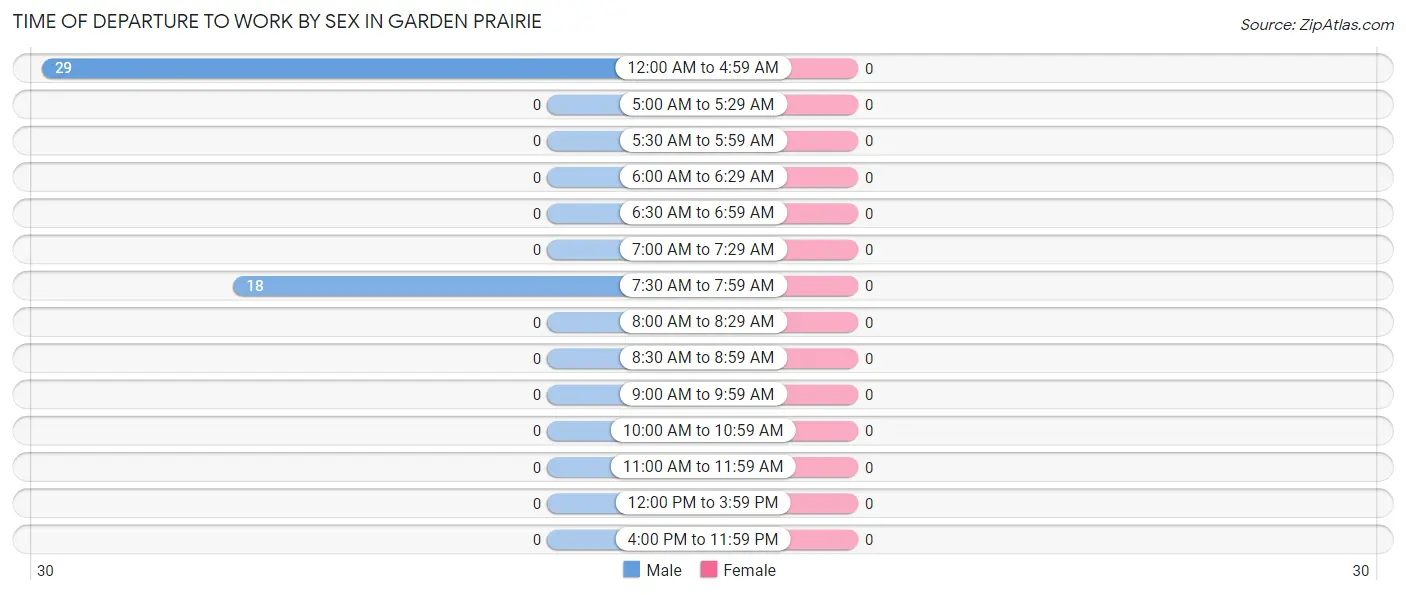
| Time of Departure | Male | Female |
| 12:00 AM to 4:59 AM | 29 (61.7%) | 0 (0.0%) |
| 5:00 AM to 5:29 AM | 0 (0.0%) | 0 (0.0%) |
| 5:30 AM to 5:59 AM | 0 (0.0%) | 0 (0.0%) |
| 6:00 AM to 6:29 AM | 0 (0.0%) | 0 (0.0%) |
| 6:30 AM to 6:59 AM | 0 (0.0%) | 0 (0.0%) |
| 7:00 AM to 7:29 AM | 0 (0.0%) | 0 (0.0%) |
| 7:30 AM to 7:59 AM | 18 (38.3%) | 0 (0.0%) |
| 8:00 AM to 8:29 AM | 0 (0.0%) | 0 (0.0%) |
| 8:30 AM to 8:59 AM | 0 (0.0%) | 0 (0.0%) |
| 9:00 AM to 9:59 AM | 0 (0.0%) | 0 (0.0%) |
| 10:00 AM to 10:59 AM | 0 (0.0%) | 0 (0.0%) |
| 11:00 AM to 11:59 AM | 0 (0.0%) | 0 (0.0%) |
| 12:00 PM to 3:59 PM | 0 (0.0%) | 0 (0.0%) |
| 4:00 PM to 11:59 PM | 0 (0.0%) | 0 (0.0%) |
| Total | 47 (100.0%) | 0 (0.0%) |
Housing Occupancy in Garden Prairie
Occupancy by Ownership in Garden Prairie
Of the total 100 dwellings in Garden Prairie, owner-occupied units account for 85 (85.0%), while renter-occupied units make up 15 (15.0%).
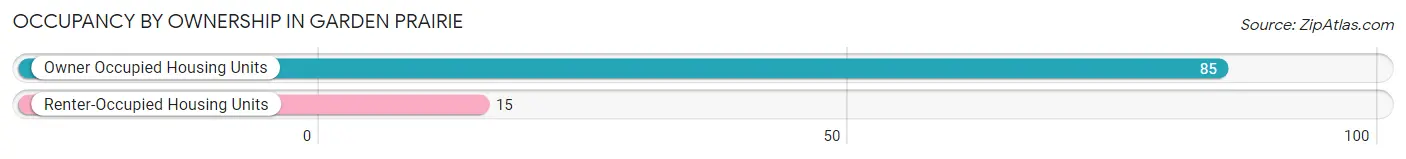
| Occupancy | # Housing Units | % Housing Units |
| Owner Occupied Housing Units | 85 | 85.0% |
| Renter-Occupied Housing Units | 15 | 15.0% |
| Total Occupied Housing Units | 100 | 100.0% |
Occupancy by Household Size in Garden Prairie
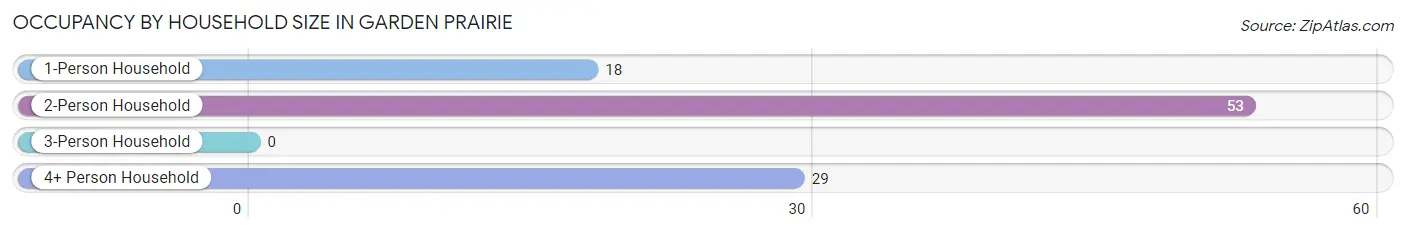
| Household Size | # Housing Units | % Housing Units |
| 1-Person Household | 18 | 18.0% |
| 2-Person Household | 53 | 53.0% |
| 3-Person Household | 0 | 0.0% |
| 4+ Person Household | 29 | 29.0% |
| Total Housing Units | 100 | 100.0% |
Occupancy by Ownership by Household Size in Garden Prairie
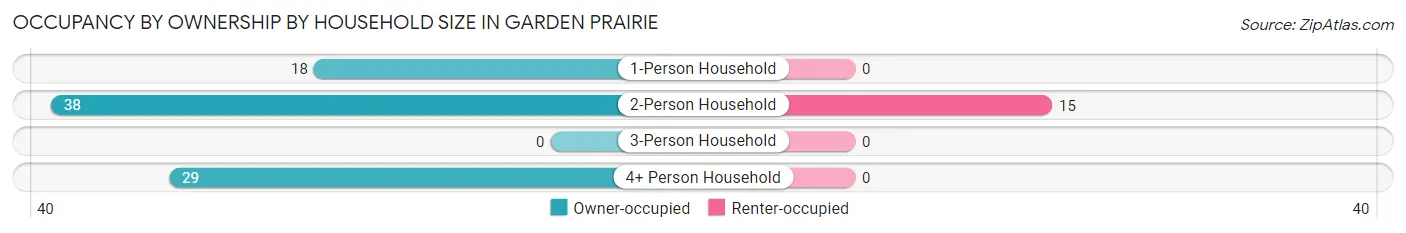
| Household Size | Owner-occupied | Renter-occupied |
| 1-Person Household | 18 (100.0%) | 0 (0.0%) |
| 2-Person Household | 38 (71.7%) | 15 (28.3%) |
| 3-Person Household | 0 (0.0%) | 0 (0.0%) |
| 4+ Person Household | 29 (100.0%) | 0 (0.0%) |
| Total Housing Units | 85 (85.0%) | 15 (15.0%) |
Occupancy by Educational Attainment in Garden Prairie
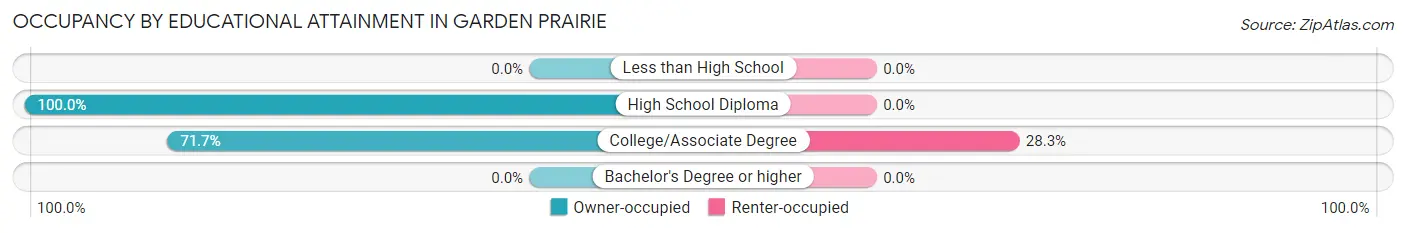
| Household Size | Owner-occupied | Renter-occupied |
| Less than High School | 0 (0.0%) | 0 (0.0%) |
| High School Diploma | 47 (100.0%) | 0 (0.0%) |
| College/Associate Degree | 38 (71.7%) | 15 (28.3%) |
| Bachelor's Degree or higher | 0 (0.0%) | 0 (0.0%) |
Occupancy by Age of Householder in Garden Prairie
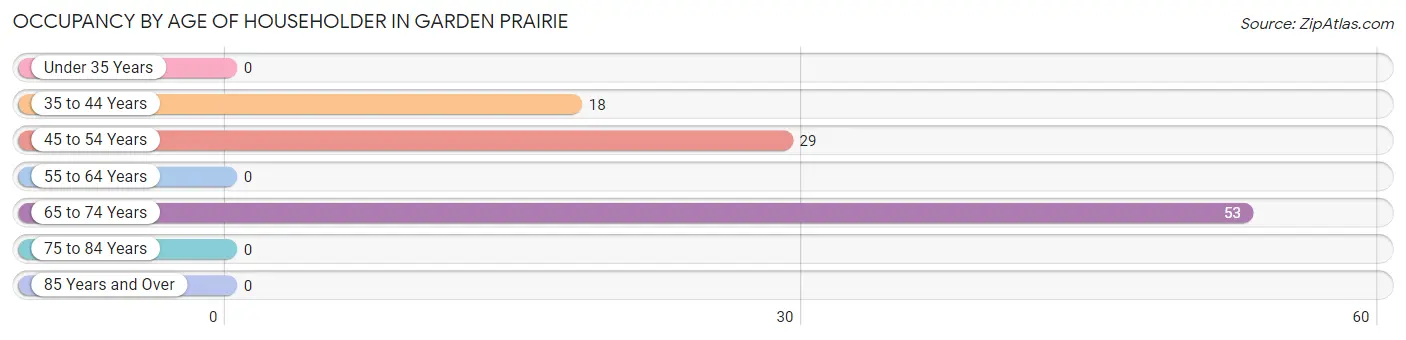
| Age Bracket | # Households | % Households |
| Under 35 Years | 0 | 0.0% |
| 35 to 44 Years | 18 | 18.0% |
| 45 to 54 Years | 29 | 29.0% |
| 55 to 64 Years | 0 | 0.0% |
| 65 to 74 Years | 53 | 53.0% |
| 75 to 84 Years | 0 | 0.0% |
| 85 Years and Over | 0 | 0.0% |
| Total | 100 | 100.0% |
Housing Finances in Garden Prairie
Median Income by Occupancy in Garden Prairie
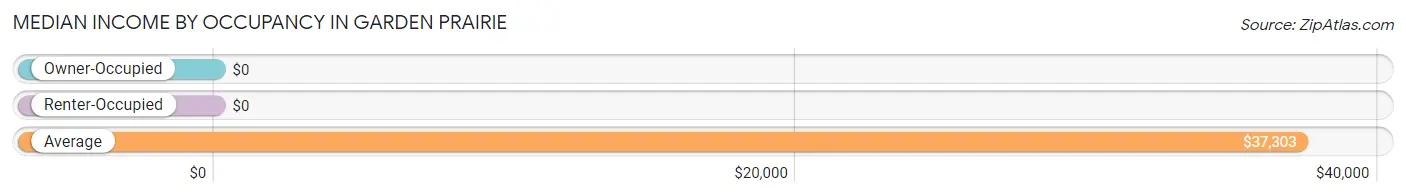
| Occupancy Type | # Households | Median Income |
| Owner-Occupied | 85 (85.0%) | $0 |
| Renter-Occupied | 15 (15.0%) | $0 |
| Average | 100 (100.0%) | $37,303 |
Occupancy by Householder Income Bracket in Garden Prairie
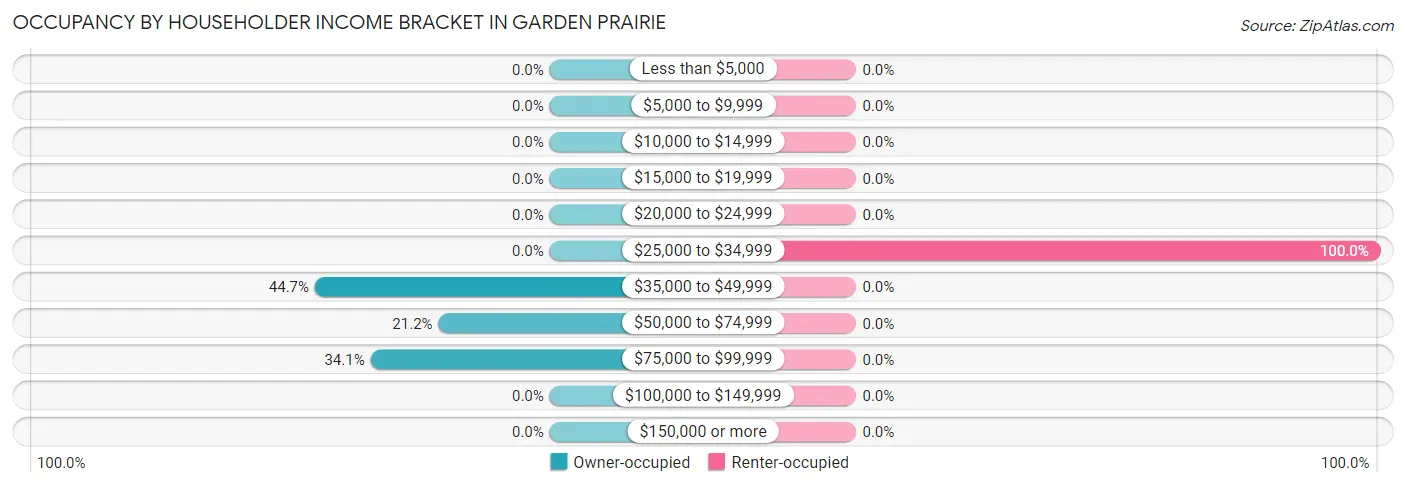
| Income Bracket | Owner-occupied | Renter-occupied |
| Less than $5,000 | 0 (0.0%) | 0 (0.0%) |
| $5,000 to $9,999 | 0 (0.0%) | 0 (0.0%) |
| $10,000 to $14,999 | 0 (0.0%) | 0 (0.0%) |
| $15,000 to $19,999 | 0 (0.0%) | 0 (0.0%) |
| $20,000 to $24,999 | 0 (0.0%) | 0 (0.0%) |
| $25,000 to $34,999 | 0 (0.0%) | 15 (100.0%) |
| $35,000 to $49,999 | 38 (44.7%) | 0 (0.0%) |
| $50,000 to $74,999 | 18 (21.2%) | 0 (0.0%) |
| $75,000 to $99,999 | 29 (34.1%) | 0 (0.0%) |
| $100,000 to $149,999 | 0 (0.0%) | 0 (0.0%) |
| $150,000 or more | 0 (0.0%) | 0 (0.0%) |
| Total | 85 (100.0%) | 15 (100.0%) |
Monthly Housing Cost Tiers in Garden Prairie
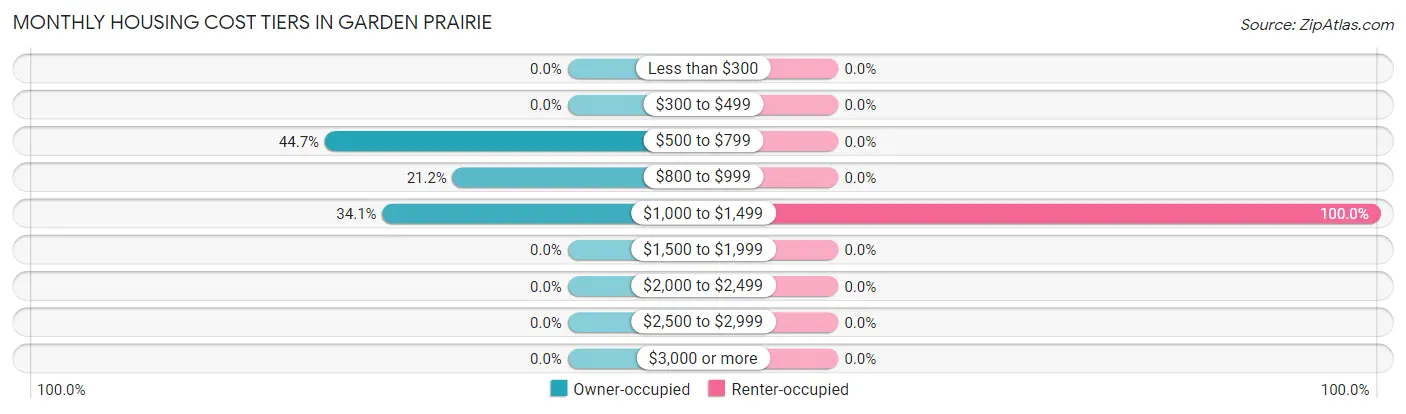
| Monthly Cost | Owner-occupied | Renter-occupied |
| Less than $300 | 0 (0.0%) | 0 (0.0%) |
| $300 to $499 | 0 (0.0%) | 0 (0.0%) |
| $500 to $799 | 38 (44.7%) | 0 (0.0%) |
| $800 to $999 | 18 (21.2%) | 0 (0.0%) |
| $1,000 to $1,499 | 29 (34.1%) | 15 (100.0%) |
| $1,500 to $1,999 | 0 (0.0%) | 0 (0.0%) |
| $2,000 to $2,499 | 0 (0.0%) | 0 (0.0%) |
| $2,500 to $2,999 | 0 (0.0%) | 0 (0.0%) |
| $3,000 or more | 0 (0.0%) | 0 (0.0%) |
| Total | 85 (100.0%) | 15 (100.0%) |
Physical Housing Characteristics in Garden Prairie
Housing Structures in Garden Prairie
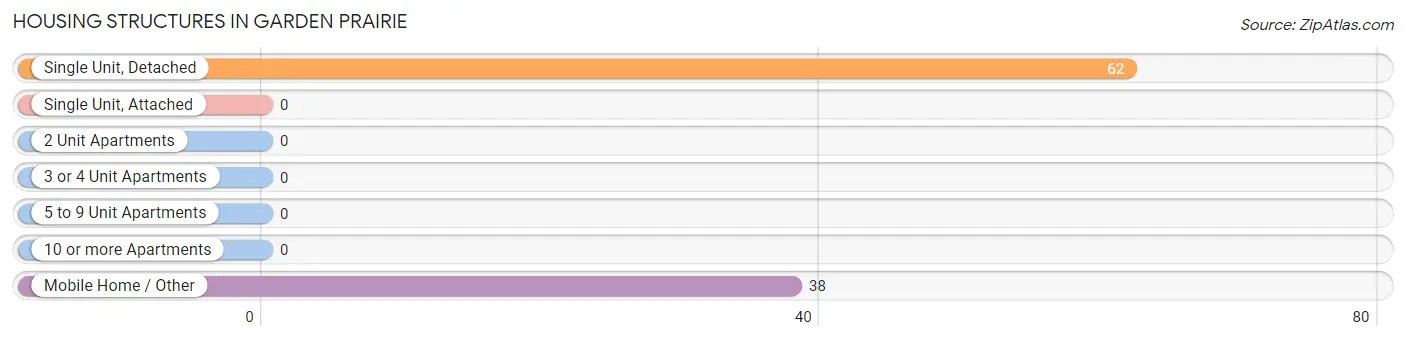
| Structure Type | # Housing Units | % Housing Units |
| Single Unit, Detached | 62 | 62.0% |
| Single Unit, Attached | 0 | 0.0% |
| 2 Unit Apartments | 0 | 0.0% |
| 3 or 4 Unit Apartments | 0 | 0.0% |
| 5 to 9 Unit Apartments | 0 | 0.0% |
| 10 or more Apartments | 0 | 0.0% |
| Mobile Home / Other | 38 | 38.0% |
| Total | 100 | 100.0% |
Housing Structures by Occupancy in Garden Prairie
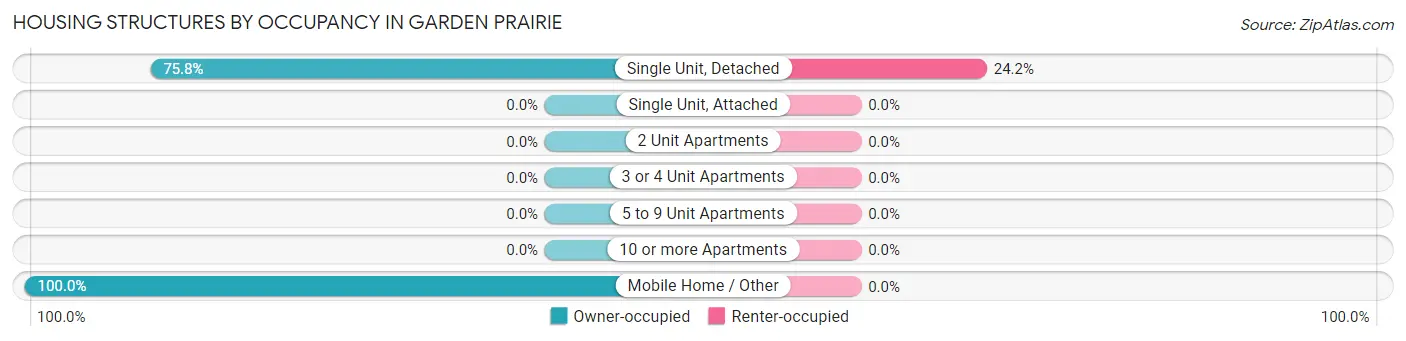
| Structure Type | Owner-occupied | Renter-occupied |
| Single Unit, Detached | 47 (75.8%) | 15 (24.2%) |
| Single Unit, Attached | 0 (0.0%) | 0 (0.0%) |
| 2 Unit Apartments | 0 (0.0%) | 0 (0.0%) |
| 3 or 4 Unit Apartments | 0 (0.0%) | 0 (0.0%) |
| 5 to 9 Unit Apartments | 0 (0.0%) | 0 (0.0%) |
| 10 or more Apartments | 0 (0.0%) | 0 (0.0%) |
| Mobile Home / Other | 38 (100.0%) | 0 (0.0%) |
| Total | 85 (85.0%) | 15 (15.0%) |
Housing Structures by Number of Rooms in Garden Prairie
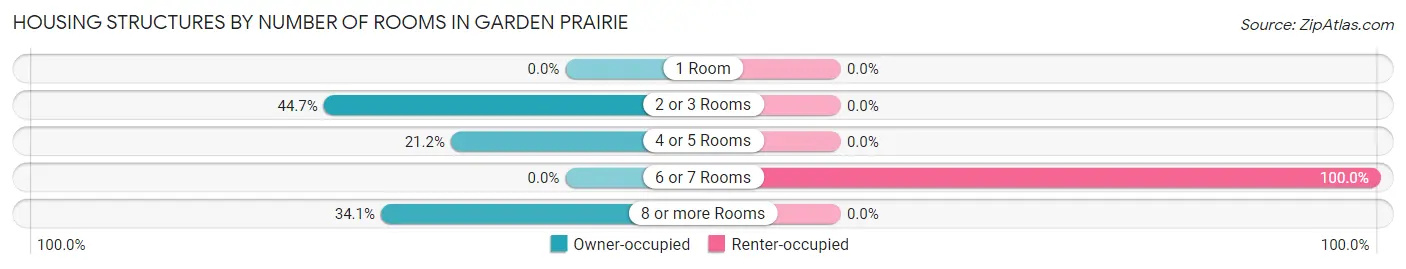
| Number of Rooms | Owner-occupied | Renter-occupied |
| 1 Room | 0 (0.0%) | 0 (0.0%) |
| 2 or 3 Rooms | 38 (44.7%) | 0 (0.0%) |
| 4 or 5 Rooms | 18 (21.2%) | 0 (0.0%) |
| 6 or 7 Rooms | 0 (0.0%) | 15 (100.0%) |
| 8 or more Rooms | 29 (34.1%) | 0 (0.0%) |
| Total | 85 (100.0%) | 15 (100.0%) |
Housing Structure by Heating Type in Garden Prairie
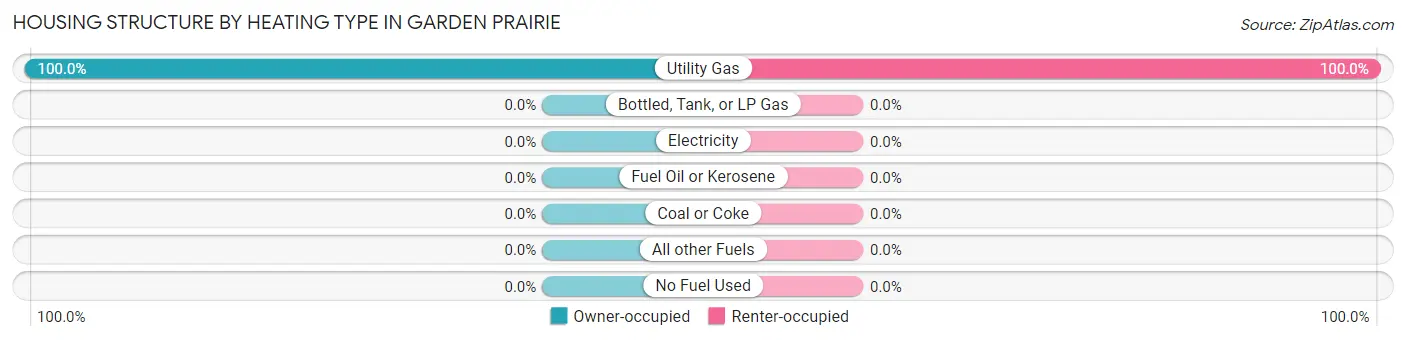
| Heating Type | Owner-occupied | Renter-occupied |
| Utility Gas | 85 (100.0%) | 15 (100.0%) |
| Bottled, Tank, or LP Gas | 0 (0.0%) | 0 (0.0%) |
| Electricity | 0 (0.0%) | 0 (0.0%) |
| Fuel Oil or Kerosene | 0 (0.0%) | 0 (0.0%) |
| Coal or Coke | 0 (0.0%) | 0 (0.0%) |
| All other Fuels | 0 (0.0%) | 0 (0.0%) |
| No Fuel Used | 0 (0.0%) | 0 (0.0%) |
| Total | 85 (100.0%) | 15 (100.0%) |
Household Vehicle Usage in Garden Prairie
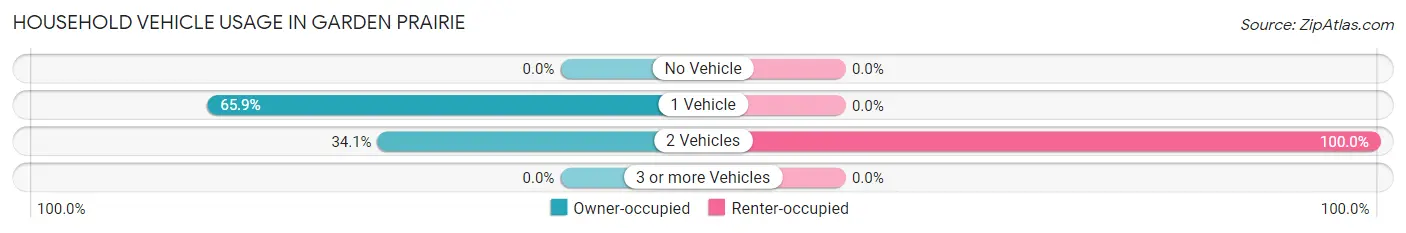
| Vehicles per Household | Owner-occupied | Renter-occupied |
| No Vehicle | 0 (0.0%) | 0 (0.0%) |
| 1 Vehicle | 56 (65.9%) | 0 (0.0%) |
| 2 Vehicles | 29 (34.1%) | 15 (100.0%) |
| 3 or more Vehicles | 0 (0.0%) | 0 (0.0%) |
| Total | 85 (100.0%) | 15 (100.0%) |
Real Estate & Mortgages in Garden Prairie
Real Estate and Mortgage Overview in Garden Prairie
| Characteristic | Without Mortgage | With Mortgage |
| Housing Units | 0 | 85 |
| Median Property Value | - | - |
| Median Household Income | - | - |
| Monthly Housing Costs | - | - |
| Real Estate Taxes | - | - |
Property Value by Mortgage Status in Garden Prairie
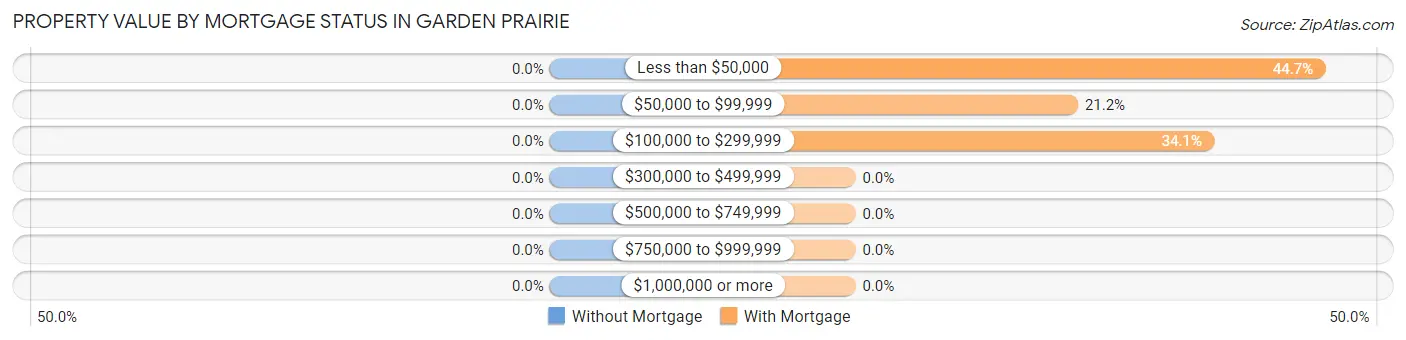
| Property Value | Without Mortgage | With Mortgage |
| Less than $50,000 | 0 (0.0%) | 38 (44.7%) |
| $50,000 to $99,999 | 0 (0.0%) | 18 (21.2%) |
| $100,000 to $299,999 | 0 (0.0%) | 29 (34.1%) |
| $300,000 to $499,999 | 0 (0.0%) | 0 (0.0%) |
| $500,000 to $749,999 | 0 (0.0%) | 0 (0.0%) |
| $750,000 to $999,999 | 0 (0.0%) | 0 (0.0%) |
| $1,000,000 or more | 0 (0.0%) | 0 (0.0%) |
| Total | 0 (0.0%) | 85 (100.0%) |
Household Income by Mortgage Status in Garden Prairie
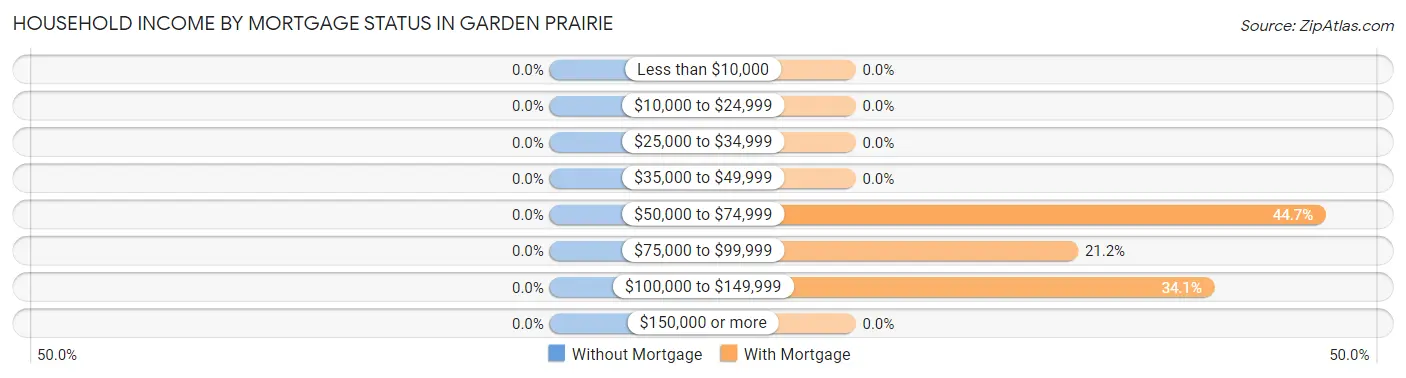
| Household Income | Without Mortgage | With Mortgage |
| Less than $10,000 | 0 (0.0%) | 0 (0.0%) |
| $10,000 to $24,999 | 0 (0.0%) | 0 (0.0%) |
| $25,000 to $34,999 | 0 (0.0%) | 0 (0.0%) |
| $35,000 to $49,999 | 0 (0.0%) | 0 (0.0%) |
| $50,000 to $74,999 | 0 (0.0%) | 38 (44.7%) |
| $75,000 to $99,999 | 0 (0.0%) | 18 (21.2%) |
| $100,000 to $149,999 | 0 (0.0%) | 29 (34.1%) |
| $150,000 or more | 0 (0.0%) | 0 (0.0%) |
| Total | 0 (0.0%) | 85 (100.0%) |
Property Value to Household Income Ratio in Garden Prairie
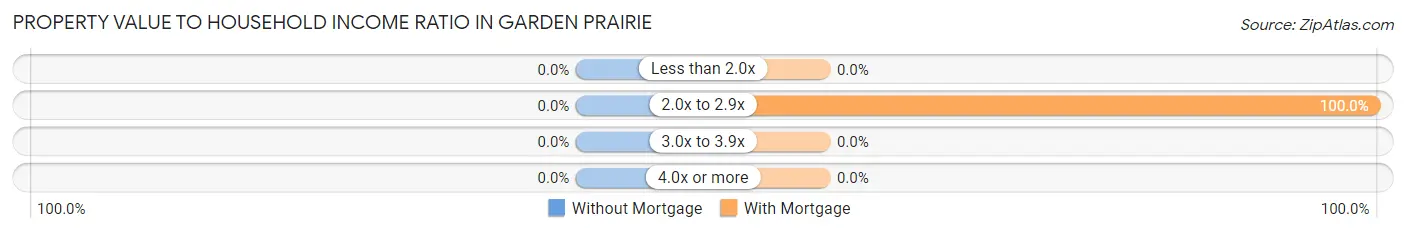
| Value-to-Income Ratio | Without Mortgage | With Mortgage |
| Less than 2.0x | 0 (0.0%) | 0 (0.0%) |
| 2.0x to 2.9x | 0 (0.0%) | 85 (100.0%) |
| 3.0x to 3.9x | 0 (0.0%) | 0 (0.0%) |
| 4.0x or more | 0 (0.0%) | 0 (0.0%) |
| Total | 0 (0.0%) | 85 (100.0%) |
Real Estate Taxes by Mortgage Status in Garden Prairie
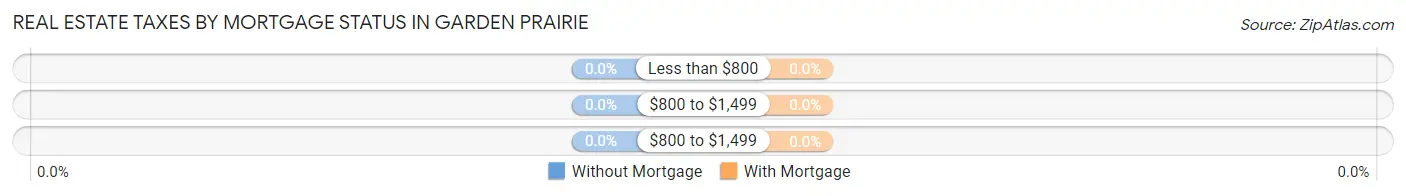
| Property Taxes | Without Mortgage | With Mortgage |
| Less than $800 | 0 (0.0%) | 0 (0.0%) |
| $800 to $1,499 | 0 (0.0%) | 0 (0.0%) |
| $800 to $1,499 | 0 (0.0%) | 0 (0.0%) |
| Total | 0 (0.0%) | 85 (100.0%) |
Health & Disability in Garden Prairie
Health Insurance Coverage by Age in Garden Prairie
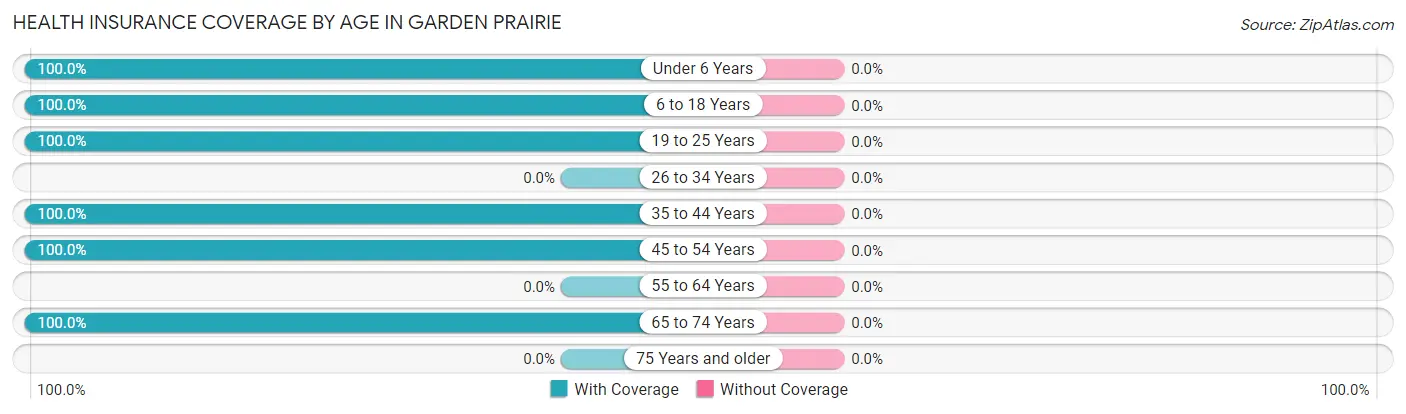
| Age Bracket | With Coverage | Without Coverage |
| Under 6 Years | 47 (100.0%) | 0 (0.0%) |
| 6 to 18 Years | 104 (100.0%) | 0 (0.0%) |
| 19 to 25 Years | 26 (100.0%) | 0 (0.0%) |
| 26 to 34 Years | 0 (0.0%) | 0 (0.0%) |
| 35 to 44 Years | 18 (100.0%) | 0 (0.0%) |
| 45 to 54 Years | 66 (100.0%) | 0 (0.0%) |
| 55 to 64 Years | 0 (0.0%) | 0 (0.0%) |
| 65 to 74 Years | 67 (100.0%) | 0 (0.0%) |
| 75 Years and older | 0 (0.0%) | 0 (0.0%) |
| Total | 328 (100.0%) | 0 (0.0%) |
Health Insurance Coverage by Citizenship Status in Garden Prairie
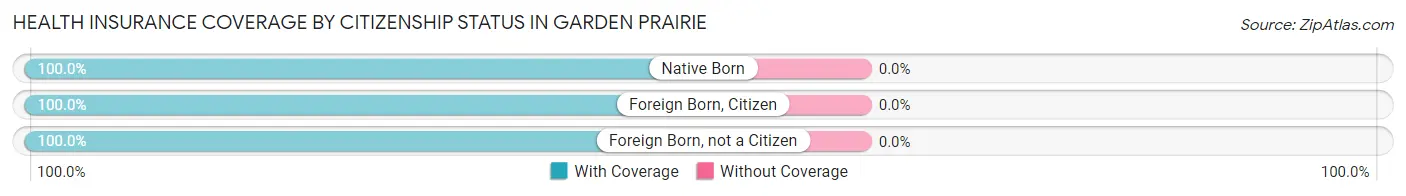
| Citizenship Status | With Coverage | Without Coverage |
| Native Born | 47 (100.0%) | 0 (0.0%) |
| Foreign Born, Citizen | 104 (100.0%) | 0 (0.0%) |
| Foreign Born, not a Citizen | 26 (100.0%) | 0 (0.0%) |
Health Insurance Coverage by Household Income in Garden Prairie
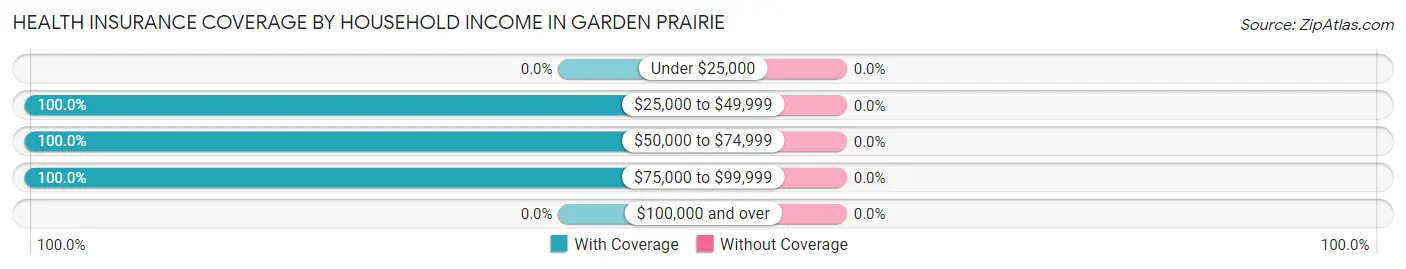
| Household Income | With Coverage | Without Coverage |
| Under $25,000 | 0 (0.0%) | 0 (0.0%) |
| $25,000 to $49,999 | 104 (100.0%) | 0 (0.0%) |
| $50,000 to $74,999 | 18 (100.0%) | 0 (0.0%) |
| $75,000 to $99,999 | 206 (100.0%) | 0 (0.0%) |
| $100,000 and over | 0 (0.0%) | 0 (0.0%) |
Public vs Private Health Insurance Coverage by Age in Garden Prairie
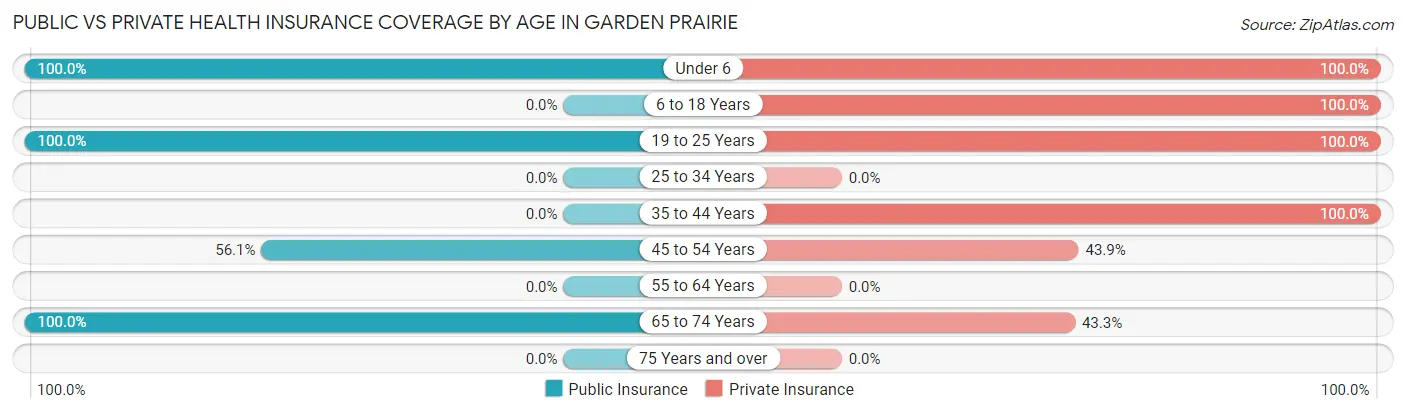
| Age Bracket | Public Insurance | Private Insurance |
| Under 6 | 47 (100.0%) | 47 (100.0%) |
| 6 to 18 Years | 0 (0.0%) | 104 (100.0%) |
| 19 to 25 Years | 26 (100.0%) | 26 (100.0%) |
| 25 to 34 Years | 0 (0.0%) | 0 (0.0%) |
| 35 to 44 Years | 0 (0.0%) | 18 (100.0%) |
| 45 to 54 Years | 37 (56.1%) | 29 (43.9%) |
| 55 to 64 Years | 0 (0.0%) | 0 (0.0%) |
| 65 to 74 Years | 67 (100.0%) | 29 (43.3%) |
| 75 Years and over | 0 (0.0%) | 0 (0.0%) |
| Total | 177 (54.0%) | 253 (77.1%) |
Disability Status by Sex by Age in Garden Prairie
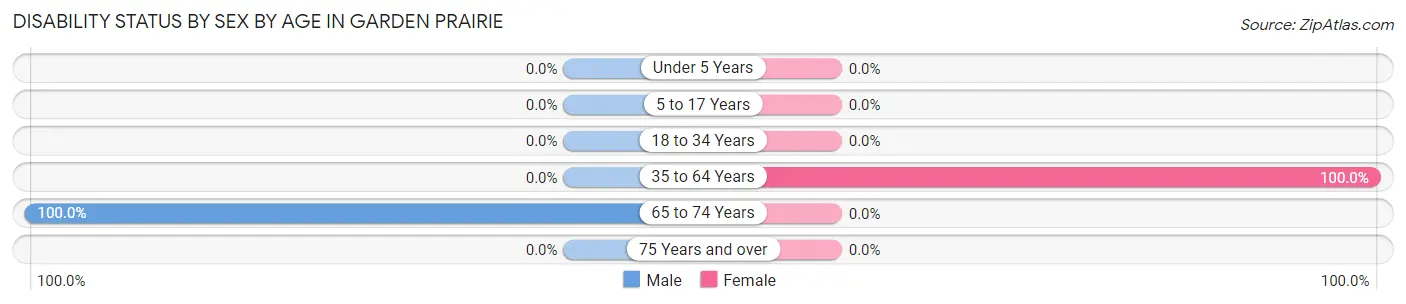
| Age Bracket | Male | Female |
| Under 5 Years | 0 (0.0%) | 0 (0.0%) |
| 5 to 17 Years | 0 (0.0%) | 0 (0.0%) |
| 18 to 34 Years | 0 (0.0%) | 0 (0.0%) |
| 35 to 64 Years | 0 (0.0%) | 37 (100.0%) |
| 65 to 74 Years | 53 (100.0%) | 0 (0.0%) |
| 75 Years and over | 0 (0.0%) | 0 (0.0%) |
Disability Class by Sex by Age in Garden Prairie
Disability Class: Hearing Difficulty
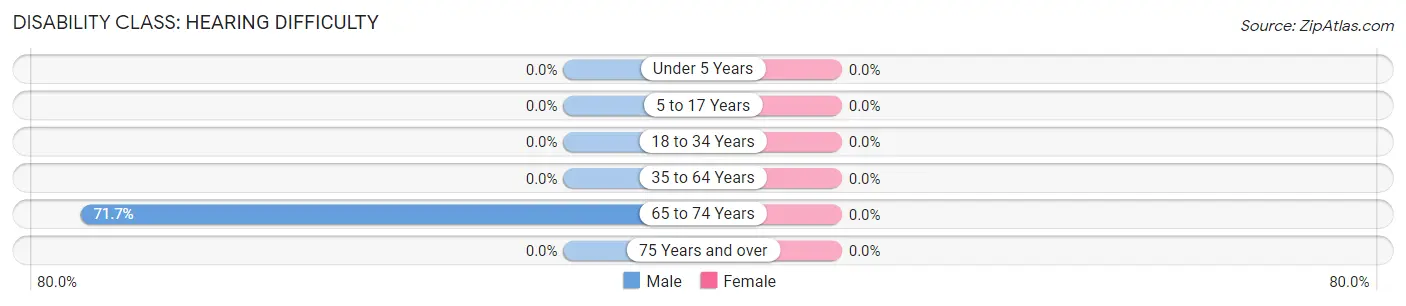
| Age Bracket | Male | Female |
| Under 5 Years | 0 (0.0%) | 0 (0.0%) |
| 5 to 17 Years | 0 (0.0%) | 0 (0.0%) |
| 18 to 34 Years | 0 (0.0%) | 0 (0.0%) |
| 35 to 64 Years | 0 (0.0%) | 0 (0.0%) |
| 65 to 74 Years | 38 (71.7%) | 0 (0.0%) |
| 75 Years and over | 0 (0.0%) | 0 (0.0%) |
Disability Class: Vision Difficulty
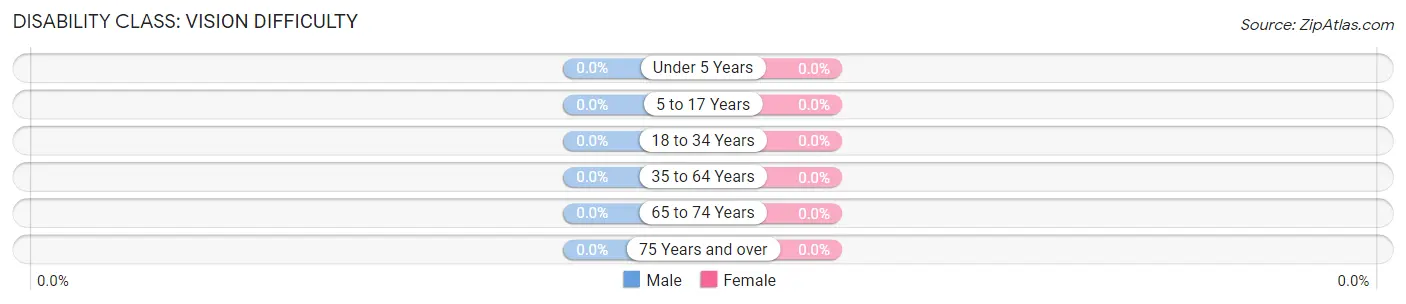
| Age Bracket | Male | Female |
| Under 5 Years | 0 (0.0%) | 0 (0.0%) |
| 5 to 17 Years | 0 (0.0%) | 0 (0.0%) |
| 18 to 34 Years | 0 (0.0%) | 0 (0.0%) |
| 35 to 64 Years | 0 (0.0%) | 0 (0.0%) |
| 65 to 74 Years | 0 (0.0%) | 0 (0.0%) |
| 75 Years and over | 0 (0.0%) | 0 (0.0%) |
Disability Class: Cognitive Difficulty
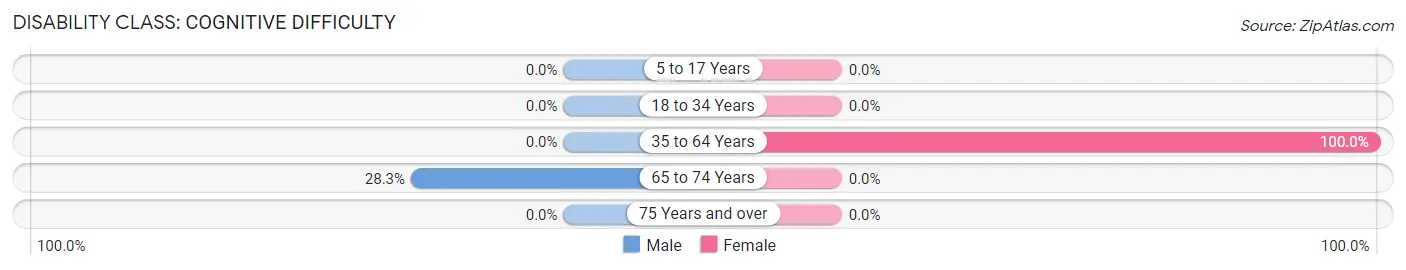
| Age Bracket | Male | Female |
| 5 to 17 Years | 0 (0.0%) | 0 (0.0%) |
| 18 to 34 Years | 0 (0.0%) | 0 (0.0%) |
| 35 to 64 Years | 0 (0.0%) | 37 (100.0%) |
| 65 to 74 Years | 15 (28.3%) | 0 (0.0%) |
| 75 Years and over | 0 (0.0%) | 0 (0.0%) |
Disability Class: Ambulatory Difficulty
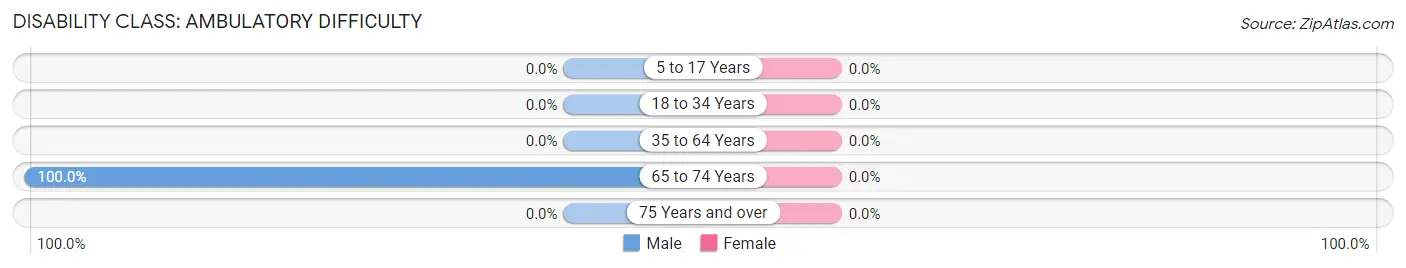
| Age Bracket | Male | Female |
| 5 to 17 Years | 0 (0.0%) | 0 (0.0%) |
| 18 to 34 Years | 0 (0.0%) | 0 (0.0%) |
| 35 to 64 Years | 0 (0.0%) | 0 (0.0%) |
| 65 to 74 Years | 53 (100.0%) | 0 (0.0%) |
| 75 Years and over | 0 (0.0%) | 0 (0.0%) |
Disability Class: Self-Care Difficulty
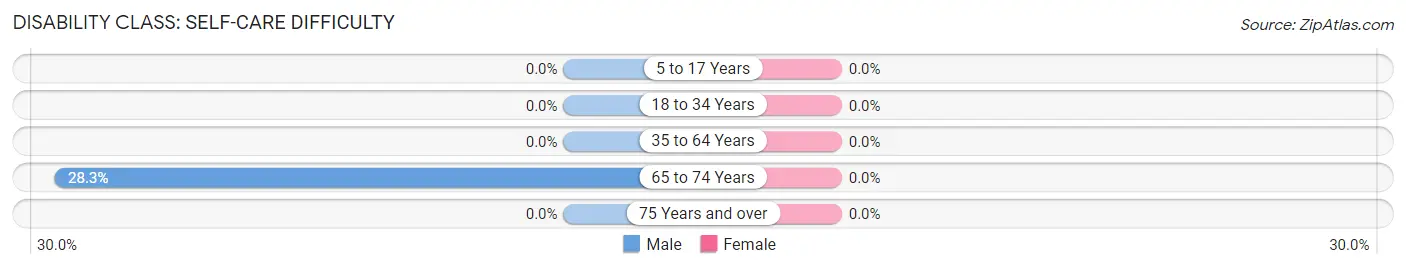
| Age Bracket | Male | Female |
| 5 to 17 Years | 0 (0.0%) | 0 (0.0%) |
| 18 to 34 Years | 0 (0.0%) | 0 (0.0%) |
| 35 to 64 Years | 0 (0.0%) | 0 (0.0%) |
| 65 to 74 Years | 15 (28.3%) | 0 (0.0%) |
| 75 Years and over | 0 (0.0%) | 0 (0.0%) |
Technology Access in Garden Prairie
Computing Device Access in Garden Prairie
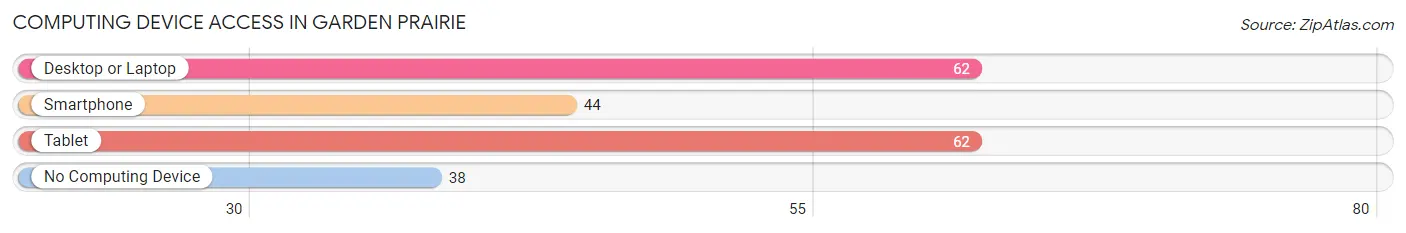
| Device Type | # Households | % Households |
| Desktop or Laptop | 62 | 62.0% |
| Smartphone | 44 | 44.0% |
| Tablet | 62 | 62.0% |
| No Computing Device | 38 | 38.0% |
| Total | 100 | 100.0% |
Internet Access in Garden Prairie
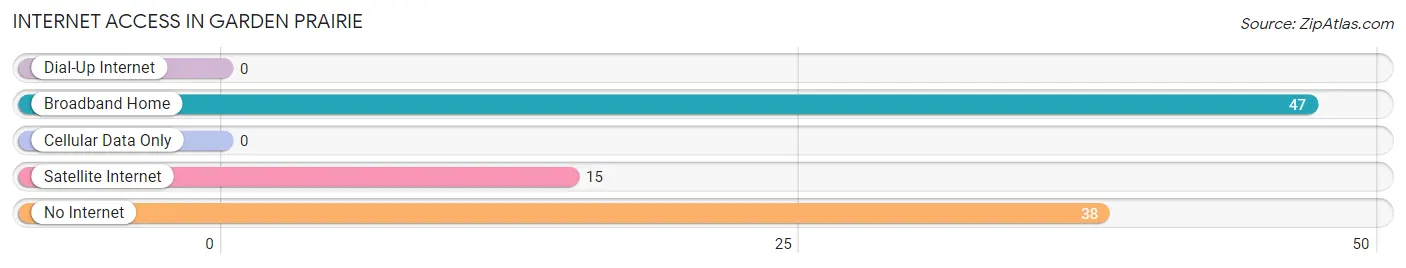
| Internet Type | # Households | % Households |
| Dial-Up Internet | 0 | 0.0% |
| Broadband Home | 47 | 47.0% |
| Cellular Data Only | 0 | 0.0% |
| Satellite Internet | 15 | 15.0% |
| No Internet | 38 | 38.0% |
| Total | 100 | 100.0% |
Garden Prairie Summary
Garden Prairie is a small unincorporated community located in Boone County, Illinois, United States. It is situated in the northern part of the county, approximately 10 miles northwest of the county seat of Belvidere. The population of Garden Prairie was estimated to be around 1,000 in the year 2000.
History
Garden Prairie was first settled in the early 1800s by a group of settlers from New England. The settlers were attracted to the area due to its fertile soil and abundant natural resources. The first settlers built a log cabin and began farming the land. The community was originally known as “Garden Prairie” due to the abundance of wildflowers and prairie grasses that grew in the area.
In 1837, the first post office was established in Garden Prairie. The post office was named after the community and served as a hub for communication and commerce. The post office was also used to send mail to and from the nearby towns of Belvidere and Rockford.
In 1854, the first school was built in Garden Prairie. The school was a one-room schoolhouse and served as the educational center for the community. The school was later replaced by a larger two-room schoolhouse in 1875.
In 1876, the first church was built in Garden Prairie. The church was a Methodist church and served as the spiritual center for the community. The church was later replaced by a larger building in 1891.
Geography
Garden Prairie is located in the northern part of Boone County, Illinois. It is situated approximately 10 miles northwest of the county seat of Belvidere. The community is located on the banks of the Kishwaukee River and is surrounded by rolling hills and farmland.
The climate in Garden Prairie is typical of the Midwest. Summers are hot and humid, while winters are cold and snowy. The average temperature in the summer is around 75 degrees Fahrenheit, while the average temperature in the winter is around 25 degrees Fahrenheit.
Economy
Garden Prairie is a small, rural community with a limited economy. The primary industry in the area is agriculture. The area is home to several farms that produce corn, soybeans, and other crops.
In addition to agriculture, Garden Prairie is home to several small businesses. These businesses include a grocery store, a hardware store, a gas station, and a few restaurants.
Demographics
As of the year 2000, the population of Garden Prairie was estimated to be around 1,000. The racial makeup of the community was 97.2% White, 0.7% African American, 0.3% Native American, 0.3% Asian, and 1.5% from other races.
The median household income in Garden Prairie was $45,000 in the year 2000. The median home value was $90,000. The median age of the population was 37.5 years.
Common Questions
What is Per Capita Income in Garden Prairie?
Per Capita income in Garden Prairie is $16,445.
What is the Median Household income in Garden Prairie?
Median Household Income in Garden Prairie is $37,303.
What is Inequality or Gini Index in Garden Prairie?
Inequality or Gini Index in Garden Prairie is 0.26.
What is the Total Population of Garden Prairie?
Total Population of Garden Prairie is 328.
What is the Total Male Population of Garden Prairie?
Total Male Population of Garden Prairie is 226.
What is the Total Female Population of Garden Prairie?
Total Female Population of Garden Prairie is 102.
What is the Ratio of Males per 100 Females in Garden Prairie?
There are 221.57 Males per 100 Females in Garden Prairie.
What is the Ratio of Females per 100 Males in Garden Prairie?
There are 45.13 Females per 100 Males in Garden Prairie.
What is the Median Population Age in Garden Prairie?
Median Population Age in Garden Prairie is 19.5 Years.
What is the Average Family Size in Garden Prairie
Average Family Size in Garden Prairie is 5.3 People.
What is the Average Household Size in Garden Prairie
Average Household Size in Garden Prairie is 3.3 People.
How Large is the Labor Force in Garden Prairie?
There are 73 People in the Labor Forcein in Garden Prairie.
What is the Percentage of People in the Labor Force in Garden Prairie?
41.2% of People are in the Labor Force in Garden Prairie.