Downs, IL Map & Demographics
Downs Map
Downs Overview
$44,117
PER CAPITA INCOME
$147,833
AVG FAMILY INCOME
$104,890
AVG HOUSEHOLD INCOME
41.2%
WAGE / INCOME GAP [ % ]
58.8¢/ $1
WAGE / INCOME GAP [ $ ]
0.37
INEQUALITY / GINI INDEX
1,530
TOTAL POPULATION
765
MALE POPULATION
765
FEMALE POPULATION
100.00
MALES / 100 FEMALES
100.00
FEMALES / 100 MALES
33.5
MEDIAN AGE
3.5
AVG FAMILY SIZE
2.9
AVG HOUSEHOLD SIZE
758
LABOR FORCE [ PEOPLE ]
75.3%
PERCENT IN LABOR FORCE
0.5%
UNEMPLOYMENT RATE
Downs Zip Codes
Downs Area Codes
Income in Downs
Income Overview in Downs
Per Capita Income in Downs is $44,117, while median incomes of families and households are $147,833 and $104,890 respectively.
| Characteristic | Number | Measure |
| Per Capita Income | 1,530 | $44,117 |
| Median Family Income | 392 | $147,833 |
| Mean Family Income | 392 | $142,981 |
| Median Household Income | 537 | $104,890 |
| Mean Household Income | 537 | $126,829 |
| Income Deficit | 392 | $0 |
| Wage / Income Gap (%) | 1,530 | 41.21% |
| Wage / Income Gap ($) | 1,530 | 58.79¢ per $1 |
| Gini / Inequality Index | 1,530 | 0.37 |
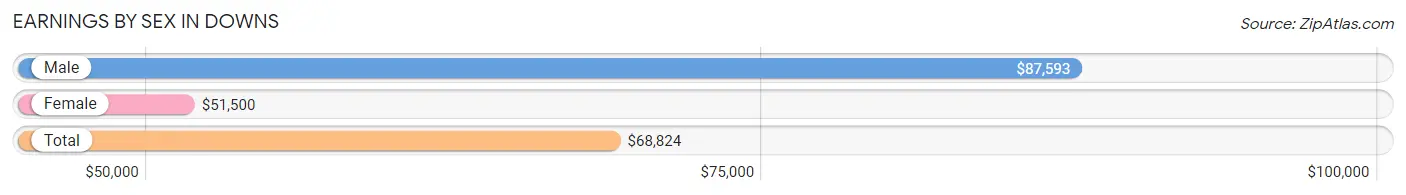
Earnings by Sex in Downs
Average Earnings in Downs are $68,824, $87,593 for men and $51,500 for women, a difference of 41.2%.
| Sex | Number | Average Earnings |
| Male | 364 (46.9%) | $87,593 |
| Female | 412 (53.1%) | $51,500 |
| Total | 776 (100.0%) | $68,824 |
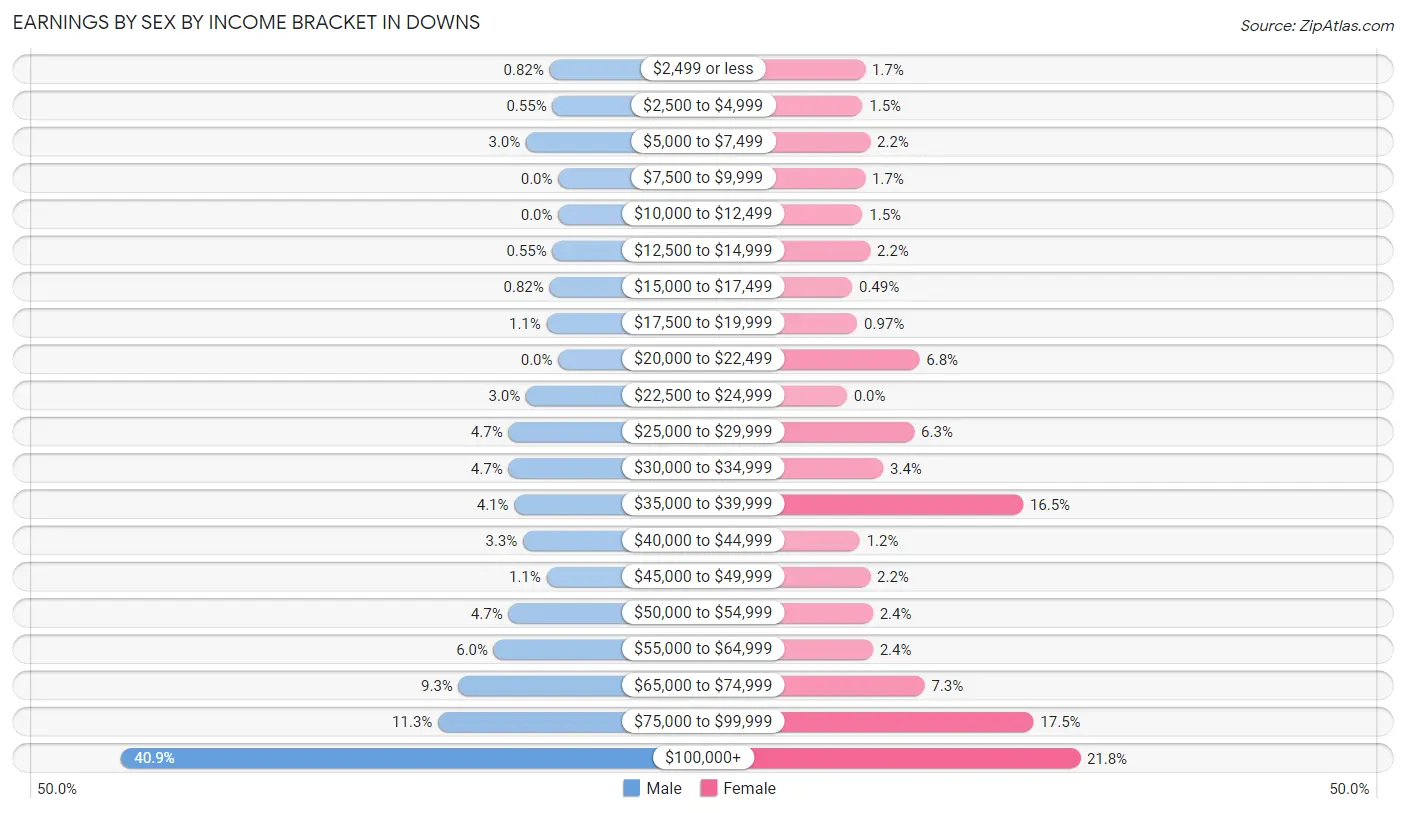
Earnings by Sex by Income Bracket in Downs
The most common earnings brackets in Downs are $100,000+ for men (149 | 40.9%) and $100,000+ for women (90 | 21.8%).
| Income | Male | Female |
| $2,499 or less | 3 (0.8%) | 7 (1.7%) |
| $2,500 to $4,999 | 2 (0.5%) | 6 (1.5%) |
| $5,000 to $7,499 | 11 (3.0%) | 9 (2.2%) |
| $7,500 to $9,999 | 0 (0.0%) | 7 (1.7%) |
| $10,000 to $12,499 | 0 (0.0%) | 6 (1.5%) |
| $12,500 to $14,999 | 2 (0.5%) | 9 (2.2%) |
| $15,000 to $17,499 | 3 (0.8%) | 2 (0.5%) |
| $17,500 to $19,999 | 4 (1.1%) | 4 (1.0%) |
| $20,000 to $22,499 | 0 (0.0%) | 28 (6.8%) |
| $22,500 to $24,999 | 11 (3.0%) | 0 (0.0%) |
| $25,000 to $29,999 | 17 (4.7%) | 26 (6.3%) |
| $30,000 to $34,999 | 17 (4.7%) | 14 (3.4%) |
| $35,000 to $39,999 | 15 (4.1%) | 68 (16.5%) |
| $40,000 to $44,999 | 12 (3.3%) | 5 (1.2%) |
| $45,000 to $49,999 | 4 (1.1%) | 9 (2.2%) |
| $50,000 to $54,999 | 17 (4.7%) | 10 (2.4%) |
| $55,000 to $64,999 | 22 (6.0%) | 10 (2.4%) |
| $65,000 to $74,999 | 34 (9.3%) | 30 (7.3%) |
| $75,000 to $99,999 | 41 (11.3%) | 72 (17.5%) |
| $100,000+ | 149 (40.9%) | 90 (21.8%) |
| Total | 364 (100.0%) | 412 (100.0%) |
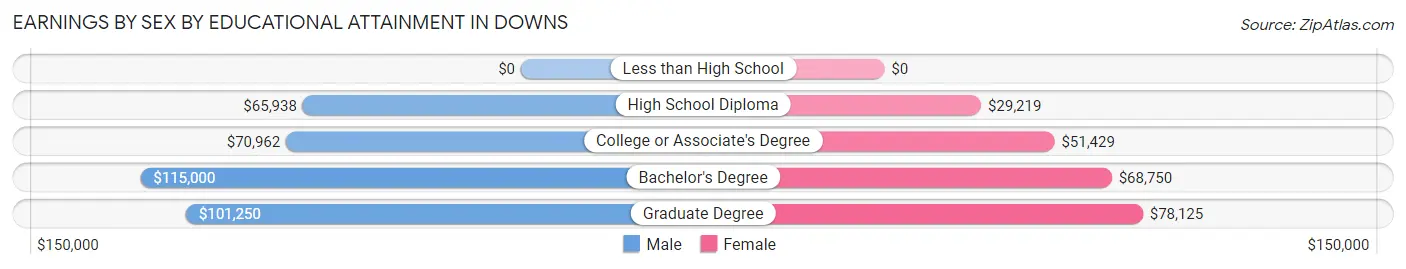
Earnings by Sex by Educational Attainment in Downs
Average earnings in Downs are $88,611 for men and $66,563 for women, a difference of 24.9%. Men with an educational attainment of bachelor's degree enjoy the highest average annual earnings of $115,000, while those with high school diploma education earn the least with $65,938. Women with an educational attainment of graduate degree earn the most with the average annual earnings of $78,125, while those with high school diploma education have the smallest earnings of $29,219.
| Educational Attainment | Male Income | Female Income |
| Less than High School | - | - |
| High School Diploma | $65,938 | $29,219 |
| College or Associate's Degree | $70,962 | $51,429 |
| Bachelor's Degree | $115,000 | $68,750 |
| Graduate Degree | $101,250 | $78,125 |
| Total | $88,611 | $66,563 |
Family Income in Downs
Family Income Brackets in Downs
According to the Downs family income data, there are 97 families falling into the $150,000 to $199,999 income range, which is the most common income bracket and makes up 24.7% of all families.
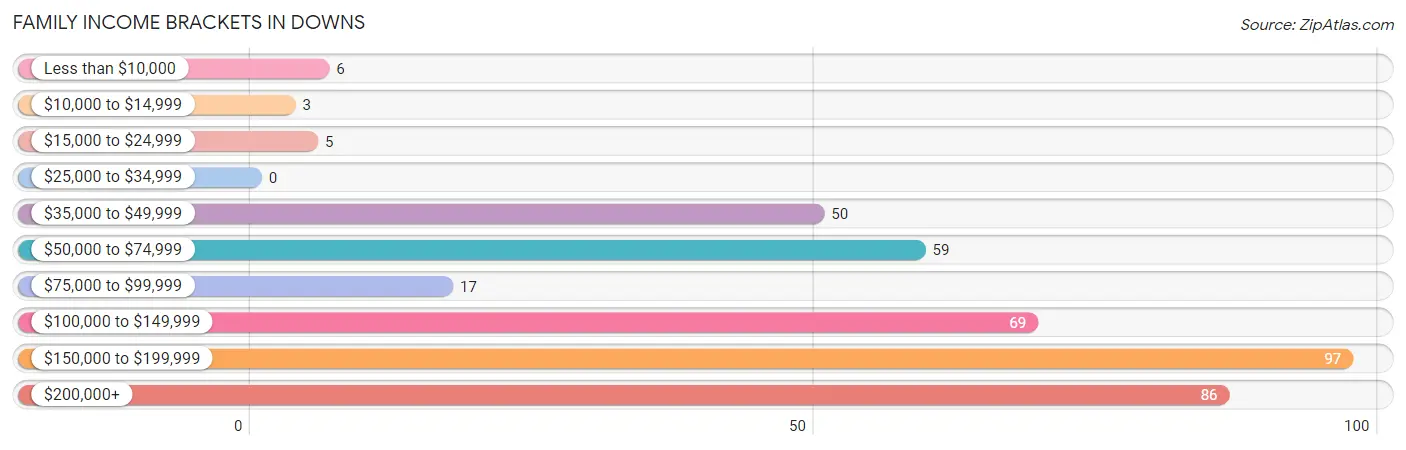
| Income Bracket | # Families | % Families |
| Less than $10,000 | 6 | 1.5% |
| $10,000 to $14,999 | 3 | 0.8% |
| $15,000 to $24,999 | 5 | 1.3% |
| $25,000 to $34,999 | 0 | 0.0% |
| $35,000 to $49,999 | 50 | 12.8% |
| $50,000 to $74,999 | 59 | 15.1% |
| $75,000 to $99,999 | 17 | 4.3% |
| $100,000 to $149,999 | 69 | 17.6% |
| $150,000 to $199,999 | 97 | 24.7% |
| $200,000+ | 86 | 21.9% |
Family Income by Famaliy Size in Downs
4-person families (62 | 15.8%) account for the highest median family income in Downs with $190,500 per family, while 3-person families (108 | 27.6%) have the highest median income of $50,417 per family member.
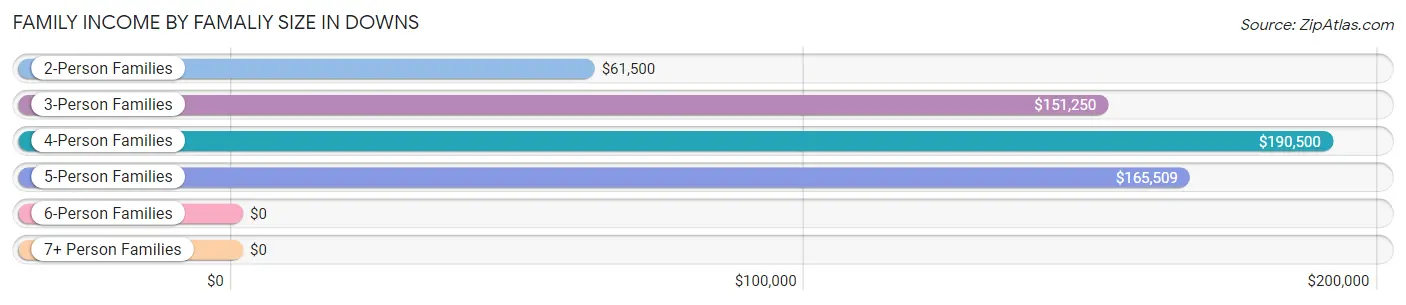
| Income Bracket | # Families | Median Income |
| 2-Person Families | 142 (36.2%) | $61,500 |
| 3-Person Families | 108 (27.6%) | $151,250 |
| 4-Person Families | 62 (15.8%) | $190,500 |
| 5-Person Families | 71 (18.1%) | $165,509 |
| 6-Person Families | 6 (1.5%) | $0 |
| 7+ Person Families | 3 (0.8%) | $0 |
| Total | 392 (100.0%) | $147,833 |
Family Income by Number of Earners in Downs
The median family income in Downs is $147,833, with families comprising 3+ earners (27) having the highest median family income of $172,250, while families with no earners (26) have the lowest median family income of $47,500, accounting for 6.9% and 6.6% of families, respectively.
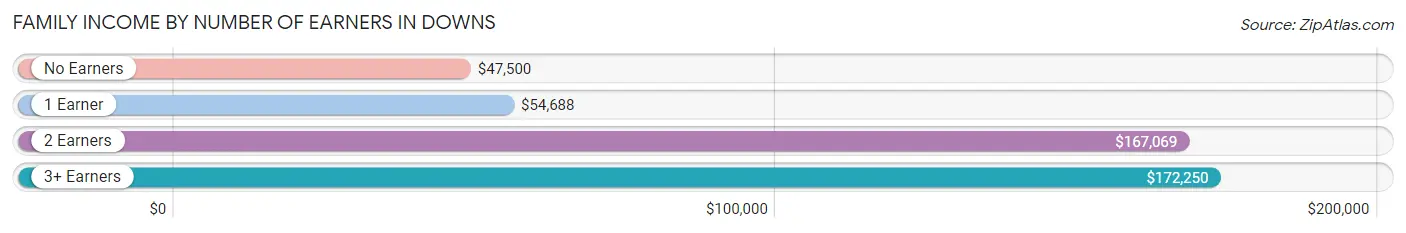
| Number of Earners | # Families | Median Income |
| No Earners | 26 (6.6%) | $47,500 |
| 1 Earner | 113 (28.8%) | $54,688 |
| 2 Earners | 226 (57.7%) | $167,069 |
| 3+ Earners | 27 (6.9%) | $172,250 |
| Total | 392 (100.0%) | $147,833 |
Household Income in Downs
Household Income Brackets in Downs
With 133 households falling in the category, the $100,000 to $149,999 income range is the most frequent in Downs, accounting for 24.8% of all households. In contrast, only 3 households (0.6%) fall into the $10,000 to $14,999 income bracket, making it the least populous group.
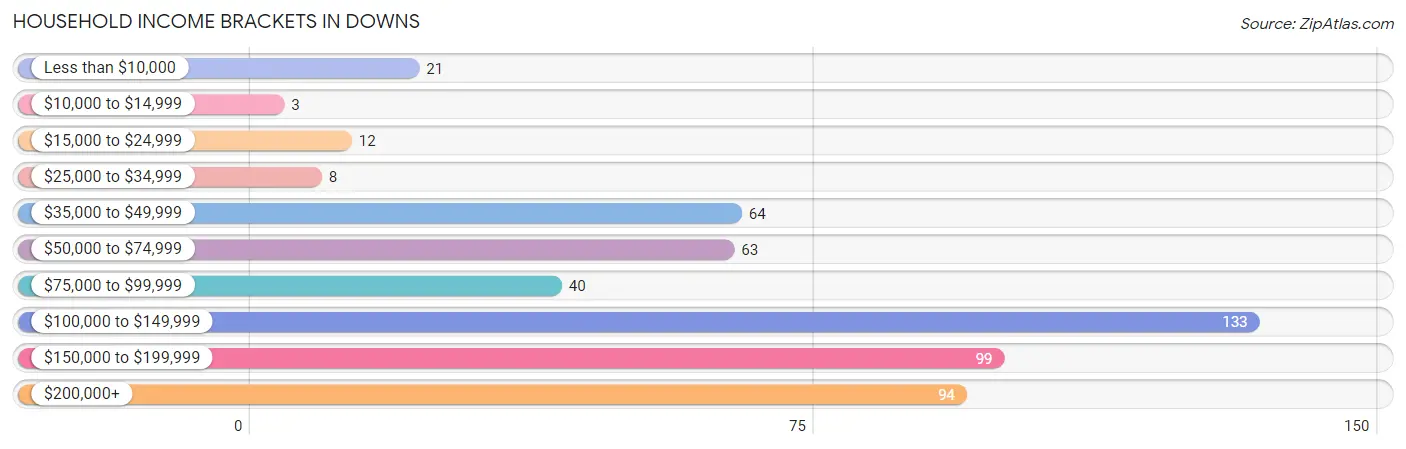
| Income Bracket | # Households | % Households |
| Less than $10,000 | 21 | 3.9% |
| $10,000 to $14,999 | 3 | 0.6% |
| $15,000 to $24,999 | 12 | 2.2% |
| $25,000 to $34,999 | 8 | 1.5% |
| $35,000 to $49,999 | 64 | 11.9% |
| $50,000 to $74,999 | 63 | 11.7% |
| $75,000 to $99,999 | 40 | 7.4% |
| $100,000 to $149,999 | 133 | 24.8% |
| $150,000 to $199,999 | 99 | 18.4% |
| $200,000+ | 94 | 17.5% |
Household Income by Householder Age in Downs
The median household income in Downs is $104,890, with the highest median household income of $126,406 found in the 45 to 64 years age bracket for the primary householder. A total of 137 households (25.5%) fall into this category.
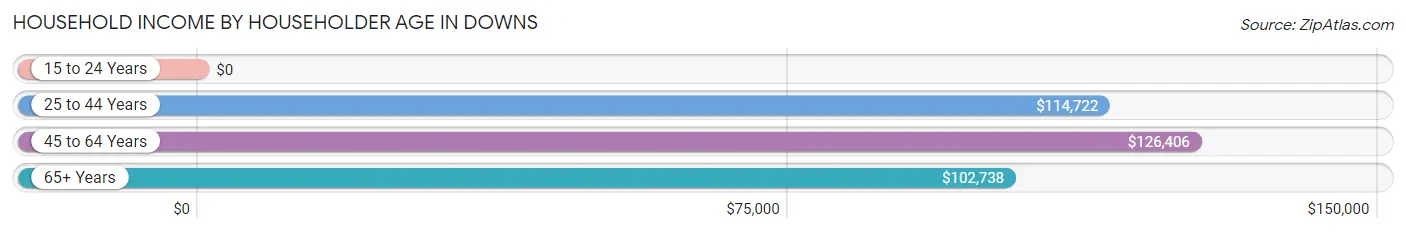
| Income Bracket | # Households | Median Income |
| 15 to 24 Years | 0 (0.0%) | $0 |
| 25 to 44 Years | 290 (54.0%) | $114,722 |
| 45 to 64 Years | 137 (25.5%) | $126,406 |
| 65+ Years | 110 (20.5%) | $102,738 |
| Total | 537 (100.0%) | $104,890 |
Poverty in Downs
Income Below Poverty by Sex and Age in Downs
With 3.7% poverty level for males and 5.8% for females among the residents of Downs, 12 to 14 year old males and 75 year old and over females are the most vulnerable to poverty, with 6 males (27.3%) and 7 females (17.5%) in their respective age groups living below the poverty level.
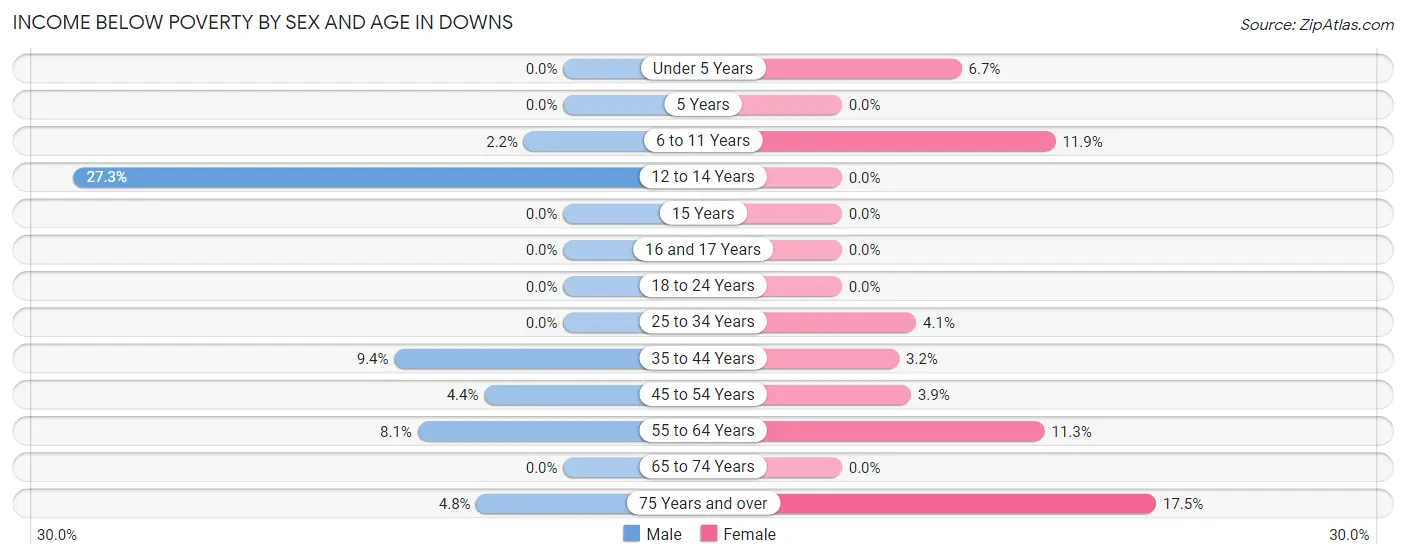
| Age Bracket | Male | Female |
| Under 5 Years | 0 (0.0%) | 7 (6.7%) |
| 5 Years | 0 (0.0%) | 0 (0.0%) |
| 6 to 11 Years | 4 (2.2%) | 10 (11.9%) |
| 12 to 14 Years | 6 (27.3%) | 0 (0.0%) |
| 15 Years | 0 (0.0%) | 0 (0.0%) |
| 16 and 17 Years | 0 (0.0%) | 0 (0.0%) |
| 18 to 24 Years | 0 (0.0%) | 0 (0.0%) |
| 25 to 34 Years | 0 (0.0%) | 7 (4.1%) |
| 35 to 44 Years | 8 (9.4%) | 3 (3.2%) |
| 45 to 54 Years | 4 (4.4%) | 3 (3.8%) |
| 55 to 64 Years | 3 (8.1%) | 7 (11.3%) |
| 65 to 74 Years | 0 (0.0%) | 0 (0.0%) |
| 75 Years and over | 3 (4.8%) | 7 (17.5%) |
| Total | 28 (3.7%) | 44 (5.8%) |
Income Above Poverty by Sex and Age in Downs
According to the poverty statistics in Downs, males aged under 5 years and females aged 5 years are the age groups that are most secure financially, with 100.0% of males and 100.0% of females in these age groups living above the poverty line.
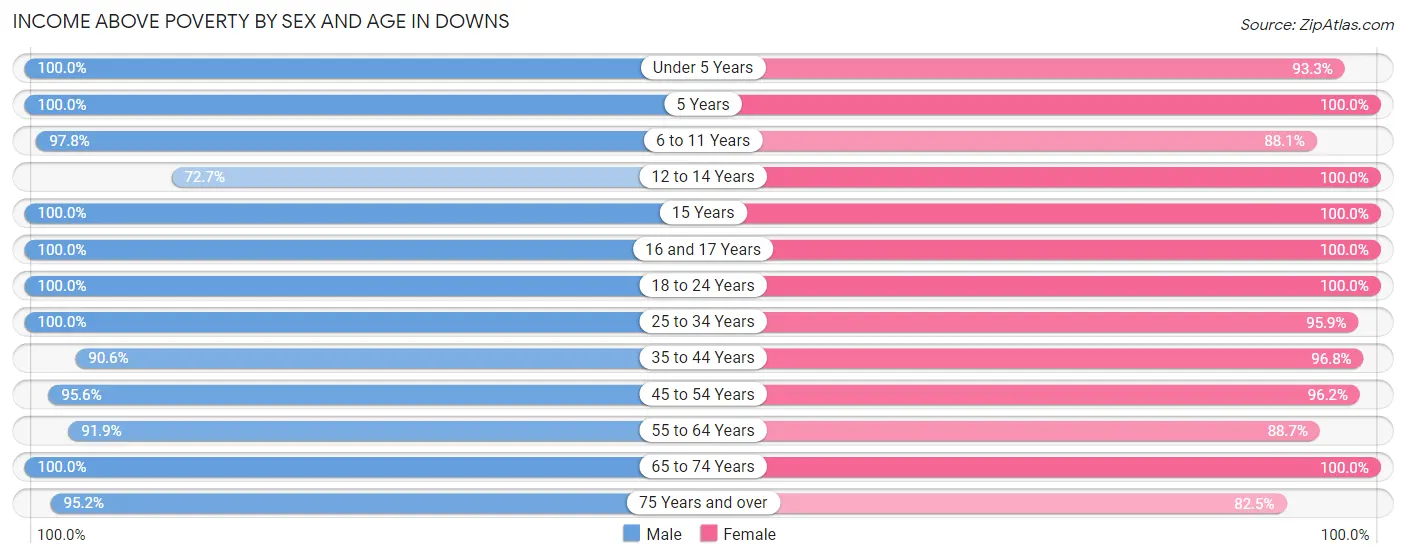
| Age Bracket | Male | Female |
| Under 5 Years | 29 (100.0%) | 98 (93.3%) |
| 5 Years | 36 (100.0%) | 7 (100.0%) |
| 6 to 11 Years | 178 (97.8%) | 74 (88.1%) |
| 12 to 14 Years | 16 (72.7%) | 38 (100.0%) |
| 15 Years | 6 (100.0%) | 14 (100.0%) |
| 16 and 17 Years | 8 (100.0%) | 19 (100.0%) |
| 18 to 24 Years | 35 (100.0%) | 26 (100.0%) |
| 25 to 34 Years | 131 (100.0%) | 162 (95.9%) |
| 35 to 44 Years | 77 (90.6%) | 91 (96.8%) |
| 45 to 54 Years | 87 (95.6%) | 75 (96.2%) |
| 55 to 64 Years | 34 (91.9%) | 55 (88.7%) |
| 65 to 74 Years | 41 (100.0%) | 29 (100.0%) |
| 75 Years and over | 59 (95.2%) | 33 (82.5%) |
| Total | 737 (96.3%) | 721 (94.3%) |
Income Below Poverty Among Married-Couple Families in Downs
The poverty statistics for married-couple families in Downs show that 3.0% or 9 of the total 302 families live below the poverty line. Families with no children have the highest poverty rate of 6.7%, comprising of 7 families. On the other hand, families with 3 or 4 children have the lowest poverty rate of 0.0%, which includes 0 families.
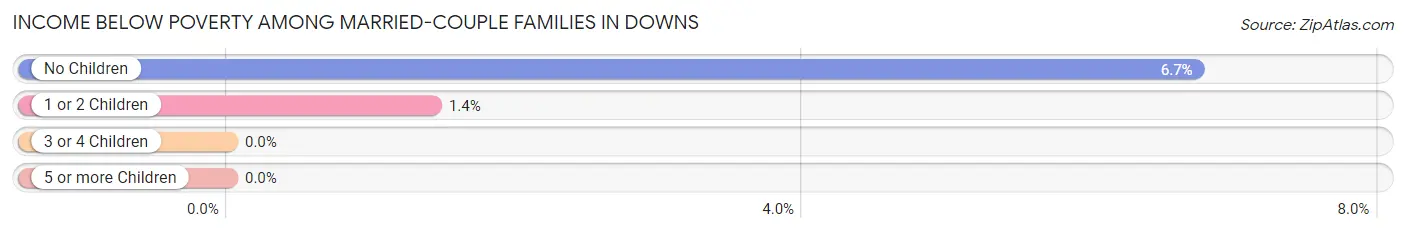
| Children | Above Poverty | Below Poverty |
| No Children | 97 (93.3%) | 7 (6.7%) |
| 1 or 2 Children | 139 (98.6%) | 2 (1.4%) |
| 3 or 4 Children | 57 (100.0%) | 0 (0.0%) |
| 5 or more Children | 0 (0.0%) | 0 (0.0%) |
| Total | 293 (97.0%) | 9 (3.0%) |
Income Below Poverty Among Single-Parent Households in Downs
According to the poverty data in Downs, 10.5% or 2 single-father households and 4.2% or 3 single-mother households are living below the poverty line. Among single-father households, those with 1 or 2 children have the highest poverty rate, with 2 households (15.4%) experiencing poverty. Likewise, among single-mother households, those with 5 or more children have the highest poverty rate, with 3 households (100.0%) falling below the poverty line.
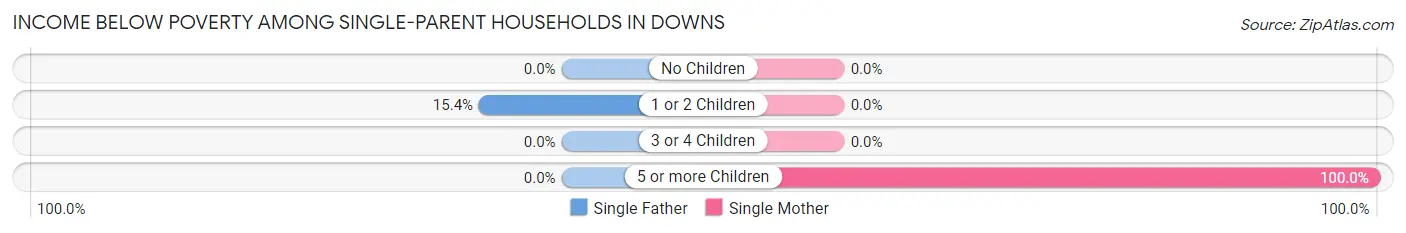
| Children | Single Father | Single Mother |
| No Children | 0 (0.0%) | 0 (0.0%) |
| 1 or 2 Children | 2 (15.4%) | 0 (0.0%) |
| 3 or 4 Children | 0 (0.0%) | 0 (0.0%) |
| 5 or more Children | 0 (0.0%) | 3 (100.0%) |
| Total | 2 (10.5%) | 3 (4.2%) |
Income Below Poverty Among Married-Couple vs Single-Parent Households in Downs
The poverty data for Downs shows that 9 of the married-couple family households (3.0%) and 5 of the single-parent households (5.6%) are living below the poverty level. Within the married-couple family households, those with no children have the highest poverty rate, with 7 households (6.7%) falling below the poverty line. Among the single-parent households, those with 5 or more children have the highest poverty rate, with 3 household (100.0%) living below poverty.
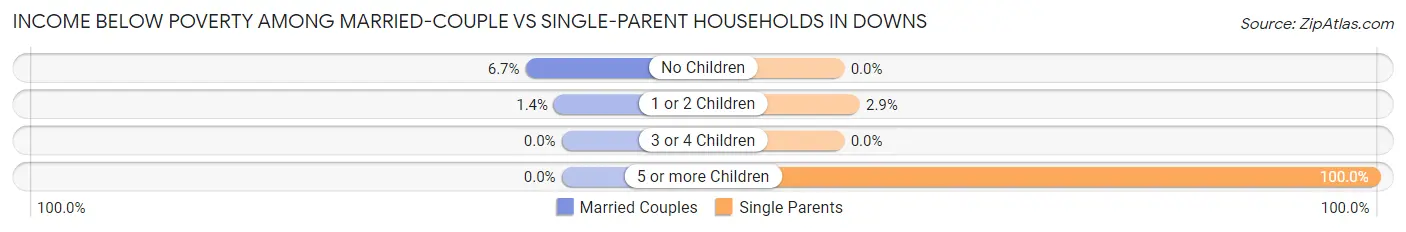
| Children | Married-Couple Families | Single-Parent Households |
| No Children | 7 (6.7%) | 0 (0.0%) |
| 1 or 2 Children | 2 (1.4%) | 2 (2.9%) |
| 3 or 4 Children | 0 (0.0%) | 0 (0.0%) |
| 5 or more Children | 0 (0.0%) | 3 (100.0%) |
| Total | 9 (3.0%) | 5 (5.6%) |
Race in Downs
The most populous races in Downs are White / Caucasian (1,422 | 92.9%), Two or more Races (98 | 6.4%), and Hispanic or Latino (66 | 4.3%).
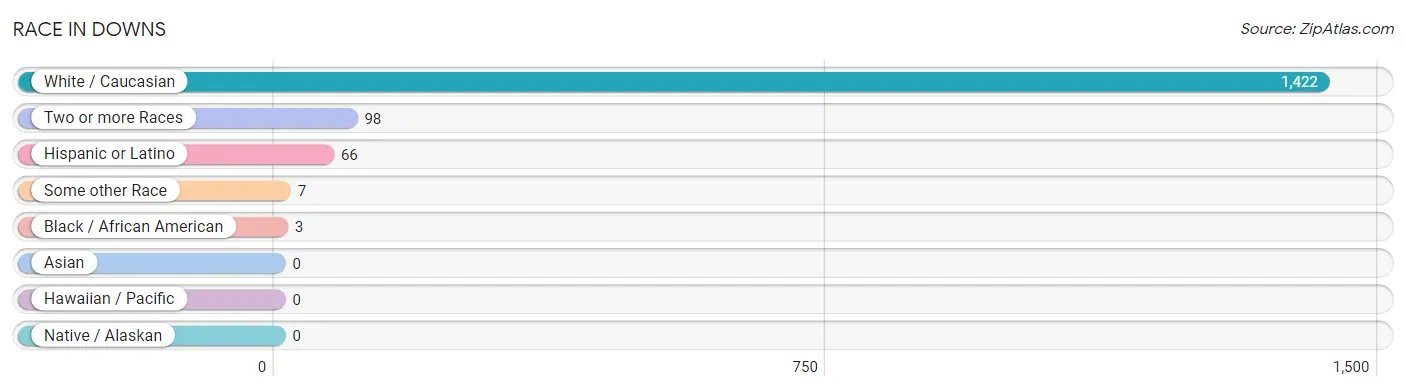
| Race | # Population | % Population |
| Asian | 0 | 0.0% |
| Black / African American | 3 | 0.2% |
| Hawaiian / Pacific | 0 | 0.0% |
| Hispanic or Latino | 66 | 4.3% |
| Native / Alaskan | 0 | 0.0% |
| White / Caucasian | 1,422 | 92.9% |
| Two or more Races | 98 | 6.4% |
| Some other Race | 7 | 0.5% |
| Total | 1,530 | 100.0% |
Ancestry in Downs
The most populous ancestries reported in Downs are German (395 | 25.8%), Irish (302 | 19.7%), English (125 | 8.2%), Italian (125 | 8.2%), and Polish (69 | 4.5%), together accounting for 66.4% of all Downs residents.
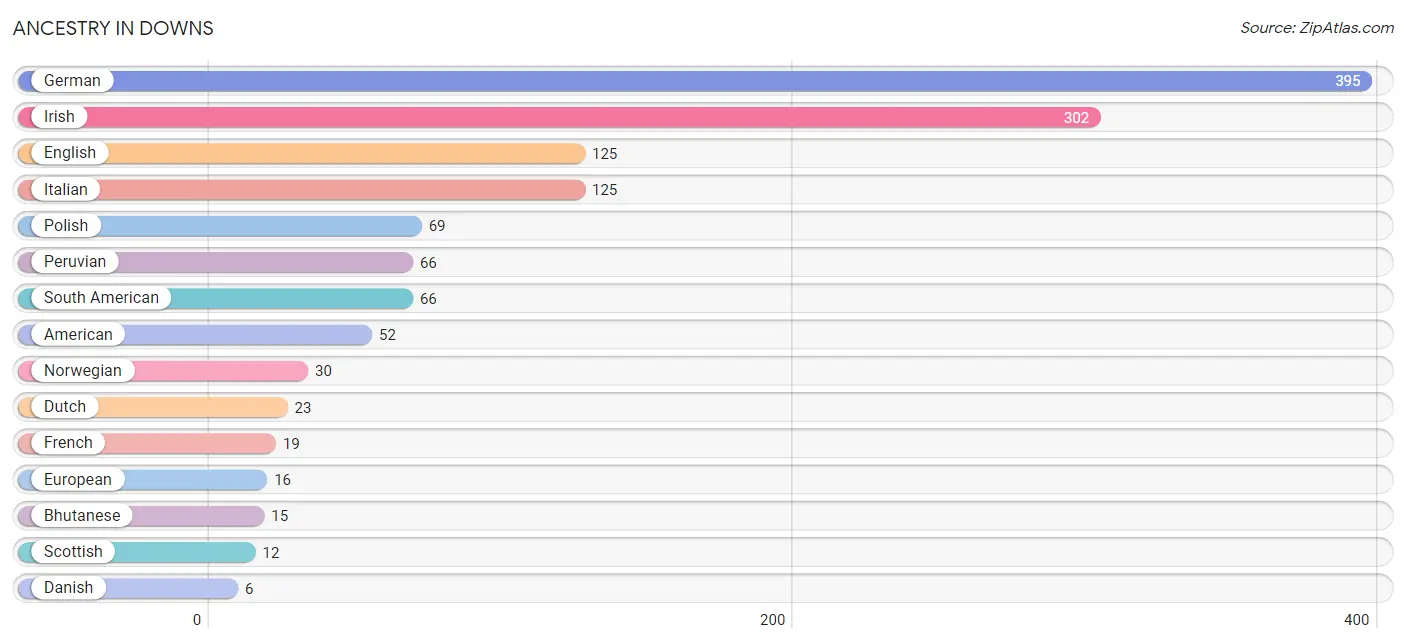
| Ancestry | # Population | % Population |
| American | 52 | 3.4% |
| Bhutanese | 15 | 1.0% |
| Croatian | 5 | 0.3% |
| Czech | 3 | 0.2% |
| Czechoslovakian | 2 | 0.1% |
| Danish | 6 | 0.4% |
| Dutch | 23 | 1.5% |
| English | 125 | 8.2% |
| European | 16 | 1.1% |
| French | 19 | 1.2% |
| German | 395 | 25.8% |
| Hungarian | 5 | 0.3% |
| Irish | 302 | 19.7% |
| Italian | 125 | 8.2% |
| Korean | 6 | 0.4% |
| Lithuanian | 2 | 0.1% |
| Norwegian | 30 | 2.0% |
| Peruvian | 66 | 4.3% |
| Polish | 69 | 4.5% |
| Portuguese | 5 | 0.3% |
| Scandinavian | 3 | 0.2% |
| Scotch-Irish | 4 | 0.3% |
| Scottish | 12 | 0.8% |
| Slovak | 4 | 0.3% |
| South American | 66 | 4.3% |
| Swedish | 6 | 0.4% |
| Swiss | 2 | 0.1% |
| Welsh | 2 | 0.1% | View All 28 Rows |
Immigrants in Downs
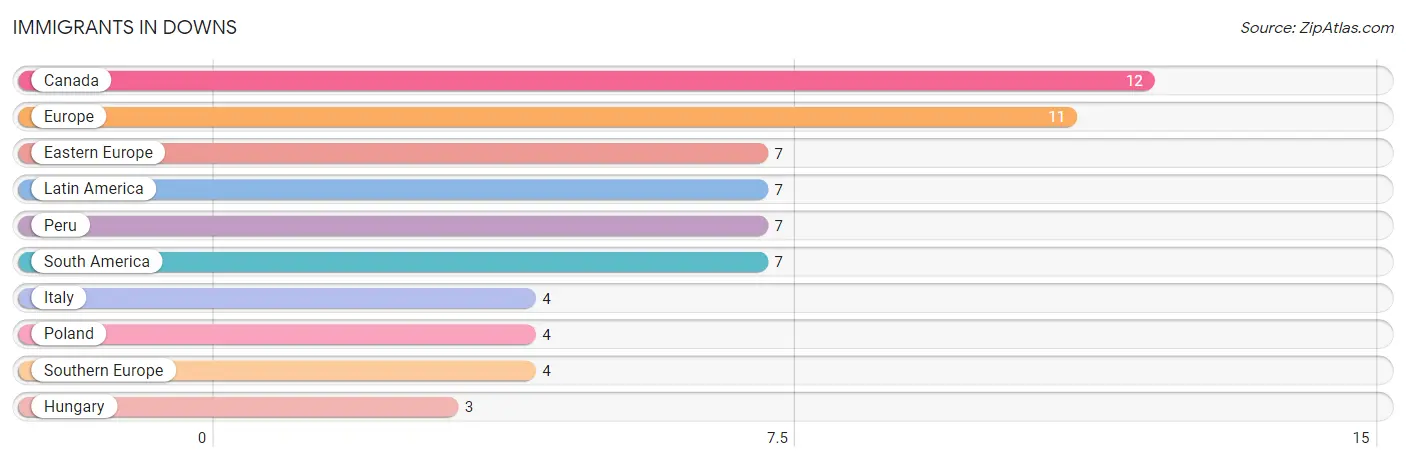
The most numerous immigrant groups reported in Downs came from Canada (12 | 0.8%), Europe (11 | 0.7%), Eastern Europe (7 | 0.5%), Latin America (7 | 0.5%), and Peru (7 | 0.5%), together accounting for 2.9% of all Downs residents.
| Immigration Origin | # Population | % Population |
| Canada | 12 | 0.8% |
| Eastern Europe | 7 | 0.5% |
| Europe | 11 | 0.7% |
| Hungary | 3 | 0.2% |
| Italy | 4 | 0.3% |
| Latin America | 7 | 0.5% |
| Peru | 7 | 0.5% |
| Poland | 4 | 0.3% |
| South America | 7 | 0.5% |
| Southern Europe | 4 | 0.3% | View All 10 Rows |
Sex and Age in Downs
Sex and Age in Downs
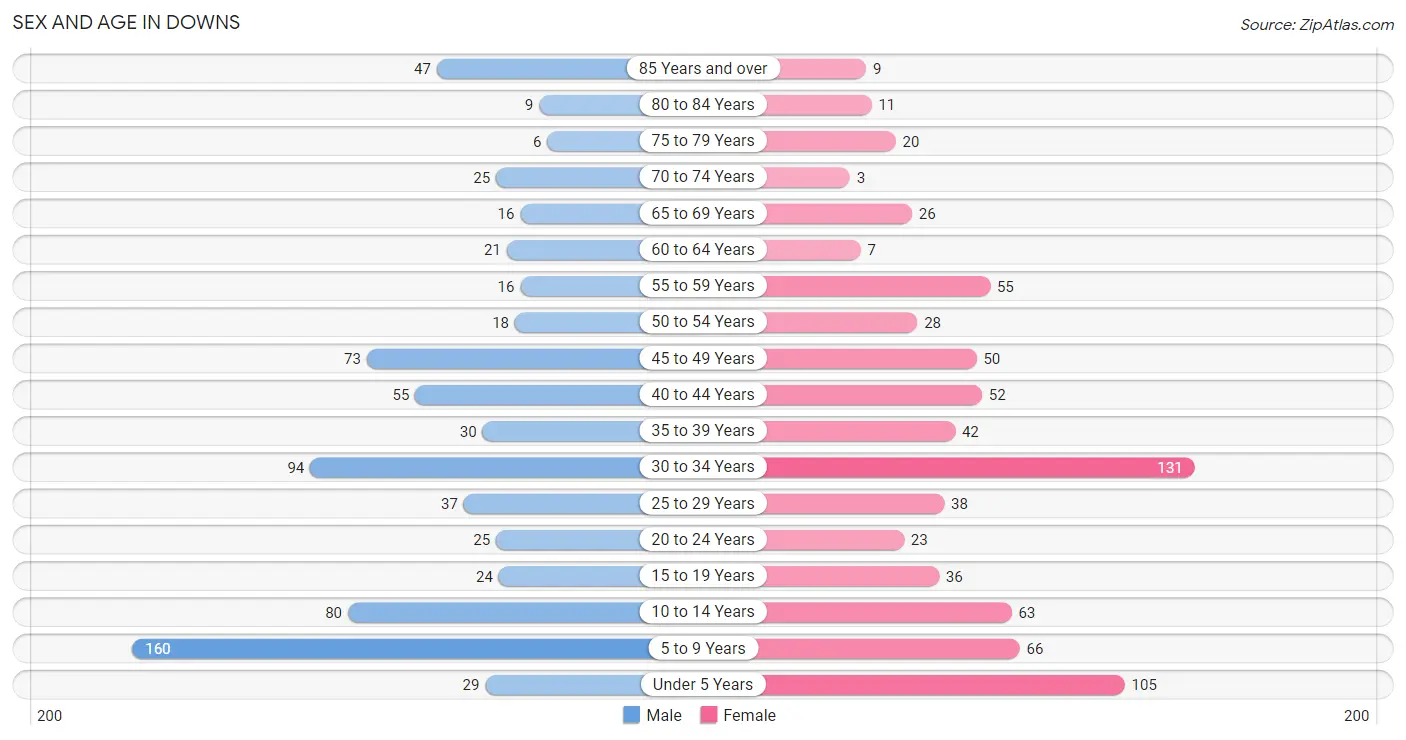
The most populous age groups in Downs are 5 to 9 Years (160 | 20.9%) for men and 30 to 34 Years (131 | 17.1%) for women.
| Age Bracket | Male | Female |
| Under 5 Years | 29 (3.8%) | 105 (13.7%) |
| 5 to 9 Years | 160 (20.9%) | 66 (8.6%) |
| 10 to 14 Years | 80 (10.5%) | 63 (8.2%) |
| 15 to 19 Years | 24 (3.1%) | 36 (4.7%) |
| 20 to 24 Years | 25 (3.3%) | 23 (3.0%) |
| 25 to 29 Years | 37 (4.8%) | 38 (5.0%) |
| 30 to 34 Years | 94 (12.3%) | 131 (17.1%) |
| 35 to 39 Years | 30 (3.9%) | 42 (5.5%) |
| 40 to 44 Years | 55 (7.2%) | 52 (6.8%) |
| 45 to 49 Years | 73 (9.5%) | 50 (6.5%) |
| 50 to 54 Years | 18 (2.4%) | 28 (3.7%) |
| 55 to 59 Years | 16 (2.1%) | 55 (7.2%) |
| 60 to 64 Years | 21 (2.8%) | 7 (0.9%) |
| 65 to 69 Years | 16 (2.1%) | 26 (3.4%) |
| 70 to 74 Years | 25 (3.3%) | 3 (0.4%) |
| 75 to 79 Years | 6 (0.8%) | 20 (2.6%) |
| 80 to 84 Years | 9 (1.2%) | 11 (1.4%) |
| 85 Years and over | 47 (6.1%) | 9 (1.2%) |
| Total | 765 (100.0%) | 765 (100.0%) |
Families and Households in Downs
Median Family Size in Downs
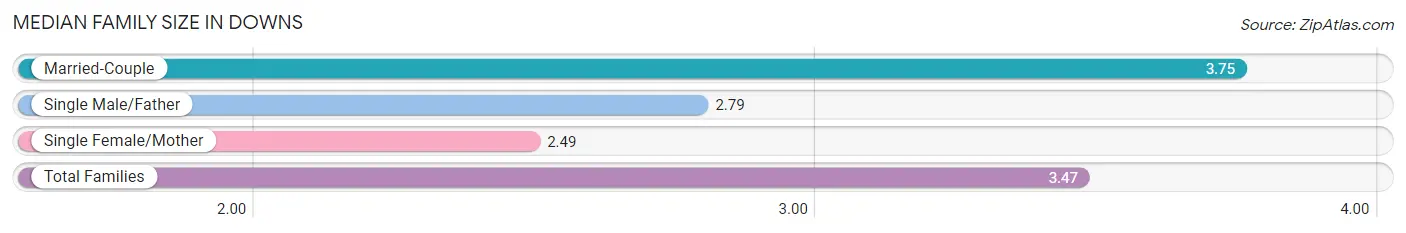
The median family size in Downs is 3.47 persons per family, with married-couple families (302 | 77.0%) accounting for the largest median family size of 3.75 persons per family. On the other hand, single female/mother families (71 | 18.1%) represent the smallest median family size with 2.49 persons per family.
| Family Type | # Families | Family Size |
| Married-Couple | 302 (77.0%) | 3.75 |
| Single Male/Father | 19 (4.9%) | 2.79 |
| Single Female/Mother | 71 (18.1%) | 2.49 |
| Total Families | 392 (100.0%) | 3.47 |
Median Household Size in Downs
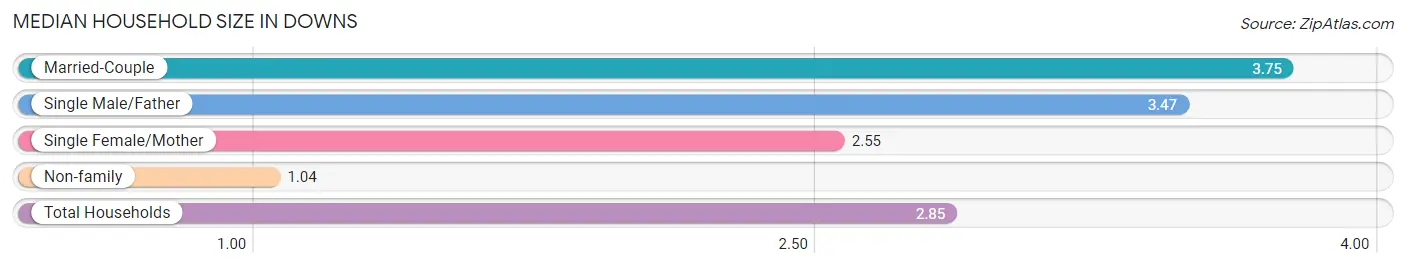
The median household size in Downs is 2.85 persons per household, with married-couple households (302 | 56.2%) accounting for the largest median household size of 3.75 persons per household. non-family households (145 | 27.0%) represent the smallest median household size with 1.04 persons per household.
| Household Type | # Households | Household Size |
| Married-Couple | 302 (56.2%) | 3.75 |
| Single Male/Father | 19 (3.5%) | 3.47 |
| Single Female/Mother | 71 (13.2%) | 2.55 |
| Non-family | 145 (27.0%) | 1.04 |
| Total Households | 537 (100.0%) | 2.85 |
Household Size by Marriage Status in Downs
Out of a total of 537 households in Downs, 392 (73.0%) are family households, while 145 (27.0%) are nonfamily households. The most numerous type of family households are 2-person households, comprising 140, and the most common type of nonfamily households are 1-person households, comprising 138.
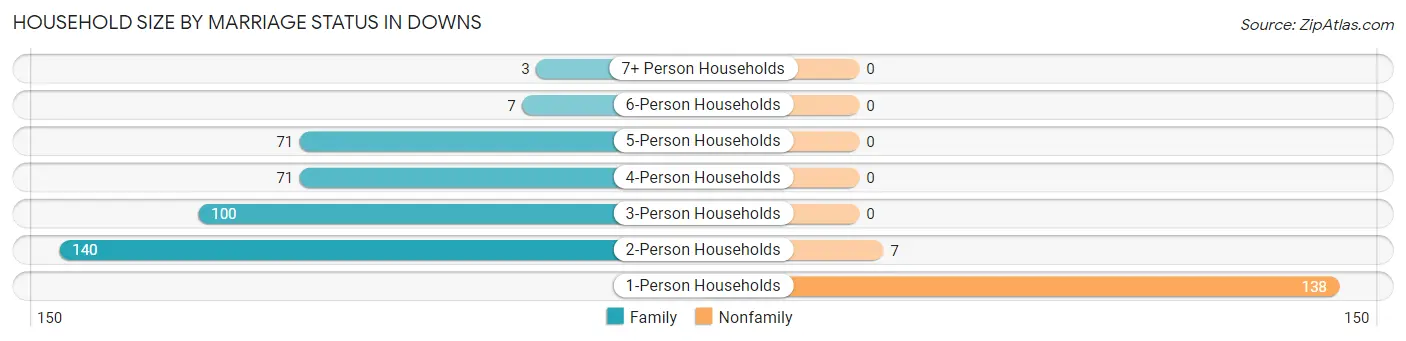
| Household Size | Family Households | Nonfamily Households |
| 1-Person Households | - | 138 (25.7%) |
| 2-Person Households | 140 (26.1%) | 7 (1.3%) |
| 3-Person Households | 100 (18.6%) | 0 (0.0%) |
| 4-Person Households | 71 (13.2%) | 0 (0.0%) |
| 5-Person Households | 71 (13.2%) | 0 (0.0%) |
| 6-Person Households | 7 (1.3%) | 0 (0.0%) |
| 7+ Person Households | 3 (0.6%) | 0 (0.0%) |
| Total | 392 (73.0%) | 145 (27.0%) |
Female Fertility in Downs
Fertility by Age in Downs
Average fertility rate in Downs is 13.0 births per 1,000 women. Women in the age bracket of 35 to 50 years have the highest fertility rate with 34.0 births per 1,000 women. Women in the age bracket of 35 to 50 years acount for 100.0% of all women with births.
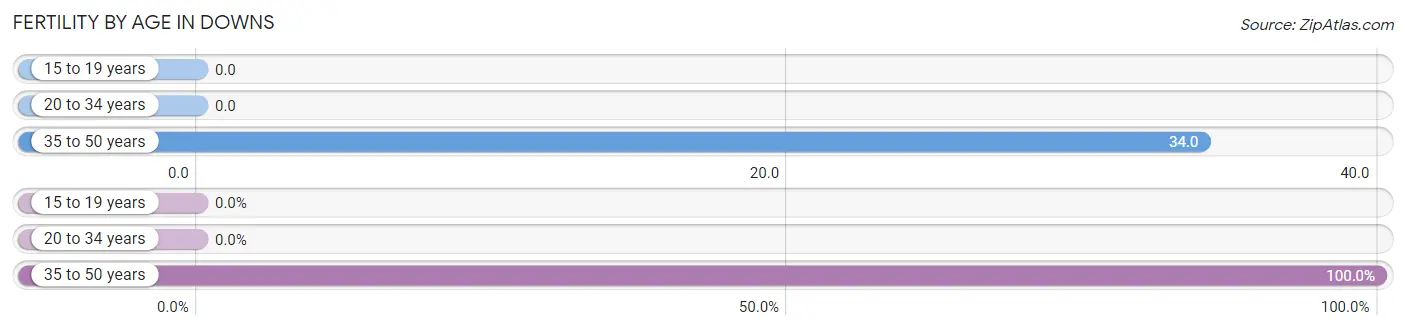
| Age Bracket | Women with Births | Births / 1,000 Women |
| 15 to 19 years | 0 (0.0%) | 0.0 |
| 20 to 34 years | 0 (0.0%) | 0.0 |
| 35 to 50 years | 5 (100.0%) | 34.0 |
| Total | 5 (100.0%) | 13.0 |
Fertility by Age by Marriage Status in Downs
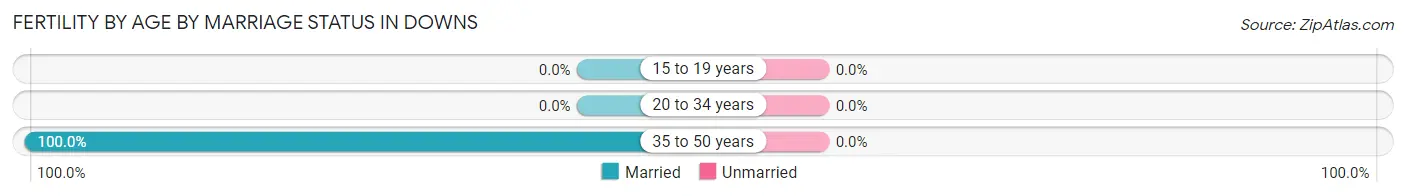
| Age Bracket | Married | Unmarried |
| 15 to 19 years | 0 (0.0%) | 0 (0.0%) |
| 20 to 34 years | 0 (0.0%) | 0 (0.0%) |
| 35 to 50 years | 5 (100.0%) | 0 (0.0%) |
| Total | 5 (100.0%) | 0 (0.0%) |
Fertility by Education in Downs
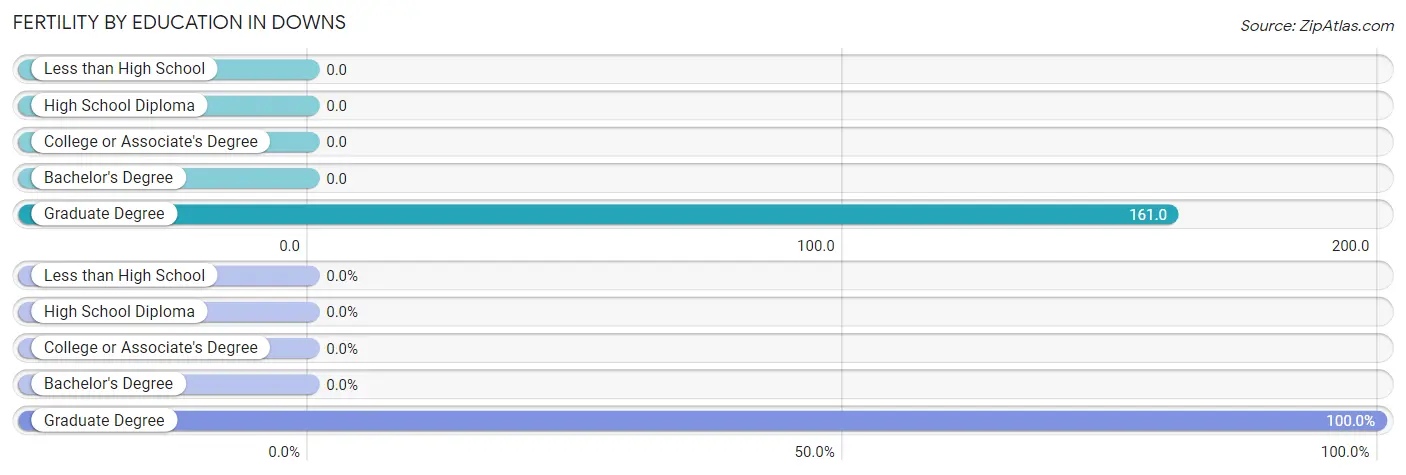
| Educational Attainment | Women with Births | Births / 1,000 Women |
| Less than High School | 0 (0.0%) | 0.0 |
| High School Diploma | 0 (0.0%) | 0.0 |
| College or Associate's Degree | 0 (0.0%) | 0.0 |
| Bachelor's Degree | 0 (0.0%) | 0.0 |
| Graduate Degree | 5 (100.0%) | 161.0 |
| Total | 5 (100.0%) | 13.0 |
Fertility by Education by Marriage Status in Downs
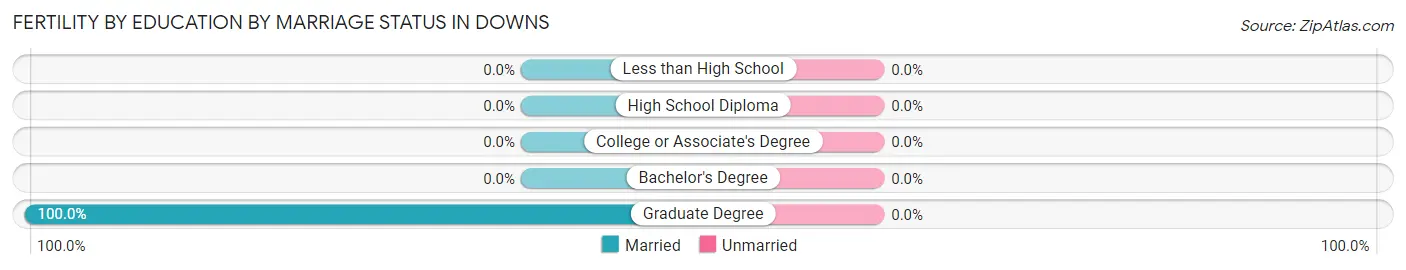
| Educational Attainment | Married | Unmarried |
| Less than High School | 0 (0.0%) | 0 (0.0%) |
| High School Diploma | 0 (0.0%) | 0 (0.0%) |
| College or Associate's Degree | 0 (0.0%) | 0 (0.0%) |
| Bachelor's Degree | 0 (0.0%) | 0 (0.0%) |
| Graduate Degree | 5 (100.0%) | 0 (0.0%) |
| Total | 5 (100.0%) | 0 (0.0%) |
Employment Characteristics in Downs
Employment by Class of Employer in Downs
Among the 749 employed individuals in Downs, private company employees (563 | 75.2%), local government employees (81 | 10.8%), and not-for-profit organizations (34 | 4.5%) make up the most common classes of employment.
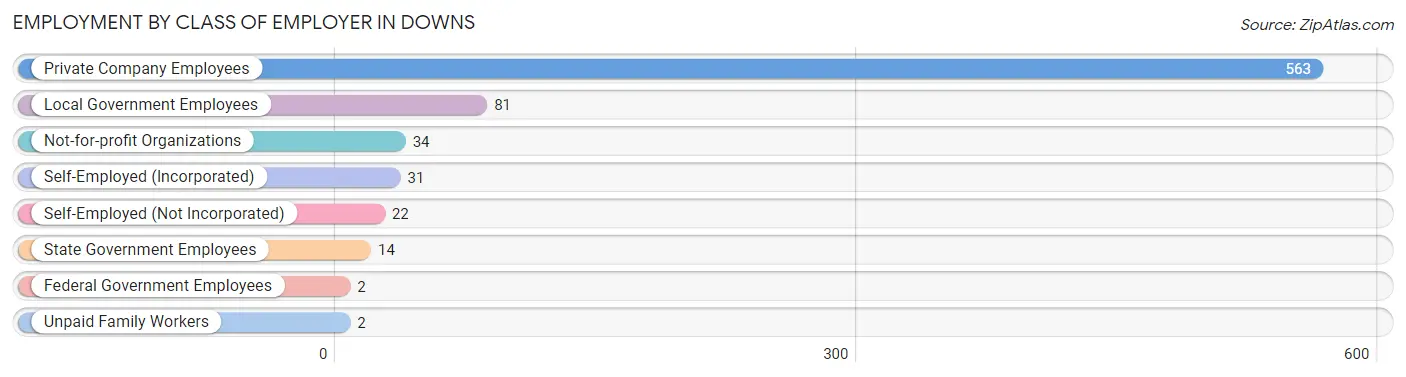
| Employer Class | # Employees | % Employees |
| Private Company Employees | 563 | 75.2% |
| Self-Employed (Incorporated) | 31 | 4.1% |
| Self-Employed (Not Incorporated) | 22 | 2.9% |
| Not-for-profit Organizations | 34 | 4.5% |
| Local Government Employees | 81 | 10.8% |
| State Government Employees | 14 | 1.9% |
| Federal Government Employees | 2 | 0.3% |
| Unpaid Family Workers | 2 | 0.3% |
| Total | 749 | 100.0% |
Employment Status by Age in Downs
According to the labor force statistics for Downs, out of the total population over 16 years of age (1,007), 75.3% or 758 individuals are in the labor force, with 0.5% or 4 of them unemployed. The age group with the highest labor force participation rate is 30 to 34 years, with 98.2% or 221 individuals in the labor force. Within the labor force, the 35 to 44 years age range has the highest percentage of unemployed individuals, with 2.8% or 4 of them being unemployed.
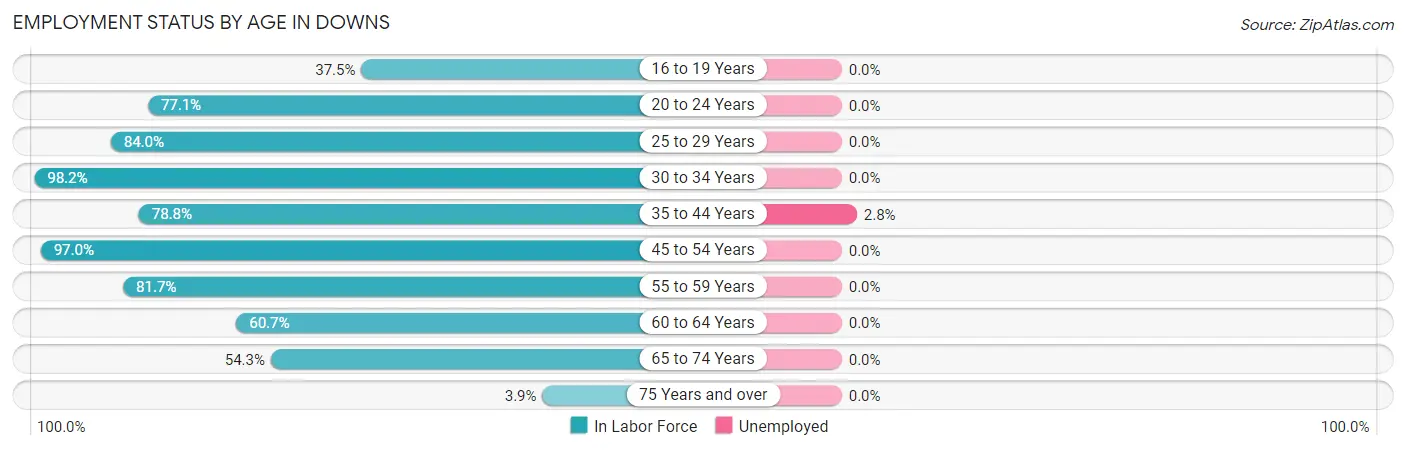
| Age Bracket | In Labor Force | Unemployed |
| 16 to 19 Years | 15 (37.5%) | 0 (0.0%) |
| 20 to 24 Years | 37 (77.1%) | 0 (0.0%) |
| 25 to 29 Years | 63 (84.0%) | 0 (0.0%) |
| 30 to 34 Years | 221 (98.2%) | 0 (0.0%) |
| 35 to 44 Years | 141 (78.8%) | 4 (2.8%) |
| 45 to 54 Years | 164 (97.0%) | 0 (0.0%) |
| 55 to 59 Years | 58 (81.7%) | 0 (0.0%) |
| 60 to 64 Years | 17 (60.7%) | 0 (0.0%) |
| 65 to 74 Years | 38 (54.3%) | 0 (0.0%) |
| 75 Years and over | 4 (3.9%) | 0 (0.0%) |
| Total | 758 (75.3%) | 4 (0.5%) |
Employment Status by Educational Attainment in Downs
According to labor force statistics for Downs, 88.9% of individuals (664) out of the total population between 25 and 64 years of age (747) are in the labor force, with 0.6% or 4 of them being unemployed. The group with the highest labor force participation rate are those with the educational attainment of bachelor's degree or higher, with 95.4% or 375 individuals in the labor force. Within the labor force, individuals with bachelor's degree or higher education have the highest percentage of unemployment, with 1.1% or 4 of them being unemployed.
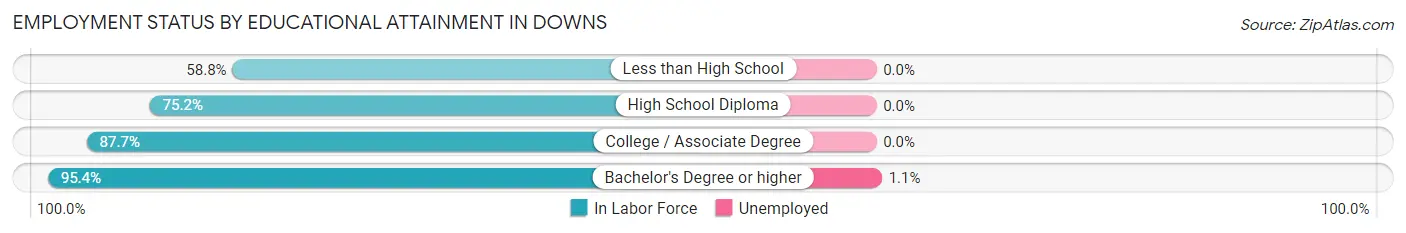
| Educational Attainment | In Labor Force | Unemployed |
| Less than High School | 10 (58.8%) | 0 (0.0%) |
| High School Diploma | 100 (75.2%) | 0 (0.0%) |
| College / Associate Degree | 179 (87.7%) | 0 (0.0%) |
| Bachelor's Degree or higher | 375 (95.4%) | 4 (1.1%) |
| Total | 664 (88.9%) | 4 (0.6%) |
Employment Occupations by Sex in Downs
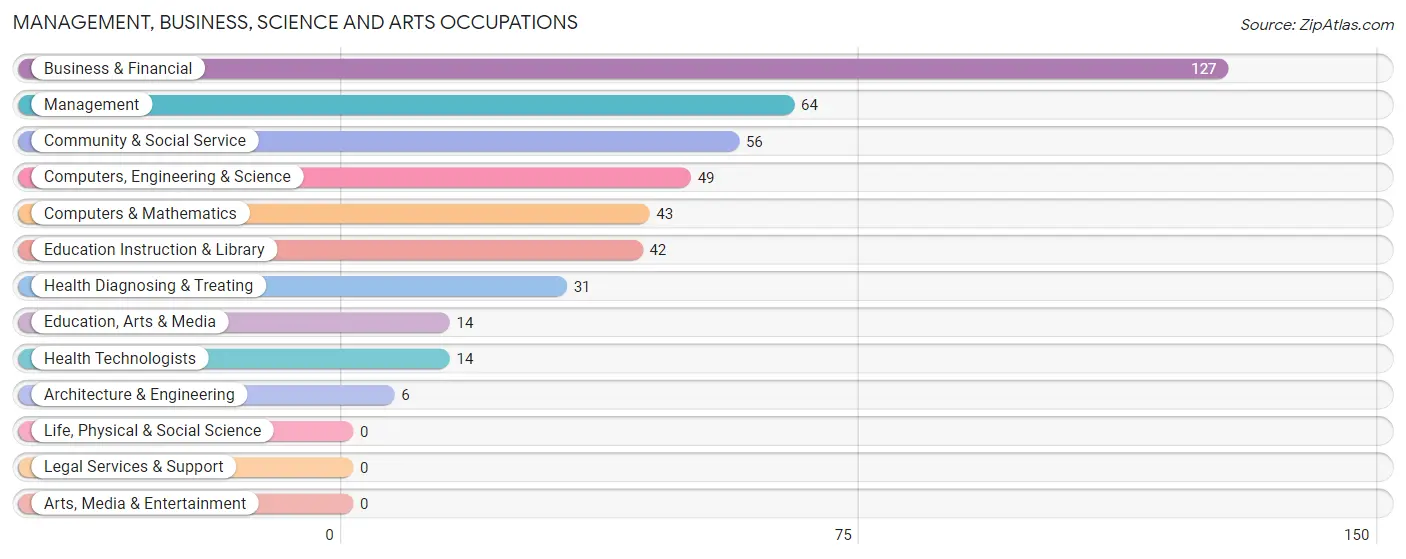
Management, Business, Science and Arts Occupations
The most common Management, Business, Science and Arts occupations in Downs are Business & Financial (127 | 16.8%), Management (64 | 8.5%), Community & Social Service (56 | 7.4%), Computers, Engineering & Science (49 | 6.5%), and Computers & Mathematics (43 | 5.7%).
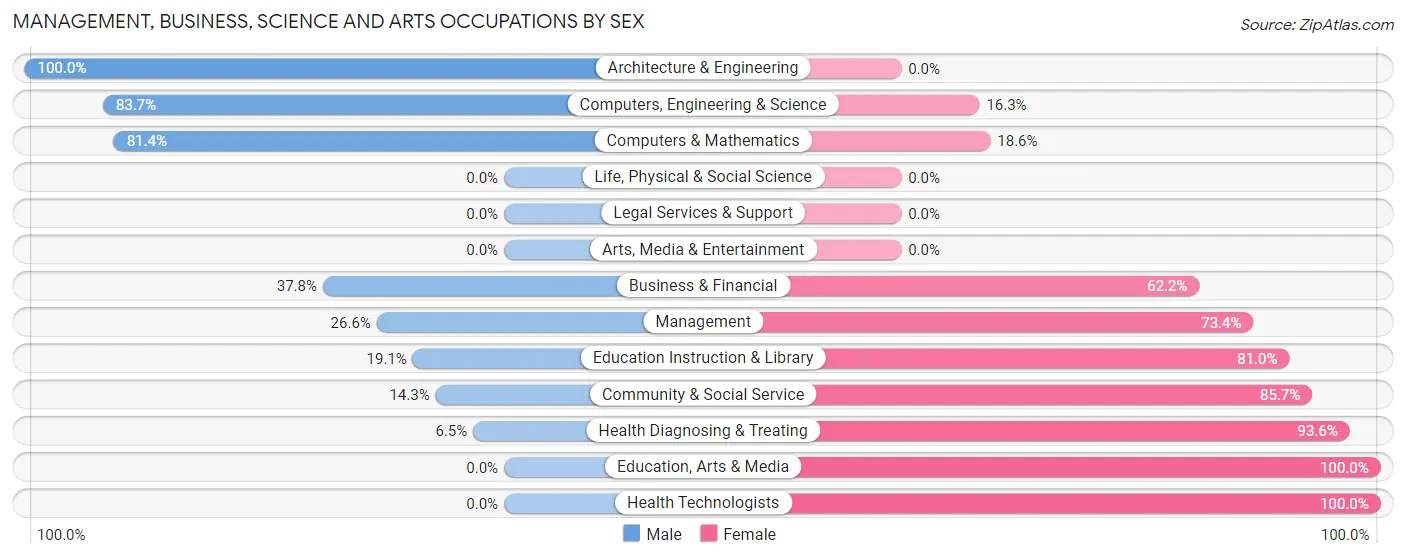
Management, Business, Science and Arts Occupations by Sex
Within the Management, Business, Science and Arts occupations in Downs, the most male-oriented occupations are Architecture & Engineering (100.0%), Computers, Engineering & Science (83.7%), and Computers & Mathematics (81.4%), while the most female-oriented occupations are Education, Arts & Media (100.0%), Health Technologists (100.0%), and Health Diagnosing & Treating (93.5%).
| Occupation | Male | Female |
| Management | 17 (26.6%) | 47 (73.4%) |
| Business & Financial | 48 (37.8%) | 79 (62.2%) |
| Computers, Engineering & Science | 41 (83.7%) | 8 (16.3%) |
| Computers & Mathematics | 35 (81.4%) | 8 (18.6%) |
| Architecture & Engineering | 6 (100.0%) | 0 (0.0%) |
| Life, Physical & Social Science | 0 (0.0%) | 0 (0.0%) |
| Community & Social Service | 8 (14.3%) | 48 (85.7%) |
| Education, Arts & Media | 0 (0.0%) | 14 (100.0%) |
| Legal Services & Support | 0 (0.0%) | 0 (0.0%) |
| Education Instruction & Library | 8 (19.1%) | 34 (80.9%) |
| Arts, Media & Entertainment | 0 (0.0%) | 0 (0.0%) |
| Health Diagnosing & Treating | 2 (6.5%) | 29 (93.5%) |
| Health Technologists | 0 (0.0%) | 14 (100.0%) |
| Total (Category) | 116 (35.5%) | 211 (64.5%) |
| Total (Overall) | 345 (45.8%) | 409 (54.2%) |
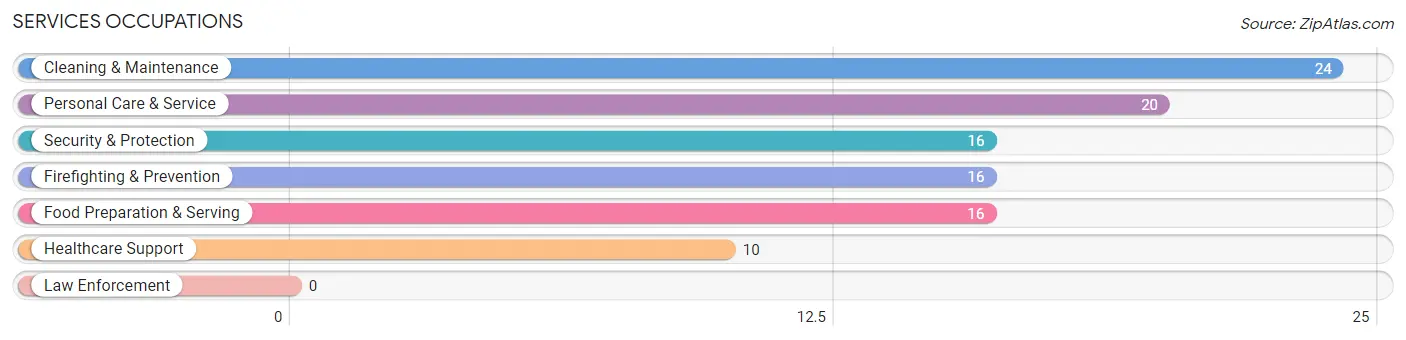
Services Occupations
The most common Services occupations in Downs are Cleaning & Maintenance (24 | 3.2%), Personal Care & Service (20 | 2.6%), Security & Protection (16 | 2.1%), Firefighting & Prevention (16 | 2.1%), and Food Preparation & Serving (16 | 2.1%).
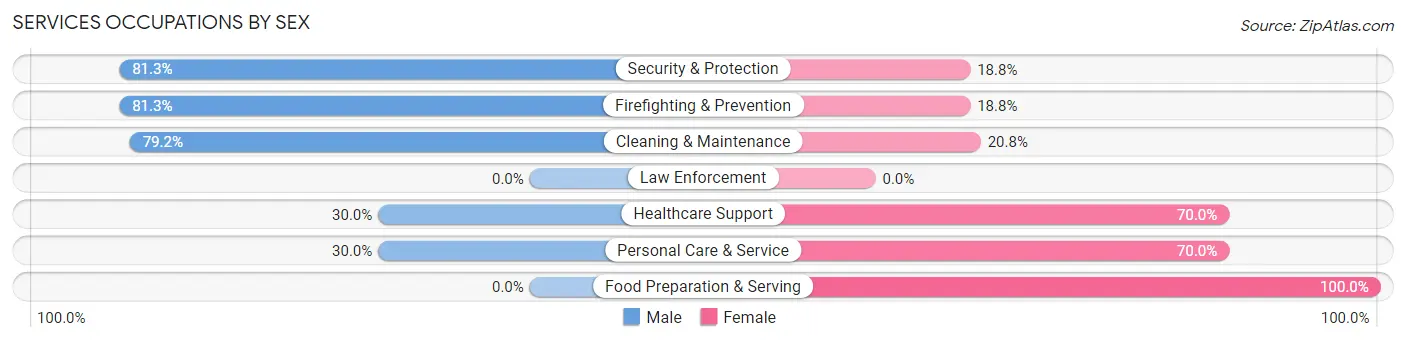
Services Occupations by Sex
Within the Services occupations in Downs, the most male-oriented occupations are Security & Protection (81.2%), Firefighting & Prevention (81.2%), and Cleaning & Maintenance (79.2%), while the most female-oriented occupations are Food Preparation & Serving (100.0%), Healthcare Support (70.0%), and Personal Care & Service (70.0%).
| Occupation | Male | Female |
| Healthcare Support | 3 (30.0%) | 7 (70.0%) |
| Security & Protection | 13 (81.2%) | 3 (18.8%) |
| Firefighting & Prevention | 13 (81.2%) | 3 (18.8%) |
| Law Enforcement | 0 (0.0%) | 0 (0.0%) |
| Food Preparation & Serving | 0 (0.0%) | 16 (100.0%) |
| Cleaning & Maintenance | 19 (79.2%) | 5 (20.8%) |
| Personal Care & Service | 6 (30.0%) | 14 (70.0%) |
| Total (Category) | 41 (47.7%) | 45 (52.3%) |
| Total (Overall) | 345 (45.8%) | 409 (54.2%) |
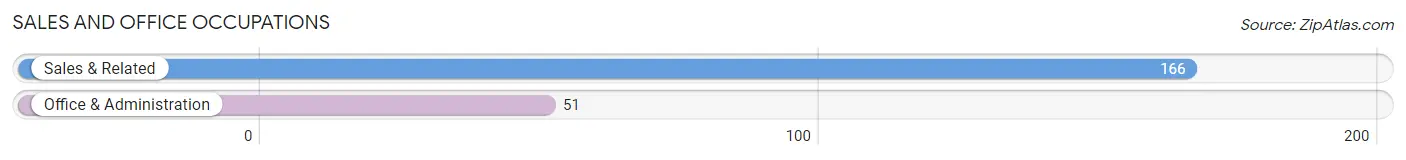
Sales and Office Occupations
The most common Sales and Office occupations in Downs are Sales & Related (166 | 22.0%), and Office & Administration (51 | 6.8%).
Sales and Office Occupations by Sex
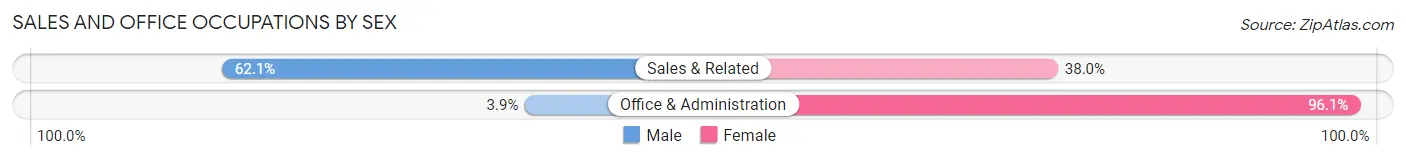
| Occupation | Male | Female |
| Sales & Related | 103 (62.1%) | 63 (38.0%) |
| Office & Administration | 2 (3.9%) | 49 (96.1%) |
| Total (Category) | 105 (48.4%) | 112 (51.6%) |
| Total (Overall) | 345 (45.8%) | 409 (54.2%) |
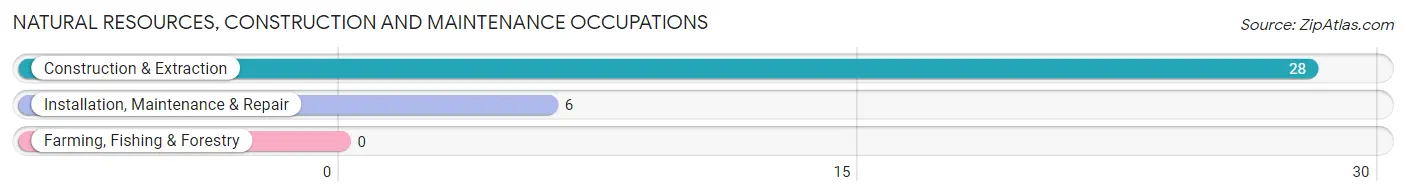
Natural Resources, Construction and Maintenance Occupations
The most common Natural Resources, Construction and Maintenance occupations in Downs are Construction & Extraction (28 | 3.7%), and Installation, Maintenance & Repair (6 | 0.8%).
Natural Resources, Construction and Maintenance Occupations by Sex
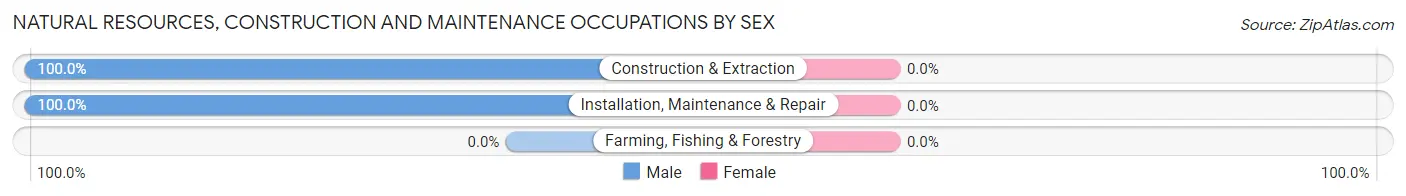
| Occupation | Male | Female |
| Farming, Fishing & Forestry | 0 (0.0%) | 0 (0.0%) |
| Construction & Extraction | 28 (100.0%) | 0 (0.0%) |
| Installation, Maintenance & Repair | 6 (100.0%) | 0 (0.0%) |
| Total (Category) | 34 (100.0%) | 0 (0.0%) |
| Total (Overall) | 345 (45.8%) | 409 (54.2%) |
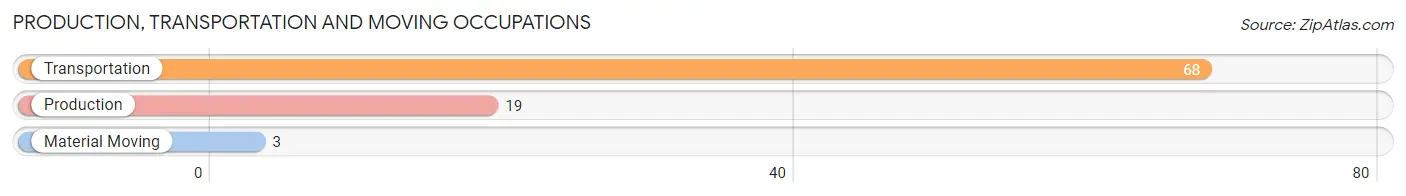
Production, Transportation and Moving Occupations
The most common Production, Transportation and Moving occupations in Downs are Transportation (68 | 9.0%), Production (19 | 2.5%), and Material Moving (3 | 0.4%).
Production, Transportation and Moving Occupations by Sex
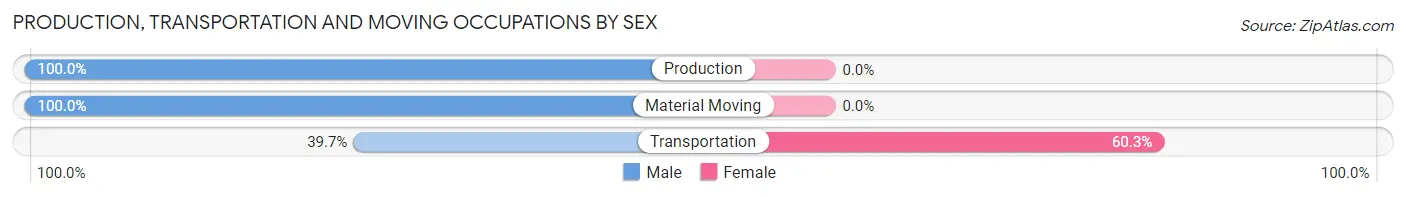
| Occupation | Male | Female |
| Production | 19 (100.0%) | 0 (0.0%) |
| Transportation | 27 (39.7%) | 41 (60.3%) |
| Material Moving | 3 (100.0%) | 0 (0.0%) |
| Total (Category) | 49 (54.4%) | 41 (45.6%) |
| Total (Overall) | 345 (45.8%) | 409 (54.2%) |
Employment Industries by Sex in Downs
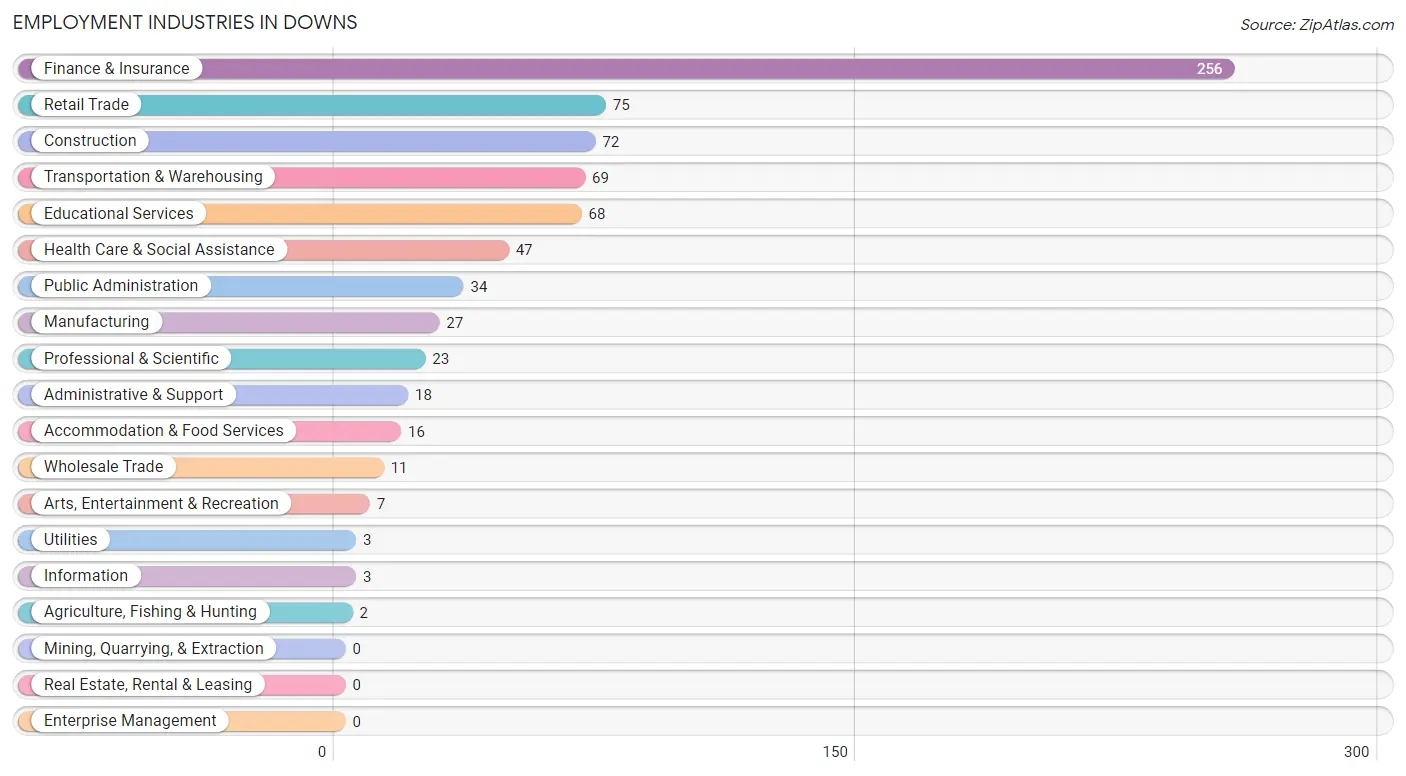
Employment Industries in Downs
The major employment industries in Downs include Finance & Insurance (256 | 34.0%), Retail Trade (75 | 10.0%), Construction (72 | 9.6%), Transportation & Warehousing (69 | 9.1%), and Educational Services (68 | 9.0%).
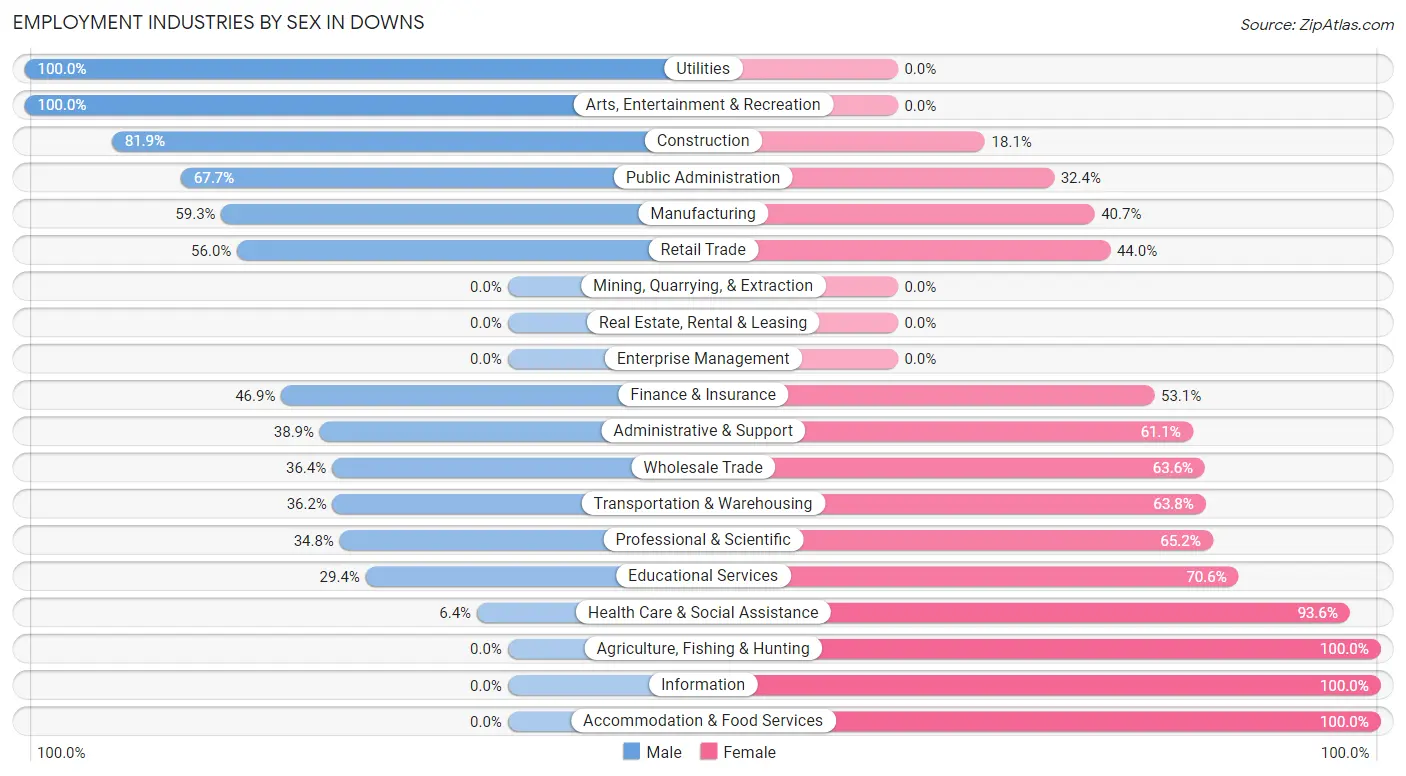
Employment Industries by Sex in Downs
The Downs industries that see more men than women are Utilities (100.0%), Arts, Entertainment & Recreation (100.0%), and Construction (81.9%), whereas the industries that tend to have a higher number of women are Agriculture, Fishing & Hunting (100.0%), Information (100.0%), and Accommodation & Food Services (100.0%).
| Industry | Male | Female |
| Agriculture, Fishing & Hunting | 0 (0.0%) | 2 (100.0%) |
| Mining, Quarrying, & Extraction | 0 (0.0%) | 0 (0.0%) |
| Construction | 59 (81.9%) | 13 (18.1%) |
| Manufacturing | 16 (59.3%) | 11 (40.7%) |
| Wholesale Trade | 4 (36.4%) | 7 (63.6%) |
| Retail Trade | 42 (56.0%) | 33 (44.0%) |
| Transportation & Warehousing | 25 (36.2%) | 44 (63.8%) |
| Utilities | 3 (100.0%) | 0 (0.0%) |
| Information | 0 (0.0%) | 3 (100.0%) |
| Finance & Insurance | 120 (46.9%) | 136 (53.1%) |
| Real Estate, Rental & Leasing | 0 (0.0%) | 0 (0.0%) |
| Professional & Scientific | 8 (34.8%) | 15 (65.2%) |
| Enterprise Management | 0 (0.0%) | 0 (0.0%) |
| Administrative & Support | 7 (38.9%) | 11 (61.1%) |
| Educational Services | 20 (29.4%) | 48 (70.6%) |
| Health Care & Social Assistance | 3 (6.4%) | 44 (93.6%) |
| Arts, Entertainment & Recreation | 7 (100.0%) | 0 (0.0%) |
| Accommodation & Food Services | 0 (0.0%) | 16 (100.0%) |
| Public Administration | 23 (67.6%) | 11 (32.4%) |
| Total | 345 (45.8%) | 409 (54.2%) |
Education in Downs
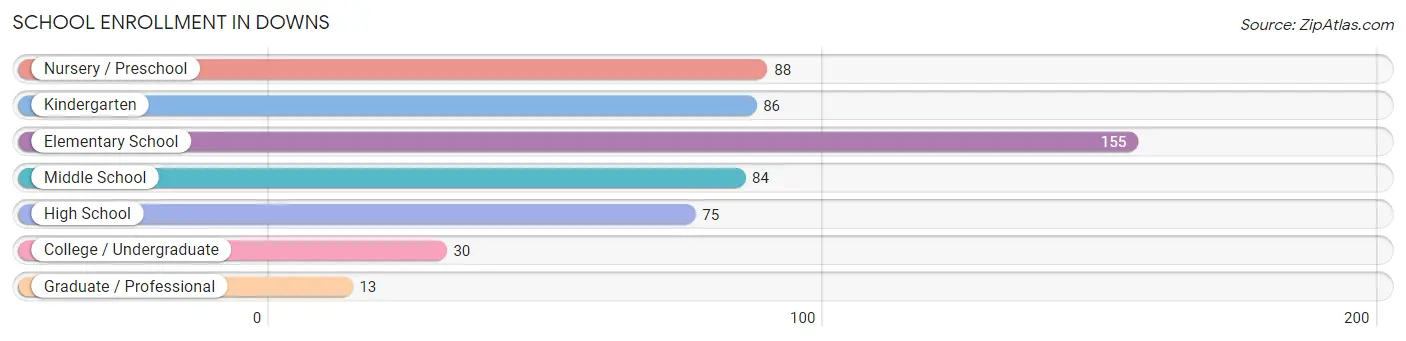
School Enrollment in Downs
The most common levels of schooling among the 531 students in Downs are elementary school (155 | 29.2%), nursery / preschool (88 | 16.6%), and kindergarten (86 | 16.2%).
| School Level | # Students | % Students |
| Nursery / Preschool | 88 | 16.6% |
| Kindergarten | 86 | 16.2% |
| Elementary School | 155 | 29.2% |
| Middle School | 84 | 15.8% |
| High School | 75 | 14.1% |
| College / Undergraduate | 30 | 5.7% |
| Graduate / Professional | 13 | 2.5% |
| Total | 531 | 100.0% |
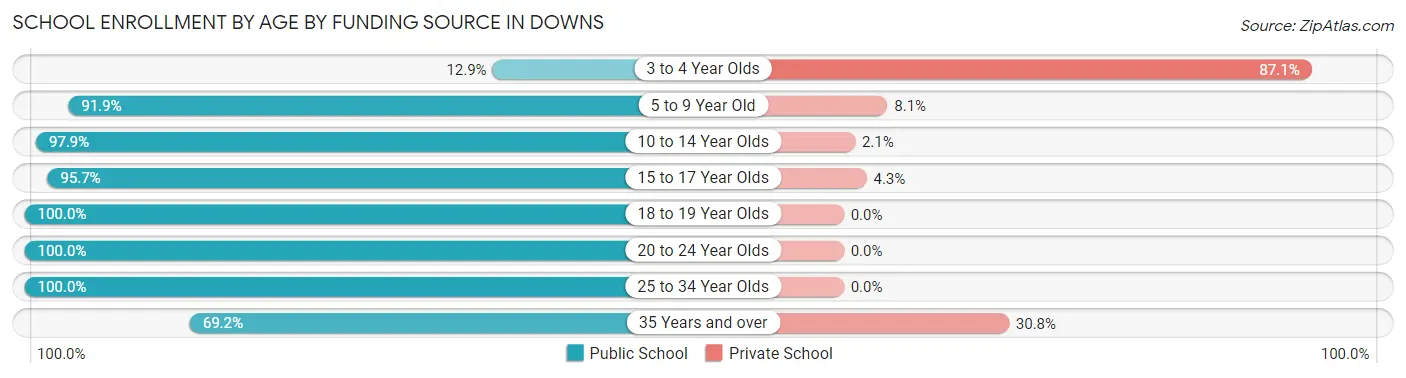
School Enrollment by Age by Funding Source in Downs
Out of a total of 531 students who are enrolled in schools in Downs, 88 (16.6%) attend a private institution, while the remaining 443 (83.4%) are enrolled in public schools. The age group of 3 to 4 year olds has the highest likelihood of being enrolled in private schools, with 61 (87.1% in the age bracket) enrolled. Conversely, the age group of 18 to 19 year olds has the lowest likelihood of being enrolled in a private school, with 13 (100.0% in the age bracket) attending a public institution.
| Age Bracket | Public School | Private School |
| 3 to 4 Year Olds | 9 (12.9%) | 61 (87.1%) |
| 5 to 9 Year Old | 203 (91.9%) | 18 (8.1%) |
| 10 to 14 Year Olds | 140 (97.9%) | 3 (2.1%) |
| 15 to 17 Year Olds | 45 (95.7%) | 2 (4.3%) |
| 18 to 19 Year Olds | 13 (100.0%) | 0 (0.0%) |
| 20 to 24 Year Olds | 11 (100.0%) | 0 (0.0%) |
| 25 to 34 Year Olds | 13 (100.0%) | 0 (0.0%) |
| 35 Years and over | 9 (69.2%) | 4 (30.8%) |
| Total | 443 (83.4%) | 88 (16.6%) |
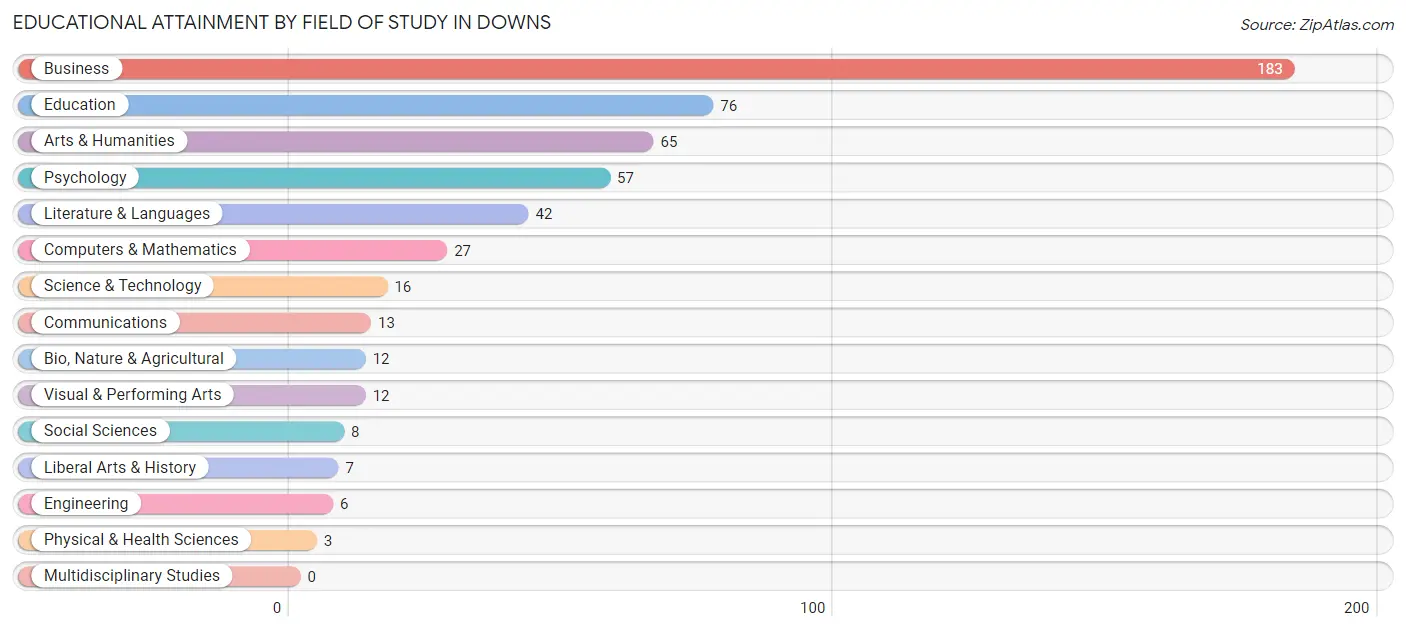
Educational Attainment by Field of Study in Downs
Business (183 | 34.7%), education (76 | 14.4%), arts & humanities (65 | 12.3%), psychology (57 | 10.8%), and literature & languages (42 | 8.0%) are the most common fields of study among 527 individuals in Downs who have obtained a bachelor's degree or higher.
| Field of Study | # Graduates | % Graduates |
| Computers & Mathematics | 27 | 5.1% |
| Bio, Nature & Agricultural | 12 | 2.3% |
| Physical & Health Sciences | 3 | 0.6% |
| Psychology | 57 | 10.8% |
| Social Sciences | 8 | 1.5% |
| Engineering | 6 | 1.1% |
| Multidisciplinary Studies | 0 | 0.0% |
| Science & Technology | 16 | 3.0% |
| Business | 183 | 34.7% |
| Education | 76 | 14.4% |
| Literature & Languages | 42 | 8.0% |
| Liberal Arts & History | 7 | 1.3% |
| Visual & Performing Arts | 12 | 2.3% |
| Communications | 13 | 2.5% |
| Arts & Humanities | 65 | 12.3% |
| Total | 527 | 100.0% |
Transportation & Commute in Downs
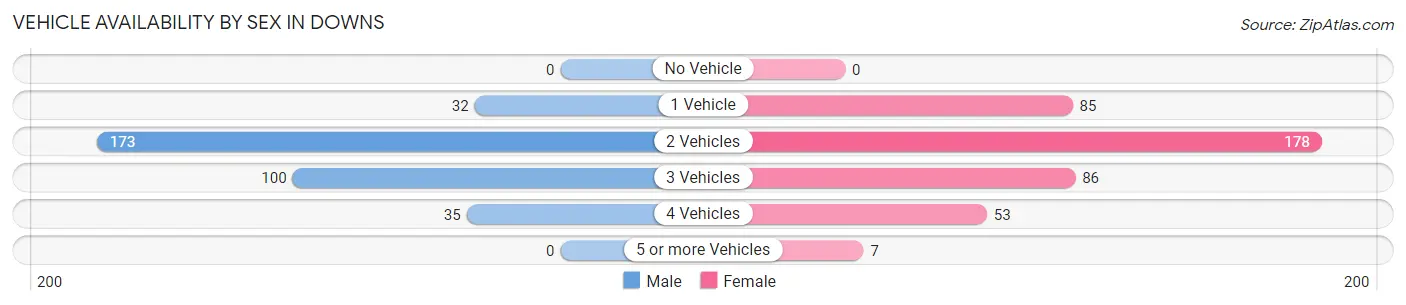
Vehicle Availability by Sex in Downs
The most prevalent vehicle ownership categories in Downs are males with 2 vehicles (173, accounting for 50.9%) and females with 2 vehicles (178, making up 42.3%).
| Vehicles Available | Male | Female |
| No Vehicle | 0 (0.0%) | 0 (0.0%) |
| 1 Vehicle | 32 (9.4%) | 85 (20.8%) |
| 2 Vehicles | 173 (50.9%) | 178 (43.5%) |
| 3 Vehicles | 100 (29.4%) | 86 (21.0%) |
| 4 Vehicles | 35 (10.3%) | 53 (13.0%) |
| 5 or more Vehicles | 0 (0.0%) | 7 (1.7%) |
| Total | 340 (100.0%) | 409 (100.0%) |
Commute Time in Downs
The most frequently occuring commute durations in Downs are 15 to 19 minutes (202 commuters, 30.5%), 20 to 24 minutes (130 commuters, 19.6%), and 5 to 9 minutes (68 commuters, 10.3%).
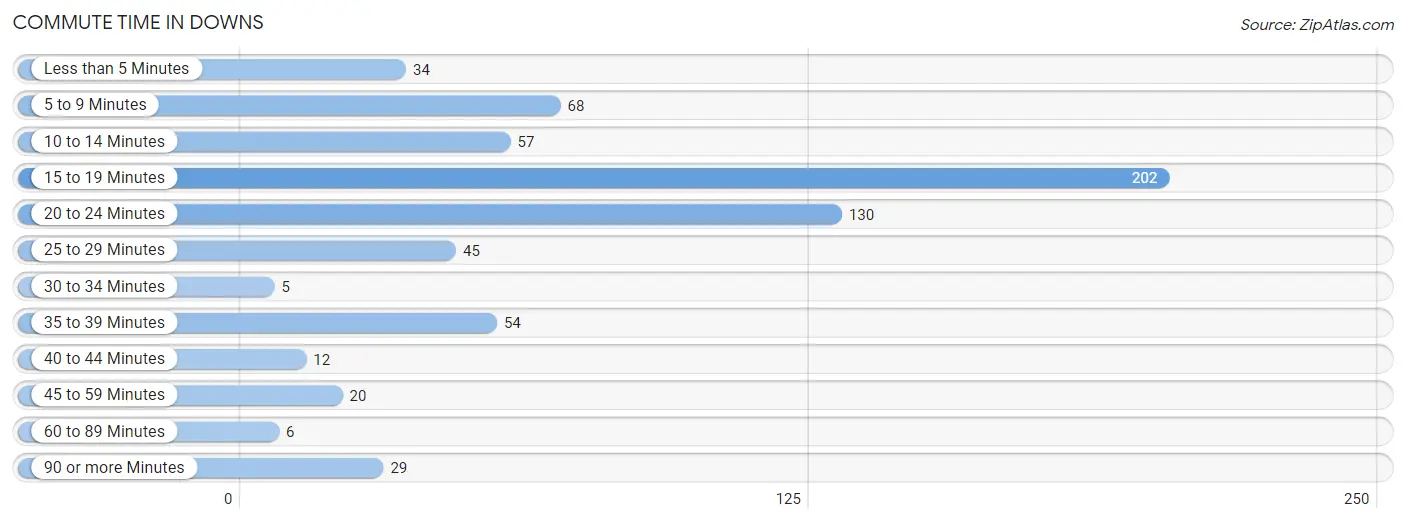
| Commute Time | # Commuters | % Commuters |
| Less than 5 Minutes | 34 | 5.1% |
| 5 to 9 Minutes | 68 | 10.3% |
| 10 to 14 Minutes | 57 | 8.6% |
| 15 to 19 Minutes | 202 | 30.5% |
| 20 to 24 Minutes | 130 | 19.6% |
| 25 to 29 Minutes | 45 | 6.8% |
| 30 to 34 Minutes | 5 | 0.8% |
| 35 to 39 Minutes | 54 | 8.2% |
| 40 to 44 Minutes | 12 | 1.8% |
| 45 to 59 Minutes | 20 | 3.0% |
| 60 to 89 Minutes | 6 | 0.9% |
| 90 or more Minutes | 29 | 4.4% |
Commute Time by Sex in Downs
The most common commute times in Downs are 15 to 19 minutes (99 commuters, 33.6%) for males and 15 to 19 minutes (103 commuters, 28.1%) for females.
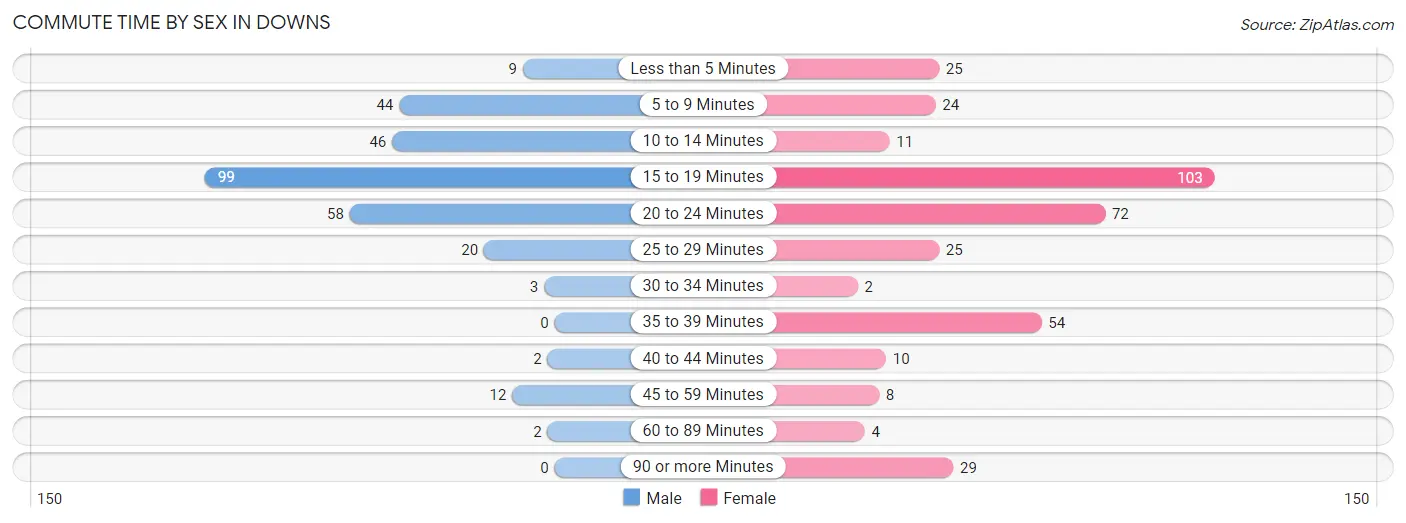
| Commute Time | Male | Female |
| Less than 5 Minutes | 9 (3.0%) | 25 (6.8%) |
| 5 to 9 Minutes | 44 (14.9%) | 24 (6.5%) |
| 10 to 14 Minutes | 46 (15.6%) | 11 (3.0%) |
| 15 to 19 Minutes | 99 (33.6%) | 103 (28.1%) |
| 20 to 24 Minutes | 58 (19.7%) | 72 (19.6%) |
| 25 to 29 Minutes | 20 (6.8%) | 25 (6.8%) |
| 30 to 34 Minutes | 3 (1.0%) | 2 (0.5%) |
| 35 to 39 Minutes | 0 (0.0%) | 54 (14.7%) |
| 40 to 44 Minutes | 2 (0.7%) | 10 (2.7%) |
| 45 to 59 Minutes | 12 (4.1%) | 8 (2.2%) |
| 60 to 89 Minutes | 2 (0.7%) | 4 (1.1%) |
| 90 or more Minutes | 0 (0.0%) | 29 (7.9%) |
Time of Departure to Work by Sex in Downs
The most frequent times of departure to work in Downs are 7:30 AM to 7:59 AM (64, 21.7%) for males and 7:30 AM to 7:59 AM (79, 21.5%) for females.
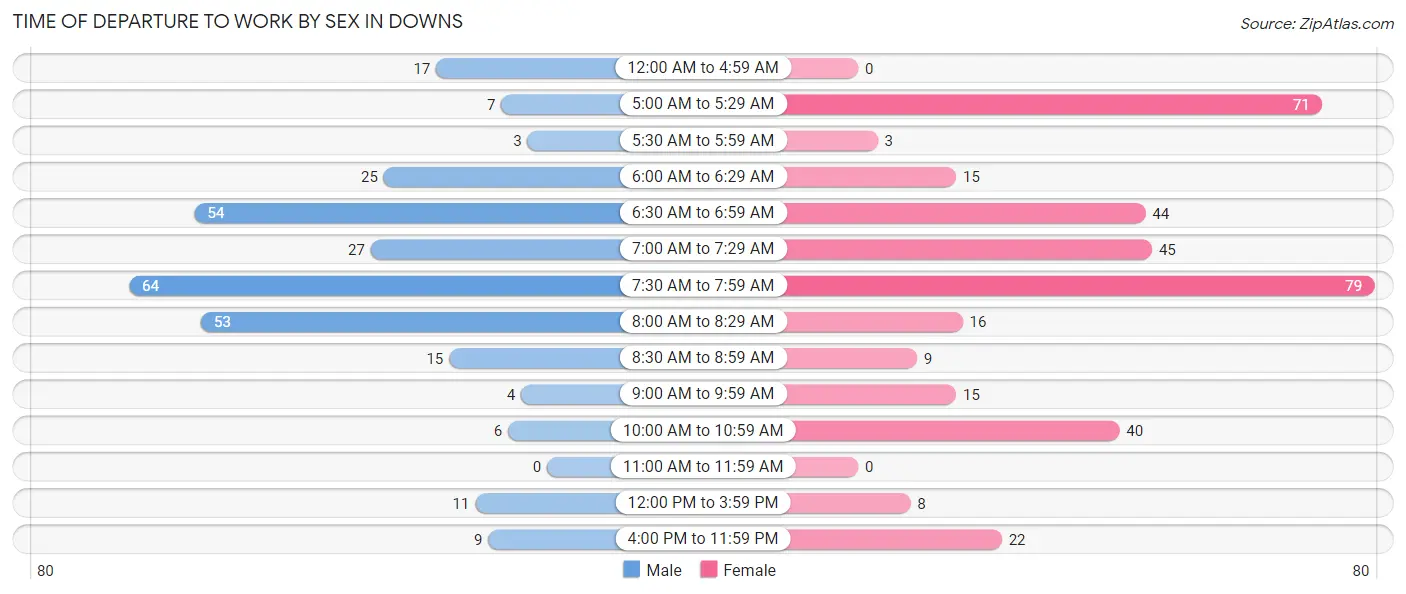
| Time of Departure | Male | Female |
| 12:00 AM to 4:59 AM | 17 (5.8%) | 0 (0.0%) |
| 5:00 AM to 5:29 AM | 7 (2.4%) | 71 (19.4%) |
| 5:30 AM to 5:59 AM | 3 (1.0%) | 3 (0.8%) |
| 6:00 AM to 6:29 AM | 25 (8.5%) | 15 (4.1%) |
| 6:30 AM to 6:59 AM | 54 (18.3%) | 44 (12.0%) |
| 7:00 AM to 7:29 AM | 27 (9.1%) | 45 (12.3%) |
| 7:30 AM to 7:59 AM | 64 (21.7%) | 79 (21.5%) |
| 8:00 AM to 8:29 AM | 53 (18.0%) | 16 (4.4%) |
| 8:30 AM to 8:59 AM | 15 (5.1%) | 9 (2.5%) |
| 9:00 AM to 9:59 AM | 4 (1.4%) | 15 (4.1%) |
| 10:00 AM to 10:59 AM | 6 (2.0%) | 40 (10.9%) |
| 11:00 AM to 11:59 AM | 0 (0.0%) | 0 (0.0%) |
| 12:00 PM to 3:59 PM | 11 (3.7%) | 8 (2.2%) |
| 4:00 PM to 11:59 PM | 9 (3.0%) | 22 (6.0%) |
| Total | 295 (100.0%) | 367 (100.0%) |
Housing Occupancy in Downs
Occupancy by Ownership in Downs
Of the total 537 dwellings in Downs, owner-occupied units account for 460 (85.7%), while renter-occupied units make up 77 (14.3%).
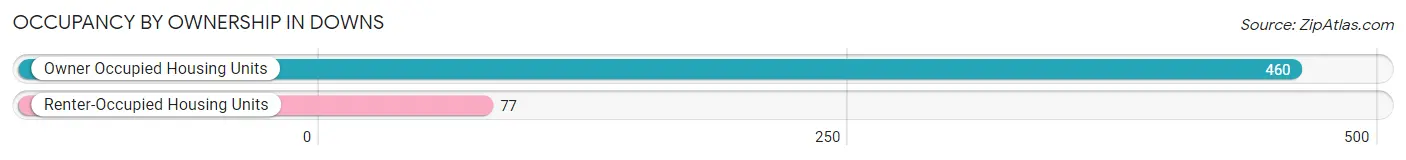
| Occupancy | # Housing Units | % Housing Units |
| Owner Occupied Housing Units | 460 | 85.7% |
| Renter-Occupied Housing Units | 77 | 14.3% |
| Total Occupied Housing Units | 537 | 100.0% |
Occupancy by Household Size in Downs
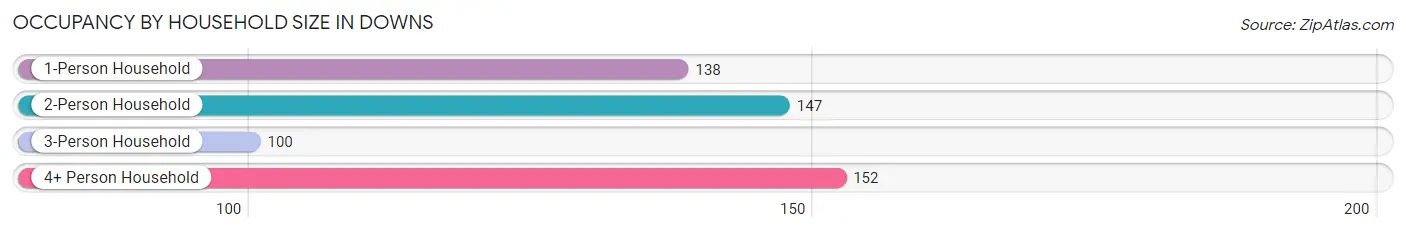
| Household Size | # Housing Units | % Housing Units |
| 1-Person Household | 138 | 25.7% |
| 2-Person Household | 147 | 27.4% |
| 3-Person Household | 100 | 18.6% |
| 4+ Person Household | 152 | 28.3% |
| Total Housing Units | 537 | 100.0% |
Occupancy by Ownership by Household Size in Downs
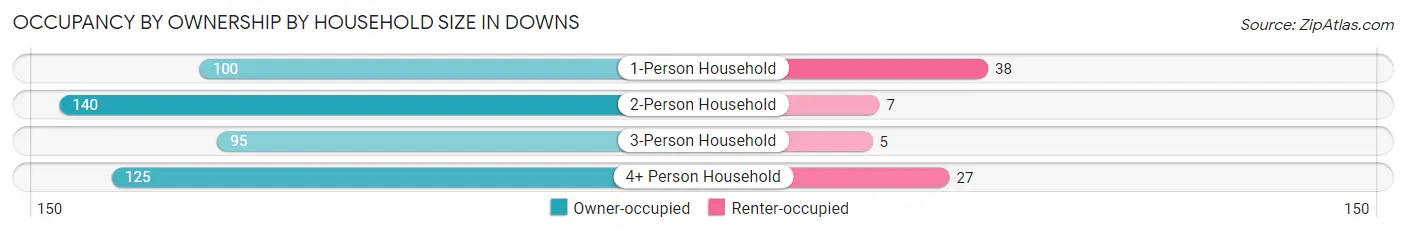
| Household Size | Owner-occupied | Renter-occupied |
| 1-Person Household | 100 (72.5%) | 38 (27.5%) |
| 2-Person Household | 140 (95.2%) | 7 (4.8%) |
| 3-Person Household | 95 (95.0%) | 5 (5.0%) |
| 4+ Person Household | 125 (82.2%) | 27 (17.8%) |
| Total Housing Units | 460 (85.7%) | 77 (14.3%) |
Occupancy by Educational Attainment in Downs
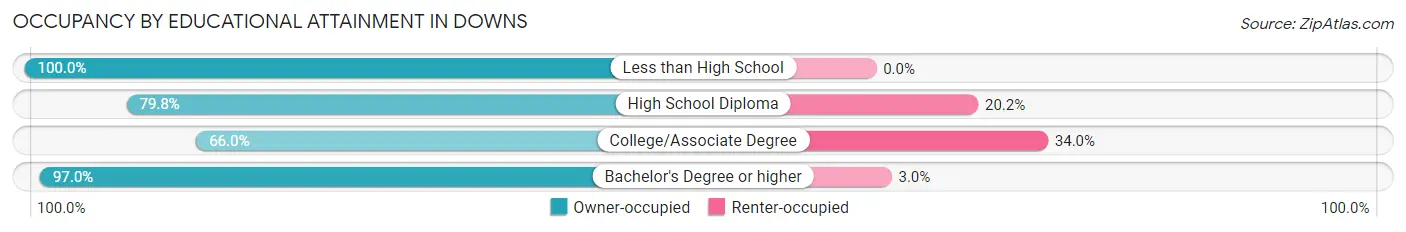
| Household Size | Owner-occupied | Renter-occupied |
| Less than High School | 1 (100.0%) | 0 (0.0%) |
| High School Diploma | 79 (79.8%) | 20 (20.2%) |
| College/Associate Degree | 93 (66.0%) | 48 (34.0%) |
| Bachelor's Degree or higher | 287 (97.0%) | 9 (3.0%) |
Occupancy by Age of Householder in Downs
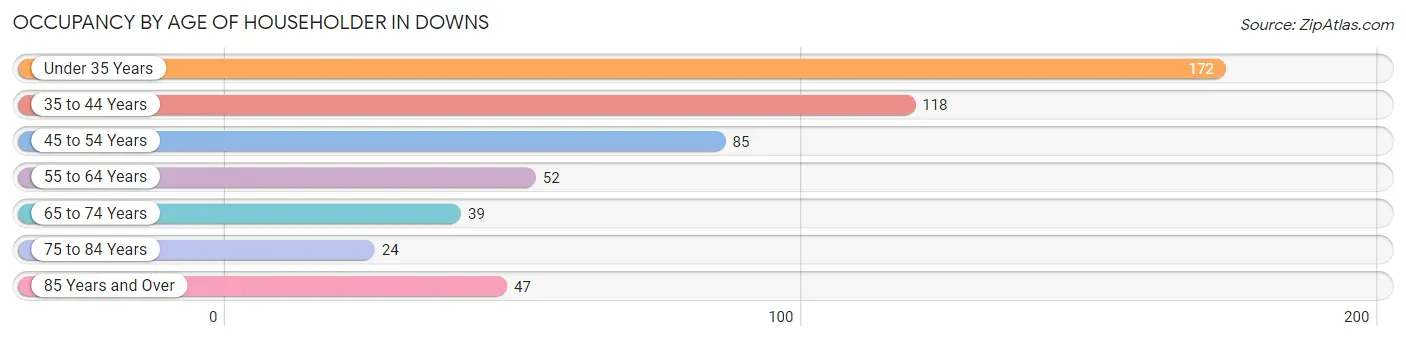
| Age Bracket | # Households | % Households |
| Under 35 Years | 172 | 32.0% |
| 35 to 44 Years | 118 | 22.0% |
| 45 to 54 Years | 85 | 15.8% |
| 55 to 64 Years | 52 | 9.7% |
| 65 to 74 Years | 39 | 7.3% |
| 75 to 84 Years | 24 | 4.5% |
| 85 Years and Over | 47 | 8.7% |
| Total | 537 | 100.0% |
Housing Finances in Downs
Median Income by Occupancy in Downs
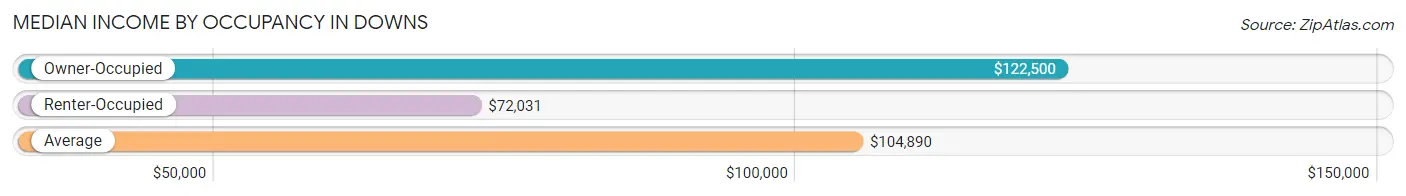
| Occupancy Type | # Households | Median Income |
| Owner-Occupied | 460 (85.7%) | $122,500 |
| Renter-Occupied | 77 (14.3%) | $72,031 |
| Average | 537 (100.0%) | $104,890 |
Occupancy by Householder Income Bracket in Downs
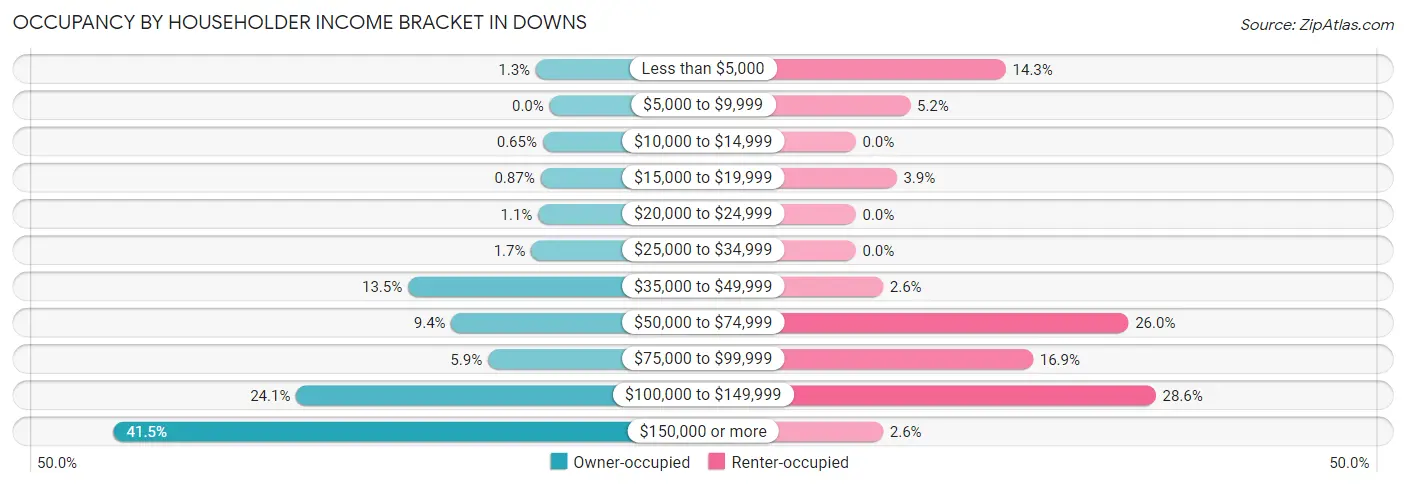
| Income Bracket | Owner-occupied | Renter-occupied |
| Less than $5,000 | 6 (1.3%) | 11 (14.3%) |
| $5,000 to $9,999 | 0 (0.0%) | 4 (5.2%) |
| $10,000 to $14,999 | 3 (0.6%) | 0 (0.0%) |
| $15,000 to $19,999 | 4 (0.9%) | 3 (3.9%) |
| $20,000 to $24,999 | 5 (1.1%) | 0 (0.0%) |
| $25,000 to $34,999 | 8 (1.7%) | 0 (0.0%) |
| $35,000 to $49,999 | 62 (13.5%) | 2 (2.6%) |
| $50,000 to $74,999 | 43 (9.3%) | 20 (26.0%) |
| $75,000 to $99,999 | 27 (5.9%) | 13 (16.9%) |
| $100,000 to $149,999 | 111 (24.1%) | 22 (28.6%) |
| $150,000 or more | 191 (41.5%) | 2 (2.6%) |
| Total | 460 (100.0%) | 77 (100.0%) |
Monthly Housing Cost Tiers in Downs
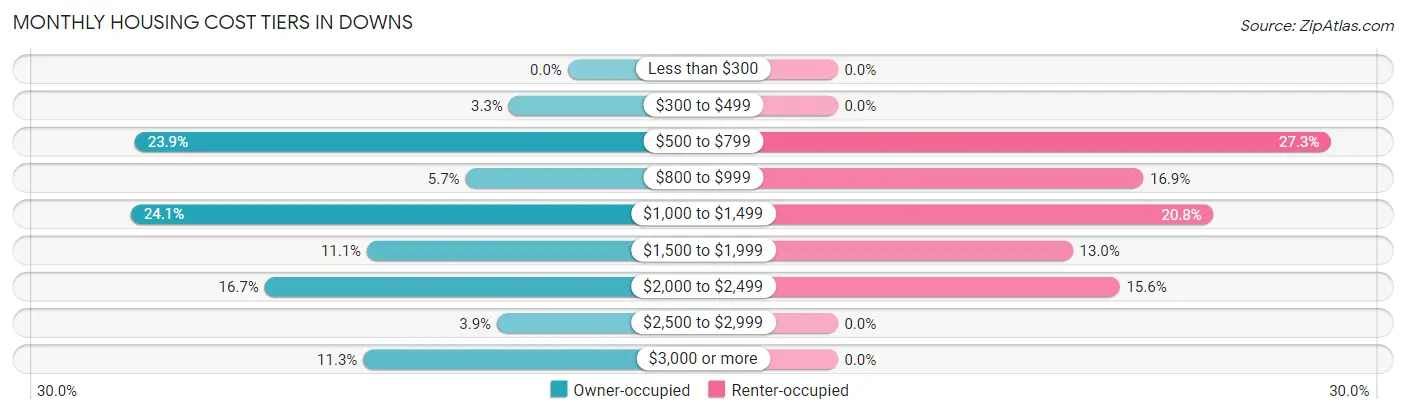
| Monthly Cost | Owner-occupied | Renter-occupied |
| Less than $300 | 0 (0.0%) | 0 (0.0%) |
| $300 to $499 | 15 (3.3%) | 0 (0.0%) |
| $500 to $799 | 110 (23.9%) | 21 (27.3%) |
| $800 to $999 | 26 (5.7%) | 13 (16.9%) |
| $1,000 to $1,499 | 111 (24.1%) | 16 (20.8%) |
| $1,500 to $1,999 | 51 (11.1%) | 10 (13.0%) |
| $2,000 to $2,499 | 77 (16.7%) | 12 (15.6%) |
| $2,500 to $2,999 | 18 (3.9%) | 0 (0.0%) |
| $3,000 or more | 52 (11.3%) | 0 (0.0%) |
| Total | 460 (100.0%) | 77 (100.0%) |
Physical Housing Characteristics in Downs
Housing Structures in Downs
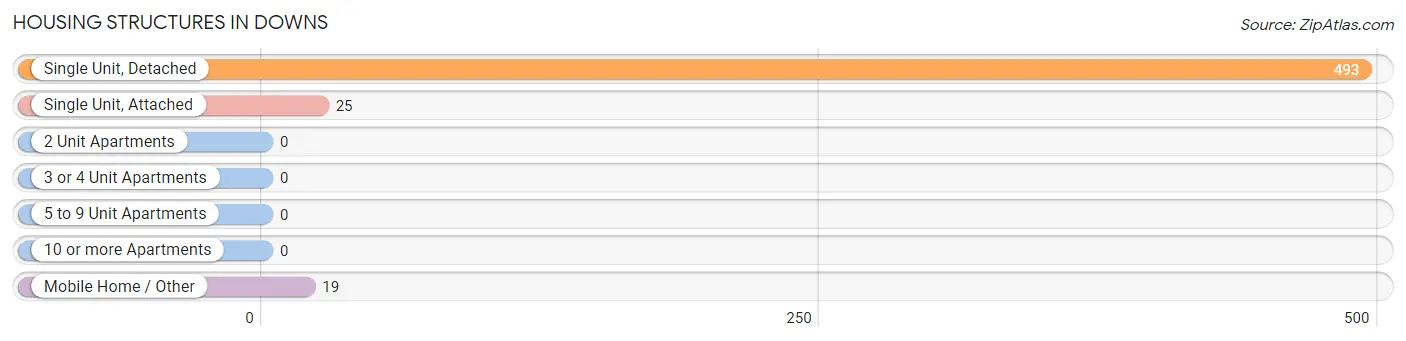
| Structure Type | # Housing Units | % Housing Units |
| Single Unit, Detached | 493 | 91.8% |
| Single Unit, Attached | 25 | 4.7% |
| 2 Unit Apartments | 0 | 0.0% |
| 3 or 4 Unit Apartments | 0 | 0.0% |
| 5 to 9 Unit Apartments | 0 | 0.0% |
| 10 or more Apartments | 0 | 0.0% |
| Mobile Home / Other | 19 | 3.5% |
| Total | 537 | 100.0% |
Housing Structures by Occupancy in Downs
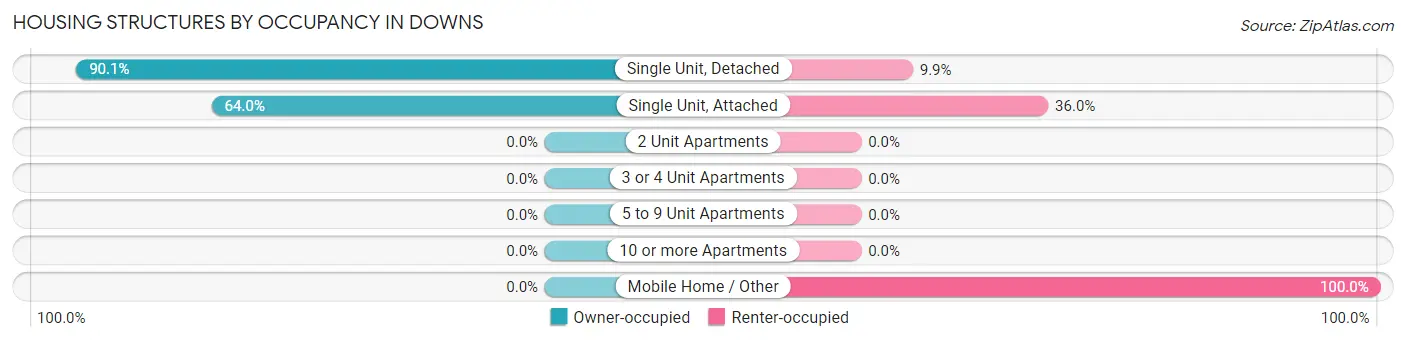
| Structure Type | Owner-occupied | Renter-occupied |
| Single Unit, Detached | 444 (90.1%) | 49 (9.9%) |
| Single Unit, Attached | 16 (64.0%) | 9 (36.0%) |
| 2 Unit Apartments | 0 (0.0%) | 0 (0.0%) |
| 3 or 4 Unit Apartments | 0 (0.0%) | 0 (0.0%) |
| 5 to 9 Unit Apartments | 0 (0.0%) | 0 (0.0%) |
| 10 or more Apartments | 0 (0.0%) | 0 (0.0%) |
| Mobile Home / Other | 0 (0.0%) | 19 (100.0%) |
| Total | 460 (85.7%) | 77 (14.3%) |
Housing Structures by Number of Rooms in Downs
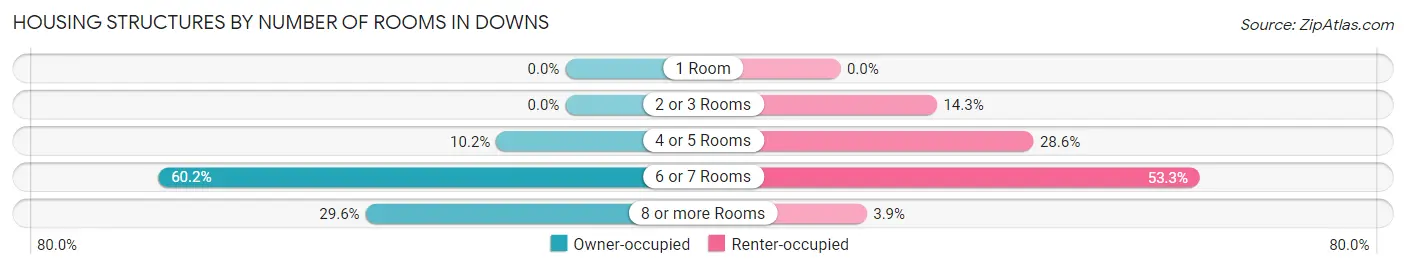
| Number of Rooms | Owner-occupied | Renter-occupied |
| 1 Room | 0 (0.0%) | 0 (0.0%) |
| 2 or 3 Rooms | 0 (0.0%) | 11 (14.3%) |
| 4 or 5 Rooms | 47 (10.2%) | 22 (28.6%) |
| 6 or 7 Rooms | 277 (60.2%) | 41 (53.2%) |
| 8 or more Rooms | 136 (29.6%) | 3 (3.9%) |
| Total | 460 (100.0%) | 77 (100.0%) |
Housing Structure by Heating Type in Downs
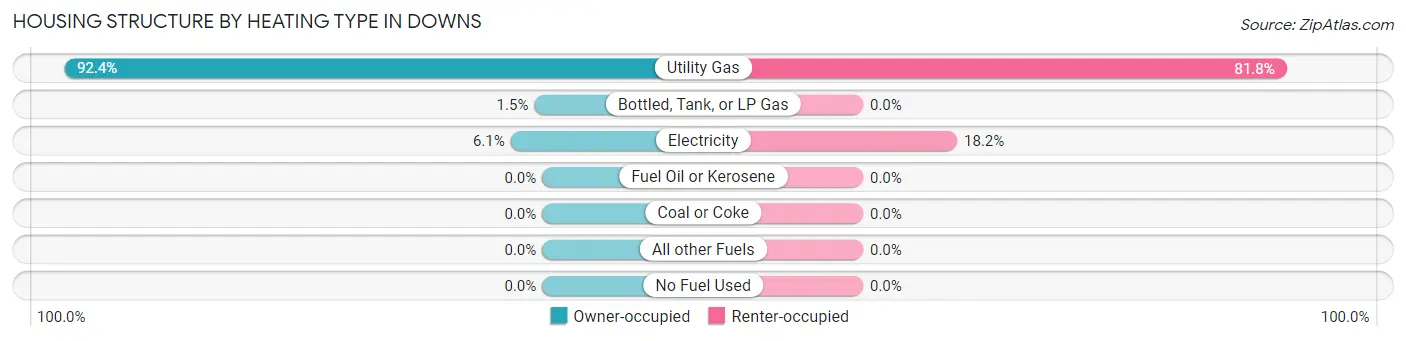
| Heating Type | Owner-occupied | Renter-occupied |
| Utility Gas | 425 (92.4%) | 63 (81.8%) |
| Bottled, Tank, or LP Gas | 7 (1.5%) | 0 (0.0%) |
| Electricity | 28 (6.1%) | 14 (18.2%) |
| Fuel Oil or Kerosene | 0 (0.0%) | 0 (0.0%) |
| Coal or Coke | 0 (0.0%) | 0 (0.0%) |
| All other Fuels | 0 (0.0%) | 0 (0.0%) |
| No Fuel Used | 0 (0.0%) | 0 (0.0%) |
| Total | 460 (100.0%) | 77 (100.0%) |
Household Vehicle Usage in Downs
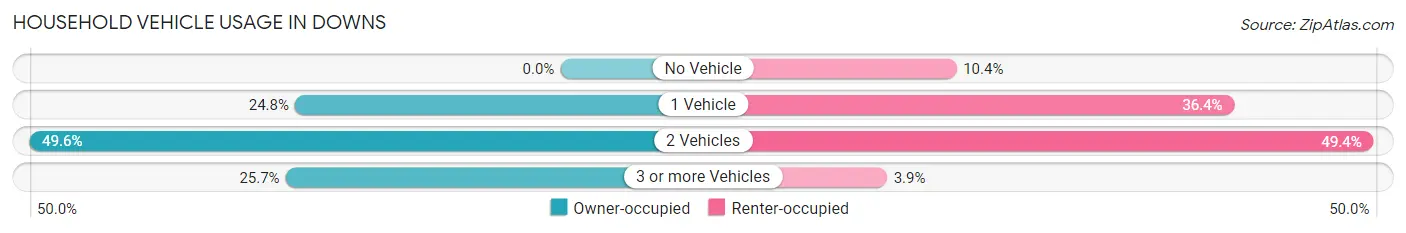
| Vehicles per Household | Owner-occupied | Renter-occupied |
| No Vehicle | 0 (0.0%) | 8 (10.4%) |
| 1 Vehicle | 114 (24.8%) | 28 (36.4%) |
| 2 Vehicles | 228 (49.6%) | 38 (49.3%) |
| 3 or more Vehicles | 118 (25.7%) | 3 (3.9%) |
| Total | 460 (100.0%) | 77 (100.0%) |
Real Estate & Mortgages in Downs
Real Estate and Mortgage Overview in Downs
| Characteristic | Without Mortgage | With Mortgage |
| Housing Units | 156 | 304 |
| Median Property Value | $228,200 | $252,300 |
| Median Household Income | $103,988 | $157 |
| Monthly Housing Costs | $757 | $52 |
| Real Estate Taxes | $4,873 | $0 |
Property Value by Mortgage Status in Downs
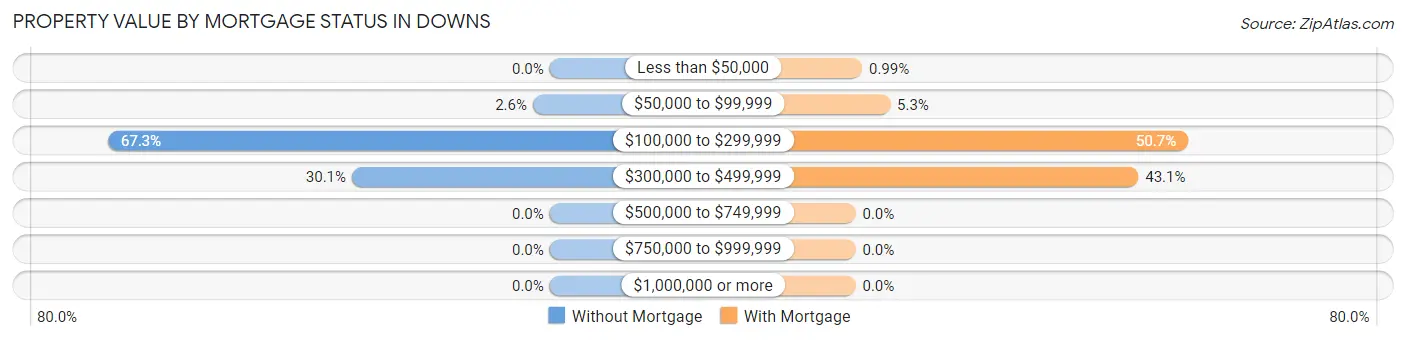
| Property Value | Without Mortgage | With Mortgage |
| Less than $50,000 | 0 (0.0%) | 3 (1.0%) |
| $50,000 to $99,999 | 4 (2.6%) | 16 (5.3%) |
| $100,000 to $299,999 | 105 (67.3%) | 154 (50.7%) |
| $300,000 to $499,999 | 47 (30.1%) | 131 (43.1%) |
| $500,000 to $749,999 | 0 (0.0%) | 0 (0.0%) |
| $750,000 to $999,999 | 0 (0.0%) | 0 (0.0%) |
| $1,000,000 or more | 0 (0.0%) | 0 (0.0%) |
| Total | 156 (100.0%) | 304 (100.0%) |
Household Income by Mortgage Status in Downs
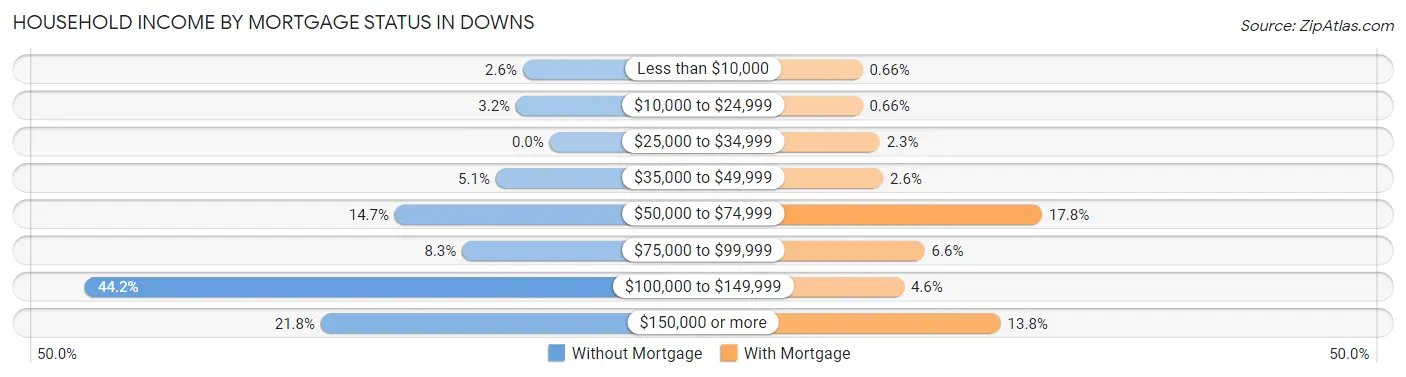
| Household Income | Without Mortgage | With Mortgage |
| Less than $10,000 | 4 (2.6%) | 2 (0.7%) |
| $10,000 to $24,999 | 5 (3.2%) | 2 (0.7%) |
| $25,000 to $34,999 | 0 (0.0%) | 7 (2.3%) |
| $35,000 to $49,999 | 8 (5.1%) | 8 (2.6%) |
| $50,000 to $74,999 | 23 (14.7%) | 54 (17.8%) |
| $75,000 to $99,999 | 13 (8.3%) | 20 (6.6%) |
| $100,000 to $149,999 | 69 (44.2%) | 14 (4.6%) |
| $150,000 or more | 34 (21.8%) | 42 (13.8%) |
| Total | 156 (100.0%) | 304 (100.0%) |
Property Value to Household Income Ratio in Downs
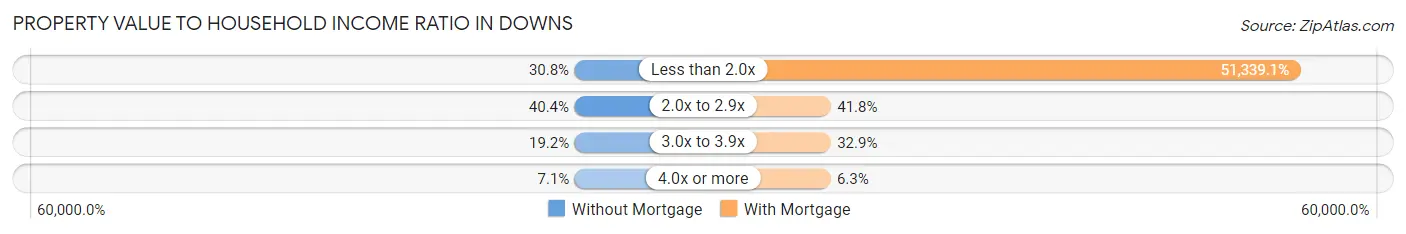
| Value-to-Income Ratio | Without Mortgage | With Mortgage |
| Less than 2.0x | 48 (30.8%) | 156,071 (51,339.1%) |
| 2.0x to 2.9x | 63 (40.4%) | 127 (41.8%) |
| 3.0x to 3.9x | 30 (19.2%) | 100 (32.9%) |
| 4.0x or more | 11 (7.0%) | 19 (6.2%) |
| Total | 156 (100.0%) | 304 (100.0%) |
Real Estate Taxes by Mortgage Status in Downs
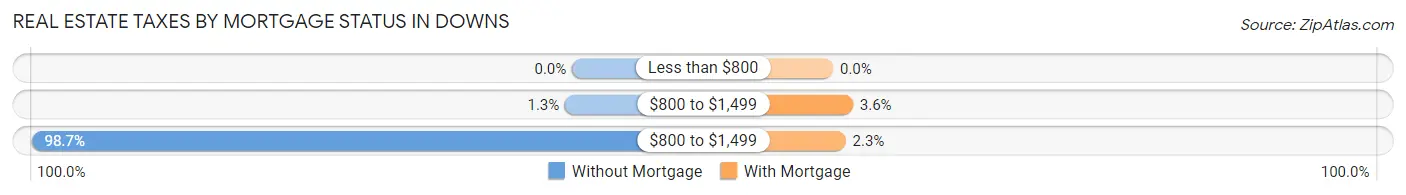
| Property Taxes | Without Mortgage | With Mortgage |
| Less than $800 | 0 (0.0%) | 0 (0.0%) |
| $800 to $1,499 | 2 (1.3%) | 11 (3.6%) |
| $800 to $1,499 | 154 (98.7%) | 7 (2.3%) |
| Total | 156 (100.0%) | 304 (100.0%) |
Health & Disability in Downs
Health Insurance Coverage by Age in Downs
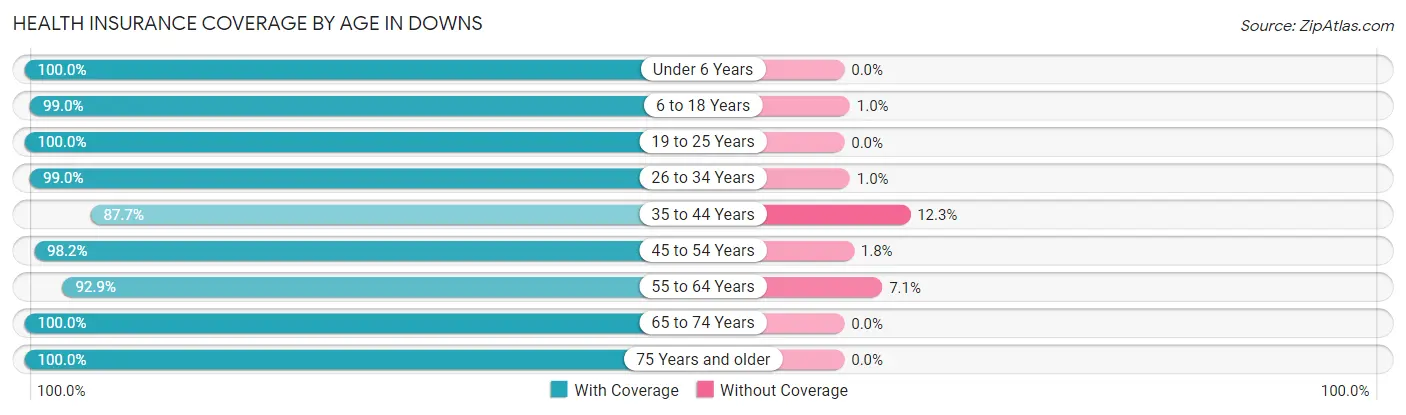
| Age Bracket | With Coverage | Without Coverage |
| Under 6 Years | 177 (100.0%) | 0 (0.0%) |
| 6 to 18 Years | 379 (99.0%) | 4 (1.0%) |
| 19 to 25 Years | 61 (100.0%) | 0 (0.0%) |
| 26 to 34 Years | 287 (99.0%) | 3 (1.0%) |
| 35 to 44 Years | 157 (87.7%) | 22 (12.3%) |
| 45 to 54 Years | 166 (98.2%) | 3 (1.8%) |
| 55 to 64 Years | 92 (92.9%) | 7 (7.1%) |
| 65 to 74 Years | 70 (100.0%) | 0 (0.0%) |
| 75 Years and older | 102 (100.0%) | 0 (0.0%) |
| Total | 1,491 (97.5%) | 39 (2.5%) |
Health Insurance Coverage by Citizenship Status in Downs
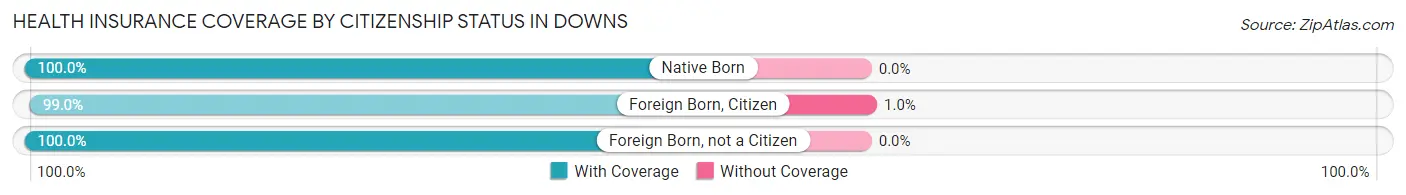
| Citizenship Status | With Coverage | Without Coverage |
| Native Born | 177 (100.0%) | 0 (0.0%) |
| Foreign Born, Citizen | 379 (99.0%) | 4 (1.0%) |
| Foreign Born, not a Citizen | 61 (100.0%) | 0 (0.0%) |
Health Insurance Coverage by Household Income in Downs
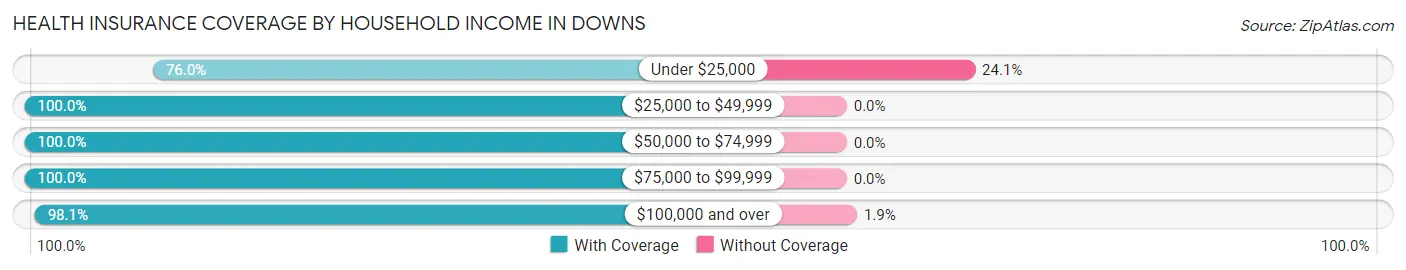
| Household Income | With Coverage | Without Coverage |
| Under $25,000 | 60 (75.9%) | 19 (24.0%) |
| $25,000 to $49,999 | 115 (100.0%) | 0 (0.0%) |
| $50,000 to $74,999 | 194 (100.0%) | 0 (0.0%) |
| $75,000 to $99,999 | 94 (100.0%) | 0 (0.0%) |
| $100,000 and over | 1,028 (98.1%) | 20 (1.9%) |
Public vs Private Health Insurance Coverage by Age in Downs
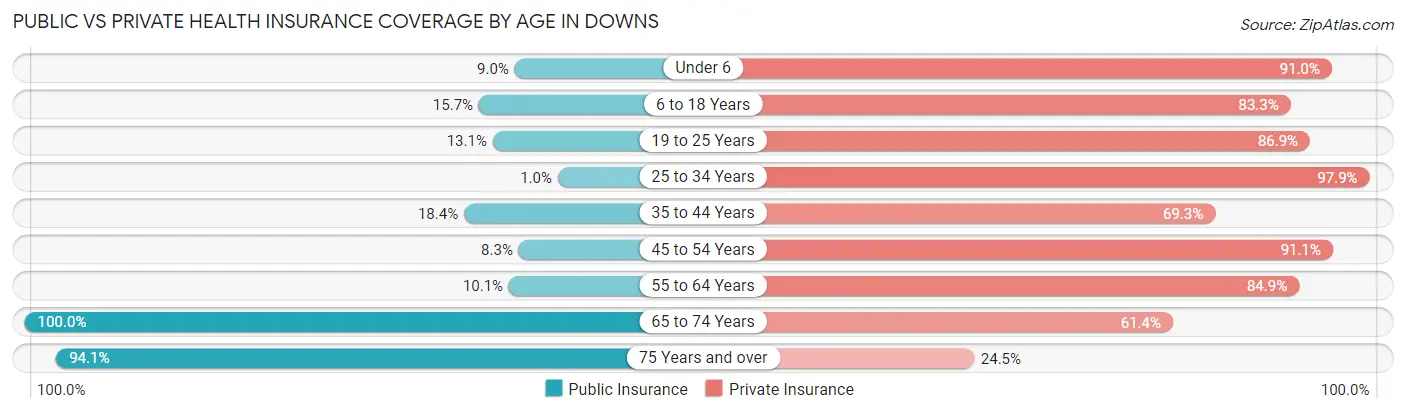
| Age Bracket | Public Insurance | Private Insurance |
| Under 6 | 16 (9.0%) | 161 (91.0%) |
| 6 to 18 Years | 60 (15.7%) | 319 (83.3%) |
| 19 to 25 Years | 8 (13.1%) | 53 (86.9%) |
| 25 to 34 Years | 3 (1.0%) | 284 (97.9%) |
| 35 to 44 Years | 33 (18.4%) | 124 (69.3%) |
| 45 to 54 Years | 14 (8.3%) | 154 (91.1%) |
| 55 to 64 Years | 10 (10.1%) | 84 (84.9%) |
| 65 to 74 Years | 70 (100.0%) | 43 (61.4%) |
| 75 Years and over | 96 (94.1%) | 25 (24.5%) |
| Total | 310 (20.3%) | 1,247 (81.5%) |
Disability Status by Sex by Age in Downs
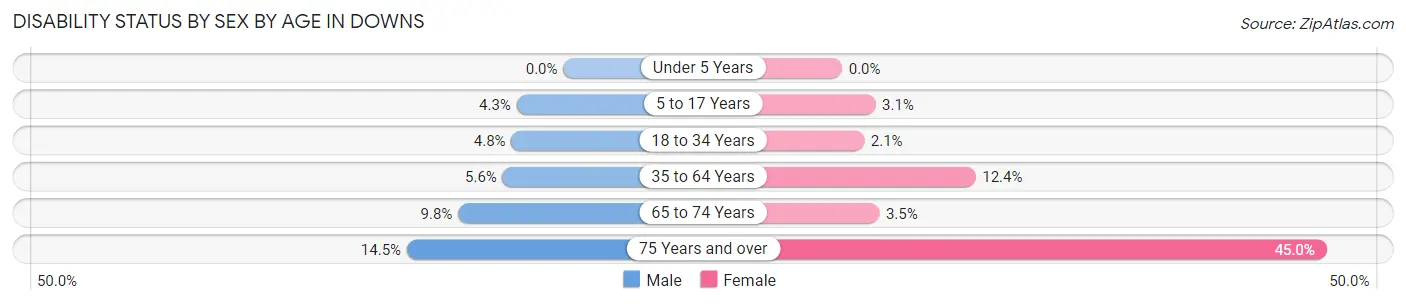
| Age Bracket | Male | Female |
| Under 5 Years | 0 (0.0%) | 0 (0.0%) |
| 5 to 17 Years | 11 (4.3%) | 5 (3.1%) |
| 18 to 34 Years | 8 (4.8%) | 4 (2.1%) |
| 35 to 64 Years | 12 (5.6%) | 29 (12.4%) |
| 65 to 74 Years | 4 (9.8%) | 1 (3.5%) |
| 75 Years and over | 9 (14.5%) | 18 (45.0%) |
Disability Class by Sex by Age in Downs
Disability Class: Hearing Difficulty
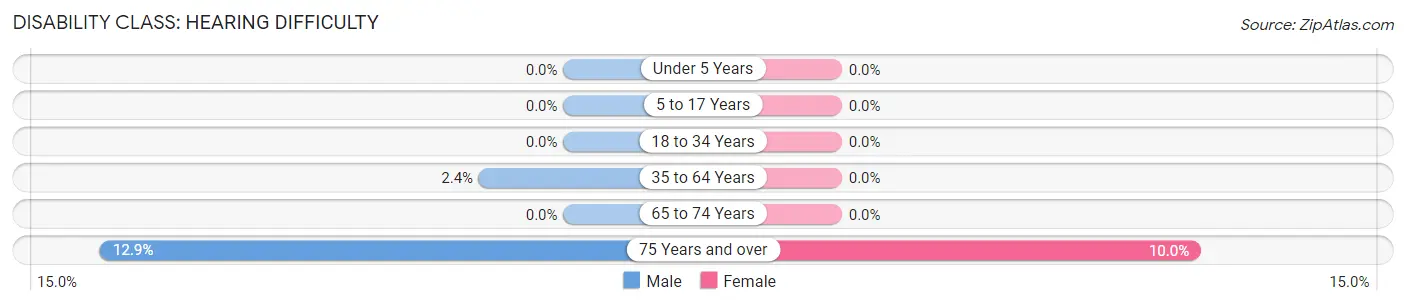
| Age Bracket | Male | Female |
| Under 5 Years | 0 (0.0%) | 0 (0.0%) |
| 5 to 17 Years | 0 (0.0%) | 0 (0.0%) |
| 18 to 34 Years | 0 (0.0%) | 0 (0.0%) |
| 35 to 64 Years | 5 (2.4%) | 0 (0.0%) |
| 65 to 74 Years | 0 (0.0%) | 0 (0.0%) |
| 75 Years and over | 8 (12.9%) | 4 (10.0%) |
Disability Class: Vision Difficulty
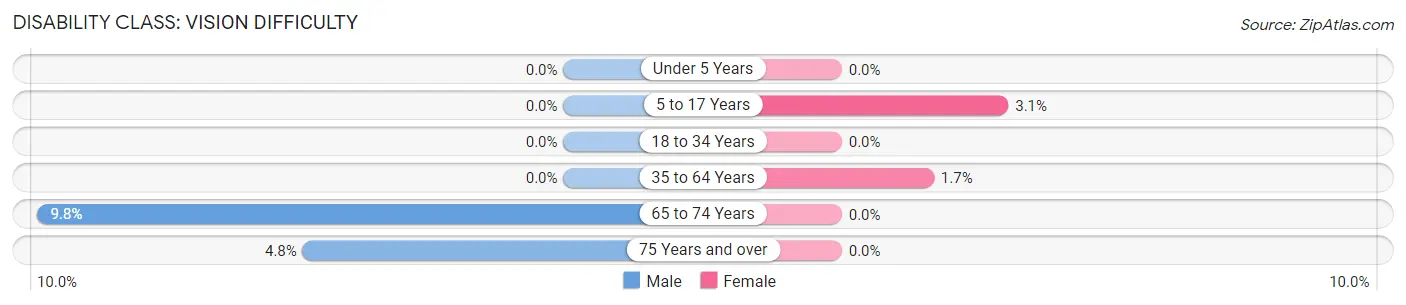
| Age Bracket | Male | Female |
| Under 5 Years | 0 (0.0%) | 0 (0.0%) |
| 5 to 17 Years | 0 (0.0%) | 5 (3.1%) |
| 18 to 34 Years | 0 (0.0%) | 0 (0.0%) |
| 35 to 64 Years | 0 (0.0%) | 4 (1.7%) |
| 65 to 74 Years | 4 (9.8%) | 0 (0.0%) |
| 75 Years and over | 3 (4.8%) | 0 (0.0%) |
Disability Class: Cognitive Difficulty
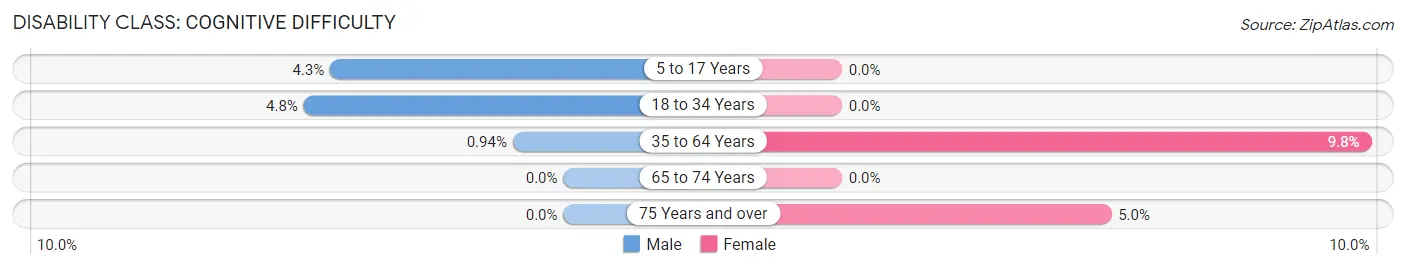
| Age Bracket | Male | Female |
| 5 to 17 Years | 11 (4.3%) | 0 (0.0%) |
| 18 to 34 Years | 8 (4.8%) | 0 (0.0%) |
| 35 to 64 Years | 2 (0.9%) | 23 (9.8%) |
| 65 to 74 Years | 0 (0.0%) | 0 (0.0%) |
| 75 Years and over | 0 (0.0%) | 2 (5.0%) |
Disability Class: Ambulatory Difficulty
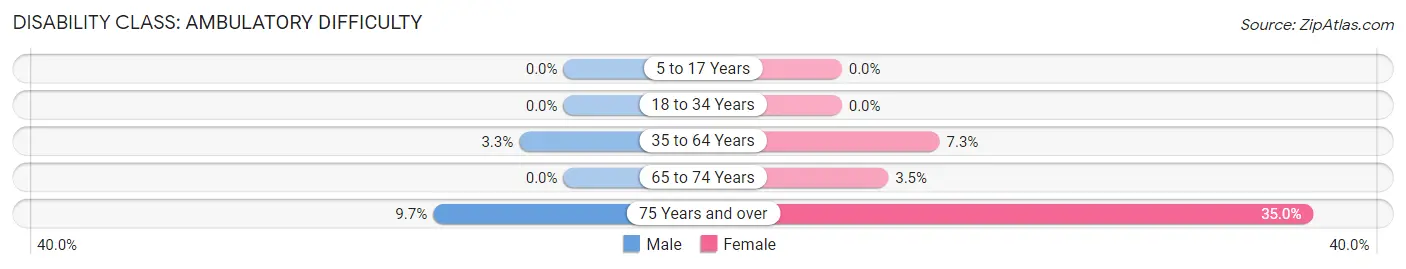
| Age Bracket | Male | Female |
| 5 to 17 Years | 0 (0.0%) | 0 (0.0%) |
| 18 to 34 Years | 0 (0.0%) | 0 (0.0%) |
| 35 to 64 Years | 7 (3.3%) | 17 (7.3%) |
| 65 to 74 Years | 0 (0.0%) | 1 (3.5%) |
| 75 Years and over | 6 (9.7%) | 14 (35.0%) |
Disability Class: Self-Care Difficulty
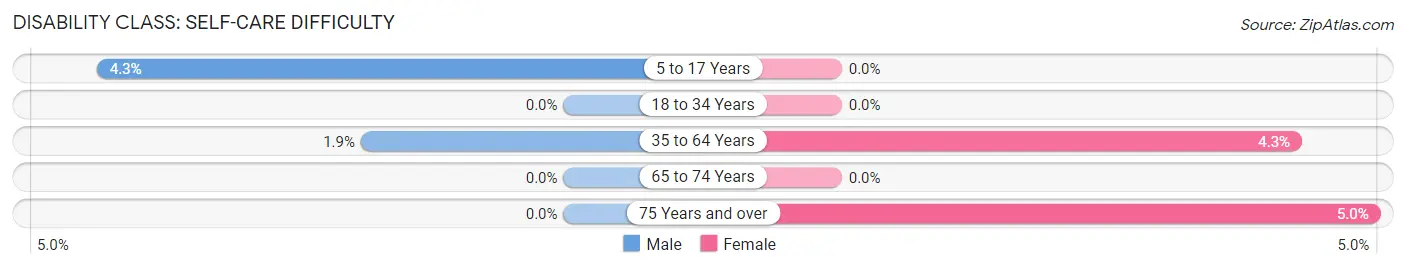
| Age Bracket | Male | Female |
| 5 to 17 Years | 11 (4.3%) | 0 (0.0%) |
| 18 to 34 Years | 0 (0.0%) | 0 (0.0%) |
| 35 to 64 Years | 4 (1.9%) | 10 (4.3%) |
| 65 to 74 Years | 0 (0.0%) | 0 (0.0%) |
| 75 Years and over | 0 (0.0%) | 2 (5.0%) |
Technology Access in Downs
Computing Device Access in Downs
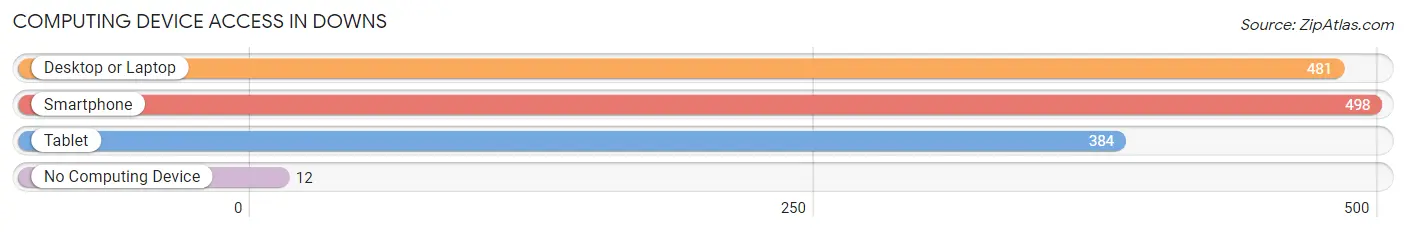
| Device Type | # Households | % Households |
| Desktop or Laptop | 481 | 89.6% |
| Smartphone | 498 | 92.7% |
| Tablet | 384 | 71.5% |
| No Computing Device | 12 | 2.2% |
| Total | 537 | 100.0% |
Internet Access in Downs
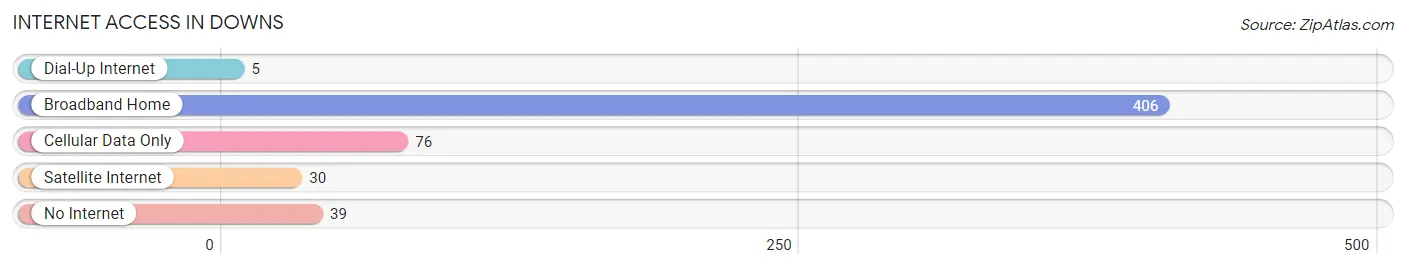
| Internet Type | # Households | % Households |
| Dial-Up Internet | 5 | 0.9% |
| Broadband Home | 406 | 75.6% |
| Cellular Data Only | 76 | 14.1% |
| Satellite Internet | 30 | 5.6% |
| No Internet | 39 | 7.3% |
| Total | 537 | 100.0% |
Downs Summary
Downs, Illinois is a small village located in McLean County, Illinois. It is situated in the central part of the state, approximately 25 miles northeast of Bloomington and about 30 miles southwest of Champaign. The village has a population of 1,845 people, according to the 2010 census.
Geography
Downs is located in the heart of the Midwest, in the central part of Illinois. It is situated in McLean County, approximately 25 miles northeast of Bloomington and about 30 miles southwest of Champaign. The village is located on the banks of the Sangamon River, which flows through the area. The village is surrounded by rolling hills and farmland, and is located in the heart of the Illinois prairie.
The village is located at an elevation of 690 feet above sea level. The climate in Downs is typical of the Midwest, with hot summers and cold winters. The average temperature in the summer is around 80 degrees Fahrenheit, while the average temperature in the winter is around 30 degrees Fahrenheit.
History
Downs was founded in 1854 by a group of settlers from Ohio. The village was named after the first settler, William Downs. The village was incorporated in 1858, and the first post office was established in 1859.
The village grew slowly over the years, and by the turn of the century, it had a population of around 500 people. The village was primarily an agricultural community, and the main crops grown were corn, wheat, and oats.
In the early 1900s, the village began to experience a period of growth. The population increased to over 1,000 people by the 1920s. During this time, the village was home to several businesses, including a bank, a hotel, a general store, and a blacksmith shop.
Economy
Downs is a small village with a population of 1,845 people, according to the 2010 census. The village is primarily a residential community, and the main industries are agriculture and retail. The village is home to several small businesses, including a grocery store, a hardware store, and a restaurant.
The village is also home to several manufacturing companies, including a plastics manufacturer, a metal fabricator, and a printing company. The village is also home to a number of farms, which produce corn, soybeans, and wheat.
Demographics
According to the 2010 census, the population of Downs is 1,845 people. The racial makeup of the village is 97.3% White, 0.7% African American, 0.3% Native American, 0.2% Asian, 0.1% Pacific Islander, and 1.4% from other races. The median household income in the village is $45,000, and the median age is 40 years.
Conclusion
Downs, Illinois is a small village located in McLean County, Illinois. It is situated in the central part of the state, approximately 25 miles northeast of Bloomington and about 30 miles southwest of Champaign. The village has a population of 1,845 people, according to the 2010 census. The village is primarily a residential community, and the main industries are agriculture and retail. The village is home to several small businesses, including a grocery store, a hardware store, and a restaurant. The racial makeup of the village is 97.3% White, 0.7% African American, 0.3% Native American, 0.2% Asian, 0.1% Pacific Islander, and 1.4% from other races. The median household income in the village is $45,000, and the median age is 40 years.
Common Questions
What is Per Capita Income in Downs?
Per Capita income in Downs is $44,117.
What is the Median Family Income in Downs?
Median Family Income in Downs is $147,833.
What is the Median Household income in Downs?
Median Household Income in Downs is $104,890.
What is Income or Wage Gap in Downs?
Income or Wage Gap in Downs is 41.2%.
Women in Downs earn 58.8 cents for every dollar earned by a man.
What is Inequality or Gini Index in Downs?
Inequality or Gini Index in Downs is 0.37.
What is the Total Population of Downs?
Total Population of Downs is 1,530.
What is the Total Male Population of Downs?
Total Male Population of Downs is 765.
What is the Total Female Population of Downs?
Total Female Population of Downs is 765.
What is the Ratio of Males per 100 Females in Downs?
There are 100.00 Males per 100 Females in Downs.
What is the Ratio of Females per 100 Males in Downs?
There are 100.00 Females per 100 Males in Downs.
What is the Median Population Age in Downs?
Median Population Age in Downs is 33.5 Years.
What is the Average Family Size in Downs
Average Family Size in Downs is 3.5 People.
What is the Average Household Size in Downs
Average Household Size in Downs is 2.9 People.
How Large is the Labor Force in Downs?
There are 758 People in the Labor Forcein in Downs.
What is the Percentage of People in the Labor Force in Downs?
75.3% of People are in the Labor Force in Downs.
What is the Unemployment Rate in Downs?
Unemployment Rate in Downs is 0.5%.