Cities with the Highest Percentage of Population Employed in Food Preparation & Serving in Georgia
RELATED REPORTS & OPTIONS
Food Preparation & Serving
Georgia
Compare Cities
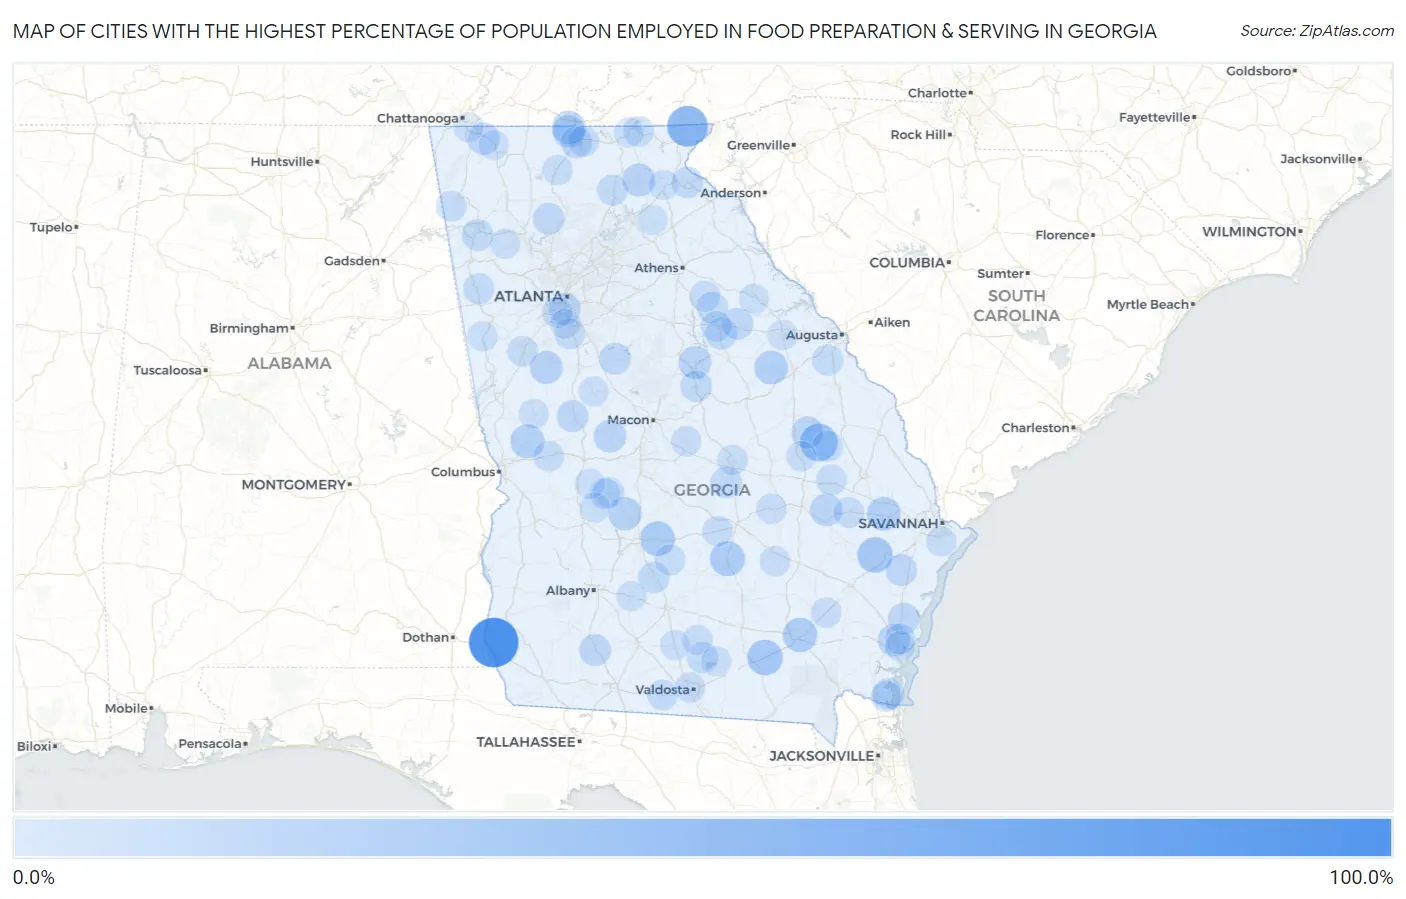
Map of Cities with the Highest Percentage of Population Employed in Food Preparation & Serving in Georgia
0.0%
100.0%
Cities with the Highest Percentage of Population Employed in Food Preparation & Serving in Georgia
| City | % Employed | vs State | vs National | |
| 1. | Cedar Springs | 87.5% | 5.1%(+82.4)#1 | 5.3%(+82.2)#37 |
| 2. | Sky Valley | 51.0% | 5.1%(+45.9)#2 | 5.3%(+45.7)#105 |
| 3. | Canoochee | 38.8% | 5.1%(+33.6)#3 | 5.3%(+33.5)#199 |
| 4. | Godfrey | 35.7% | 5.1%(+30.6)#4 | 5.3%(+30.4)#240 |
| 5. | Gough | 30.8% | 5.1%(+25.6)#5 | 5.3%(+25.5)#325 |
| 6. | Argyle | 30.5% | 5.1%(+25.4)#6 | 5.3%(+25.2)#332 |
| 7. | Gumbranch | 30.4% | 5.1%(+25.3)#7 | 5.3%(+25.1)#339 |
| 8. | Jacksonville | 28.0% | 5.1%(+22.9)#8 | 5.3%(+22.7)#399 |
| 9. | Seville | 27.8% | 5.1%(+22.6)#9 | 5.3%(+22.5)#407 |
| 10. | Sunnyside | 25.9% | 5.1%(+20.8)#10 | 5.3%(+20.7)#474 |
| 11. | Waverly Hall | 24.4% | 5.1%(+19.2)#11 | 5.3%(+19.1)#532 |
| 12. | Pembroke | 23.7% | 5.1%(+18.6)#12 | 5.3%(+18.4)#566 |
| 13. | Gibson | 23.3% | 5.1%(+18.1)#13 | 5.3%(+18.0)#597 |
| 14. | Mccaysville | 22.2% | 5.1%(+17.0)#14 | 5.3%(+16.9)#673 |
| 15. | Lilly | 21.6% | 5.1%(+16.5)#15 | 5.3%(+16.3)#703 |
| 16. | Wildwood | 20.8% | 5.1%(+15.7)#16 | 5.3%(+15.5)#751 |
| 17. | Cleveland | 20.2% | 5.1%(+15.1)#17 | 5.3%(+14.9)#814 |
| 18. | Haralson | 20.0% | 5.1%(+14.9)#18 | 5.3%(+14.7)#837 |
| 19. | Crooked Creek | 19.0% | 5.1%(+13.9)#19 | 5.3%(+13.7)#945 |
| 20. | Epworth | 19.0% | 5.1%(+13.8)#20 | 5.3%(+13.7)#950 |
| 21. | Collins | 18.7% | 5.1%(+13.6)#21 | 5.3%(+13.4)#983 |
| 22. | Roberta | 18.6% | 5.1%(+13.4)#22 | 5.3%(+13.3)#1,002 |
| 23. | Naylor | 18.5% | 5.1%(+13.4)#23 | 5.3%(+13.2)#1,006 |
| 24. | Summertown | 17.4% | 5.1%(+12.2)#24 | 5.3%(+12.1)#1,146 |
| 25. | Ringgold | 17.0% | 5.1%(+11.9)#25 | 5.3%(+11.7)#1,203 |
| 26. | Dock Junction | 16.9% | 5.1%(+11.7)#26 | 5.3%(+11.6)#1,220 |
| 27. | Jackson | 16.6% | 5.1%(+11.4)#27 | 5.3%(+11.3)#1,287 |
| 28. | Hapeville | 16.4% | 5.1%(+11.3)#28 | 5.3%(+11.1)#1,308 |
| 29. | Pelham | 16.4% | 5.1%(+11.2)#29 | 5.3%(+11.1)#1,322 |
| 30. | White Plains | 16.2% | 5.1%(+11.0)#30 | 5.3%(+10.9)#1,361 |
| 31. | Darien | 16.0% | 5.1%(+10.9)#31 | 5.3%(+10.7)#1,402 |
| 32. | Lincoln Park | 16.0% | 5.1%(+10.9)#32 | 5.3%(+10.7)#1,406 |
| 33. | Riceboro | 15.9% | 5.1%(+10.8)#33 | 5.3%(+10.6)#1,420 |
| 34. | Blue Ridge | 15.8% | 5.1%(+10.6)#34 | 5.3%(+10.5)#1,458 |
| 35. | Waleska | 15.7% | 5.1%(+10.6)#35 | 5.3%(+10.4)#1,470 |
| 36. | Crawfordville | 15.7% | 5.1%(+10.5)#36 | 5.3%(+10.4)#1,479 |
| 37. | Kings Bay Base | 15.4% | 5.1%(+10.2)#37 | 5.3%(+10.1)#1,526 |
| 38. | Rentz | 15.4% | 5.1%(+10.2)#38 | 5.3%(+10.1)#1,532 |
| 39. | Milledgeville | 15.0% | 5.1%(+9.90)#39 | 5.3%(+9.76)#1,617 |
| 40. | Toccoa | 15.0% | 5.1%(+9.84)#40 | 5.3%(+9.69)#1,639 |
| 41. | Lindale | 14.9% | 5.1%(+9.80)#41 | 5.3%(+9.66)#1,652 |
| 42. | Sycamore | 14.4% | 5.1%(+9.30)#42 | 5.3%(+9.16)#1,782 |
| 43. | Ray City | 14.1% | 5.1%(+8.98)#43 | 5.3%(+8.84)#1,875 |
| 44. | Woodville | 14.1% | 5.1%(+8.96)#44 | 5.3%(+8.82)#1,882 |
| 45. | Crescent | 13.3% | 5.1%(+8.19)#45 | 5.3%(+8.05)#2,124 |
| 46. | Buchanan | 13.2% | 5.1%(+8.09)#46 | 5.3%(+7.95)#2,168 |
| 47. | Dahlonega | 13.2% | 5.1%(+8.07)#47 | 5.3%(+7.92)#2,174 |
| 48. | Hephzibah | 13.2% | 5.1%(+8.06)#48 | 5.3%(+7.92)#2,180 |
| 49. | Webster County Unified Government | 13.2% | 5.1%(+8.05)#49 | 5.3%(+7.91)#2,184 |
| 50. | Kennesaw State University | 13.1% | 5.1%(+8.00)#50 | 5.3%(+7.86)#2,204 |
| 51. | Garfield | 13.1% | 5.1%(+7.95)#51 | 5.3%(+7.81)#2,217 |
| 52. | Smarr | 13.0% | 5.1%(+7.87)#52 | 5.3%(+7.73)#2,253 |
| 53. | Montezuma | 13.0% | 5.1%(+7.82)#53 | 5.3%(+7.68)#2,273 |
| 54. | Rebecca | 12.8% | 5.1%(+7.69)#54 | 5.3%(+7.55)#2,330 |
| 55. | Morganton | 12.8% | 5.1%(+7.66)#55 | 5.3%(+7.51)#2,347 |
| 56. | Oglethorpe | 12.7% | 5.1%(+7.59)#56 | 5.3%(+7.45)#2,378 |
| 57. | St Marys | 12.6% | 5.1%(+7.46)#57 | 5.3%(+7.32)#2,434 |
| 58. | Maxeys | 12.6% | 5.1%(+7.41)#58 | 5.3%(+7.27)#2,461 |
| 59. | Geneva | 12.5% | 5.1%(+7.36)#59 | 5.3%(+7.21)#2,504 |
| 60. | Metter | 12.2% | 5.1%(+7.09)#60 | 5.3%(+6.95)#2,628 |
| 61. | Irondale | 12.2% | 5.1%(+7.09)#61 | 5.3%(+6.95)#2,629 |
| 62. | Claxton | 12.2% | 5.1%(+7.04)#62 | 5.3%(+6.90)#2,658 |
| 63. | Lyerly | 12.0% | 5.1%(+6.89)#63 | 5.3%(+6.75)#2,734 |
| 64. | Siloam | 11.8% | 5.1%(+6.66)#64 | 5.3%(+6.52)#2,876 |
| 65. | East Newnan | 11.8% | 5.1%(+6.66)#65 | 5.3%(+6.52)#2,878 |
| 66. | Country Club Estates | 11.8% | 5.1%(+6.65)#66 | 5.3%(+6.51)#2,881 |
| 67. | College Park | 11.8% | 5.1%(+6.61)#67 | 5.3%(+6.47)#2,904 |
| 68. | Berry College | 11.7% | 5.1%(+6.58)#68 | 5.3%(+6.44)#2,922 |
| 69. | Quitman | 11.7% | 5.1%(+6.56)#69 | 5.3%(+6.41)#2,943 |
| 70. | Milan | 11.7% | 5.1%(+6.52)#70 | 5.3%(+6.38)#2,960 |
| 71. | Hiawassee | 11.6% | 5.1%(+6.49)#71 | 5.3%(+6.35)#2,982 |
| 72. | Satilla | 11.6% | 5.1%(+6.43)#72 | 5.3%(+6.28)#3,027 |
| 73. | Jeffersonville | 11.1% | 5.1%(+5.93)#73 | 5.3%(+5.78)#3,349 |
| 74. | East Ellijay | 11.1% | 5.1%(+5.91)#74 | 5.3%(+5.77)#3,356 |
| 75. | Mount Vernon | 11.0% | 5.1%(+5.83)#75 | 5.3%(+5.69)#3,405 |
| 76. | Georgetown Quitman County Unified Government | 10.9% | 5.1%(+5.71)#76 | 5.3%(+5.57)#3,478 |
| 77. | Nashville | 10.8% | 5.1%(+5.61)#77 | 5.3%(+5.47)#3,543 |
| 78. | Offerman | 10.7% | 5.1%(+5.57)#78 | 5.3%(+5.43)#3,570 |
| 79. | Dublin | 10.5% | 5.1%(+5.38)#79 | 5.3%(+5.24)#3,708 |
| 80. | Remerton | 10.4% | 5.1%(+5.28)#80 | 5.3%(+5.14)#3,778 |
| 81. | Swainsboro | 10.4% | 5.1%(+5.27)#81 | 5.3%(+5.13)#3,779 |
| 82. | Montgomery | 10.4% | 5.1%(+5.21)#82 | 5.3%(+5.06)#3,830 |
| 83. | Lakeland | 10.3% | 5.1%(+5.13)#83 | 5.3%(+4.99)#3,878 |
| 84. | Demorest | 10.2% | 5.1%(+5.10)#84 | 5.3%(+4.96)#3,900 |
| 85. | Brunswick | 10.2% | 5.1%(+5.09)#85 | 5.3%(+4.95)#3,914 |
| 86. | Thomson | 10.2% | 5.1%(+5.08)#86 | 5.3%(+4.94)#3,922 |
| 87. | Ideal | 10.2% | 5.1%(+5.05)#87 | 5.3%(+4.91)#3,950 |
| 88. | Tunnel Hill | 10.1% | 5.1%(+4.92)#88 | 5.3%(+4.78)#4,048 |
| 89. | Roopville | 10.0% | 5.1%(+4.86)#89 | 5.3%(+4.71)#4,096 |
| 90. | Andersonville | 10.0% | 5.1%(+4.86)#90 | 5.3%(+4.71)#4,102 |
| 91. | Euharlee | 9.9% | 5.1%(+4.79)#91 | 5.3%(+4.64)#4,167 |
| 92. | Sparks | 9.9% | 5.1%(+4.73)#92 | 5.3%(+4.59)#4,208 |
| 93. | Young Harris | 9.8% | 5.1%(+4.69)#93 | 5.3%(+4.54)#4,242 |
| 94. | Barnesville | 9.8% | 5.1%(+4.65)#94 | 5.3%(+4.51)#4,269 |
| 95. | Gillsville | 9.7% | 5.1%(+4.56)#95 | 5.3%(+4.42)#4,356 |
| 96. | Lakeview | 9.7% | 5.1%(+4.54)#96 | 5.3%(+4.40)#4,365 |
| 97. | Riverdale | 9.7% | 5.1%(+4.53)#97 | 5.3%(+4.39)#4,368 |
| 98. | Washington | 9.7% | 5.1%(+4.51)#98 | 5.3%(+4.37)#4,383 |
| 99. | Sylvester | 9.7% | 5.1%(+4.51)#99 | 5.3%(+4.37)#4,389 |
| 100. | Warm Springs | 9.6% | 5.1%(+4.50)#100 | 5.3%(+4.36)#4,398 |
Common Questions
What are the Top 10 Cities with the Highest Percentage of Population Employed in Food Preparation & Serving in Georgia?
Top 10 Cities with the Highest Percentage of Population Employed in Food Preparation & Serving in Georgia are:
#1
87.5%
#2
51.0%
#3
38.8%
#4
30.5%
#5
30.4%
#6
28.0%
#7
27.8%
#8
25.9%
#9
24.4%
#10
23.7%
What city has the Highest Percentage of Population Employed in Food Preparation & Serving in Georgia?
Cedar Springs has the Highest Percentage of Population Employed in Food Preparation & Serving in Georgia with 87.5%.
What is the Percentage of Population Employed in Food Preparation & Serving in the State of Georgia?
Percentage of Population Employed in Food Preparation & Serving in Georgia is 5.1%.
What is the Percentage of Population Employed in Food Preparation & Serving in the United States?
Percentage of Population Employed in Food Preparation & Serving in the United States is 5.3%.