Warm Springs, GA Map & Demographics
Warm Springs Map
Warm Springs Overview
$21,704
PER CAPITA INCOME
$52,885
AVG FAMILY INCOME
$44,792
AVG HOUSEHOLD INCOME
31.7%
WAGE / INCOME GAP [ % ]
68.3¢/ $1
WAGE / INCOME GAP [ $ ]
0.43
INEQUALITY / GINI INDEX
543
TOTAL POPULATION
244
MALE POPULATION
299
FEMALE POPULATION
81.61
MALES / 100 FEMALES
122.54
FEMALES / 100 MALES
47.1
MEDIAN AGE
3.3
AVG FAMILY SIZE
2.8
AVG HOUSEHOLD SIZE
205
LABOR FORCE [ PEOPLE ]
47.7%
PERCENT IN LABOR FORCE
3.9%
UNEMPLOYMENT RATE
Warm Springs Zip Codes
Warm Springs Area Codes
Income in Warm Springs
Income Overview in Warm Springs
Per Capita Income in Warm Springs is $21,704, while median incomes of families and households are $52,885 and $44,792 respectively.
| Characteristic | Number | Measure |
| Per Capita Income | 543 | $21,704 |
| Median Family Income | 120 | $52,885 |
| Mean Family Income | 120 | $62,708 |
| Median Household Income | 165 | $44,792 |
| Mean Household Income | 165 | $55,753 |
| Income Deficit | 120 | $0 |
| Wage / Income Gap (%) | 543 | 31.75% |
| Wage / Income Gap ($) | 543 | 68.25¢ per $1 |
| Gini / Inequality Index | 543 | 0.43 |
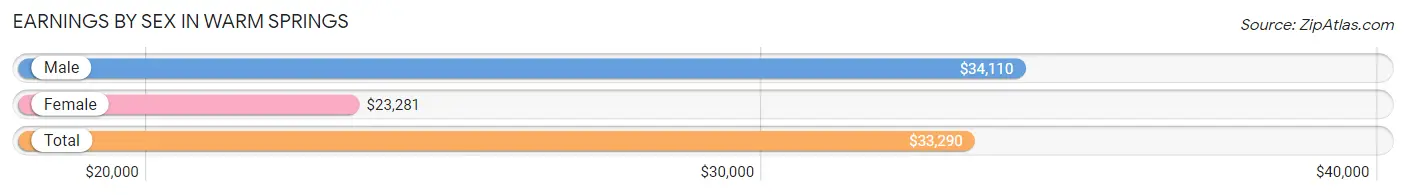
Earnings by Sex in Warm Springs
Average Earnings in Warm Springs are $33,290, $34,110 for men and $23,281 for women, a difference of 31.8%.
| Sex | Number | Average Earnings |
| Male | 118 (56.5%) | $34,110 |
| Female | 91 (43.5%) | $23,281 |
| Total | 209 (100.0%) | $33,290 |
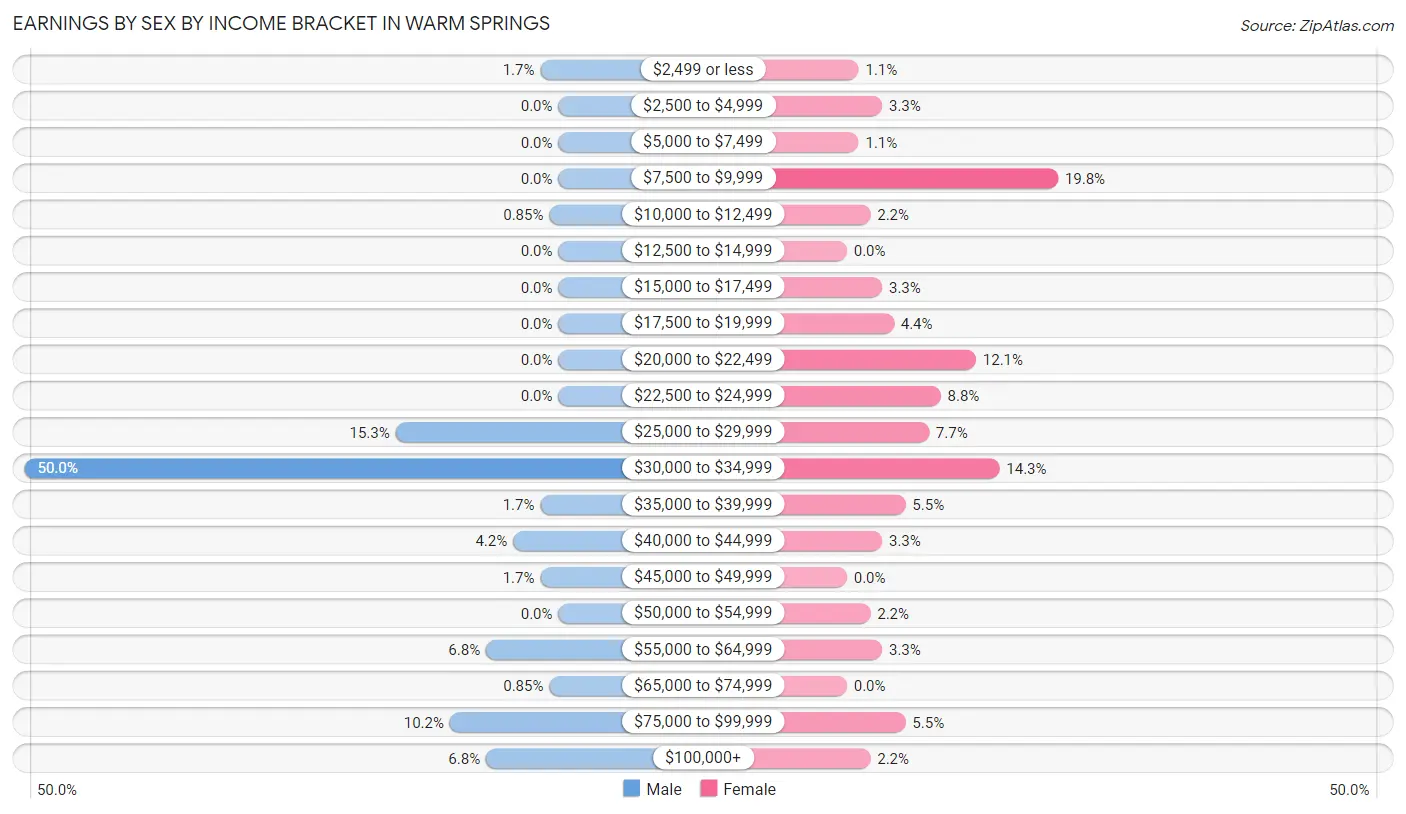
Earnings by Sex by Income Bracket in Warm Springs
The most common earnings brackets in Warm Springs are $30,000 to $34,999 for men (59 | 50.0%) and $7,500 to $9,999 for women (18 | 19.8%).
| Income | Male | Female |
| $2,499 or less | 2 (1.7%) | 1 (1.1%) |
| $2,500 to $4,999 | 0 (0.0%) | 3 (3.3%) |
| $5,000 to $7,499 | 0 (0.0%) | 1 (1.1%) |
| $7,500 to $9,999 | 0 (0.0%) | 18 (19.8%) |
| $10,000 to $12,499 | 1 (0.9%) | 2 (2.2%) |
| $12,500 to $14,999 | 0 (0.0%) | 0 (0.0%) |
| $15,000 to $17,499 | 0 (0.0%) | 3 (3.3%) |
| $17,500 to $19,999 | 0 (0.0%) | 4 (4.4%) |
| $20,000 to $22,499 | 0 (0.0%) | 11 (12.1%) |
| $22,500 to $24,999 | 0 (0.0%) | 8 (8.8%) |
| $25,000 to $29,999 | 18 (15.2%) | 7 (7.7%) |
| $30,000 to $34,999 | 59 (50.0%) | 13 (14.3%) |
| $35,000 to $39,999 | 2 (1.7%) | 5 (5.5%) |
| $40,000 to $44,999 | 5 (4.2%) | 3 (3.3%) |
| $45,000 to $49,999 | 2 (1.7%) | 0 (0.0%) |
| $50,000 to $54,999 | 0 (0.0%) | 2 (2.2%) |
| $55,000 to $64,999 | 8 (6.8%) | 3 (3.3%) |
| $65,000 to $74,999 | 1 (0.9%) | 0 (0.0%) |
| $75,000 to $99,999 | 12 (10.2%) | 5 (5.5%) |
| $100,000+ | 8 (6.8%) | 2 (2.2%) |
| Total | 118 (100.0%) | 91 (100.0%) |
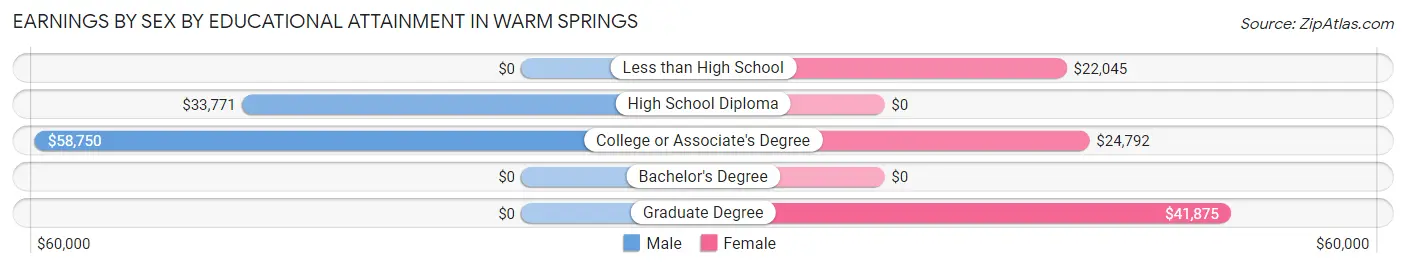
Earnings by Sex by Educational Attainment in Warm Springs
Average earnings in Warm Springs are $34,110 for men and $24,219 for women, a difference of 29.0%. Men with an educational attainment of college or associate's degree enjoy the highest average annual earnings of $58,750, while those with high school diploma education earn the least with $33,771. Women with an educational attainment of graduate degree earn the most with the average annual earnings of $41,875, while those with less than high school education have the smallest earnings of $22,045.
| Educational Attainment | Male Income | Female Income |
| Less than High School | - | - |
| High School Diploma | $33,771 | $0 |
| College or Associate's Degree | $58,750 | $24,792 |
| Bachelor's Degree | - | - |
| Graduate Degree | - | - |
| Total | $34,110 | $24,219 |
Family Income in Warm Springs
Family Income Brackets in Warm Springs
According to the Warm Springs family income data, there are 30 families falling into the $50,000 to $74,999 income range, which is the most common income bracket and makes up 25.0% of all families.
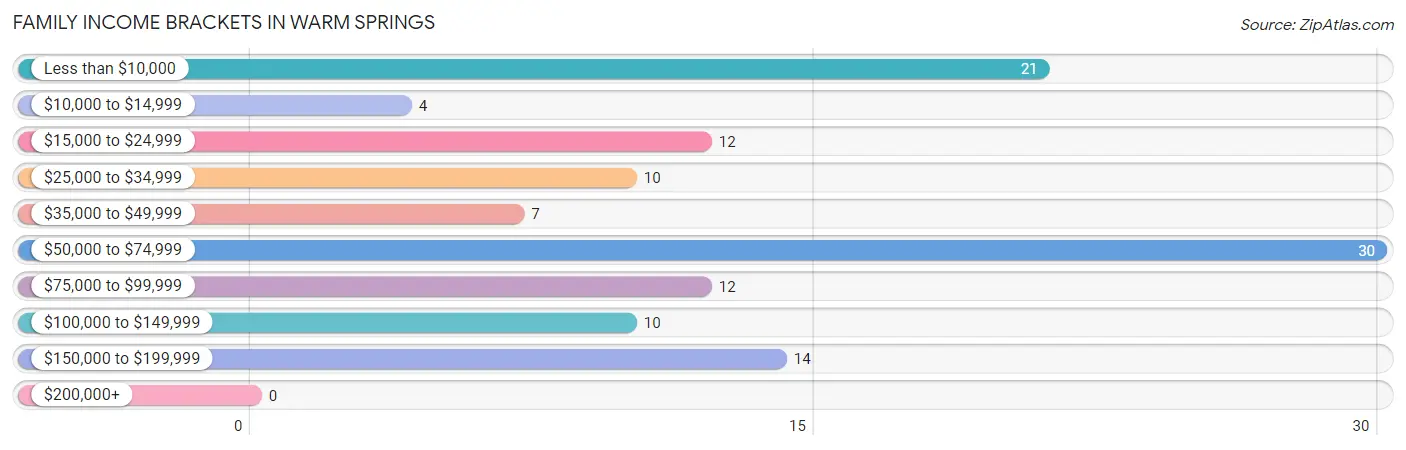
| Income Bracket | # Families | % Families |
| Less than $10,000 | 21 | 17.5% |
| $10,000 to $14,999 | 4 | 3.3% |
| $15,000 to $24,999 | 12 | 10.0% |
| $25,000 to $34,999 | 10 | 8.3% |
| $35,000 to $49,999 | 7 | 5.8% |
| $50,000 to $74,999 | 30 | 25.0% |
| $75,000 to $99,999 | 12 | 10.0% |
| $100,000 to $149,999 | 10 | 8.3% |
| $150,000 to $199,999 | 14 | 11.7% |
| $200,000+ | 0 | 0.0% |
Family Income by Famaliy Size in Warm Springs
5-person families (8 | 6.7%) account for the highest median family income in Warm Springs with $142,500 per family, while 5-person families (8 | 6.7%) have the highest median income of $28,500 per family member.
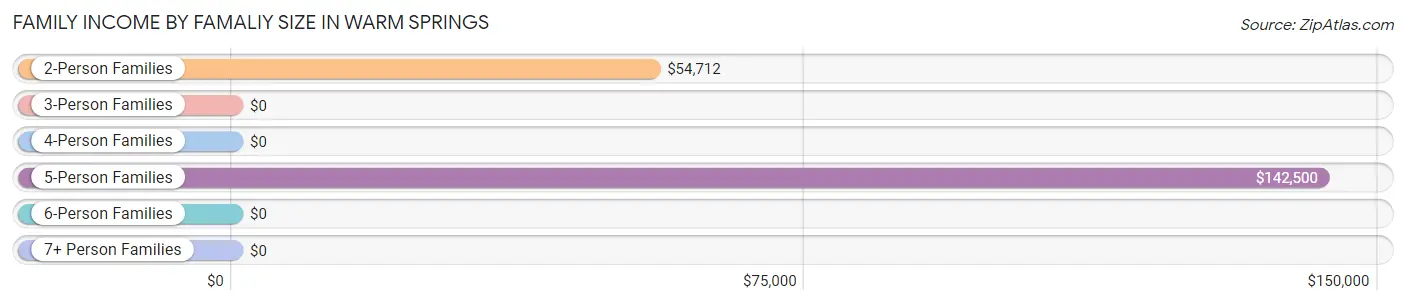
| Income Bracket | # Families | Median Income |
| 2-Person Families | 77 (64.2%) | $54,712 |
| 3-Person Families | 5 (4.2%) | $0 |
| 4-Person Families | 26 (21.7%) | $0 |
| 5-Person Families | 8 (6.7%) | $142,500 |
| 6-Person Families | 0 (0.0%) | $0 |
| 7+ Person Families | 4 (3.3%) | $0 |
| Total | 120 (100.0%) | $52,885 |
Family Income by Number of Earners in Warm Springs
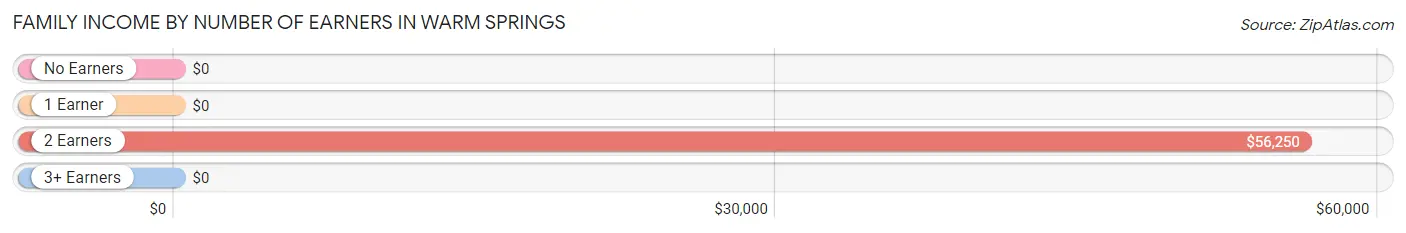
| Number of Earners | # Families | Median Income |
| No Earners | 30 (25.0%) | $0 |
| 1 Earner | 40 (33.3%) | $0 |
| 2 Earners | 48 (40.0%) | $56,250 |
| 3+ Earners | 2 (1.7%) | $0 |
| Total | 120 (100.0%) | $52,885 |
Household Income in Warm Springs
Household Income Brackets in Warm Springs
With 34 households falling in the category, the $50,000 to $74,999 income range is the most frequent in Warm Springs, accounting for 20.6% of all households.
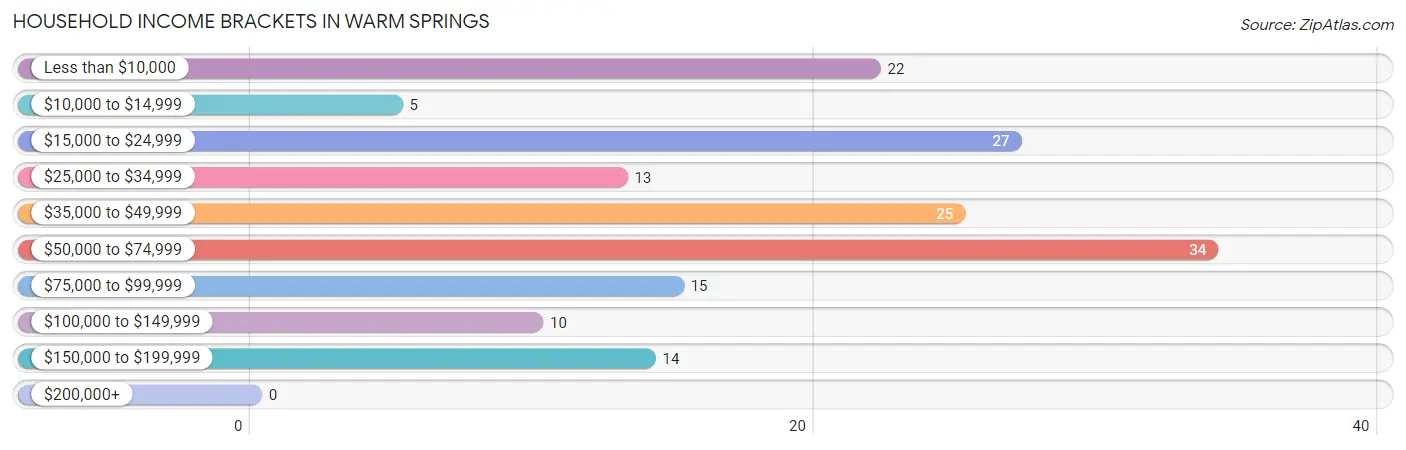
| Income Bracket | # Households | % Households |
| Less than $10,000 | 22 | 13.3% |
| $10,000 to $14,999 | 5 | 3.0% |
| $15,000 to $24,999 | 27 | 16.4% |
| $25,000 to $34,999 | 13 | 7.9% |
| $35,000 to $49,999 | 25 | 15.2% |
| $50,000 to $74,999 | 34 | 20.6% |
| $75,000 to $99,999 | 15 | 9.1% |
| $100,000 to $149,999 | 10 | 6.1% |
| $150,000 to $199,999 | 14 | 8.5% |
| $200,000+ | 0 | 0.0% |
Household Income by Householder Age in Warm Springs
The median household income in Warm Springs is $44,792, with the highest median household income of $53,750 found in the 45 to 64 years age bracket for the primary householder. A total of 75 households (45.5%) fall into this category. Meanwhile, the 15 to 24 years age bracket for the primary householder has the lowest median household income of $0, with 2 households (1.2%) in this group.
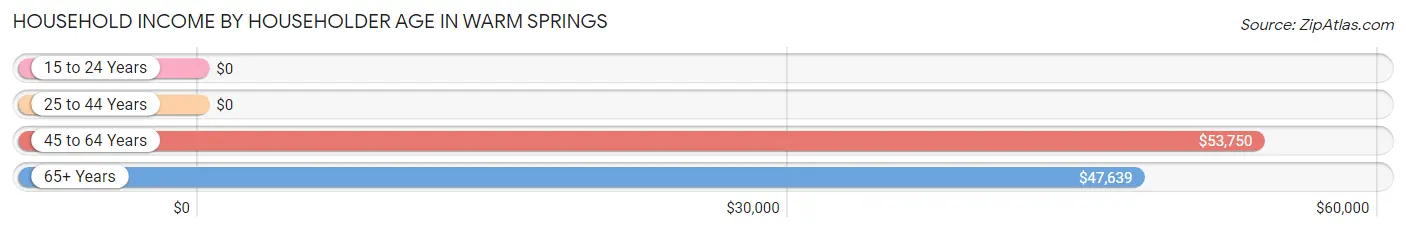
| Income Bracket | # Households | Median Income |
| 15 to 24 Years | 2 (1.2%) | $0 |
| 25 to 44 Years | 37 (22.4%) | $0 |
| 45 to 64 Years | 75 (45.5%) | $53,750 |
| 65+ Years | 51 (30.9%) | $47,639 |
| Total | 165 (100.0%) | $44,792 |
Poverty in Warm Springs
Income Below Poverty by Sex and Age in Warm Springs
With 18.3% poverty level for males and 37.4% for females among the residents of Warm Springs, 15 year old males and 16 and 17 year old females are the most vulnerable to poverty, with 3 males (100.0%) and 12 females (85.7%) in their respective age groups living below the poverty level.
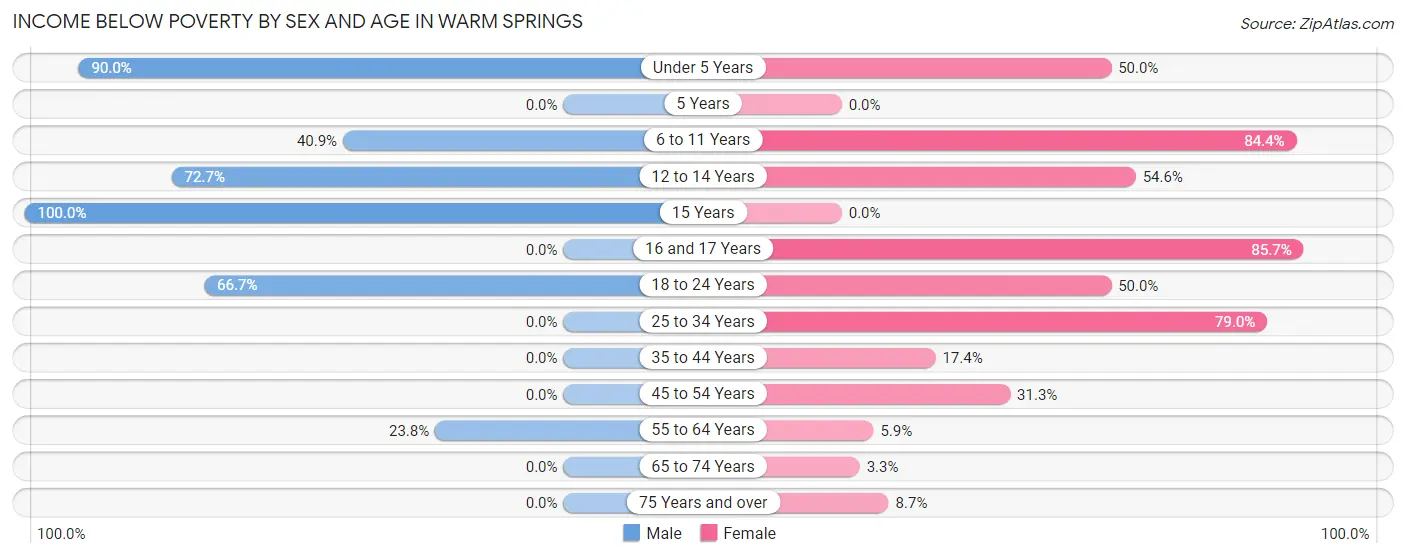
| Age Bracket | Male | Female |
| Under 5 Years | 9 (90.0%) | 6 (50.0%) |
| 5 Years | 0 (0.0%) | 0 (0.0%) |
| 6 to 11 Years | 9 (40.9%) | 27 (84.4%) |
| 12 to 14 Years | 8 (72.7%) | 6 (54.5%) |
| 15 Years | 3 (100.0%) | 0 (0.0%) |
| 16 and 17 Years | 0 (0.0%) | 12 (85.7%) |
| 18 to 24 Years | 6 (66.7%) | 4 (50.0%) |
| 25 to 34 Years | 0 (0.0%) | 15 (78.9%) |
| 35 to 44 Years | 0 (0.0%) | 4 (17.4%) |
| 45 to 54 Years | 0 (0.0%) | 10 (31.2%) |
| 55 to 64 Years | 5 (23.8%) | 2 (5.9%) |
| 65 to 74 Years | 0 (0.0%) | 1 (3.3%) |
| 75 Years and over | 0 (0.0%) | 2 (8.7%) |
| Total | 40 (18.3%) | 89 (37.4%) |
Income Above Poverty by Sex and Age in Warm Springs
According to the poverty statistics in Warm Springs, males aged 5 years and females aged 65 to 74 years are the age groups that are most secure financially, with 100.0% of males and 96.7% of females in these age groups living above the poverty line.
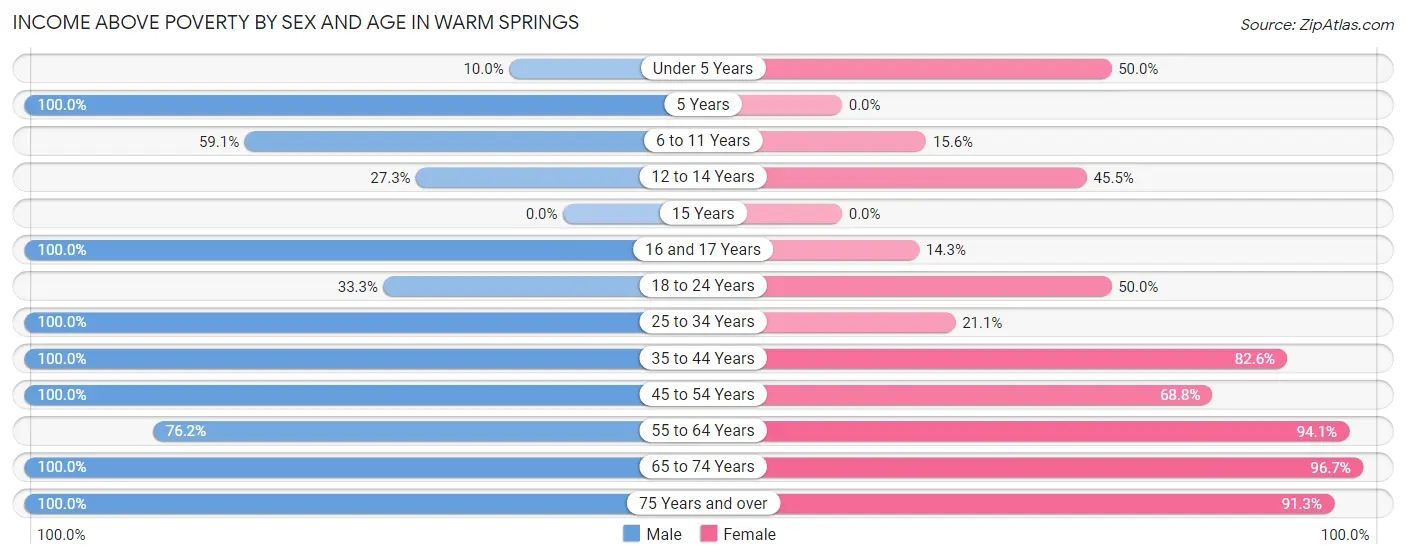
| Age Bracket | Male | Female |
| Under 5 Years | 1 (10.0%) | 6 (50.0%) |
| 5 Years | 2 (100.0%) | 0 (0.0%) |
| 6 to 11 Years | 13 (59.1%) | 5 (15.6%) |
| 12 to 14 Years | 3 (27.3%) | 5 (45.5%) |
| 15 Years | 0 (0.0%) | 0 (0.0%) |
| 16 and 17 Years | 1 (100.0%) | 2 (14.3%) |
| 18 to 24 Years | 3 (33.3%) | 4 (50.0%) |
| 25 to 34 Years | 69 (100.0%) | 4 (21.0%) |
| 35 to 44 Years | 13 (100.0%) | 19 (82.6%) |
| 45 to 54 Years | 34 (100.0%) | 22 (68.8%) |
| 55 to 64 Years | 16 (76.2%) | 32 (94.1%) |
| 65 to 74 Years | 9 (100.0%) | 29 (96.7%) |
| 75 Years and over | 14 (100.0%) | 21 (91.3%) |
| Total | 178 (81.7%) | 149 (62.6%) |
Income Below Poverty Among Married-Couple Families in Warm Springs
The poverty statistics for married-couple families in Warm Springs show that 3.8% or 2 of the total 52 families live below the poverty line. Families with 1 or 2 children have the highest poverty rate of 13.3%, comprising of 2 families. On the other hand, families with no children have the lowest poverty rate of 0.0%, which includes 0 families.
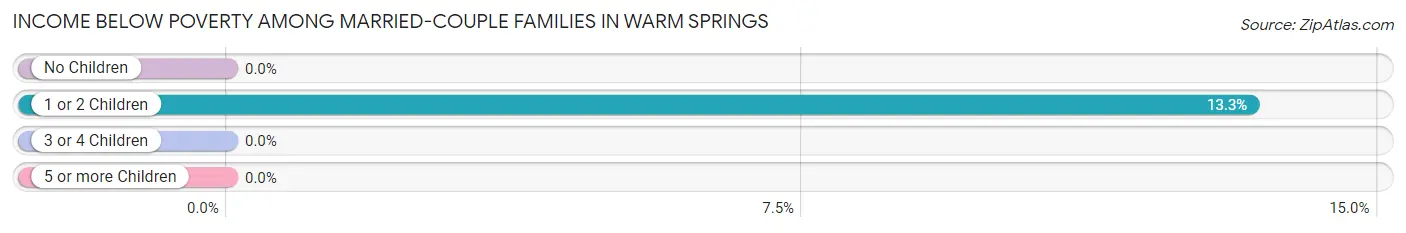
| Children | Above Poverty | Below Poverty |
| No Children | 33 (100.0%) | 0 (0.0%) |
| 1 or 2 Children | 13 (86.7%) | 2 (13.3%) |
| 3 or 4 Children | 4 (100.0%) | 0 (0.0%) |
| 5 or more Children | 0 (0.0%) | 0 (0.0%) |
| Total | 50 (96.2%) | 2 (3.8%) |
Income Below Poverty Among Single-Parent Households in Warm Springs
According to the poverty data in Warm Springs, 20.0% or 2 single-father households and 50.0% or 29 single-mother households are living below the poverty line. Among single-father households, those with no children have the highest poverty rate, with 2 households (20.0%) experiencing poverty. Likewise, among single-mother households, those with 3 or 4 children have the highest poverty rate, with 14 households (100.0%) falling below the poverty line.
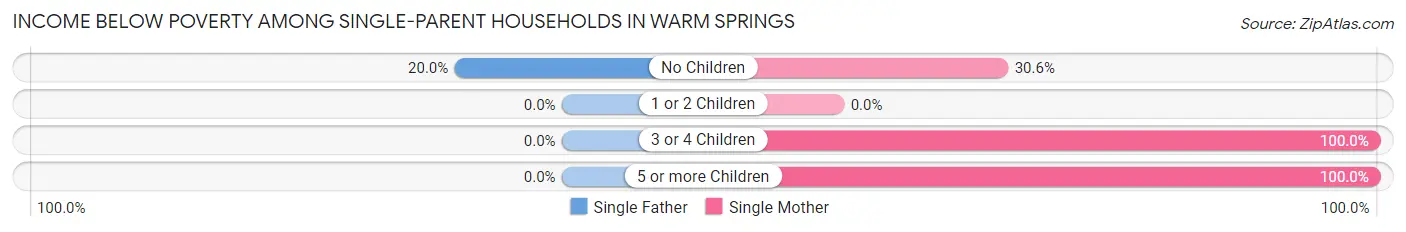
| Children | Single Father | Single Mother |
| No Children | 2 (20.0%) | 11 (30.6%) |
| 1 or 2 Children | 0 (0.0%) | 0 (0.0%) |
| 3 or 4 Children | 0 (0.0%) | 14 (100.0%) |
| 5 or more Children | 0 (0.0%) | 4 (100.0%) |
| Total | 2 (20.0%) | 29 (50.0%) |
Income Below Poverty Among Married-Couple vs Single-Parent Households in Warm Springs
The poverty data for Warm Springs shows that 2 of the married-couple family households (3.8%) and 31 of the single-parent households (45.6%) are living below the poverty level. Within the married-couple family households, those with 1 or 2 children have the highest poverty rate, with 2 households (13.3%) falling below the poverty line. Among the single-parent households, those with 3 or 4 children have the highest poverty rate, with 14 household (100.0%) living below poverty.
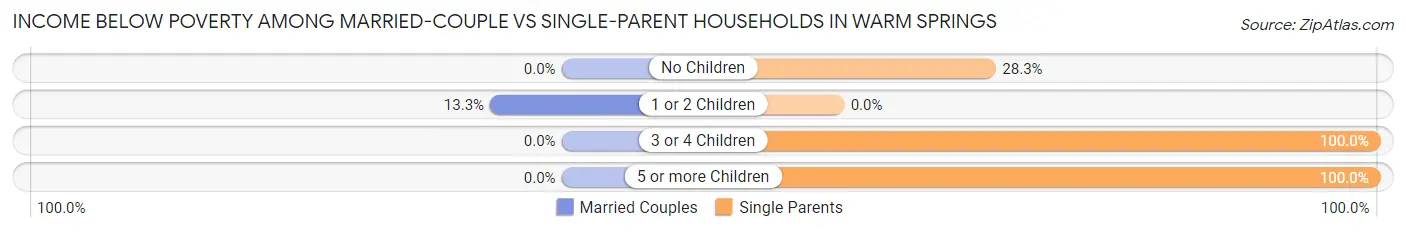
| Children | Married-Couple Families | Single-Parent Households |
| No Children | 0 (0.0%) | 13 (28.3%) |
| 1 or 2 Children | 2 (13.3%) | 0 (0.0%) |
| 3 or 4 Children | 0 (0.0%) | 14 (100.0%) |
| 5 or more Children | 0 (0.0%) | 4 (100.0%) |
| Total | 2 (3.8%) | 31 (45.6%) |
Race in Warm Springs
The most populous races in Warm Springs are White / Caucasian (293 | 54.0%), Black / African American (240 | 44.2%), and Some other Race (8 | 1.5%).
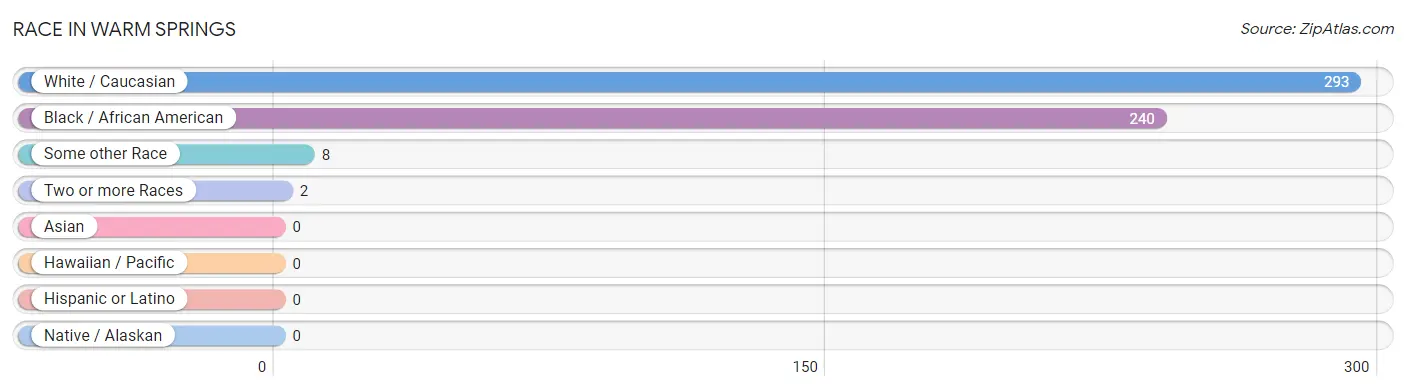
| Race | # Population | % Population |
| Asian | 0 | 0.0% |
| Black / African American | 240 | 44.2% |
| Hawaiian / Pacific | 0 | 0.0% |
| Hispanic or Latino | 0 | 0.0% |
| Native / Alaskan | 0 | 0.0% |
| White / Caucasian | 293 | 54.0% |
| Two or more Races | 2 | 0.4% |
| Some other Race | 8 | 1.5% |
| Total | 543 | 100.0% |
Ancestry in Warm Springs
The most populous ancestries reported in Warm Springs are Irish (30 | 5.5%), English (29 | 5.3%), American (27 | 5.0%), German (18 | 3.3%), and French (9 | 1.7%), together accounting for 20.8% of all Warm Springs residents.
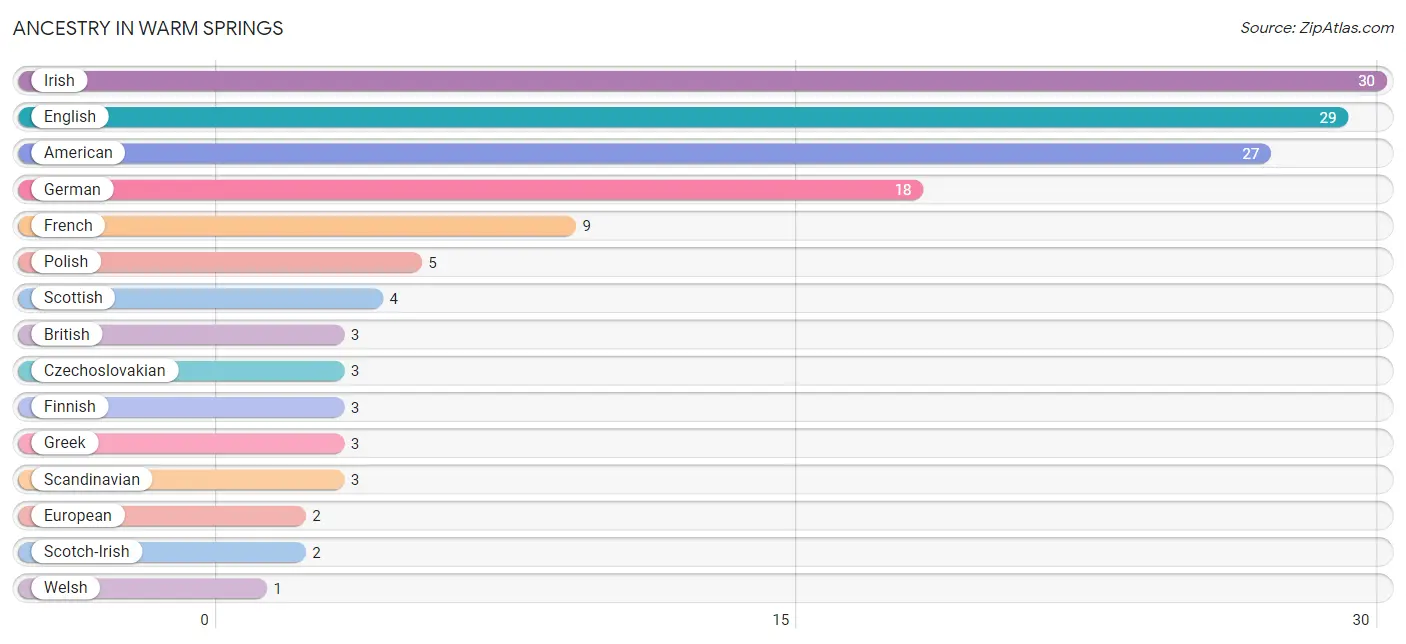
| Ancestry | # Population | % Population |
| American | 27 | 5.0% |
| British | 3 | 0.5% |
| Czechoslovakian | 3 | 0.5% |
| English | 29 | 5.3% |
| European | 2 | 0.4% |
| Finnish | 3 | 0.5% |
| French | 9 | 1.7% |
| German | 18 | 3.3% |
| Greek | 3 | 0.5% |
| Irish | 30 | 5.5% |
| Polish | 5 | 0.9% |
| Scandinavian | 3 | 0.5% |
| Scotch-Irish | 2 | 0.4% |
| Scottish | 4 | 0.7% |
| Welsh | 1 | 0.2% | View All 15 Rows |
Immigrants in Warm Springs
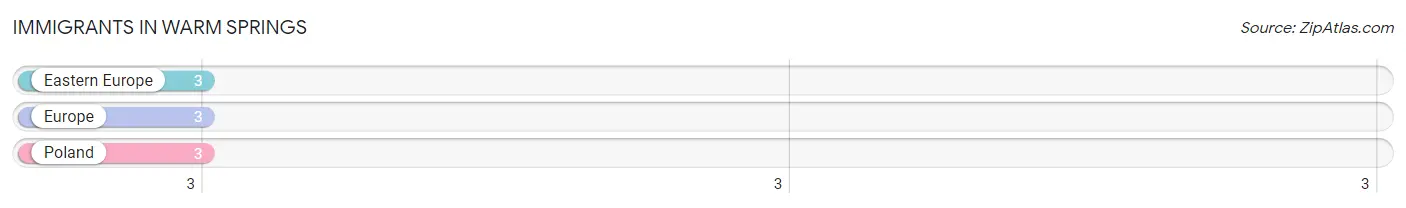
The most numerous immigrant groups reported in Warm Springs came from Eastern Europe (3 | 0.5%), Europe (3 | 0.5%), and Poland (3 | 0.5%), together accounting for 1.7% of all Warm Springs residents.
| Immigration Origin | # Population | % Population |
| Eastern Europe | 3 | 0.5% |
| Europe | 3 | 0.5% |
| Poland | 3 | 0.5% | View All 3 Rows |
Sex and Age in Warm Springs
Sex and Age in Warm Springs
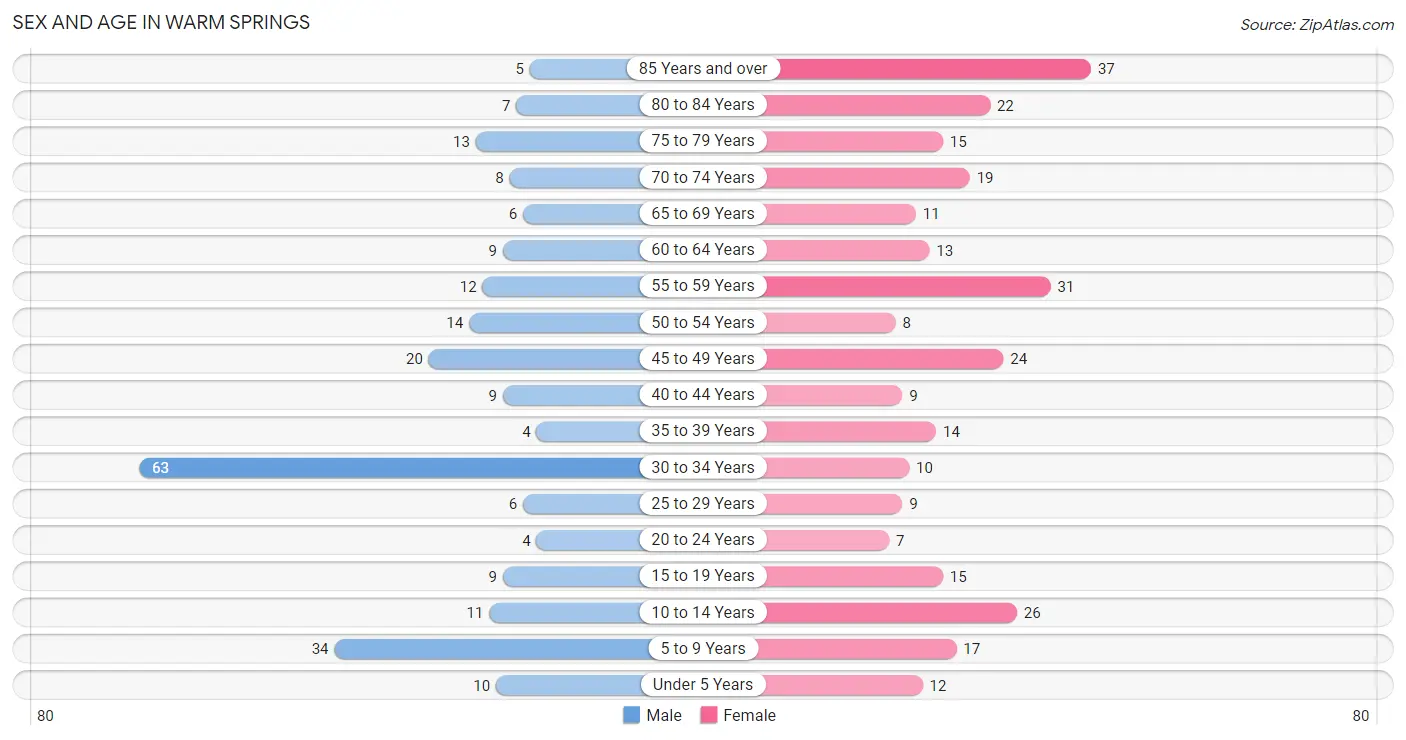
The most populous age groups in Warm Springs are 30 to 34 Years (63 | 25.8%) for men and 85 Years and over (37 | 12.4%) for women.
| Age Bracket | Male | Female |
| Under 5 Years | 10 (4.1%) | 12 (4.0%) |
| 5 to 9 Years | 34 (13.9%) | 17 (5.7%) |
| 10 to 14 Years | 11 (4.5%) | 26 (8.7%) |
| 15 to 19 Years | 9 (3.7%) | 15 (5.0%) |
| 20 to 24 Years | 4 (1.6%) | 7 (2.3%) |
| 25 to 29 Years | 6 (2.5%) | 9 (3.0%) |
| 30 to 34 Years | 63 (25.8%) | 10 (3.3%) |
| 35 to 39 Years | 4 (1.6%) | 14 (4.7%) |
| 40 to 44 Years | 9 (3.7%) | 9 (3.0%) |
| 45 to 49 Years | 20 (8.2%) | 24 (8.0%) |
| 50 to 54 Years | 14 (5.7%) | 8 (2.7%) |
| 55 to 59 Years | 12 (4.9%) | 31 (10.4%) |
| 60 to 64 Years | 9 (3.7%) | 13 (4.3%) |
| 65 to 69 Years | 6 (2.5%) | 11 (3.7%) |
| 70 to 74 Years | 8 (3.3%) | 19 (6.4%) |
| 75 to 79 Years | 13 (5.3%) | 15 (5.0%) |
| 80 to 84 Years | 7 (2.9%) | 22 (7.4%) |
| 85 Years and over | 5 (2.1%) | 37 (12.4%) |
| Total | 244 (100.0%) | 299 (100.0%) |
Families and Households in Warm Springs
Median Family Size in Warm Springs
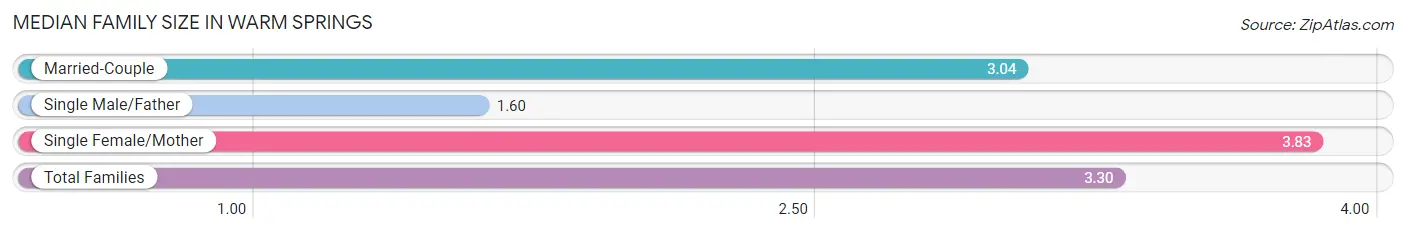
The median family size in Warm Springs is 3.30 persons per family, with single female/mother families (58 | 48.3%) accounting for the largest median family size of 3.83 persons per family. On the other hand, single male/father families (10 | 8.3%) represent the smallest median family size with 1.60 persons per family.
| Family Type | # Families | Family Size |
| Married-Couple | 52 (43.3%) | 3.04 |
| Single Male/Father | 10 (8.3%) | 1.60 |
| Single Female/Mother | 58 (48.3%) | 3.83 |
| Total Families | 120 (100.0%) | 3.30 |
Median Household Size in Warm Springs
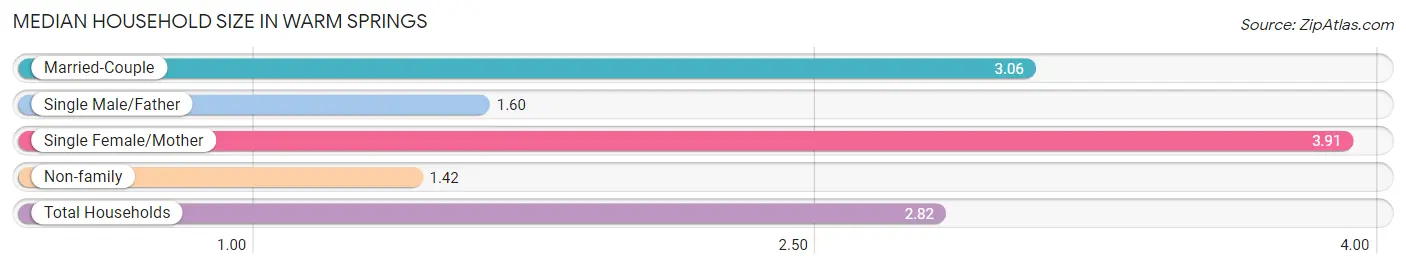
The median household size in Warm Springs is 2.82 persons per household, with single female/mother households (58 | 35.1%) accounting for the largest median household size of 3.91 persons per household. non-family households (45 | 27.3%) represent the smallest median household size with 1.42 persons per household.
| Household Type | # Households | Household Size |
| Married-Couple | 52 (31.5%) | 3.06 |
| Single Male/Father | 10 (6.1%) | 1.60 |
| Single Female/Mother | 58 (35.1%) | 3.91 |
| Non-family | 45 (27.3%) | 1.42 |
| Total Households | 165 (100.0%) | 2.82 |
Household Size by Marriage Status in Warm Springs
Out of a total of 165 households in Warm Springs, 120 (72.7%) are family households, while 45 (27.3%) are nonfamily households. The most numerous type of family households are 2-person households, comprising 77, and the most common type of nonfamily households are 1-person households, comprising 34.
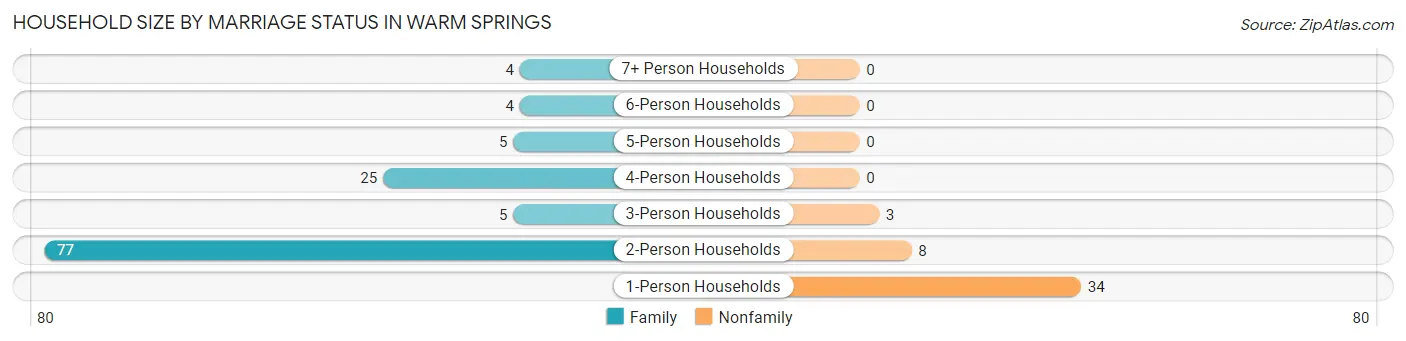
| Household Size | Family Households | Nonfamily Households |
| 1-Person Households | - | 34 (20.6%) |
| 2-Person Households | 77 (46.7%) | 8 (4.9%) |
| 3-Person Households | 5 (3.0%) | 3 (1.8%) |
| 4-Person Households | 25 (15.1%) | 0 (0.0%) |
| 5-Person Households | 5 (3.0%) | 0 (0.0%) |
| 6-Person Households | 4 (2.4%) | 0 (0.0%) |
| 7+ Person Households | 4 (2.4%) | 0 (0.0%) |
| Total | 120 (72.7%) | 45 (27.3%) |
Female Fertility in Warm Springs
Fertility by Age in Warm Springs
Average fertility rate in Warm Springs is 89.0 births per 1,000 women. Women in the age bracket of 20 to 34 years have the highest fertility rate with 308.0 births per 1,000 women. Women in the age bracket of 20 to 34 years acount for 100.0% of all women with births.
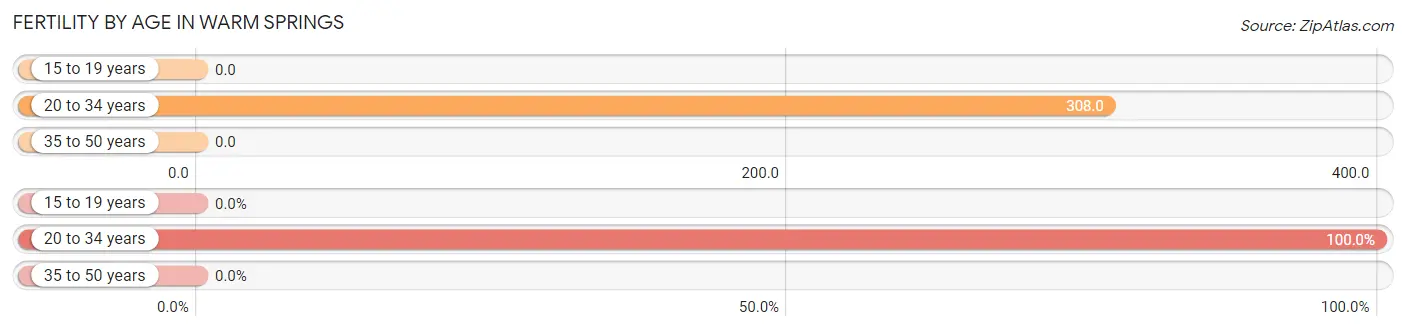
| Age Bracket | Women with Births | Births / 1,000 Women |
| 15 to 19 years | 0 (0.0%) | 0.0 |
| 20 to 34 years | 8 (100.0%) | 308.0 |
| 35 to 50 years | 0 (0.0%) | 0.0 |
| Total | 8 (100.0%) | 89.0 |
Fertility by Age by Marriage Status in Warm Springs
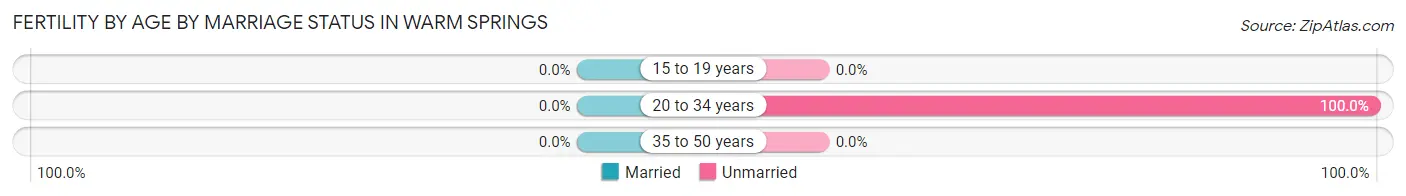
| Age Bracket | Married | Unmarried |
| 15 to 19 years | 0 (0.0%) | 0 (0.0%) |
| 20 to 34 years | 0 (0.0%) | 8 (100.0%) |
| 35 to 50 years | 0 (0.0%) | 0 (0.0%) |
| Total | 0 (0.0%) | 8 (100.0%) |
Fertility by Education in Warm Springs
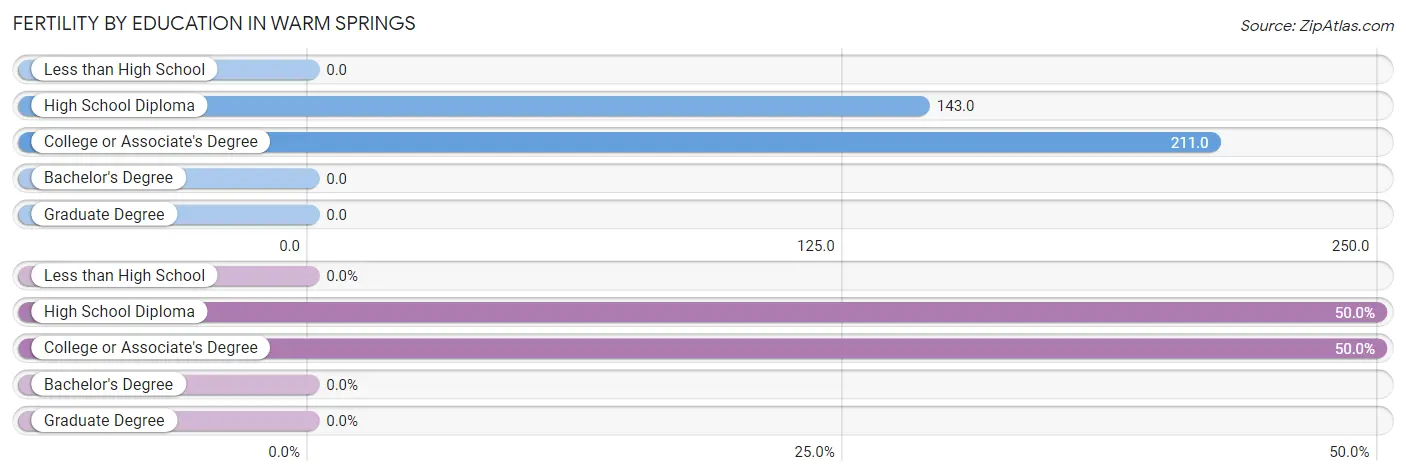
| Educational Attainment | Women with Births | Births / 1,000 Women |
| Less than High School | 0 (0.0%) | 0.0 |
| High School Diploma | 4 (50.0%) | 143.0 |
| College or Associate's Degree | 4 (50.0%) | 211.0 |
| Bachelor's Degree | 0 (0.0%) | 0.0 |
| Graduate Degree | 0 (0.0%) | 0.0 |
| Total | 8 (100.0%) | 89.0 |
Fertility by Education by Marriage Status in Warm Springs
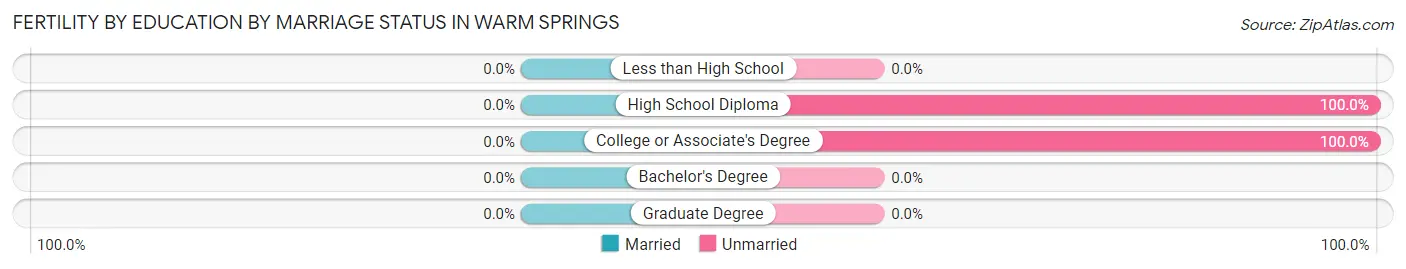
| Educational Attainment | Married | Unmarried |
| Less than High School | 0 (0.0%) | 0 (0.0%) |
| High School Diploma | 0 (0.0%) | 4 (100.0%) |
| College or Associate's Degree | 0 (0.0%) | 4 (100.0%) |
| Bachelor's Degree | 0 (0.0%) | 0 (0.0%) |
| Graduate Degree | 0 (0.0%) | 0 (0.0%) |
| Total | 0 (0.0%) | 8 (100.0%) |
Employment Characteristics in Warm Springs
Employment by Class of Employer in Warm Springs
Among the 195 employed individuals in Warm Springs, private company employees (149 | 76.4%), state government employees (16 | 8.2%), and local government employees (13 | 6.7%) make up the most common classes of employment.
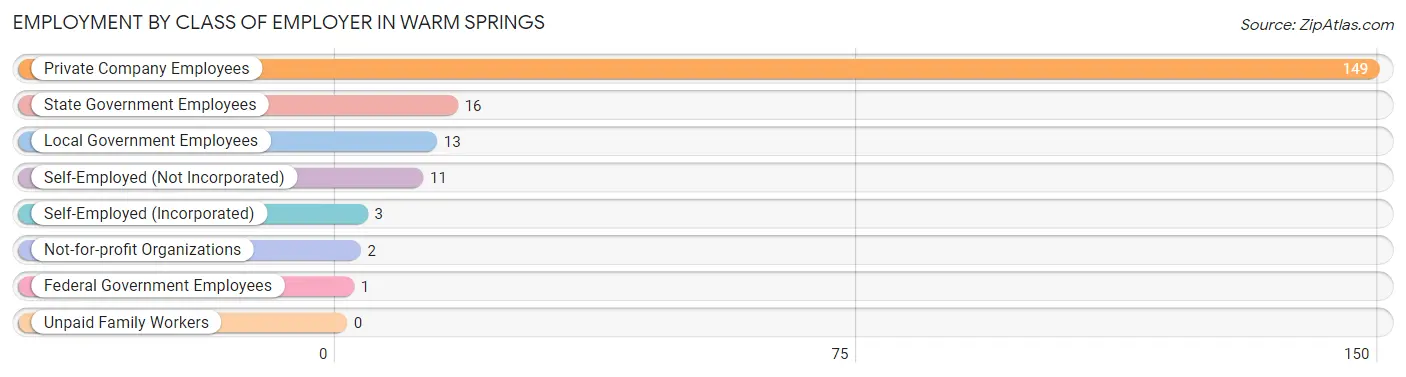
| Employer Class | # Employees | % Employees |
| Private Company Employees | 149 | 76.4% |
| Self-Employed (Incorporated) | 3 | 1.5% |
| Self-Employed (Not Incorporated) | 11 | 5.6% |
| Not-for-profit Organizations | 2 | 1.0% |
| Local Government Employees | 13 | 6.7% |
| State Government Employees | 16 | 8.2% |
| Federal Government Employees | 1 | 0.5% |
| Unpaid Family Workers | 0 | 0.0% |
| Total | 195 | 100.0% |
Employment Status by Age in Warm Springs
According to the labor force statistics for Warm Springs, out of the total population over 16 years of age (430), 47.7% or 205 individuals are in the labor force, with 3.9% or 8 of them unemployed. The age group with the highest labor force participation rate is 25 to 29 years, with 93.3% or 14 individuals in the labor force. Within the labor force, the 30 to 34 years age range has the highest percentage of unemployed individuals, with 11.8% or 8 of them being unemployed.
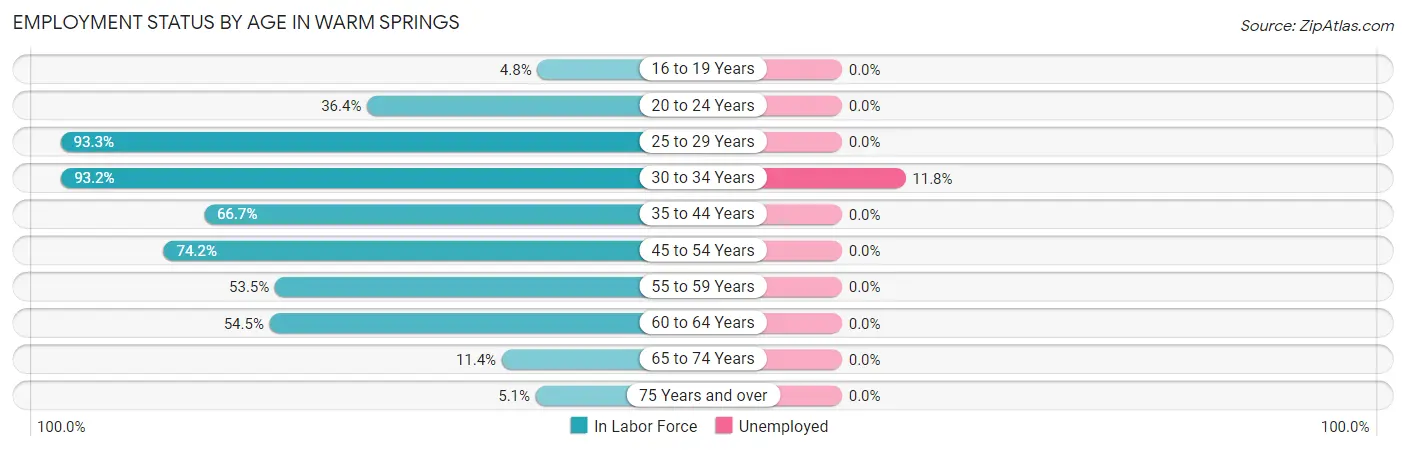
| Age Bracket | In Labor Force | Unemployed |
| 16 to 19 Years | 1 (4.8%) | 0 (0.0%) |
| 20 to 24 Years | 4 (36.4%) | 0 (0.0%) |
| 25 to 29 Years | 14 (93.3%) | 0 (0.0%) |
| 30 to 34 Years | 68 (93.2%) | 8 (11.8%) |
| 35 to 44 Years | 24 (66.7%) | 0 (0.0%) |
| 45 to 54 Years | 49 (74.2%) | 0 (0.0%) |
| 55 to 59 Years | 23 (53.5%) | 0 (0.0%) |
| 60 to 64 Years | 12 (54.5%) | 0 (0.0%) |
| 65 to 74 Years | 5 (11.4%) | 0 (0.0%) |
| 75 Years and over | 5 (5.1%) | 0 (0.0%) |
| Total | 205 (47.7%) | 8 (3.9%) |
Employment Status by Educational Attainment in Warm Springs
According to labor force statistics for Warm Springs, 74.5% of individuals (190) out of the total population between 25 and 64 years of age (255) are in the labor force, with 4.2% or 8 of them being unemployed. The group with the highest labor force participation rate are those with the educational attainment of bachelor's degree or higher, with 95.2% or 20 individuals in the labor force. Within the labor force, individuals with high school diploma education have the highest percentage of unemployment, with 8.2% or 8 of them being unemployed.
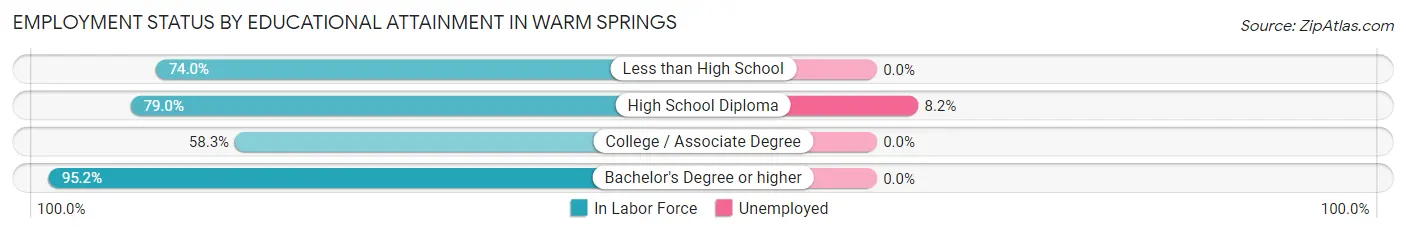
| Educational Attainment | In Labor Force | Unemployed |
| Less than High School | 37 (74.0%) | 0 (0.0%) |
| High School Diploma | 98 (79.0%) | 10 (8.2%) |
| College / Associate Degree | 35 (58.3%) | 0 (0.0%) |
| Bachelor's Degree or higher | 20 (95.2%) | 0 (0.0%) |
| Total | 190 (74.5%) | 11 (4.2%) |
Employment Occupations by Sex in Warm Springs
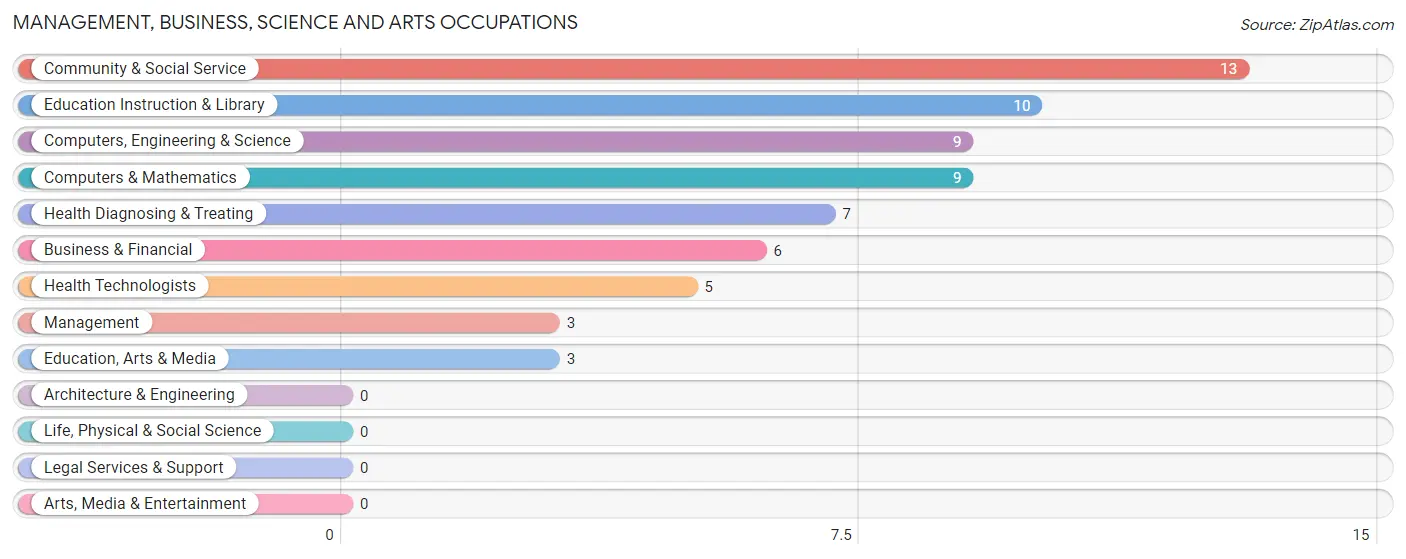
Management, Business, Science and Arts Occupations
The most common Management, Business, Science and Arts occupations in Warm Springs are Community & Social Service (13 | 6.6%), Education Instruction & Library (10 | 5.1%), Computers, Engineering & Science (9 | 4.6%), Computers & Mathematics (9 | 4.6%), and Health Diagnosing & Treating (7 | 3.5%).
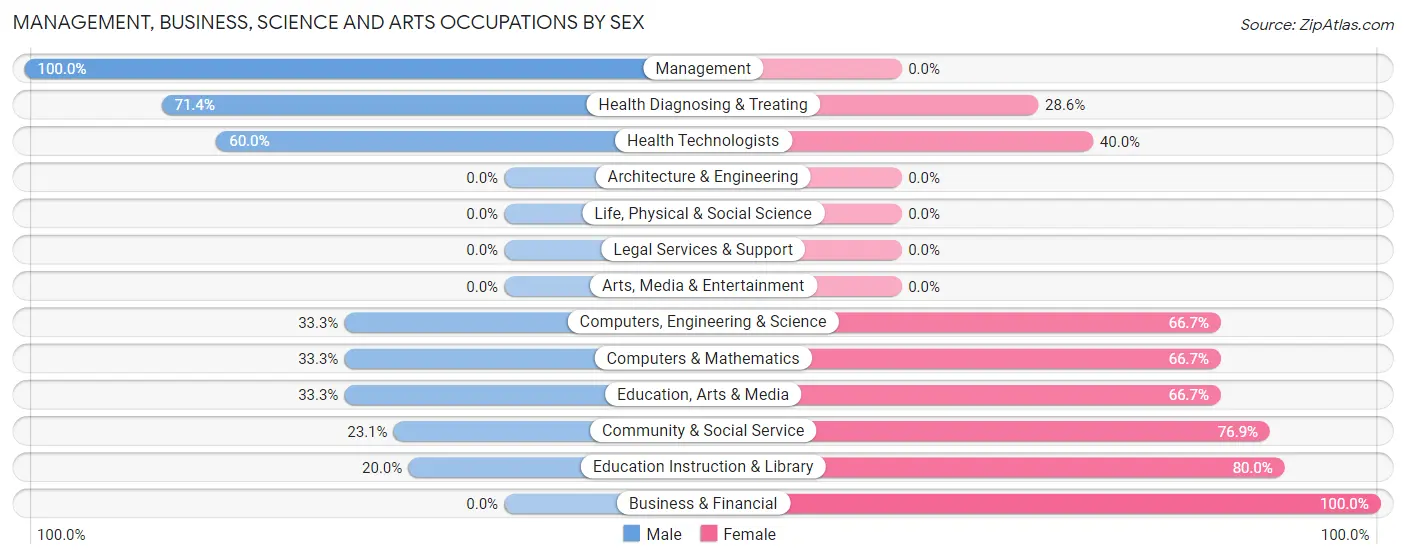
Management, Business, Science and Arts Occupations by Sex
Within the Management, Business, Science and Arts occupations in Warm Springs, the most male-oriented occupations are Management (100.0%), Health Diagnosing & Treating (71.4%), and Health Technologists (60.0%), while the most female-oriented occupations are Business & Financial (100.0%), Education Instruction & Library (80.0%), and Community & Social Service (76.9%).
| Occupation | Male | Female |
| Management | 3 (100.0%) | 0 (0.0%) |
| Business & Financial | 0 (0.0%) | 6 (100.0%) |
| Computers, Engineering & Science | 3 (33.3%) | 6 (66.7%) |
| Computers & Mathematics | 3 (33.3%) | 6 (66.7%) |
| Architecture & Engineering | 0 (0.0%) | 0 (0.0%) |
| Life, Physical & Social Science | 0 (0.0%) | 0 (0.0%) |
| Community & Social Service | 3 (23.1%) | 10 (76.9%) |
| Education, Arts & Media | 1 (33.3%) | 2 (66.7%) |
| Legal Services & Support | 0 (0.0%) | 0 (0.0%) |
| Education Instruction & Library | 2 (20.0%) | 8 (80.0%) |
| Arts, Media & Entertainment | 0 (0.0%) | 0 (0.0%) |
| Health Diagnosing & Treating | 5 (71.4%) | 2 (28.6%) |
| Health Technologists | 3 (60.0%) | 2 (40.0%) |
| Total (Category) | 14 (36.8%) | 24 (63.2%) |
| Total (Overall) | 112 (56.9%) | 85 (43.1%) |
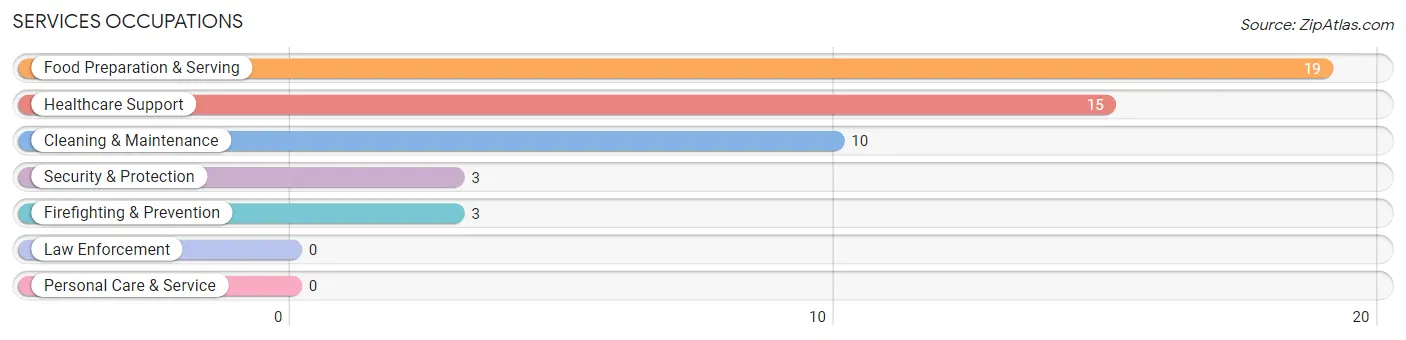
Services Occupations
The most common Services occupations in Warm Springs are Food Preparation & Serving (19 | 9.6%), Healthcare Support (15 | 7.6%), Cleaning & Maintenance (10 | 5.1%), Security & Protection (3 | 1.5%), and Firefighting & Prevention (3 | 1.5%).
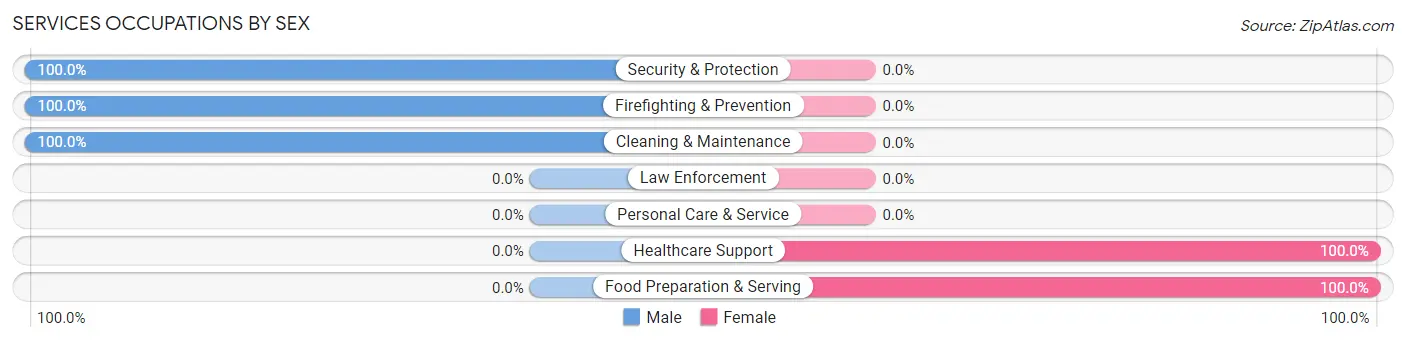
Services Occupations by Sex
Within the Services occupations in Warm Springs, the most male-oriented occupations are Security & Protection (100.0%), Firefighting & Prevention (100.0%), and Cleaning & Maintenance (100.0%), while the most female-oriented occupations are Healthcare Support (100.0%), and Food Preparation & Serving (100.0%).
| Occupation | Male | Female |
| Healthcare Support | 0 (0.0%) | 15 (100.0%) |
| Security & Protection | 3 (100.0%) | 0 (0.0%) |
| Firefighting & Prevention | 3 (100.0%) | 0 (0.0%) |
| Law Enforcement | 0 (0.0%) | 0 (0.0%) |
| Food Preparation & Serving | 0 (0.0%) | 19 (100.0%) |
| Cleaning & Maintenance | 10 (100.0%) | 0 (0.0%) |
| Personal Care & Service | 0 (0.0%) | 0 (0.0%) |
| Total (Category) | 13 (27.7%) | 34 (72.3%) |
| Total (Overall) | 112 (56.9%) | 85 (43.1%) |
Sales and Office Occupations
The most common Sales and Office occupations in Warm Springs are Sales & Related (18 | 9.1%), and Office & Administration (5 | 2.5%).
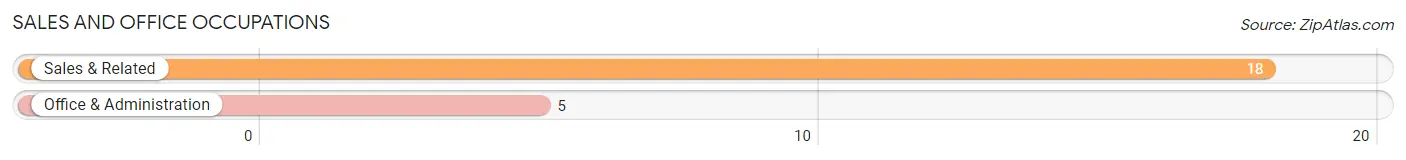
Sales and Office Occupations by Sex
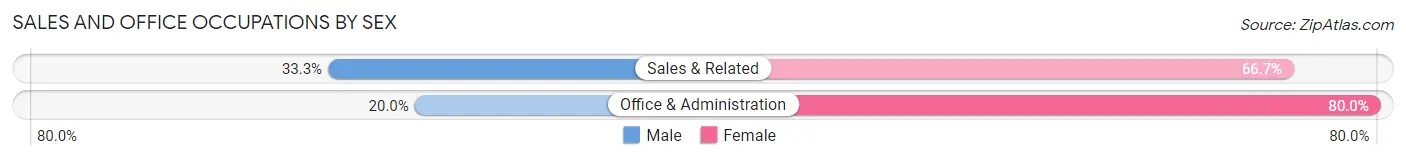
| Occupation | Male | Female |
| Sales & Related | 6 (33.3%) | 12 (66.7%) |
| Office & Administration | 1 (20.0%) | 4 (80.0%) |
| Total (Category) | 7 (30.4%) | 16 (69.6%) |
| Total (Overall) | 112 (56.9%) | 85 (43.1%) |
Natural Resources, Construction and Maintenance Occupations
The most common Natural Resources, Construction and Maintenance occupations in Warm Springs are Construction & Extraction (4 | 2.0%), and Installation, Maintenance & Repair (1 | 0.5%).
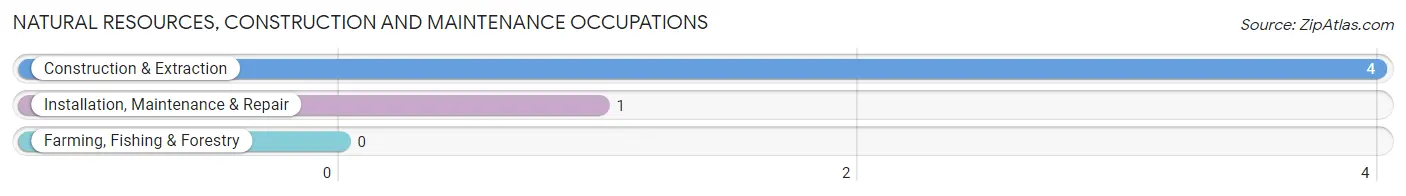
Natural Resources, Construction and Maintenance Occupations by Sex
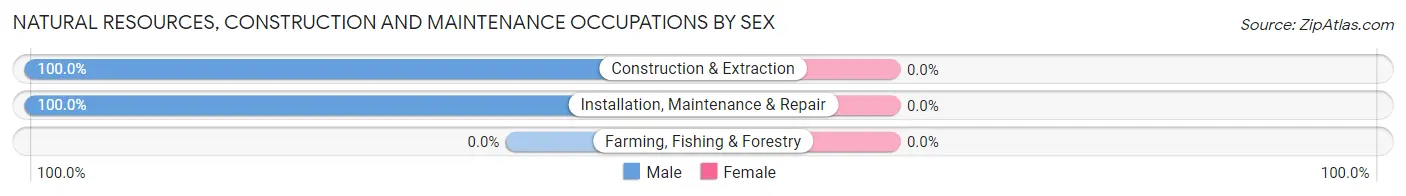
| Occupation | Male | Female |
| Farming, Fishing & Forestry | 0 (0.0%) | 0 (0.0%) |
| Construction & Extraction | 4 (100.0%) | 0 (0.0%) |
| Installation, Maintenance & Repair | 1 (100.0%) | 0 (0.0%) |
| Total (Category) | 5 (100.0%) | 0 (0.0%) |
| Total (Overall) | 112 (56.9%) | 85 (43.1%) |
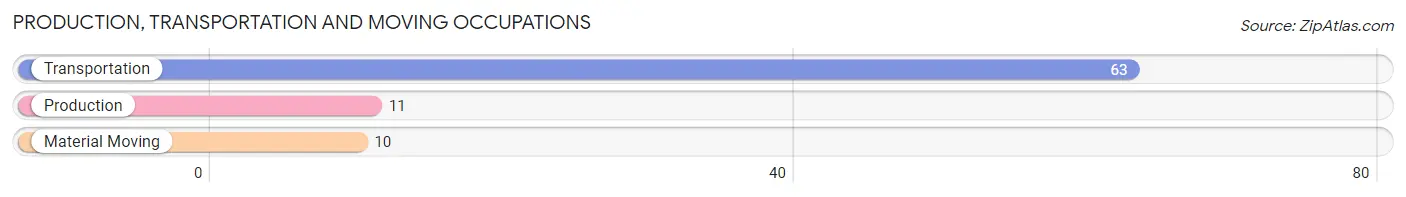
Production, Transportation and Moving Occupations
The most common Production, Transportation and Moving occupations in Warm Springs are Transportation (63 | 32.0%), Production (11 | 5.6%), and Material Moving (10 | 5.1%).
Production, Transportation and Moving Occupations by Sex
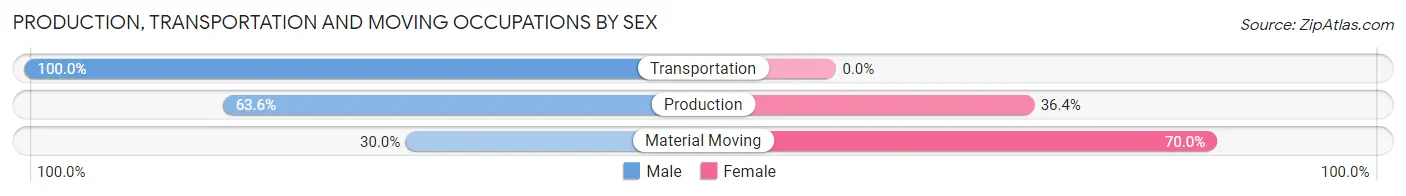
| Occupation | Male | Female |
| Production | 7 (63.6%) | 4 (36.4%) |
| Transportation | 63 (100.0%) | 0 (0.0%) |
| Material Moving | 3 (30.0%) | 7 (70.0%) |
| Total (Category) | 73 (86.9%) | 11 (13.1%) |
| Total (Overall) | 112 (56.9%) | 85 (43.1%) |
Employment Industries by Sex in Warm Springs
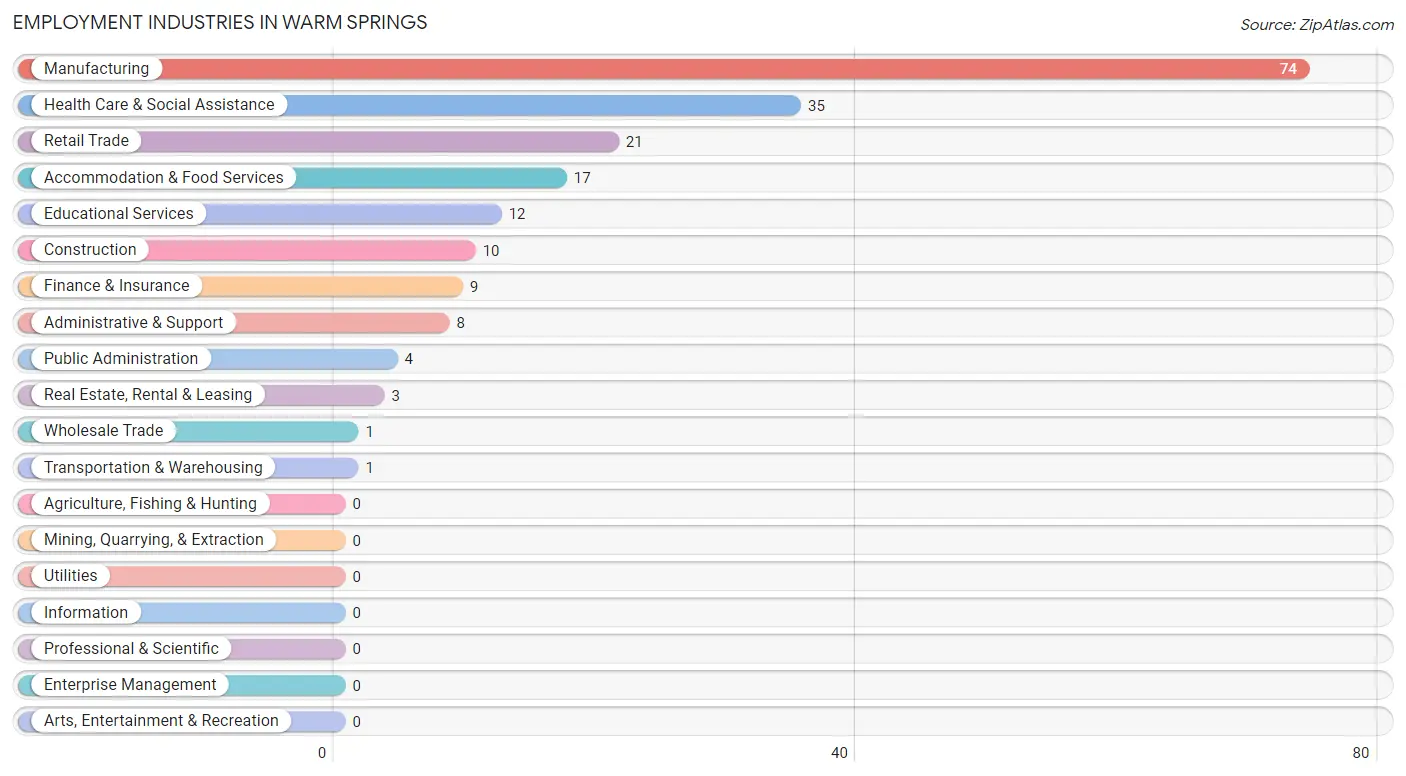
Employment Industries in Warm Springs
The major employment industries in Warm Springs include Manufacturing (74 | 37.6%), Health Care & Social Assistance (35 | 17.8%), Retail Trade (21 | 10.7%), Accommodation & Food Services (17 | 8.6%), and Educational Services (12 | 6.1%).
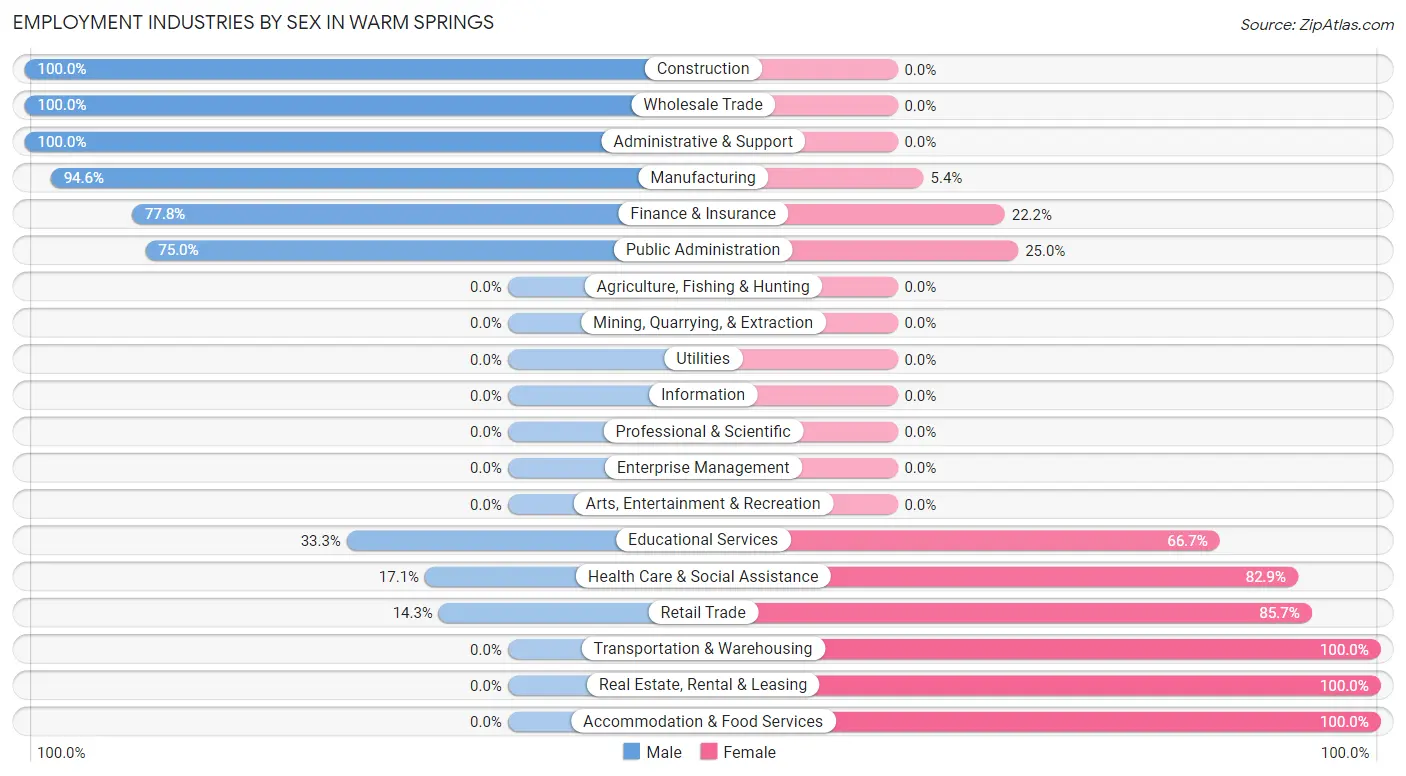
Employment Industries by Sex in Warm Springs
The Warm Springs industries that see more men than women are Construction (100.0%), Wholesale Trade (100.0%), and Administrative & Support (100.0%), whereas the industries that tend to have a higher number of women are Transportation & Warehousing (100.0%), Real Estate, Rental & Leasing (100.0%), and Accommodation & Food Services (100.0%).
| Industry | Male | Female |
| Agriculture, Fishing & Hunting | 0 (0.0%) | 0 (0.0%) |
| Mining, Quarrying, & Extraction | 0 (0.0%) | 0 (0.0%) |
| Construction | 10 (100.0%) | 0 (0.0%) |
| Manufacturing | 70 (94.6%) | 4 (5.4%) |
| Wholesale Trade | 1 (100.0%) | 0 (0.0%) |
| Retail Trade | 3 (14.3%) | 18 (85.7%) |
| Transportation & Warehousing | 0 (0.0%) | 1 (100.0%) |
| Utilities | 0 (0.0%) | 0 (0.0%) |
| Information | 0 (0.0%) | 0 (0.0%) |
| Finance & Insurance | 7 (77.8%) | 2 (22.2%) |
| Real Estate, Rental & Leasing | 0 (0.0%) | 3 (100.0%) |
| Professional & Scientific | 0 (0.0%) | 0 (0.0%) |
| Enterprise Management | 0 (0.0%) | 0 (0.0%) |
| Administrative & Support | 8 (100.0%) | 0 (0.0%) |
| Educational Services | 4 (33.3%) | 8 (66.7%) |
| Health Care & Social Assistance | 6 (17.1%) | 29 (82.9%) |
| Arts, Entertainment & Recreation | 0 (0.0%) | 0 (0.0%) |
| Accommodation & Food Services | 0 (0.0%) | 17 (100.0%) |
| Public Administration | 3 (75.0%) | 1 (25.0%) |
| Total | 112 (56.9%) | 85 (43.1%) |
Education in Warm Springs
School Enrollment in Warm Springs
The most common levels of schooling among the 100 students in Warm Springs are elementary school (36 | 36.0%), high school (23 | 23.0%), and kindergarten (20 | 20.0%).
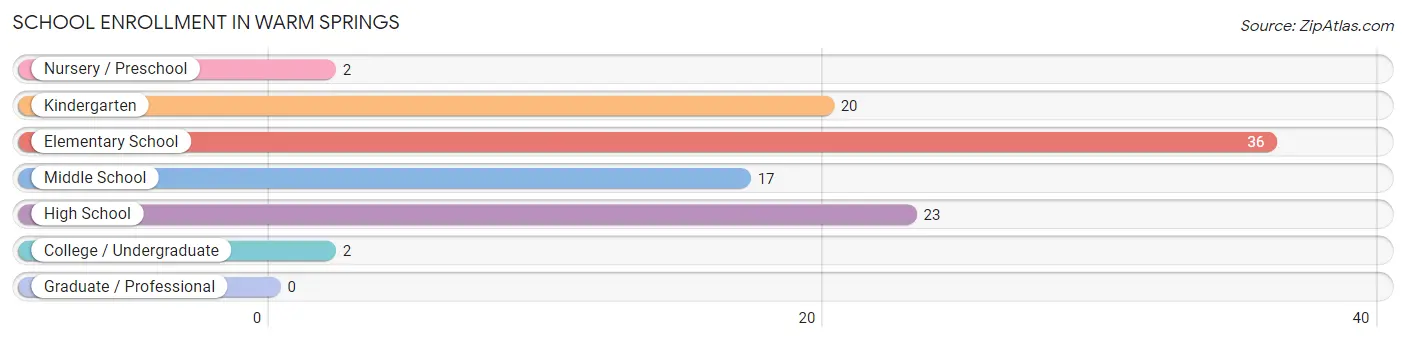
| School Level | # Students | % Students |
| Nursery / Preschool | 2 | 2.0% |
| Kindergarten | 20 | 20.0% |
| Elementary School | 36 | 36.0% |
| Middle School | 17 | 17.0% |
| High School | 23 | 23.0% |
| College / Undergraduate | 2 | 2.0% |
| Graduate / Professional | 0 | 0.0% |
| Total | 100 | 100.0% |
School Enrollment by Age by Funding Source in Warm Springs
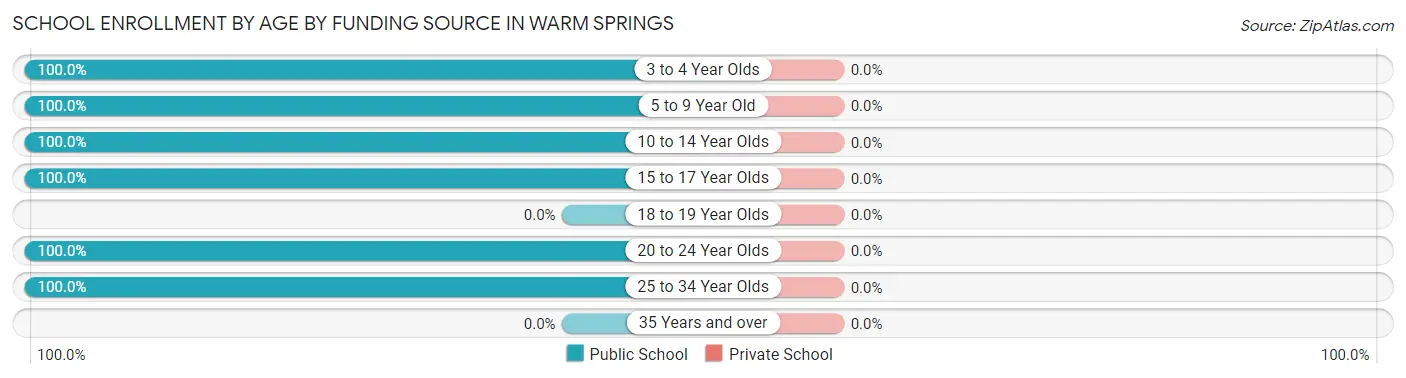
| Age Bracket | Public School | Private School |
| 3 to 4 Year Olds | 2 (100.0%) | 0 (0.0%) |
| 5 to 9 Year Old | 49 (100.0%) | 0 (0.0%) |
| 10 to 14 Year Olds | 29 (100.0%) | 0 (0.0%) |
| 15 to 17 Year Olds | 18 (100.0%) | 0 (0.0%) |
| 18 to 19 Year Olds | 0 (0.0%) | 0 (0.0%) |
| 20 to 24 Year Olds | 1 (100.0%) | 0 (0.0%) |
| 25 to 34 Year Olds | 1 (100.0%) | 0 (0.0%) |
| 35 Years and over | 0 (0.0%) | 0 (0.0%) |
| Total | 100 (100.0%) | 0 (0.0%) |
Educational Attainment by Field of Study in Warm Springs
Education (18 | 36.7%), arts & humanities (8 | 16.3%), psychology (6 | 12.2%), science & technology (6 | 12.2%), and literature & languages (6 | 12.2%) are the most common fields of study among 49 individuals in Warm Springs who have obtained a bachelor's degree or higher.
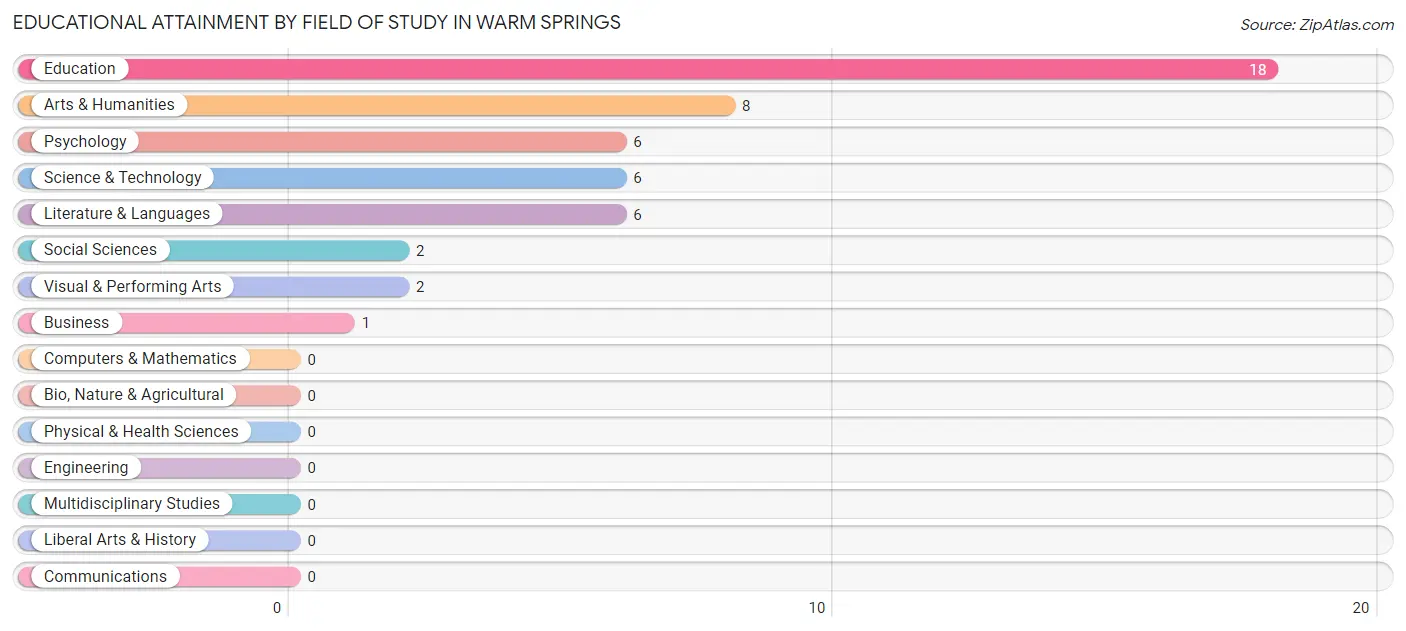
| Field of Study | # Graduates | % Graduates |
| Computers & Mathematics | 0 | 0.0% |
| Bio, Nature & Agricultural | 0 | 0.0% |
| Physical & Health Sciences | 0 | 0.0% |
| Psychology | 6 | 12.2% |
| Social Sciences | 2 | 4.1% |
| Engineering | 0 | 0.0% |
| Multidisciplinary Studies | 0 | 0.0% |
| Science & Technology | 6 | 12.2% |
| Business | 1 | 2.0% |
| Education | 18 | 36.7% |
| Literature & Languages | 6 | 12.2% |
| Liberal Arts & History | 0 | 0.0% |
| Visual & Performing Arts | 2 | 4.1% |
| Communications | 0 | 0.0% |
| Arts & Humanities | 8 | 16.3% |
| Total | 49 | 100.0% |
Transportation & Commute in Warm Springs
Vehicle Availability by Sex in Warm Springs
The most prevalent vehicle ownership categories in Warm Springs are males with 2 vehicles (75, accounting for 67.0%) and females with 2 vehicles (37, making up 90.4%).
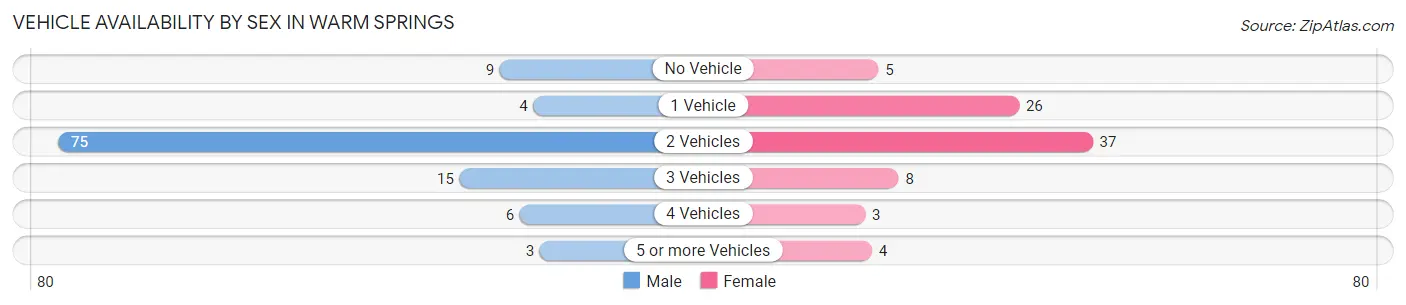
| Vehicles Available | Male | Female |
| No Vehicle | 9 (8.0%) | 5 (6.0%) |
| 1 Vehicle | 4 (3.6%) | 26 (31.3%) |
| 2 Vehicles | 75 (67.0%) | 37 (44.6%) |
| 3 Vehicles | 15 (13.4%) | 8 (9.6%) |
| 4 Vehicles | 6 (5.4%) | 3 (3.6%) |
| 5 or more Vehicles | 3 (2.7%) | 4 (4.8%) |
| Total | 112 (100.0%) | 83 (100.0%) |
Commute Time in Warm Springs
The most frequently occuring commute durations in Warm Springs are 40 to 44 minutes (64 commuters, 33.9%), 10 to 14 minutes (24 commuters, 12.7%), and 15 to 19 minutes (22 commuters, 11.6%).
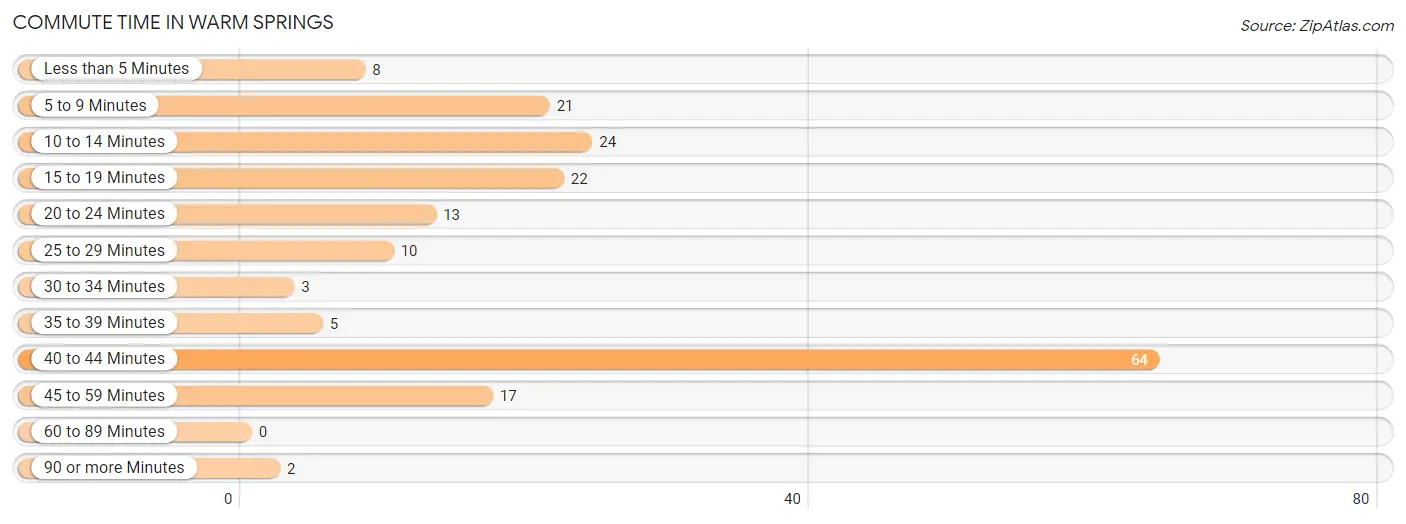
| Commute Time | # Commuters | % Commuters |
| Less than 5 Minutes | 8 | 4.2% |
| 5 to 9 Minutes | 21 | 11.1% |
| 10 to 14 Minutes | 24 | 12.7% |
| 15 to 19 Minutes | 22 | 11.6% |
| 20 to 24 Minutes | 13 | 6.9% |
| 25 to 29 Minutes | 10 | 5.3% |
| 30 to 34 Minutes | 3 | 1.6% |
| 35 to 39 Minutes | 5 | 2.6% |
| 40 to 44 Minutes | 64 | 33.9% |
| 45 to 59 Minutes | 17 | 9.0% |
| 60 to 89 Minutes | 0 | 0.0% |
| 90 or more Minutes | 2 | 1.1% |
Commute Time by Sex in Warm Springs
The most common commute times in Warm Springs are 40 to 44 minutes (62 commuters, 58.5%) for males and 10 to 14 minutes (23 commuters, 27.7%) for females.
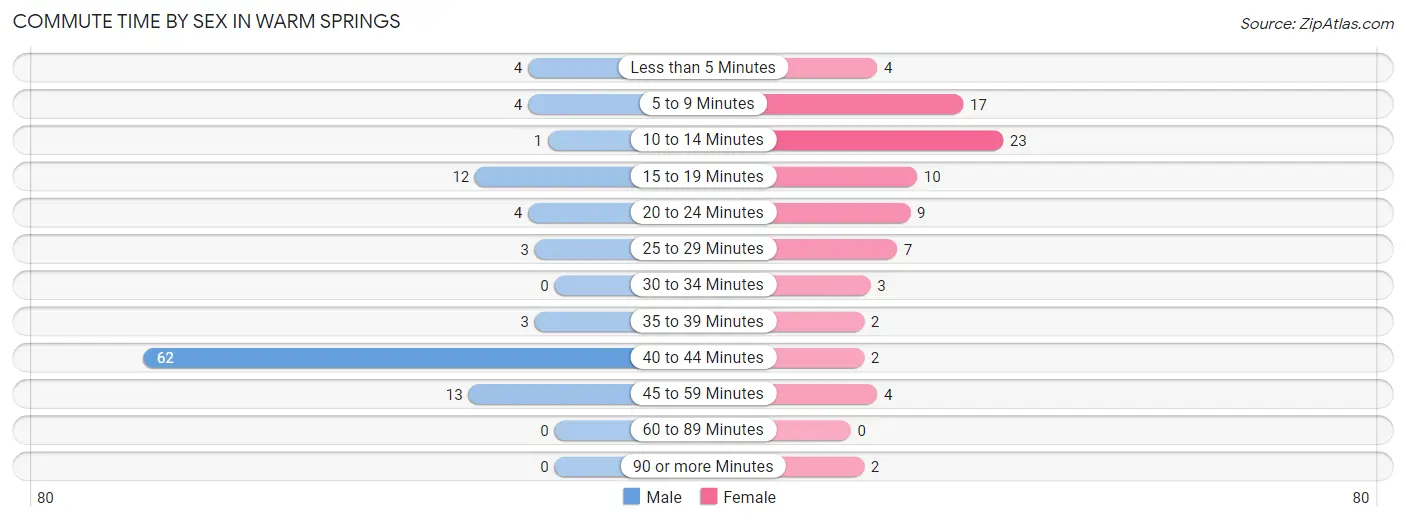
| Commute Time | Male | Female |
| Less than 5 Minutes | 4 (3.8%) | 4 (4.8%) |
| 5 to 9 Minutes | 4 (3.8%) | 17 (20.5%) |
| 10 to 14 Minutes | 1 (0.9%) | 23 (27.7%) |
| 15 to 19 Minutes | 12 (11.3%) | 10 (12.0%) |
| 20 to 24 Minutes | 4 (3.8%) | 9 (10.8%) |
| 25 to 29 Minutes | 3 (2.8%) | 7 (8.4%) |
| 30 to 34 Minutes | 0 (0.0%) | 3 (3.6%) |
| 35 to 39 Minutes | 3 (2.8%) | 2 (2.4%) |
| 40 to 44 Minutes | 62 (58.5%) | 2 (2.4%) |
| 45 to 59 Minutes | 13 (12.3%) | 4 (4.8%) |
| 60 to 89 Minutes | 0 (0.0%) | 0 (0.0%) |
| 90 or more Minutes | 0 (0.0%) | 2 (2.4%) |
Time of Departure to Work by Sex in Warm Springs
The most frequent times of departure to work in Warm Springs are 12:00 PM to 3:59 PM (59, 55.7%) for males and 6:30 AM to 6:59 AM (20, 24.1%) for females.
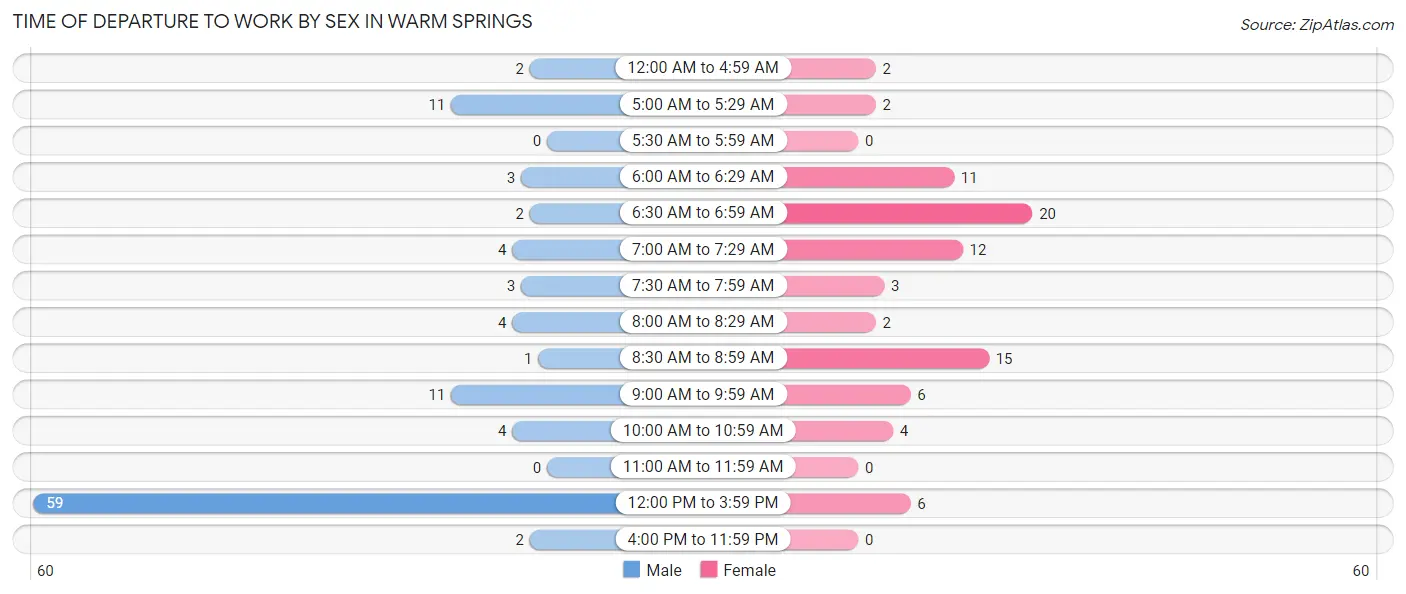
| Time of Departure | Male | Female |
| 12:00 AM to 4:59 AM | 2 (1.9%) | 2 (2.4%) |
| 5:00 AM to 5:29 AM | 11 (10.4%) | 2 (2.4%) |
| 5:30 AM to 5:59 AM | 0 (0.0%) | 0 (0.0%) |
| 6:00 AM to 6:29 AM | 3 (2.8%) | 11 (13.3%) |
| 6:30 AM to 6:59 AM | 2 (1.9%) | 20 (24.1%) |
| 7:00 AM to 7:29 AM | 4 (3.8%) | 12 (14.5%) |
| 7:30 AM to 7:59 AM | 3 (2.8%) | 3 (3.6%) |
| 8:00 AM to 8:29 AM | 4 (3.8%) | 2 (2.4%) |
| 8:30 AM to 8:59 AM | 1 (0.9%) | 15 (18.1%) |
| 9:00 AM to 9:59 AM | 11 (10.4%) | 6 (7.2%) |
| 10:00 AM to 10:59 AM | 4 (3.8%) | 4 (4.8%) |
| 11:00 AM to 11:59 AM | 0 (0.0%) | 0 (0.0%) |
| 12:00 PM to 3:59 PM | 59 (55.7%) | 6 (7.2%) |
| 4:00 PM to 11:59 PM | 2 (1.9%) | 0 (0.0%) |
| Total | 106 (100.0%) | 83 (100.0%) |
Housing Occupancy in Warm Springs
Occupancy by Ownership in Warm Springs
Of the total 165 dwellings in Warm Springs, owner-occupied units account for 75 (45.5%), while renter-occupied units make up 90 (54.5%).
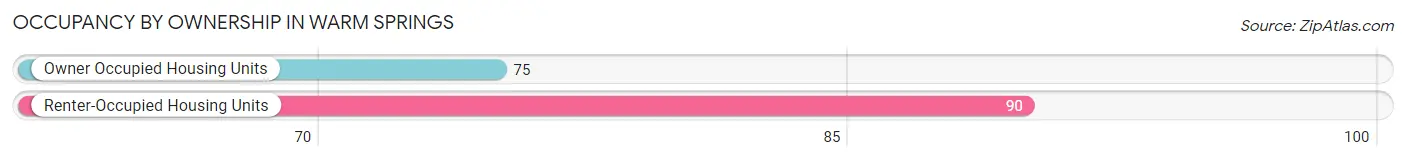
| Occupancy | # Housing Units | % Housing Units |
| Owner Occupied Housing Units | 75 | 45.5% |
| Renter-Occupied Housing Units | 90 | 54.5% |
| Total Occupied Housing Units | 165 | 100.0% |
Occupancy by Household Size in Warm Springs
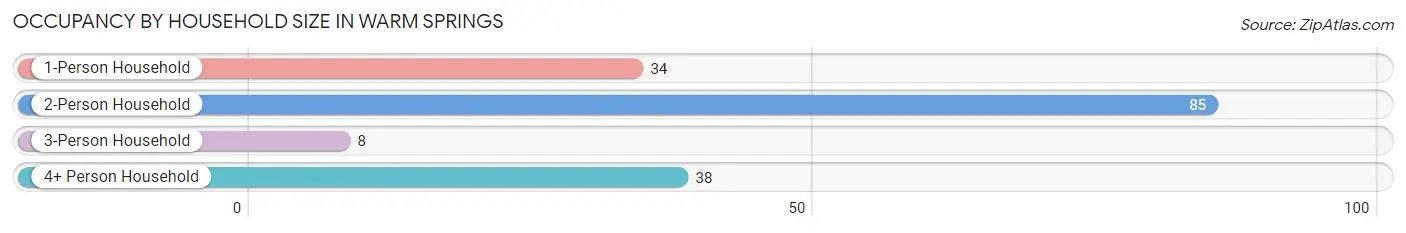
| Household Size | # Housing Units | % Housing Units |
| 1-Person Household | 34 | 20.6% |
| 2-Person Household | 85 | 51.5% |
| 3-Person Household | 8 | 4.9% |
| 4+ Person Household | 38 | 23.0% |
| Total Housing Units | 165 | 100.0% |
Occupancy by Ownership by Household Size in Warm Springs
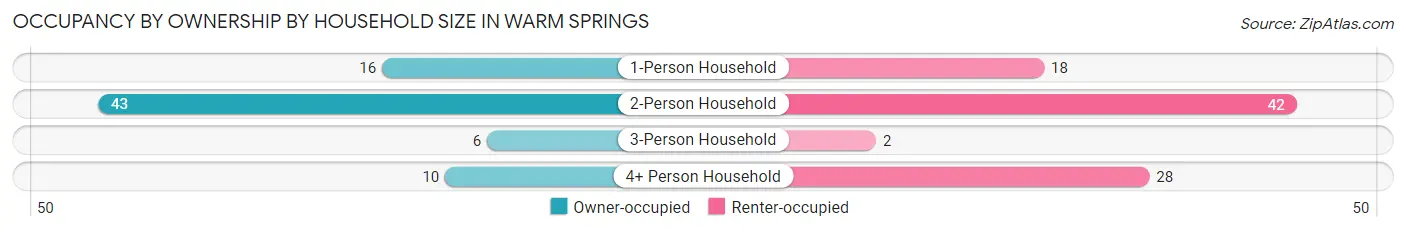
| Household Size | Owner-occupied | Renter-occupied |
| 1-Person Household | 16 (47.1%) | 18 (52.9%) |
| 2-Person Household | 43 (50.6%) | 42 (49.4%) |
| 3-Person Household | 6 (75.0%) | 2 (25.0%) |
| 4+ Person Household | 10 (26.3%) | 28 (73.7%) |
| Total Housing Units | 75 (45.5%) | 90 (54.5%) |
Occupancy by Educational Attainment in Warm Springs
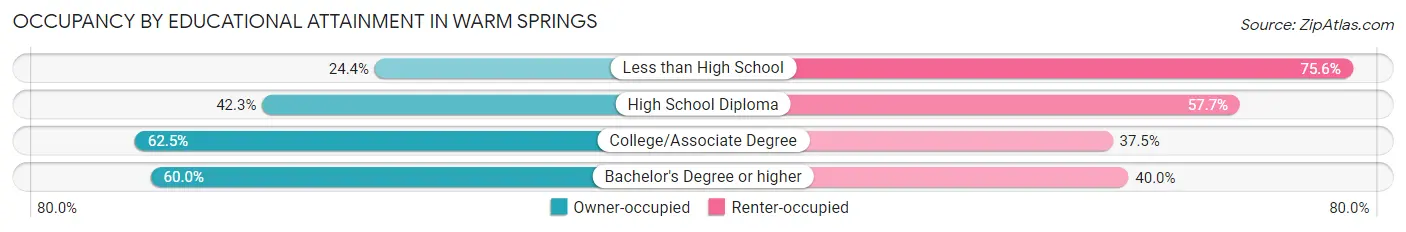
| Household Size | Owner-occupied | Renter-occupied |
| Less than High School | 11 (24.4%) | 34 (75.6%) |
| High School Diploma | 22 (42.3%) | 30 (57.7%) |
| College/Associate Degree | 30 (62.5%) | 18 (37.5%) |
| Bachelor's Degree or higher | 12 (60.0%) | 8 (40.0%) |
Occupancy by Age of Householder in Warm Springs
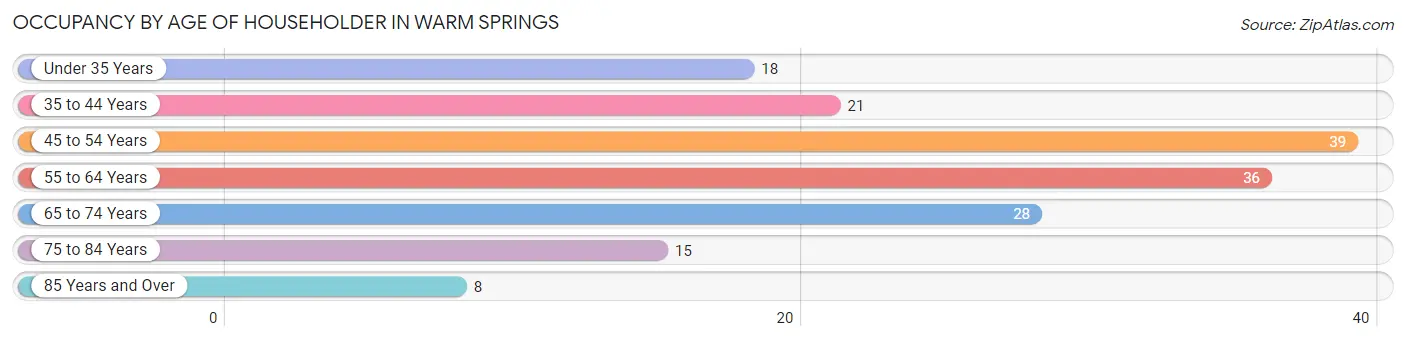
| Age Bracket | # Households | % Households |
| Under 35 Years | 18 | 10.9% |
| 35 to 44 Years | 21 | 12.7% |
| 45 to 54 Years | 39 | 23.6% |
| 55 to 64 Years | 36 | 21.8% |
| 65 to 74 Years | 28 | 17.0% |
| 75 to 84 Years | 15 | 9.1% |
| 85 Years and Over | 8 | 4.9% |
| Total | 165 | 100.0% |
Housing Finances in Warm Springs
Median Income by Occupancy in Warm Springs
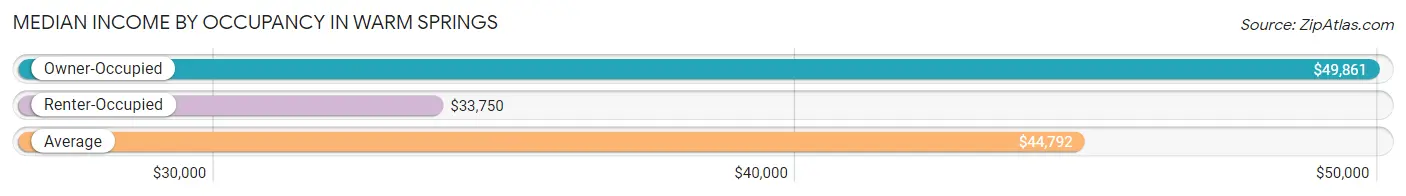
| Occupancy Type | # Households | Median Income |
| Owner-Occupied | 75 (45.5%) | $49,861 |
| Renter-Occupied | 90 (54.5%) | $33,750 |
| Average | 165 (100.0%) | $44,792 |
Occupancy by Householder Income Bracket in Warm Springs
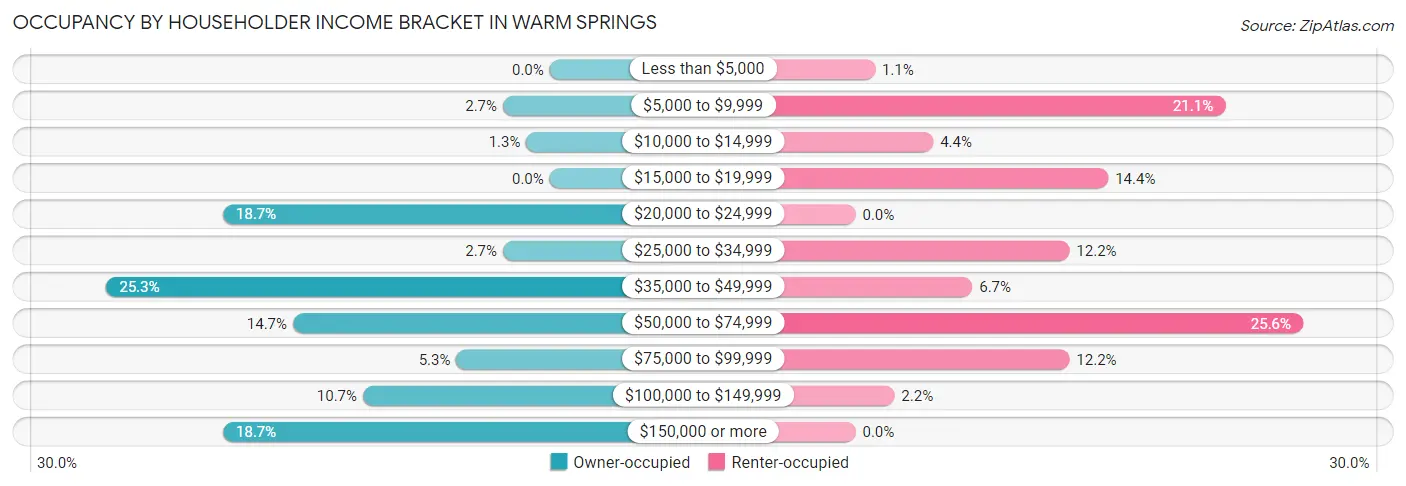
| Income Bracket | Owner-occupied | Renter-occupied |
| Less than $5,000 | 0 (0.0%) | 1 (1.1%) |
| $5,000 to $9,999 | 2 (2.7%) | 19 (21.1%) |
| $10,000 to $14,999 | 1 (1.3%) | 4 (4.4%) |
| $15,000 to $19,999 | 0 (0.0%) | 13 (14.4%) |
| $20,000 to $24,999 | 14 (18.7%) | 0 (0.0%) |
| $25,000 to $34,999 | 2 (2.7%) | 11 (12.2%) |
| $35,000 to $49,999 | 19 (25.3%) | 6 (6.7%) |
| $50,000 to $74,999 | 11 (14.7%) | 23 (25.6%) |
| $75,000 to $99,999 | 4 (5.3%) | 11 (12.2%) |
| $100,000 to $149,999 | 8 (10.7%) | 2 (2.2%) |
| $150,000 or more | 14 (18.7%) | 0 (0.0%) |
| Total | 75 (100.0%) | 90 (100.0%) |
Monthly Housing Cost Tiers in Warm Springs
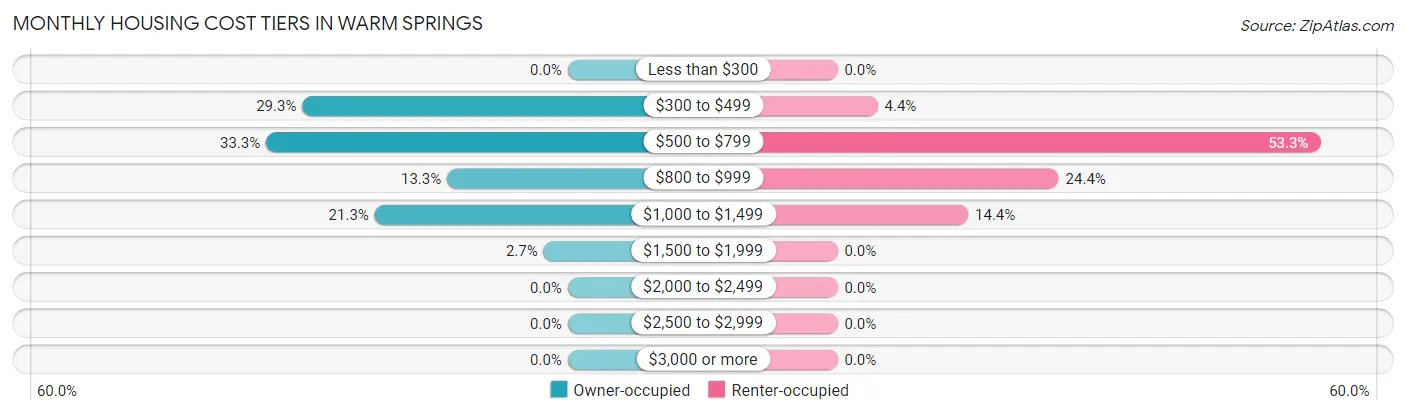
| Monthly Cost | Owner-occupied | Renter-occupied |
| Less than $300 | 0 (0.0%) | 0 (0.0%) |
| $300 to $499 | 22 (29.3%) | 4 (4.4%) |
| $500 to $799 | 25 (33.3%) | 48 (53.3%) |
| $800 to $999 | 10 (13.3%) | 22 (24.4%) |
| $1,000 to $1,499 | 16 (21.3%) | 13 (14.4%) |
| $1,500 to $1,999 | 2 (2.7%) | 0 (0.0%) |
| $2,000 to $2,499 | 0 (0.0%) | 0 (0.0%) |
| $2,500 to $2,999 | 0 (0.0%) | 0 (0.0%) |
| $3,000 or more | 0 (0.0%) | 0 (0.0%) |
| Total | 75 (100.0%) | 90 (100.0%) |
Physical Housing Characteristics in Warm Springs
Housing Structures in Warm Springs
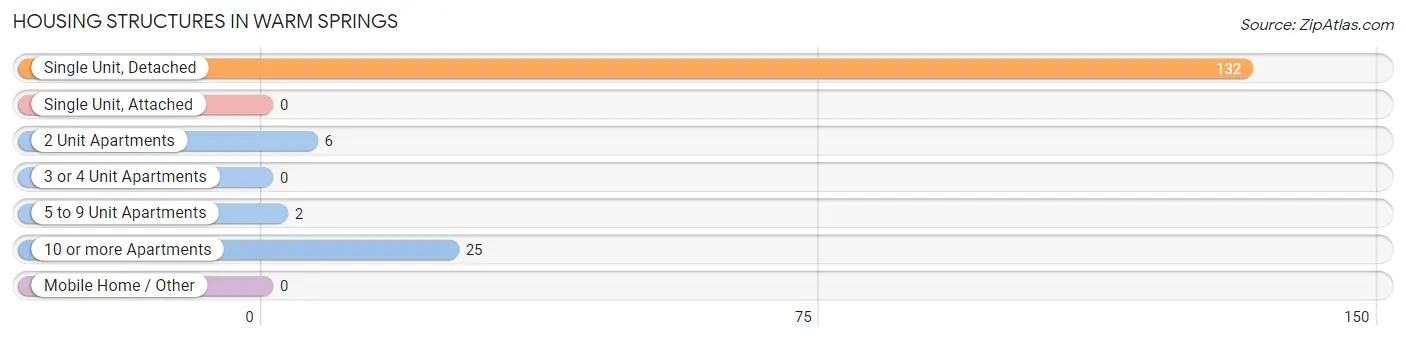
| Structure Type | # Housing Units | % Housing Units |
| Single Unit, Detached | 132 | 80.0% |
| Single Unit, Attached | 0 | 0.0% |
| 2 Unit Apartments | 6 | 3.6% |
| 3 or 4 Unit Apartments | 0 | 0.0% |
| 5 to 9 Unit Apartments | 2 | 1.2% |
| 10 or more Apartments | 25 | 15.1% |
| Mobile Home / Other | 0 | 0.0% |
| Total | 165 | 100.0% |
Housing Structures by Occupancy in Warm Springs
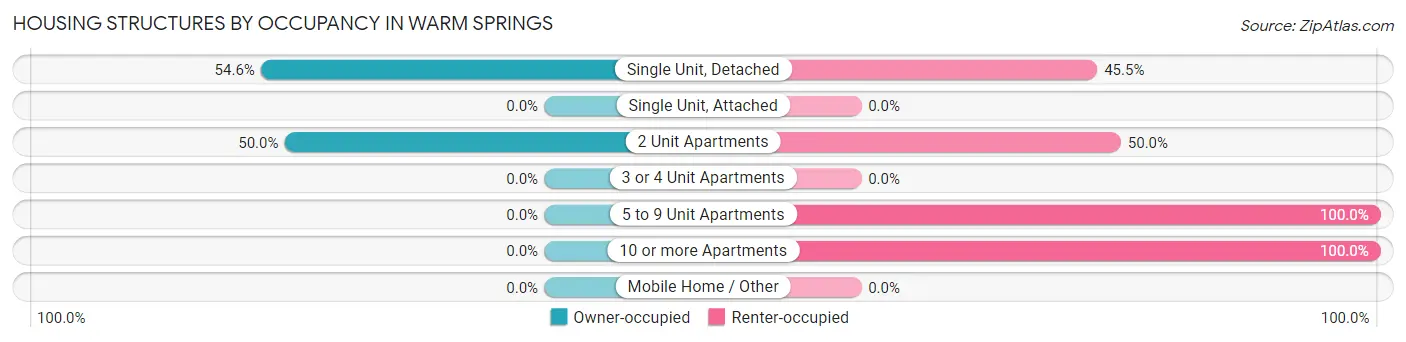
| Structure Type | Owner-occupied | Renter-occupied |
| Single Unit, Detached | 72 (54.5%) | 60 (45.5%) |
| Single Unit, Attached | 0 (0.0%) | 0 (0.0%) |
| 2 Unit Apartments | 3 (50.0%) | 3 (50.0%) |
| 3 or 4 Unit Apartments | 0 (0.0%) | 0 (0.0%) |
| 5 to 9 Unit Apartments | 0 (0.0%) | 2 (100.0%) |
| 10 or more Apartments | 0 (0.0%) | 25 (100.0%) |
| Mobile Home / Other | 0 (0.0%) | 0 (0.0%) |
| Total | 75 (45.5%) | 90 (54.5%) |
Housing Structures by Number of Rooms in Warm Springs
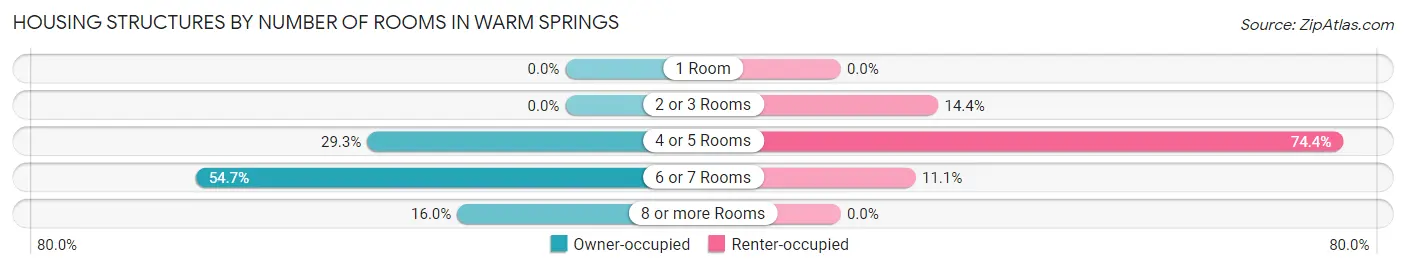
| Number of Rooms | Owner-occupied | Renter-occupied |
| 1 Room | 0 (0.0%) | 0 (0.0%) |
| 2 or 3 Rooms | 0 (0.0%) | 13 (14.4%) |
| 4 or 5 Rooms | 22 (29.3%) | 67 (74.4%) |
| 6 or 7 Rooms | 41 (54.7%) | 10 (11.1%) |
| 8 or more Rooms | 12 (16.0%) | 0 (0.0%) |
| Total | 75 (100.0%) | 90 (100.0%) |
Housing Structure by Heating Type in Warm Springs
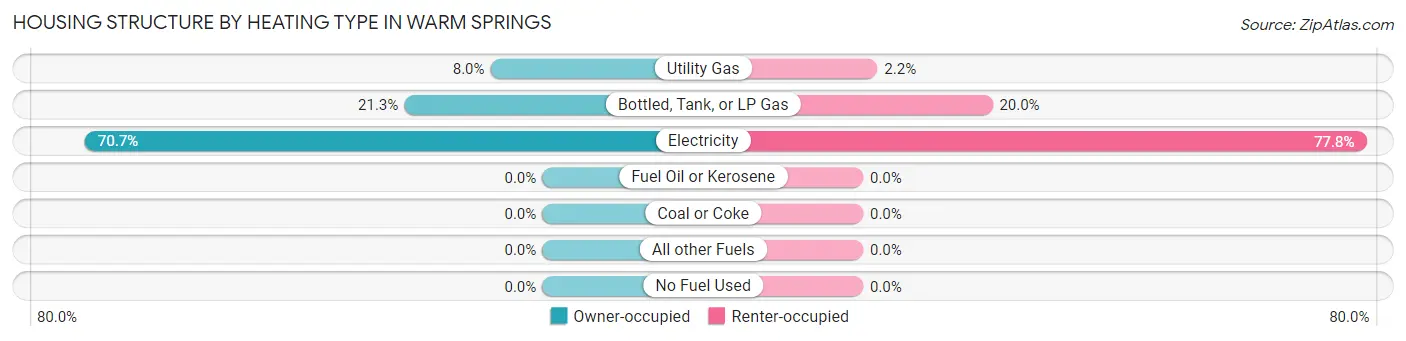
| Heating Type | Owner-occupied | Renter-occupied |
| Utility Gas | 6 (8.0%) | 2 (2.2%) |
| Bottled, Tank, or LP Gas | 16 (21.3%) | 18 (20.0%) |
| Electricity | 53 (70.7%) | 70 (77.8%) |
| Fuel Oil or Kerosene | 0 (0.0%) | 0 (0.0%) |
| Coal or Coke | 0 (0.0%) | 0 (0.0%) |
| All other Fuels | 0 (0.0%) | 0 (0.0%) |
| No Fuel Used | 0 (0.0%) | 0 (0.0%) |
| Total | 75 (100.0%) | 90 (100.0%) |
Household Vehicle Usage in Warm Springs
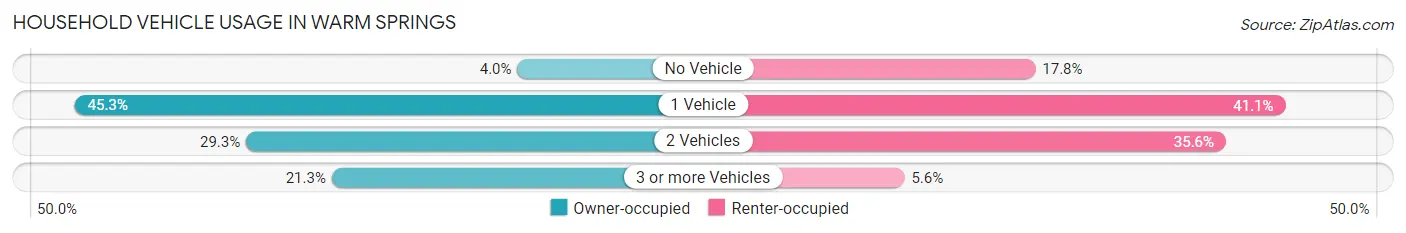
| Vehicles per Household | Owner-occupied | Renter-occupied |
| No Vehicle | 3 (4.0%) | 16 (17.8%) |
| 1 Vehicle | 34 (45.3%) | 37 (41.1%) |
| 2 Vehicles | 22 (29.3%) | 32 (35.6%) |
| 3 or more Vehicles | 16 (21.3%) | 5 (5.6%) |
| Total | 75 (100.0%) | 90 (100.0%) |
Real Estate & Mortgages in Warm Springs
Real Estate and Mortgage Overview in Warm Springs
| Characteristic | Without Mortgage | With Mortgage |
| Housing Units | 42 | 33 |
| Median Property Value | $120,800 | $129,700 |
| Median Household Income | $44,500 | $10 |
| Monthly Housing Costs | $600 | $0 |
| Real Estate Taxes | $1,431 | $1 |
Property Value by Mortgage Status in Warm Springs
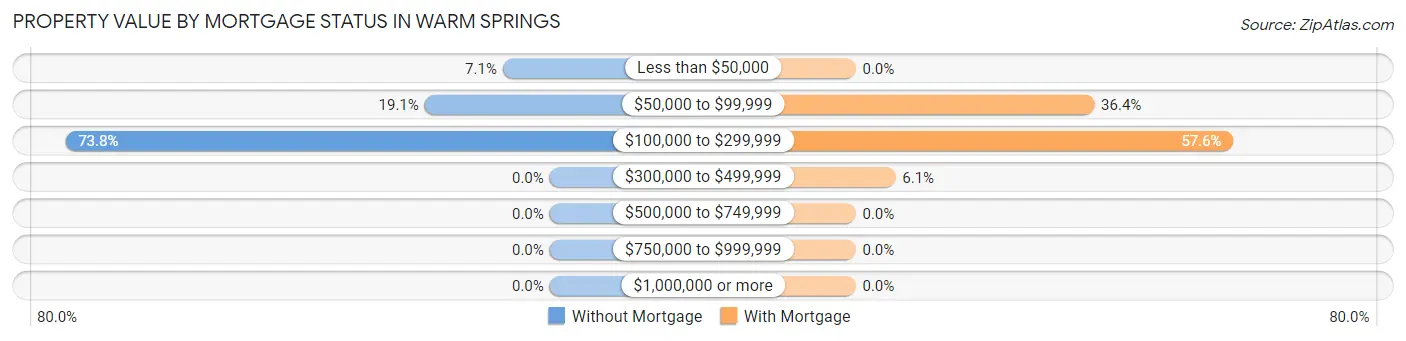
| Property Value | Without Mortgage | With Mortgage |
| Less than $50,000 | 3 (7.1%) | 0 (0.0%) |
| $50,000 to $99,999 | 8 (19.1%) | 12 (36.4%) |
| $100,000 to $299,999 | 31 (73.8%) | 19 (57.6%) |
| $300,000 to $499,999 | 0 (0.0%) | 2 (6.1%) |
| $500,000 to $749,999 | 0 (0.0%) | 0 (0.0%) |
| $750,000 to $999,999 | 0 (0.0%) | 0 (0.0%) |
| $1,000,000 or more | 0 (0.0%) | 0 (0.0%) |
| Total | 42 (100.0%) | 33 (100.0%) |
Household Income by Mortgage Status in Warm Springs
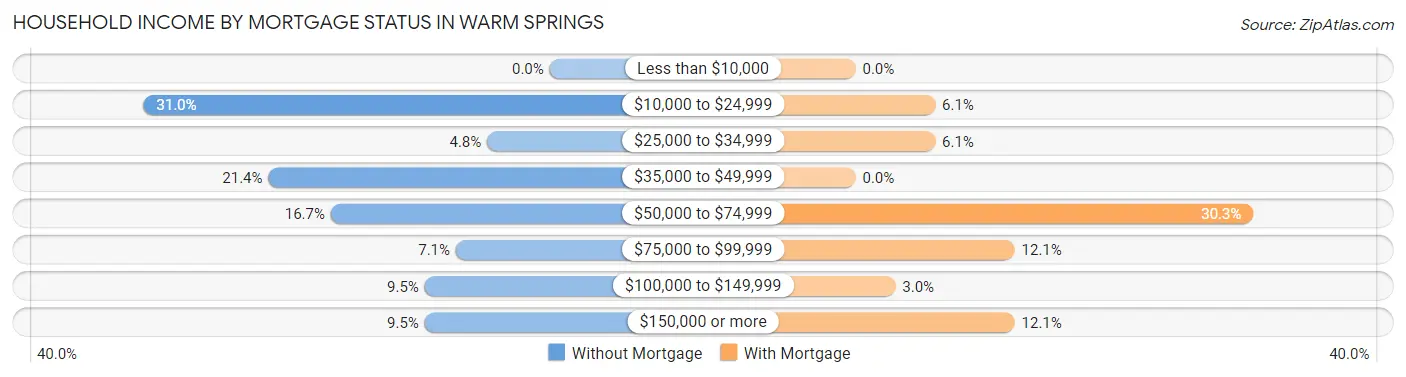
| Household Income | Without Mortgage | With Mortgage |
| Less than $10,000 | 0 (0.0%) | 0 (0.0%) |
| $10,000 to $24,999 | 13 (30.9%) | 2 (6.1%) |
| $25,000 to $34,999 | 2 (4.8%) | 2 (6.1%) |
| $35,000 to $49,999 | 9 (21.4%) | 0 (0.0%) |
| $50,000 to $74,999 | 7 (16.7%) | 10 (30.3%) |
| $75,000 to $99,999 | 3 (7.1%) | 4 (12.1%) |
| $100,000 to $149,999 | 4 (9.5%) | 1 (3.0%) |
| $150,000 or more | 4 (9.5%) | 4 (12.1%) |
| Total | 42 (100.0%) | 33 (100.0%) |
Property Value to Household Income Ratio in Warm Springs
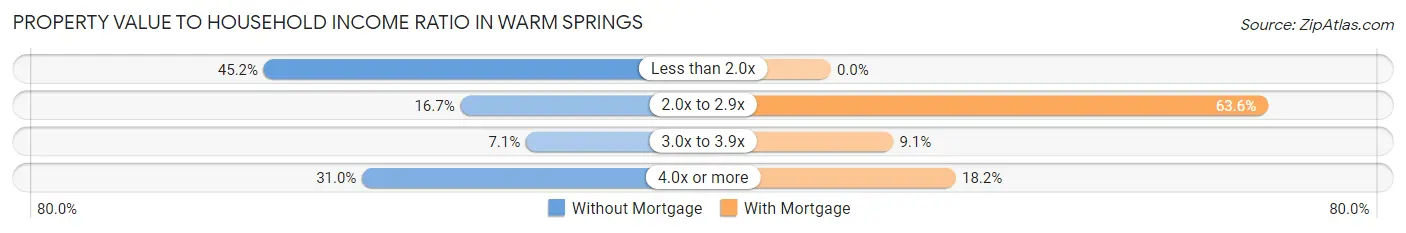
| Value-to-Income Ratio | Without Mortgage | With Mortgage |
| Less than 2.0x | 19 (45.2%) | 0 (0.0%) |
| 2.0x to 2.9x | 7 (16.7%) | 21 (63.6%) |
| 3.0x to 3.9x | 3 (7.1%) | 3 (9.1%) |
| 4.0x or more | 13 (30.9%) | 6 (18.2%) |
| Total | 42 (100.0%) | 33 (100.0%) |
Real Estate Taxes by Mortgage Status in Warm Springs
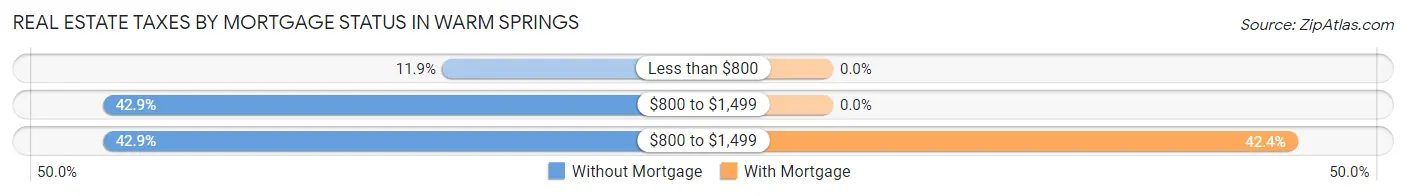
| Property Taxes | Without Mortgage | With Mortgage |
| Less than $800 | 5 (11.9%) | 0 (0.0%) |
| $800 to $1,499 | 18 (42.9%) | 0 (0.0%) |
| $800 to $1,499 | 18 (42.9%) | 14 (42.4%) |
| Total | 42 (100.0%) | 33 (100.0%) |
Health & Disability in Warm Springs
Health Insurance Coverage by Age in Warm Springs
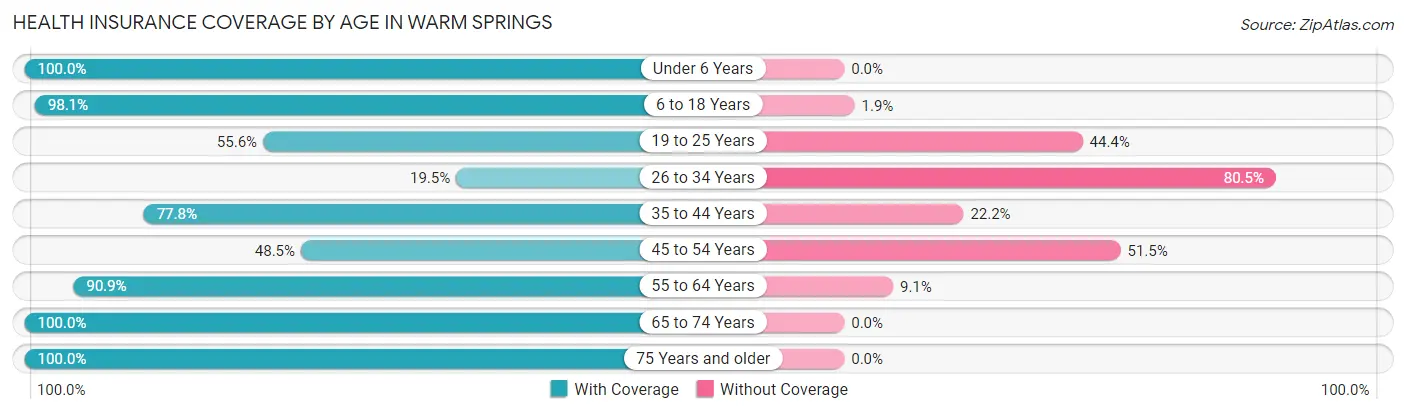
| Age Bracket | With Coverage | Without Coverage |
| Under 6 Years | 24 (100.0%) | 0 (0.0%) |
| 6 to 18 Years | 102 (98.1%) | 2 (1.9%) |
| 19 to 25 Years | 10 (55.6%) | 8 (44.4%) |
| 26 to 34 Years | 17 (19.5%) | 70 (80.5%) |
| 35 to 44 Years | 28 (77.8%) | 8 (22.2%) |
| 45 to 54 Years | 32 (48.5%) | 34 (51.5%) |
| 55 to 64 Years | 50 (90.9%) | 5 (9.1%) |
| 65 to 74 Years | 39 (100.0%) | 0 (0.0%) |
| 75 Years and older | 37 (100.0%) | 0 (0.0%) |
| Total | 339 (72.8%) | 127 (27.3%) |
Health Insurance Coverage by Citizenship Status in Warm Springs
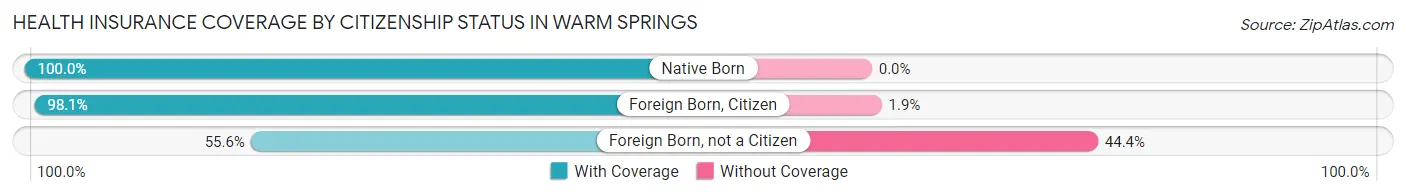
| Citizenship Status | With Coverage | Without Coverage |
| Native Born | 24 (100.0%) | 0 (0.0%) |
| Foreign Born, Citizen | 102 (98.1%) | 2 (1.9%) |
| Foreign Born, not a Citizen | 10 (55.6%) | 8 (44.4%) |
Health Insurance Coverage by Household Income in Warm Springs
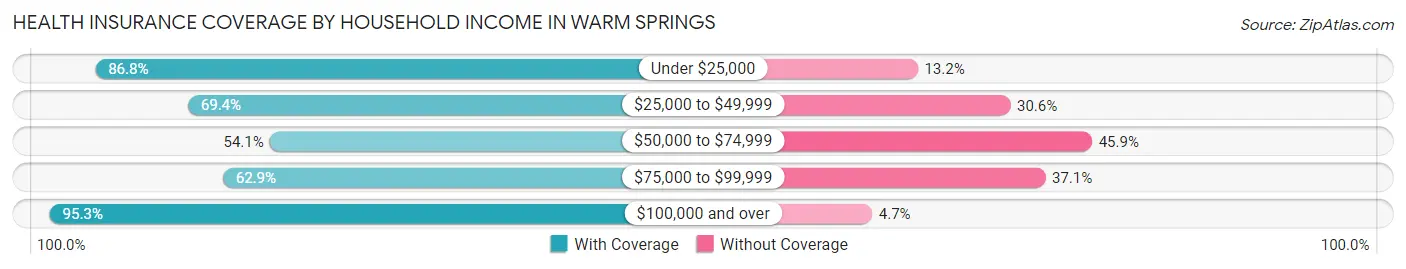
| Household Income | With Coverage | Without Coverage |
| Under $25,000 | 118 (86.8%) | 18 (13.2%) |
| $25,000 to $49,999 | 59 (69.4%) | 26 (30.6%) |
| $50,000 to $74,999 | 79 (54.1%) | 67 (45.9%) |
| $75,000 to $99,999 | 22 (62.9%) | 13 (37.1%) |
| $100,000 and over | 61 (95.3%) | 3 (4.7%) |
Public vs Private Health Insurance Coverage by Age in Warm Springs
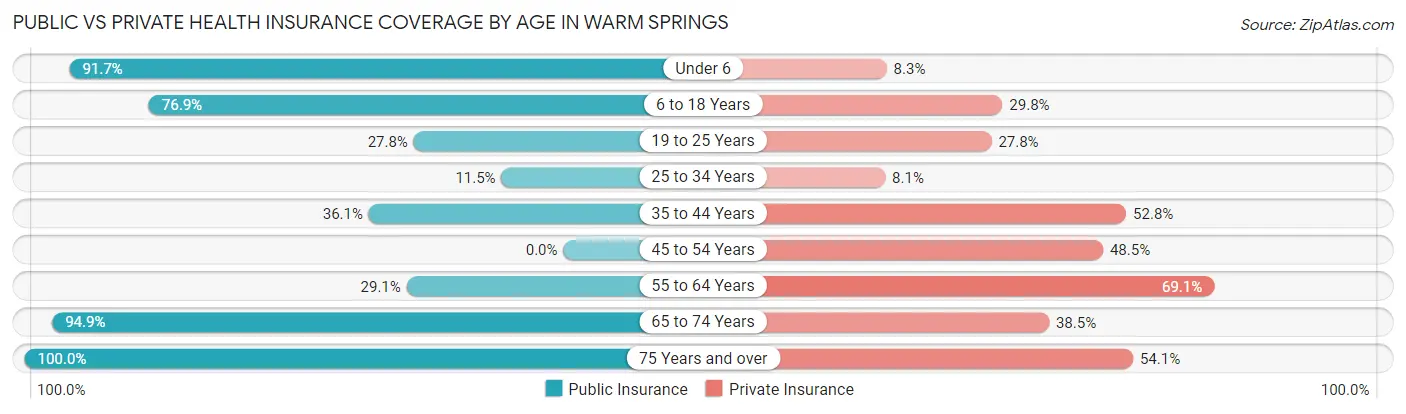
| Age Bracket | Public Insurance | Private Insurance |
| Under 6 | 22 (91.7%) | 2 (8.3%) |
| 6 to 18 Years | 80 (76.9%) | 31 (29.8%) |
| 19 to 25 Years | 5 (27.8%) | 5 (27.8%) |
| 25 to 34 Years | 10 (11.5%) | 7 (8.1%) |
| 35 to 44 Years | 13 (36.1%) | 19 (52.8%) |
| 45 to 54 Years | 0 (0.0%) | 32 (48.5%) |
| 55 to 64 Years | 16 (29.1%) | 38 (69.1%) |
| 65 to 74 Years | 37 (94.9%) | 15 (38.5%) |
| 75 Years and over | 37 (100.0%) | 20 (54.0%) |
| Total | 220 (47.2%) | 169 (36.3%) |
Disability Status by Sex by Age in Warm Springs
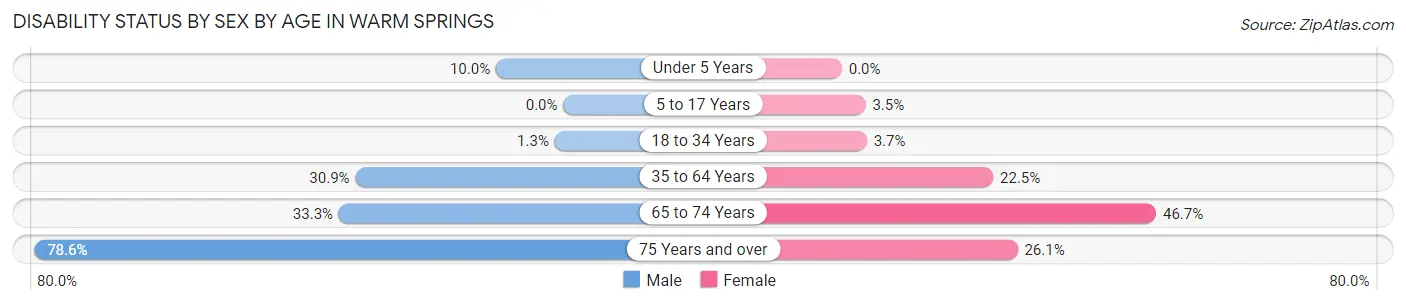
| Age Bracket | Male | Female |
| Under 5 Years | 1 (10.0%) | 0 (0.0%) |
| 5 to 17 Years | 0 (0.0%) | 2 (3.5%) |
| 18 to 34 Years | 1 (1.3%) | 1 (3.7%) |
| 35 to 64 Years | 21 (30.9%) | 20 (22.5%) |
| 65 to 74 Years | 3 (33.3%) | 14 (46.7%) |
| 75 Years and over | 11 (78.6%) | 6 (26.1%) |
Disability Class by Sex by Age in Warm Springs
Disability Class: Hearing Difficulty
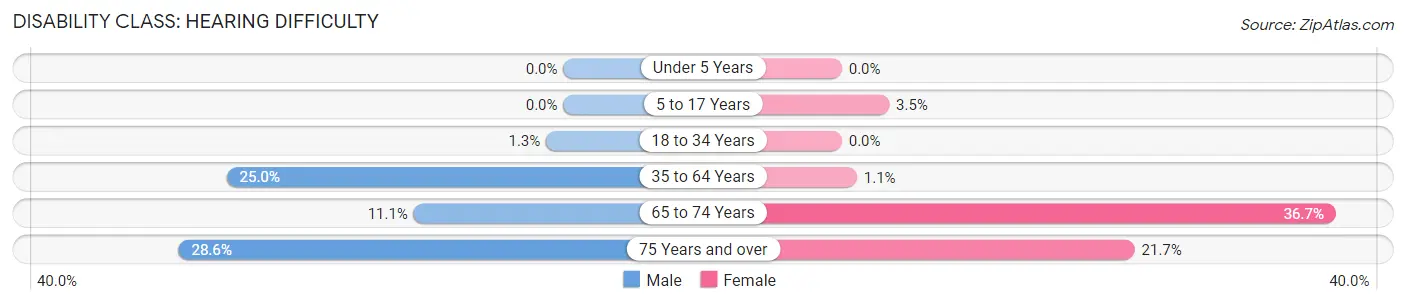
| Age Bracket | Male | Female |
| Under 5 Years | 0 (0.0%) | 0 (0.0%) |
| 5 to 17 Years | 0 (0.0%) | 2 (3.5%) |
| 18 to 34 Years | 1 (1.3%) | 0 (0.0%) |
| 35 to 64 Years | 17 (25.0%) | 1 (1.1%) |
| 65 to 74 Years | 1 (11.1%) | 11 (36.7%) |
| 75 Years and over | 4 (28.6%) | 5 (21.7%) |
Disability Class: Vision Difficulty
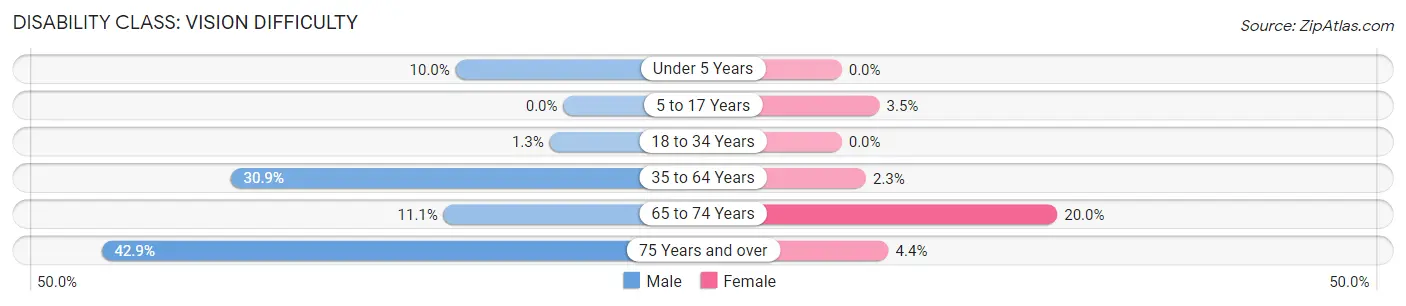
| Age Bracket | Male | Female |
| Under 5 Years | 1 (10.0%) | 0 (0.0%) |
| 5 to 17 Years | 0 (0.0%) | 2 (3.5%) |
| 18 to 34 Years | 1 (1.3%) | 0 (0.0%) |
| 35 to 64 Years | 21 (30.9%) | 2 (2.2%) |
| 65 to 74 Years | 1 (11.1%) | 6 (20.0%) |
| 75 Years and over | 6 (42.9%) | 1 (4.3%) |
Disability Class: Cognitive Difficulty
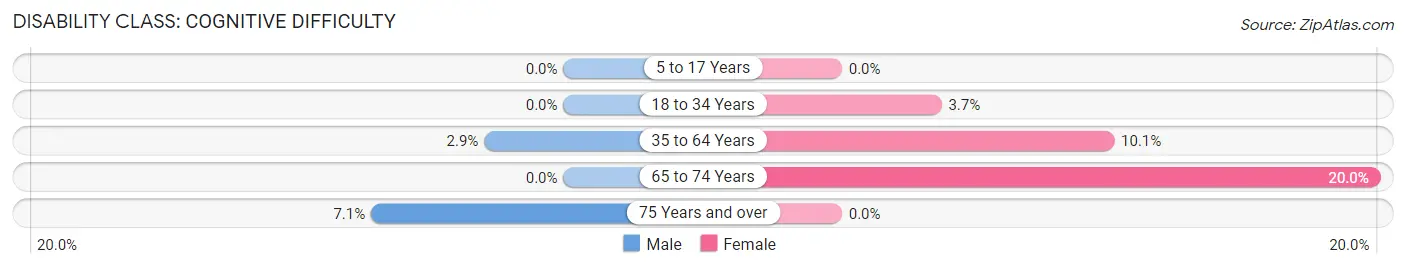
| Age Bracket | Male | Female |
| 5 to 17 Years | 0 (0.0%) | 0 (0.0%) |
| 18 to 34 Years | 0 (0.0%) | 1 (3.7%) |
| 35 to 64 Years | 2 (2.9%) | 9 (10.1%) |
| 65 to 74 Years | 0 (0.0%) | 6 (20.0%) |
| 75 Years and over | 1 (7.1%) | 0 (0.0%) |
Disability Class: Ambulatory Difficulty
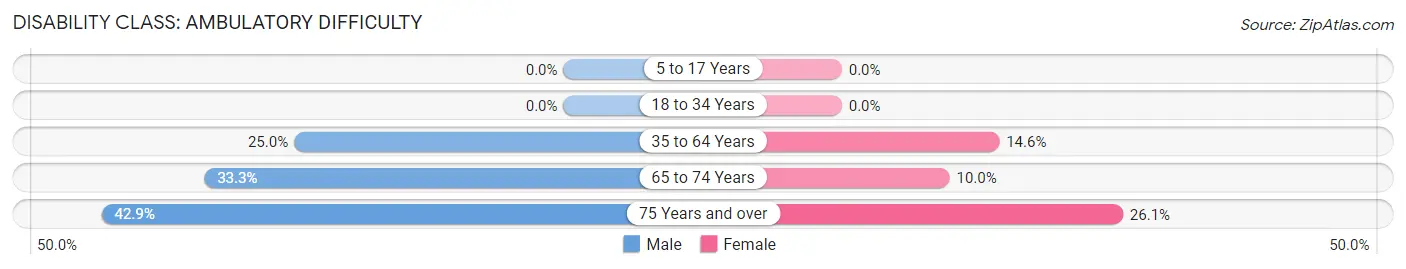
| Age Bracket | Male | Female |
| 5 to 17 Years | 0 (0.0%) | 0 (0.0%) |
| 18 to 34 Years | 0 (0.0%) | 0 (0.0%) |
| 35 to 64 Years | 17 (25.0%) | 13 (14.6%) |
| 65 to 74 Years | 3 (33.3%) | 3 (10.0%) |
| 75 Years and over | 6 (42.9%) | 6 (26.1%) |
Disability Class: Self-Care Difficulty
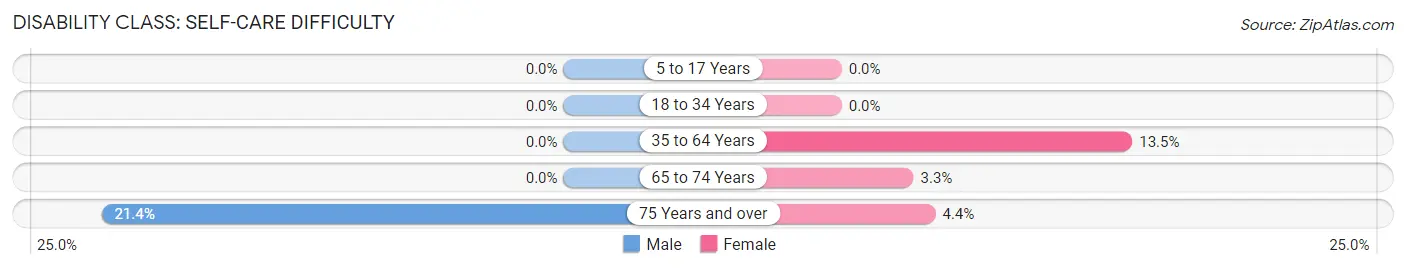
| Age Bracket | Male | Female |
| 5 to 17 Years | 0 (0.0%) | 0 (0.0%) |
| 18 to 34 Years | 0 (0.0%) | 0 (0.0%) |
| 35 to 64 Years | 0 (0.0%) | 12 (13.5%) |
| 65 to 74 Years | 0 (0.0%) | 1 (3.3%) |
| 75 Years and over | 3 (21.4%) | 1 (4.3%) |
Technology Access in Warm Springs
Computing Device Access in Warm Springs
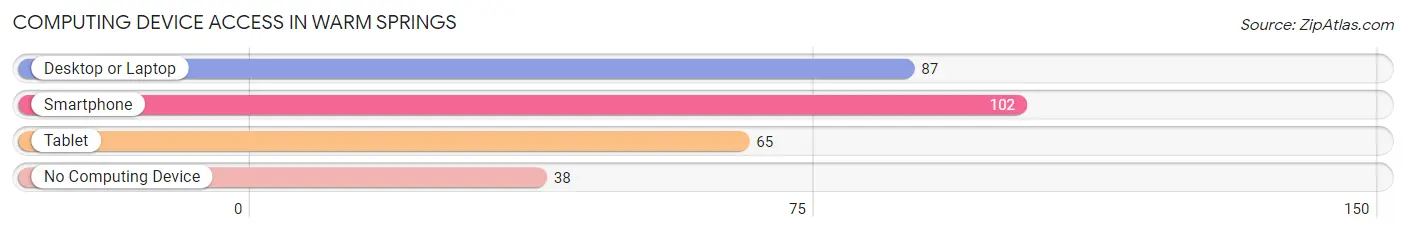
| Device Type | # Households | % Households |
| Desktop or Laptop | 87 | 52.7% |
| Smartphone | 102 | 61.8% |
| Tablet | 65 | 39.4% |
| No Computing Device | 38 | 23.0% |
| Total | 165 | 100.0% |
Internet Access in Warm Springs
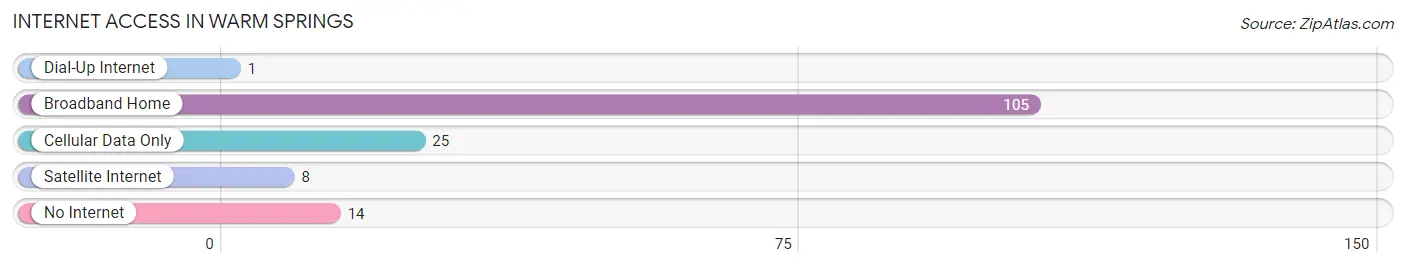
| Internet Type | # Households | % Households |
| Dial-Up Internet | 1 | 0.6% |
| Broadband Home | 105 | 63.6% |
| Cellular Data Only | 25 | 15.1% |
| Satellite Internet | 8 | 4.9% |
| No Internet | 14 | 8.5% |
| Total | 165 | 100.0% |
Warm Springs Summary
Warm Springs, Georgia is a small town located in Meriwether County, Georgia, United States. It is situated in the foothills of the Appalachian Mountains, approximately 70 miles southwest of Atlanta. The town is best known as the home of President Franklin D. Roosevelt, who established the Little White House there in 1932.
History
The area that is now Warm Springs has been inhabited for thousands of years. The Creek and Cherokee Native American tribes were the first to settle in the area, and the town was originally known as Bullochville. The town was renamed Warm Springs in 1832, after the natural springs that were discovered in the area. The springs were believed to have healing properties, and the town quickly became a popular destination for those seeking relief from various ailments.
In the late 19th century, the town began to attract wealthy visitors from the North, who built grand hotels and resorts in the area. One of the most famous visitors was President Franklin D. Roosevelt, who first visited Warm Springs in 1924. He was so taken with the area that he purchased a home there in 1932, which he named the Little White House. Roosevelt used the Little White House as a retreat from the pressures of the presidency, and he often invited friends and dignitaries to stay with him there.
Geography
Warm Springs is located in Meriwether County, Georgia, approximately 70 miles southwest of Atlanta. The town is situated in the foothills of the Appalachian Mountains, and is surrounded by rolling hills and lush forests. The town is located on the banks of the Chattahoochee River, and is home to several natural springs, which are believed to have healing properties.
The climate in Warm Springs is mild and humid, with hot summers and mild winters. The average temperature in the summer is around 80 degrees Fahrenheit, and the average temperature in the winter is around 50 degrees Fahrenheit.
Economy
The economy of Warm Springs is largely based on tourism. The town is home to several resorts and hotels, which attract visitors from all over the world. The town is also home to several historic sites, including the Little White House, which is a popular tourist attraction.
In addition to tourism, the town is also home to several small businesses, including restaurants, shops, and other services. The town is also home to several manufacturing companies, which produce a variety of products, including furniture, clothing, and electronics.
Demographics
As of the 2010 census, the population of Warm Springs was 1,766. The racial makeup of the town was 79.3% White, 17.2% African American, 0.3% Native American, 0.2% Asian, 0.1% Pacific Islander, and 2.9% from other races. The median household income was $30,938, and the median family income was $37,813.
Conclusion
Warm Springs, Georgia is a small town located in Meriwether County, Georgia, United States. It is situated in the foothills of the Appalachian Mountains, approximately 70 miles southwest of Atlanta. The town is best known as the home of President Franklin D. Roosevelt, who established the Little White House there in 1932. The economy of Warm Springs is largely based on tourism, and the town is home to several resorts and hotels, as well as several small businesses. As of the 2010 census, the population of Warm Springs was 1,766. The racial makeup of the town was 79.3% White, 17.2% African American, 0.3% Native American, 0.2% Asian, 0.1% Pacific Islander, and 2.9% from other races.
Common Questions
What is Per Capita Income in Warm Springs?
Per Capita income in Warm Springs is $21,704.
What is the Median Family Income in Warm Springs?
Median Family Income in Warm Springs is $52,885.
What is the Median Household income in Warm Springs?
Median Household Income in Warm Springs is $44,792.
What is Income or Wage Gap in Warm Springs?
Income or Wage Gap in Warm Springs is 31.7%.
Women in Warm Springs earn 68.3 cents for every dollar earned by a man.
What is Inequality or Gini Index in Warm Springs?
Inequality or Gini Index in Warm Springs is 0.43.
What is the Total Population of Warm Springs?
Total Population of Warm Springs is 543.
What is the Total Male Population of Warm Springs?
Total Male Population of Warm Springs is 244.
What is the Total Female Population of Warm Springs?
Total Female Population of Warm Springs is 299.
What is the Ratio of Males per 100 Females in Warm Springs?
There are 81.61 Males per 100 Females in Warm Springs.
What is the Ratio of Females per 100 Males in Warm Springs?
There are 122.54 Females per 100 Males in Warm Springs.
What is the Median Population Age in Warm Springs?
Median Population Age in Warm Springs is 47.1 Years.
What is the Average Family Size in Warm Springs
Average Family Size in Warm Springs is 3.3 People.
What is the Average Household Size in Warm Springs
Average Household Size in Warm Springs is 2.8 People.
How Large is the Labor Force in Warm Springs?
There are 205 People in the Labor Forcein in Warm Springs.
What is the Percentage of People in the Labor Force in Warm Springs?
47.7% of People are in the Labor Force in Warm Springs.
What is the Unemployment Rate in Warm Springs?
Unemployment Rate in Warm Springs is 3.9%.