Zip Codes with the Highest Percentage of Population Employed in Food Preparation & Serving in Mc Rae Helena, GA
RELATED REPORTS & OPTIONS
Food Preparation & Serving
Mc Rae Helena
Compare Zip Codes
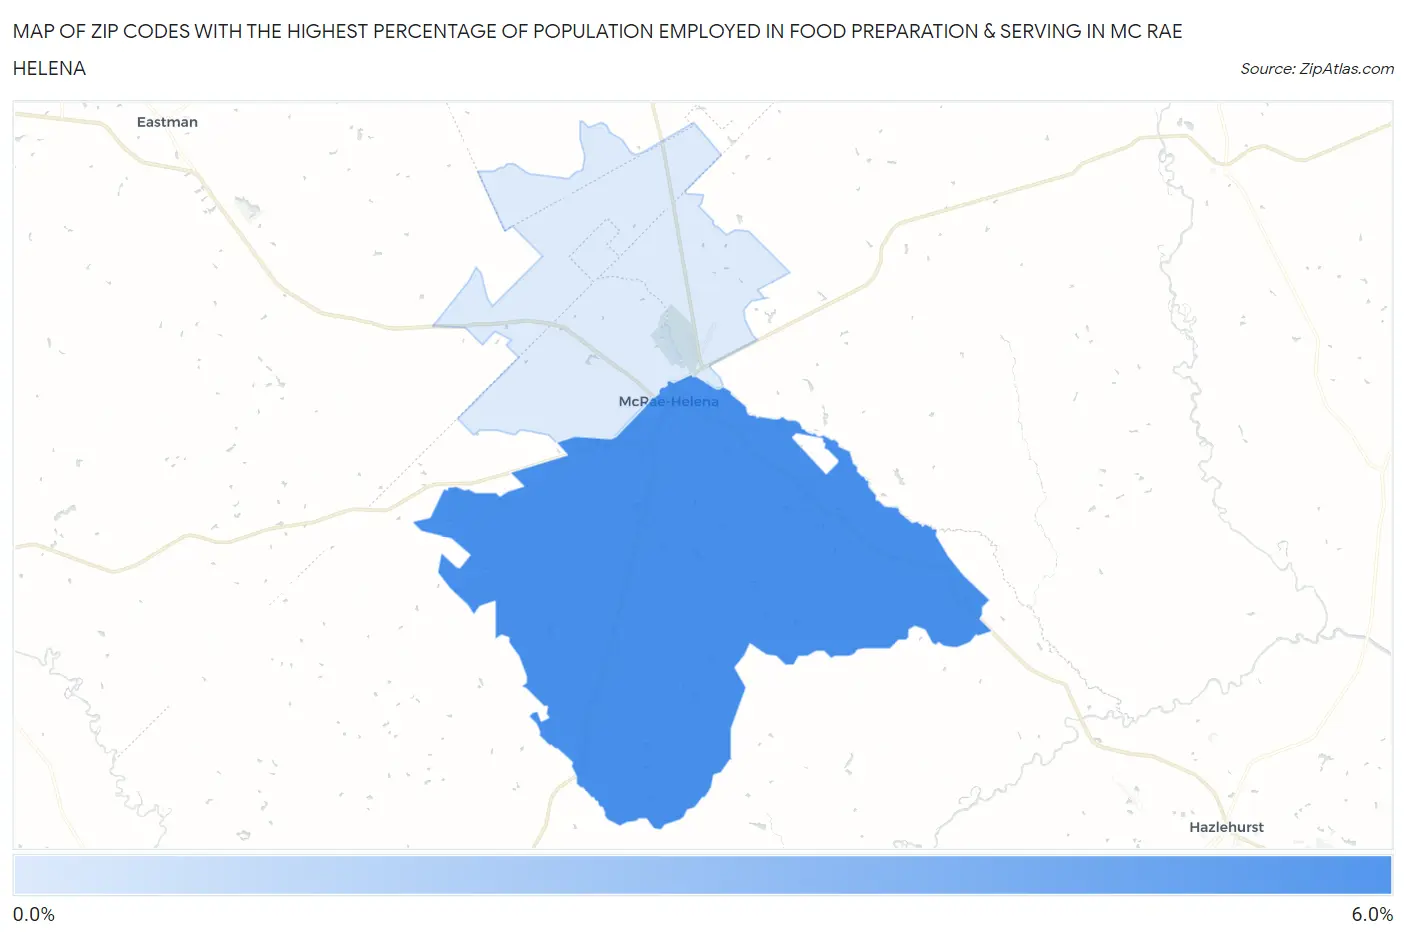
Map of Zip Codes with the Highest Percentage of Population Employed in Food Preparation & Serving in Mc Rae Helena
1.2%
5.8%
Zip Codes with the Highest Percentage of Population Employed in Food Preparation & Serving in Mc Rae Helena, GA
| Zip Code | % Employed | vs State | vs National | |
| 1. | 31055 | 5.8% | 5.1%(+0.623)#232 | 5.3%(+0.482)#10,128 |
| 2. | 31037 | 1.2% | 5.1%(-3.98)#624 | 5.3%(-4.12)#26,666 |
1
Common Questions
What are the Top Zip Codes with the Highest Percentage of Population Employed in Food Preparation & Serving in Mc Rae Helena, GA?
Top Zip Codes with the Highest Percentage of Population Employed in Food Preparation & Serving in Mc Rae Helena, GA are:
What zip code has the Highest Percentage of Population Employed in Food Preparation & Serving in Mc Rae Helena, GA?
31055 has the Highest Percentage of Population Employed in Food Preparation & Serving in Mc Rae Helena, GA with 5.8%.
What is the Percentage of Population Employed in Food Preparation & Serving in Georgia?
Percentage of Population Employed in Food Preparation & Serving in Georgia is 5.1%.
What is the Percentage of Population Employed in Food Preparation & Serving in the United States?
Percentage of Population Employed in Food Preparation & Serving in the United States is 5.3%.