Rebecca, GA Map & Demographics
Rebecca Map
Rebecca Overview
$30,262
PER CAPITA INCOME
$67,188
AVG FAMILY INCOME
$59,934
AVG HOUSEHOLD INCOME
45.8%
WAGE / INCOME GAP [ % ]
54.2¢/ $1
WAGE / INCOME GAP [ $ ]
0.28
INEQUALITY / GINI INDEX
315
TOTAL POPULATION
158
MALE POPULATION
157
FEMALE POPULATION
100.64
MALES / 100 FEMALES
99.37
FEMALES / 100 MALES
43.5
MEDIAN AGE
2.8
AVG FAMILY SIZE
2.4
AVG HOUSEHOLD SIZE
154
LABOR FORCE [ PEOPLE ]
57.9%
PERCENT IN LABOR FORCE
3.9%
UNEMPLOYMENT RATE
Rebecca Zip Codes
Rebecca Area Codes
Income in Rebecca
Income Overview in Rebecca
Per Capita Income in Rebecca is $30,262, while median incomes of families and households are $67,188 and $59,934 respectively.
| Characteristic | Number | Measure |
| Per Capita Income | 315 | $30,262 |
| Median Family Income | 79 | $67,188 |
| Mean Family Income | 79 | $76,561 |
| Median Household Income | 129 | $59,934 |
| Mean Household Income | 129 | $65,926 |
| Income Deficit | 79 | $0 |
| Wage / Income Gap (%) | 315 | 45.77% |
| Wage / Income Gap ($) | 315 | 54.23¢ per $1 |
| Gini / Inequality Index | 315 | 0.28 |
Earnings by Sex in Rebecca
Average Earnings in Rebecca are $34,345, $24,792 for men and $45,714 for women, a difference of 45.8%.
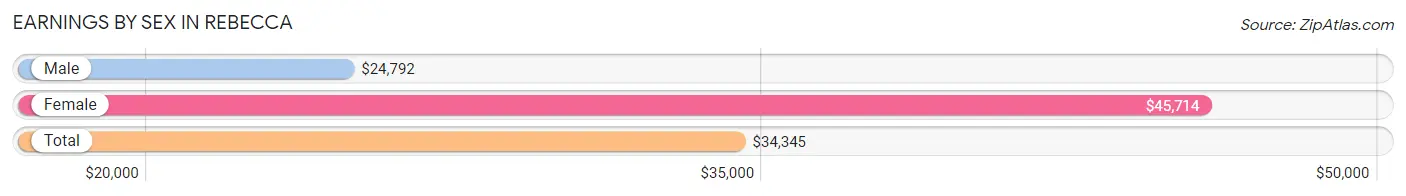
| Sex | Number | Average Earnings |
| Male | 87 (56.1%) | $24,792 |
| Female | 68 (43.9%) | $45,714 |
| Total | 155 (100.0%) | $34,345 |
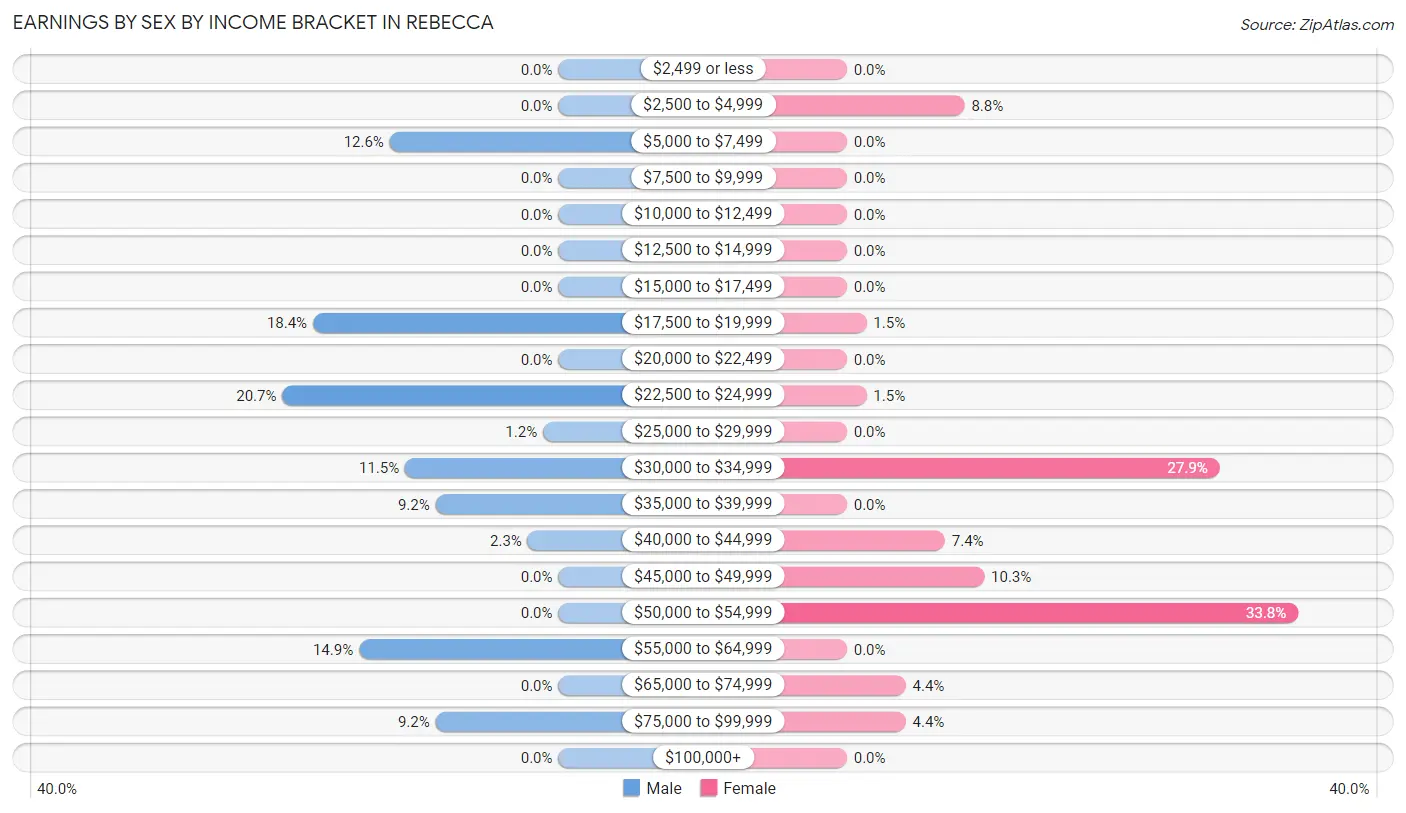
Earnings by Sex by Income Bracket in Rebecca
The most common earnings brackets in Rebecca are $22,500 to $24,999 for men (18 | 20.7%) and $50,000 to $54,999 for women (23 | 33.8%).
| Income | Male | Female |
| $2,499 or less | 0 (0.0%) | 0 (0.0%) |
| $2,500 to $4,999 | 0 (0.0%) | 6 (8.8%) |
| $5,000 to $7,499 | 11 (12.6%) | 0 (0.0%) |
| $7,500 to $9,999 | 0 (0.0%) | 0 (0.0%) |
| $10,000 to $12,499 | 0 (0.0%) | 0 (0.0%) |
| $12,500 to $14,999 | 0 (0.0%) | 0 (0.0%) |
| $15,000 to $17,499 | 0 (0.0%) | 0 (0.0%) |
| $17,500 to $19,999 | 16 (18.4%) | 1 (1.5%) |
| $20,000 to $22,499 | 0 (0.0%) | 0 (0.0%) |
| $22,500 to $24,999 | 18 (20.7%) | 1 (1.5%) |
| $25,000 to $29,999 | 1 (1.1%) | 0 (0.0%) |
| $30,000 to $34,999 | 10 (11.5%) | 19 (27.9%) |
| $35,000 to $39,999 | 8 (9.2%) | 0 (0.0%) |
| $40,000 to $44,999 | 2 (2.3%) | 5 (7.3%) |
| $45,000 to $49,999 | 0 (0.0%) | 7 (10.3%) |
| $50,000 to $54,999 | 0 (0.0%) | 23 (33.8%) |
| $55,000 to $64,999 | 13 (14.9%) | 0 (0.0%) |
| $65,000 to $74,999 | 0 (0.0%) | 3 (4.4%) |
| $75,000 to $99,999 | 8 (9.2%) | 3 (4.4%) |
| $100,000+ | 0 (0.0%) | 0 (0.0%) |
| Total | 87 (100.0%) | 68 (100.0%) |
Earnings by Sex by Educational Attainment in Rebecca
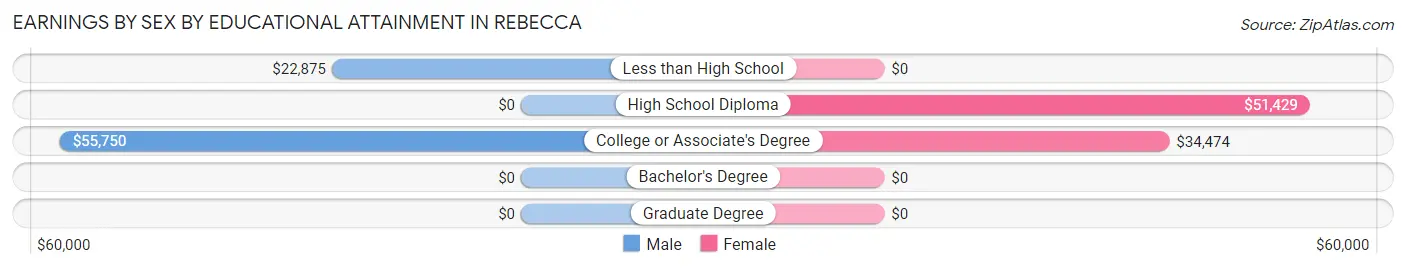
| Educational Attainment | Male Income | Female Income |
| Less than High School | $22,875 | $0 |
| High School Diploma | - | - |
| College or Associate's Degree | $55,750 | $34,474 |
| Bachelor's Degree | - | - |
| Graduate Degree | - | - |
| Total | - | - |
Family Income in Rebecca
Family Income Brackets in Rebecca
According to the Rebecca family income data, there are 26 families falling into the $50,000 to $74,999 income range, which is the most common income bracket and makes up 32.9% of all families.
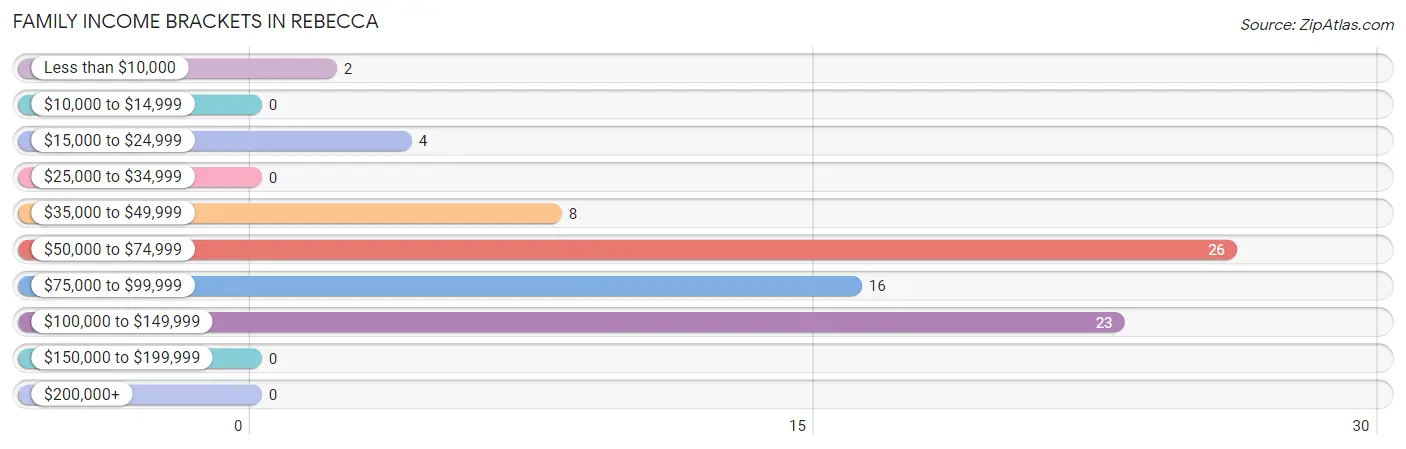
| Income Bracket | # Families | % Families |
| Less than $10,000 | 2 | 2.5% |
| $10,000 to $14,999 | 0 | 0.0% |
| $15,000 to $24,999 | 4 | 5.1% |
| $25,000 to $34,999 | 0 | 0.0% |
| $35,000 to $49,999 | 8 | 10.1% |
| $50,000 to $74,999 | 26 | 32.9% |
| $75,000 to $99,999 | 16 | 20.3% |
| $100,000 to $149,999 | 23 | 29.1% |
| $150,000 to $199,999 | 0 | 0.0% |
| $200,000+ | 0 | 0.0% |
Family Income by Famaliy Size in Rebecca
2-person families (57 | 72.2%) account for the highest median family income in Rebecca with $66,563 per family, while 2-person families (57 | 72.2%) have the highest median income of $33,282 per family member.
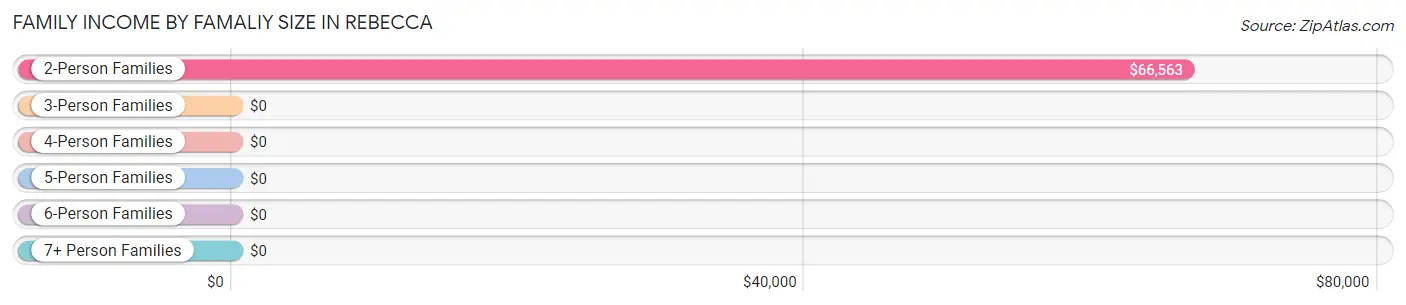
| Income Bracket | # Families | Median Income |
| 2-Person Families | 57 (72.2%) | $66,563 |
| 3-Person Families | 17 (21.5%) | $0 |
| 4-Person Families | 5 (6.3%) | $0 |
| 5-Person Families | 0 (0.0%) | $0 |
| 6-Person Families | 0 (0.0%) | $0 |
| 7+ Person Families | 0 (0.0%) | $0 |
| Total | 79 (100.0%) | $67,188 |
Family Income by Number of Earners in Rebecca
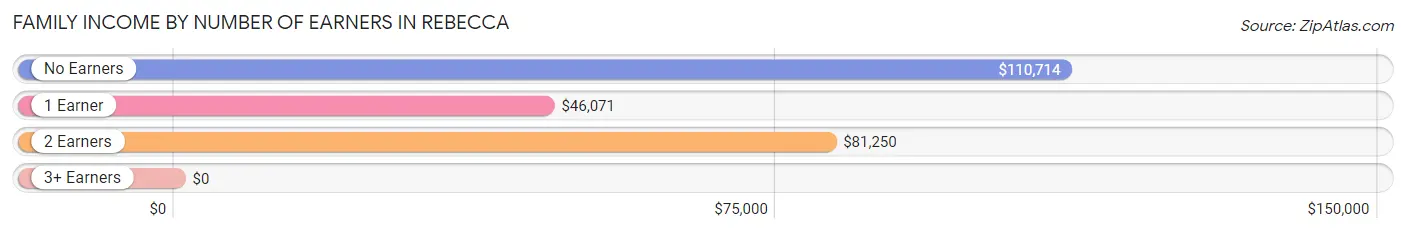
| Number of Earners | # Families | Median Income |
| No Earners | 14 (17.7%) | $110,714 |
| 1 Earner | 16 (20.3%) | $46,071 |
| 2 Earners | 49 (62.0%) | $81,250 |
| 3+ Earners | 0 (0.0%) | $0 |
| Total | 79 (100.0%) | $67,188 |
Household Income in Rebecca
Household Income Brackets in Rebecca
With 50 households falling in the category, the $50,000 to $74,999 income range is the most frequent in Rebecca, accounting for 38.8% of all households.
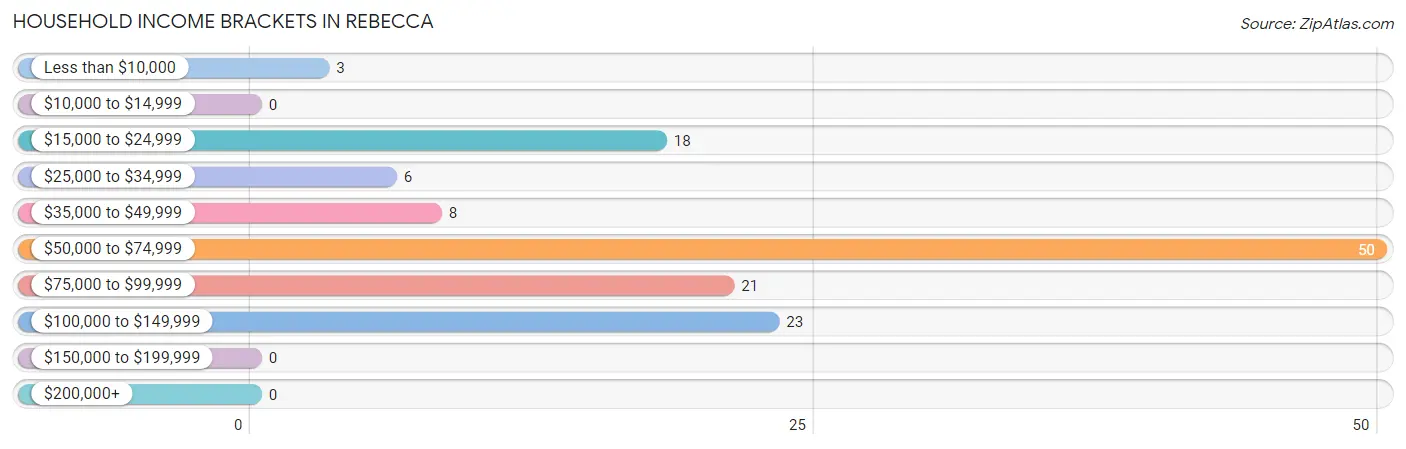
| Income Bracket | # Households | % Households |
| Less than $10,000 | 3 | 2.3% |
| $10,000 to $14,999 | 0 | 0.0% |
| $15,000 to $24,999 | 18 | 14.0% |
| $25,000 to $34,999 | 6 | 4.7% |
| $35,000 to $49,999 | 8 | 6.2% |
| $50,000 to $74,999 | 50 | 38.8% |
| $75,000 to $99,999 | 21 | 16.3% |
| $100,000 to $149,999 | 23 | 17.8% |
| $150,000 to $199,999 | 0 | 0.0% |
| $200,000+ | 0 | 0.0% |
Household Income by Householder Age in Rebecca
The median household income in Rebecca is $59,934, with the highest median household income of $65,417 found in the 65+ years age bracket for the primary householder. A total of 13 households (10.1%) fall into this category. Meanwhile, the 15 to 24 years age bracket for the primary householder has the lowest median household income of $0, with 13 households (10.1%) in this group.

| Income Bracket | # Households | Median Income |
| 15 to 24 Years | 13 (10.1%) | $0 |
| 25 to 44 Years | 35 (27.1%) | $57,125 |
| 45 to 64 Years | 68 (52.7%) | $59,737 |
| 65+ Years | 13 (10.1%) | $65,417 |
| Total | 129 (100.0%) | $59,934 |
Poverty in Rebecca
Income Below Poverty by Sex and Age in Rebecca
With 5.5% poverty level for males and 20.4% for females among the residents of Rebecca, 25 to 34 year old males and under 5 year old females are the most vulnerable to poverty, with 7 males (25.0%) and 7 females (100.0%) in their respective age groups living below the poverty level.
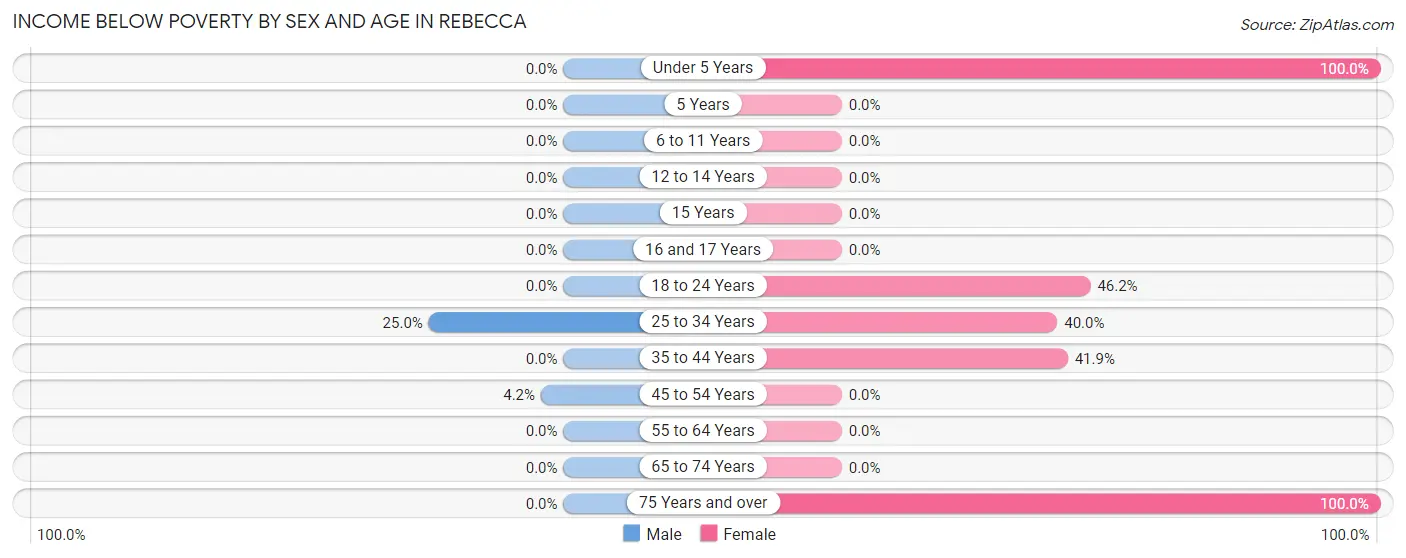
| Age Bracket | Male | Female |
| Under 5 Years | 0 (0.0%) | 7 (100.0%) |
| 5 Years | 0 (0.0%) | 0 (0.0%) |
| 6 to 11 Years | 0 (0.0%) | 0 (0.0%) |
| 12 to 14 Years | 0 (0.0%) | 0 (0.0%) |
| 15 Years | 0 (0.0%) | 0 (0.0%) |
| 16 and 17 Years | 0 (0.0%) | 0 (0.0%) |
| 18 to 24 Years | 0 (0.0%) | 6 (46.2%) |
| 25 to 34 Years | 7 (25.0%) | 2 (40.0%) |
| 35 to 44 Years | 0 (0.0%) | 13 (41.9%) |
| 45 to 54 Years | 1 (4.2%) | 0 (0.0%) |
| 55 to 64 Years | 0 (0.0%) | 0 (0.0%) |
| 65 to 74 Years | 0 (0.0%) | 0 (0.0%) |
| 75 Years and over | 0 (0.0%) | 4 (100.0%) |
| Total | 8 (5.5%) | 32 (20.4%) |
Income Above Poverty by Sex and Age in Rebecca
According to the poverty statistics in Rebecca, males aged 18 to 24 years and females aged 6 to 11 years are the age groups that are most secure financially, with 100.0% of males and 100.0% of females in these age groups living above the poverty line.
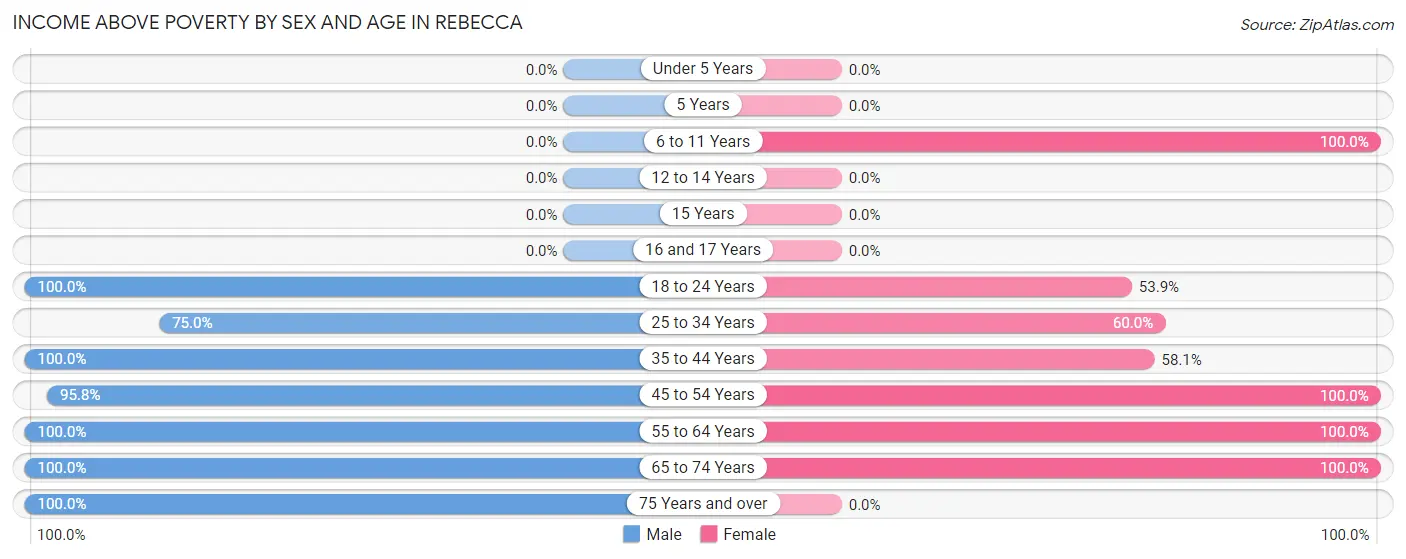
| Age Bracket | Male | Female |
| Under 5 Years | 0 (0.0%) | 0 (0.0%) |
| 5 Years | 0 (0.0%) | 0 (0.0%) |
| 6 to 11 Years | 0 (0.0%) | 30 (100.0%) |
| 12 to 14 Years | 0 (0.0%) | 0 (0.0%) |
| 15 Years | 0 (0.0%) | 0 (0.0%) |
| 16 and 17 Years | 0 (0.0%) | 0 (0.0%) |
| 18 to 24 Years | 24 (100.0%) | 7 (53.8%) |
| 25 to 34 Years | 21 (75.0%) | 3 (60.0%) |
| 35 to 44 Years | 8 (100.0%) | 18 (58.1%) |
| 45 to 54 Years | 23 (95.8%) | 52 (100.0%) |
| 55 to 64 Years | 16 (100.0%) | 8 (100.0%) |
| 65 to 74 Years | 42 (100.0%) | 7 (100.0%) |
| 75 Years and over | 4 (100.0%) | 0 (0.0%) |
| Total | 138 (94.5%) | 125 (79.6%) |
Income Below Poverty Among Married-Couple Families in Rebecca
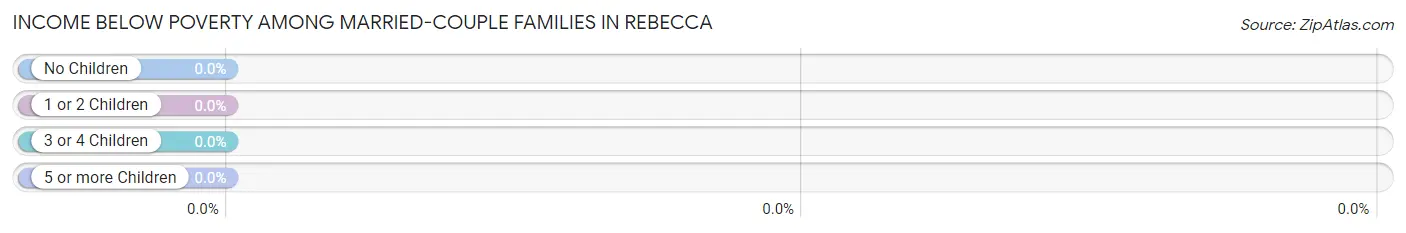
| Children | Above Poverty | Below Poverty |
| No Children | 63 (100.0%) | 0 (0.0%) |
| 1 or 2 Children | 5 (100.0%) | 0 (0.0%) |
| 3 or 4 Children | 0 (0.0%) | 0 (0.0%) |
| 5 or more Children | 0 (0.0%) | 0 (0.0%) |
| Total | 68 (100.0%) | 0 (0.0%) |
Income Below Poverty Among Single-Parent Households in Rebecca
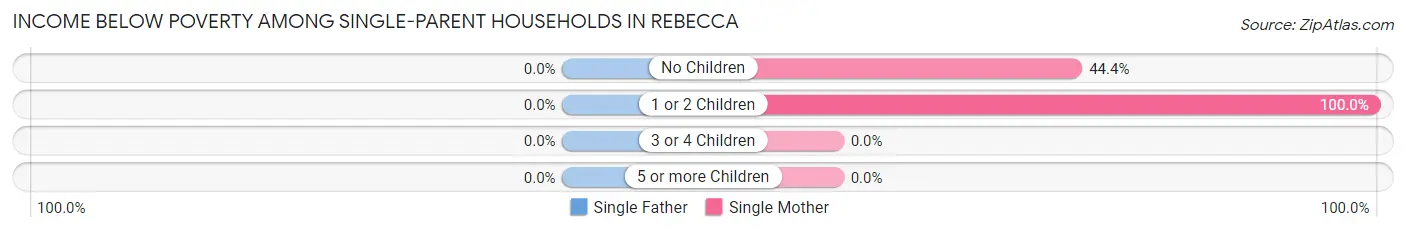
| Children | Single Father | Single Mother |
| No Children | 0 (0.0%) | 4 (44.4%) |
| 1 or 2 Children | 0 (0.0%) | 2 (100.0%) |
| 3 or 4 Children | 0 (0.0%) | 0 (0.0%) |
| 5 or more Children | 0 (0.0%) | 0 (0.0%) |
| Total | 0 (0.0%) | 6 (54.5%) |
Income Below Poverty Among Married-Couple vs Single-Parent Households in Rebecca
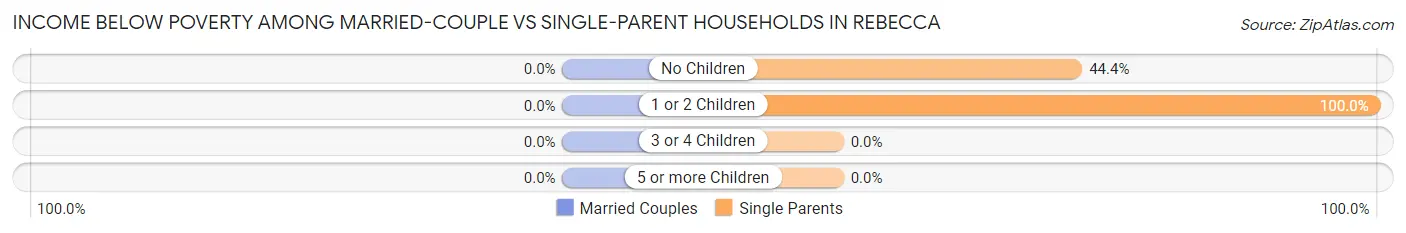
| Children | Married-Couple Families | Single-Parent Households |
| No Children | 0 (0.0%) | 4 (44.4%) |
| 1 or 2 Children | 0 (0.0%) | 2 (100.0%) |
| 3 or 4 Children | 0 (0.0%) | 0 (0.0%) |
| 5 or more Children | 0 (0.0%) | 0 (0.0%) |
| Total | 0 (0.0%) | 6 (54.5%) |
Race in Rebecca
The most populous races in Rebecca are White / Caucasian (298 | 94.6%), Hispanic or Latino (18 | 5.7%), and Two or more Races (11 | 3.5%).
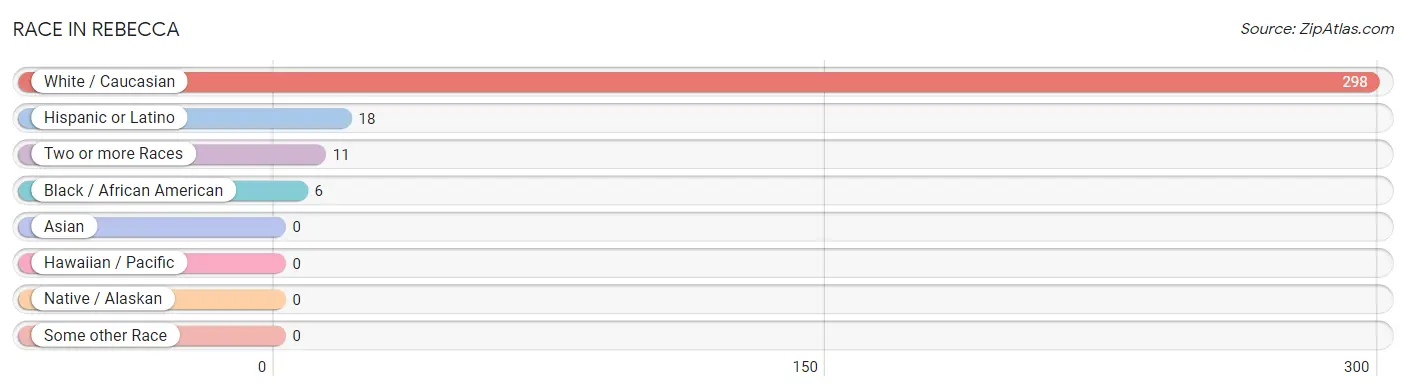
| Race | # Population | % Population |
| Asian | 0 | 0.0% |
| Black / African American | 6 | 1.9% |
| Hawaiian / Pacific | 0 | 0.0% |
| Hispanic or Latino | 18 | 5.7% |
| Native / Alaskan | 0 | 0.0% |
| White / Caucasian | 298 | 94.6% |
| Two or more Races | 11 | 3.5% |
| Some other Race | 0 | 0.0% |
| Total | 315 | 100.0% |
Ancestry in Rebecca
The most populous ancestries reported in Rebecca are American (81 | 25.7%), English (26 | 8.3%), German (26 | 8.3%), Irish (24 | 7.6%), and Mexican (18 | 5.7%), together accounting for 55.5% of all Rebecca residents.
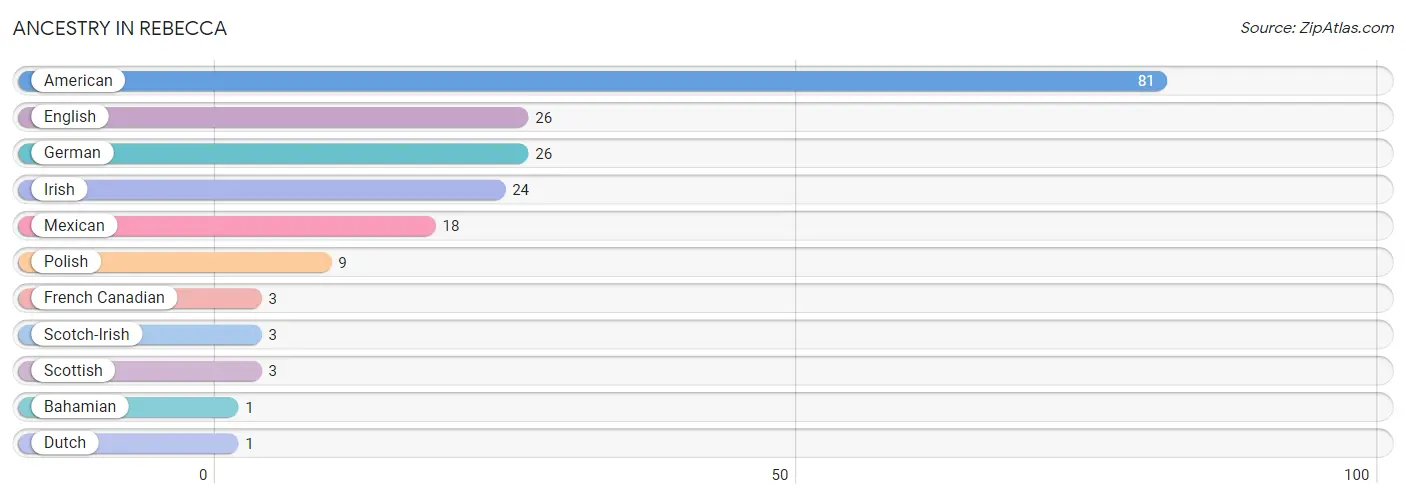
| Ancestry | # Population | % Population |
| American | 81 | 25.7% |
| Bahamian | 1 | 0.3% |
| Dutch | 1 | 0.3% |
| English | 26 | 8.3% |
| French Canadian | 3 | 0.9% |
| German | 26 | 8.3% |
| Irish | 24 | 7.6% |
| Mexican | 18 | 5.7% |
| Polish | 9 | 2.9% |
| Scotch-Irish | 3 | 0.9% |
| Scottish | 3 | 0.9% | View All 11 Rows |
Immigrants in Rebecca

| Immigration Origin | # Population | % Population | View All 0 Rows |
Sex and Age in Rebecca
Sex and Age in Rebecca
The most populous age groups in Rebecca are 70 to 74 Years (30 | 19.0%) for men and 50 to 54 Years (38 | 24.2%) for women.
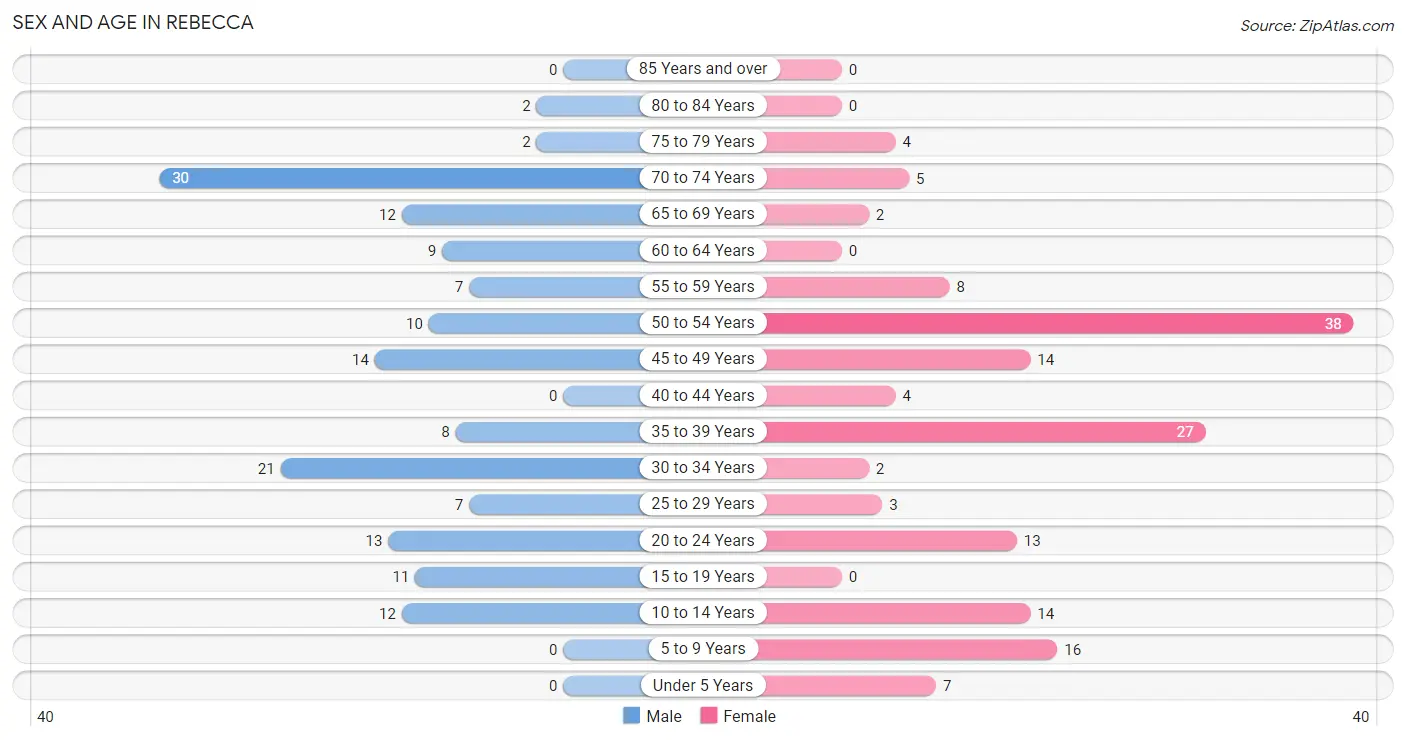
| Age Bracket | Male | Female |
| Under 5 Years | 0 (0.0%) | 7 (4.5%) |
| 5 to 9 Years | 0 (0.0%) | 16 (10.2%) |
| 10 to 14 Years | 12 (7.6%) | 14 (8.9%) |
| 15 to 19 Years | 11 (7.0%) | 0 (0.0%) |
| 20 to 24 Years | 13 (8.2%) | 13 (8.3%) |
| 25 to 29 Years | 7 (4.4%) | 3 (1.9%) |
| 30 to 34 Years | 21 (13.3%) | 2 (1.3%) |
| 35 to 39 Years | 8 (5.1%) | 27 (17.2%) |
| 40 to 44 Years | 0 (0.0%) | 4 (2.5%) |
| 45 to 49 Years | 14 (8.9%) | 14 (8.9%) |
| 50 to 54 Years | 10 (6.3%) | 38 (24.2%) |
| 55 to 59 Years | 7 (4.4%) | 8 (5.1%) |
| 60 to 64 Years | 9 (5.7%) | 0 (0.0%) |
| 65 to 69 Years | 12 (7.6%) | 2 (1.3%) |
| 70 to 74 Years | 30 (19.0%) | 5 (3.2%) |
| 75 to 79 Years | 2 (1.3%) | 4 (2.5%) |
| 80 to 84 Years | 2 (1.3%) | 0 (0.0%) |
| 85 Years and over | 0 (0.0%) | 0 (0.0%) |
| Total | 158 (100.0%) | 157 (100.0%) |
Families and Households in Rebecca
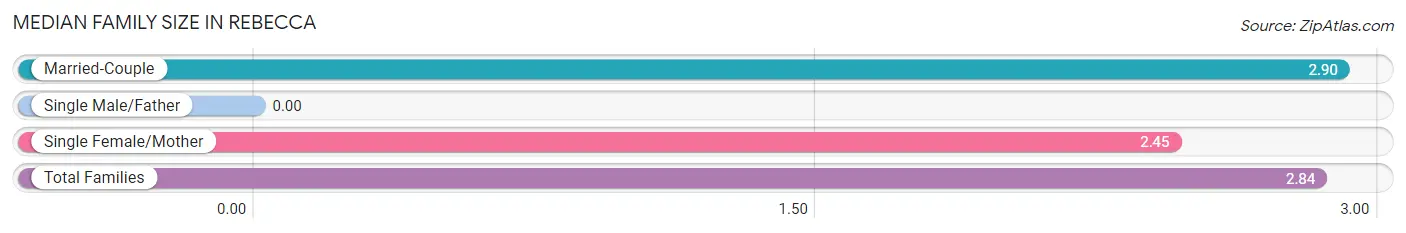
Median Family Size in Rebecca
| Family Type | # Families | Family Size |
| Married-Couple | 68 (86.1%) | 2.90 |
| Single Male/Father | 0 (0.0%) | - |
| Single Female/Mother | 11 (13.9%) | 2.45 |
| Total Families | 79 (100.0%) | 2.84 |
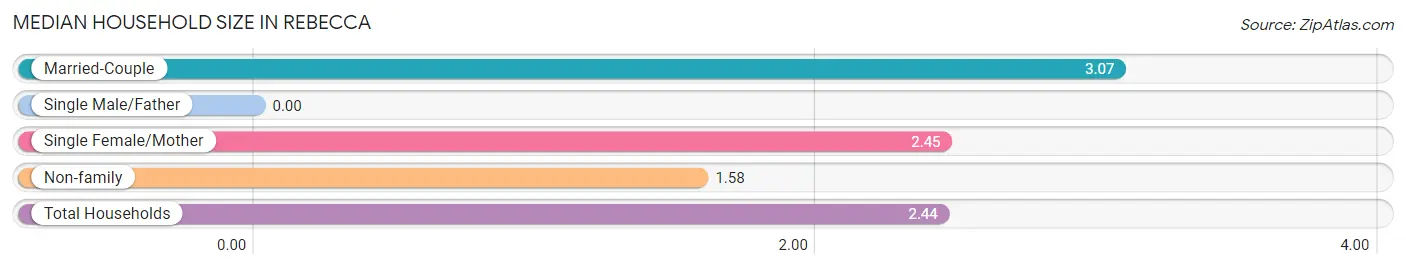
Median Household Size in Rebecca
| Household Type | # Households | Household Size |
| Married-Couple | 68 (52.7%) | 3.07 |
| Single Male/Father | 0 (0.0%) | - |
| Single Female/Mother | 11 (8.5%) | 2.45 |
| Non-family | 50 (38.8%) | 1.58 |
| Total Households | 129 (100.0%) | 2.44 |
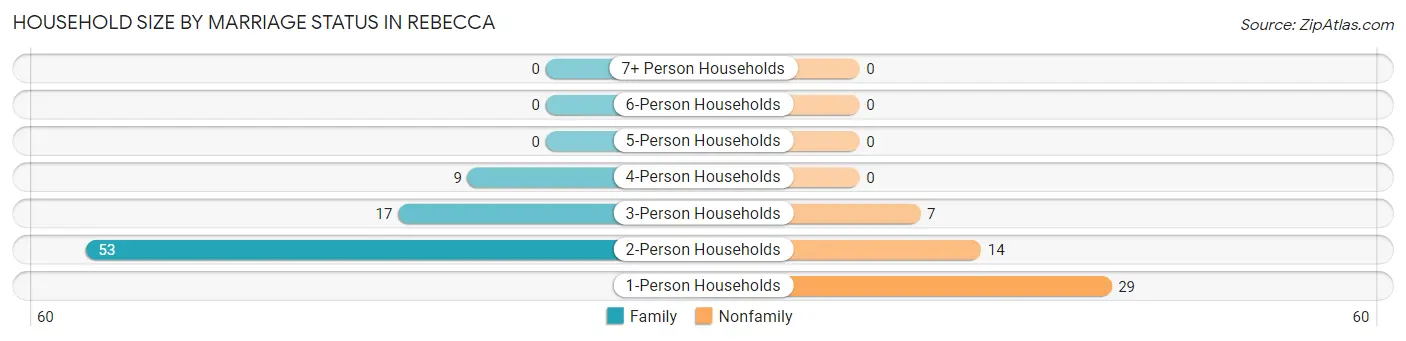
Household Size by Marriage Status in Rebecca
Out of a total of 129 households in Rebecca, 79 (61.2%) are family households, while 50 (38.8%) are nonfamily households. The most numerous type of family households are 2-person households, comprising 53, and the most common type of nonfamily households are 1-person households, comprising 29.
| Household Size | Family Households | Nonfamily Households |
| 1-Person Households | - | 29 (22.5%) |
| 2-Person Households | 53 (41.1%) | 14 (10.8%) |
| 3-Person Households | 17 (13.2%) | 7 (5.4%) |
| 4-Person Households | 9 (7.0%) | 0 (0.0%) |
| 5-Person Households | 0 (0.0%) | 0 (0.0%) |
| 6-Person Households | 0 (0.0%) | 0 (0.0%) |
| 7+ Person Households | 0 (0.0%) | 0 (0.0%) |
| Total | 79 (61.2%) | 50 (38.8%) |
Female Fertility in Rebecca
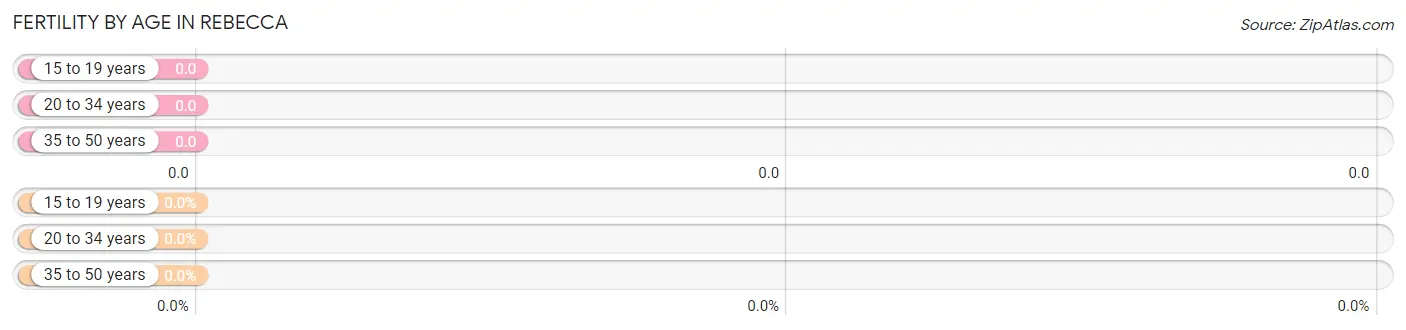
Fertility by Age in Rebecca
| Age Bracket | Women with Births | Births / 1,000 Women |
| 15 to 19 years | 0 (0.0%) | 0.0 |
| 20 to 34 years | 0 (0.0%) | 0.0 |
| 35 to 50 years | 0 (0.0%) | 0.0 |
| Total | 0 (0.0%) | 0.0 |
Fertility by Age by Marriage Status in Rebecca
| Age Bracket | Married | Unmarried |
| 15 to 19 years | 0 (0.0%) | 0 (0.0%) |
| 20 to 34 years | 0 (0.0%) | 0 (0.0%) |
| 35 to 50 years | 0 (0.0%) | 0 (0.0%) |
| Total | 0 (0.0%) | 0 (0.0%) |
Fertility by Education in Rebecca
| Educational Attainment | Women with Births | Births / 1,000 Women |
| Less than High School | 0 (0.0%) | 0.0 |
| High School Diploma | 0 (0.0%) | 0.0 |
| College or Associate's Degree | 0 (0.0%) | 0.0 |
| Bachelor's Degree | 0 (0.0%) | 0.0 |
| Graduate Degree | 0 (0.0%) | 0.0 |
| Total | 0 (0.0%) | 0.0 |
Fertility by Education by Marriage Status in Rebecca
| Educational Attainment | Married | Unmarried |
| Less than High School | 0 (0.0%) | 0 (0.0%) |
| High School Diploma | 0 (0.0%) | 0 (0.0%) |
| College or Associate's Degree | 0 (0.0%) | 0 (0.0%) |
| Bachelor's Degree | 0 (0.0%) | 0 (0.0%) |
| Graduate Degree | 0 (0.0%) | 0 (0.0%) |
| Total | 0 (0.0%) | 0 (0.0%) |
Employment Characteristics in Rebecca
Employment by Class of Employer in Rebecca
Among the 148 employed individuals in Rebecca, private company employees (109 | 73.7%), local government employees (22 | 14.9%), and not-for-profit organizations (12 | 8.1%) make up the most common classes of employment.
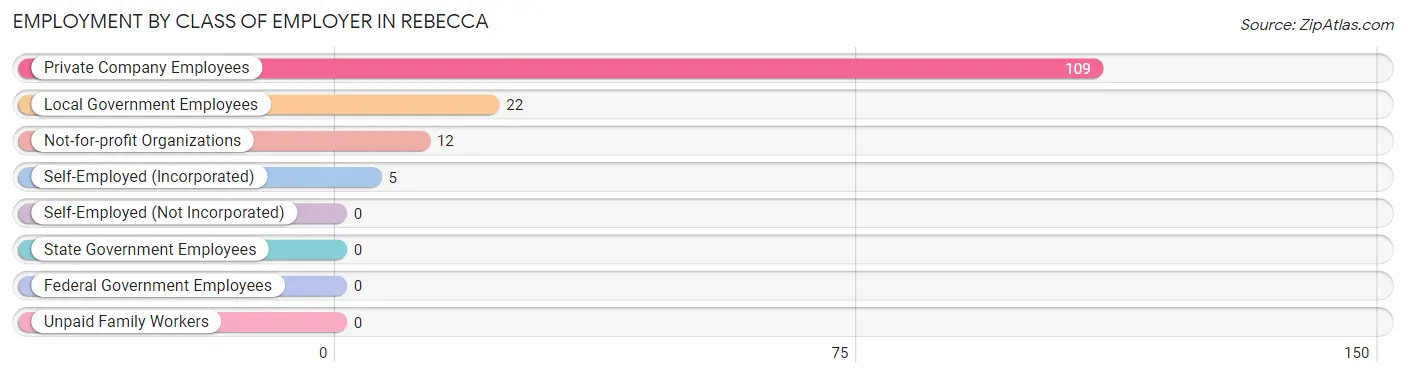
| Employer Class | # Employees | % Employees |
| Private Company Employees | 109 | 73.7% |
| Self-Employed (Incorporated) | 5 | 3.4% |
| Self-Employed (Not Incorporated) | 0 | 0.0% |
| Not-for-profit Organizations | 12 | 8.1% |
| Local Government Employees | 22 | 14.9% |
| State Government Employees | 0 | 0.0% |
| Federal Government Employees | 0 | 0.0% |
| Unpaid Family Workers | 0 | 0.0% |
| Total | 148 | 100.0% |
Employment Status by Age in Rebecca
According to the labor force statistics for Rebecca, out of the total population over 16 years of age (266), 57.9% or 154 individuals are in the labor force, with 3.9% or 6 of them unemployed. The age group with the highest labor force participation rate is 16 to 19 years, with 100.0% or 11 individuals in the labor force. Within the labor force, the 20 to 24 years age range has the highest percentage of unemployed individuals, with 23.1% or 6 of them being unemployed.
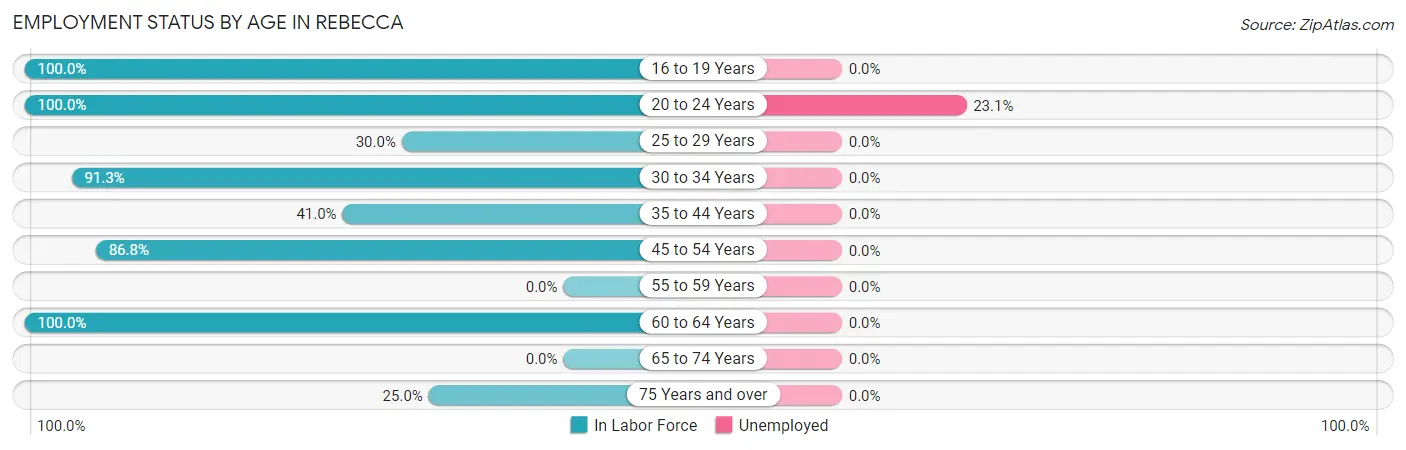
| Age Bracket | In Labor Force | Unemployed |
| 16 to 19 Years | 11 (100.0%) | 0 (0.0%) |
| 20 to 24 Years | 26 (100.0%) | 6 (23.1%) |
| 25 to 29 Years | 3 (30.0%) | 0 (0.0%) |
| 30 to 34 Years | 21 (91.3%) | 0 (0.0%) |
| 35 to 44 Years | 16 (41.0%) | 0 (0.0%) |
| 45 to 54 Years | 66 (86.8%) | 0 (0.0%) |
| 55 to 59 Years | 0 (0.0%) | 0 (0.0%) |
| 60 to 64 Years | 9 (100.0%) | 0 (0.0%) |
| 65 to 74 Years | 0 (0.0%) | 0 (0.0%) |
| 75 Years and over | 2 (25.0%) | 0 (0.0%) |
| Total | 154 (57.9%) | 6 (3.9%) |
Employment Status by Educational Attainment in Rebecca
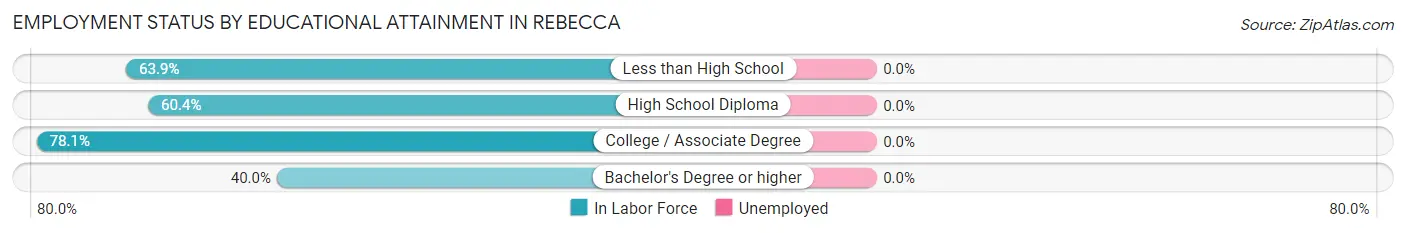
| Educational Attainment | In Labor Force | Unemployed |
| Less than High School | 23 (63.9%) | 0 (0.0%) |
| High School Diploma | 29 (60.4%) | 0 (0.0%) |
| College / Associate Degree | 57 (78.1%) | 0 (0.0%) |
| Bachelor's Degree or higher | 6 (40.0%) | 0 (0.0%) |
| Total | 115 (66.9%) | 0 (0.0%) |
Employment Occupations by Sex in Rebecca
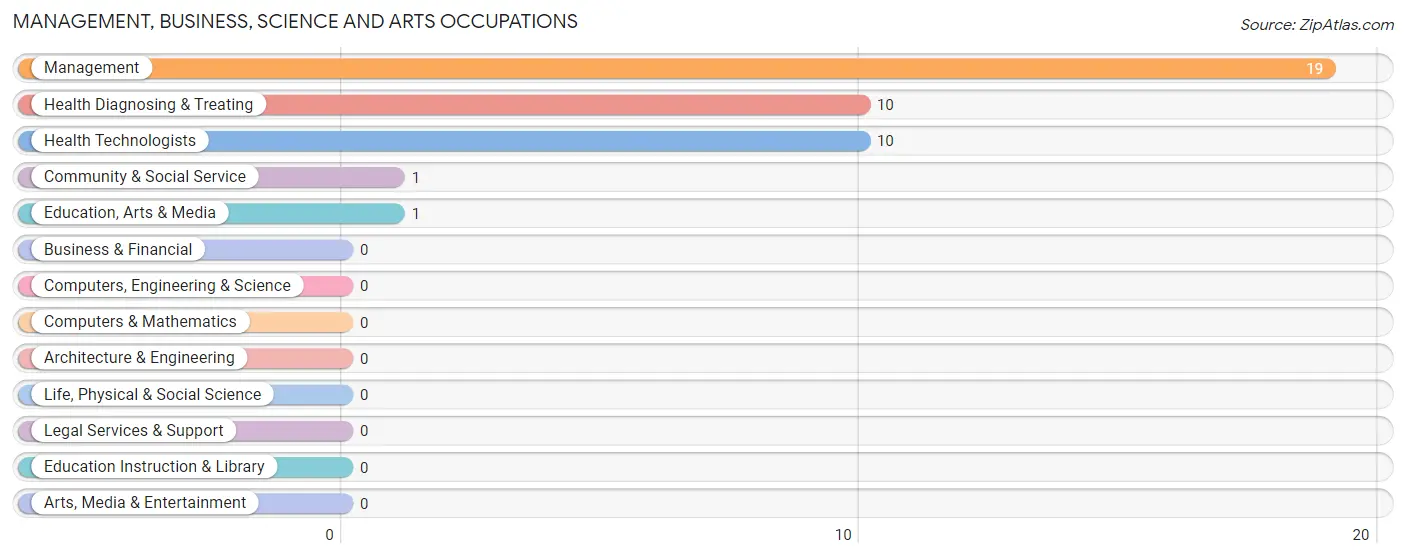
Management, Business, Science and Arts Occupations
The most common Management, Business, Science and Arts occupations in Rebecca are Management (19 | 12.8%), Health Diagnosing & Treating (10 | 6.8%), Health Technologists (10 | 6.8%), Community & Social Service (1 | 0.7%), and Education, Arts & Media (1 | 0.7%).
Management, Business, Science and Arts Occupations by Sex
Within the Management, Business, Science and Arts occupations in Rebecca, the most male-oriented occupations are Community & Social Service (100.0%), Education, Arts & Media (100.0%), and Management (10.5%), while the most female-oriented occupations are Health Diagnosing & Treating (100.0%), Health Technologists (100.0%), and Management (89.5%).
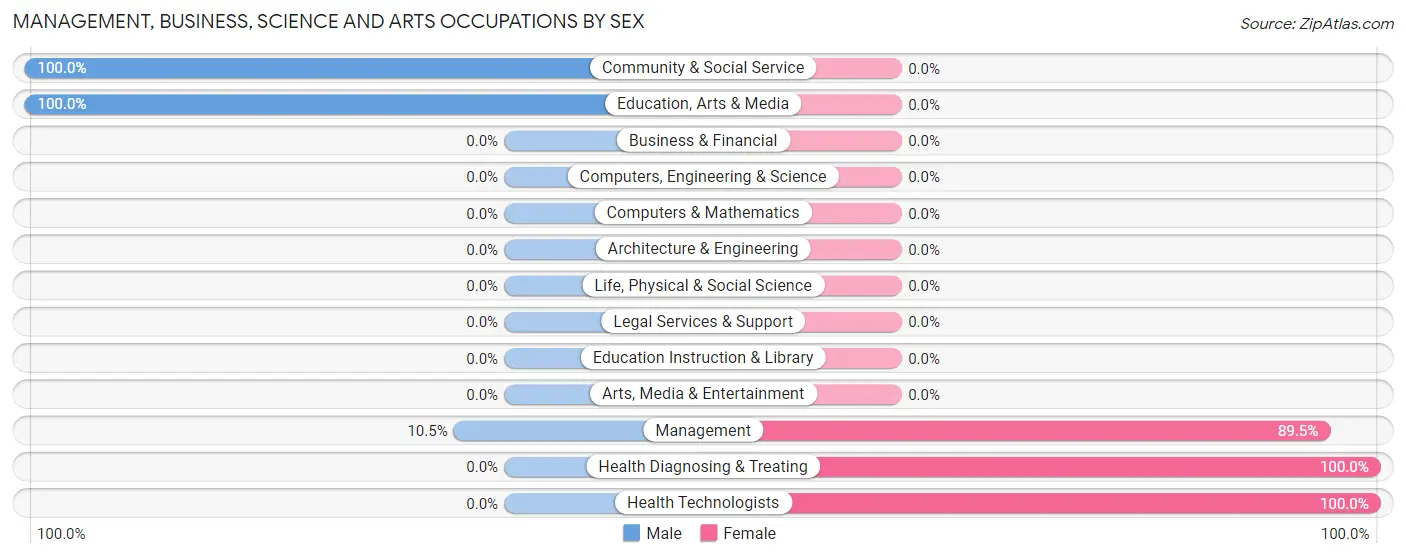
| Occupation | Male | Female |
| Management | 2 (10.5%) | 17 (89.5%) |
| Business & Financial | 0 (0.0%) | 0 (0.0%) |
| Computers, Engineering & Science | 0 (0.0%) | 0 (0.0%) |
| Computers & Mathematics | 0 (0.0%) | 0 (0.0%) |
| Architecture & Engineering | 0 (0.0%) | 0 (0.0%) |
| Life, Physical & Social Science | 0 (0.0%) | 0 (0.0%) |
| Community & Social Service | 1 (100.0%) | 0 (0.0%) |
| Education, Arts & Media | 1 (100.0%) | 0 (0.0%) |
| Legal Services & Support | 0 (0.0%) | 0 (0.0%) |
| Education Instruction & Library | 0 (0.0%) | 0 (0.0%) |
| Arts, Media & Entertainment | 0 (0.0%) | 0 (0.0%) |
| Health Diagnosing & Treating | 0 (0.0%) | 10 (100.0%) |
| Health Technologists | 0 (0.0%) | 10 (100.0%) |
| Total (Category) | 3 (10.0%) | 27 (90.0%) |
| Total (Overall) | 87 (58.8%) | 61 (41.2%) |
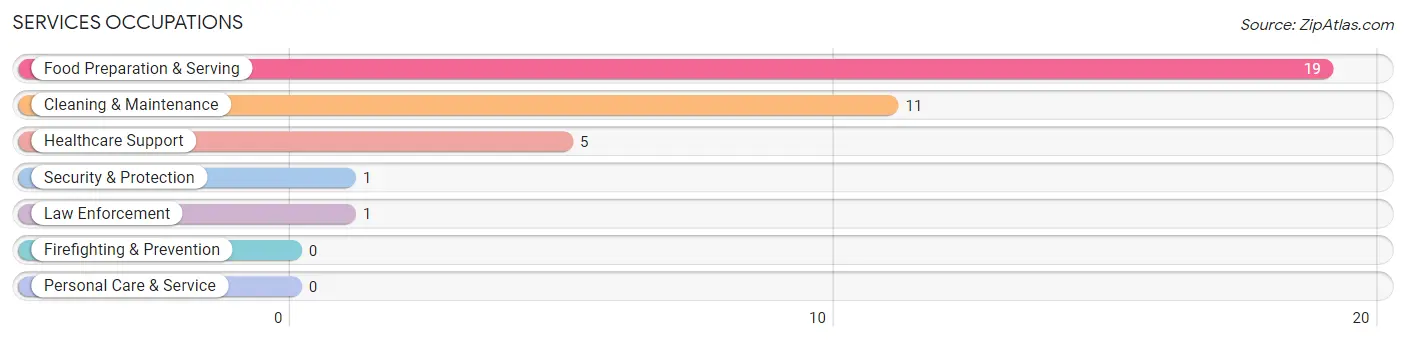
Services Occupations
The most common Services occupations in Rebecca are Food Preparation & Serving (19 | 12.8%), Cleaning & Maintenance (11 | 7.4%), Healthcare Support (5 | 3.4%), Security & Protection (1 | 0.7%), and Law Enforcement (1 | 0.7%).
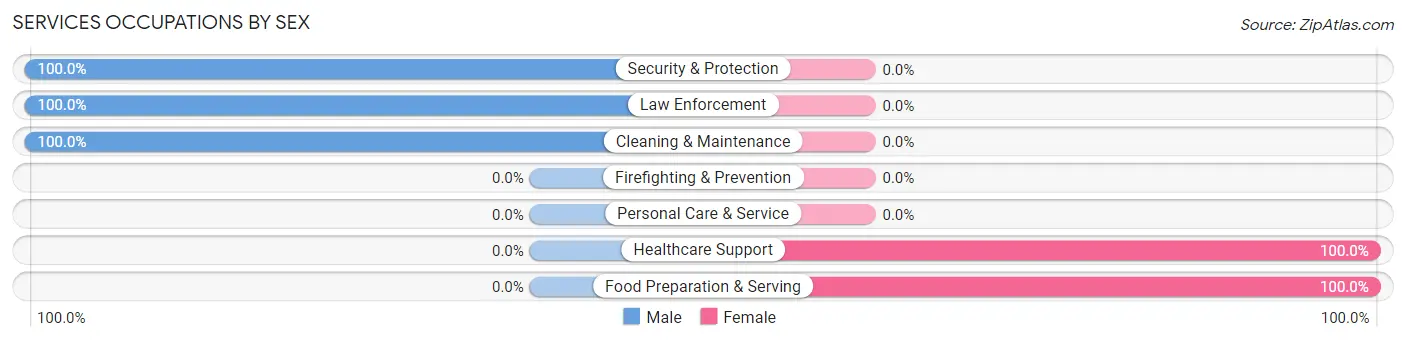
Services Occupations by Sex
Within the Services occupations in Rebecca, the most male-oriented occupations are Security & Protection (100.0%), Law Enforcement (100.0%), and Cleaning & Maintenance (100.0%), while the most female-oriented occupations are Healthcare Support (100.0%), and Food Preparation & Serving (100.0%).
| Occupation | Male | Female |
| Healthcare Support | 0 (0.0%) | 5 (100.0%) |
| Security & Protection | 1 (100.0%) | 0 (0.0%) |
| Firefighting & Prevention | 0 (0.0%) | 0 (0.0%) |
| Law Enforcement | 1 (100.0%) | 0 (0.0%) |
| Food Preparation & Serving | 0 (0.0%) | 19 (100.0%) |
| Cleaning & Maintenance | 11 (100.0%) | 0 (0.0%) |
| Personal Care & Service | 0 (0.0%) | 0 (0.0%) |
| Total (Category) | 12 (33.3%) | 24 (66.7%) |
| Total (Overall) | 87 (58.8%) | 61 (41.2%) |
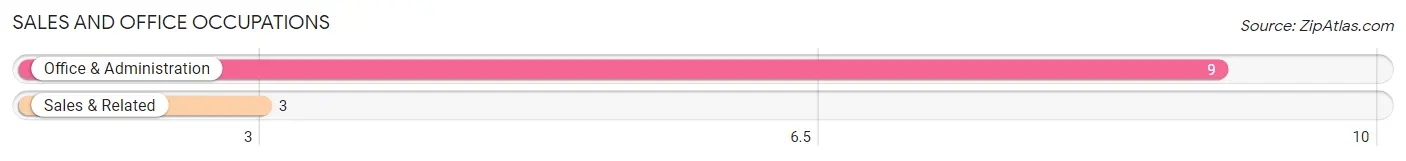
Sales and Office Occupations
The most common Sales and Office occupations in Rebecca are Office & Administration (9 | 6.1%), and Sales & Related (3 | 2.0%).
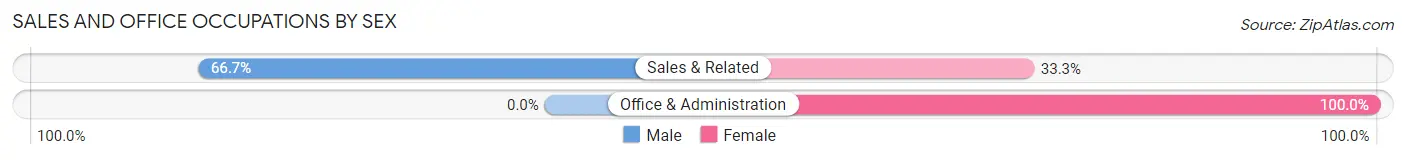
Sales and Office Occupations by Sex
| Occupation | Male | Female |
| Sales & Related | 2 (66.7%) | 1 (33.3%) |
| Office & Administration | 0 (0.0%) | 9 (100.0%) |
| Total (Category) | 2 (16.7%) | 10 (83.3%) |
| Total (Overall) | 87 (58.8%) | 61 (41.2%) |
Natural Resources, Construction and Maintenance Occupations
The most common Natural Resources, Construction and Maintenance occupations in Rebecca are Farming, Fishing & Forestry (25 | 16.9%), Construction & Extraction (17 | 11.5%), and Installation, Maintenance & Repair (5 | 3.4%).
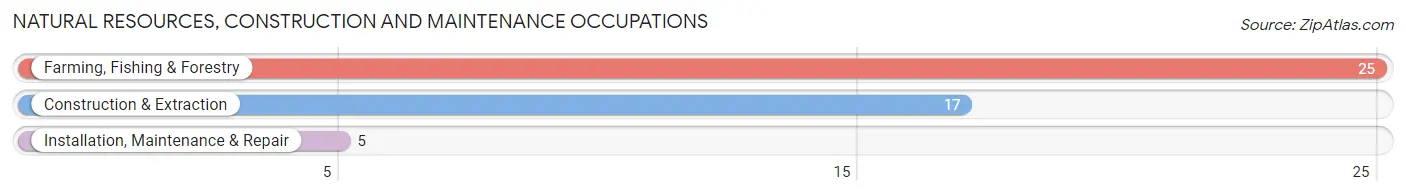
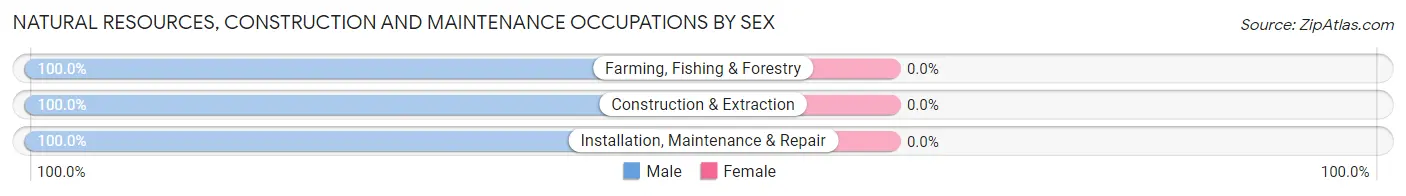
Natural Resources, Construction and Maintenance Occupations by Sex
| Occupation | Male | Female |
| Farming, Fishing & Forestry | 25 (100.0%) | 0 (0.0%) |
| Construction & Extraction | 17 (100.0%) | 0 (0.0%) |
| Installation, Maintenance & Repair | 5 (100.0%) | 0 (0.0%) |
| Total (Category) | 47 (100.0%) | 0 (0.0%) |
| Total (Overall) | 87 (58.8%) | 61 (41.2%) |
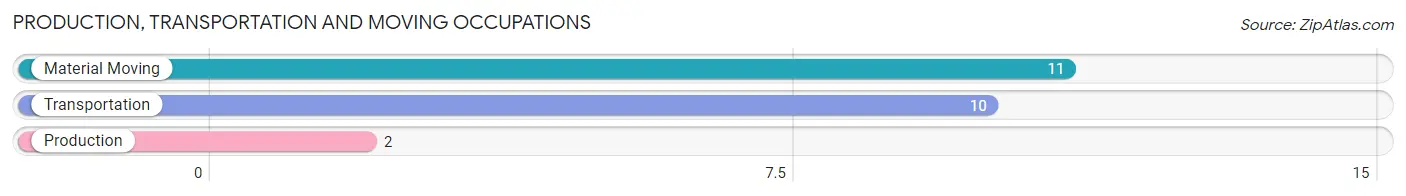
Production, Transportation and Moving Occupations
The most common Production, Transportation and Moving occupations in Rebecca are Material Moving (11 | 7.4%), Transportation (10 | 6.8%), and Production (2 | 1.3%).
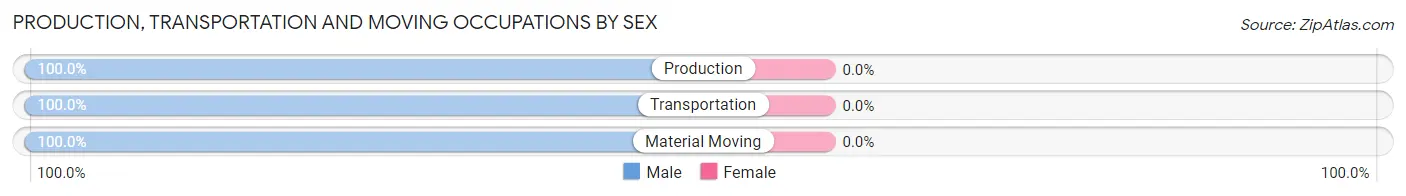
Production, Transportation and Moving Occupations by Sex
| Occupation | Male | Female |
| Production | 2 (100.0%) | 0 (0.0%) |
| Transportation | 10 (100.0%) | 0 (0.0%) |
| Material Moving | 11 (100.0%) | 0 (0.0%) |
| Total (Category) | 23 (100.0%) | 0 (0.0%) |
| Total (Overall) | 87 (58.8%) | 61 (41.2%) |
Employment Industries by Sex in Rebecca
Employment Industries in Rebecca
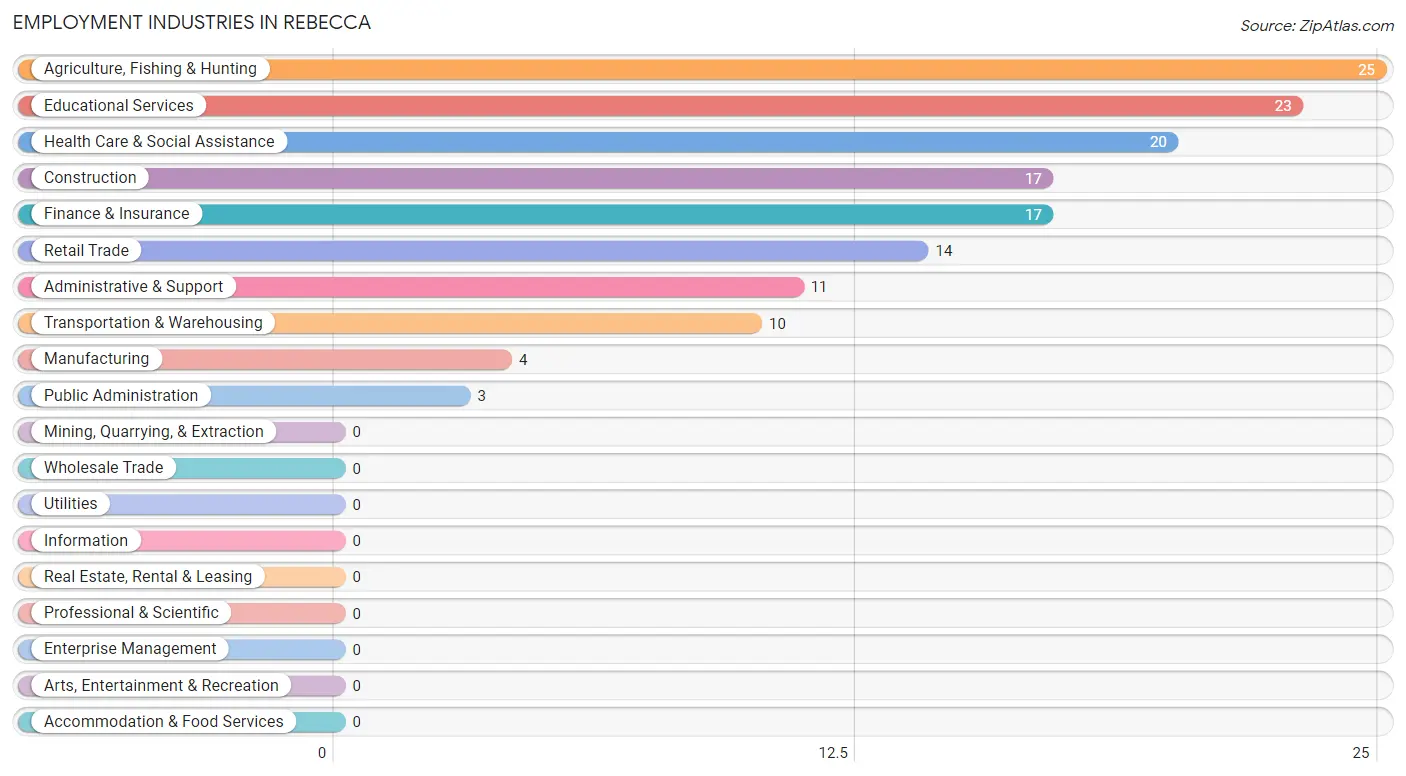
The major employment industries in Rebecca include Agriculture, Fishing & Hunting (25 | 16.9%), Educational Services (23 | 15.5%), Health Care & Social Assistance (20 | 13.5%), Construction (17 | 11.5%), and Finance & Insurance (17 | 11.5%).
Employment Industries by Sex in Rebecca
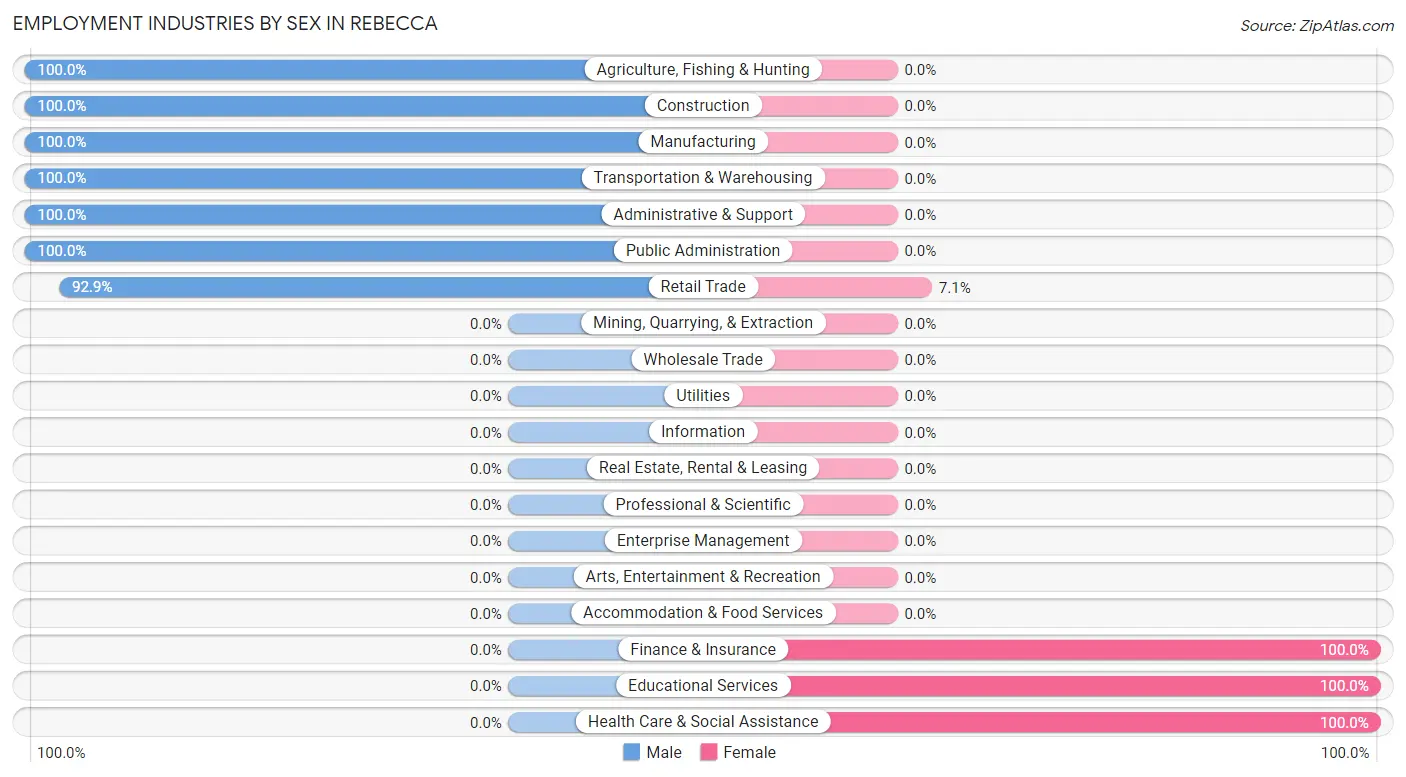
The Rebecca industries that see more men than women are Agriculture, Fishing & Hunting (100.0%), Construction (100.0%), and Manufacturing (100.0%), whereas the industries that tend to have a higher number of women are Finance & Insurance (100.0%), Educational Services (100.0%), and Health Care & Social Assistance (100.0%).
| Industry | Male | Female |
| Agriculture, Fishing & Hunting | 25 (100.0%) | 0 (0.0%) |
| Mining, Quarrying, & Extraction | 0 (0.0%) | 0 (0.0%) |
| Construction | 17 (100.0%) | 0 (0.0%) |
| Manufacturing | 4 (100.0%) | 0 (0.0%) |
| Wholesale Trade | 0 (0.0%) | 0 (0.0%) |
| Retail Trade | 13 (92.9%) | 1 (7.1%) |
| Transportation & Warehousing | 10 (100.0%) | 0 (0.0%) |
| Utilities | 0 (0.0%) | 0 (0.0%) |
| Information | 0 (0.0%) | 0 (0.0%) |
| Finance & Insurance | 0 (0.0%) | 17 (100.0%) |
| Real Estate, Rental & Leasing | 0 (0.0%) | 0 (0.0%) |
| Professional & Scientific | 0 (0.0%) | 0 (0.0%) |
| Enterprise Management | 0 (0.0%) | 0 (0.0%) |
| Administrative & Support | 11 (100.0%) | 0 (0.0%) |
| Educational Services | 0 (0.0%) | 23 (100.0%) |
| Health Care & Social Assistance | 0 (0.0%) | 20 (100.0%) |
| Arts, Entertainment & Recreation | 0 (0.0%) | 0 (0.0%) |
| Accommodation & Food Services | 0 (0.0%) | 0 (0.0%) |
| Public Administration | 3 (100.0%) | 0 (0.0%) |
| Total | 87 (58.8%) | 61 (41.2%) |
Education in Rebecca
School Enrollment in Rebecca
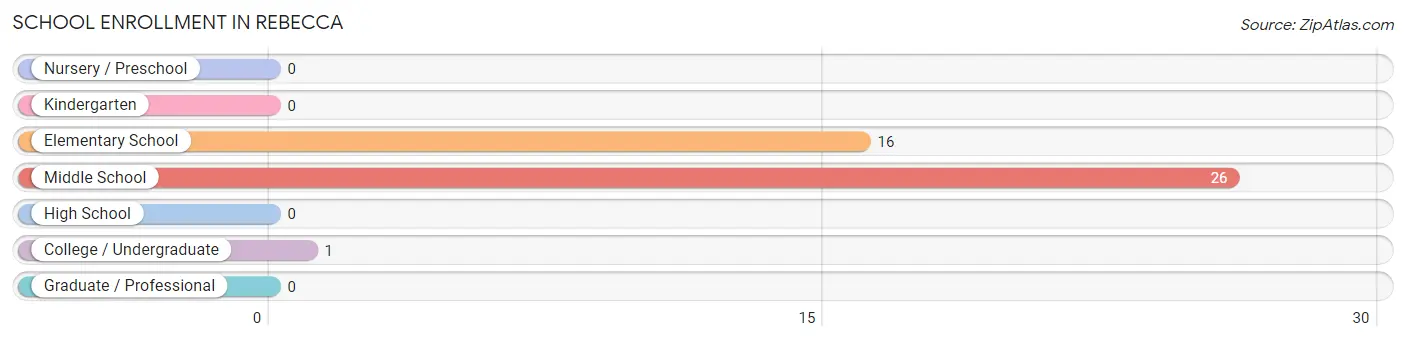
The most common levels of schooling among the 43 students in Rebecca are middle school (26 | 60.5%), elementary school (16 | 37.2%), and college / undergraduate (1 | 2.3%).
| School Level | # Students | % Students |
| Nursery / Preschool | 0 | 0.0% |
| Kindergarten | 0 | 0.0% |
| Elementary School | 16 | 37.2% |
| Middle School | 26 | 60.5% |
| High School | 0 | 0.0% |
| College / Undergraduate | 1 | 2.3% |
| Graduate / Professional | 0 | 0.0% |
| Total | 43 | 100.0% |
School Enrollment by Age by Funding Source in Rebecca
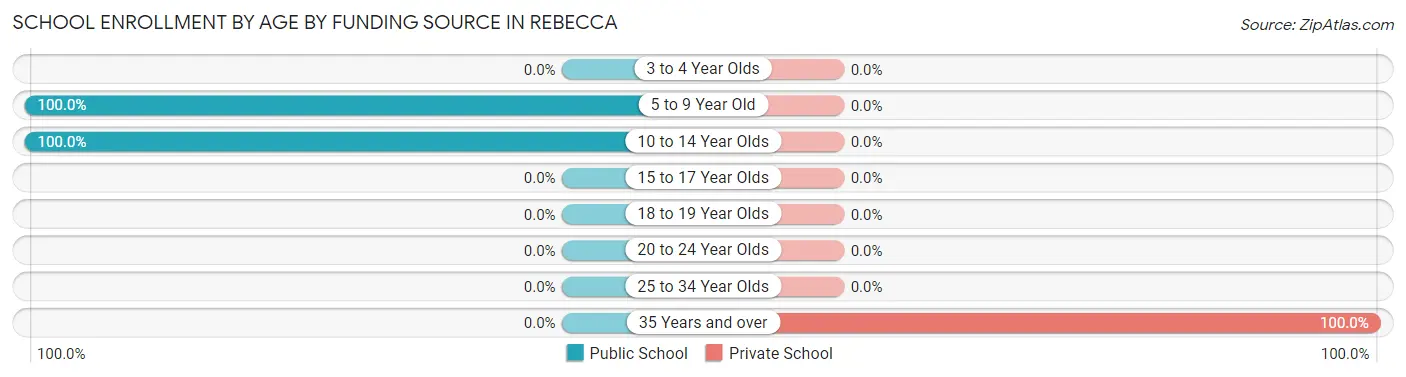
Out of a total of 43 students who are enrolled in schools in Rebecca, 1 (2.3%) attend a private institution, while the remaining 42 (97.7%) are enrolled in public schools. The age group of 35 years and over has the highest likelihood of being enrolled in private schools, with 1 (100.0% in the age bracket) enrolled. Conversely, the age group of 5 to 9 year old has the lowest likelihood of being enrolled in a private school, with 16 (100.0% in the age bracket) attending a public institution.
| Age Bracket | Public School | Private School |
| 3 to 4 Year Olds | 0 (0.0%) | 0 (0.0%) |
| 5 to 9 Year Old | 16 (100.0%) | 0 (0.0%) |
| 10 to 14 Year Olds | 26 (100.0%) | 0 (0.0%) |
| 15 to 17 Year Olds | 0 (0.0%) | 0 (0.0%) |
| 18 to 19 Year Olds | 0 (0.0%) | 0 (0.0%) |
| 20 to 24 Year Olds | 0 (0.0%) | 0 (0.0%) |
| 25 to 34 Year Olds | 0 (0.0%) | 0 (0.0%) |
| 35 Years and over | 0 (0.0%) | 1 (100.0%) |
| Total | 42 (97.7%) | 1 (2.3%) |
Educational Attainment by Field of Study in Rebecca
Science & technology (9 | 42.9%), education (9 | 42.9%), bio, nature & agricultural (2 | 9.5%), and liberal arts & history (1 | 4.8%) are the most common fields of study among 21 individuals in Rebecca who have obtained a bachelor's degree or higher.
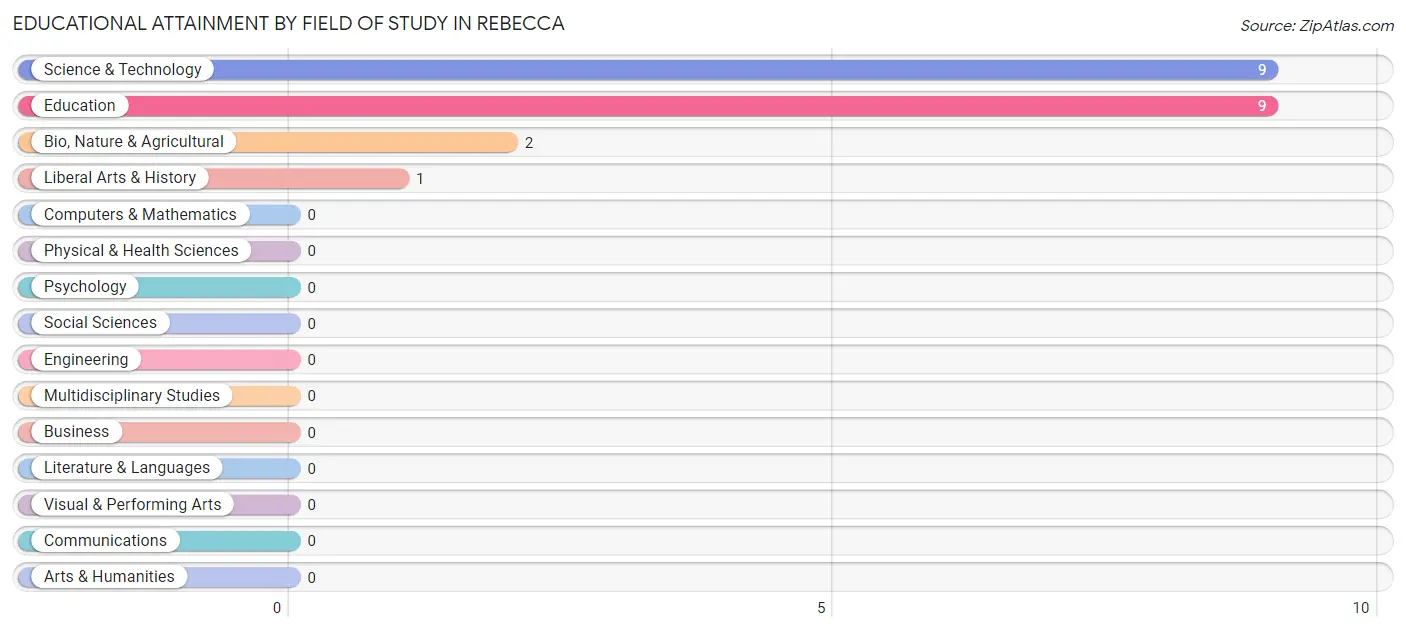
| Field of Study | # Graduates | % Graduates |
| Computers & Mathematics | 0 | 0.0% |
| Bio, Nature & Agricultural | 2 | 9.5% |
| Physical & Health Sciences | 0 | 0.0% |
| Psychology | 0 | 0.0% |
| Social Sciences | 0 | 0.0% |
| Engineering | 0 | 0.0% |
| Multidisciplinary Studies | 0 | 0.0% |
| Science & Technology | 9 | 42.9% |
| Business | 0 | 0.0% |
| Education | 9 | 42.9% |
| Literature & Languages | 0 | 0.0% |
| Liberal Arts & History | 1 | 4.8% |
| Visual & Performing Arts | 0 | 0.0% |
| Communications | 0 | 0.0% |
| Arts & Humanities | 0 | 0.0% |
| Total | 21 | 100.0% |
Transportation & Commute in Rebecca
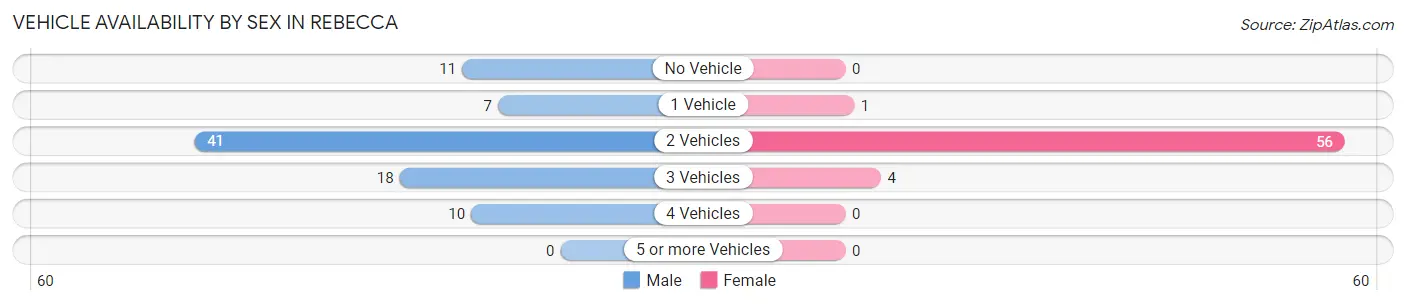
Vehicle Availability by Sex in Rebecca
The most prevalent vehicle ownership categories in Rebecca are males with 2 vehicles (41, accounting for 47.1%) and females with 2 vehicles (56, making up 67.2%).
| Vehicles Available | Male | Female |
| No Vehicle | 11 (12.6%) | 0 (0.0%) |
| 1 Vehicle | 7 (8.1%) | 1 (1.6%) |
| 2 Vehicles | 41 (47.1%) | 56 (91.8%) |
| 3 Vehicles | 18 (20.7%) | 4 (6.6%) |
| 4 Vehicles | 10 (11.5%) | 0 (0.0%) |
| 5 or more Vehicles | 0 (0.0%) | 0 (0.0%) |
| Total | 87 (100.0%) | 61 (100.0%) |
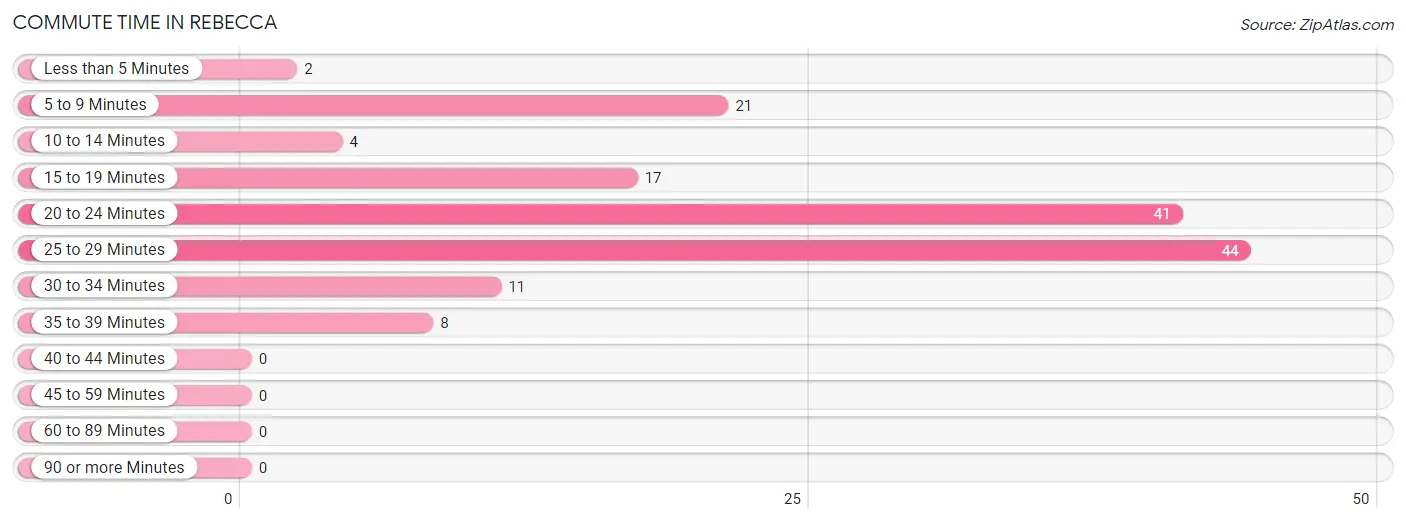
Commute Time in Rebecca
The most frequently occuring commute durations in Rebecca are 25 to 29 minutes (44 commuters, 29.7%), 20 to 24 minutes (41 commuters, 27.7%), and 5 to 9 minutes (21 commuters, 14.2%).
| Commute Time | # Commuters | % Commuters |
| Less than 5 Minutes | 2 | 1.3% |
| 5 to 9 Minutes | 21 | 14.2% |
| 10 to 14 Minutes | 4 | 2.7% |
| 15 to 19 Minutes | 17 | 11.5% |
| 20 to 24 Minutes | 41 | 27.7% |
| 25 to 29 Minutes | 44 | 29.7% |
| 30 to 34 Minutes | 11 | 7.4% |
| 35 to 39 Minutes | 8 | 5.4% |
| 40 to 44 Minutes | 0 | 0.0% |
| 45 to 59 Minutes | 0 | 0.0% |
| 60 to 89 Minutes | 0 | 0.0% |
| 90 or more Minutes | 0 | 0.0% |
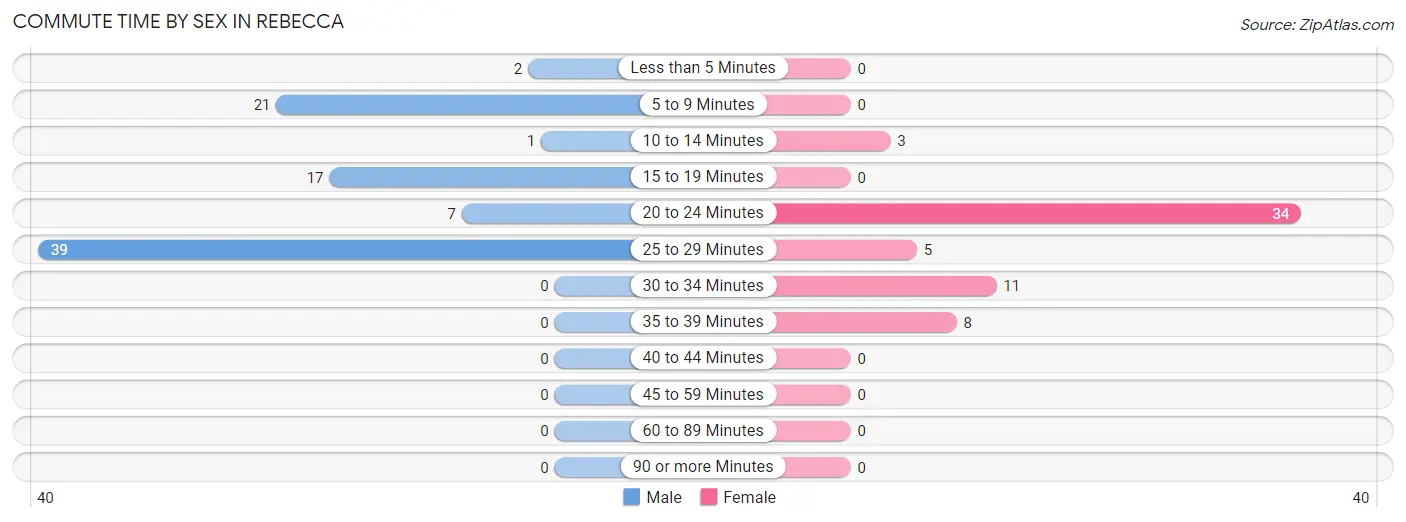
Commute Time by Sex in Rebecca
The most common commute times in Rebecca are 25 to 29 minutes (39 commuters, 44.8%) for males and 20 to 24 minutes (34 commuters, 55.7%) for females.
| Commute Time | Male | Female |
| Less than 5 Minutes | 2 (2.3%) | 0 (0.0%) |
| 5 to 9 Minutes | 21 (24.1%) | 0 (0.0%) |
| 10 to 14 Minutes | 1 (1.1%) | 3 (4.9%) |
| 15 to 19 Minutes | 17 (19.5%) | 0 (0.0%) |
| 20 to 24 Minutes | 7 (8.1%) | 34 (55.7%) |
| 25 to 29 Minutes | 39 (44.8%) | 5 (8.2%) |
| 30 to 34 Minutes | 0 (0.0%) | 11 (18.0%) |
| 35 to 39 Minutes | 0 (0.0%) | 8 (13.1%) |
| 40 to 44 Minutes | 0 (0.0%) | 0 (0.0%) |
| 45 to 59 Minutes | 0 (0.0%) | 0 (0.0%) |
| 60 to 89 Minutes | 0 (0.0%) | 0 (0.0%) |
| 90 or more Minutes | 0 (0.0%) | 0 (0.0%) |
Time of Departure to Work by Sex in Rebecca
The most frequent times of departure to work in Rebecca are 7:00 AM to 7:29 AM (25, 28.7%) for males and 5:30 AM to 5:59 AM (19, 31.1%) for females.
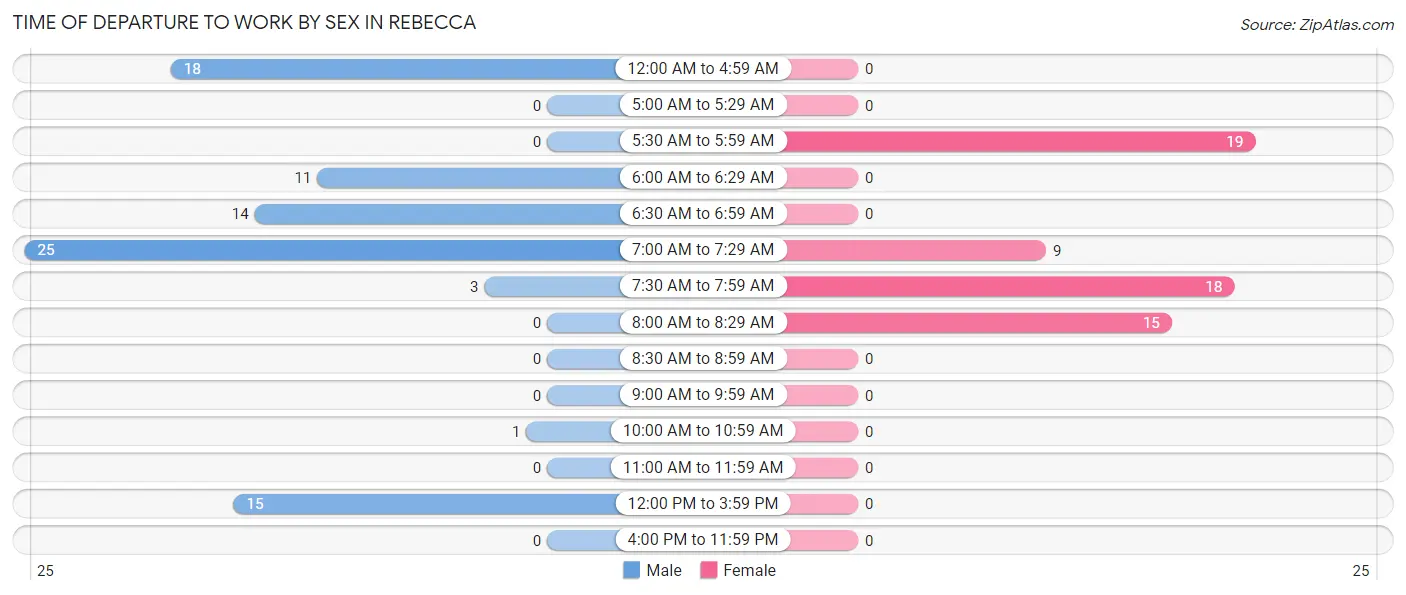
| Time of Departure | Male | Female |
| 12:00 AM to 4:59 AM | 18 (20.7%) | 0 (0.0%) |
| 5:00 AM to 5:29 AM | 0 (0.0%) | 0 (0.0%) |
| 5:30 AM to 5:59 AM | 0 (0.0%) | 19 (31.1%) |
| 6:00 AM to 6:29 AM | 11 (12.6%) | 0 (0.0%) |
| 6:30 AM to 6:59 AM | 14 (16.1%) | 0 (0.0%) |
| 7:00 AM to 7:29 AM | 25 (28.7%) | 9 (14.7%) |
| 7:30 AM to 7:59 AM | 3 (3.5%) | 18 (29.5%) |
| 8:00 AM to 8:29 AM | 0 (0.0%) | 15 (24.6%) |
| 8:30 AM to 8:59 AM | 0 (0.0%) | 0 (0.0%) |
| 9:00 AM to 9:59 AM | 0 (0.0%) | 0 (0.0%) |
| 10:00 AM to 10:59 AM | 1 (1.1%) | 0 (0.0%) |
| 11:00 AM to 11:59 AM | 0 (0.0%) | 0 (0.0%) |
| 12:00 PM to 3:59 PM | 15 (17.2%) | 0 (0.0%) |
| 4:00 PM to 11:59 PM | 0 (0.0%) | 0 (0.0%) |
| Total | 87 (100.0%) | 61 (100.0%) |
Housing Occupancy in Rebecca
Occupancy by Ownership in Rebecca
Of the total 129 dwellings in Rebecca, owner-occupied units account for 63 (48.8%), while renter-occupied units make up 66 (51.2%).
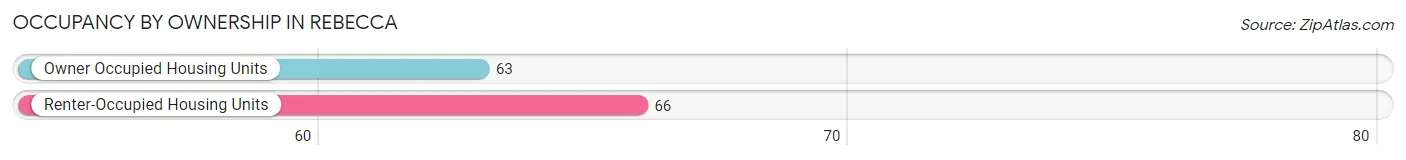
| Occupancy | # Housing Units | % Housing Units |
| Owner Occupied Housing Units | 63 | 48.8% |
| Renter-Occupied Housing Units | 66 | 51.2% |
| Total Occupied Housing Units | 129 | 100.0% |
Occupancy by Household Size in Rebecca
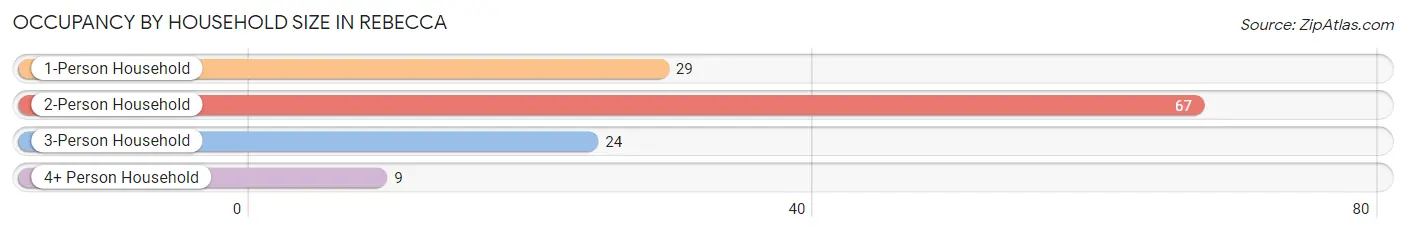
| Household Size | # Housing Units | % Housing Units |
| 1-Person Household | 29 | 22.5% |
| 2-Person Household | 67 | 51.9% |
| 3-Person Household | 24 | 18.6% |
| 4+ Person Household | 9 | 7.0% |
| Total Housing Units | 129 | 100.0% |
Occupancy by Ownership by Household Size in Rebecca
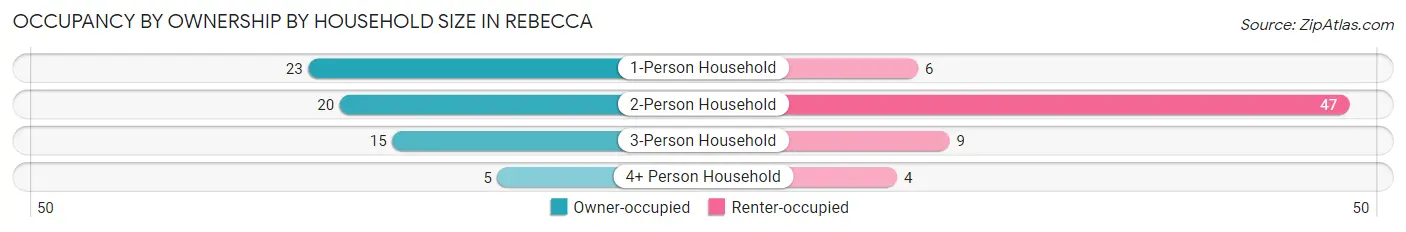
| Household Size | Owner-occupied | Renter-occupied |
| 1-Person Household | 23 (79.3%) | 6 (20.7%) |
| 2-Person Household | 20 (29.8%) | 47 (70.2%) |
| 3-Person Household | 15 (62.5%) | 9 (37.5%) |
| 4+ Person Household | 5 (55.6%) | 4 (44.4%) |
| Total Housing Units | 63 (48.8%) | 66 (51.2%) |
Occupancy by Educational Attainment in Rebecca
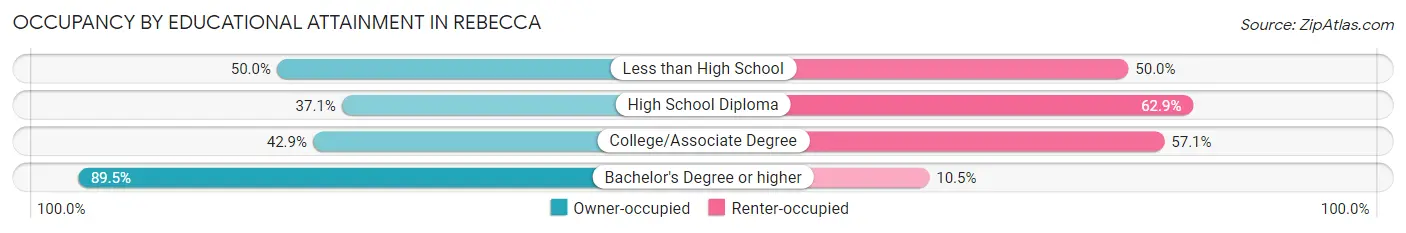
| Household Size | Owner-occupied | Renter-occupied |
| Less than High School | 6 (50.0%) | 6 (50.0%) |
| High School Diploma | 13 (37.1%) | 22 (62.9%) |
| College/Associate Degree | 27 (42.9%) | 36 (57.1%) |
| Bachelor's Degree or higher | 17 (89.5%) | 2 (10.5%) |
Occupancy by Age of Householder in Rebecca
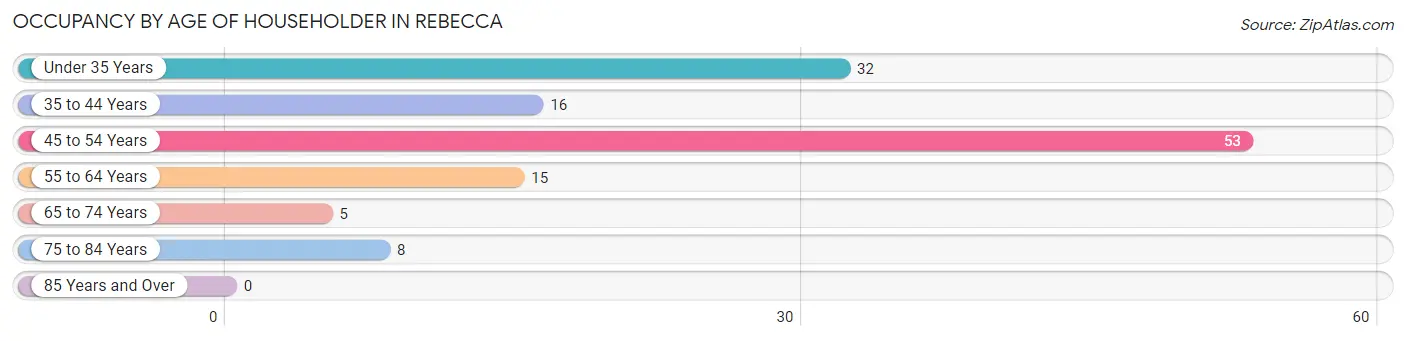
| Age Bracket | # Households | % Households |
| Under 35 Years | 32 | 24.8% |
| 35 to 44 Years | 16 | 12.4% |
| 45 to 54 Years | 53 | 41.1% |
| 55 to 64 Years | 15 | 11.6% |
| 65 to 74 Years | 5 | 3.9% |
| 75 to 84 Years | 8 | 6.2% |
| 85 Years and Over | 0 | 0.0% |
| Total | 129 | 100.0% |
Housing Finances in Rebecca
Median Income by Occupancy in Rebecca
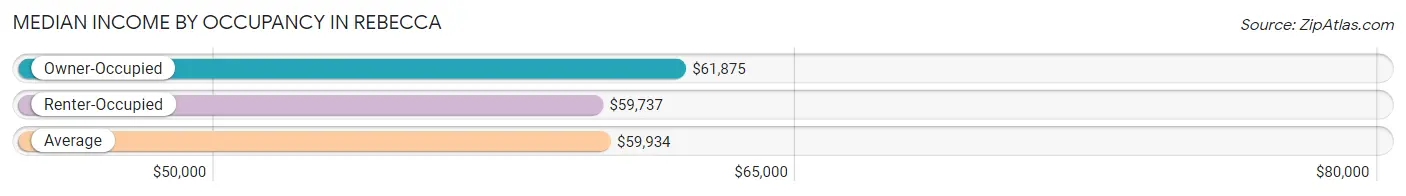
| Occupancy Type | # Households | Median Income |
| Owner-Occupied | 63 (48.8%) | $61,875 |
| Renter-Occupied | 66 (51.2%) | $59,737 |
| Average | 129 (100.0%) | $59,934 |
Occupancy by Householder Income Bracket in Rebecca
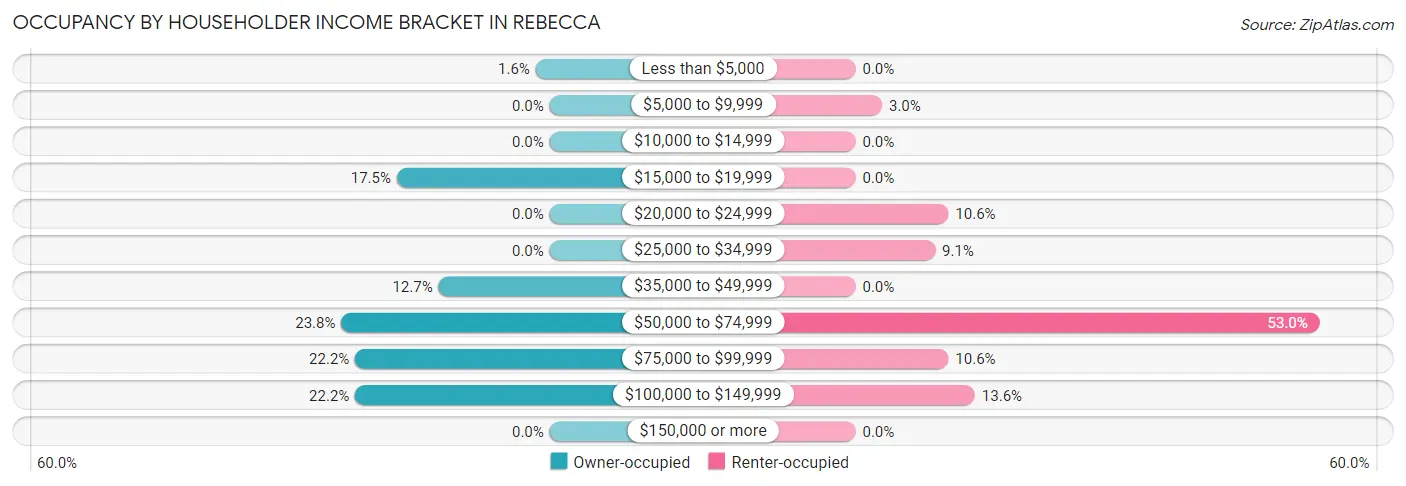
| Income Bracket | Owner-occupied | Renter-occupied |
| Less than $5,000 | 1 (1.6%) | 0 (0.0%) |
| $5,000 to $9,999 | 0 (0.0%) | 2 (3.0%) |
| $10,000 to $14,999 | 0 (0.0%) | 0 (0.0%) |
| $15,000 to $19,999 | 11 (17.5%) | 0 (0.0%) |
| $20,000 to $24,999 | 0 (0.0%) | 7 (10.6%) |
| $25,000 to $34,999 | 0 (0.0%) | 6 (9.1%) |
| $35,000 to $49,999 | 8 (12.7%) | 0 (0.0%) |
| $50,000 to $74,999 | 15 (23.8%) | 35 (53.0%) |
| $75,000 to $99,999 | 14 (22.2%) | 7 (10.6%) |
| $100,000 to $149,999 | 14 (22.2%) | 9 (13.6%) |
| $150,000 or more | 0 (0.0%) | 0 (0.0%) |
| Total | 63 (100.0%) | 66 (100.0%) |
Monthly Housing Cost Tiers in Rebecca
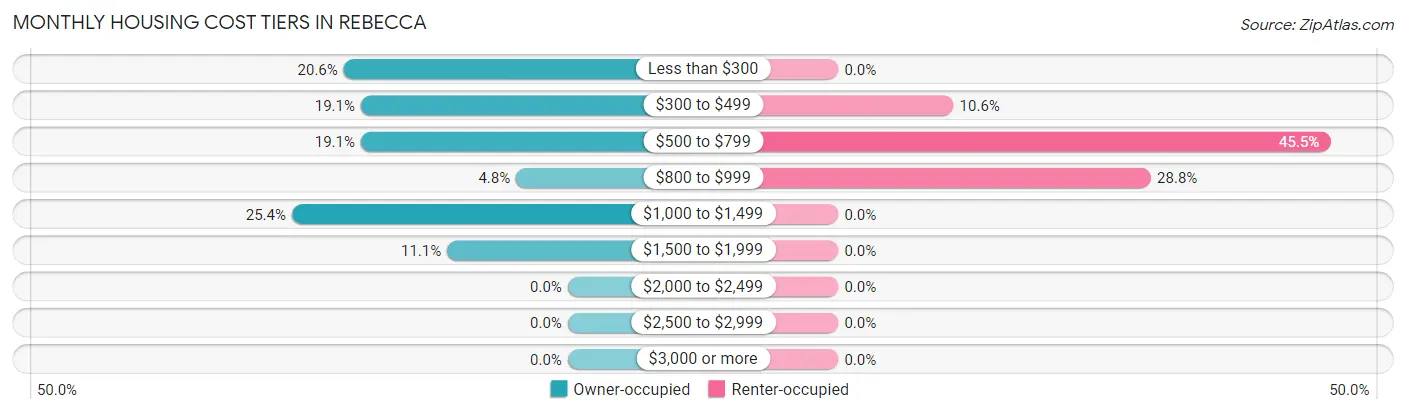
| Monthly Cost | Owner-occupied | Renter-occupied |
| Less than $300 | 13 (20.6%) | 0 (0.0%) |
| $300 to $499 | 12 (19.1%) | 7 (10.6%) |
| $500 to $799 | 12 (19.1%) | 30 (45.5%) |
| $800 to $999 | 3 (4.8%) | 19 (28.8%) |
| $1,000 to $1,499 | 16 (25.4%) | 0 (0.0%) |
| $1,500 to $1,999 | 7 (11.1%) | 0 (0.0%) |
| $2,000 to $2,499 | 0 (0.0%) | 0 (0.0%) |
| $2,500 to $2,999 | 0 (0.0%) | 0 (0.0%) |
| $3,000 or more | 0 (0.0%) | 0 (0.0%) |
| Total | 63 (100.0%) | 66 (100.0%) |
Physical Housing Characteristics in Rebecca
Housing Structures in Rebecca
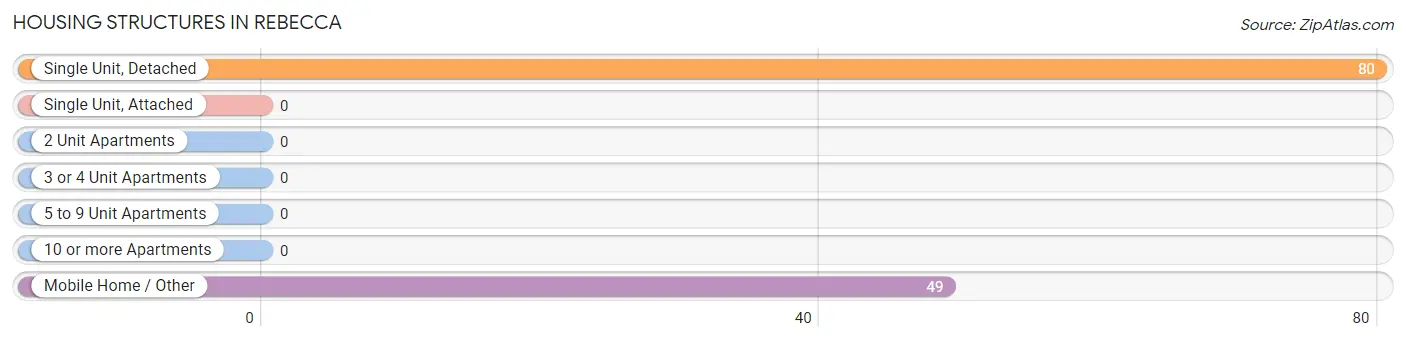
| Structure Type | # Housing Units | % Housing Units |
| Single Unit, Detached | 80 | 62.0% |
| Single Unit, Attached | 0 | 0.0% |
| 2 Unit Apartments | 0 | 0.0% |
| 3 or 4 Unit Apartments | 0 | 0.0% |
| 5 to 9 Unit Apartments | 0 | 0.0% |
| 10 or more Apartments | 0 | 0.0% |
| Mobile Home / Other | 49 | 38.0% |
| Total | 129 | 100.0% |
Housing Structures by Occupancy in Rebecca
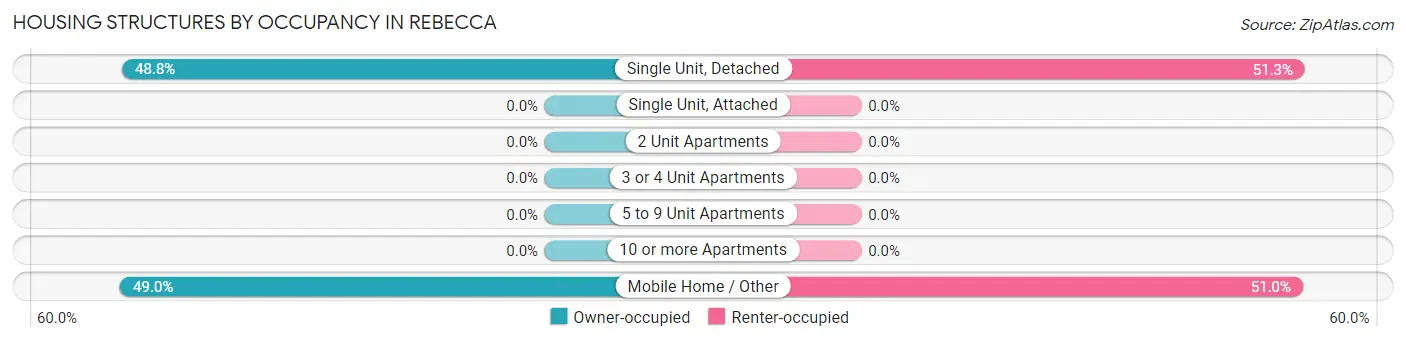
| Structure Type | Owner-occupied | Renter-occupied |
| Single Unit, Detached | 39 (48.7%) | 41 (51.2%) |
| Single Unit, Attached | 0 (0.0%) | 0 (0.0%) |
| 2 Unit Apartments | 0 (0.0%) | 0 (0.0%) |
| 3 or 4 Unit Apartments | 0 (0.0%) | 0 (0.0%) |
| 5 to 9 Unit Apartments | 0 (0.0%) | 0 (0.0%) |
| 10 or more Apartments | 0 (0.0%) | 0 (0.0%) |
| Mobile Home / Other | 24 (49.0%) | 25 (51.0%) |
| Total | 63 (48.8%) | 66 (51.2%) |
Housing Structures by Number of Rooms in Rebecca
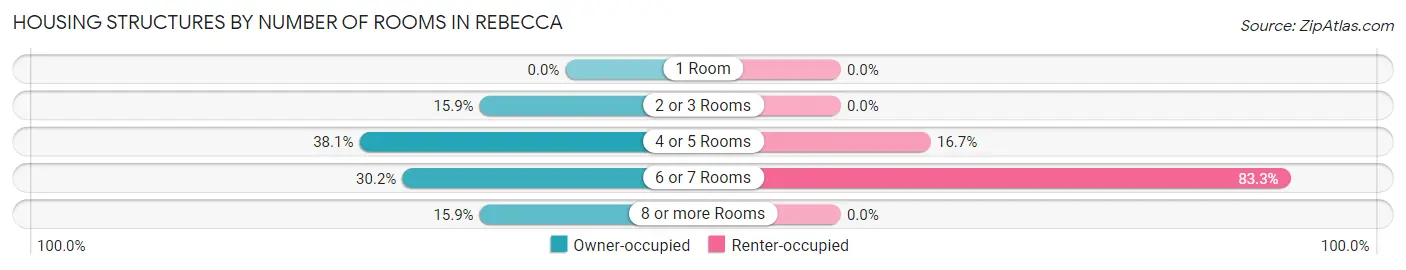
| Number of Rooms | Owner-occupied | Renter-occupied |
| 1 Room | 0 (0.0%) | 0 (0.0%) |
| 2 or 3 Rooms | 10 (15.9%) | 0 (0.0%) |
| 4 or 5 Rooms | 24 (38.1%) | 11 (16.7%) |
| 6 or 7 Rooms | 19 (30.2%) | 55 (83.3%) |
| 8 or more Rooms | 10 (15.9%) | 0 (0.0%) |
| Total | 63 (100.0%) | 66 (100.0%) |
Housing Structure by Heating Type in Rebecca
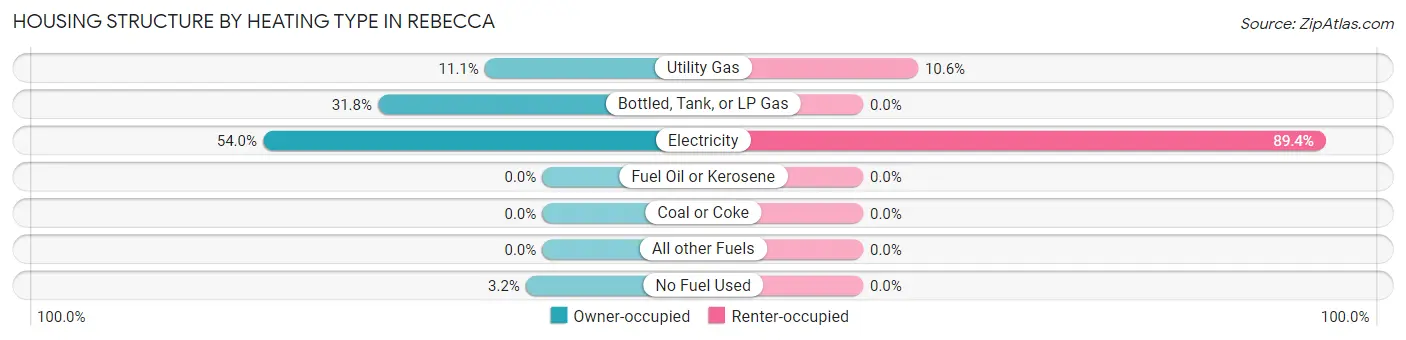
| Heating Type | Owner-occupied | Renter-occupied |
| Utility Gas | 7 (11.1%) | 7 (10.6%) |
| Bottled, Tank, or LP Gas | 20 (31.8%) | 0 (0.0%) |
| Electricity | 34 (54.0%) | 59 (89.4%) |
| Fuel Oil or Kerosene | 0 (0.0%) | 0 (0.0%) |
| Coal or Coke | 0 (0.0%) | 0 (0.0%) |
| All other Fuels | 0 (0.0%) | 0 (0.0%) |
| No Fuel Used | 2 (3.2%) | 0 (0.0%) |
| Total | 63 (100.0%) | 66 (100.0%) |
Household Vehicle Usage in Rebecca
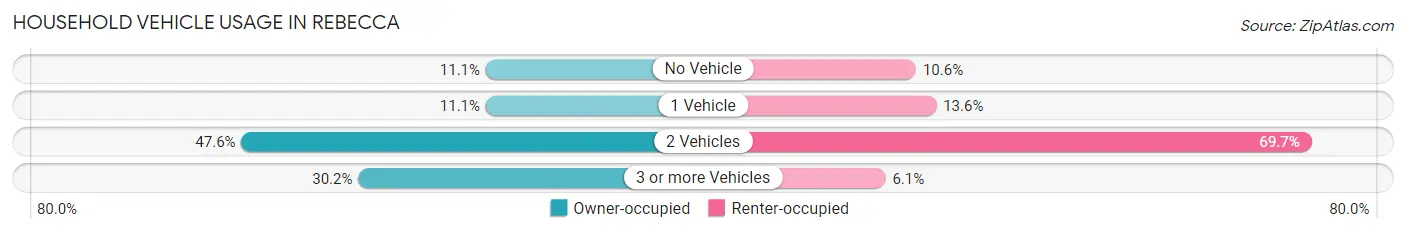
| Vehicles per Household | Owner-occupied | Renter-occupied |
| No Vehicle | 7 (11.1%) | 7 (10.6%) |
| 1 Vehicle | 7 (11.1%) | 9 (13.6%) |
| 2 Vehicles | 30 (47.6%) | 46 (69.7%) |
| 3 or more Vehicles | 19 (30.2%) | 4 (6.1%) |
| Total | 63 (100.0%) | 66 (100.0%) |
Real Estate & Mortgages in Rebecca
Real Estate and Mortgage Overview in Rebecca
| Characteristic | Without Mortgage | With Mortgage |
| Housing Units | 36 | 27 |
| Median Property Value | $64,300 | $130,400 |
| Median Household Income | $56,500 | $0 |
| Monthly Housing Costs | $375 | $0 |
| Real Estate Taxes | - | - |
Property Value by Mortgage Status in Rebecca
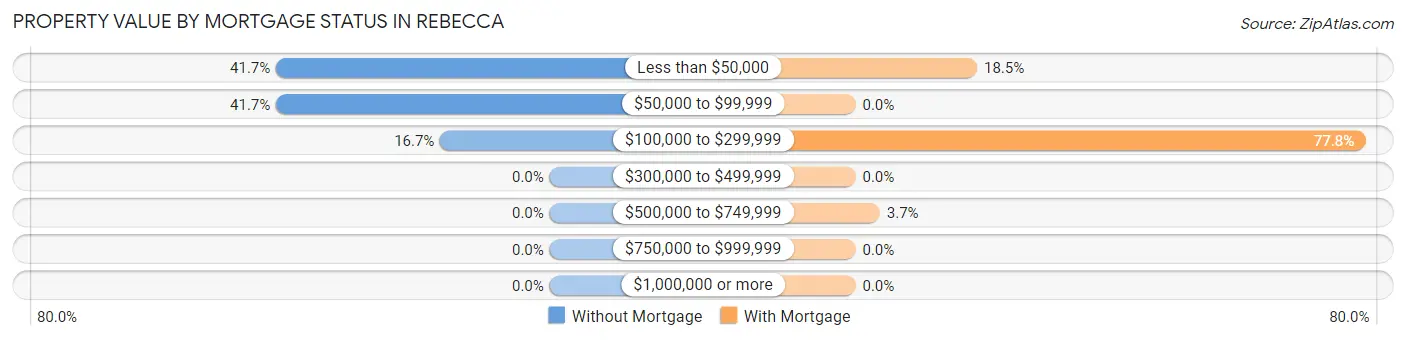
| Property Value | Without Mortgage | With Mortgage |
| Less than $50,000 | 15 (41.7%) | 5 (18.5%) |
| $50,000 to $99,999 | 15 (41.7%) | 0 (0.0%) |
| $100,000 to $299,999 | 6 (16.7%) | 21 (77.8%) |
| $300,000 to $499,999 | 0 (0.0%) | 0 (0.0%) |
| $500,000 to $749,999 | 0 (0.0%) | 1 (3.7%) |
| $750,000 to $999,999 | 0 (0.0%) | 0 (0.0%) |
| $1,000,000 or more | 0 (0.0%) | 0 (0.0%) |
| Total | 36 (100.0%) | 27 (100.0%) |
Household Income by Mortgage Status in Rebecca
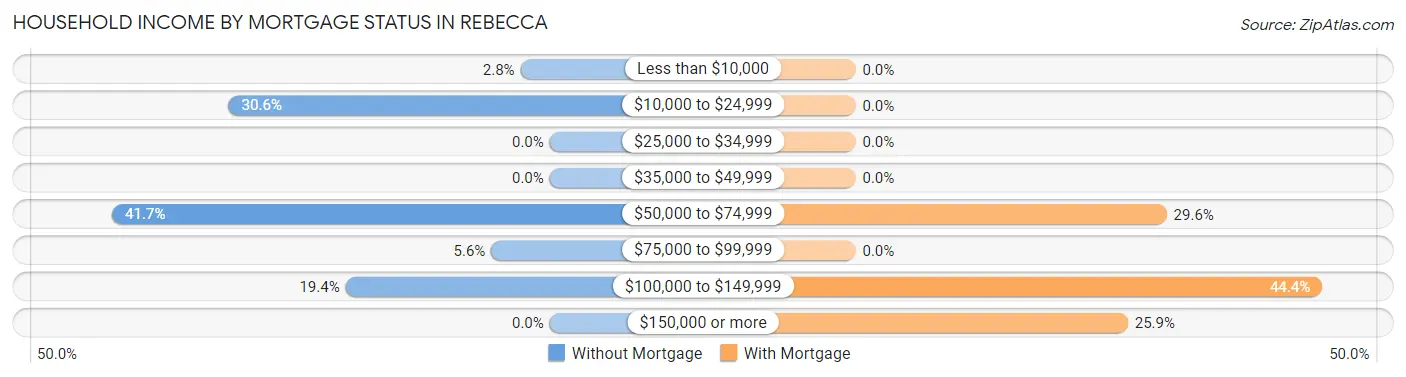
| Household Income | Without Mortgage | With Mortgage |
| Less than $10,000 | 1 (2.8%) | 0 (0.0%) |
| $10,000 to $24,999 | 11 (30.6%) | 0 (0.0%) |
| $25,000 to $34,999 | 0 (0.0%) | 0 (0.0%) |
| $35,000 to $49,999 | 0 (0.0%) | 0 (0.0%) |
| $50,000 to $74,999 | 15 (41.7%) | 8 (29.6%) |
| $75,000 to $99,999 | 2 (5.6%) | 0 (0.0%) |
| $100,000 to $149,999 | 7 (19.4%) | 12 (44.4%) |
| $150,000 or more | 0 (0.0%) | 7 (25.9%) |
| Total | 36 (100.0%) | 27 (100.0%) |
Property Value to Household Income Ratio in Rebecca
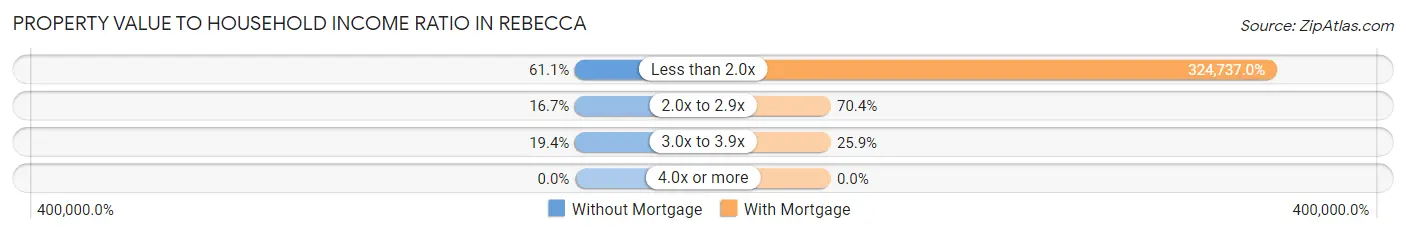
| Value-to-Income Ratio | Without Mortgage | With Mortgage |
| Less than 2.0x | 22 (61.1%) | 87,679 (324,737.0%) |
| 2.0x to 2.9x | 6 (16.7%) | 19 (70.4%) |
| 3.0x to 3.9x | 7 (19.4%) | 7 (25.9%) |
| 4.0x or more | 0 (0.0%) | 0 (0.0%) |
| Total | 36 (100.0%) | 27 (100.0%) |
Real Estate Taxes by Mortgage Status in Rebecca
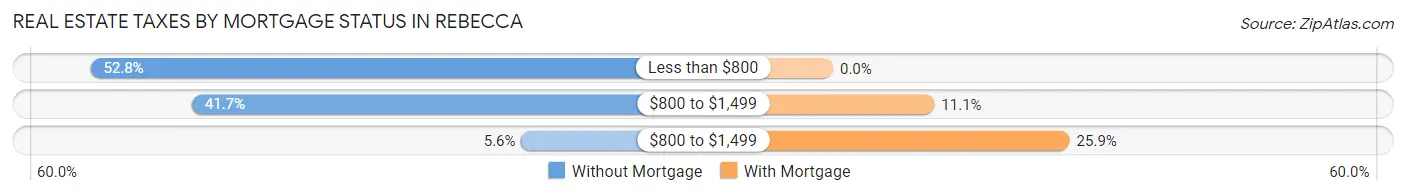
| Property Taxes | Without Mortgage | With Mortgage |
| Less than $800 | 19 (52.8%) | 0 (0.0%) |
| $800 to $1,499 | 15 (41.7%) | 3 (11.1%) |
| $800 to $1,499 | 2 (5.6%) | 7 (25.9%) |
| Total | 36 (100.0%) | 27 (100.0%) |
Health & Disability in Rebecca
Health Insurance Coverage by Age in Rebecca
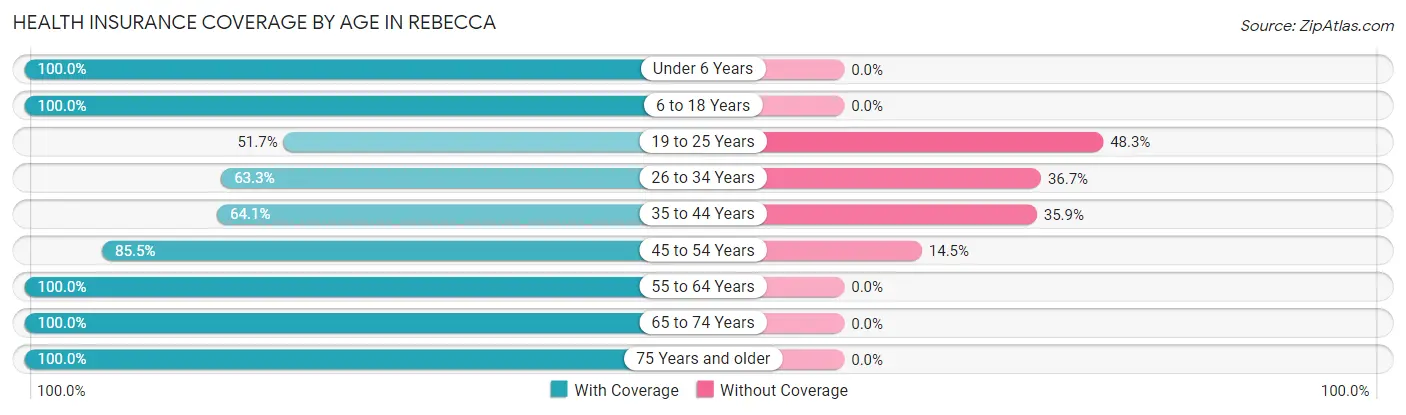
| Age Bracket | With Coverage | Without Coverage |
| Under 6 Years | 7 (100.0%) | 0 (0.0%) |
| 6 to 18 Years | 53 (100.0%) | 0 (0.0%) |
| 19 to 25 Years | 15 (51.7%) | 14 (48.3%) |
| 26 to 34 Years | 19 (63.3%) | 11 (36.7%) |
| 35 to 44 Years | 25 (64.1%) | 14 (35.9%) |
| 45 to 54 Years | 65 (85.5%) | 11 (14.5%) |
| 55 to 64 Years | 24 (100.0%) | 0 (0.0%) |
| 65 to 74 Years | 49 (100.0%) | 0 (0.0%) |
| 75 Years and older | 8 (100.0%) | 0 (0.0%) |
| Total | 265 (84.1%) | 50 (15.9%) |
Health Insurance Coverage by Citizenship Status in Rebecca
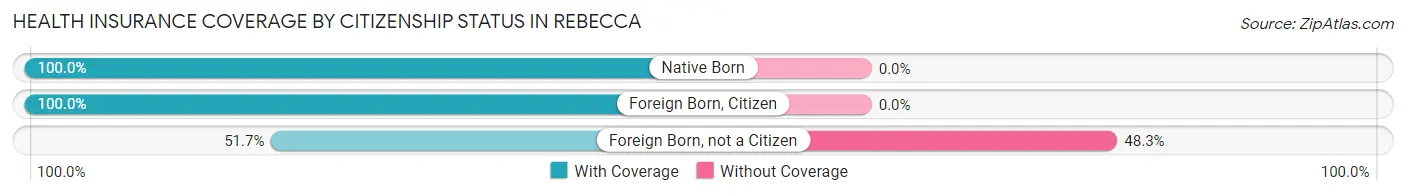
| Citizenship Status | With Coverage | Without Coverage |
| Native Born | 7 (100.0%) | 0 (0.0%) |
| Foreign Born, Citizen | 53 (100.0%) | 0 (0.0%) |
| Foreign Born, not a Citizen | 15 (51.7%) | 14 (48.3%) |
Health Insurance Coverage by Household Income in Rebecca
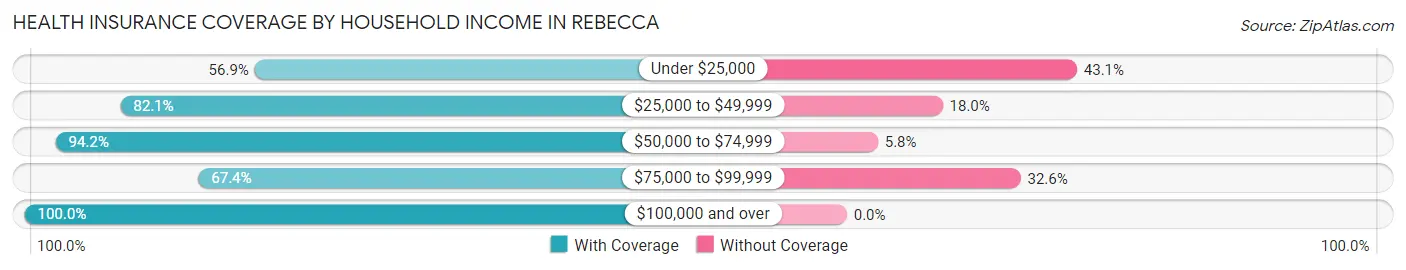
| Household Income | With Coverage | Without Coverage |
| Under $25,000 | 33 (56.9%) | 25 (43.1%) |
| $25,000 to $49,999 | 32 (82.1%) | 7 (17.9%) |
| $50,000 to $74,999 | 65 (94.2%) | 4 (5.8%) |
| $75,000 to $99,999 | 29 (67.4%) | 14 (32.6%) |
| $100,000 and over | 106 (100.0%) | 0 (0.0%) |
Public vs Private Health Insurance Coverage by Age in Rebecca
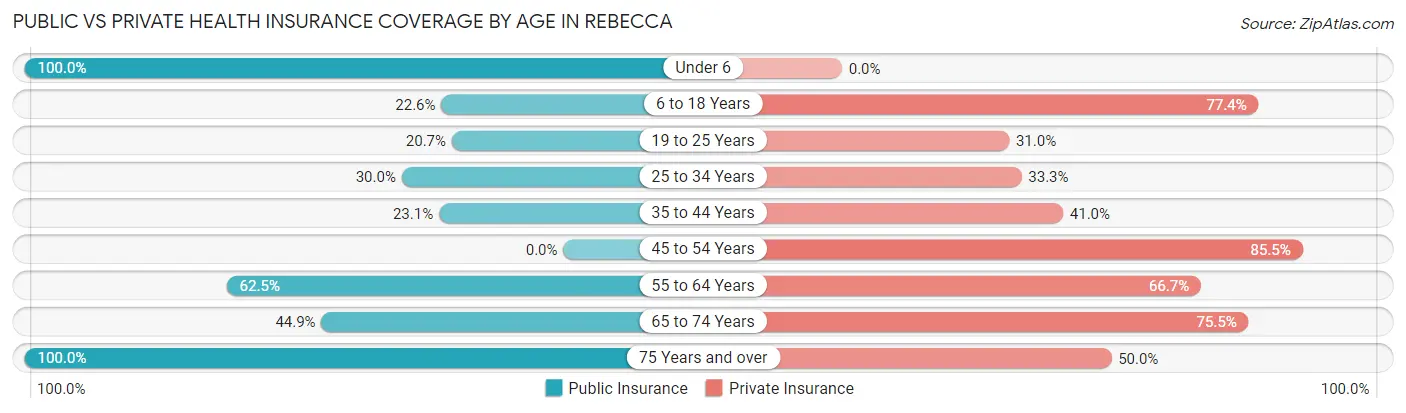
| Age Bracket | Public Insurance | Private Insurance |
| Under 6 | 7 (100.0%) | 0 (0.0%) |
| 6 to 18 Years | 12 (22.6%) | 41 (77.4%) |
| 19 to 25 Years | 6 (20.7%) | 9 (31.0%) |
| 25 to 34 Years | 9 (30.0%) | 10 (33.3%) |
| 35 to 44 Years | 9 (23.1%) | 16 (41.0%) |
| 45 to 54 Years | 0 (0.0%) | 65 (85.5%) |
| 55 to 64 Years | 15 (62.5%) | 16 (66.7%) |
| 65 to 74 Years | 22 (44.9%) | 37 (75.5%) |
| 75 Years and over | 8 (100.0%) | 4 (50.0%) |
| Total | 88 (27.9%) | 198 (62.9%) |
Disability Status by Sex by Age in Rebecca
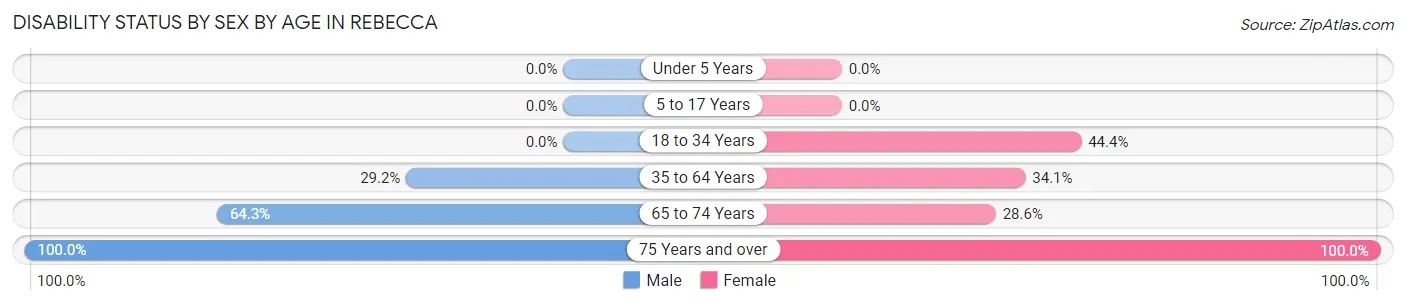
| Age Bracket | Male | Female |
| Under 5 Years | 0 (0.0%) | 0 (0.0%) |
| 5 to 17 Years | 0 (0.0%) | 0 (0.0%) |
| 18 to 34 Years | 0 (0.0%) | 8 (44.4%) |
| 35 to 64 Years | 14 (29.2%) | 31 (34.1%) |
| 65 to 74 Years | 27 (64.3%) | 2 (28.6%) |
| 75 Years and over | 4 (100.0%) | 4 (100.0%) |
Disability Class by Sex by Age in Rebecca
Disability Class: Hearing Difficulty
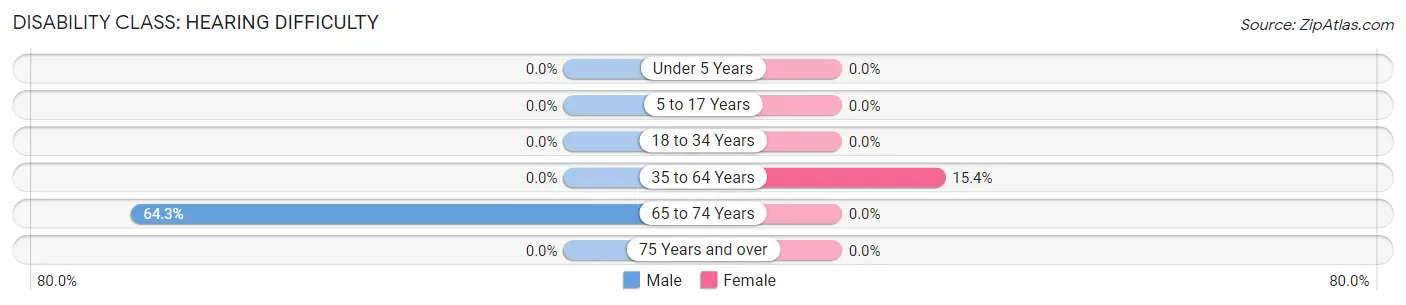
| Age Bracket | Male | Female |
| Under 5 Years | 0 (0.0%) | 0 (0.0%) |
| 5 to 17 Years | 0 (0.0%) | 0 (0.0%) |
| 18 to 34 Years | 0 (0.0%) | 0 (0.0%) |
| 35 to 64 Years | 0 (0.0%) | 14 (15.4%) |
| 65 to 74 Years | 27 (64.3%) | 0 (0.0%) |
| 75 Years and over | 0 (0.0%) | 0 (0.0%) |
Disability Class: Vision Difficulty
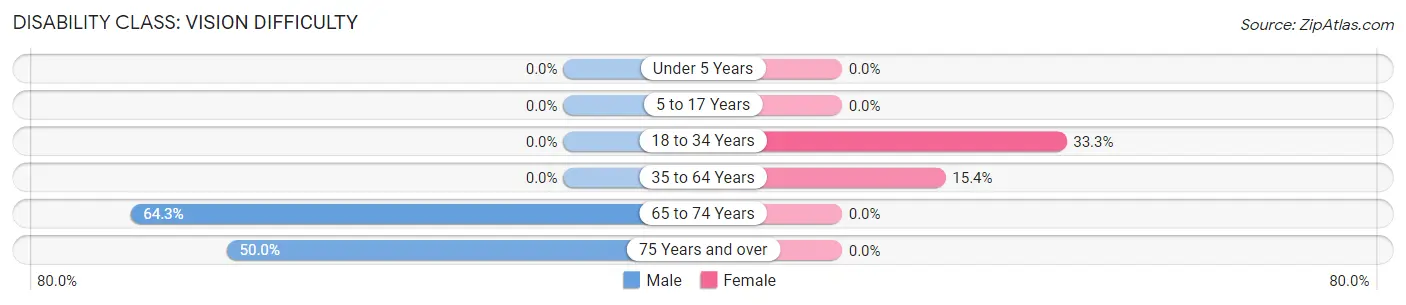
| Age Bracket | Male | Female |
| Under 5 Years | 0 (0.0%) | 0 (0.0%) |
| 5 to 17 Years | 0 (0.0%) | 0 (0.0%) |
| 18 to 34 Years | 0 (0.0%) | 6 (33.3%) |
| 35 to 64 Years | 0 (0.0%) | 14 (15.4%) |
| 65 to 74 Years | 27 (64.3%) | 0 (0.0%) |
| 75 Years and over | 2 (50.0%) | 0 (0.0%) |
Disability Class: Cognitive Difficulty
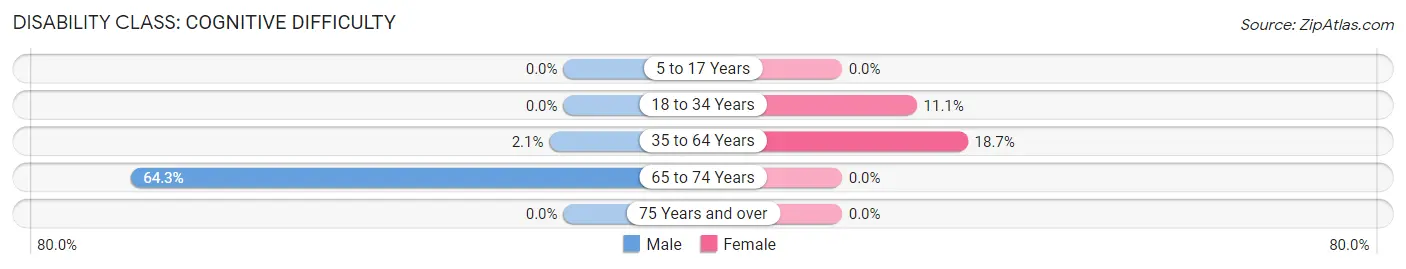
| Age Bracket | Male | Female |
| 5 to 17 Years | 0 (0.0%) | 0 (0.0%) |
| 18 to 34 Years | 0 (0.0%) | 2 (11.1%) |
| 35 to 64 Years | 1 (2.1%) | 17 (18.7%) |
| 65 to 74 Years | 27 (64.3%) | 0 (0.0%) |
| 75 Years and over | 0 (0.0%) | 0 (0.0%) |
Disability Class: Ambulatory Difficulty
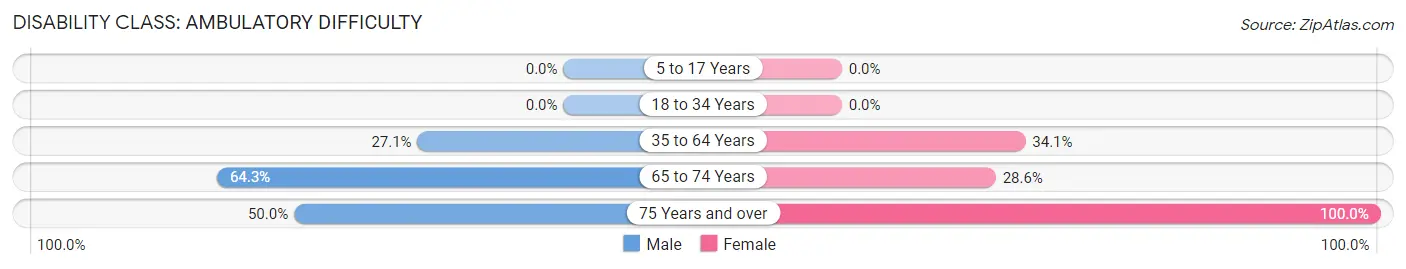
| Age Bracket | Male | Female |
| 5 to 17 Years | 0 (0.0%) | 0 (0.0%) |
| 18 to 34 Years | 0 (0.0%) | 0 (0.0%) |
| 35 to 64 Years | 13 (27.1%) | 31 (34.1%) |
| 65 to 74 Years | 27 (64.3%) | 2 (28.6%) |
| 75 Years and over | 2 (50.0%) | 4 (100.0%) |
Disability Class: Self-Care Difficulty
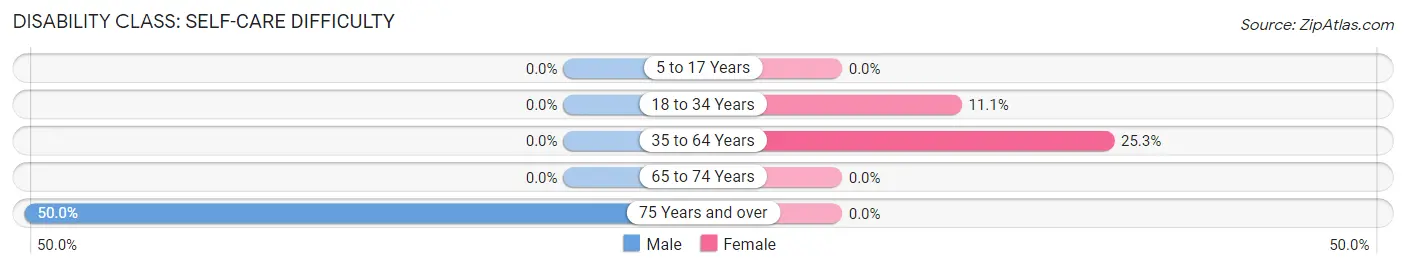
| Age Bracket | Male | Female |
| 5 to 17 Years | 0 (0.0%) | 0 (0.0%) |
| 18 to 34 Years | 0 (0.0%) | 2 (11.1%) |
| 35 to 64 Years | 0 (0.0%) | 23 (25.3%) |
| 65 to 74 Years | 0 (0.0%) | 0 (0.0%) |
| 75 Years and over | 2 (50.0%) | 0 (0.0%) |
Technology Access in Rebecca
Computing Device Access in Rebecca
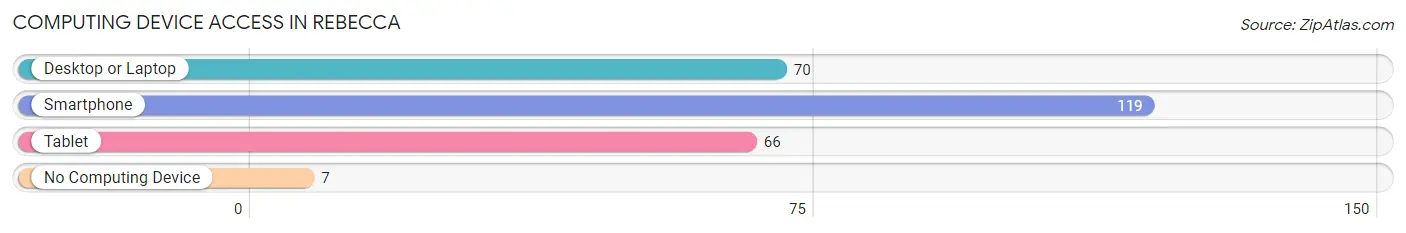
| Device Type | # Households | % Households |
| Desktop or Laptop | 70 | 54.3% |
| Smartphone | 119 | 92.2% |
| Tablet | 66 | 51.2% |
| No Computing Device | 7 | 5.4% |
| Total | 129 | 100.0% |
Internet Access in Rebecca
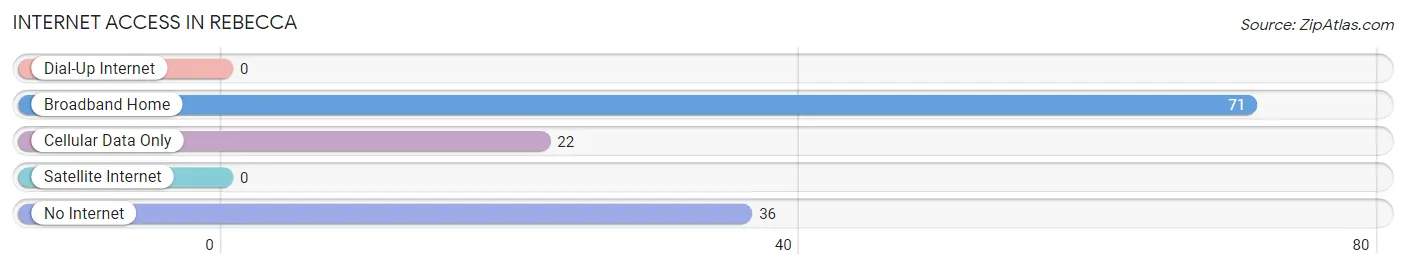
| Internet Type | # Households | % Households |
| Dial-Up Internet | 0 | 0.0% |
| Broadband Home | 71 | 55.0% |
| Cellular Data Only | 22 | 17.1% |
| Satellite Internet | 0 | 0.0% |
| No Internet | 36 | 27.9% |
| Total | 129 | 100.0% |
Rebecca Summary
Rebecca, Georgia is a small town located in Tattnall County, Georgia. It is situated in the southeastern part of the state, about 30 miles from the Atlantic Ocean. The town has a population of approximately 1,000 people and is part of the larger metropolitan area of Savannah.
History
Rebecca, Georgia was founded in 1872 by a group of settlers from the nearby town of Glennville. The town was named after the daughter of one of the settlers, Rebecca. The town was originally a farming community, but it soon developed into a small commercial center. The town was incorporated in 1891 and the first mayor was elected in 1892.
In the early 1900s, Rebecca was a thriving community with a variety of businesses, including a cotton gin, a sawmill, a grist mill, and a general store. The town also had a post office, a bank, and a hotel. In the 1920s, the town began to decline as the economy shifted away from agriculture and more people moved to larger cities.
Geography
Rebecca is located in Tattnall County, Georgia, in the southeastern part of the state. It is situated about 30 miles from the Atlantic Ocean and is part of the larger metropolitan area of Savannah. The town is located on the banks of the Ohoopee River, which flows through the area. The town is surrounded by a variety of natural features, including forests, swamps, and wetlands.
Economy
Rebecca’s economy is largely based on agriculture and forestry. The town is home to several farms, which produce a variety of crops, including corn, soybeans, and cotton. The town also has a sawmill, which produces lumber for the local market. In addition, there are several small businesses in the town, including a general store, a gas station, and a restaurant.
Demographics
As of the 2010 census, Rebecca had a population of 1,000 people. The racial makeup of the town was 94.2% White, 3.2% African American, 0.7% Native American, 0.2% Asian, and 1.7% from other races. The median household income was $30,000 and the median age was 38. The town had a poverty rate of 22.2%.
Rebecca, Georgia is a small town with a rich history and a diverse population. It is a rural community with a strong agricultural and forestry economy. The town is home to a variety of businesses and is part of the larger metropolitan area of Savannah. The town has a population of 1,000 people and is a great place to live and work.
Common Questions
What is Per Capita Income in Rebecca?
Per Capita income in Rebecca is $30,262.
What is the Median Family Income in Rebecca?
Median Family Income in Rebecca is $67,188.
What is the Median Household income in Rebecca?
Median Household Income in Rebecca is $59,934.
What is Income or Wage Gap in Rebecca?
Income or Wage Gap in Rebecca is 45.8%.
Women in Rebecca earn 54.2 cents for every dollar earned by a man.
What is Inequality or Gini Index in Rebecca?
Inequality or Gini Index in Rebecca is 0.28.
What is the Total Population of Rebecca?
Total Population of Rebecca is 315.
What is the Total Male Population of Rebecca?
Total Male Population of Rebecca is 158.
What is the Total Female Population of Rebecca?
Total Female Population of Rebecca is 157.
What is the Ratio of Males per 100 Females in Rebecca?
There are 100.64 Males per 100 Females in Rebecca.
What is the Ratio of Females per 100 Males in Rebecca?
There are 99.37 Females per 100 Males in Rebecca.
What is the Median Population Age in Rebecca?
Median Population Age in Rebecca is 43.5 Years.
What is the Average Family Size in Rebecca
Average Family Size in Rebecca is 2.8 People.
What is the Average Household Size in Rebecca
Average Household Size in Rebecca is 2.4 People.
How Large is the Labor Force in Rebecca?
There are 154 People in the Labor Forcein in Rebecca.
What is the Percentage of People in the Labor Force in Rebecca?
57.9% of People are in the Labor Force in Rebecca.
What is the Unemployment Rate in Rebecca?
Unemployment Rate in Rebecca is 3.9%.