Jackson, GA Map & Demographics
Jackson Map
Jackson Overview
$22,293
PER CAPITA INCOME
$41,385
AVG FAMILY INCOME
$43,824
AVG HOUSEHOLD INCOME
21.0%
WAGE / INCOME GAP [ % ]
79.0¢/ $1
WAGE / INCOME GAP [ $ ]
0.51
INEQUALITY / GINI INDEX
5,497
TOTAL POPULATION
2,799
MALE POPULATION
2,698
FEMALE POPULATION
103.74
MALES / 100 FEMALES
96.39
FEMALES / 100 MALES
35.4
MEDIAN AGE
3.1
AVG FAMILY SIZE
3.0
AVG HOUSEHOLD SIZE
2,081
LABOR FORCE [ PEOPLE ]
52.1%
PERCENT IN LABOR FORCE
6.3%
UNEMPLOYMENT RATE
Jackson Zip Codes
Income in Jackson
Income Overview in Jackson
Per Capita Income in Jackson is $22,293, while median incomes of families and households are $41,385 and $43,824 respectively.
| Characteristic | Number | Measure |
| Per Capita Income | 5,497 | $22,293 |
| Median Family Income | 1,411 | $41,385 |
| Mean Family Income | 1,411 | $69,551 |
| Median Household Income | 1,692 | $43,824 |
| Mean Household Income | 1,692 | $65,600 |
| Income Deficit | 1,411 | $0 |
| Wage / Income Gap (%) | 5,497 | 20.98% |
| Wage / Income Gap ($) | 5,497 | 79.02¢ per $1 |
| Gini / Inequality Index | 5,497 | 0.51 |
Earnings by Sex in Jackson
Average Earnings in Jackson are $28,185, $32,578 for men and $25,742 for women, a difference of 21.0%.
| Sex | Number | Average Earnings |
| Male | 1,151 (52.1%) | $32,578 |
| Female | 1,060 (47.9%) | $25,742 |
| Total | 2,211 (100.0%) | $28,185 |
Earnings by Sex by Income Bracket in Jackson
The most common earnings brackets in Jackson are $35,000 to $39,999 for men (139 | 12.1%) and $17,500 to $19,999 for women (143 | 13.5%).
| Income | Male | Female |
| $2,499 or less | 31 (2.7%) | 7 (0.7%) |
| $2,500 to $4,999 | 41 (3.6%) | 64 (6.0%) |
| $5,000 to $7,499 | 0 (0.0%) | 66 (6.2%) |
| $7,500 to $9,999 | 0 (0.0%) | 0 (0.0%) |
| $10,000 to $12,499 | 134 (11.6%) | 101 (9.5%) |
| $12,500 to $14,999 | 20 (1.7%) | 22 (2.1%) |
| $15,000 to $17,499 | 123 (10.7%) | 18 (1.7%) |
| $17,500 to $19,999 | 0 (0.0%) | 143 (13.5%) |
| $20,000 to $22,499 | 61 (5.3%) | 38 (3.6%) |
| $22,500 to $24,999 | 44 (3.8%) | 44 (4.2%) |
| $25,000 to $29,999 | 102 (8.9%) | 138 (13.0%) |
| $30,000 to $34,999 | 97 (8.4%) | 54 (5.1%) |
| $35,000 to $39,999 | 139 (12.1%) | 39 (3.7%) |
| $40,000 to $44,999 | 48 (4.2%) | 109 (10.3%) |
| $45,000 to $49,999 | 17 (1.5%) | 83 (7.8%) |
| $50,000 to $54,999 | 47 (4.1%) | 24 (2.3%) |
| $55,000 to $64,999 | 40 (3.5%) | 44 (4.2%) |
| $65,000 to $74,999 | 100 (8.7%) | 12 (1.1%) |
| $75,000 to $99,999 | 72 (6.3%) | 27 (2.5%) |
| $100,000+ | 35 (3.0%) | 27 (2.5%) |
| Total | 1,151 (100.0%) | 1,060 (100.0%) |
Earnings by Sex by Educational Attainment in Jackson
Average earnings in Jackson are $33,172 for men and $26,099 for women, a difference of 21.3%. Men with an educational attainment of bachelor's degree enjoy the highest average annual earnings of $46,250, while those with less than high school education earn the least with $23,750. Women with an educational attainment of bachelor's degree earn the most with the average annual earnings of $42,112, while those with high school diploma education have the smallest earnings of $19,134.
| Educational Attainment | Male Income | Female Income |
| Less than High School | $23,750 | $23,581 |
| High School Diploma | $33,804 | $19,134 |
| College or Associate's Degree | $29,036 | $34,402 |
| Bachelor's Degree | $46,250 | $42,112 |
| Graduate Degree | - | - |
| Total | $33,172 | $26,099 |
Family Income in Jackson
Family Income Brackets in Jackson
According to the Jackson family income data, there are 447 families falling into the $35,000 to $49,999 income range, which is the most common income bracket and makes up 31.7% of all families. Conversely, the $150,000 to $199,999 income bracket is the least frequent group with only 11 families (0.8%) belonging to this category.
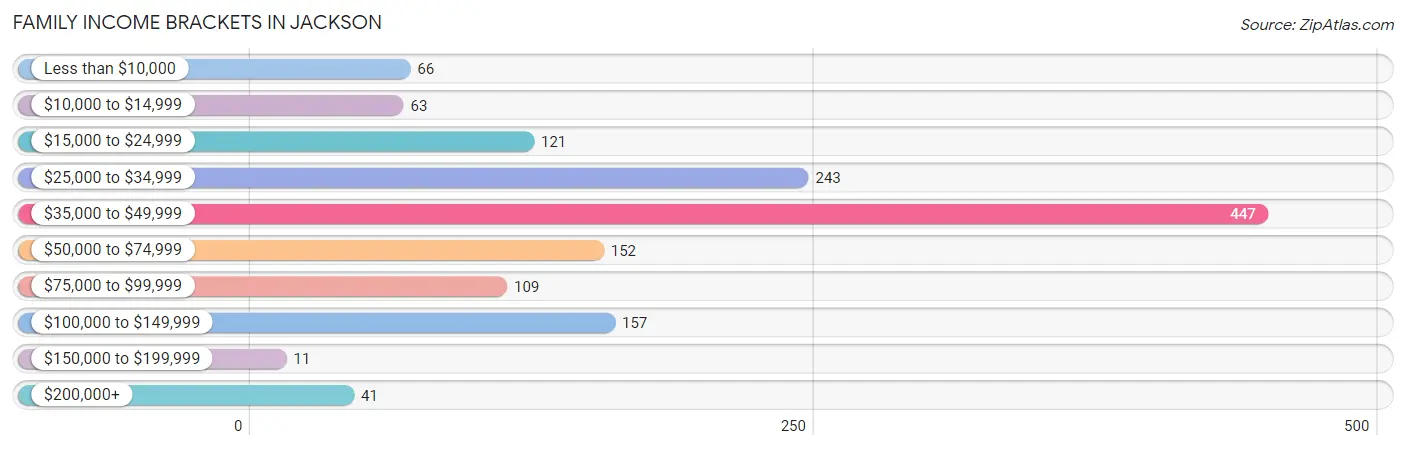
| Income Bracket | # Families | % Families |
| Less than $10,000 | 66 | 4.7% |
| $10,000 to $14,999 | 63 | 4.5% |
| $15,000 to $24,999 | 121 | 8.6% |
| $25,000 to $34,999 | 243 | 17.2% |
| $35,000 to $49,999 | 447 | 31.7% |
| $50,000 to $74,999 | 152 | 10.8% |
| $75,000 to $99,999 | 109 | 7.7% |
| $100,000 to $149,999 | 157 | 11.1% |
| $150,000 to $199,999 | 11 | 0.8% |
| $200,000+ | 41 | 2.9% |
Family Income by Famaliy Size in Jackson
3-person families (515 | 36.5%) account for the highest median family income in Jackson with $46,094 per family, while 2-person families (568 | 40.3%) have the highest median income of $20,692 per family member.
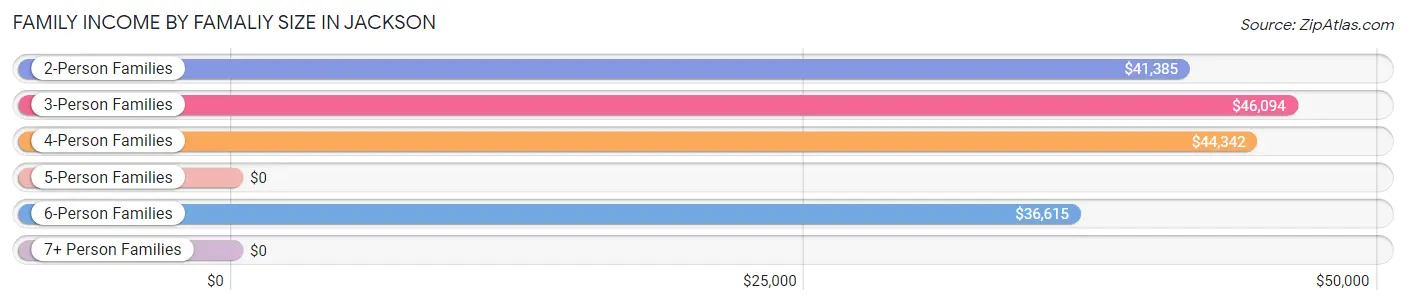
| Income Bracket | # Families | Median Income |
| 2-Person Families | 568 (40.3%) | $41,385 |
| 3-Person Families | 515 (36.5%) | $46,094 |
| 4-Person Families | 116 (8.2%) | $44,342 |
| 5-Person Families | 96 (6.8%) | $0 |
| 6-Person Families | 62 (4.4%) | $36,615 |
| 7+ Person Families | 54 (3.8%) | $0 |
| Total | 1,411 (100.0%) | $41,385 |
Family Income by Number of Earners in Jackson
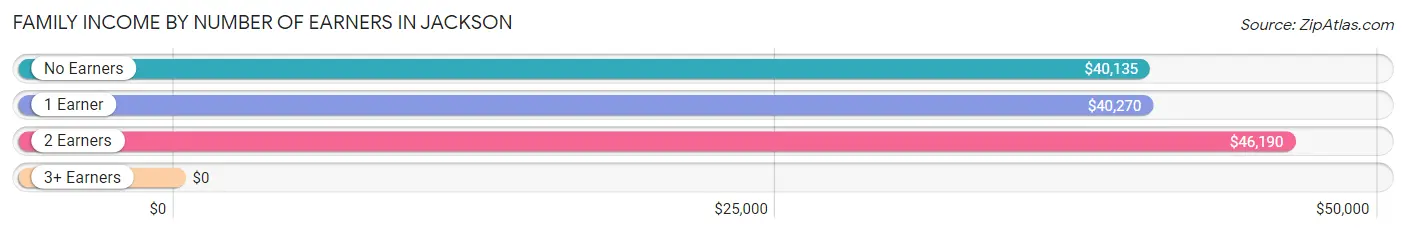
| Number of Earners | # Families | Median Income |
| No Earners | 265 (18.8%) | $40,135 |
| 1 Earner | 632 (44.8%) | $40,270 |
| 2 Earners | 512 (36.3%) | $46,190 |
| 3+ Earners | 2 (0.1%) | $0 |
| Total | 1,411 (100.0%) | $41,385 |
Household Income in Jackson
Household Income Brackets in Jackson
With 452 households falling in the category, the $35,000 to $49,999 income range is the most frequent in Jackson, accounting for 26.7% of all households. In contrast, only 12 households (0.7%) fall into the $150,000 to $199,999 income bracket, making it the least populous group.
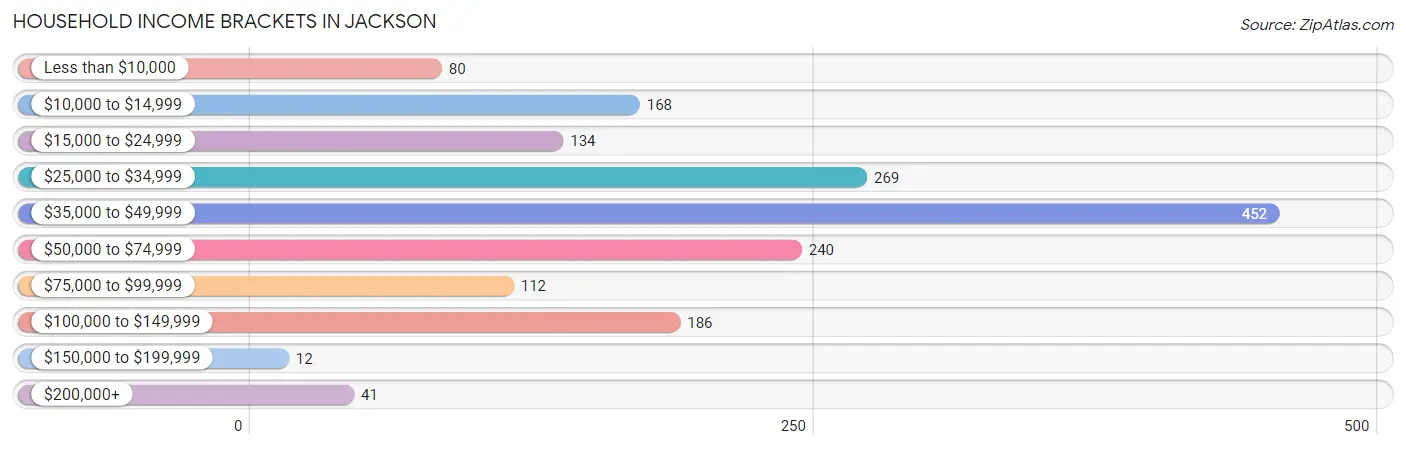
| Income Bracket | # Households | % Households |
| Less than $10,000 | 80 | 4.7% |
| $10,000 to $14,999 | 168 | 9.9% |
| $15,000 to $24,999 | 134 | 7.9% |
| $25,000 to $34,999 | 269 | 15.9% |
| $35,000 to $49,999 | 452 | 26.7% |
| $50,000 to $74,999 | 240 | 14.2% |
| $75,000 to $99,999 | 112 | 6.6% |
| $100,000 to $149,999 | 186 | 11.0% |
| $150,000 to $199,999 | 12 | 0.7% |
| $200,000+ | 41 | 2.4% |
Household Income by Householder Age in Jackson
The median household income in Jackson is $43,824, with the highest median household income of $52,255 found in the 65+ years age bracket for the primary householder. A total of 301 households (17.8%) fall into this category. Meanwhile, the 15 to 24 years age bracket for the primary householder has the lowest median household income of $0, with 58 households (3.4%) in this group.
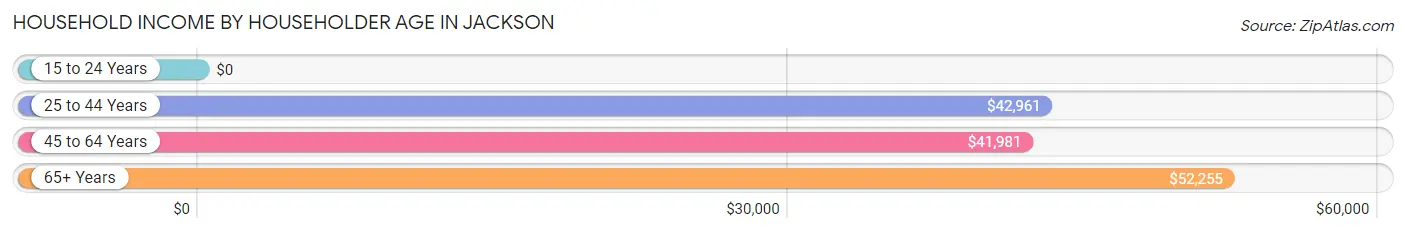
| Income Bracket | # Households | Median Income |
| 15 to 24 Years | 58 (3.4%) | $0 |
| 25 to 44 Years | 740 (43.7%) | $42,961 |
| 45 to 64 Years | 593 (35.0%) | $41,981 |
| 65+ Years | 301 (17.8%) | $52,255 |
| Total | 1,692 (100.0%) | $43,824 |
Poverty in Jackson
Income Below Poverty by Sex and Age in Jackson
With 32.8% poverty level for males and 26.2% for females among the residents of Jackson, 16 and 17 year old males and 12 to 14 year old females are the most vulnerable to poverty, with 140 males (85.4%) and 87 females (47.8%) in their respective age groups living below the poverty level.
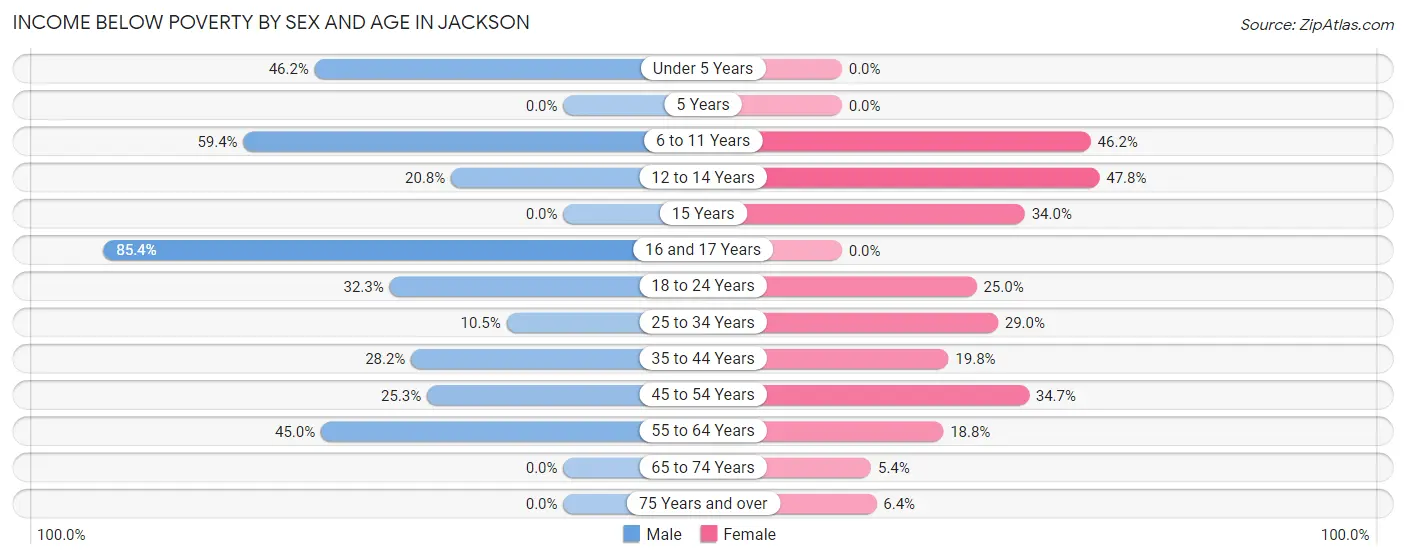
| Age Bracket | Male | Female |
| Under 5 Years | 78 (46.2%) | 0 (0.0%) |
| 5 Years | 0 (0.0%) | 0 (0.0%) |
| 6 to 11 Years | 190 (59.4%) | 176 (46.2%) |
| 12 to 14 Years | 40 (20.8%) | 87 (47.8%) |
| 15 Years | 0 (0.0%) | 18 (34.0%) |
| 16 and 17 Years | 140 (85.4%) | 0 (0.0%) |
| 18 to 24 Years | 20 (32.3%) | 30 (25.0%) |
| 25 to 34 Years | 48 (10.5%) | 97 (29.0%) |
| 35 to 44 Years | 111 (28.2%) | 75 (19.8%) |
| 45 to 54 Years | 64 (25.3%) | 118 (34.7%) |
| 55 to 64 Years | 152 (45.0%) | 35 (18.8%) |
| 65 to 74 Years | 0 (0.0%) | 14 (5.4%) |
| 75 Years and over | 0 (0.0%) | 7 (6.4%) |
| Total | 843 (32.8%) | 657 (26.2%) |
Income Above Poverty by Sex and Age in Jackson
According to the poverty statistics in Jackson, males aged 15 years and females aged under 5 years are the age groups that are most secure financially, with 100.0% of males and 100.0% of females in these age groups living above the poverty line.
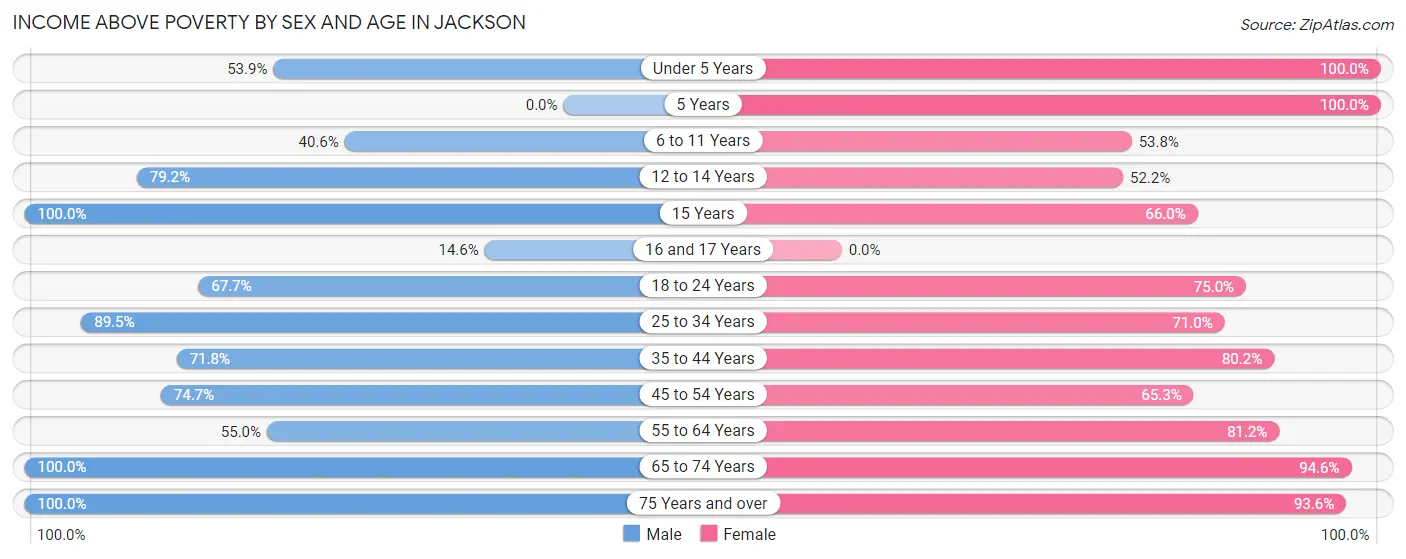
| Age Bracket | Male | Female |
| Under 5 Years | 91 (53.8%) | 128 (100.0%) |
| 5 Years | 0 (0.0%) | 34 (100.0%) |
| 6 to 11 Years | 130 (40.6%) | 205 (53.8%) |
| 12 to 14 Years | 152 (79.2%) | 95 (52.2%) |
| 15 Years | 36 (100.0%) | 35 (66.0%) |
| 16 and 17 Years | 24 (14.6%) | 0 (0.0%) |
| 18 to 24 Years | 42 (67.7%) | 90 (75.0%) |
| 25 to 34 Years | 408 (89.5%) | 238 (71.0%) |
| 35 to 44 Years | 282 (71.8%) | 304 (80.2%) |
| 45 to 54 Years | 189 (74.7%) | 222 (65.3%) |
| 55 to 64 Years | 186 (55.0%) | 151 (81.2%) |
| 65 to 74 Years | 87 (100.0%) | 244 (94.6%) |
| 75 Years and over | 98 (100.0%) | 102 (93.6%) |
| Total | 1,725 (67.2%) | 1,848 (73.8%) |
Income Below Poverty Among Married-Couple Families in Jackson
The poverty statistics for married-couple families in Jackson show that 6.7% or 31 of the total 463 families live below the poverty line. Families with 1 or 2 children have the highest poverty rate of 21.4%, comprising of 31 families. On the other hand, families with no children have the lowest poverty rate of 0.0%, which includes 0 families.
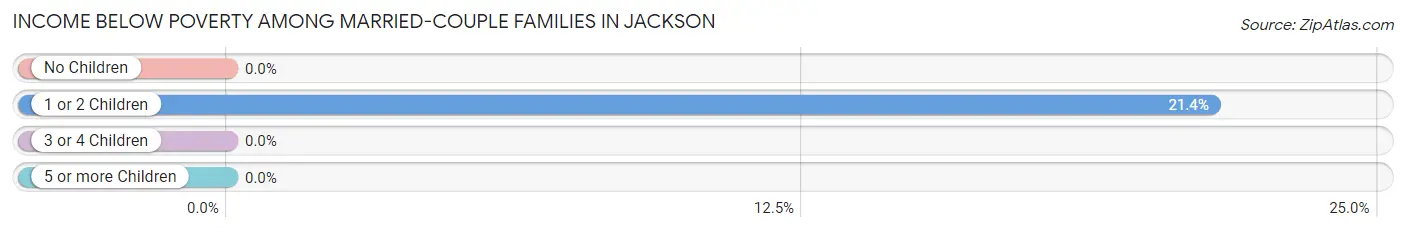
| Children | Above Poverty | Below Poverty |
| No Children | 295 (100.0%) | 0 (0.0%) |
| 1 or 2 Children | 114 (78.6%) | 31 (21.4%) |
| 3 or 4 Children | 23 (100.0%) | 0 (0.0%) |
| 5 or more Children | 0 (0.0%) | 0 (0.0%) |
| Total | 432 (93.3%) | 31 (6.7%) |
Income Below Poverty Among Single-Parent Households in Jackson
According to the poverty data in Jackson, 61.7% or 166 single-father households and 9.7% or 66 single-mother households are living below the poverty line. Among single-father households, those with 5 or more children have the highest poverty rate, with 102 households (100.0%) experiencing poverty. Likewise, among single-mother households, those with 3 or 4 children have the highest poverty rate, with 37 households (25.0%) falling below the poverty line.
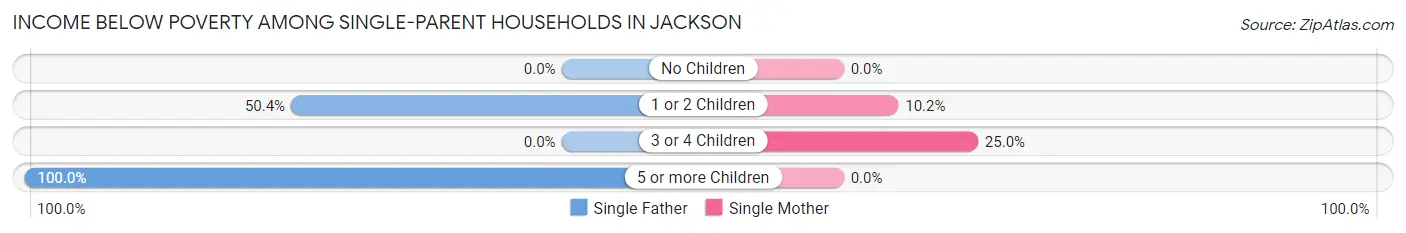
| Children | Single Father | Single Mother |
| No Children | 0 (0.0%) | 0 (0.0%) |
| 1 or 2 Children | 64 (50.4%) | 29 (10.2%) |
| 3 or 4 Children | 0 (0.0%) | 37 (25.0%) |
| 5 or more Children | 102 (100.0%) | 0 (0.0%) |
| Total | 166 (61.7%) | 66 (9.7%) |
Income Below Poverty Among Married-Couple vs Single-Parent Households in Jackson
The poverty data for Jackson shows that 31 of the married-couple family households (6.7%) and 232 of the single-parent households (24.5%) are living below the poverty level. Within the married-couple family households, those with 1 or 2 children have the highest poverty rate, with 31 households (21.4%) falling below the poverty line. Among the single-parent households, those with 5 or more children have the highest poverty rate, with 102 household (100.0%) living below poverty.
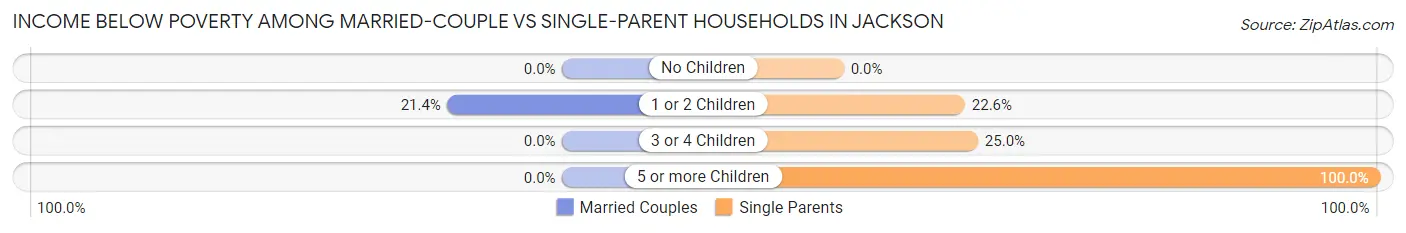
| Children | Married-Couple Families | Single-Parent Households |
| No Children | 0 (0.0%) | 0 (0.0%) |
| 1 or 2 Children | 31 (21.4%) | 93 (22.6%) |
| 3 or 4 Children | 0 (0.0%) | 37 (25.0%) |
| 5 or more Children | 0 (0.0%) | 102 (100.0%) |
| Total | 31 (6.7%) | 232 (24.5%) |
Race in Jackson
The most populous races in Jackson are White / Caucasian (2,623 | 47.7%), Black / African American (2,608 | 47.4%), and Two or more Races (236 | 4.3%).
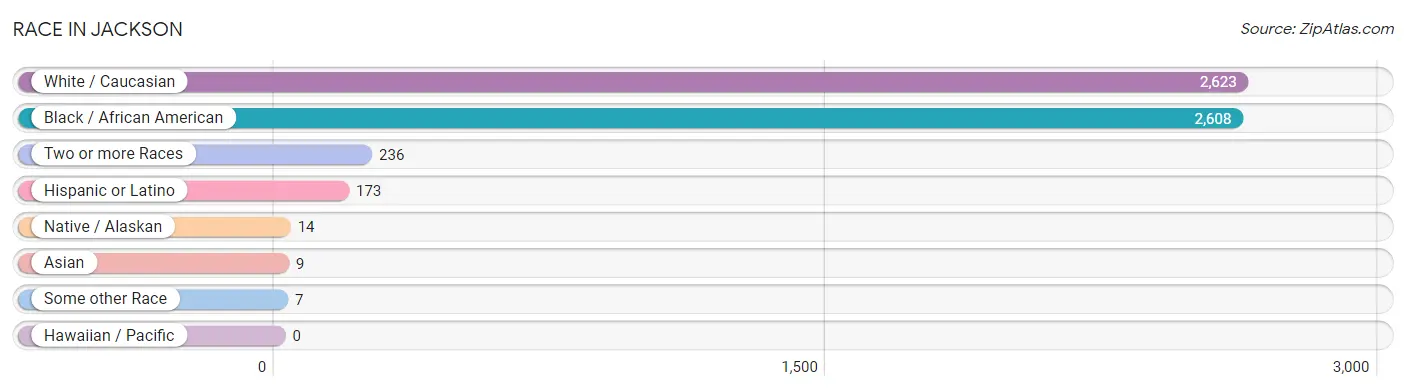
| Race | # Population | % Population |
| Asian | 9 | 0.2% |
| Black / African American | 2,608 | 47.4% |
| Hawaiian / Pacific | 0 | 0.0% |
| Hispanic or Latino | 173 | 3.2% |
| Native / Alaskan | 14 | 0.3% |
| White / Caucasian | 2,623 | 47.7% |
| Two or more Races | 236 | 4.3% |
| Some other Race | 7 | 0.1% |
| Total | 5,497 | 100.0% |
Ancestry in Jackson
The most populous ancestries reported in Jackson are American (2,586 | 47.0%), Irish (434 | 7.9%), English (408 | 7.4%), Mexican (153 | 2.8%), and Italian (145 | 2.6%), together accounting for 67.8% of all Jackson residents.
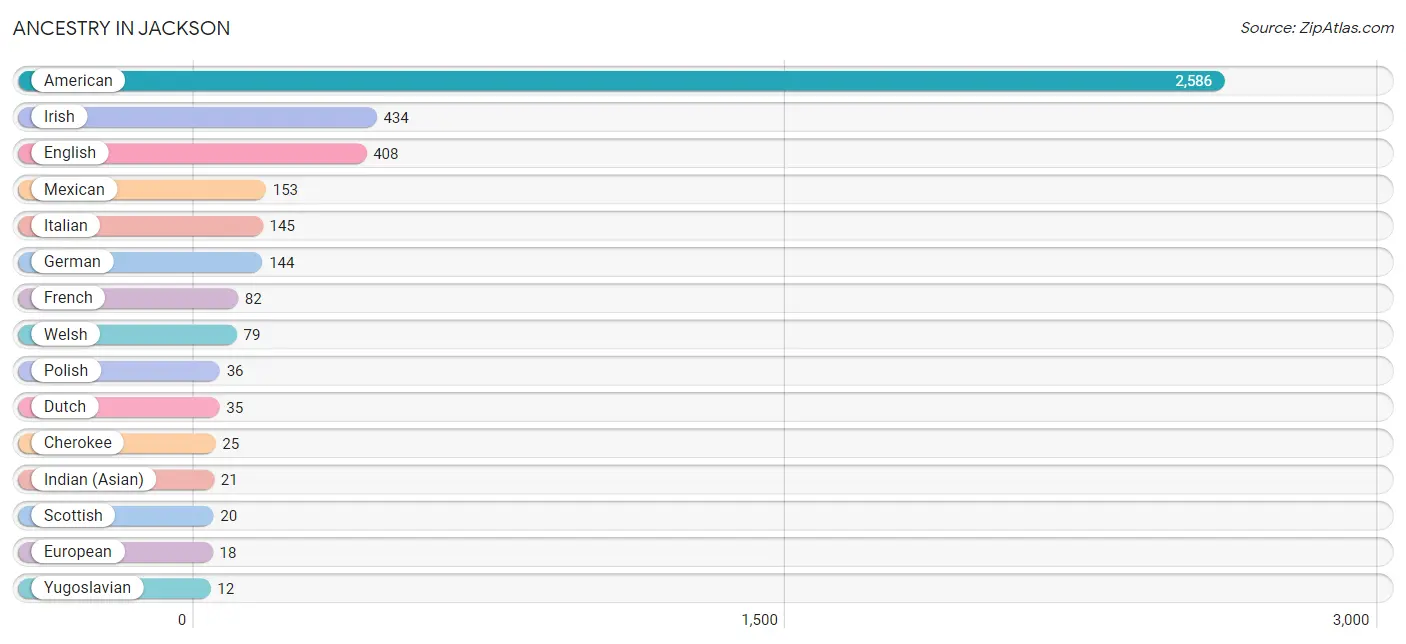
| Ancestry | # Population | % Population |
| American | 2,586 | 47.0% |
| Apache | 9 | 0.2% |
| Cherokee | 25 | 0.4% |
| Cuban | 6 | 0.1% |
| Danish | 10 | 0.2% |
| Dutch | 35 | 0.6% |
| English | 408 | 7.4% |
| European | 18 | 0.3% |
| French | 82 | 1.5% |
| German | 144 | 2.6% |
| Indian (Asian) | 21 | 0.4% |
| Irish | 434 | 7.9% |
| Italian | 145 | 2.6% |
| Mexican | 153 | 2.8% |
| Polish | 36 | 0.6% |
| Scotch-Irish | 7 | 0.1% |
| Scottish | 20 | 0.4% |
| Swedish | 10 | 0.2% |
| Welsh | 79 | 1.4% |
| West Indian | 7 | 0.1% |
| Yugoslavian | 12 | 0.2% | View All 21 Rows |
Immigrants in Jackson
The most numerous immigrant groups reported in Jackson came from Canada (46 | 0.8%), Central America (20 | 0.4%), Latin America (20 | 0.4%), Mexico (20 | 0.4%), and Asia (9 | 0.2%), together accounting for 2.1% of all Jackson residents.
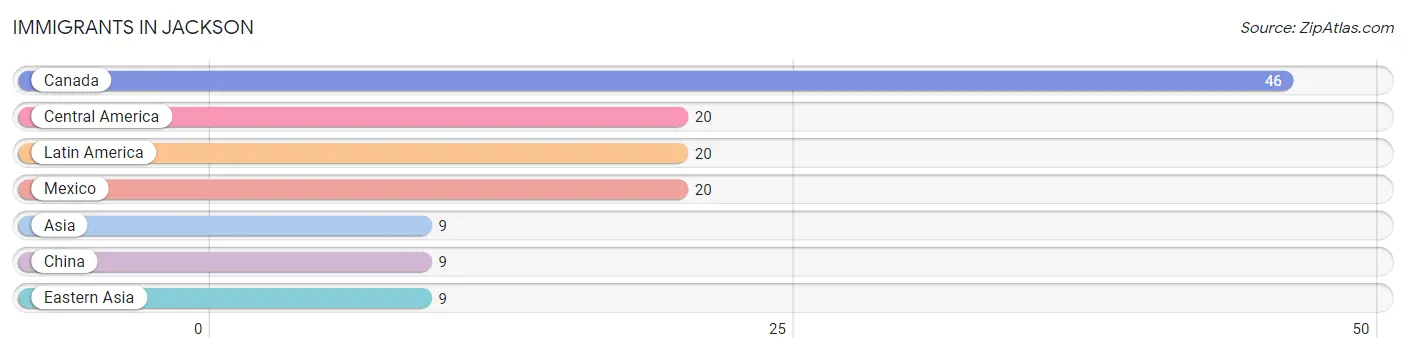
| Immigration Origin | # Population | % Population |
| Asia | 9 | 0.2% |
| Canada | 46 | 0.8% |
| Central America | 20 | 0.4% |
| China | 9 | 0.2% |
| Eastern Asia | 9 | 0.2% |
| Latin America | 20 | 0.4% |
| Mexico | 20 | 0.4% | View All 7 Rows |
Sex and Age in Jackson
Sex and Age in Jackson
The most populous age groups in Jackson are 40 to 44 Years (411 | 14.7%) for men and 10 to 14 Years (368 | 13.6%) for women.
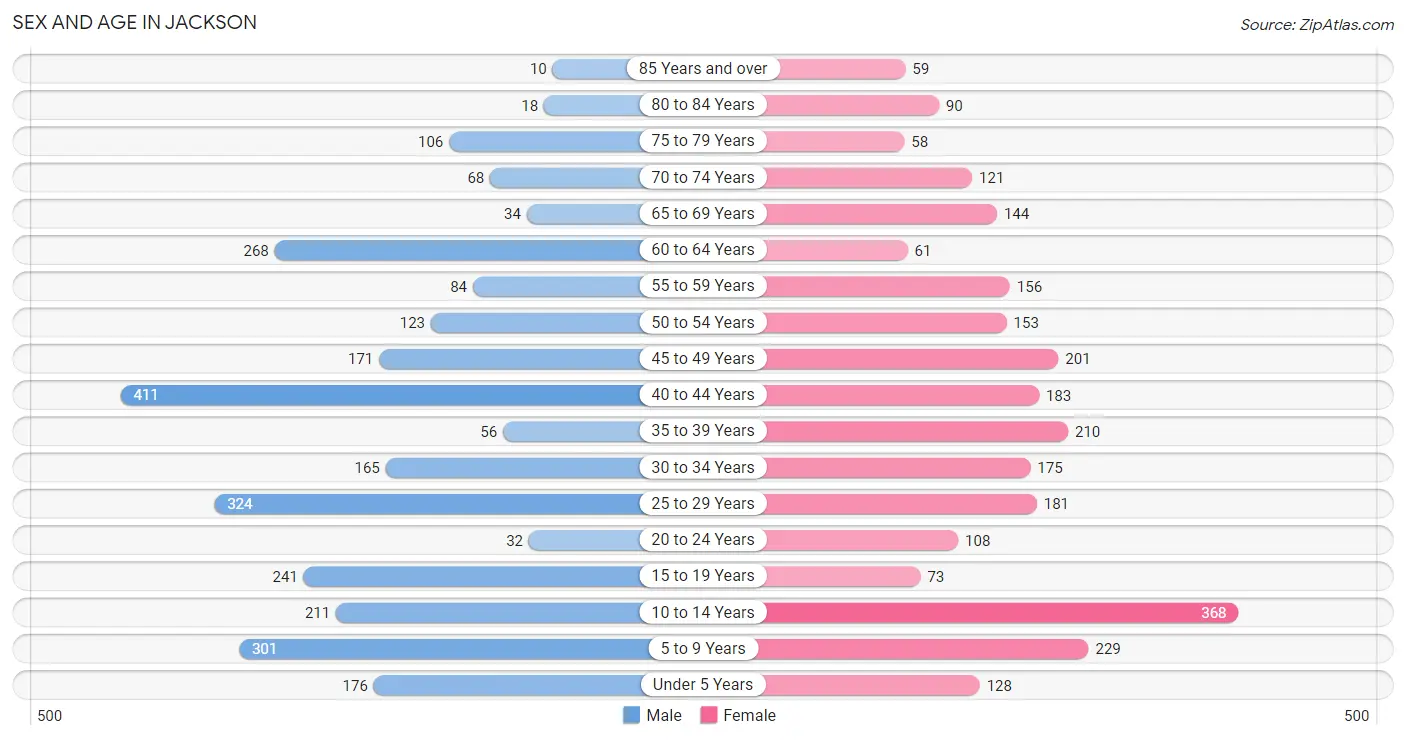
| Age Bracket | Male | Female |
| Under 5 Years | 176 (6.3%) | 128 (4.7%) |
| 5 to 9 Years | 301 (10.7%) | 229 (8.5%) |
| 10 to 14 Years | 211 (7.5%) | 368 (13.6%) |
| 15 to 19 Years | 241 (8.6%) | 73 (2.7%) |
| 20 to 24 Years | 32 (1.1%) | 108 (4.0%) |
| 25 to 29 Years | 324 (11.6%) | 181 (6.7%) |
| 30 to 34 Years | 165 (5.9%) | 175 (6.5%) |
| 35 to 39 Years | 56 (2.0%) | 210 (7.8%) |
| 40 to 44 Years | 411 (14.7%) | 183 (6.8%) |
| 45 to 49 Years | 171 (6.1%) | 201 (7.4%) |
| 50 to 54 Years | 123 (4.4%) | 153 (5.7%) |
| 55 to 59 Years | 84 (3.0%) | 156 (5.8%) |
| 60 to 64 Years | 268 (9.6%) | 61 (2.3%) |
| 65 to 69 Years | 34 (1.2%) | 144 (5.3%) |
| 70 to 74 Years | 68 (2.4%) | 121 (4.5%) |
| 75 to 79 Years | 106 (3.8%) | 58 (2.1%) |
| 80 to 84 Years | 18 (0.6%) | 90 (3.3%) |
| 85 Years and over | 10 (0.4%) | 59 (2.2%) |
| Total | 2,799 (100.0%) | 2,698 (100.0%) |
Families and Households in Jackson
Median Family Size in Jackson
The median family size in Jackson is 3.14 persons per family, with single male/father families (269 | 19.1%) accounting for the largest median family size of 3.9 persons per family. On the other hand, single female/mother families (679 | 48.1%) represent the smallest median family size with 2.93 persons per family.
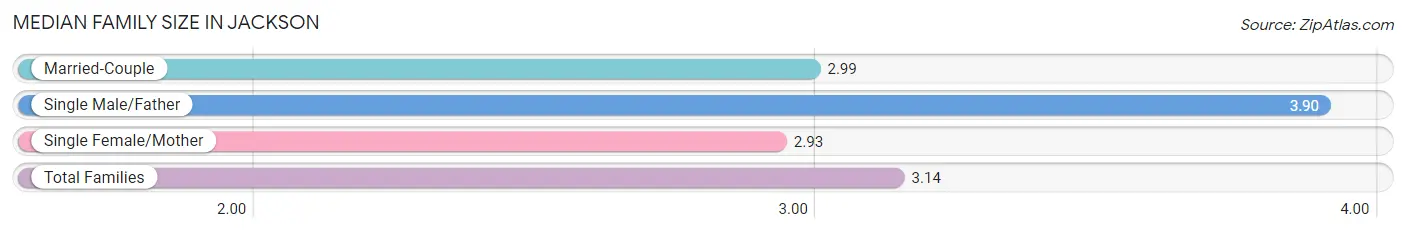
| Family Type | # Families | Family Size |
| Married-Couple | 463 (32.8%) | 2.99 |
| Single Male/Father | 269 (19.1%) | 3.90 |
| Single Female/Mother | 679 (48.1%) | 2.93 |
| Total Families | 1,411 (100.0%) | 3.14 |
Median Household Size in Jackson
The median household size in Jackson is 3.00 persons per household, with single male/father households (269 | 15.9%) accounting for the largest median household size of 4.18 persons per household. non-family households (281 | 16.6%) represent the smallest median household size with 1.04 persons per household.
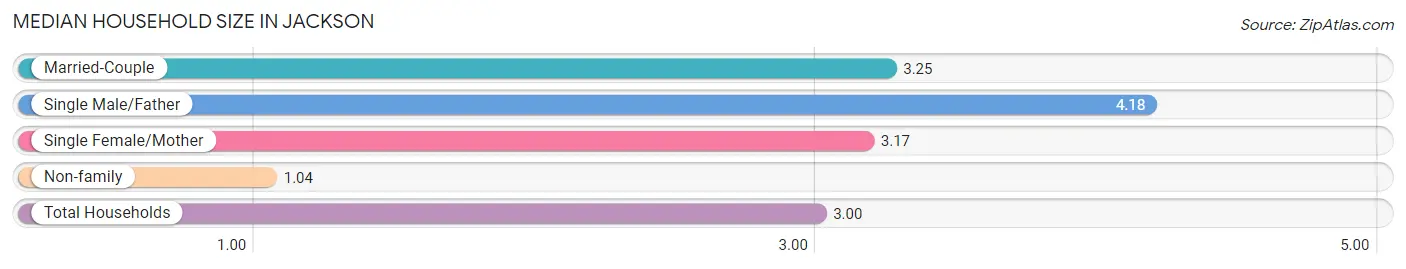
| Household Type | # Households | Household Size |
| Married-Couple | 463 (27.4%) | 3.25 |
| Single Male/Father | 269 (15.9%) | 4.18 |
| Single Female/Mother | 679 (40.1%) | 3.17 |
| Non-family | 281 (16.6%) | 1.04 |
| Total Households | 1,692 (100.0%) | 3.00 |
Household Size by Marriage Status in Jackson
Out of a total of 1,692 households in Jackson, 1,411 (83.4%) are family households, while 281 (16.6%) are nonfamily households. The most numerous type of family households are 3-person households, comprising 540, and the most common type of nonfamily households are 1-person households, comprising 268.
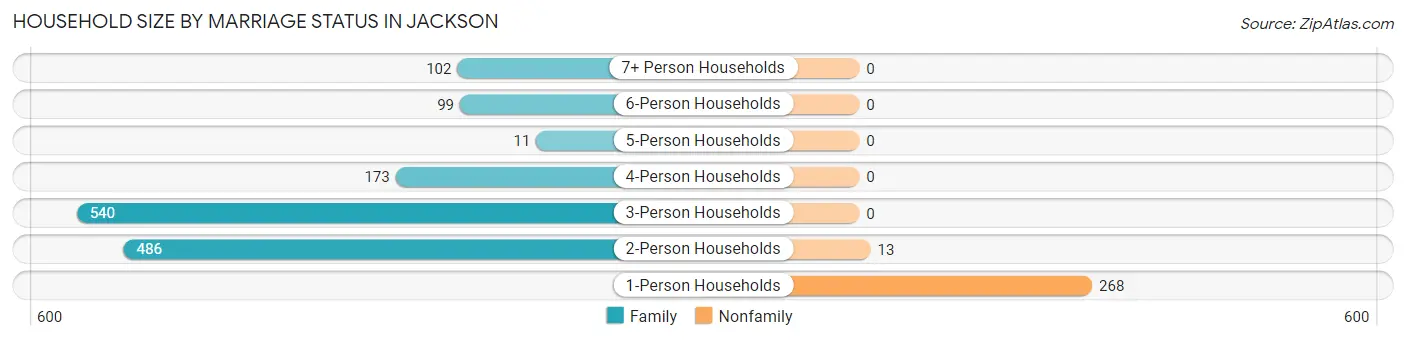
| Household Size | Family Households | Nonfamily Households |
| 1-Person Households | - | 268 (15.8%) |
| 2-Person Households | 486 (28.7%) | 13 (0.8%) |
| 3-Person Households | 540 (31.9%) | 0 (0.0%) |
| 4-Person Households | 173 (10.2%) | 0 (0.0%) |
| 5-Person Households | 11 (0.6%) | 0 (0.0%) |
| 6-Person Households | 99 (5.9%) | 0 (0.0%) |
| 7+ Person Households | 102 (6.0%) | 0 (0.0%) |
| Total | 1,411 (83.4%) | 281 (16.6%) |
Female Fertility in Jackson
Fertility by Age in Jackson
Average fertility rate in Jackson is 40.0 births per 1,000 women. Women in the age bracket of 20 to 34 years have the highest fertility rate with 101.0 births per 1,000 women. Women in the age bracket of 20 to 34 years acount for 100.0% of all women with births.
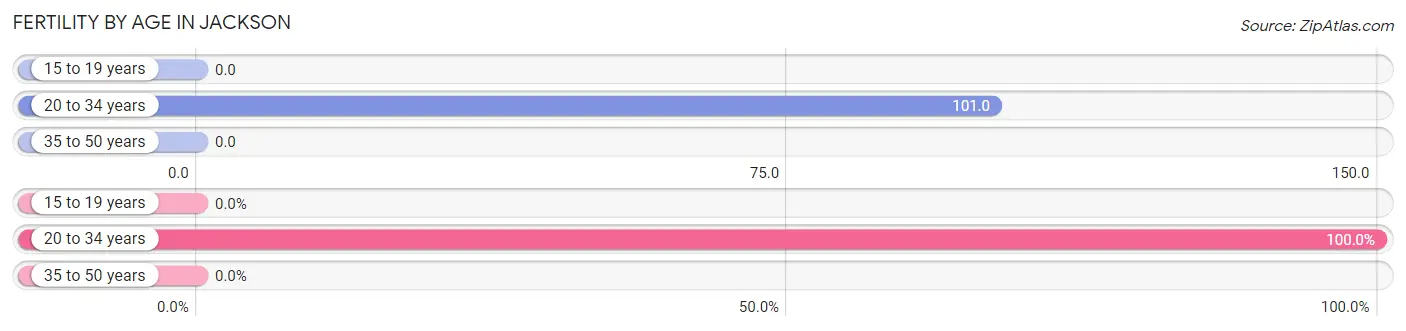
| Age Bracket | Women with Births | Births / 1,000 Women |
| 15 to 19 years | 0 (0.0%) | 0.0 |
| 20 to 34 years | 47 (100.0%) | 101.0 |
| 35 to 50 years | 0 (0.0%) | 0.0 |
| Total | 47 (100.0%) | 40.0 |
Fertility by Age by Marriage Status in Jackson
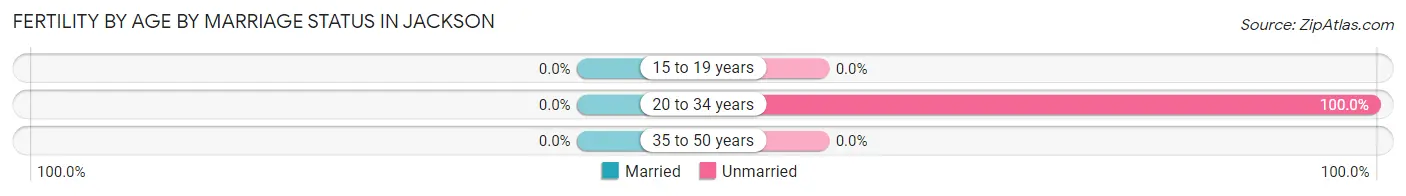
| Age Bracket | Married | Unmarried |
| 15 to 19 years | 0 (0.0%) | 0 (0.0%) |
| 20 to 34 years | 0 (0.0%) | 47 (100.0%) |
| 35 to 50 years | 0 (0.0%) | 0 (0.0%) |
| Total | 0 (0.0%) | 47 (100.0%) |
Fertility by Education in Jackson
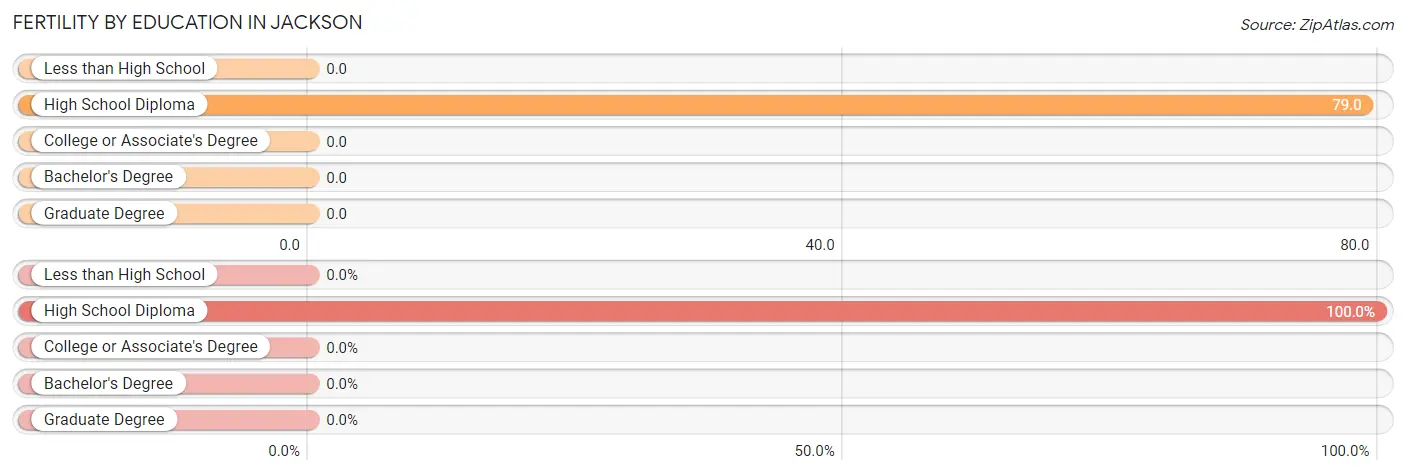
| Educational Attainment | Women with Births | Births / 1,000 Women |
| Less than High School | 0 (0.0%) | 0.0 |
| High School Diploma | 47 (100.0%) | 79.0 |
| College or Associate's Degree | 0 (0.0%) | 0.0 |
| Bachelor's Degree | 0 (0.0%) | 0.0 |
| Graduate Degree | 0 (0.0%) | 0.0 |
| Total | 47 (100.0%) | 40.0 |
Fertility by Education by Marriage Status in Jackson
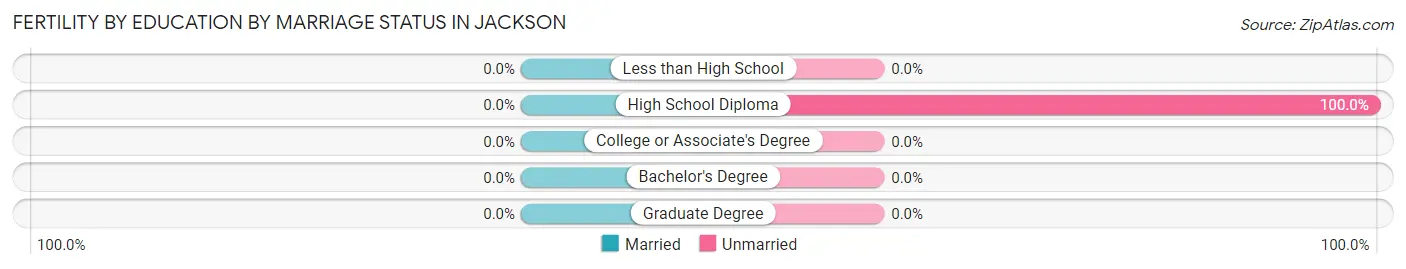
| Educational Attainment | Married | Unmarried |
| Less than High School | 0 (0.0%) | 0 (0.0%) |
| High School Diploma | 0 (0.0%) | 47 (100.0%) |
| College or Associate's Degree | 0 (0.0%) | 0 (0.0%) |
| Bachelor's Degree | 0 (0.0%) | 0 (0.0%) |
| Graduate Degree | 0 (0.0%) | 0 (0.0%) |
| Total | 0 (0.0%) | 47 (100.0%) |
Employment Characteristics in Jackson
Employment by Class of Employer in Jackson
Among the 1,866 employed individuals in Jackson, private company employees (1,475 | 79.0%), self-employed (incorporated) (188 | 10.1%), and not-for-profit organizations (77 | 4.1%) make up the most common classes of employment.
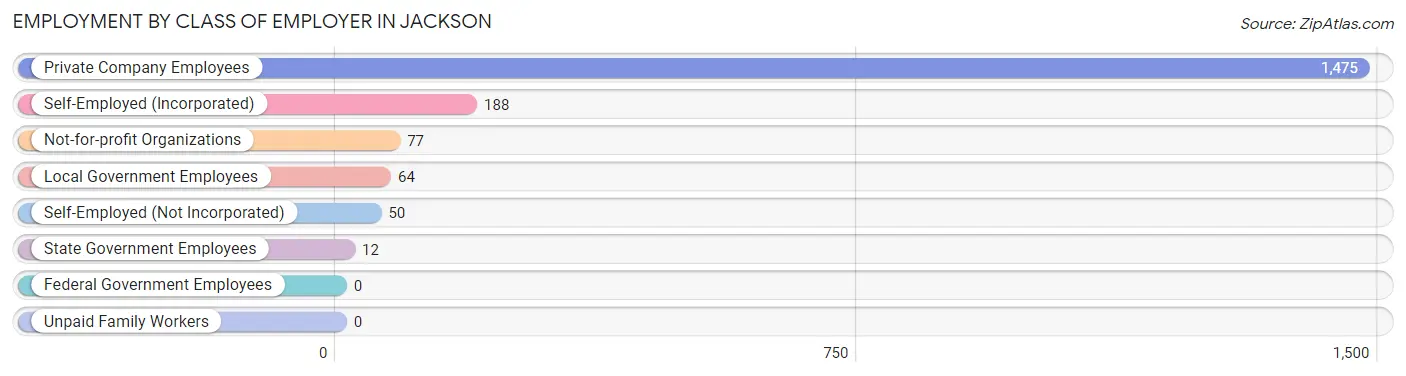
| Employer Class | # Employees | % Employees |
| Private Company Employees | 1,475 | 79.0% |
| Self-Employed (Incorporated) | 188 | 10.1% |
| Self-Employed (Not Incorporated) | 50 | 2.7% |
| Not-for-profit Organizations | 77 | 4.1% |
| Local Government Employees | 64 | 3.4% |
| State Government Employees | 12 | 0.6% |
| Federal Government Employees | 0 | 0.0% |
| Unpaid Family Workers | 0 | 0.0% |
| Total | 1,866 | 100.0% |
Employment Status by Age in Jackson
According to the labor force statistics for Jackson, out of the total population over 16 years of age (3,995), 52.1% or 2,081 individuals are in the labor force, with 6.3% or 131 of them unemployed. The age group with the highest labor force participation rate is 20 to 24 years, with 86.4% or 121 individuals in the labor force. Within the labor force, the 30 to 34 years age range has the highest percentage of unemployed individuals, with 22.5% or 46 of them being unemployed.
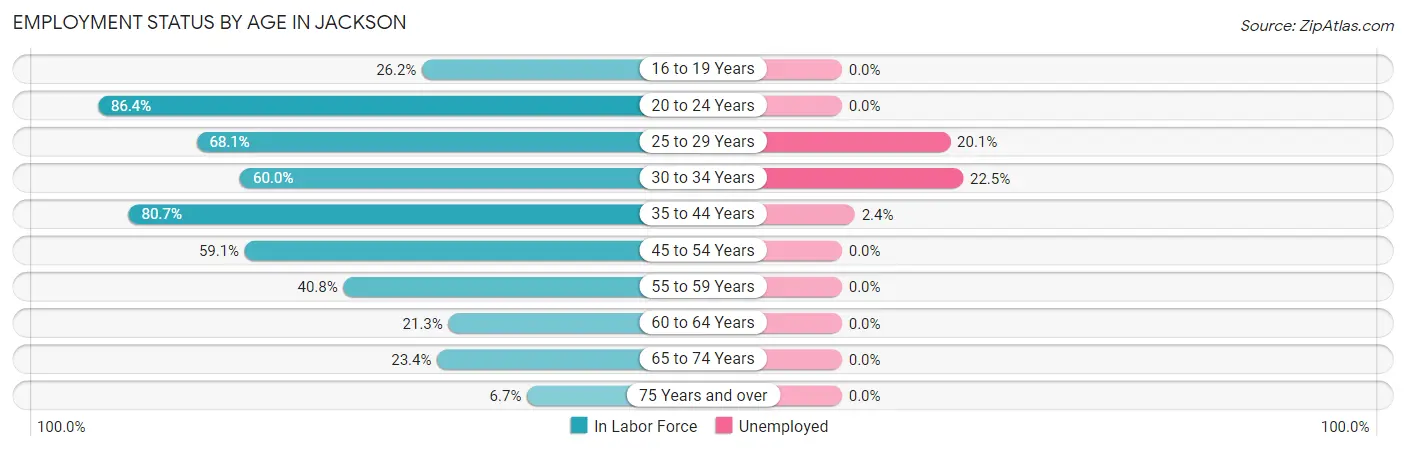
| Age Bracket | In Labor Force | Unemployed |
| 16 to 19 Years | 59 (26.2%) | 0 (0.0%) |
| 20 to 24 Years | 121 (86.4%) | 0 (0.0%) |
| 25 to 29 Years | 344 (68.1%) | 69 (20.1%) |
| 30 to 34 Years | 204 (60.0%) | 46 (22.5%) |
| 35 to 44 Years | 694 (80.7%) | 17 (2.4%) |
| 45 to 54 Years | 383 (59.1%) | 0 (0.0%) |
| 55 to 59 Years | 98 (40.8%) | 0 (0.0%) |
| 60 to 64 Years | 70 (21.3%) | 0 (0.0%) |
| 65 to 74 Years | 86 (23.4%) | 0 (0.0%) |
| 75 Years and over | 23 (6.7%) | 0 (0.0%) |
| Total | 2,081 (52.1%) | 131 (6.3%) |
Employment Status by Educational Attainment in Jackson
According to labor force statistics for Jackson, 61.4% of individuals (1,794) out of the total population between 25 and 64 years of age (2,922) are in the labor force, with 7.4% or 133 of them being unemployed. The group with the highest labor force participation rate are those with the educational attainment of bachelor's degree or higher, with 77.0% or 281 individuals in the labor force. Within the labor force, individuals with less than high school education have the highest percentage of unemployment, with 12.3% or 9 of them being unemployed.
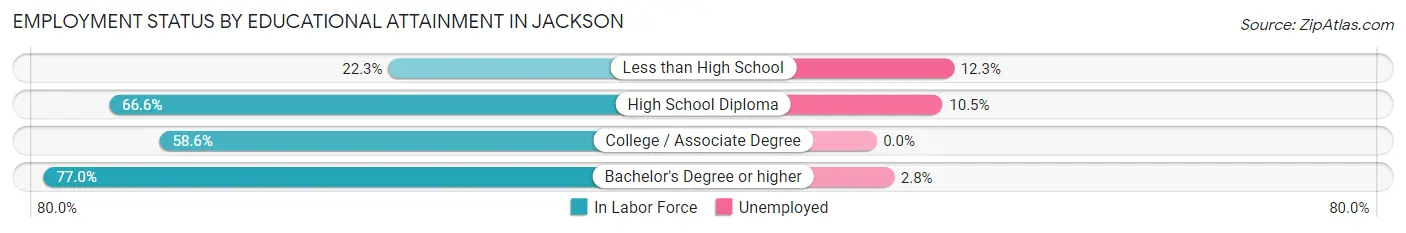
| Educational Attainment | In Labor Force | Unemployed |
| Less than High School | 73 (22.3%) | 40 (12.3%) |
| High School Diploma | 1,098 (66.6%) | 173 (10.5%) |
| College / Associate Degree | 340 (58.6%) | 0 (0.0%) |
| Bachelor's Degree or higher | 281 (77.0%) | 10 (2.8%) |
| Total | 1,794 (61.4%) | 216 (7.4%) |
Employment Occupations by Sex in Jackson
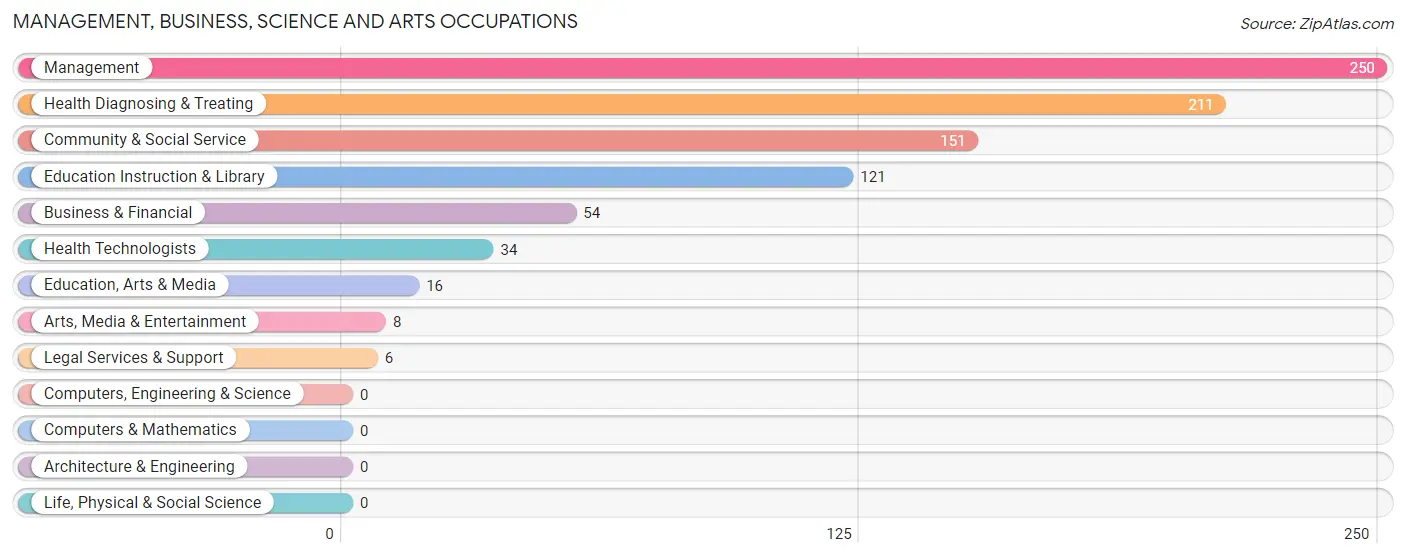
Management, Business, Science and Arts Occupations
The most common Management, Business, Science and Arts occupations in Jackson are Management (250 | 12.8%), Health Diagnosing & Treating (211 | 10.8%), Community & Social Service (151 | 7.7%), Education Instruction & Library (121 | 6.2%), and Business & Financial (54 | 2.8%).
Management, Business, Science and Arts Occupations by Sex
Within the Management, Business, Science and Arts occupations in Jackson, the most male-oriented occupations are Legal Services & Support (100.0%), Arts, Media & Entertainment (100.0%), and Management (75.6%), while the most female-oriented occupations are Education Instruction & Library (100.0%), Community & Social Service (83.4%), and Health Diagnosing & Treating (78.7%).
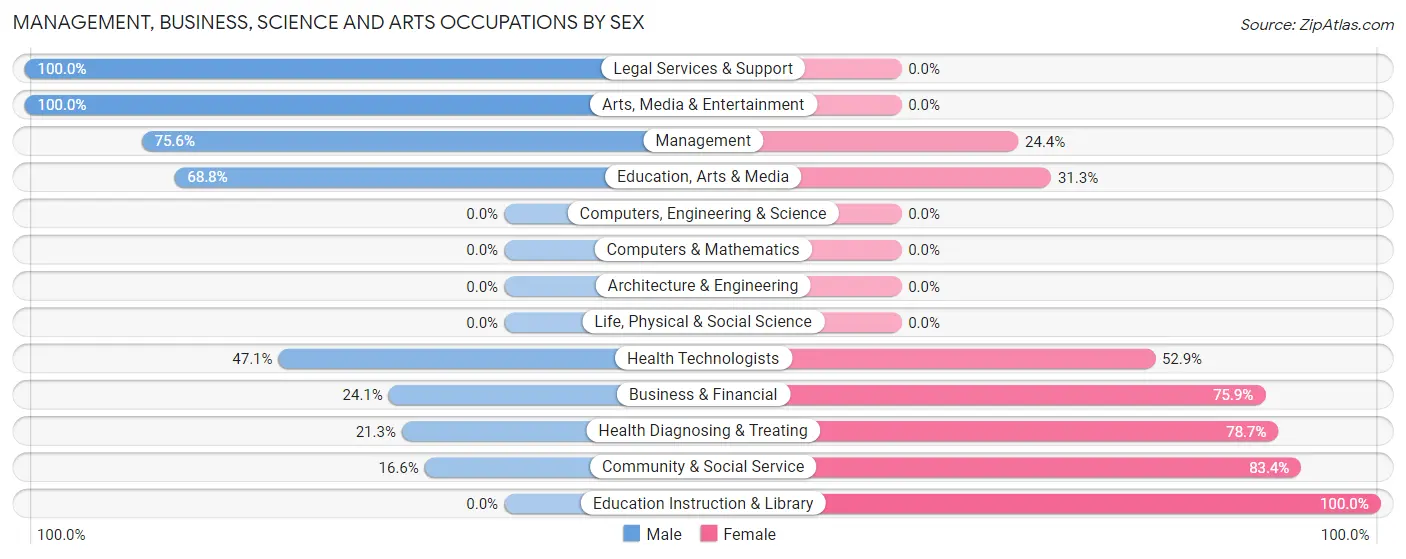
| Occupation | Male | Female |
| Management | 189 (75.6%) | 61 (24.4%) |
| Business & Financial | 13 (24.1%) | 41 (75.9%) |
| Computers, Engineering & Science | 0 (0.0%) | 0 (0.0%) |
| Computers & Mathematics | 0 (0.0%) | 0 (0.0%) |
| Architecture & Engineering | 0 (0.0%) | 0 (0.0%) |
| Life, Physical & Social Science | 0 (0.0%) | 0 (0.0%) |
| Community & Social Service | 25 (16.6%) | 126 (83.4%) |
| Education, Arts & Media | 11 (68.8%) | 5 (31.2%) |
| Legal Services & Support | 6 (100.0%) | 0 (0.0%) |
| Education Instruction & Library | 0 (0.0%) | 121 (100.0%) |
| Arts, Media & Entertainment | 8 (100.0%) | 0 (0.0%) |
| Health Diagnosing & Treating | 45 (21.3%) | 166 (78.7%) |
| Health Technologists | 16 (47.1%) | 18 (52.9%) |
| Total (Category) | 272 (40.8%) | 394 (59.2%) |
| Total (Overall) | 918 (47.1%) | 1,032 (52.9%) |
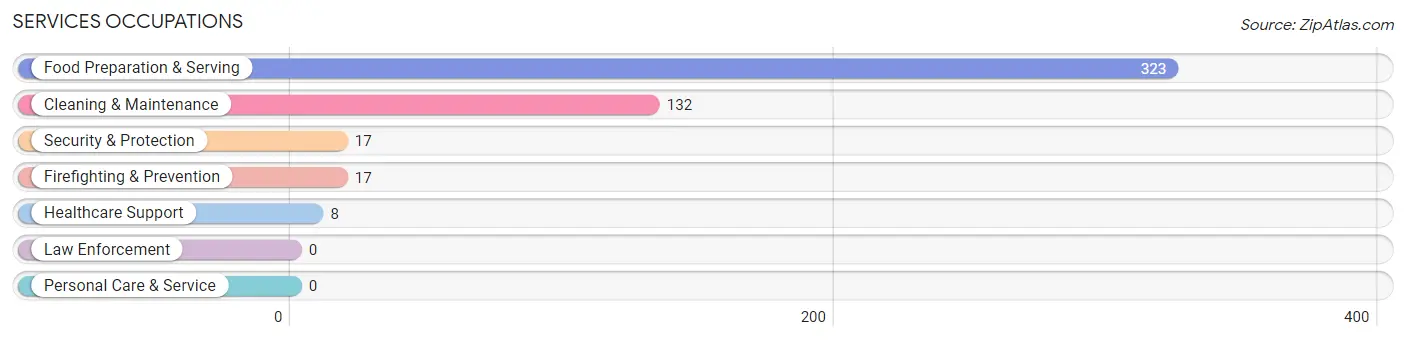
Services Occupations
The most common Services occupations in Jackson are Food Preparation & Serving (323 | 16.6%), Cleaning & Maintenance (132 | 6.8%), Security & Protection (17 | 0.9%), Firefighting & Prevention (17 | 0.9%), and Healthcare Support (8 | 0.4%).
Services Occupations by Sex
Within the Services occupations in Jackson, the most male-oriented occupations are Security & Protection (100.0%), Firefighting & Prevention (100.0%), and Food Preparation & Serving (43.0%), while the most female-oriented occupations are Healthcare Support (100.0%), Cleaning & Maintenance (86.4%), and Food Preparation & Serving (57.0%).
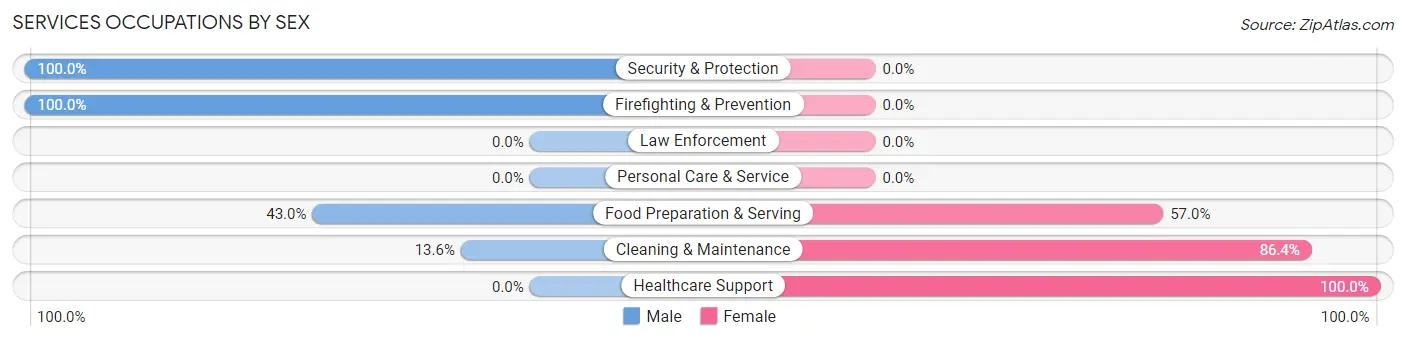
| Occupation | Male | Female |
| Healthcare Support | 0 (0.0%) | 8 (100.0%) |
| Security & Protection | 17 (100.0%) | 0 (0.0%) |
| Firefighting & Prevention | 17 (100.0%) | 0 (0.0%) |
| Law Enforcement | 0 (0.0%) | 0 (0.0%) |
| Food Preparation & Serving | 139 (43.0%) | 184 (57.0%) |
| Cleaning & Maintenance | 18 (13.6%) | 114 (86.4%) |
| Personal Care & Service | 0 (0.0%) | 0 (0.0%) |
| Total (Category) | 174 (36.2%) | 306 (63.7%) |
| Total (Overall) | 918 (47.1%) | 1,032 (52.9%) |
Sales and Office Occupations
The most common Sales and Office occupations in Jackson are Sales & Related (241 | 12.4%), and Office & Administration (160 | 8.2%).

Sales and Office Occupations by Sex
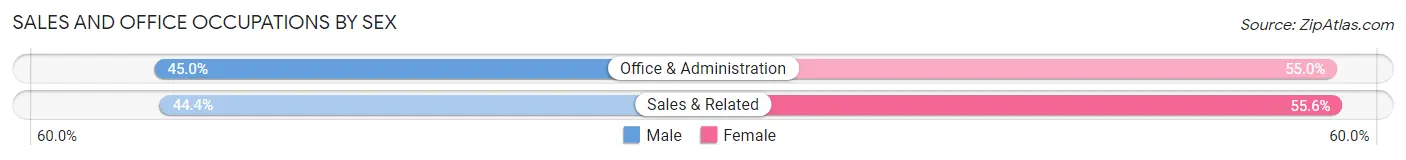
| Occupation | Male | Female |
| Sales & Related | 107 (44.4%) | 134 (55.6%) |
| Office & Administration | 72 (45.0%) | 88 (55.0%) |
| Total (Category) | 179 (44.6%) | 222 (55.4%) |
| Total (Overall) | 918 (47.1%) | 1,032 (52.9%) |
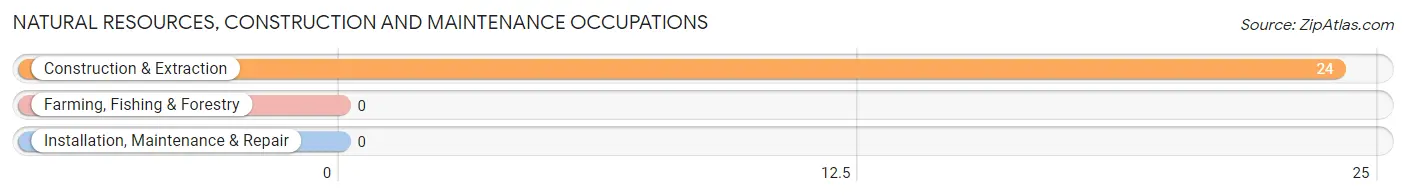
Natural Resources, Construction and Maintenance Occupations
The most common Natural Resources, Construction and Maintenance occupations in Jackson are , and Construction & Extraction (24 | 1.2%).
Natural Resources, Construction and Maintenance Occupations by Sex
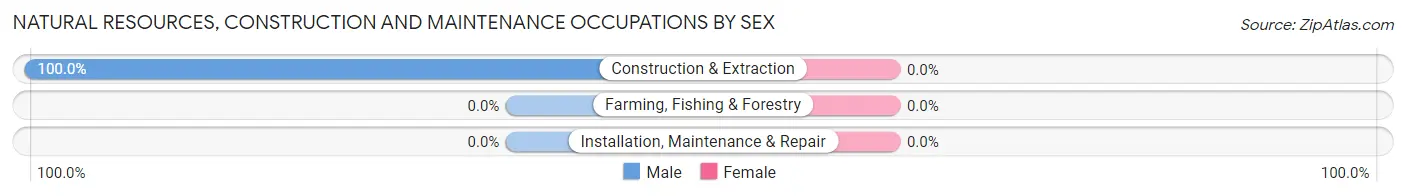
| Occupation | Male | Female |
| Farming, Fishing & Forestry | 0 (0.0%) | 0 (0.0%) |
| Construction & Extraction | 24 (100.0%) | 0 (0.0%) |
| Installation, Maintenance & Repair | 0 (0.0%) | 0 (0.0%) |
| Total (Category) | 24 (100.0%) | 0 (0.0%) |
| Total (Overall) | 918 (47.1%) | 1,032 (52.9%) |
Production, Transportation and Moving Occupations
The most common Production, Transportation and Moving occupations in Jackson are Material Moving (214 | 11.0%), Production (97 | 5.0%), and Transportation (68 | 3.5%).
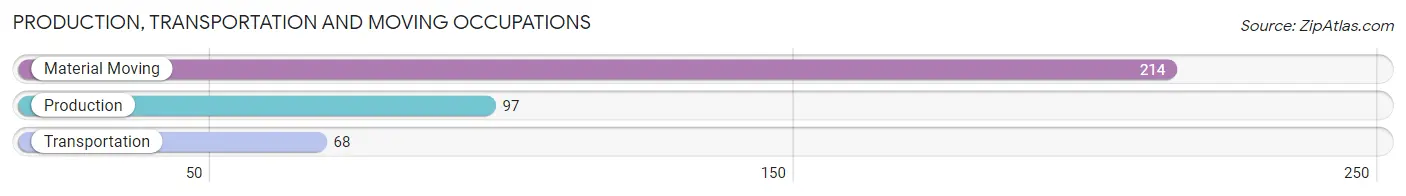
Production, Transportation and Moving Occupations by Sex
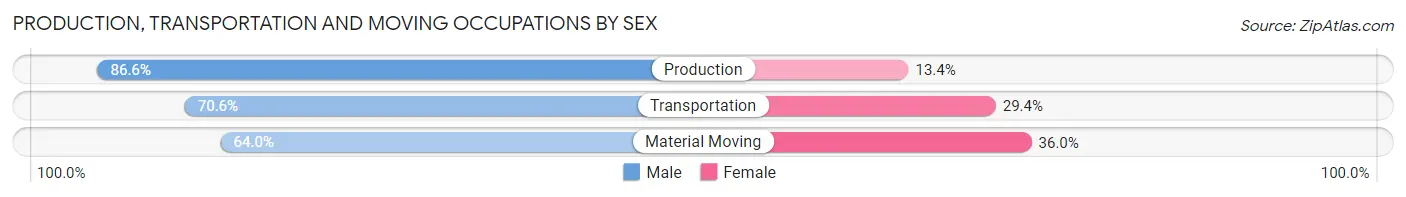
| Occupation | Male | Female |
| Production | 84 (86.6%) | 13 (13.4%) |
| Transportation | 48 (70.6%) | 20 (29.4%) |
| Material Moving | 137 (64.0%) | 77 (36.0%) |
| Total (Category) | 269 (71.0%) | 110 (29.0%) |
| Total (Overall) | 918 (47.1%) | 1,032 (52.9%) |
Employment Industries by Sex in Jackson
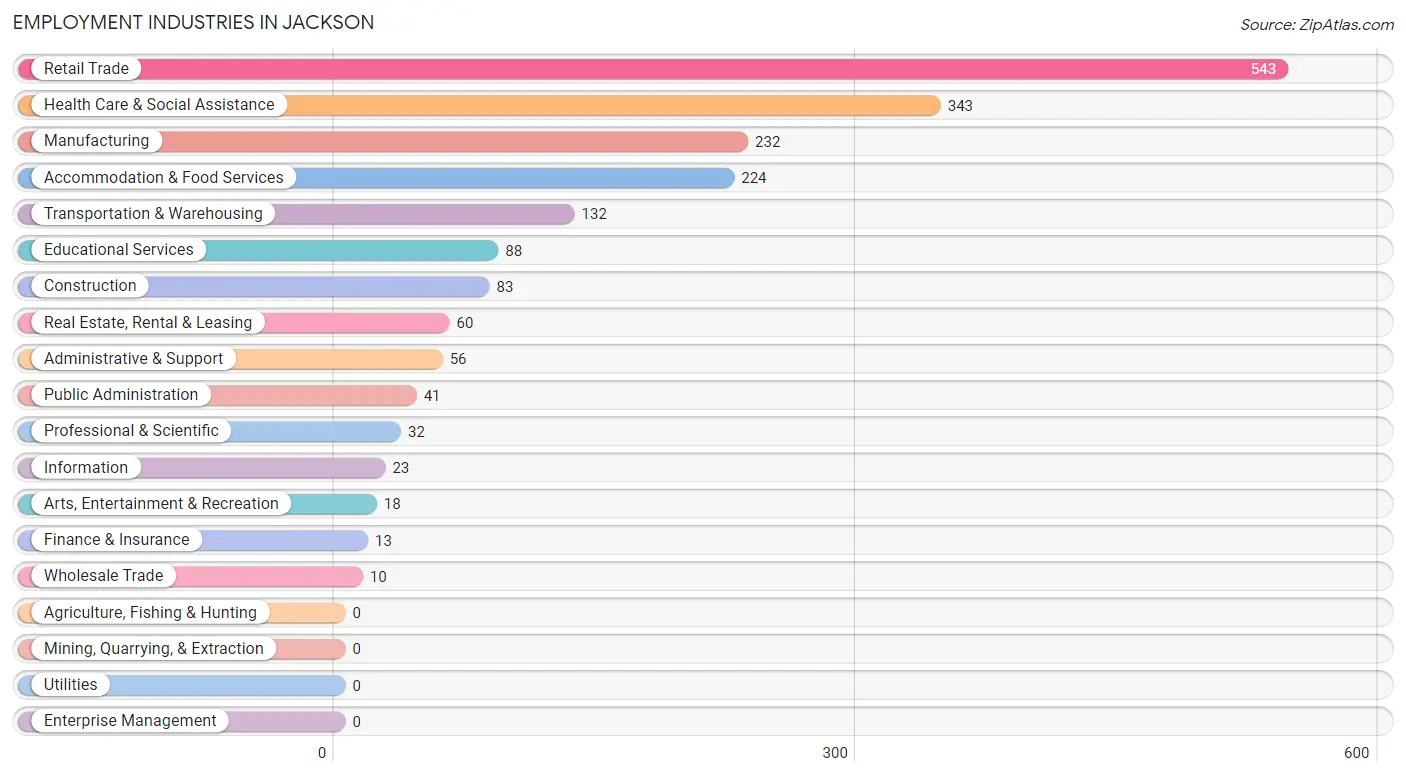
Employment Industries in Jackson
The major employment industries in Jackson include Retail Trade (543 | 27.9%), Health Care & Social Assistance (343 | 17.6%), Manufacturing (232 | 11.9%), Accommodation & Food Services (224 | 11.5%), and Transportation & Warehousing (132 | 6.8%).
Employment Industries by Sex in Jackson
The Jackson industries that see more men than women are Construction (100.0%), Wholesale Trade (100.0%), and Finance & Insurance (100.0%), whereas the industries that tend to have a higher number of women are Educational Services (100.0%), Health Care & Social Assistance (100.0%), and Administrative & Support (91.1%).
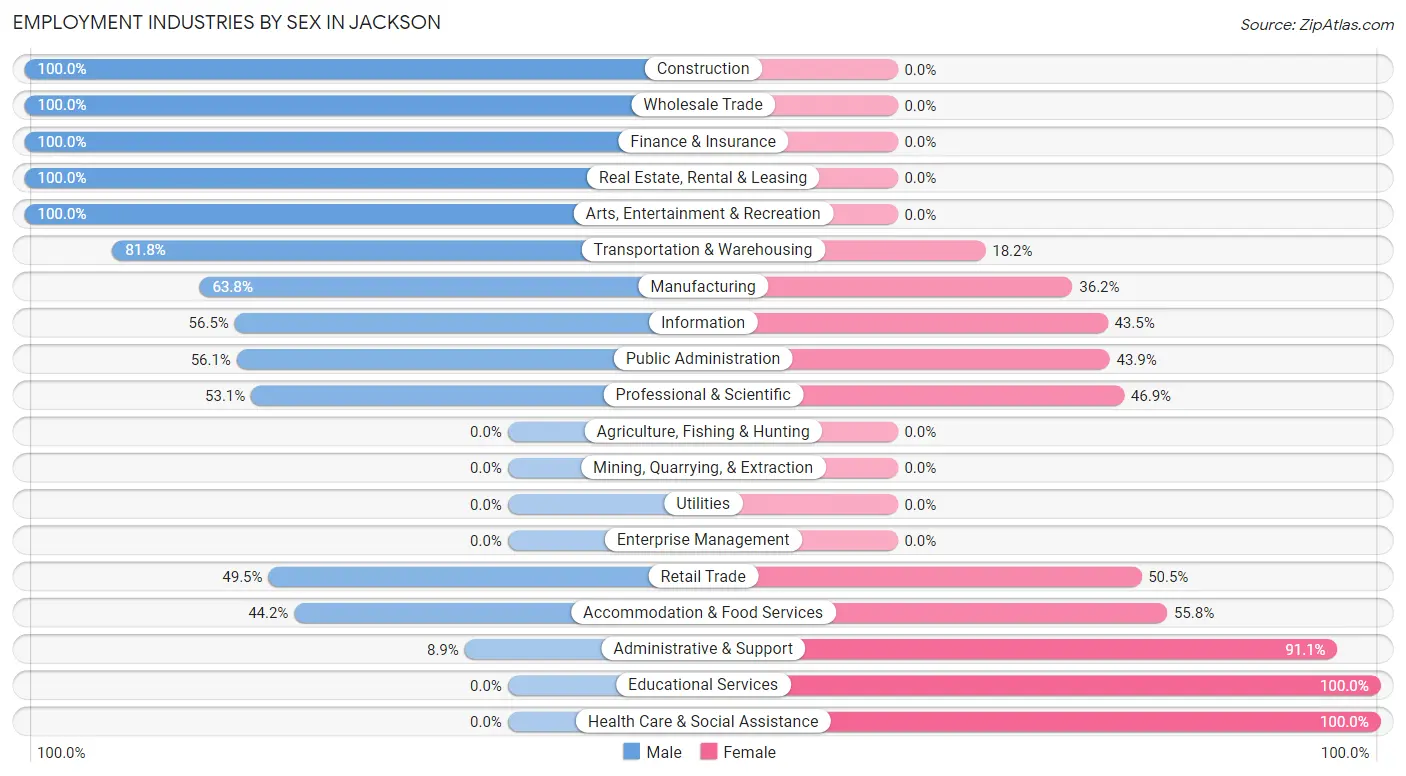
| Industry | Male | Female |
| Agriculture, Fishing & Hunting | 0 (0.0%) | 0 (0.0%) |
| Mining, Quarrying, & Extraction | 0 (0.0%) | 0 (0.0%) |
| Construction | 83 (100.0%) | 0 (0.0%) |
| Manufacturing | 148 (63.8%) | 84 (36.2%) |
| Wholesale Trade | 10 (100.0%) | 0 (0.0%) |
| Retail Trade | 269 (49.5%) | 274 (50.5%) |
| Transportation & Warehousing | 108 (81.8%) | 24 (18.2%) |
| Utilities | 0 (0.0%) | 0 (0.0%) |
| Information | 13 (56.5%) | 10 (43.5%) |
| Finance & Insurance | 13 (100.0%) | 0 (0.0%) |
| Real Estate, Rental & Leasing | 60 (100.0%) | 0 (0.0%) |
| Professional & Scientific | 17 (53.1%) | 15 (46.9%) |
| Enterprise Management | 0 (0.0%) | 0 (0.0%) |
| Administrative & Support | 5 (8.9%) | 51 (91.1%) |
| Educational Services | 0 (0.0%) | 88 (100.0%) |
| Health Care & Social Assistance | 0 (0.0%) | 343 (100.0%) |
| Arts, Entertainment & Recreation | 18 (100.0%) | 0 (0.0%) |
| Accommodation & Food Services | 99 (44.2%) | 125 (55.8%) |
| Public Administration | 23 (56.1%) | 18 (43.9%) |
| Total | 918 (47.1%) | 1,032 (52.9%) |
Education in Jackson
School Enrollment in Jackson
The most common levels of schooling among the 1,511 students in Jackson are elementary school (514 | 34.0%), middle school (462 | 30.6%), and high school (362 | 24.0%).
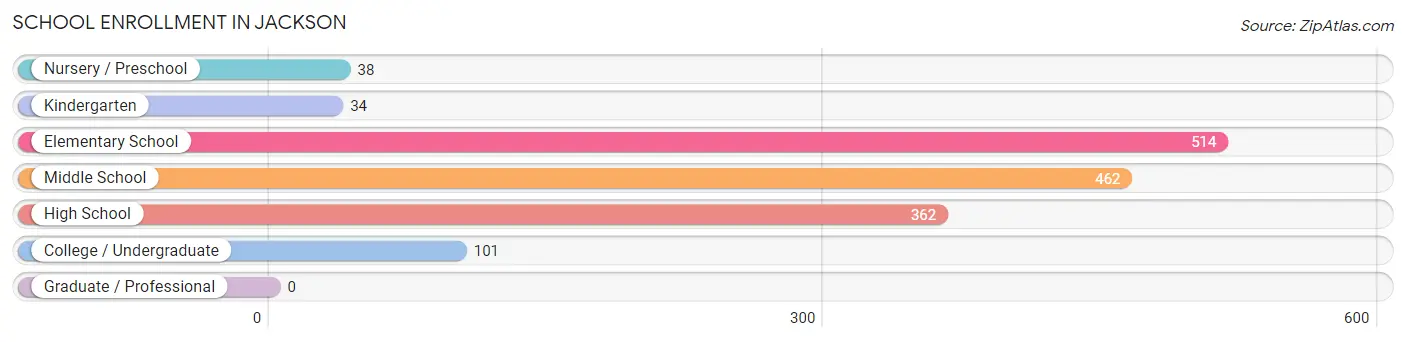
| School Level | # Students | % Students |
| Nursery / Preschool | 38 | 2.5% |
| Kindergarten | 34 | 2.2% |
| Elementary School | 514 | 34.0% |
| Middle School | 462 | 30.6% |
| High School | 362 | 24.0% |
| College / Undergraduate | 101 | 6.7% |
| Graduate / Professional | 0 | 0.0% |
| Total | 1,511 | 100.0% |
School Enrollment by Age by Funding Source in Jackson
Out of a total of 1,511 students who are enrolled in schools in Jackson, 180 (11.9%) attend a private institution, while the remaining 1,331 (88.1%) are enrolled in public schools. The age group of 10 to 14 year olds has the highest likelihood of being enrolled in private schools, with 113 (19.5% in the age bracket) enrolled. Conversely, the age group of 3 to 4 year olds has the lowest likelihood of being enrolled in a private school, with 38 (100.0% in the age bracket) attending a public institution.
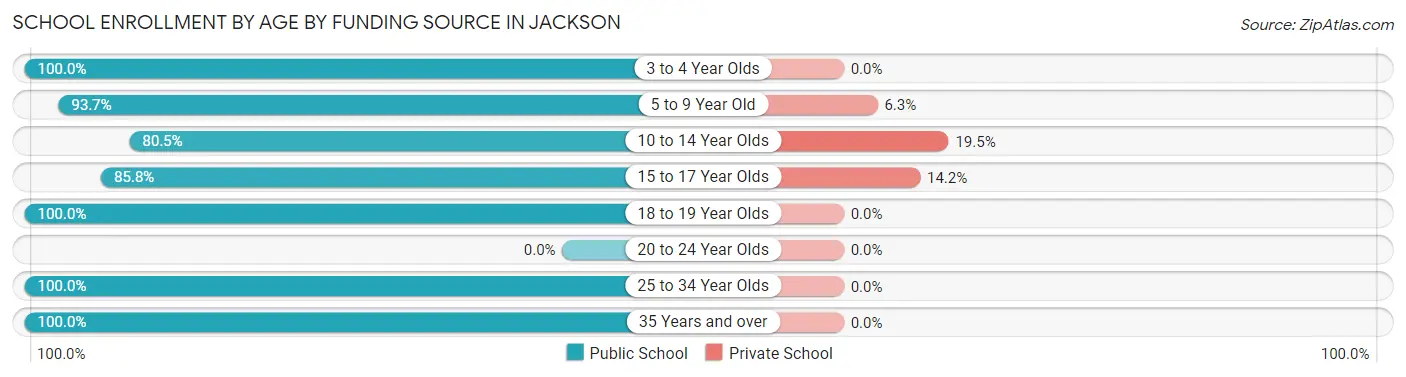
| Age Bracket | Public School | Private School |
| 3 to 4 Year Olds | 38 (100.0%) | 0 (0.0%) |
| 5 to 9 Year Old | 461 (93.7%) | 31 (6.3%) |
| 10 to 14 Year Olds | 466 (80.5%) | 113 (19.5%) |
| 15 to 17 Year Olds | 217 (85.8%) | 36 (14.2%) |
| 18 to 19 Year Olds | 41 (100.0%) | 0 (0.0%) |
| 20 to 24 Year Olds | 0 (0.0%) | 0 (0.0%) |
| 25 to 34 Year Olds | 29 (100.0%) | 0 (0.0%) |
| 35 Years and over | 79 (100.0%) | 0 (0.0%) |
| Total | 1,331 (88.1%) | 180 (11.9%) |
Educational Attainment by Field of Study in Jackson
Education (97 | 20.6%), psychology (69 | 14.7%), literature & languages (66 | 14.0%), business (64 | 13.6%), and bio, nature & agricultural (41 | 8.7%) are the most common fields of study among 470 individuals in Jackson who have obtained a bachelor's degree or higher.
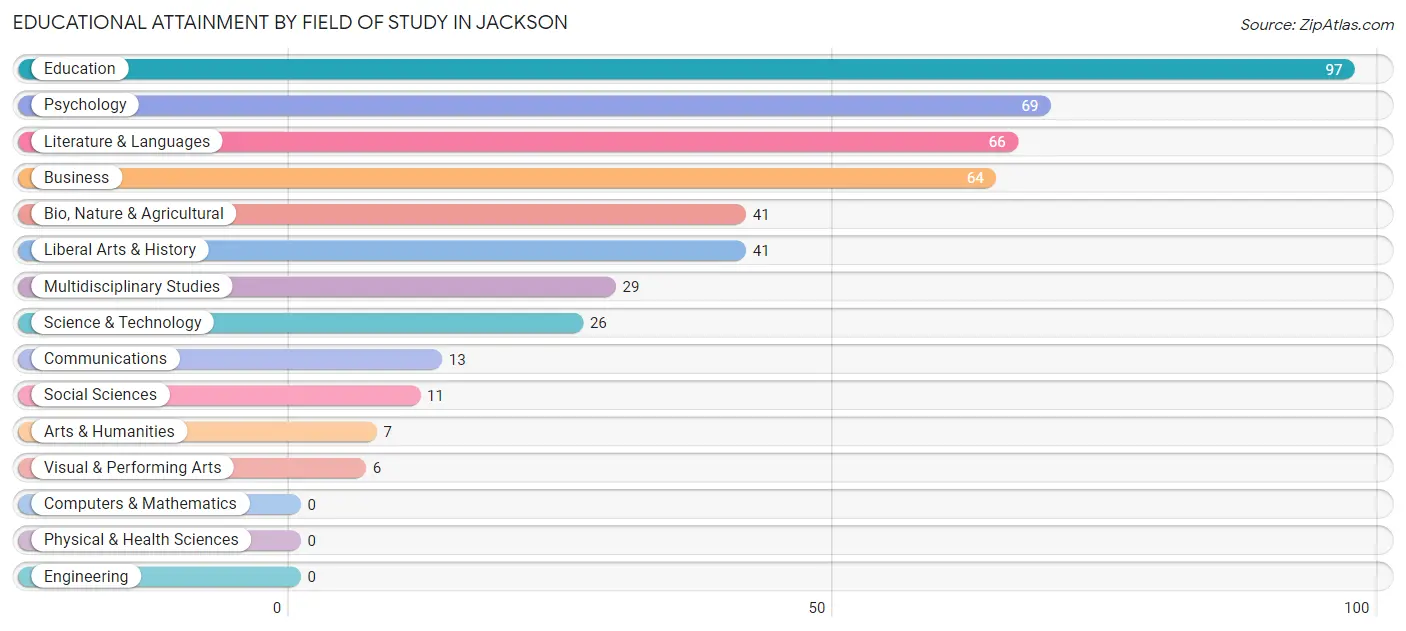
| Field of Study | # Graduates | % Graduates |
| Computers & Mathematics | 0 | 0.0% |
| Bio, Nature & Agricultural | 41 | 8.7% |
| Physical & Health Sciences | 0 | 0.0% |
| Psychology | 69 | 14.7% |
| Social Sciences | 11 | 2.3% |
| Engineering | 0 | 0.0% |
| Multidisciplinary Studies | 29 | 6.2% |
| Science & Technology | 26 | 5.5% |
| Business | 64 | 13.6% |
| Education | 97 | 20.6% |
| Literature & Languages | 66 | 14.0% |
| Liberal Arts & History | 41 | 8.7% |
| Visual & Performing Arts | 6 | 1.3% |
| Communications | 13 | 2.8% |
| Arts & Humanities | 7 | 1.5% |
| Total | 470 | 100.0% |
Transportation & Commute in Jackson
Vehicle Availability by Sex in Jackson
The most prevalent vehicle ownership categories in Jackson are males with 2 vehicles (547, accounting for 59.7%) and females with 2 vehicles (377, making up 57.7%).
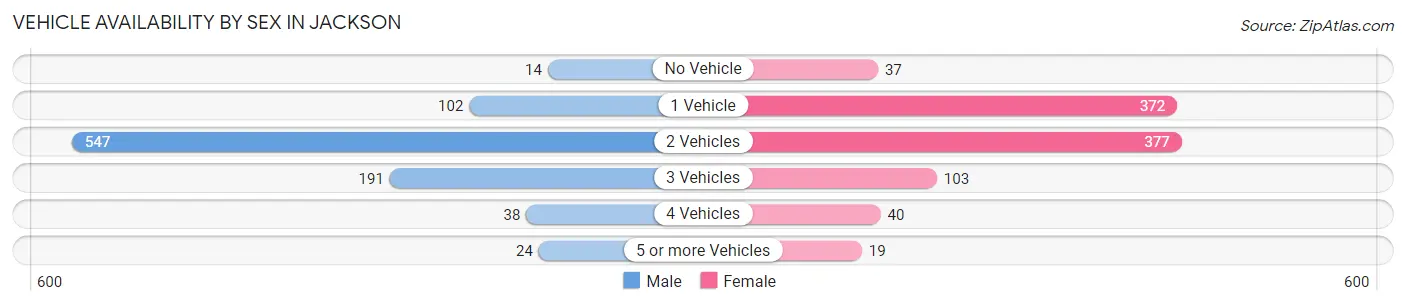
| Vehicles Available | Male | Female |
| No Vehicle | 14 (1.5%) | 37 (3.9%) |
| 1 Vehicle | 102 (11.1%) | 372 (39.2%) |
| 2 Vehicles | 547 (59.7%) | 377 (39.8%) |
| 3 Vehicles | 191 (20.8%) | 103 (10.9%) |
| 4 Vehicles | 38 (4.2%) | 40 (4.2%) |
| 5 or more Vehicles | 24 (2.6%) | 19 (2.0%) |
| Total | 916 (100.0%) | 948 (100.0%) |
Commute Time in Jackson
The most frequently occuring commute durations in Jackson are 5 to 9 minutes (389 commuters, 22.5%), 15 to 19 minutes (312 commuters, 18.1%), and 30 to 34 minutes (194 commuters, 11.2%).
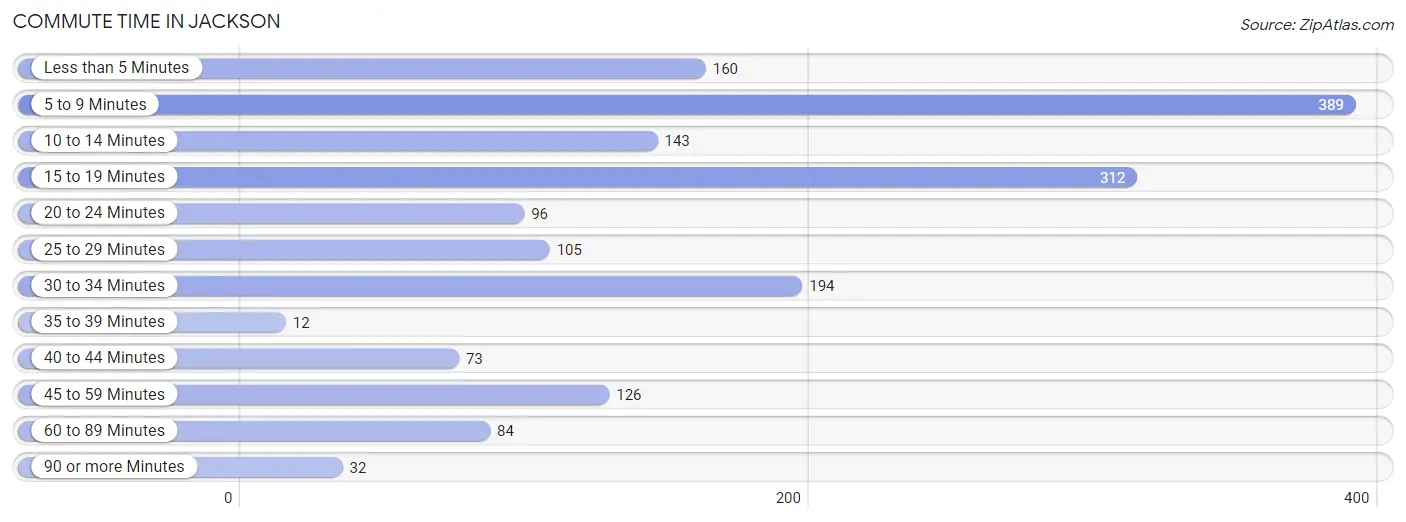
| Commute Time | # Commuters | % Commuters |
| Less than 5 Minutes | 160 | 9.3% |
| 5 to 9 Minutes | 389 | 22.5% |
| 10 to 14 Minutes | 143 | 8.3% |
| 15 to 19 Minutes | 312 | 18.1% |
| 20 to 24 Minutes | 96 | 5.6% |
| 25 to 29 Minutes | 105 | 6.1% |
| 30 to 34 Minutes | 194 | 11.2% |
| 35 to 39 Minutes | 12 | 0.7% |
| 40 to 44 Minutes | 73 | 4.2% |
| 45 to 59 Minutes | 126 | 7.3% |
| 60 to 89 Minutes | 84 | 4.9% |
| 90 or more Minutes | 32 | 1.8% |
Commute Time by Sex in Jackson
The most common commute times in Jackson are 5 to 9 minutes (225 commuters, 26.9%) for males and 5 to 9 minutes (164 commuters, 18.4%) for females.
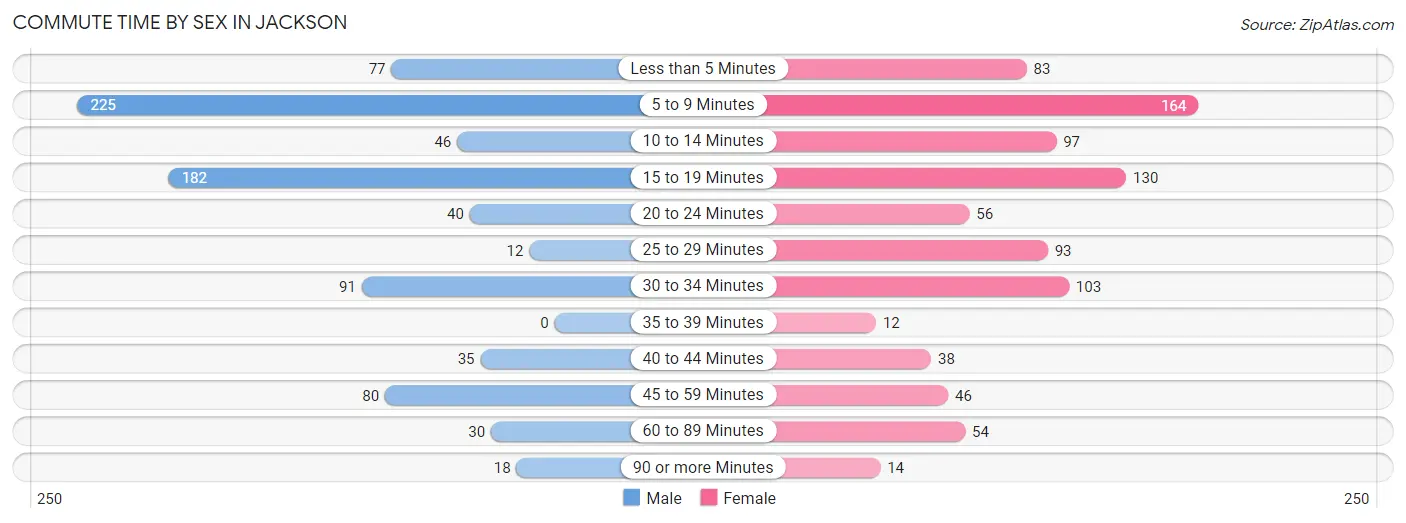
| Commute Time | Male | Female |
| Less than 5 Minutes | 77 (9.2%) | 83 (9.3%) |
| 5 to 9 Minutes | 225 (26.9%) | 164 (18.4%) |
| 10 to 14 Minutes | 46 (5.5%) | 97 (10.9%) |
| 15 to 19 Minutes | 182 (21.8%) | 130 (14.6%) |
| 20 to 24 Minutes | 40 (4.8%) | 56 (6.3%) |
| 25 to 29 Minutes | 12 (1.4%) | 93 (10.4%) |
| 30 to 34 Minutes | 91 (10.9%) | 103 (11.6%) |
| 35 to 39 Minutes | 0 (0.0%) | 12 (1.3%) |
| 40 to 44 Minutes | 35 (4.2%) | 38 (4.3%) |
| 45 to 59 Minutes | 80 (9.6%) | 46 (5.2%) |
| 60 to 89 Minutes | 30 (3.6%) | 54 (6.1%) |
| 90 or more Minutes | 18 (2.1%) | 14 (1.6%) |
Time of Departure to Work by Sex in Jackson
The most frequent times of departure to work in Jackson are 8:00 AM to 8:29 AM (156, 18.7%) for males and 7:00 AM to 7:29 AM (199, 22.4%) for females.
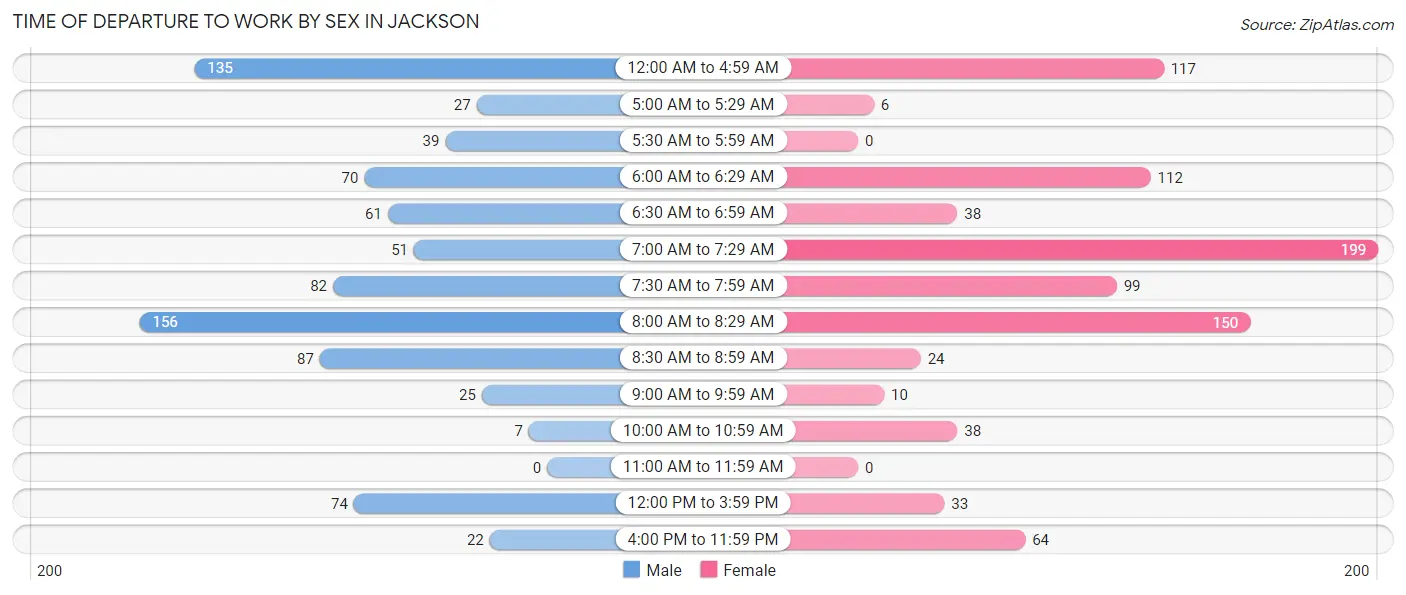
| Time of Departure | Male | Female |
| 12:00 AM to 4:59 AM | 135 (16.2%) | 117 (13.2%) |
| 5:00 AM to 5:29 AM | 27 (3.2%) | 6 (0.7%) |
| 5:30 AM to 5:59 AM | 39 (4.7%) | 0 (0.0%) |
| 6:00 AM to 6:29 AM | 70 (8.4%) | 112 (12.6%) |
| 6:30 AM to 6:59 AM | 61 (7.3%) | 38 (4.3%) |
| 7:00 AM to 7:29 AM | 51 (6.1%) | 199 (22.4%) |
| 7:30 AM to 7:59 AM | 82 (9.8%) | 99 (11.1%) |
| 8:00 AM to 8:29 AM | 156 (18.7%) | 150 (16.9%) |
| 8:30 AM to 8:59 AM | 87 (10.4%) | 24 (2.7%) |
| 9:00 AM to 9:59 AM | 25 (3.0%) | 10 (1.1%) |
| 10:00 AM to 10:59 AM | 7 (0.8%) | 38 (4.3%) |
| 11:00 AM to 11:59 AM | 0 (0.0%) | 0 (0.0%) |
| 12:00 PM to 3:59 PM | 74 (8.8%) | 33 (3.7%) |
| 4:00 PM to 11:59 PM | 22 (2.6%) | 64 (7.2%) |
| Total | 836 (100.0%) | 890 (100.0%) |
Housing Occupancy in Jackson
Occupancy by Ownership in Jackson
Of the total 1,692 dwellings in Jackson, owner-occupied units account for 860 (50.8%), while renter-occupied units make up 832 (49.2%).
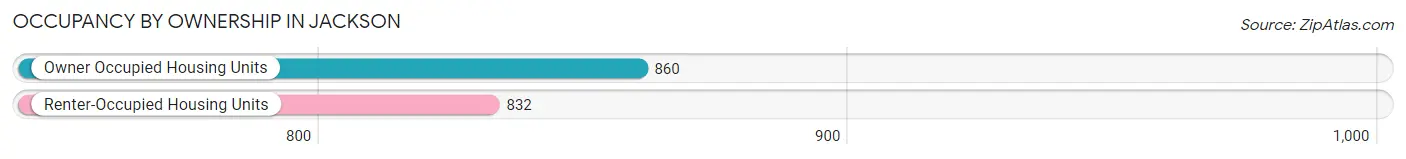
| Occupancy | # Housing Units | % Housing Units |
| Owner Occupied Housing Units | 860 | 50.8% |
| Renter-Occupied Housing Units | 832 | 49.2% |
| Total Occupied Housing Units | 1,692 | 100.0% |
Occupancy by Household Size in Jackson
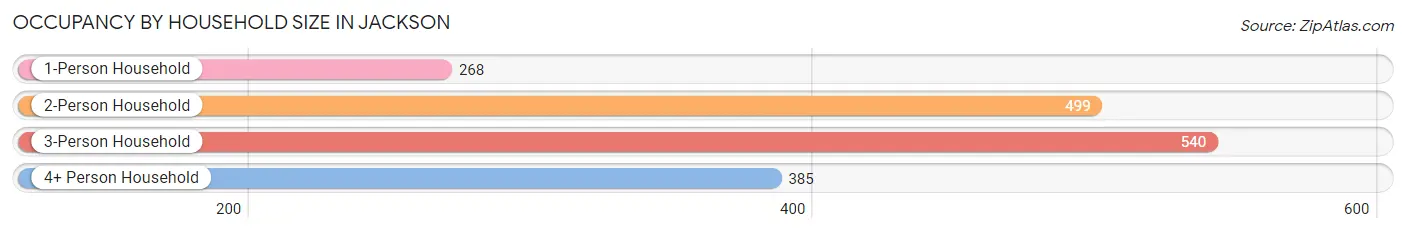
| Household Size | # Housing Units | % Housing Units |
| 1-Person Household | 268 | 15.8% |
| 2-Person Household | 499 | 29.5% |
| 3-Person Household | 540 | 31.9% |
| 4+ Person Household | 385 | 22.8% |
| Total Housing Units | 1,692 | 100.0% |
Occupancy by Ownership by Household Size in Jackson
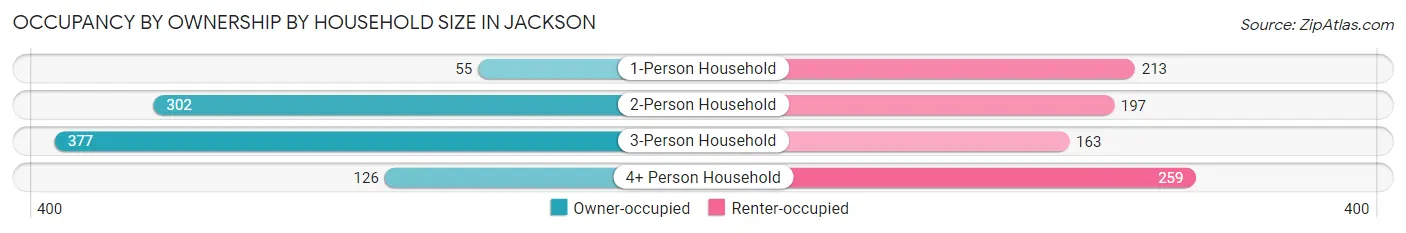
| Household Size | Owner-occupied | Renter-occupied |
| 1-Person Household | 55 (20.5%) | 213 (79.5%) |
| 2-Person Household | 302 (60.5%) | 197 (39.5%) |
| 3-Person Household | 377 (69.8%) | 163 (30.2%) |
| 4+ Person Household | 126 (32.7%) | 259 (67.3%) |
| Total Housing Units | 860 (50.8%) | 832 (49.2%) |
Occupancy by Educational Attainment in Jackson
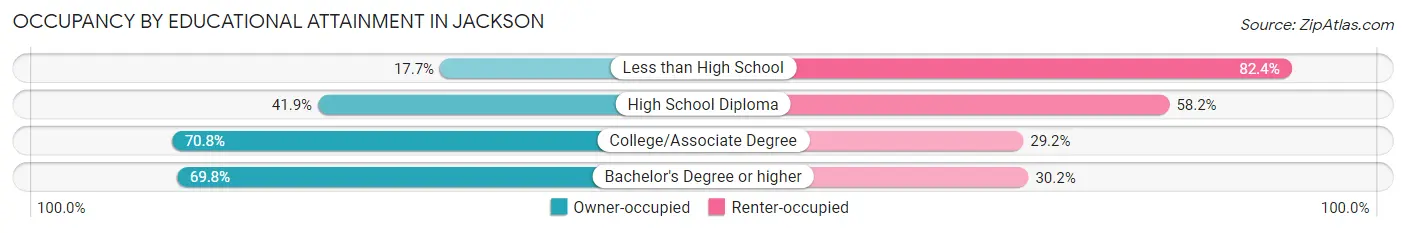
| Household Size | Owner-occupied | Renter-occupied |
| Less than High School | 42 (17.6%) | 196 (82.4%) |
| High School Diploma | 303 (41.8%) | 421 (58.2%) |
| College/Associate Degree | 374 (70.8%) | 154 (29.2%) |
| Bachelor's Degree or higher | 141 (69.8%) | 61 (30.2%) |
Occupancy by Age of Householder in Jackson
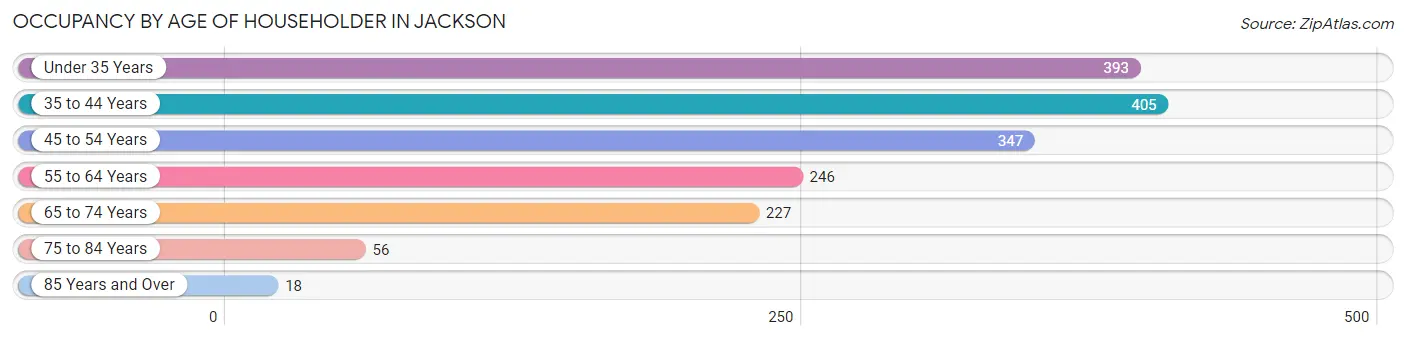
| Age Bracket | # Households | % Households |
| Under 35 Years | 393 | 23.2% |
| 35 to 44 Years | 405 | 23.9% |
| 45 to 54 Years | 347 | 20.5% |
| 55 to 64 Years | 246 | 14.5% |
| 65 to 74 Years | 227 | 13.4% |
| 75 to 84 Years | 56 | 3.3% |
| 85 Years and Over | 18 | 1.1% |
| Total | 1,692 | 100.0% |
Housing Finances in Jackson
Median Income by Occupancy in Jackson
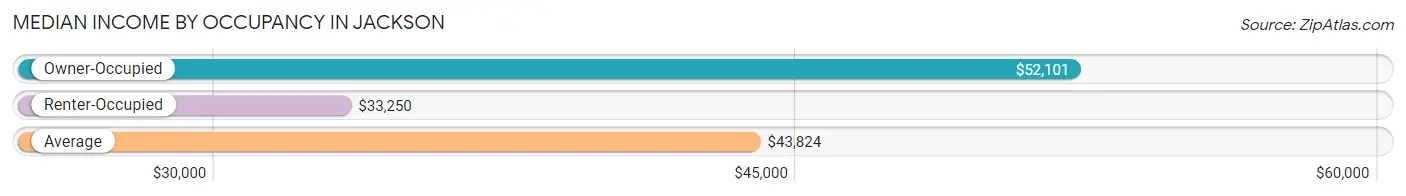
| Occupancy Type | # Households | Median Income |
| Owner-Occupied | 860 (50.8%) | $52,101 |
| Renter-Occupied | 832 (49.2%) | $33,250 |
| Average | 1,692 (100.0%) | $43,824 |
Occupancy by Householder Income Bracket in Jackson
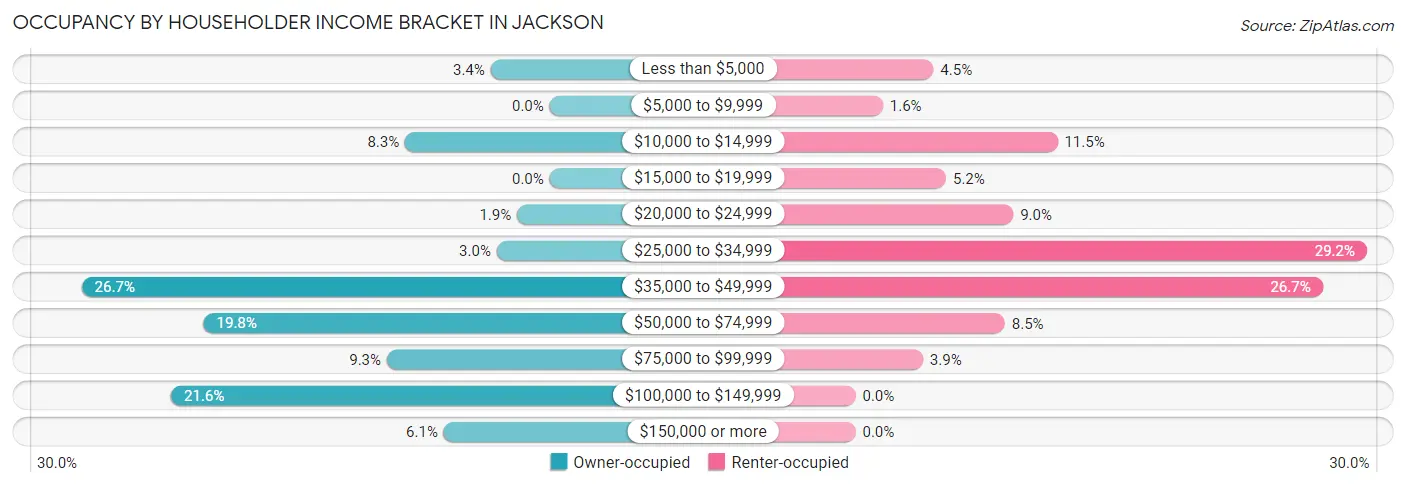
| Income Bracket | Owner-occupied | Renter-occupied |
| Less than $5,000 | 29 (3.4%) | 37 (4.4%) |
| $5,000 to $9,999 | 0 (0.0%) | 13 (1.6%) |
| $10,000 to $14,999 | 71 (8.3%) | 96 (11.5%) |
| $15,000 to $19,999 | 0 (0.0%) | 43 (5.2%) |
| $20,000 to $24,999 | 16 (1.9%) | 75 (9.0%) |
| $25,000 to $34,999 | 26 (3.0%) | 243 (29.2%) |
| $35,000 to $49,999 | 230 (26.7%) | 222 (26.7%) |
| $50,000 to $74,999 | 170 (19.8%) | 71 (8.5%) |
| $75,000 to $99,999 | 80 (9.3%) | 32 (3.8%) |
| $100,000 to $149,999 | 186 (21.6%) | 0 (0.0%) |
| $150,000 or more | 52 (6.0%) | 0 (0.0%) |
| Total | 860 (100.0%) | 832 (100.0%) |
Monthly Housing Cost Tiers in Jackson
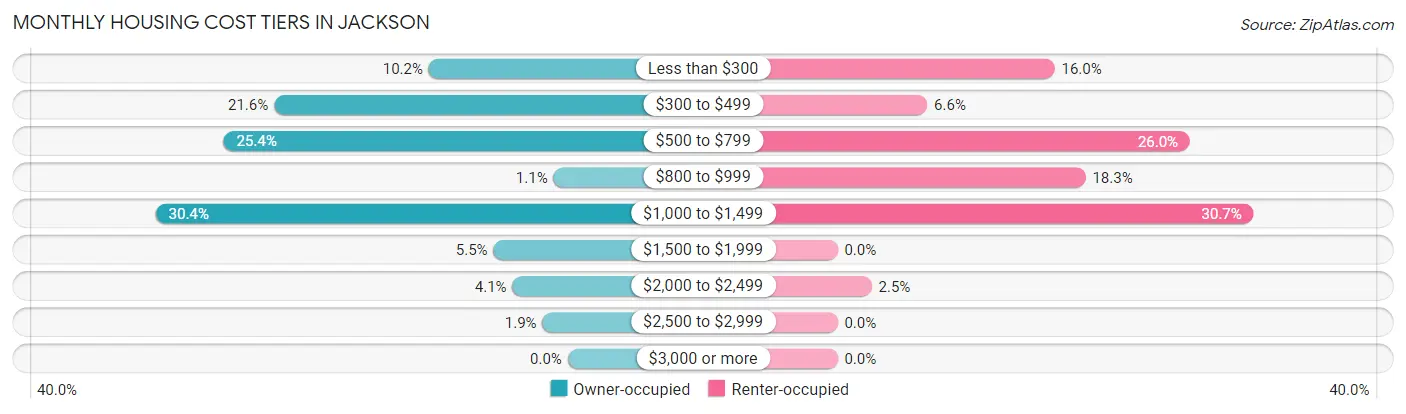
| Monthly Cost | Owner-occupied | Renter-occupied |
| Less than $300 | 88 (10.2%) | 133 (16.0%) |
| $300 to $499 | 186 (21.6%) | 55 (6.6%) |
| $500 to $799 | 218 (25.4%) | 216 (26.0%) |
| $800 to $999 | 9 (1.1%) | 152 (18.3%) |
| $1,000 to $1,499 | 261 (30.3%) | 255 (30.6%) |
| $1,500 to $1,999 | 47 (5.5%) | 0 (0.0%) |
| $2,000 to $2,499 | 35 (4.1%) | 21 (2.5%) |
| $2,500 to $2,999 | 16 (1.9%) | 0 (0.0%) |
| $3,000 or more | 0 (0.0%) | 0 (0.0%) |
| Total | 860 (100.0%) | 832 (100.0%) |
Physical Housing Characteristics in Jackson
Housing Structures in Jackson
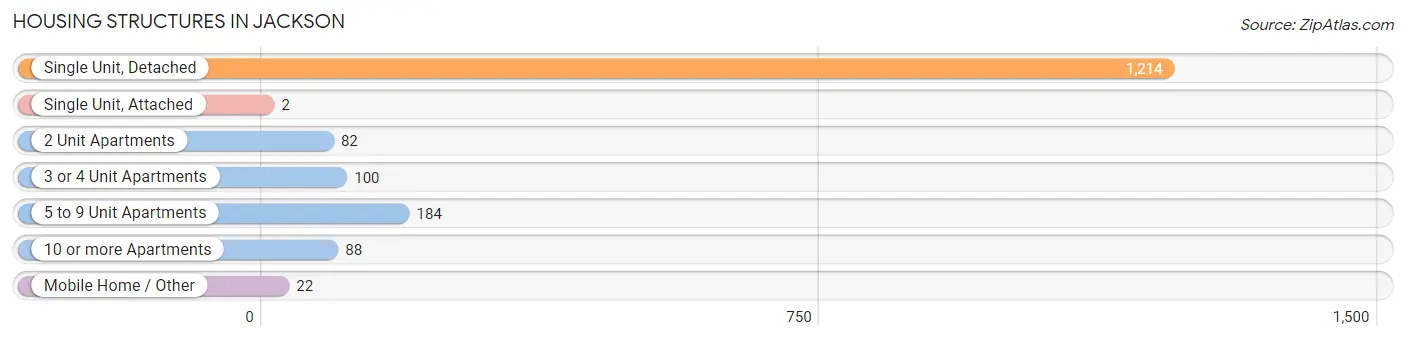
| Structure Type | # Housing Units | % Housing Units |
| Single Unit, Detached | 1,214 | 71.8% |
| Single Unit, Attached | 2 | 0.1% |
| 2 Unit Apartments | 82 | 4.9% |
| 3 or 4 Unit Apartments | 100 | 5.9% |
| 5 to 9 Unit Apartments | 184 | 10.9% |
| 10 or more Apartments | 88 | 5.2% |
| Mobile Home / Other | 22 | 1.3% |
| Total | 1,692 | 100.0% |
Housing Structures by Occupancy in Jackson
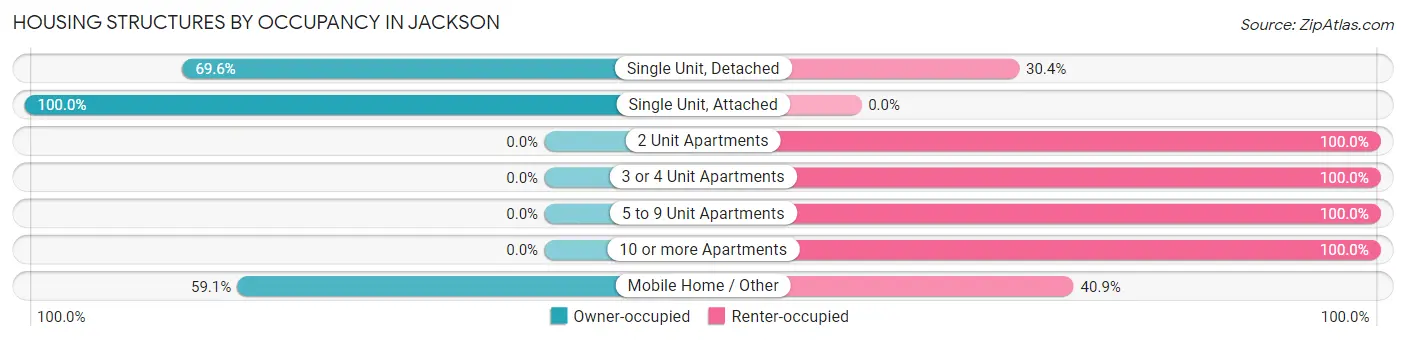
| Structure Type | Owner-occupied | Renter-occupied |
| Single Unit, Detached | 845 (69.6%) | 369 (30.4%) |
| Single Unit, Attached | 2 (100.0%) | 0 (0.0%) |
| 2 Unit Apartments | 0 (0.0%) | 82 (100.0%) |
| 3 or 4 Unit Apartments | 0 (0.0%) | 100 (100.0%) |
| 5 to 9 Unit Apartments | 0 (0.0%) | 184 (100.0%) |
| 10 or more Apartments | 0 (0.0%) | 88 (100.0%) |
| Mobile Home / Other | 13 (59.1%) | 9 (40.9%) |
| Total | 860 (50.8%) | 832 (49.2%) |
Housing Structures by Number of Rooms in Jackson
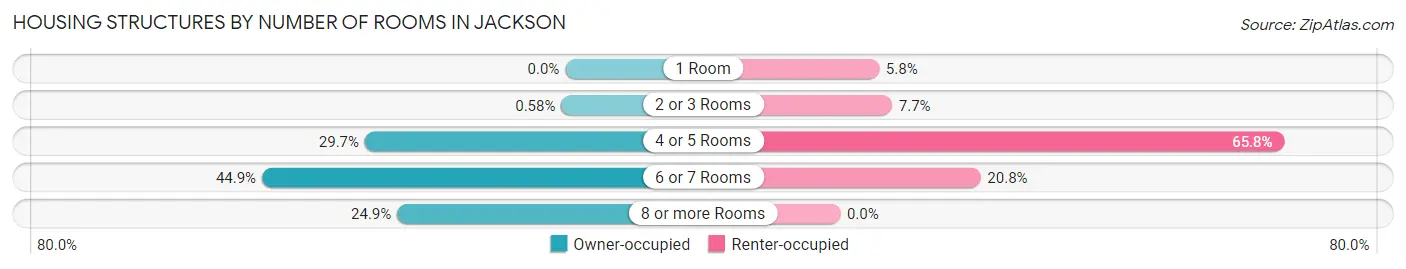
| Number of Rooms | Owner-occupied | Renter-occupied |
| 1 Room | 0 (0.0%) | 48 (5.8%) |
| 2 or 3 Rooms | 5 (0.6%) | 64 (7.7%) |
| 4 or 5 Rooms | 255 (29.6%) | 547 (65.7%) |
| 6 or 7 Rooms | 386 (44.9%) | 173 (20.8%) |
| 8 or more Rooms | 214 (24.9%) | 0 (0.0%) |
| Total | 860 (100.0%) | 832 (100.0%) |
Housing Structure by Heating Type in Jackson
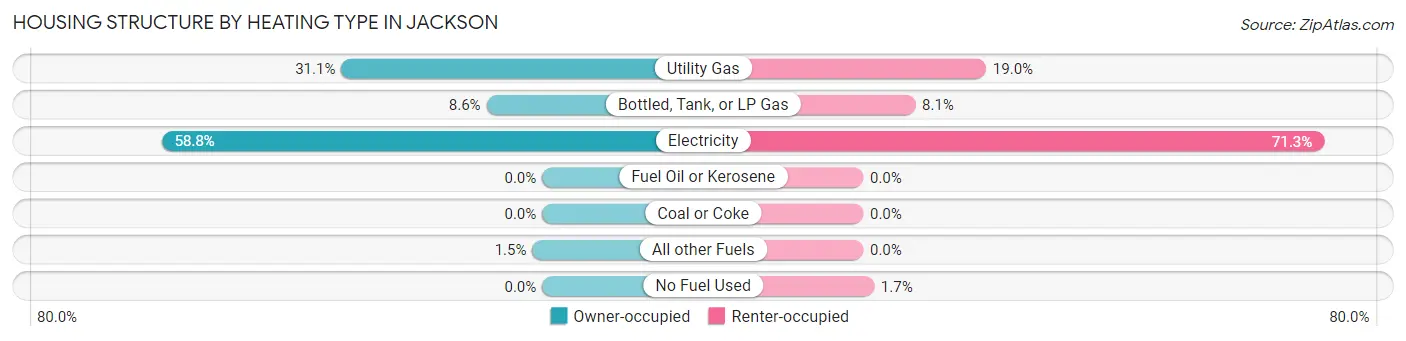
| Heating Type | Owner-occupied | Renter-occupied |
| Utility Gas | 267 (31.0%) | 158 (19.0%) |
| Bottled, Tank, or LP Gas | 74 (8.6%) | 67 (8.1%) |
| Electricity | 506 (58.8%) | 593 (71.3%) |
| Fuel Oil or Kerosene | 0 (0.0%) | 0 (0.0%) |
| Coal or Coke | 0 (0.0%) | 0 (0.0%) |
| All other Fuels | 13 (1.5%) | 0 (0.0%) |
| No Fuel Used | 0 (0.0%) | 14 (1.7%) |
| Total | 860 (100.0%) | 832 (100.0%) |
Household Vehicle Usage in Jackson
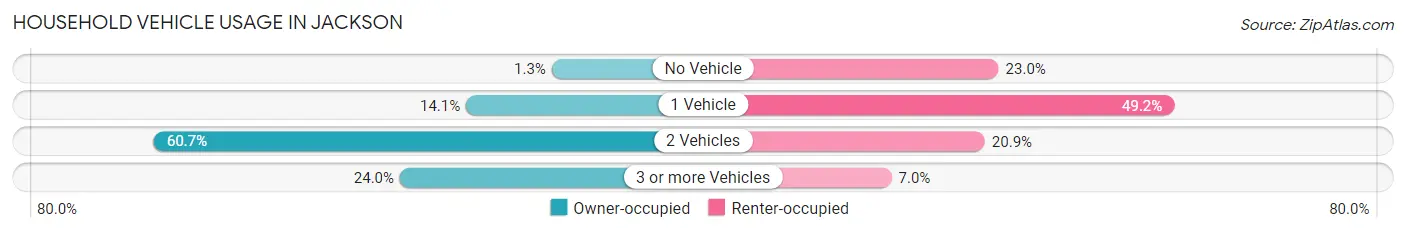
| Vehicles per Household | Owner-occupied | Renter-occupied |
| No Vehicle | 11 (1.3%) | 191 (23.0%) |
| 1 Vehicle | 121 (14.1%) | 409 (49.2%) |
| 2 Vehicles | 522 (60.7%) | 174 (20.9%) |
| 3 or more Vehicles | 206 (23.9%) | 58 (7.0%) |
| Total | 860 (100.0%) | 832 (100.0%) |
Real Estate & Mortgages in Jackson
Real Estate and Mortgage Overview in Jackson
| Characteristic | Without Mortgage | With Mortgage |
| Housing Units | 511 | 349 |
| Median Property Value | $134,100 | $163,500 |
| Median Household Income | $58,938 | $43 |
| Monthly Housing Costs | $475 | $0 |
| Real Estate Taxes | $1,278 | $0 |
Property Value by Mortgage Status in Jackson
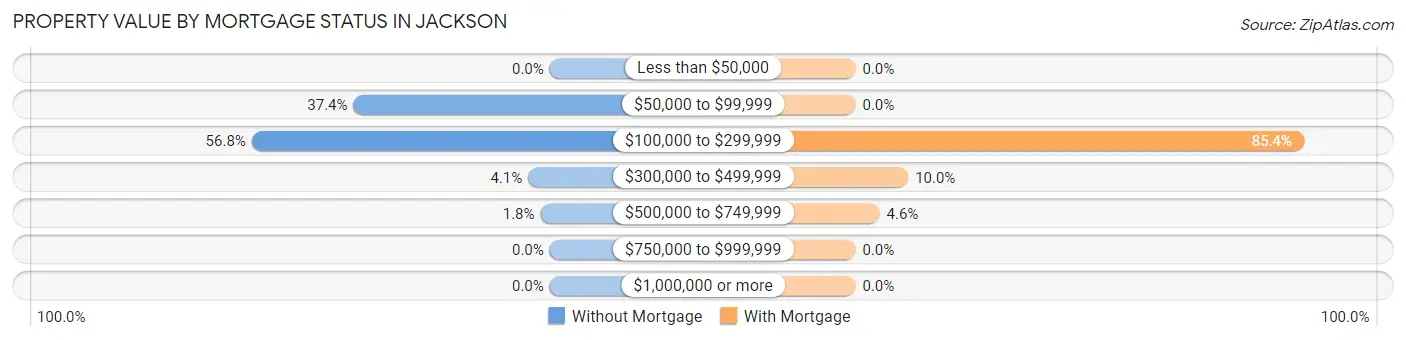
| Property Value | Without Mortgage | With Mortgage |
| Less than $50,000 | 0 (0.0%) | 0 (0.0%) |
| $50,000 to $99,999 | 191 (37.4%) | 0 (0.0%) |
| $100,000 to $299,999 | 290 (56.8%) | 298 (85.4%) |
| $300,000 to $499,999 | 21 (4.1%) | 35 (10.0%) |
| $500,000 to $749,999 | 9 (1.8%) | 16 (4.6%) |
| $750,000 to $999,999 | 0 (0.0%) | 0 (0.0%) |
| $1,000,000 or more | 0 (0.0%) | 0 (0.0%) |
| Total | 511 (100.0%) | 349 (100.0%) |
Household Income by Mortgage Status in Jackson
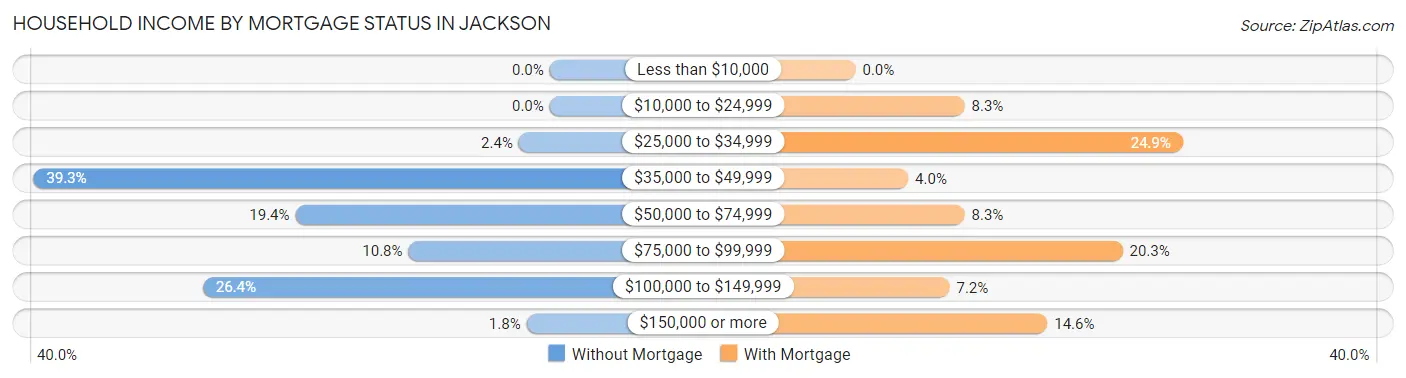
| Household Income | Without Mortgage | With Mortgage |
| Less than $10,000 | 0 (0.0%) | 0 (0.0%) |
| $10,000 to $24,999 | 0 (0.0%) | 29 (8.3%) |
| $25,000 to $34,999 | 12 (2.4%) | 87 (24.9%) |
| $35,000 to $49,999 | 201 (39.3%) | 14 (4.0%) |
| $50,000 to $74,999 | 99 (19.4%) | 29 (8.3%) |
| $75,000 to $99,999 | 55 (10.8%) | 71 (20.3%) |
| $100,000 to $149,999 | 135 (26.4%) | 25 (7.2%) |
| $150,000 or more | 9 (1.8%) | 51 (14.6%) |
| Total | 511 (100.0%) | 349 (100.0%) |
Property Value to Household Income Ratio in Jackson
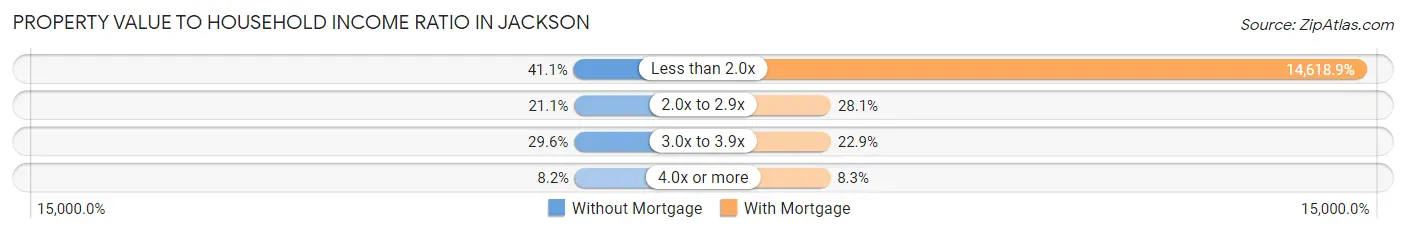
| Value-to-Income Ratio | Without Mortgage | With Mortgage |
| Less than 2.0x | 210 (41.1%) | 51,020 (14,618.9%) |
| 2.0x to 2.9x | 108 (21.1%) | 98 (28.1%) |
| 3.0x to 3.9x | 151 (29.5%) | 80 (22.9%) |
| 4.0x or more | 42 (8.2%) | 29 (8.3%) |
| Total | 511 (100.0%) | 349 (100.0%) |
Real Estate Taxes by Mortgage Status in Jackson
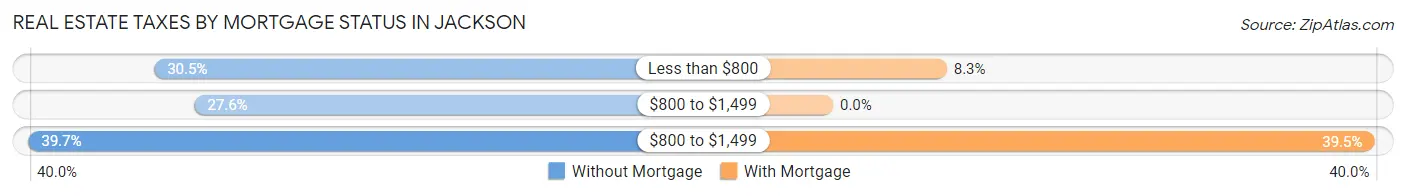
| Property Taxes | Without Mortgage | With Mortgage |
| Less than $800 | 156 (30.5%) | 29 (8.3%) |
| $800 to $1,499 | 141 (27.6%) | 0 (0.0%) |
| $800 to $1,499 | 203 (39.7%) | 138 (39.5%) |
| Total | 511 (100.0%) | 349 (100.0%) |
Health & Disability in Jackson
Health Insurance Coverage by Age in Jackson
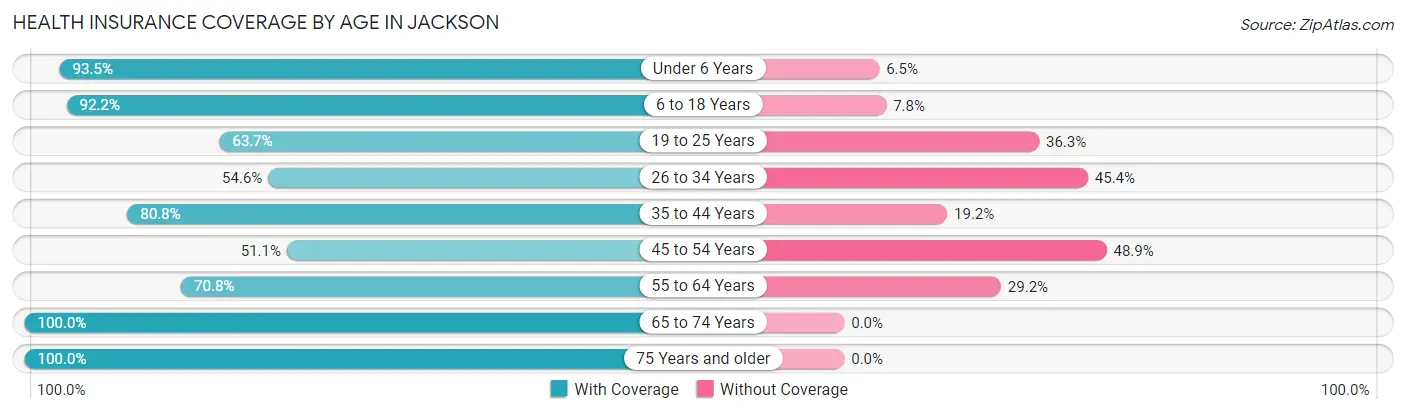
| Age Bracket | With Coverage | Without Coverage |
| Under 6 Years | 316 (93.5%) | 22 (6.5%) |
| 6 to 18 Years | 1,262 (92.2%) | 107 (7.8%) |
| 19 to 25 Years | 128 (63.7%) | 73 (36.3%) |
| 26 to 34 Years | 399 (54.6%) | 332 (45.4%) |
| 35 to 44 Years | 624 (80.8%) | 148 (19.2%) |
| 45 to 54 Years | 303 (51.1%) | 290 (48.9%) |
| 55 to 64 Years | 371 (70.8%) | 153 (29.2%) |
| 65 to 74 Years | 345 (100.0%) | 0 (0.0%) |
| 75 Years and older | 207 (100.0%) | 0 (0.0%) |
| Total | 3,955 (77.8%) | 1,125 (22.2%) |
Health Insurance Coverage by Citizenship Status in Jackson
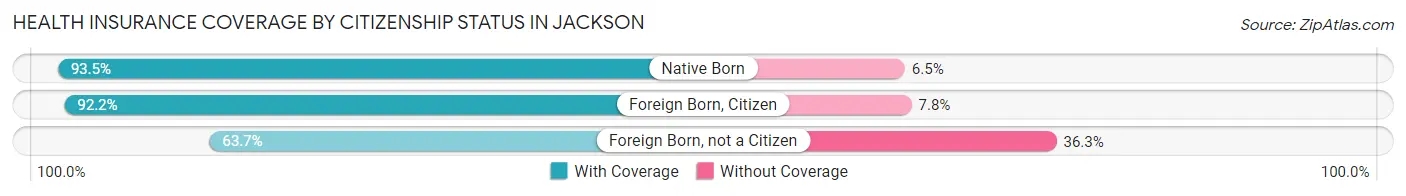
| Citizenship Status | With Coverage | Without Coverage |
| Native Born | 316 (93.5%) | 22 (6.5%) |
| Foreign Born, Citizen | 1,262 (92.2%) | 107 (7.8%) |
| Foreign Born, not a Citizen | 128 (63.7%) | 73 (36.3%) |
Health Insurance Coverage by Household Income in Jackson
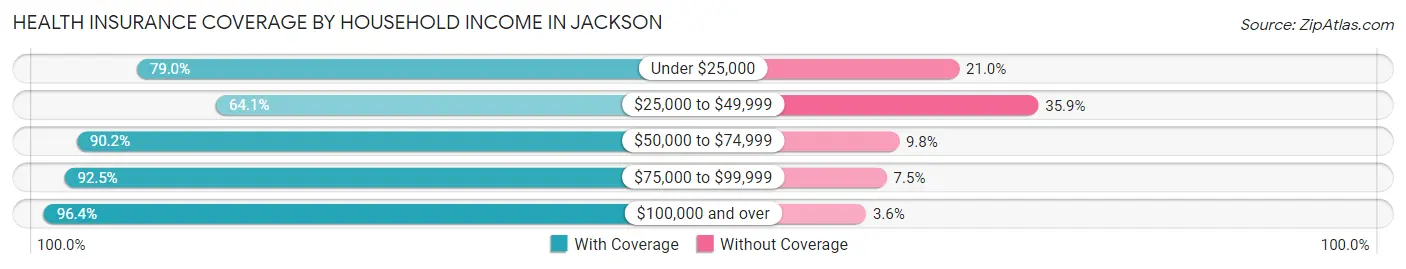
| Household Income | With Coverage | Without Coverage |
| Under $25,000 | 728 (79.0%) | 194 (21.0%) |
| $25,000 to $49,999 | 1,421 (64.1%) | 795 (35.9%) |
| $50,000 to $74,999 | 793 (90.2%) | 86 (9.8%) |
| $75,000 to $99,999 | 285 (92.5%) | 23 (7.5%) |
| $100,000 and over | 722 (96.4%) | 27 (3.6%) |
Public vs Private Health Insurance Coverage by Age in Jackson
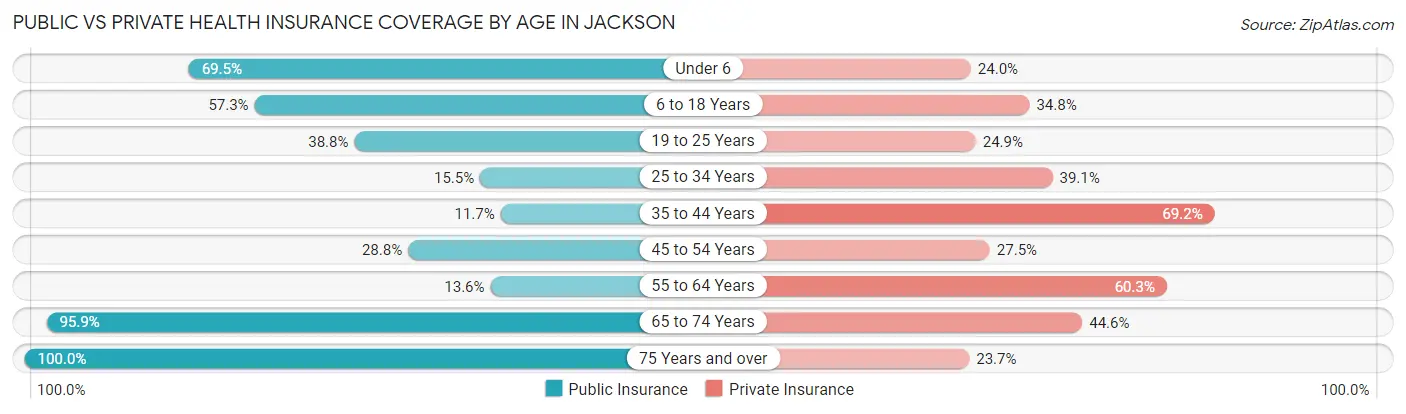
| Age Bracket | Public Insurance | Private Insurance |
| Under 6 | 235 (69.5%) | 81 (24.0%) |
| 6 to 18 Years | 785 (57.3%) | 477 (34.8%) |
| 19 to 25 Years | 78 (38.8%) | 50 (24.9%) |
| 25 to 34 Years | 113 (15.5%) | 286 (39.1%) |
| 35 to 44 Years | 90 (11.7%) | 534 (69.2%) |
| 45 to 54 Years | 171 (28.8%) | 163 (27.5%) |
| 55 to 64 Years | 71 (13.6%) | 316 (60.3%) |
| 65 to 74 Years | 331 (95.9%) | 154 (44.6%) |
| 75 Years and over | 207 (100.0%) | 49 (23.7%) |
| Total | 2,081 (41.0%) | 2,110 (41.5%) |
Disability Status by Sex by Age in Jackson
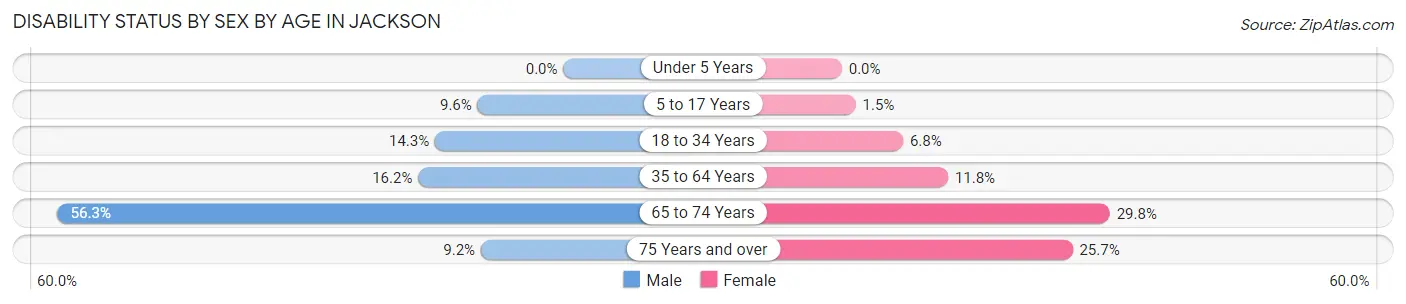
| Age Bracket | Male | Female |
| Under 5 Years | 0 (0.0%) | 0 (0.0%) |
| 5 to 17 Years | 68 (9.6%) | 10 (1.5%) |
| 18 to 34 Years | 74 (14.3%) | 31 (6.8%) |
| 35 to 64 Years | 159 (16.2%) | 107 (11.8%) |
| 65 to 74 Years | 49 (56.3%) | 77 (29.8%) |
| 75 Years and over | 9 (9.2%) | 28 (25.7%) |
Disability Class by Sex by Age in Jackson
Disability Class: Hearing Difficulty
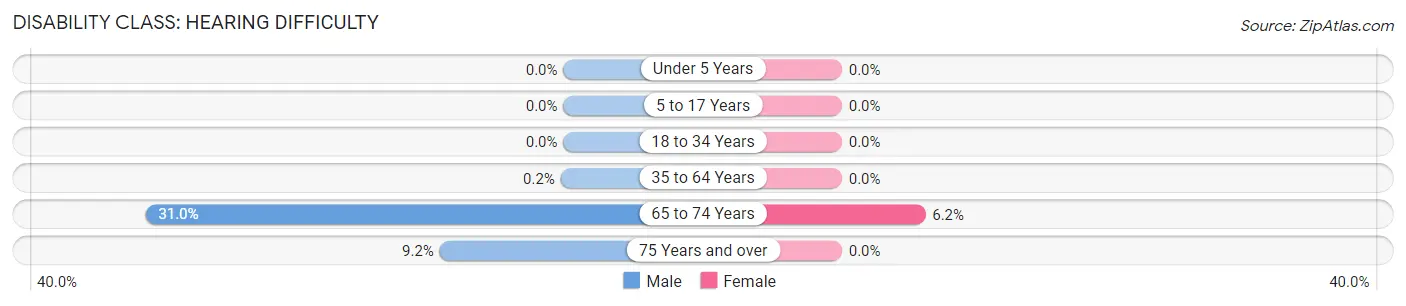
| Age Bracket | Male | Female |
| Under 5 Years | 0 (0.0%) | 0 (0.0%) |
| 5 to 17 Years | 0 (0.0%) | 0 (0.0%) |
| 18 to 34 Years | 0 (0.0%) | 0 (0.0%) |
| 35 to 64 Years | 2 (0.2%) | 0 (0.0%) |
| 65 to 74 Years | 27 (31.0%) | 16 (6.2%) |
| 75 Years and over | 9 (9.2%) | 0 (0.0%) |
Disability Class: Vision Difficulty
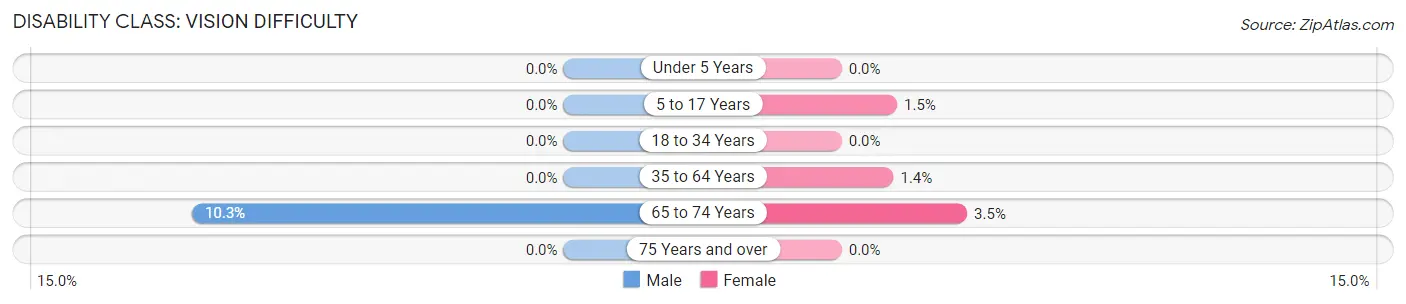
| Age Bracket | Male | Female |
| Under 5 Years | 0 (0.0%) | 0 (0.0%) |
| 5 to 17 Years | 0 (0.0%) | 10 (1.5%) |
| 18 to 34 Years | 0 (0.0%) | 0 (0.0%) |
| 35 to 64 Years | 0 (0.0%) | 13 (1.4%) |
| 65 to 74 Years | 9 (10.3%) | 9 (3.5%) |
| 75 Years and over | 0 (0.0%) | 0 (0.0%) |
Disability Class: Cognitive Difficulty
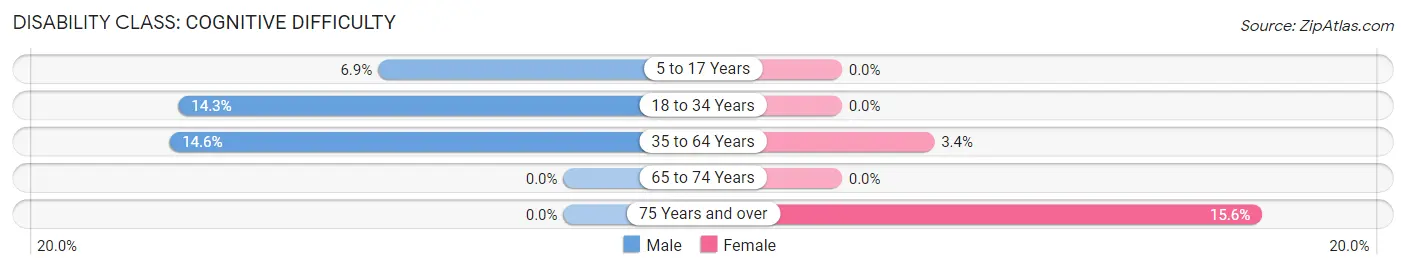
| Age Bracket | Male | Female |
| 5 to 17 Years | 49 (6.9%) | 0 (0.0%) |
| 18 to 34 Years | 74 (14.3%) | 0 (0.0%) |
| 35 to 64 Years | 144 (14.6%) | 31 (3.4%) |
| 65 to 74 Years | 0 (0.0%) | 0 (0.0%) |
| 75 Years and over | 0 (0.0%) | 17 (15.6%) |
Disability Class: Ambulatory Difficulty
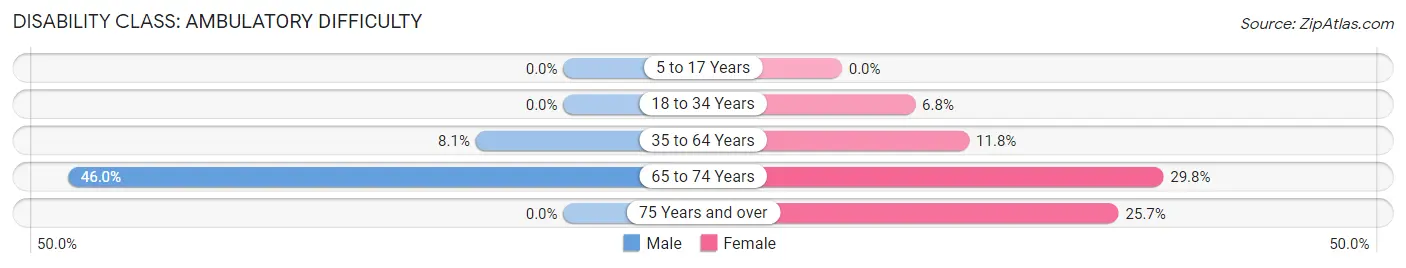
| Age Bracket | Male | Female |
| 5 to 17 Years | 0 (0.0%) | 0 (0.0%) |
| 18 to 34 Years | 0 (0.0%) | 31 (6.8%) |
| 35 to 64 Years | 80 (8.1%) | 107 (11.8%) |
| 65 to 74 Years | 40 (46.0%) | 77 (29.8%) |
| 75 Years and over | 0 (0.0%) | 28 (25.7%) |
Disability Class: Self-Care Difficulty
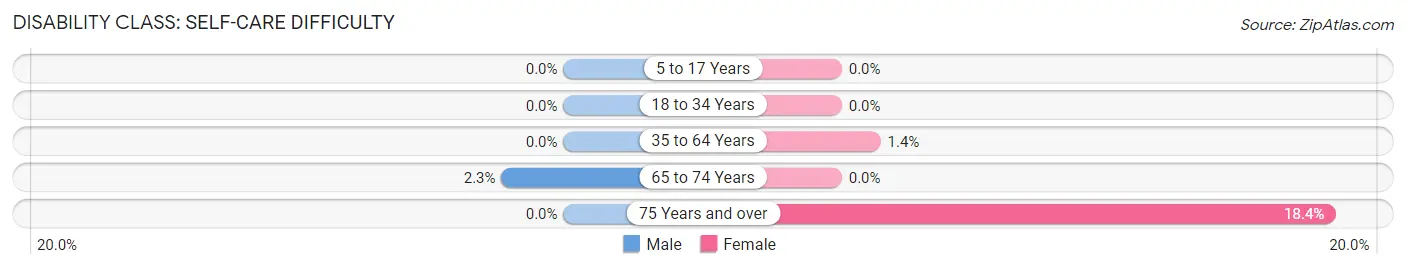
| Age Bracket | Male | Female |
| 5 to 17 Years | 0 (0.0%) | 0 (0.0%) |
| 18 to 34 Years | 0 (0.0%) | 0 (0.0%) |
| 35 to 64 Years | 0 (0.0%) | 13 (1.4%) |
| 65 to 74 Years | 2 (2.3%) | 0 (0.0%) |
| 75 Years and over | 0 (0.0%) | 20 (18.3%) |
Technology Access in Jackson
Computing Device Access in Jackson
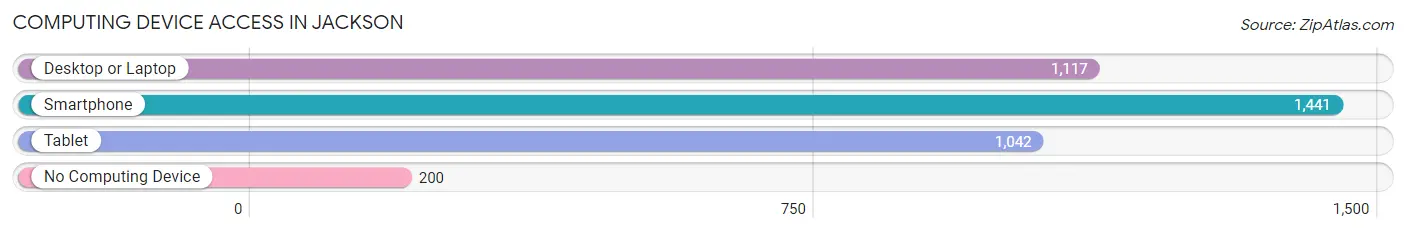
| Device Type | # Households | % Households |
| Desktop or Laptop | 1,117 | 66.0% |
| Smartphone | 1,441 | 85.2% |
| Tablet | 1,042 | 61.6% |
| No Computing Device | 200 | 11.8% |
| Total | 1,692 | 100.0% |
Internet Access in Jackson
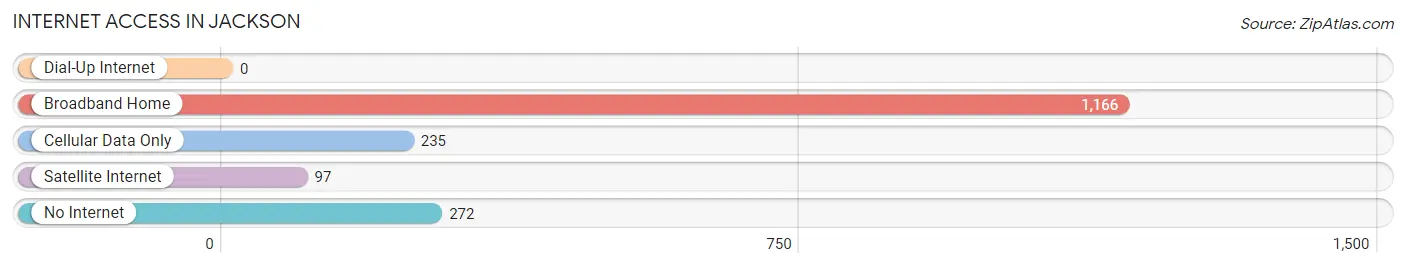
| Internet Type | # Households | % Households |
| Dial-Up Internet | 0 | 0.0% |
| Broadband Home | 1,166 | 68.9% |
| Cellular Data Only | 235 | 13.9% |
| Satellite Internet | 97 | 5.7% |
| No Internet | 272 | 16.1% |
| Total | 1,692 | 100.0% |
Jackson Summary
Jackson, Georgia is a city located in Butts County, Georgia, United States. It is the county seat of Butts County and is part of the Atlanta metropolitan area. The population was 4,717 at the 2010 census.
History
Jackson was founded in 1826 as the county seat of Butts County. It was named after the Revolutionary War hero, James Jackson. The city was incorporated in 1829 and has been the county seat ever since.
In the early 19th century, Jackson was a small agricultural town. It was the site of a major Civil War battle in 1864, when Union forces under General William T. Sherman captured the city. After the war, Jackson experienced a period of growth and prosperity. The city was home to several cotton mills and other industries.
Geography
Jackson is located at 33°19'45" North, 84°3'45" West (33.329167, -84.062500). According to the United States Census Bureau, the city has a total area of 4.2 square miles (10.8 km2), all land.
Economy
Jackson’s economy is largely based on agriculture and manufacturing. The city is home to several large poultry processing plants, as well as a number of smaller businesses. The city also has a thriving retail sector, with several large shopping centers and a variety of restaurants and other businesses.
Demographics
As of the 2010 census, there were 4,717 people, 1,845 households, and 1,213 families residing in the city. The population density was 1,118.3 people per square mile (431.2/km2). There were 2,039 housing units at an average density of 484.3 per square mile (187.2/km2). The racial makeup of the city was 68.2% White, 28.2% African American, 0.3% Native American, 0.7% Asian, 0.1% Pacific Islander, 0.9% from other races, and 1.6% from two or more races. Hispanic or Latino of any race were 2.7% of the population.
There were 1,845 households, out of which 33.2% had children under the age of 18 living with them, 41.2% were married couples living together, 19.7% had a female householder with no husband present, and 34.2% were non-families. 28.7% of all households were made up of individuals, and 11.2% had someone living alone who was 65 years of age or older. The average household size was 2.53 and the average family size was 3.11.
In the city, the population was spread out, with 26.2% under the age of 18, 8.7% from 18 to 24, 29.2% from 25 to 44, 22.2% from 45 to 64, and 13.7% who were 65 years of age or older. The median age was 36 years. For every 100 females, there were 87.2 males. For every 100 females age 18 and over, there were 82.3 males.
The median income for a household in the city was $33,958, and the median income for a family was $41,964. Males had a median income of $31,912 versus $25,917 for females. The per capita income for the city was $17,845. About 13.2% of families and 16.2% of the population were below the poverty line, including 22.2% of those under age 18 and 14.2% of those age 65 or over.
Common Questions
What is Per Capita Income in Jackson?
Per Capita income in Jackson is $22,293.
What is the Median Family Income in Jackson?
Median Family Income in Jackson is $41,385.
What is the Median Household income in Jackson?
Median Household Income in Jackson is $43,824.
What is Income or Wage Gap in Jackson?
Income or Wage Gap in Jackson is 21.0%.
Women in Jackson earn 79.0 cents for every dollar earned by a man.
What is Inequality or Gini Index in Jackson?
Inequality or Gini Index in Jackson is 0.51.
What is the Total Population of Jackson?
Total Population of Jackson is 5,497.
What is the Total Male Population of Jackson?
Total Male Population of Jackson is 2,799.
What is the Total Female Population of Jackson?
Total Female Population of Jackson is 2,698.
What is the Ratio of Males per 100 Females in Jackson?
There are 103.74 Males per 100 Females in Jackson.
What is the Ratio of Females per 100 Males in Jackson?
There are 96.39 Females per 100 Males in Jackson.
What is the Median Population Age in Jackson?
Median Population Age in Jackson is 35.4 Years.
What is the Average Family Size in Jackson
Average Family Size in Jackson is 3.1 People.
What is the Average Household Size in Jackson
Average Household Size in Jackson is 3.0 People.
How Large is the Labor Force in Jackson?
There are 2,081 People in the Labor Forcein in Jackson.
What is the Percentage of People in the Labor Force in Jackson?
52.1% of People are in the Labor Force in Jackson.
What is the Unemployment Rate in Jackson?
Unemployment Rate in Jackson is 6.3%.