Andersonville, GA Map & Demographics
Andersonville Map
Andersonville Overview
$14,556
PER CAPITA INCOME
$63,125
AVG FAMILY INCOME
$22,656
AVG HOUSEHOLD INCOME
69.3%
WAGE / INCOME GAP [ % ]
30.7¢/ $1
WAGE / INCOME GAP [ $ ]
0.46
INEQUALITY / GINI INDEX
296
TOTAL POPULATION
120
MALE POPULATION
176
FEMALE POPULATION
68.18
MALES / 100 FEMALES
146.67
FEMALES / 100 MALES
36.5
MEDIAN AGE
3.8
AVG FAMILY SIZE
2.5
AVG HOUSEHOLD SIZE
100
LABOR FORCE [ PEOPLE ]
42.9%
PERCENT IN LABOR FORCE
10.0%
UNEMPLOYMENT RATE
Andersonville Zip Codes
Andersonville Area Codes
Income in Andersonville
Income Overview in Andersonville
Per Capita Income in Andersonville is $14,556, while median incomes of families and households are $63,125 and $22,656 respectively.
| Characteristic | Number | Measure |
| Per Capita Income | 296 | $14,556 |
| Median Family Income | 55 | $63,125 |
| Mean Family Income | 55 | $50,225 |
| Median Household Income | 121 | $22,656 |
| Mean Household Income | 121 | $32,405 |
| Income Deficit | 55 | $0 |
| Wage / Income Gap (%) | 296 | 69.32% |
| Wage / Income Gap ($) | 296 | 30.68¢ per $1 |
| Gini / Inequality Index | 296 | 0.46 |
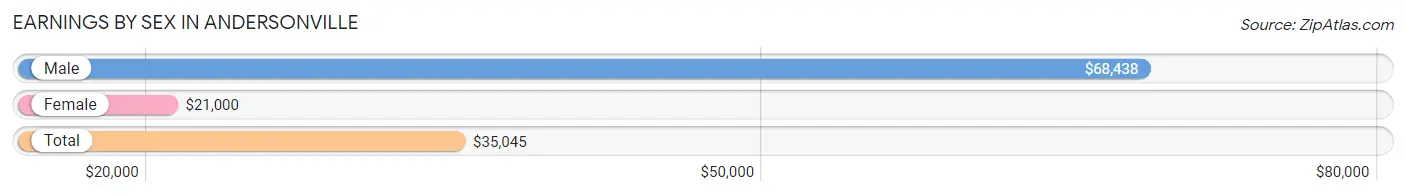
Earnings by Sex in Andersonville
Average Earnings in Andersonville are $35,045, $68,438 for men and $21,000 for women, a difference of 69.3%.
| Sex | Number | Average Earnings |
| Male | 33 (34.7%) | $68,438 |
| Female | 62 (65.3%) | $21,000 |
| Total | 95 (100.0%) | $35,045 |
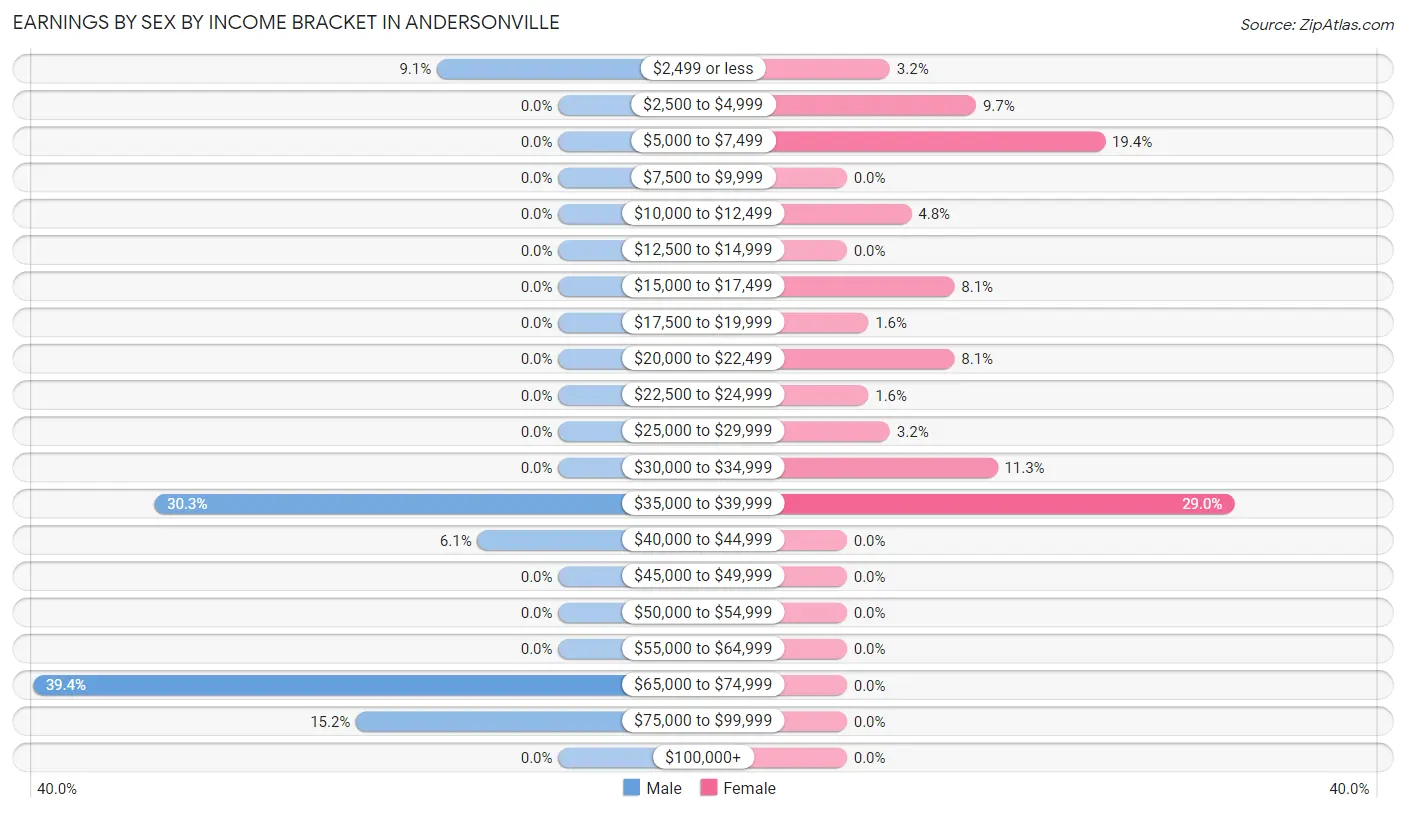
Earnings by Sex by Income Bracket in Andersonville
The most common earnings brackets in Andersonville are $65,000 to $74,999 for men (13 | 39.4%) and $35,000 to $39,999 for women (18 | 29.0%).
| Income | Male | Female |
| $2,499 or less | 3 (9.1%) | 2 (3.2%) |
| $2,500 to $4,999 | 0 (0.0%) | 6 (9.7%) |
| $5,000 to $7,499 | 0 (0.0%) | 12 (19.4%) |
| $7,500 to $9,999 | 0 (0.0%) | 0 (0.0%) |
| $10,000 to $12,499 | 0 (0.0%) | 3 (4.8%) |
| $12,500 to $14,999 | 0 (0.0%) | 0 (0.0%) |
| $15,000 to $17,499 | 0 (0.0%) | 5 (8.1%) |
| $17,500 to $19,999 | 0 (0.0%) | 1 (1.6%) |
| $20,000 to $22,499 | 0 (0.0%) | 5 (8.1%) |
| $22,500 to $24,999 | 0 (0.0%) | 1 (1.6%) |
| $25,000 to $29,999 | 0 (0.0%) | 2 (3.2%) |
| $30,000 to $34,999 | 0 (0.0%) | 7 (11.3%) |
| $35,000 to $39,999 | 10 (30.3%) | 18 (29.0%) |
| $40,000 to $44,999 | 2 (6.1%) | 0 (0.0%) |
| $45,000 to $49,999 | 0 (0.0%) | 0 (0.0%) |
| $50,000 to $54,999 | 0 (0.0%) | 0 (0.0%) |
| $55,000 to $64,999 | 0 (0.0%) | 0 (0.0%) |
| $65,000 to $74,999 | 13 (39.4%) | 0 (0.0%) |
| $75,000 to $99,999 | 5 (15.1%) | 0 (0.0%) |
| $100,000+ | 0 (0.0%) | 0 (0.0%) |
| Total | 33 (100.0%) | 62 (100.0%) |
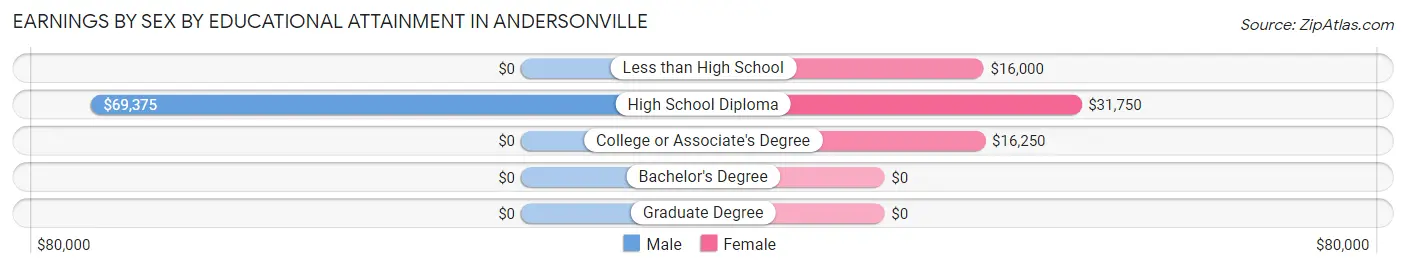
Earnings by Sex by Educational Attainment in Andersonville
Average earnings in Andersonville are $67,813 for men and $22,250 for women, a difference of 67.2%. Men with an educational attainment of high school diploma enjoy the highest average annual earnings of $69,375, while those with high school diploma education earn the least with $69,375. Women with an educational attainment of high school diploma earn the most with the average annual earnings of $31,750, while those with less than high school education have the smallest earnings of $16,000.
| Educational Attainment | Male Income | Female Income |
| Less than High School | - | - |
| High School Diploma | $69,375 | $31,750 |
| College or Associate's Degree | - | - |
| Bachelor's Degree | - | - |
| Graduate Degree | - | - |
| Total | $67,813 | $22,250 |
Family Income in Andersonville
Family Income Brackets in Andersonville
According to the Andersonville family income data, there are 19 families falling into the $50,000 to $74,999 income range, which is the most common income bracket and makes up 34.5% of all families.
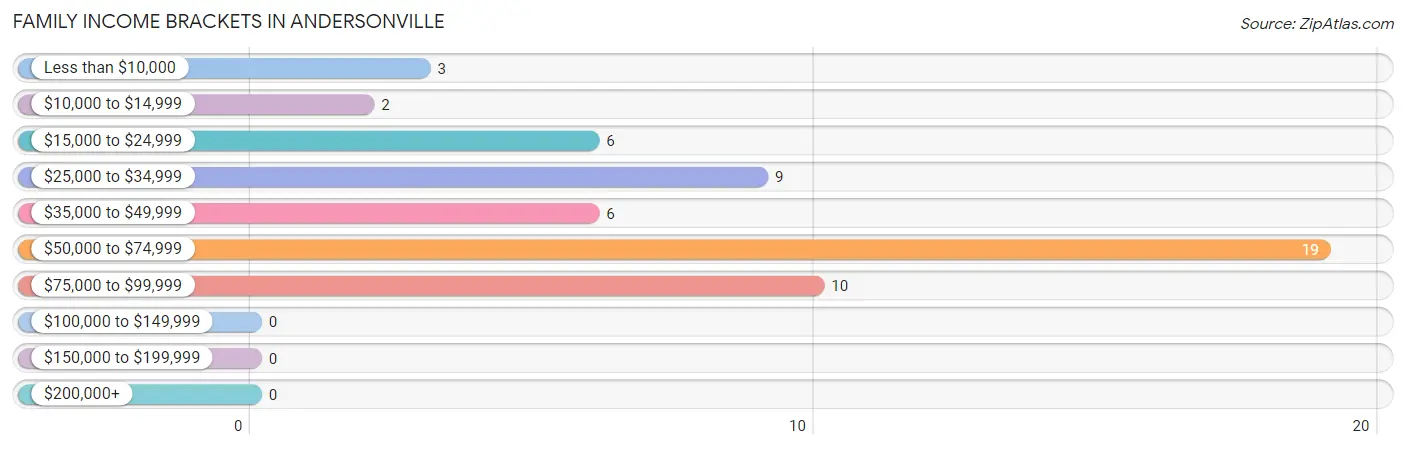
| Income Bracket | # Families | % Families |
| Less than $10,000 | 3 | 5.5% |
| $10,000 to $14,999 | 2 | 3.6% |
| $15,000 to $24,999 | 6 | 10.9% |
| $25,000 to $34,999 | 9 | 16.4% |
| $35,000 to $49,999 | 6 | 10.9% |
| $50,000 to $74,999 | 19 | 34.5% |
| $75,000 to $99,999 | 10 | 18.2% |
| $100,000 to $149,999 | 0 | 0.0% |
| $150,000 to $199,999 | 0 | 0.0% |
| $200,000+ | 0 | 0.0% |
Family Income by Famaliy Size in Andersonville
3-person families (19 | 34.5%) account for the highest median family income in Andersonville with $72,083 per family, while 3-person families (19 | 34.5%) have the highest median income of $24,028 per family member.
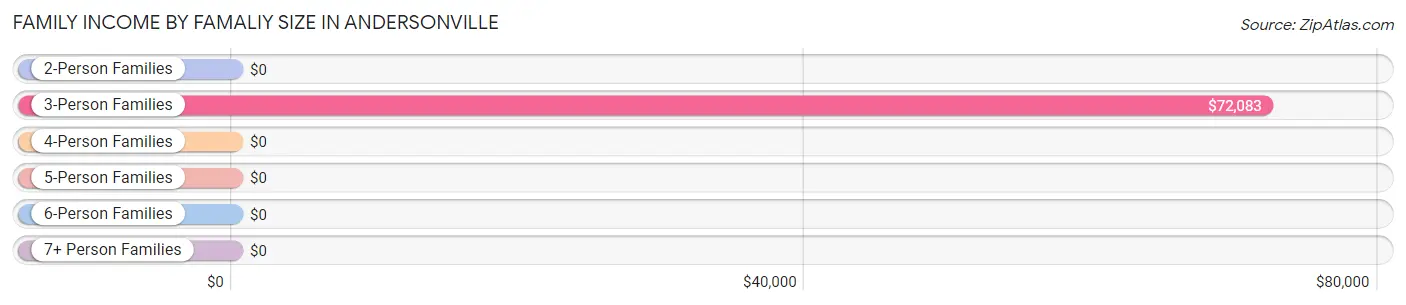
| Income Bracket | # Families | Median Income |
| 2-Person Families | 23 (41.8%) | $0 |
| 3-Person Families | 19 (34.5%) | $72,083 |
| 4-Person Families | 8 (14.5%) | $0 |
| 5-Person Families | 0 (0.0%) | $0 |
| 6-Person Families | 5 (9.1%) | $0 |
| 7+ Person Families | 0 (0.0%) | $0 |
| Total | 55 (100.0%) | $63,125 |
Family Income by Number of Earners in Andersonville
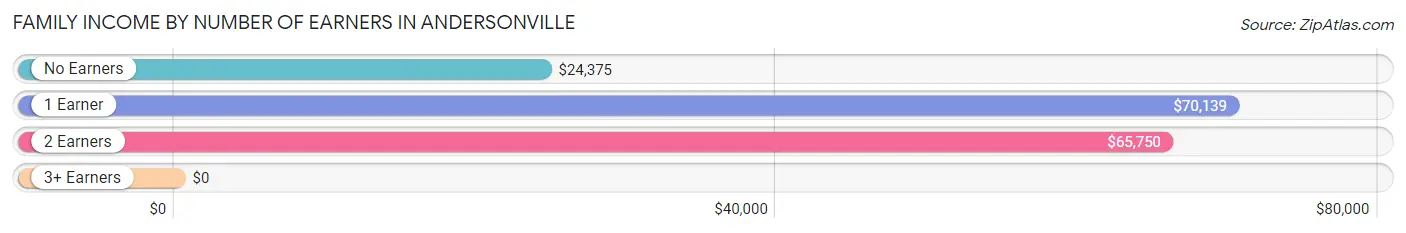
| Number of Earners | # Families | Median Income |
| No Earners | 13 (23.6%) | $24,375 |
| 1 Earner | 25 (45.5%) | $70,139 |
| 2 Earners | 11 (20.0%) | $65,750 |
| 3+ Earners | 6 (10.9%) | $0 |
| Total | 55 (100.0%) | $63,125 |
Household Income in Andersonville
Household Income Brackets in Andersonville
With 26 households falling in the category, the $10,000 to $14,999 income range is the most frequent in Andersonville, accounting for 21.5% of all households.
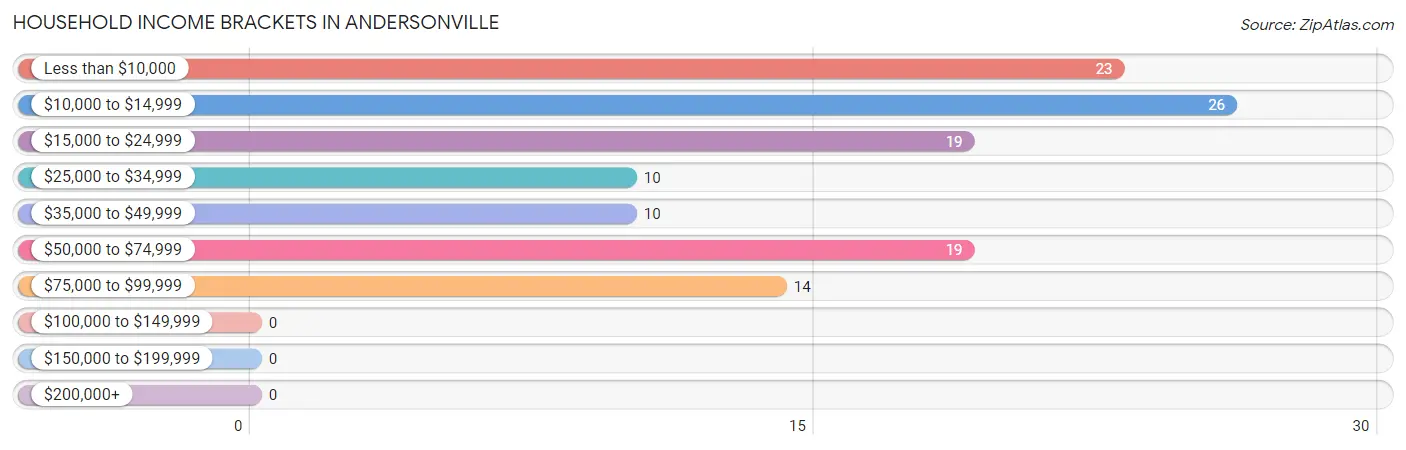
| Income Bracket | # Households | % Households |
| Less than $10,000 | 23 | 19.0% |
| $10,000 to $14,999 | 26 | 21.5% |
| $15,000 to $24,999 | 19 | 15.7% |
| $25,000 to $34,999 | 10 | 8.3% |
| $35,000 to $49,999 | 10 | 8.3% |
| $50,000 to $74,999 | 19 | 15.7% |
| $75,000 to $99,999 | 14 | 11.6% |
| $100,000 to $149,999 | 0 | 0.0% |
| $150,000 to $199,999 | 0 | 0.0% |
| $200,000+ | 0 | 0.0% |
Household Income by Householder Age in Andersonville
The median household income in Andersonville is $22,656, with the highest median household income of $70,417 found in the 25 to 44 years age bracket for the primary householder. A total of 31 households (25.6%) fall into this category. Meanwhile, the 15 to 24 years age bracket for the primary householder has the lowest median household income of $0, with 10 households (8.3%) in this group.
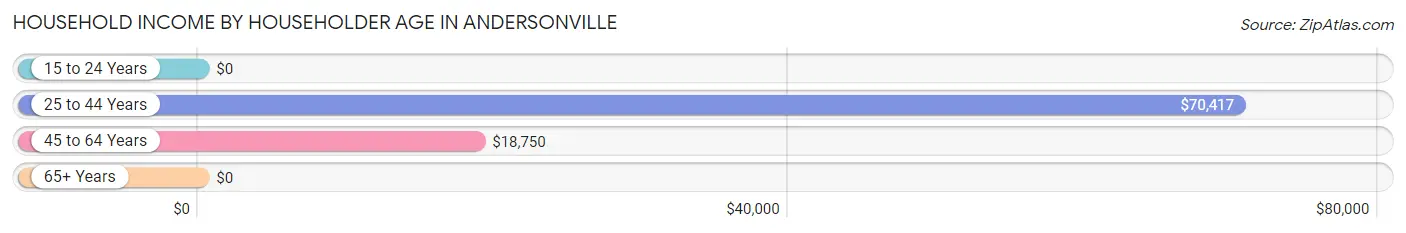
| Income Bracket | # Households | Median Income |
| 15 to 24 Years | 10 (8.3%) | $0 |
| 25 to 44 Years | 31 (25.6%) | $70,417 |
| 45 to 64 Years | 34 (28.1%) | $18,750 |
| 65+ Years | 46 (38.0%) | $0 |
| Total | 121 (100.0%) | $22,656 |
Poverty in Andersonville
Income Below Poverty by Sex and Age in Andersonville
With 34.2% poverty level for males and 21.0% for females among the residents of Andersonville, 45 to 54 year old males and 45 to 54 year old females are the most vulnerable to poverty, with 10 males (90.9%) and 14 females (51.8%) in their respective age groups living below the poverty level.
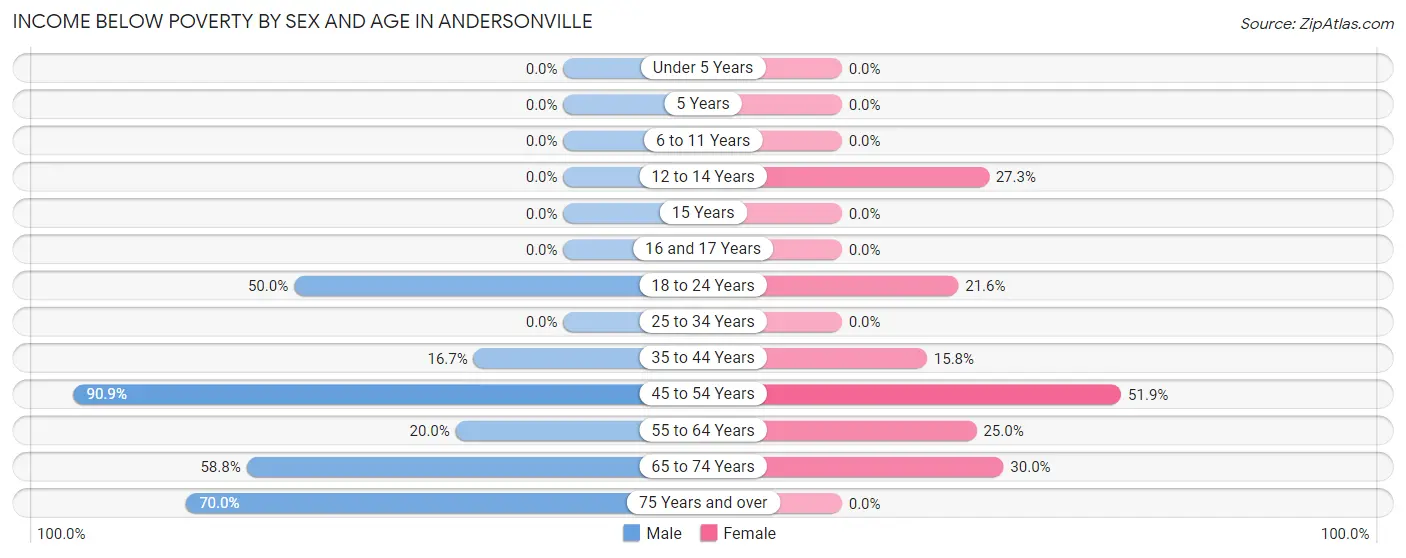
| Age Bracket | Male | Female |
| Under 5 Years | 0 (0.0%) | 0 (0.0%) |
| 5 Years | 0 (0.0%) | 0 (0.0%) |
| 6 to 11 Years | 0 (0.0%) | 0 (0.0%) |
| 12 to 14 Years | 0 (0.0%) | 3 (27.3%) |
| 15 Years | 0 (0.0%) | 0 (0.0%) |
| 16 and 17 Years | 0 (0.0%) | 0 (0.0%) |
| 18 to 24 Years | 2 (50.0%) | 8 (21.6%) |
| 25 to 34 Years | 0 (0.0%) | 0 (0.0%) |
| 35 to 44 Years | 3 (16.7%) | 3 (15.8%) |
| 45 to 54 Years | 10 (90.9%) | 14 (51.8%) |
| 55 to 64 Years | 2 (20.0%) | 4 (25.0%) |
| 65 to 74 Years | 10 (58.8%) | 3 (30.0%) |
| 75 Years and over | 14 (70.0%) | 0 (0.0%) |
| Total | 41 (34.2%) | 35 (21.0%) |
Income Above Poverty by Sex and Age in Andersonville
According to the poverty statistics in Andersonville, males aged under 5 years and females aged 6 to 11 years are the age groups that are most secure financially, with 100.0% of males and 100.0% of females in these age groups living above the poverty line.
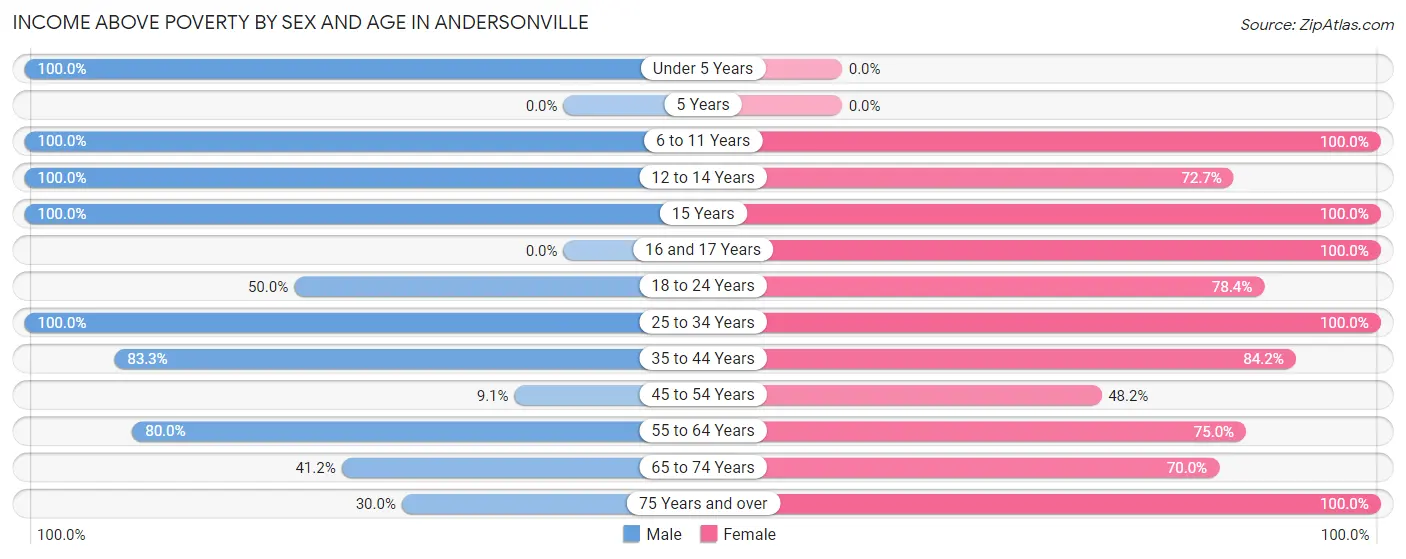
| Age Bracket | Male | Female |
| Under 5 Years | 6 (100.0%) | 0 (0.0%) |
| 5 Years | 0 (0.0%) | 0 (0.0%) |
| 6 to 11 Years | 4 (100.0%) | 5 (100.0%) |
| 12 to 14 Years | 4 (100.0%) | 8 (72.7%) |
| 15 Years | 19 (100.0%) | 5 (100.0%) |
| 16 and 17 Years | 0 (0.0%) | 24 (100.0%) |
| 18 to 24 Years | 2 (50.0%) | 29 (78.4%) |
| 25 to 34 Years | 7 (100.0%) | 5 (100.0%) |
| 35 to 44 Years | 15 (83.3%) | 16 (84.2%) |
| 45 to 54 Years | 1 (9.1%) | 13 (48.1%) |
| 55 to 64 Years | 8 (80.0%) | 12 (75.0%) |
| 65 to 74 Years | 7 (41.2%) | 7 (70.0%) |
| 75 Years and over | 6 (30.0%) | 8 (100.0%) |
| Total | 79 (65.8%) | 132 (79.0%) |
Income Below Poverty Among Married-Couple Families in Andersonville
The poverty statistics for married-couple families in Andersonville show that 18.5% or 5 of the total 27 families live below the poverty line. Families with 1 or 2 children have the highest poverty rate of 37.5%, comprising of 3 families. On the other hand, families with 3 or 4 children have the lowest poverty rate of 0.0%, which includes 0 families.
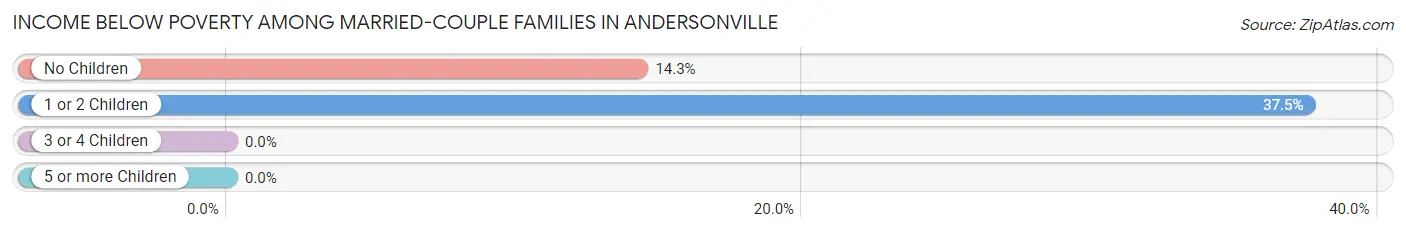
| Children | Above Poverty | Below Poverty |
| No Children | 12 (85.7%) | 2 (14.3%) |
| 1 or 2 Children | 5 (62.5%) | 3 (37.5%) |
| 3 or 4 Children | 5 (100.0%) | 0 (0.0%) |
| 5 or more Children | 0 (0.0%) | 0 (0.0%) |
| Total | 22 (81.5%) | 5 (18.5%) |
Income Below Poverty Among Single-Parent Households in Andersonville
| Children | Single Father | Single Mother |
| No Children | 0 (0.0%) | 0 (0.0%) |
| 1 or 2 Children | 0 (0.0%) | 0 (0.0%) |
| 3 or 4 Children | 0 (0.0%) | 0 (0.0%) |
| 5 or more Children | 0 (0.0%) | 0 (0.0%) |
| Total | 0 (0.0%) | 0 (0.0%) |
Income Below Poverty Among Married-Couple vs Single-Parent Households in Andersonville
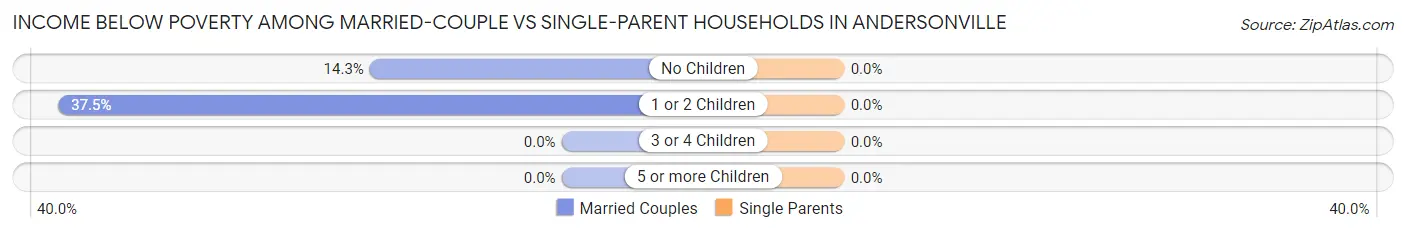
| Children | Married-Couple Families | Single-Parent Households |
| No Children | 2 (14.3%) | 0 (0.0%) |
| 1 or 2 Children | 3 (37.5%) | 0 (0.0%) |
| 3 or 4 Children | 0 (0.0%) | 0 (0.0%) |
| 5 or more Children | 0 (0.0%) | 0 (0.0%) |
| Total | 5 (18.5%) | 0 (0.0%) |
Race in Andersonville
The most populous races in Andersonville are White / Caucasian (201 | 67.9%), Black / African American (91 | 30.7%), and Hispanic or Latino (8 | 2.7%).
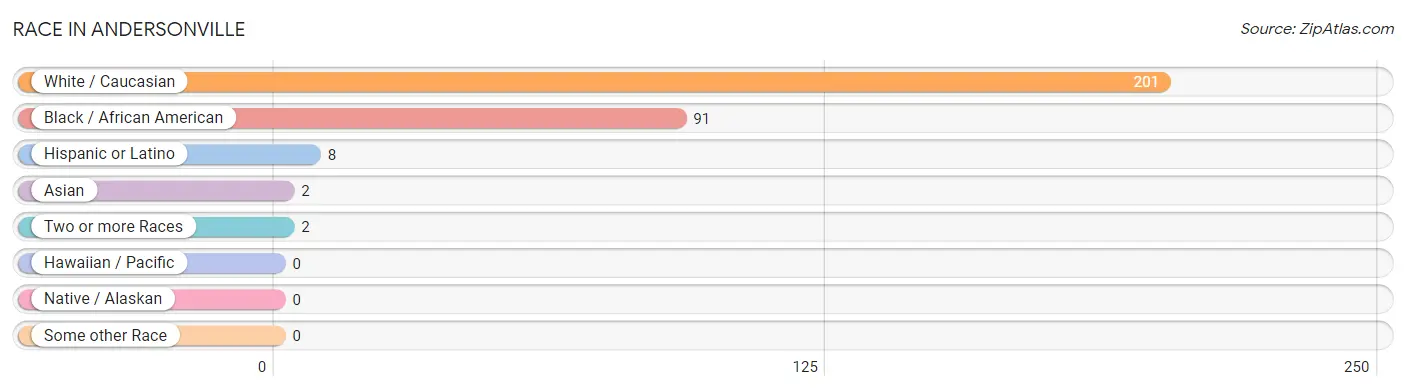
| Race | # Population | % Population |
| Asian | 2 | 0.7% |
| Black / African American | 91 | 30.7% |
| Hawaiian / Pacific | 0 | 0.0% |
| Hispanic or Latino | 8 | 2.7% |
| Native / Alaskan | 0 | 0.0% |
| White / Caucasian | 201 | 67.9% |
| Two or more Races | 2 | 0.7% |
| Some other Race | 0 | 0.0% |
| Total | 296 | 100.0% |
Ancestry in Andersonville
The most populous ancestries reported in Andersonville are English (30 | 10.1%), American (18 | 6.1%), German (15 | 5.1%), Scottish (9 | 3.0%), and Cuban (8 | 2.7%), together accounting for 27.0% of all Andersonville residents.
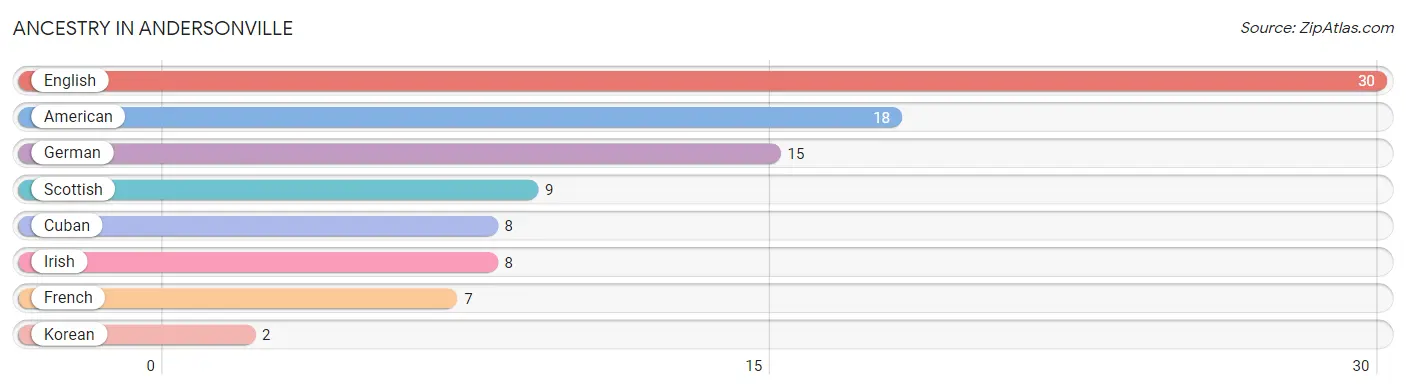
| Ancestry | # Population | % Population |
| American | 18 | 6.1% |
| Cuban | 8 | 2.7% |
| English | 30 | 10.1% |
| French | 7 | 2.4% |
| German | 15 | 5.1% |
| Irish | 8 | 2.7% |
| Korean | 2 | 0.7% |
| Scottish | 9 | 3.0% | View All 8 Rows |
Immigrants in Andersonville
The most numerous immigrant groups reported in Andersonville came from Asia (2 | 0.7%), Philippines (2 | 0.7%), and South Eastern Asia (2 | 0.7%), together accounting for 2.0% of all Andersonville residents.
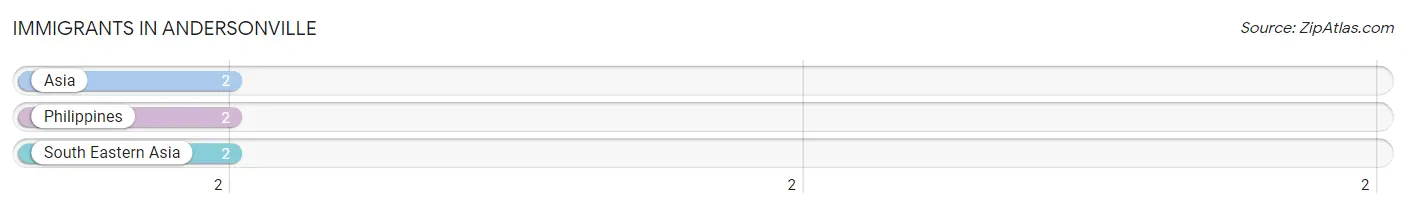
| Immigration Origin | # Population | % Population |
| Asia | 2 | 0.7% |
| Philippines | 2 | 0.7% |
| South Eastern Asia | 2 | 0.7% | View All 3 Rows |
Sex and Age in Andersonville
Sex and Age in Andersonville
The most populous age groups in Andersonville are 15 to 19 Years (21 | 17.5%) for men and 15 to 19 Years (44 | 25.0%) for women.
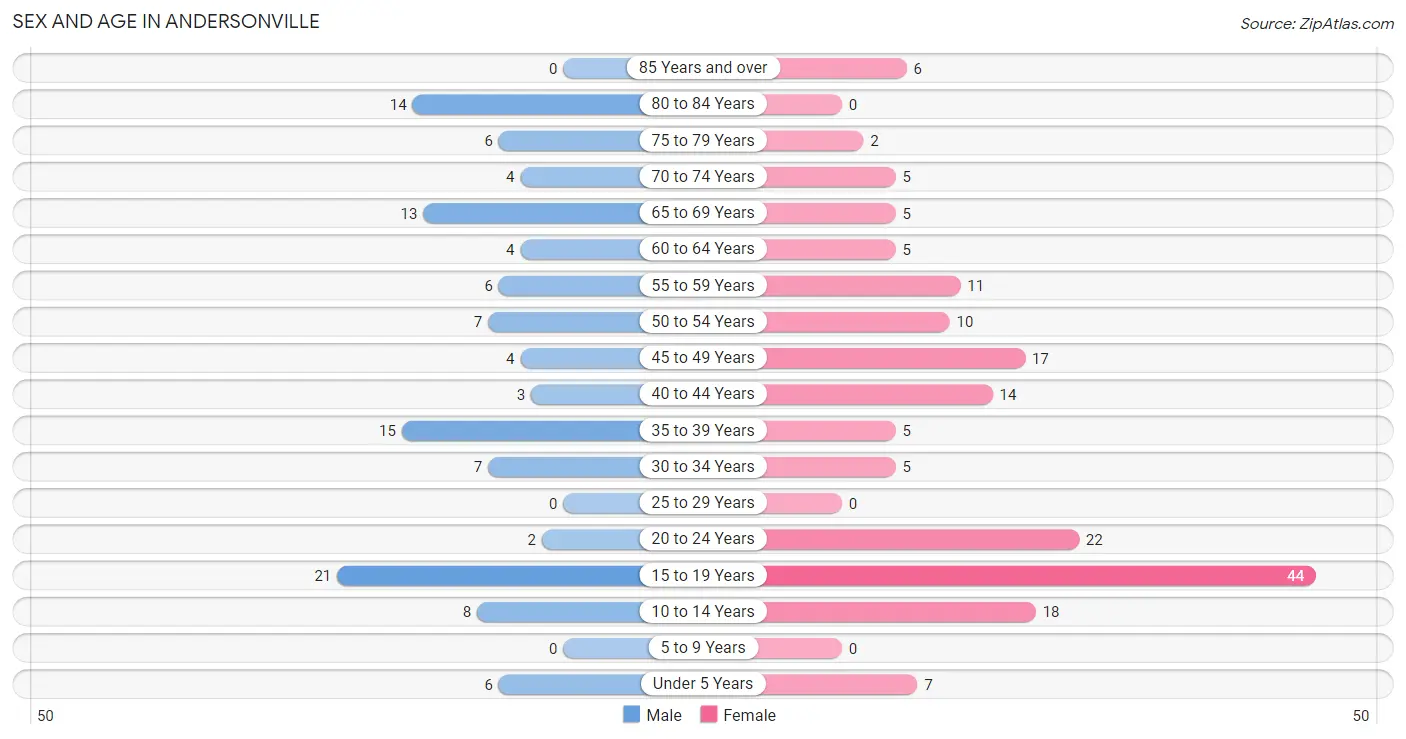
| Age Bracket | Male | Female |
| Under 5 Years | 6 (5.0%) | 7 (4.0%) |
| 5 to 9 Years | 0 (0.0%) | 0 (0.0%) |
| 10 to 14 Years | 8 (6.7%) | 18 (10.2%) |
| 15 to 19 Years | 21 (17.5%) | 44 (25.0%) |
| 20 to 24 Years | 2 (1.7%) | 22 (12.5%) |
| 25 to 29 Years | 0 (0.0%) | 0 (0.0%) |
| 30 to 34 Years | 7 (5.8%) | 5 (2.8%) |
| 35 to 39 Years | 15 (12.5%) | 5 (2.8%) |
| 40 to 44 Years | 3 (2.5%) | 14 (8.0%) |
| 45 to 49 Years | 4 (3.3%) | 17 (9.7%) |
| 50 to 54 Years | 7 (5.8%) | 10 (5.7%) |
| 55 to 59 Years | 6 (5.0%) | 11 (6.2%) |
| 60 to 64 Years | 4 (3.3%) | 5 (2.8%) |
| 65 to 69 Years | 13 (10.8%) | 5 (2.8%) |
| 70 to 74 Years | 4 (3.3%) | 5 (2.8%) |
| 75 to 79 Years | 6 (5.0%) | 2 (1.1%) |
| 80 to 84 Years | 14 (11.7%) | 0 (0.0%) |
| 85 Years and over | 0 (0.0%) | 6 (3.4%) |
| Total | 120 (100.0%) | 176 (100.0%) |
Families and Households in Andersonville
Median Family Size in Andersonville
The median family size in Andersonville is 3.76 persons per family, with single male/father families (9 | 16.4%) accounting for the largest median family size of 4.78 persons per family. On the other hand, single female/mother families (19 | 34.5%) represent the smallest median family size with 3.26 persons per family.
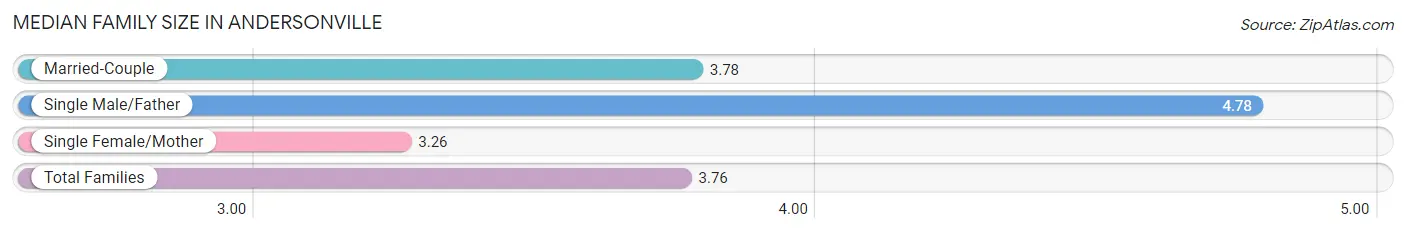
| Family Type | # Families | Family Size |
| Married-Couple | 27 (49.1%) | 3.78 |
| Single Male/Father | 9 (16.4%) | 4.78 |
| Single Female/Mother | 19 (34.5%) | 3.26 |
| Total Families | 55 (100.0%) | 3.76 |
Median Household Size in Andersonville
The median household size in Andersonville is 2.45 persons per household, with single male/father households (9 | 7.4%) accounting for the largest median household size of 4.78 persons per household. non-family households (66 | 54.5%) represent the smallest median household size with 1.21 persons per household.
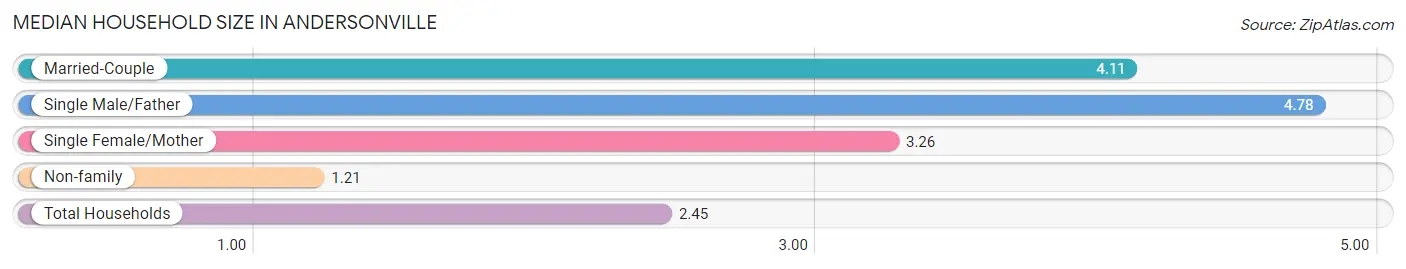
| Household Type | # Households | Household Size |
| Married-Couple | 27 (22.3%) | 4.11 |
| Single Male/Father | 9 (7.4%) | 4.78 |
| Single Female/Mother | 19 (15.7%) | 3.26 |
| Non-family | 66 (54.5%) | 1.21 |
| Total Households | 121 (100.0%) | 2.45 |
Household Size by Marriage Status in Andersonville
Out of a total of 121 households in Andersonville, 55 (45.5%) are family households, while 66 (54.5%) are nonfamily households. The most numerous type of family households are 2-person households, comprising 23, and the most common type of nonfamily households are 1-person households, comprising 54.
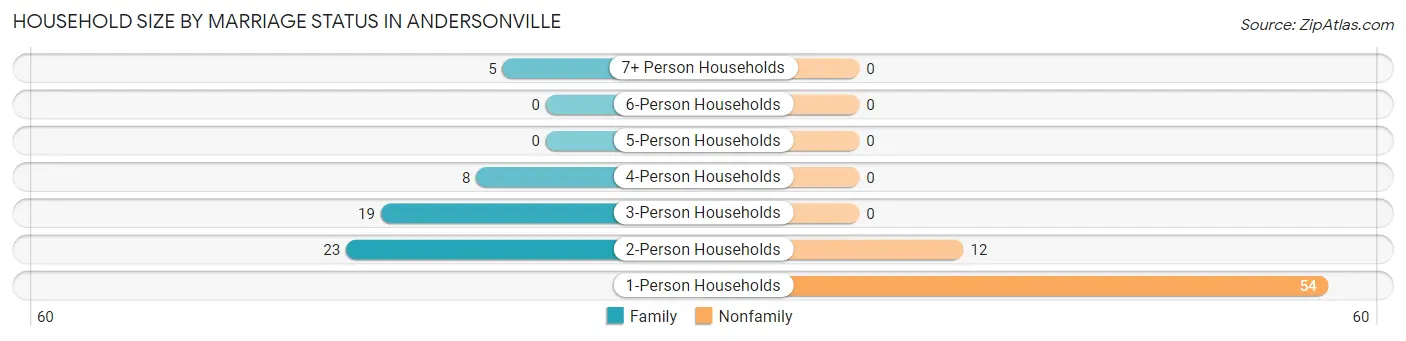
| Household Size | Family Households | Nonfamily Households |
| 1-Person Households | - | 54 (44.6%) |
| 2-Person Households | 23 (19.0%) | 12 (9.9%) |
| 3-Person Households | 19 (15.7%) | 0 (0.0%) |
| 4-Person Households | 8 (6.6%) | 0 (0.0%) |
| 5-Person Households | 0 (0.0%) | 0 (0.0%) |
| 6-Person Households | 0 (0.0%) | 0 (0.0%) |
| 7+ Person Households | 5 (4.1%) | 0 (0.0%) |
| Total | 55 (45.5%) | 66 (54.5%) |
Female Fertility in Andersonville
Fertility by Age in Andersonville
Average fertility rate in Andersonville is 19.0 births per 1,000 women. Women in the age bracket of 20 to 34 years have the highest fertility rate with 74.0 births per 1,000 women. Women in the age bracket of 20 to 34 years acount for 100.0% of all women with births.
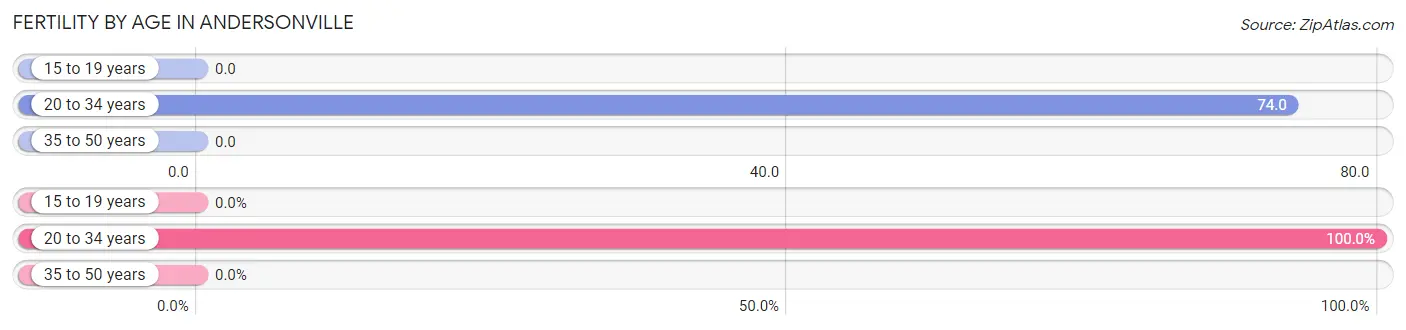
| Age Bracket | Women with Births | Births / 1,000 Women |
| 15 to 19 years | 0 (0.0%) | 0.0 |
| 20 to 34 years | 2 (100.0%) | 74.0 |
| 35 to 50 years | 0 (0.0%) | 0.0 |
| Total | 2 (100.0%) | 19.0 |
Fertility by Age by Marriage Status in Andersonville
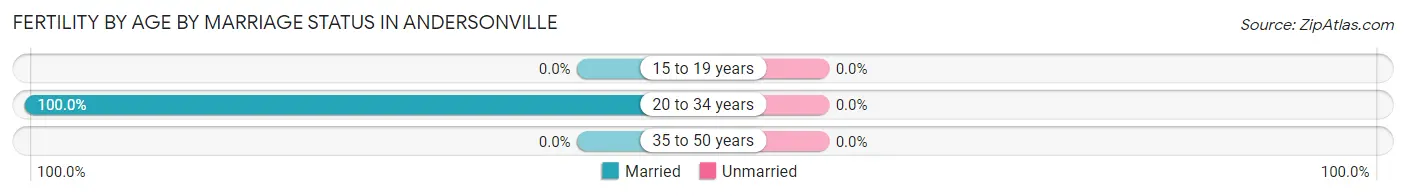
| Age Bracket | Married | Unmarried |
| 15 to 19 years | 0 (0.0%) | 0 (0.0%) |
| 20 to 34 years | 2 (100.0%) | 0 (0.0%) |
| 35 to 50 years | 0 (0.0%) | 0 (0.0%) |
| Total | 2 (100.0%) | 0 (0.0%) |
Fertility by Education in Andersonville
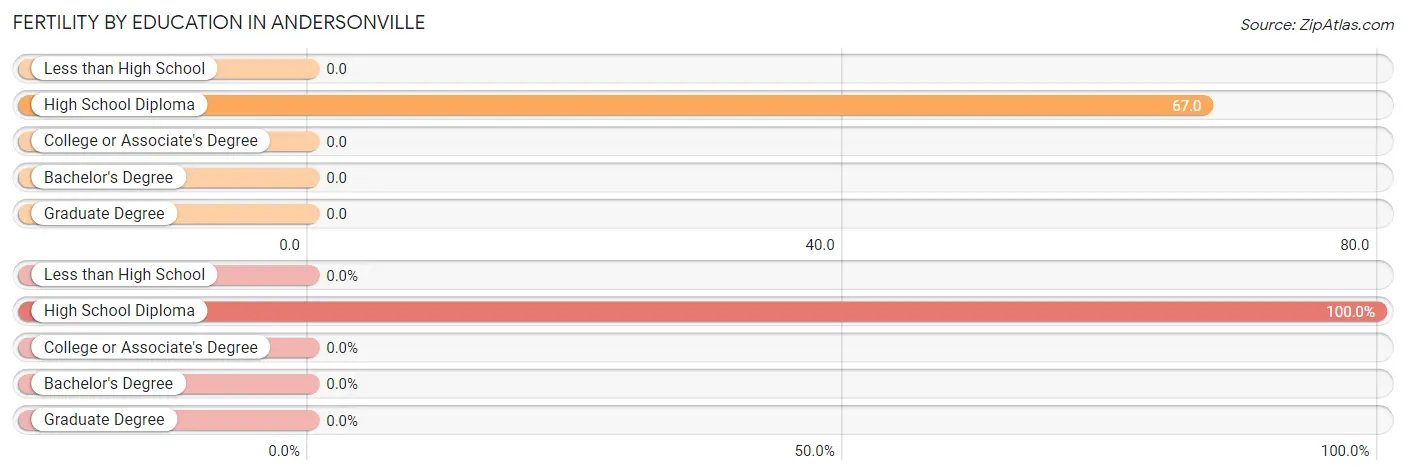
| Educational Attainment | Women with Births | Births / 1,000 Women |
| Less than High School | 0 (0.0%) | 0.0 |
| High School Diploma | 2 (100.0%) | 67.0 |
| College or Associate's Degree | 0 (0.0%) | 0.0 |
| Bachelor's Degree | 0 (0.0%) | 0.0 |
| Graduate Degree | 0 (0.0%) | 0.0 |
| Total | 2 (100.0%) | 19.0 |
Fertility by Education by Marriage Status in Andersonville
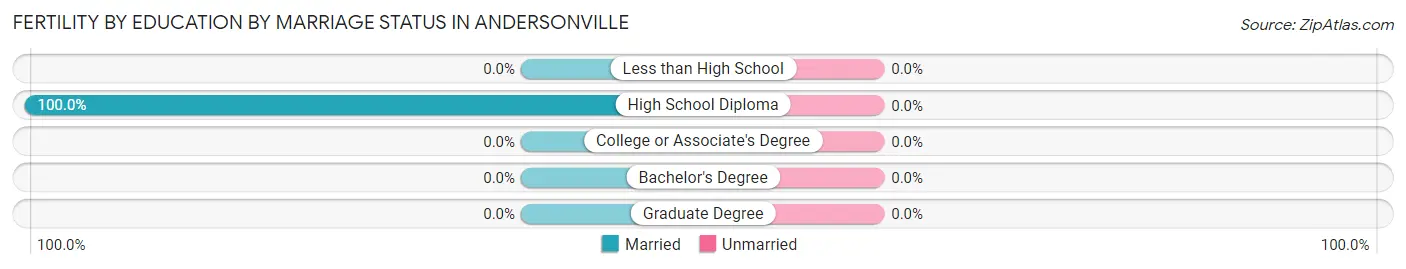
| Educational Attainment | Married | Unmarried |
| Less than High School | 0 (0.0%) | 0 (0.0%) |
| High School Diploma | 2 (100.0%) | 0 (0.0%) |
| College or Associate's Degree | 0 (0.0%) | 0 (0.0%) |
| Bachelor's Degree | 0 (0.0%) | 0 (0.0%) |
| Graduate Degree | 0 (0.0%) | 0 (0.0%) |
| Total | 2 (100.0%) | 0 (0.0%) |
Employment Characteristics in Andersonville
Employment by Class of Employer in Andersonville
Among the 84 employed individuals in Andersonville, private company employees (55 | 65.5%), local government employees (14 | 16.7%), and self-employed (incorporated) (5 | 5.9%) make up the most common classes of employment.
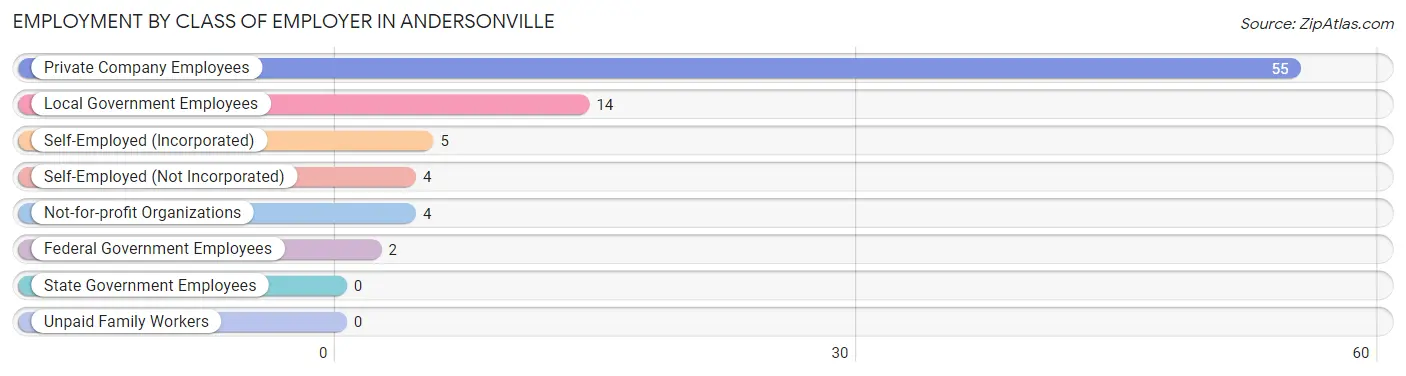
| Employer Class | # Employees | % Employees |
| Private Company Employees | 55 | 65.5% |
| Self-Employed (Incorporated) | 5 | 5.9% |
| Self-Employed (Not Incorporated) | 4 | 4.8% |
| Not-for-profit Organizations | 4 | 4.8% |
| Local Government Employees | 14 | 16.7% |
| State Government Employees | 0 | 0.0% |
| Federal Government Employees | 2 | 2.4% |
| Unpaid Family Workers | 0 | 0.0% |
| Total | 84 | 100.0% |
Employment Status by Age in Andersonville
According to the labor force statistics for Andersonville, out of the total population over 16 years of age (233), 42.9% or 100 individuals are in the labor force, with 10.0% or 10 of them unemployed. The age group with the highest labor force participation rate is 20 to 24 years, with 91.7% or 22 individuals in the labor force. Within the labor force, the 20 to 24 years age range has the highest percentage of unemployed individuals, with 36.4% or 8 of them being unemployed.
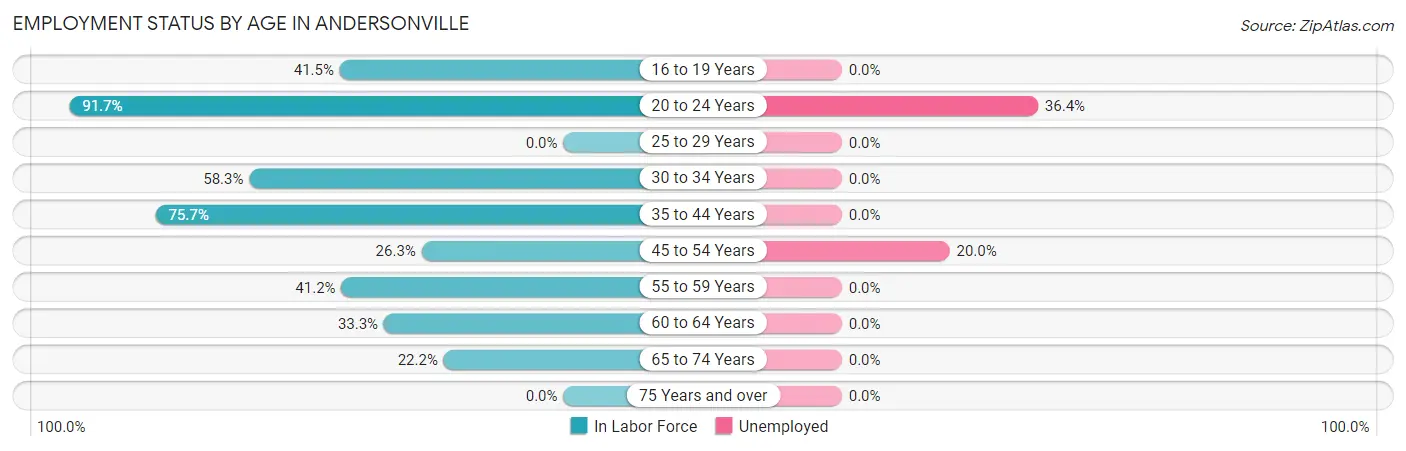
| Age Bracket | In Labor Force | Unemployed |
| 16 to 19 Years | 17 (41.5%) | 0 (0.0%) |
| 20 to 24 Years | 22 (91.7%) | 8 (36.4%) |
| 25 to 29 Years | 0 (0.0%) | 0 (0.0%) |
| 30 to 34 Years | 7 (58.3%) | 0 (0.0%) |
| 35 to 44 Years | 28 (75.7%) | 0 (0.0%) |
| 45 to 54 Years | 10 (26.3%) | 2 (20.0%) |
| 55 to 59 Years | 7 (41.2%) | 0 (0.0%) |
| 60 to 64 Years | 3 (33.3%) | 0 (0.0%) |
| 65 to 74 Years | 6 (22.2%) | 0 (0.0%) |
| 75 Years and over | 0 (0.0%) | 0 (0.0%) |
| Total | 100 (42.9%) | 10 (10.0%) |
Employment Status by Educational Attainment in Andersonville
According to labor force statistics for Andersonville, 48.7% of individuals (55) out of the total population between 25 and 64 years of age (113) are in the labor force, with 3.6% or 2 of them being unemployed. The group with the highest labor force participation rate are those with the educational attainment of college / associate degree, with 57.1% or 8 individuals in the labor force. Within the labor force, individuals with bachelor's degree or higher education have the highest percentage of unemployment, with 100.0% or 2 of them being unemployed.
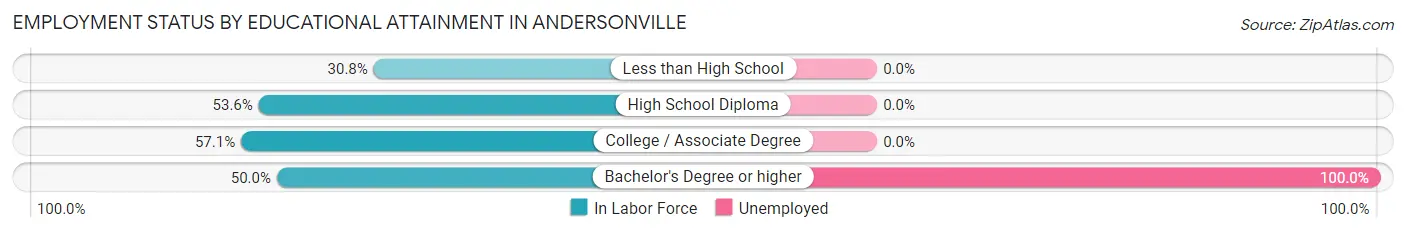
| Educational Attainment | In Labor Force | Unemployed |
| Less than High School | 8 (30.8%) | 0 (0.0%) |
| High School Diploma | 37 (53.6%) | 0 (0.0%) |
| College / Associate Degree | 8 (57.1%) | 0 (0.0%) |
| Bachelor's Degree or higher | 2 (50.0%) | 4 (100.0%) |
| Total | 55 (48.7%) | 4 (3.6%) |
Employment Occupations by Sex in Andersonville
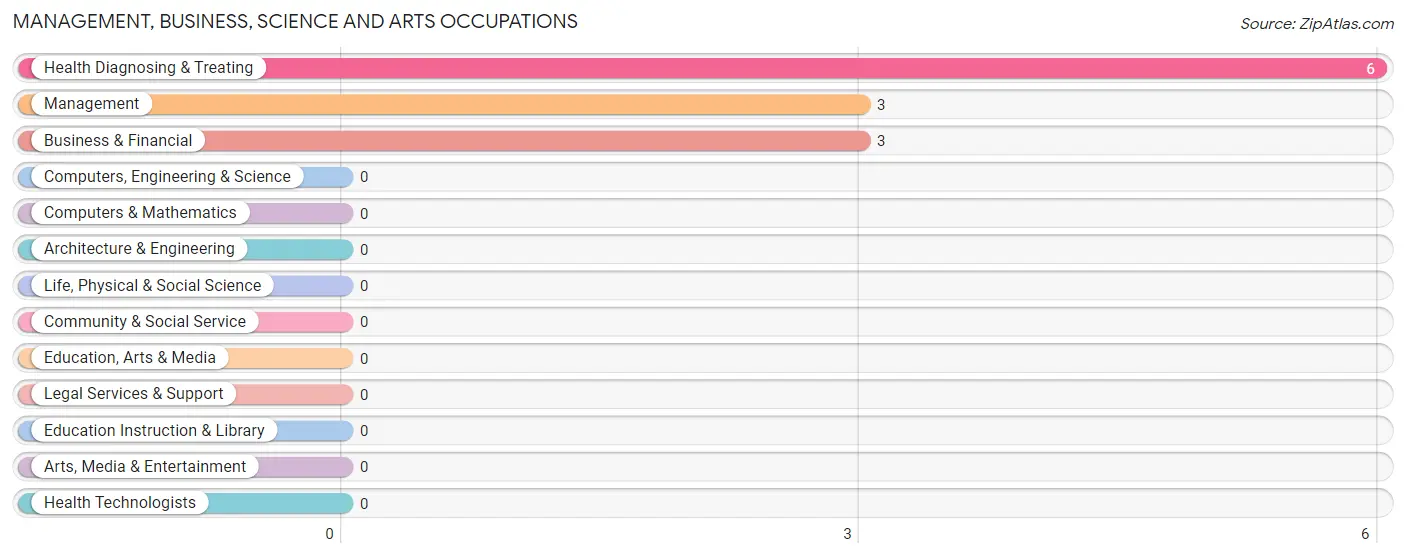
Management, Business, Science and Arts Occupations
The most common Management, Business, Science and Arts occupations in Andersonville are Health Diagnosing & Treating (6 | 6.7%), Management (3 | 3.3%), and Business & Financial (3 | 3.3%).
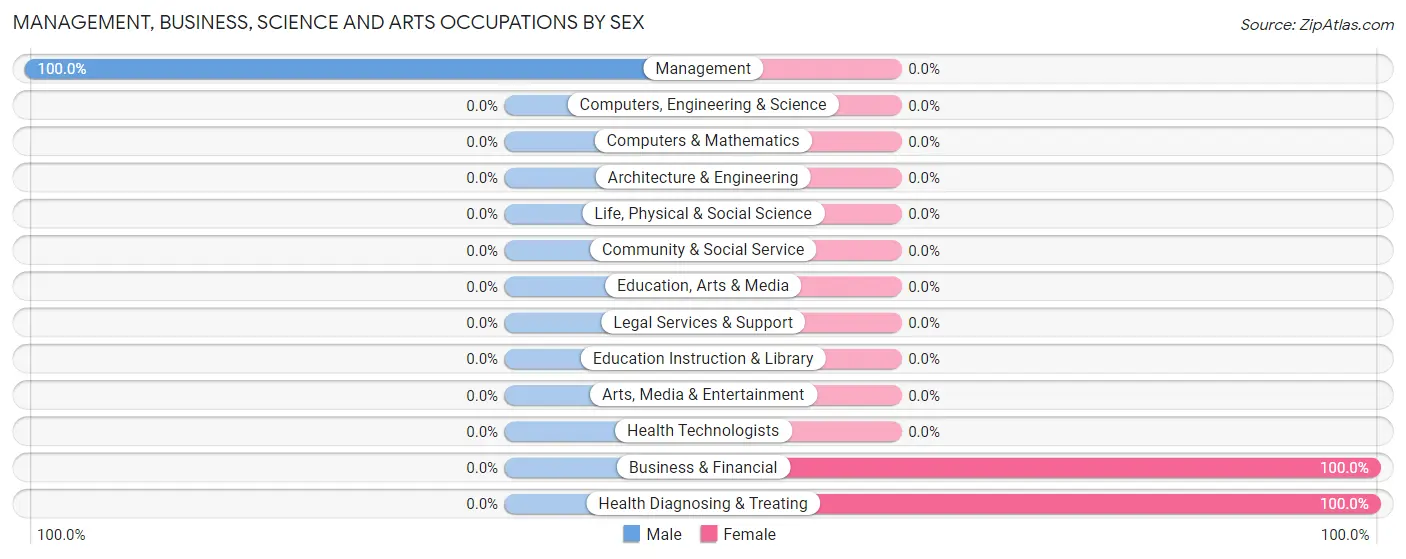
Management, Business, Science and Arts Occupations by Sex
| Occupation | Male | Female |
| Management | 3 (100.0%) | 0 (0.0%) |
| Business & Financial | 0 (0.0%) | 3 (100.0%) |
| Computers, Engineering & Science | 0 (0.0%) | 0 (0.0%) |
| Computers & Mathematics | 0 (0.0%) | 0 (0.0%) |
| Architecture & Engineering | 0 (0.0%) | 0 (0.0%) |
| Life, Physical & Social Science | 0 (0.0%) | 0 (0.0%) |
| Community & Social Service | 0 (0.0%) | 0 (0.0%) |
| Education, Arts & Media | 0 (0.0%) | 0 (0.0%) |
| Legal Services & Support | 0 (0.0%) | 0 (0.0%) |
| Education Instruction & Library | 0 (0.0%) | 0 (0.0%) |
| Arts, Media & Entertainment | 0 (0.0%) | 0 (0.0%) |
| Health Diagnosing & Treating | 0 (0.0%) | 6 (100.0%) |
| Health Technologists | 0 (0.0%) | 0 (0.0%) |
| Total (Category) | 3 (25.0%) | 9 (75.0%) |
| Total (Overall) | 30 (33.3%) | 60 (66.7%) |
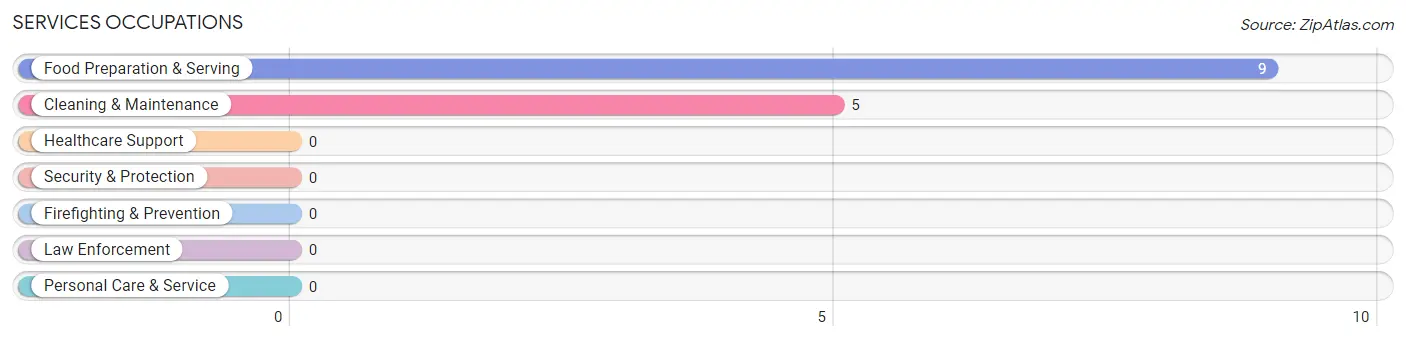
Services Occupations
The most common Services occupations in Andersonville are Food Preparation & Serving (9 | 10.0%), and Cleaning & Maintenance (5 | 5.6%).
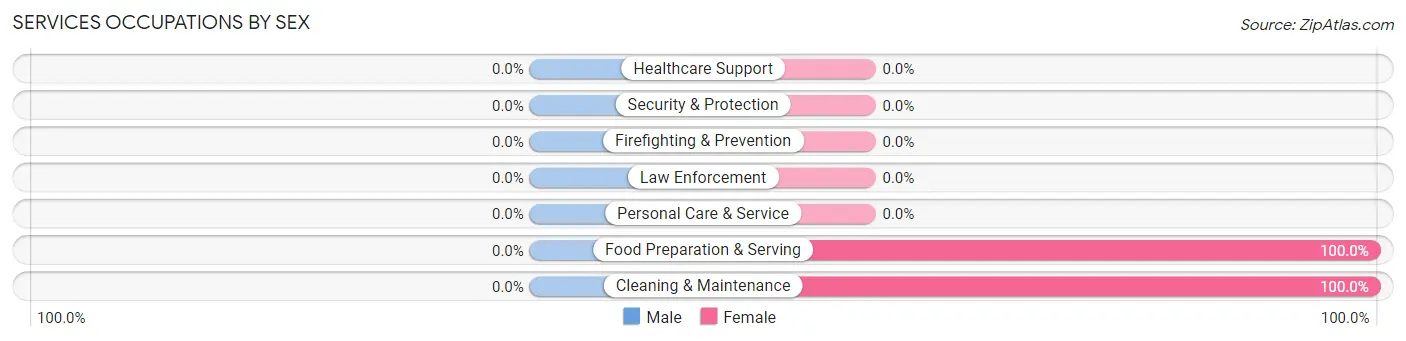
Services Occupations by Sex
| Occupation | Male | Female |
| Healthcare Support | 0 (0.0%) | 0 (0.0%) |
| Security & Protection | 0 (0.0%) | 0 (0.0%) |
| Firefighting & Prevention | 0 (0.0%) | 0 (0.0%) |
| Law Enforcement | 0 (0.0%) | 0 (0.0%) |
| Food Preparation & Serving | 0 (0.0%) | 9 (100.0%) |
| Cleaning & Maintenance | 0 (0.0%) | 5 (100.0%) |
| Personal Care & Service | 0 (0.0%) | 0 (0.0%) |
| Total (Category) | 0 (0.0%) | 14 (100.0%) |
| Total (Overall) | 30 (33.3%) | 60 (66.7%) |
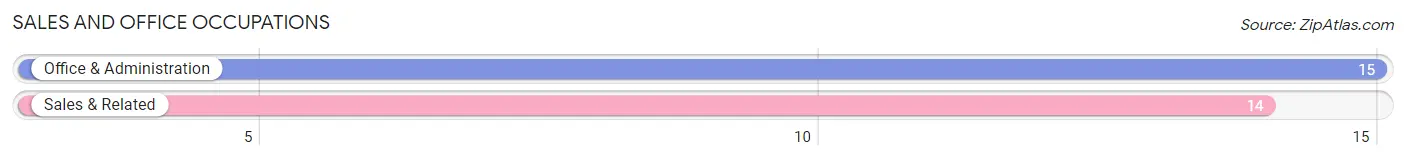
Sales and Office Occupations
The most common Sales and Office occupations in Andersonville are Office & Administration (15 | 16.7%), and Sales & Related (14 | 15.6%).
Sales and Office Occupations by Sex
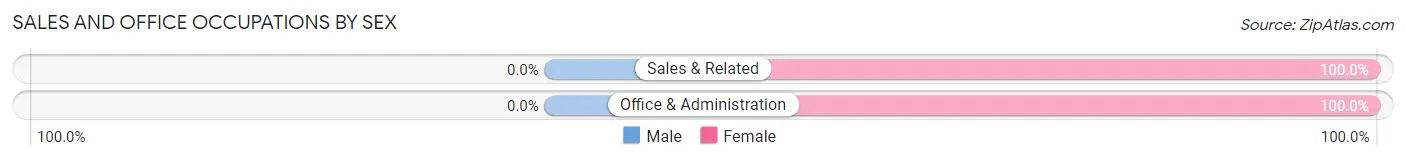
| Occupation | Male | Female |
| Sales & Related | 0 (0.0%) | 14 (100.0%) |
| Office & Administration | 0 (0.0%) | 15 (100.0%) |
| Total (Category) | 0 (0.0%) | 29 (100.0%) |
| Total (Overall) | 30 (33.3%) | 60 (66.7%) |
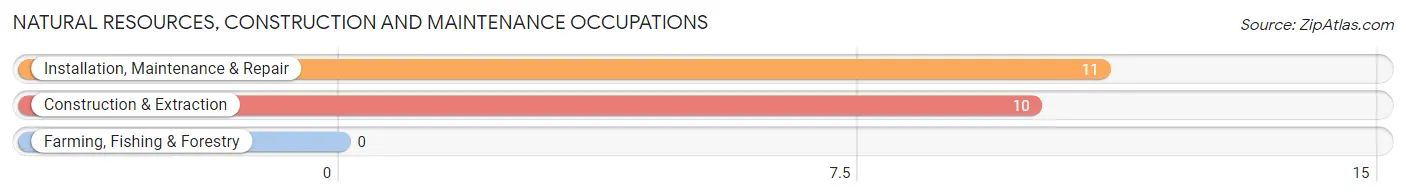
Natural Resources, Construction and Maintenance Occupations
The most common Natural Resources, Construction and Maintenance occupations in Andersonville are Installation, Maintenance & Repair (11 | 12.2%), and Construction & Extraction (10 | 11.1%).
Natural Resources, Construction and Maintenance Occupations by Sex
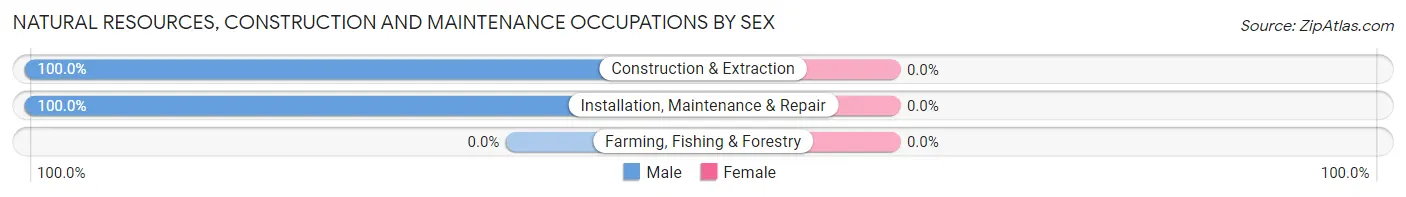
| Occupation | Male | Female |
| Farming, Fishing & Forestry | 0 (0.0%) | 0 (0.0%) |
| Construction & Extraction | 10 (100.0%) | 0 (0.0%) |
| Installation, Maintenance & Repair | 11 (100.0%) | 0 (0.0%) |
| Total (Category) | 21 (100.0%) | 0 (0.0%) |
| Total (Overall) | 30 (33.3%) | 60 (66.7%) |
Production, Transportation and Moving Occupations
The most common Production, Transportation and Moving occupations in Andersonville are Material Moving (6 | 6.7%), Production (5 | 5.6%), and Transportation (3 | 3.3%).
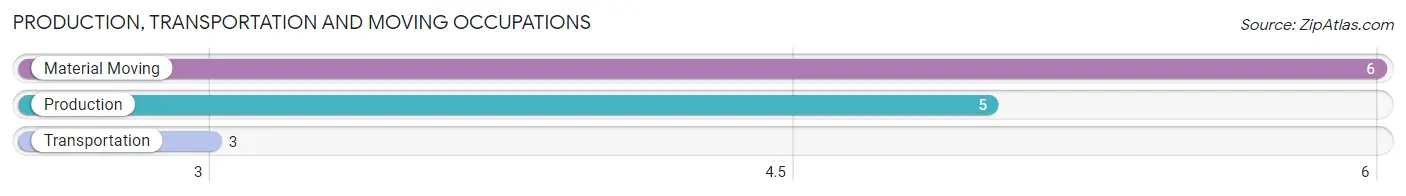
Production, Transportation and Moving Occupations by Sex
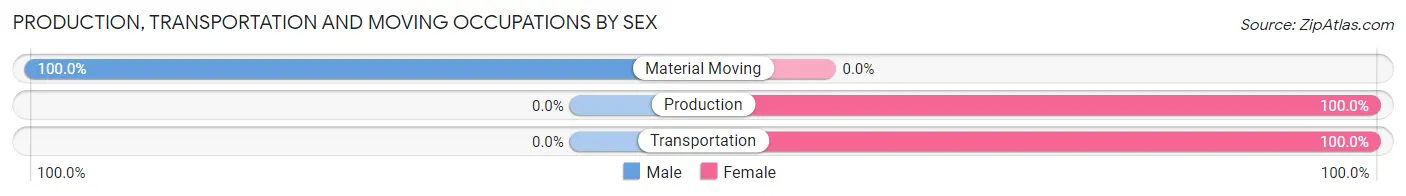
| Occupation | Male | Female |
| Production | 0 (0.0%) | 5 (100.0%) |
| Transportation | 0 (0.0%) | 3 (100.0%) |
| Material Moving | 6 (100.0%) | 0 (0.0%) |
| Total (Category) | 6 (42.9%) | 8 (57.1%) |
| Total (Overall) | 30 (33.3%) | 60 (66.7%) |
Employment Industries by Sex in Andersonville
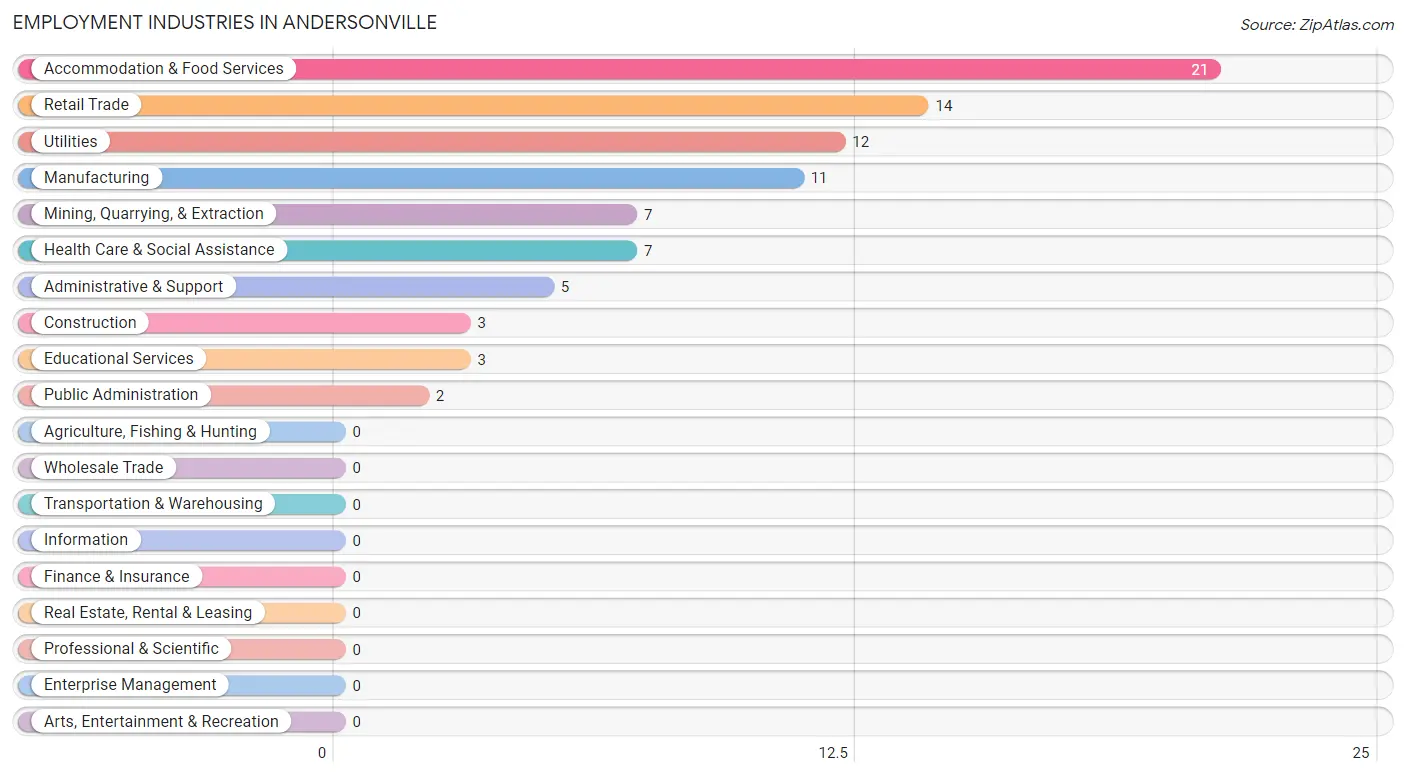
Employment Industries in Andersonville
The major employment industries in Andersonville include Accommodation & Food Services (21 | 23.3%), Retail Trade (14 | 15.6%), Utilities (12 | 13.3%), Manufacturing (11 | 12.2%), and Mining, Quarrying, & Extraction (7 | 7.8%).
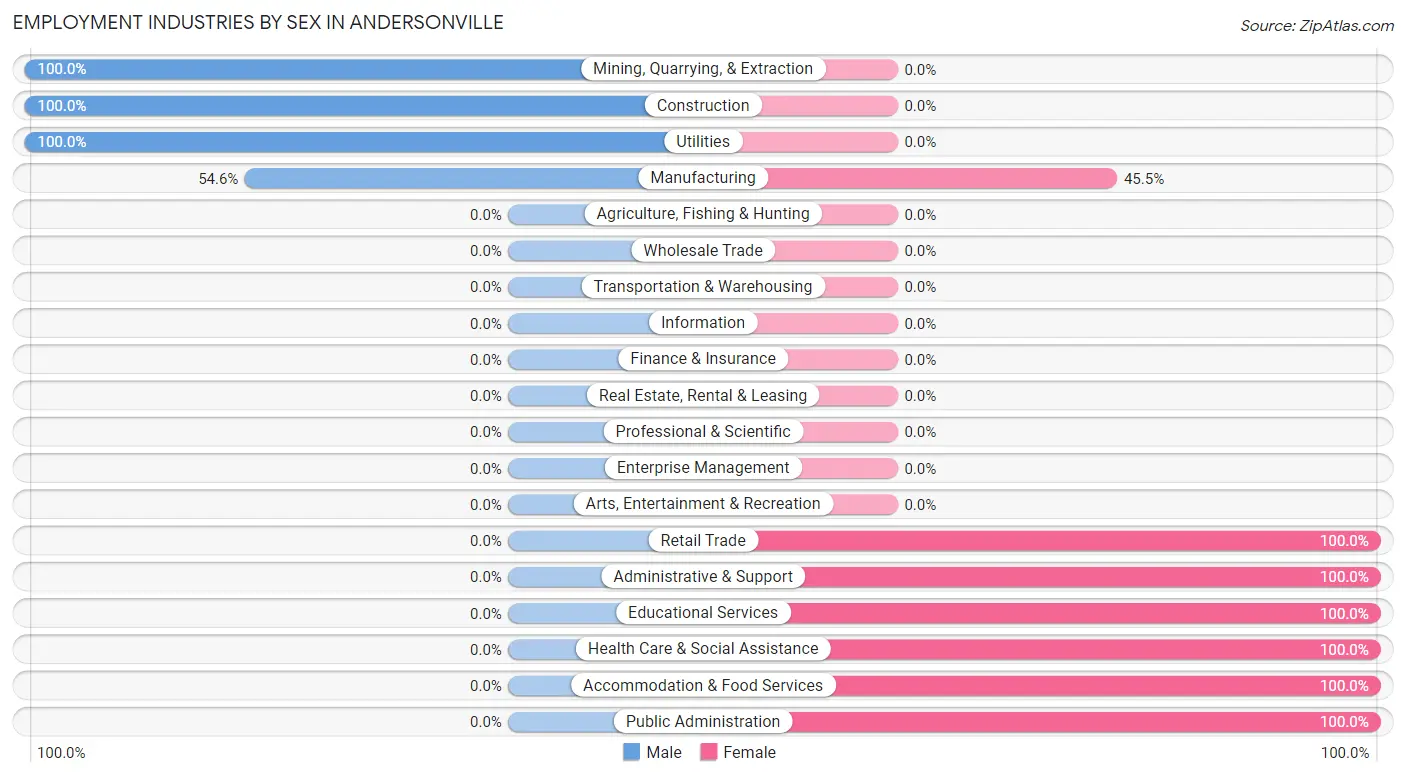
Employment Industries by Sex in Andersonville
The Andersonville industries that see more men than women are Mining, Quarrying, & Extraction (100.0%), Construction (100.0%), and Utilities (100.0%), whereas the industries that tend to have a higher number of women are Retail Trade (100.0%), Administrative & Support (100.0%), and Educational Services (100.0%).
| Industry | Male | Female |
| Agriculture, Fishing & Hunting | 0 (0.0%) | 0 (0.0%) |
| Mining, Quarrying, & Extraction | 7 (100.0%) | 0 (0.0%) |
| Construction | 3 (100.0%) | 0 (0.0%) |
| Manufacturing | 6 (54.5%) | 5 (45.5%) |
| Wholesale Trade | 0 (0.0%) | 0 (0.0%) |
| Retail Trade | 0 (0.0%) | 14 (100.0%) |
| Transportation & Warehousing | 0 (0.0%) | 0 (0.0%) |
| Utilities | 12 (100.0%) | 0 (0.0%) |
| Information | 0 (0.0%) | 0 (0.0%) |
| Finance & Insurance | 0 (0.0%) | 0 (0.0%) |
| Real Estate, Rental & Leasing | 0 (0.0%) | 0 (0.0%) |
| Professional & Scientific | 0 (0.0%) | 0 (0.0%) |
| Enterprise Management | 0 (0.0%) | 0 (0.0%) |
| Administrative & Support | 0 (0.0%) | 5 (100.0%) |
| Educational Services | 0 (0.0%) | 3 (100.0%) |
| Health Care & Social Assistance | 0 (0.0%) | 7 (100.0%) |
| Arts, Entertainment & Recreation | 0 (0.0%) | 0 (0.0%) |
| Accommodation & Food Services | 0 (0.0%) | 21 (100.0%) |
| Public Administration | 0 (0.0%) | 2 (100.0%) |
| Total | 30 (33.3%) | 60 (66.7%) |
Education in Andersonville
School Enrollment in Andersonville
The most common levels of schooling among the 116 students in Andersonville are high school (50 | 43.1%), middle school (37 | 31.9%), and college / undergraduate (17 | 14.7%).
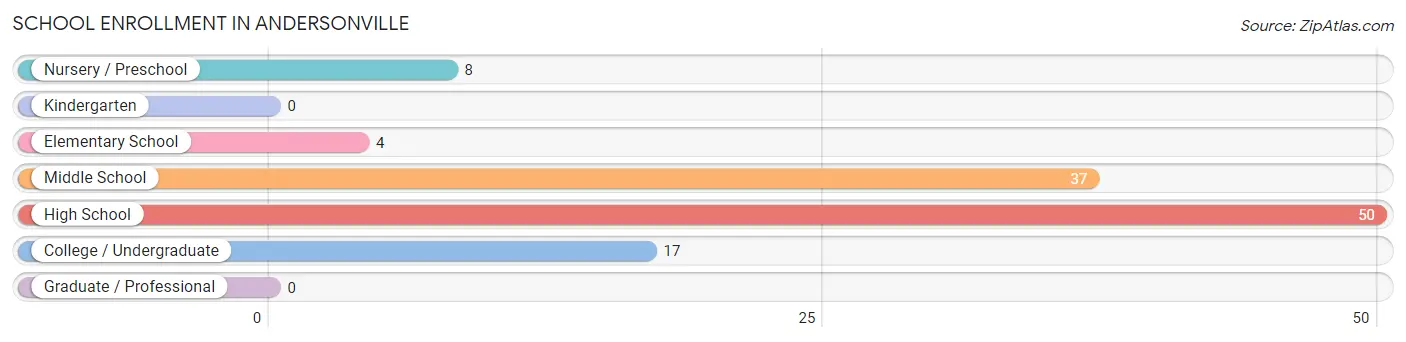
| School Level | # Students | % Students |
| Nursery / Preschool | 8 | 6.9% |
| Kindergarten | 0 | 0.0% |
| Elementary School | 4 | 3.5% |
| Middle School | 37 | 31.9% |
| High School | 50 | 43.1% |
| College / Undergraduate | 17 | 14.7% |
| Graduate / Professional | 0 | 0.0% |
| Total | 116 | 100.0% |
School Enrollment by Age by Funding Source in Andersonville
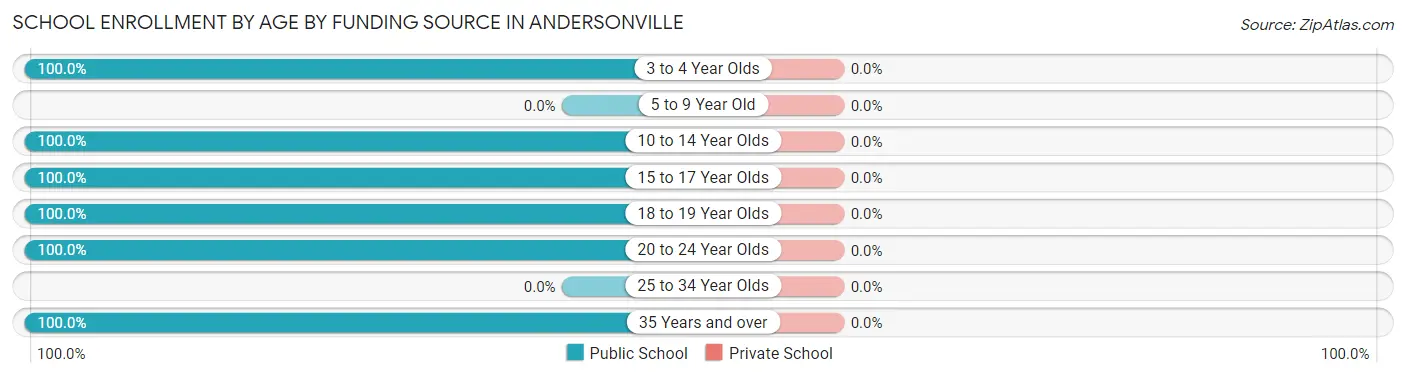
| Age Bracket | Public School | Private School |
| 3 to 4 Year Olds | 8 (100.0%) | 0 (0.0%) |
| 5 to 9 Year Old | 0 (0.0%) | 0 (0.0%) |
| 10 to 14 Year Olds | 26 (100.0%) | 0 (0.0%) |
| 15 to 17 Year Olds | 48 (100.0%) | 0 (0.0%) |
| 18 to 19 Year Olds | 17 (100.0%) | 0 (0.0%) |
| 20 to 24 Year Olds | 12 (100.0%) | 0 (0.0%) |
| 25 to 34 Year Olds | 0 (0.0%) | 0 (0.0%) |
| 35 Years and over | 5 (100.0%) | 0 (0.0%) |
| Total | 116 (100.0%) | 0 (0.0%) |
Educational Attainment by Field of Study in Andersonville
Computers & mathematics (2 | 25.0%), social sciences (2 | 25.0%), literature & languages (2 | 25.0%), and arts & humanities (2 | 25.0%) are the most common fields of study among 8 individuals in Andersonville who have obtained a bachelor's degree or higher.
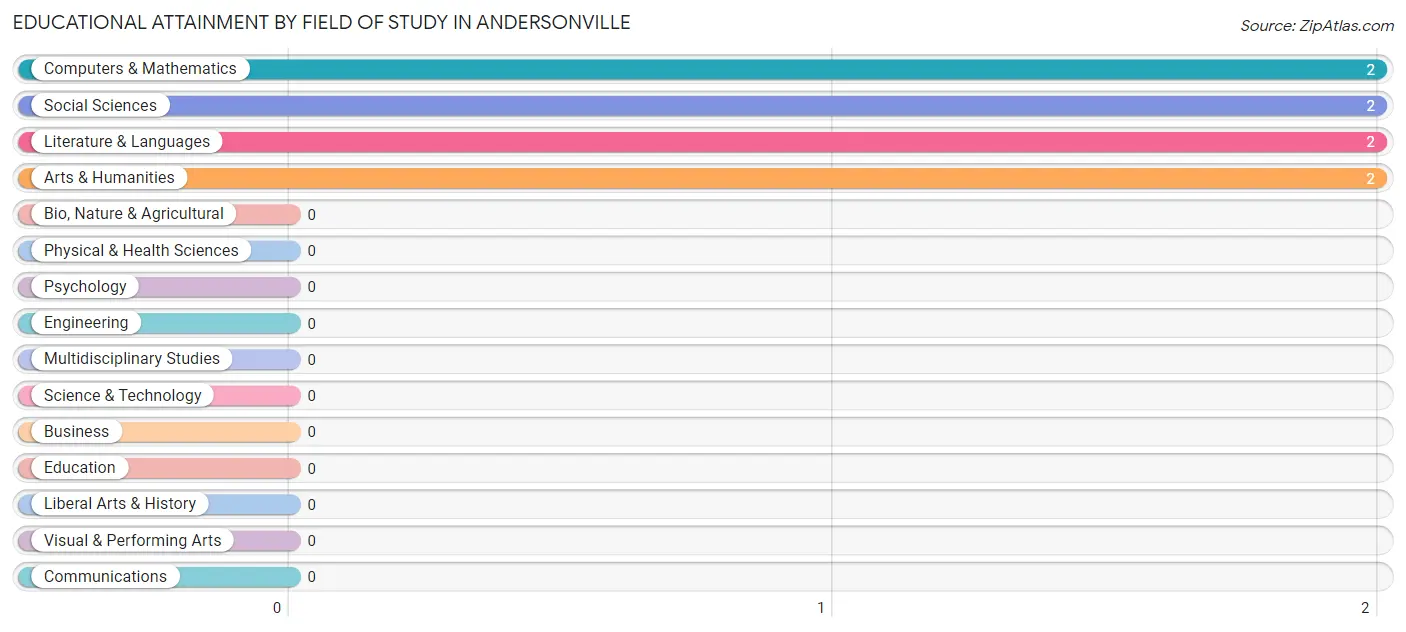
| Field of Study | # Graduates | % Graduates |
| Computers & Mathematics | 2 | 25.0% |
| Bio, Nature & Agricultural | 0 | 0.0% |
| Physical & Health Sciences | 0 | 0.0% |
| Psychology | 0 | 0.0% |
| Social Sciences | 2 | 25.0% |
| Engineering | 0 | 0.0% |
| Multidisciplinary Studies | 0 | 0.0% |
| Science & Technology | 0 | 0.0% |
| Business | 0 | 0.0% |
| Education | 0 | 0.0% |
| Literature & Languages | 2 | 25.0% |
| Liberal Arts & History | 0 | 0.0% |
| Visual & Performing Arts | 0 | 0.0% |
| Communications | 0 | 0.0% |
| Arts & Humanities | 2 | 25.0% |
| Total | 8 | 100.0% |
Transportation & Commute in Andersonville
Vehicle Availability by Sex in Andersonville
The most prevalent vehicle ownership categories in Andersonville are males with 3 vehicles (16, accounting for 53.3%) and females with 3 vehicles (5, making up 29.6%).
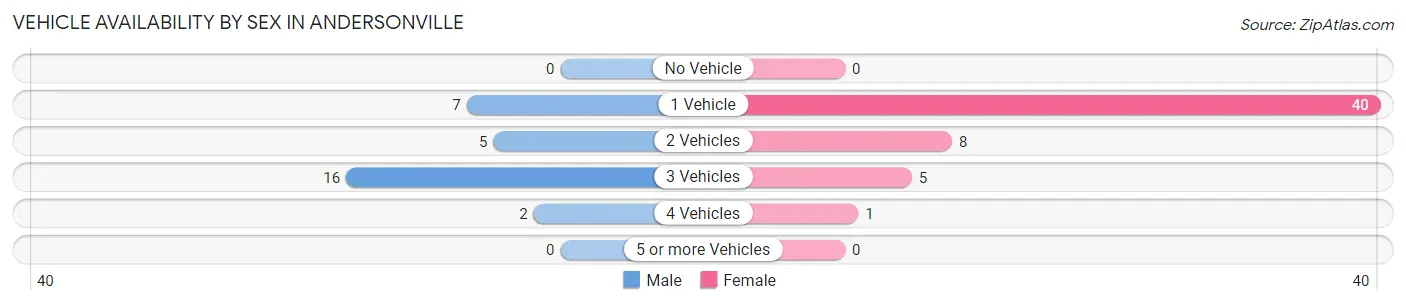
| Vehicles Available | Male | Female |
| No Vehicle | 0 (0.0%) | 0 (0.0%) |
| 1 Vehicle | 7 (23.3%) | 40 (74.1%) |
| 2 Vehicles | 5 (16.7%) | 8 (14.8%) |
| 3 Vehicles | 16 (53.3%) | 5 (9.3%) |
| 4 Vehicles | 2 (6.7%) | 1 (1.8%) |
| 5 or more Vehicles | 0 (0.0%) | 0 (0.0%) |
| Total | 30 (100.0%) | 54 (100.0%) |
Commute Time in Andersonville
The most frequently occuring commute durations in Andersonville are 15 to 19 minutes (37 commuters, 45.1%), less than 5 minutes (12 commuters, 14.6%), and 5 to 9 minutes (9 commuters, 11.0%).
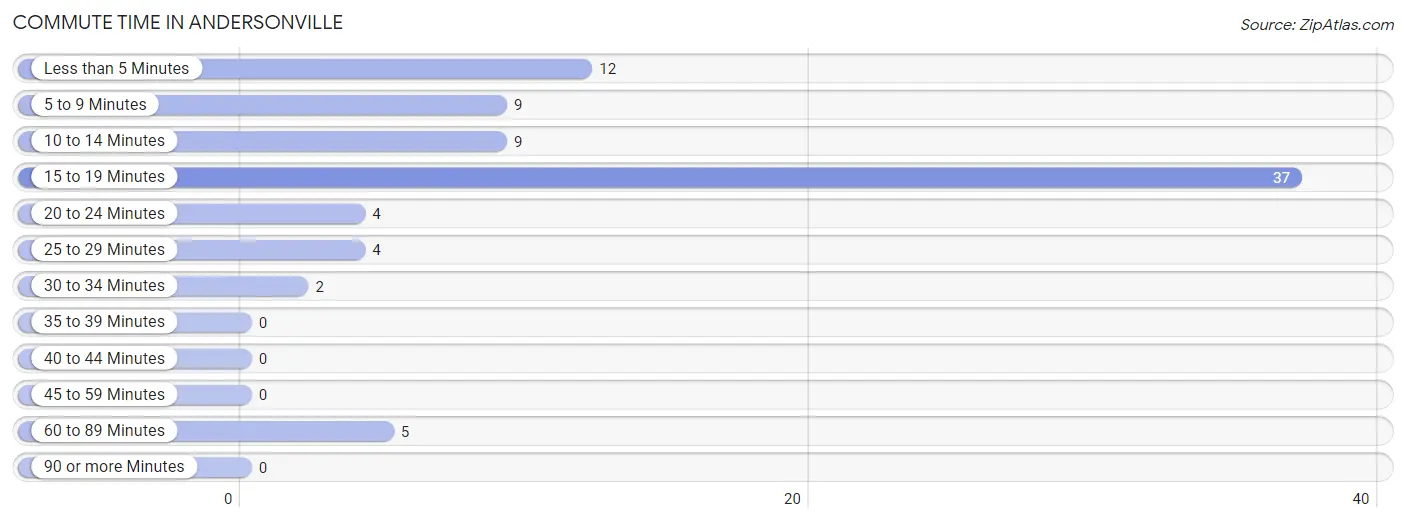
| Commute Time | # Commuters | % Commuters |
| Less than 5 Minutes | 12 | 14.6% |
| 5 to 9 Minutes | 9 | 11.0% |
| 10 to 14 Minutes | 9 | 11.0% |
| 15 to 19 Minutes | 37 | 45.1% |
| 20 to 24 Minutes | 4 | 4.9% |
| 25 to 29 Minutes | 4 | 4.9% |
| 30 to 34 Minutes | 2 | 2.4% |
| 35 to 39 Minutes | 0 | 0.0% |
| 40 to 44 Minutes | 0 | 0.0% |
| 45 to 59 Minutes | 0 | 0.0% |
| 60 to 89 Minutes | 5 | 6.1% |
| 90 or more Minutes | 0 | 0.0% |
Commute Time by Sex in Andersonville
The most common commute times in Andersonville are 15 to 19 minutes (14 commuters, 46.7%) for males and 15 to 19 minutes (23 commuters, 44.2%) for females.
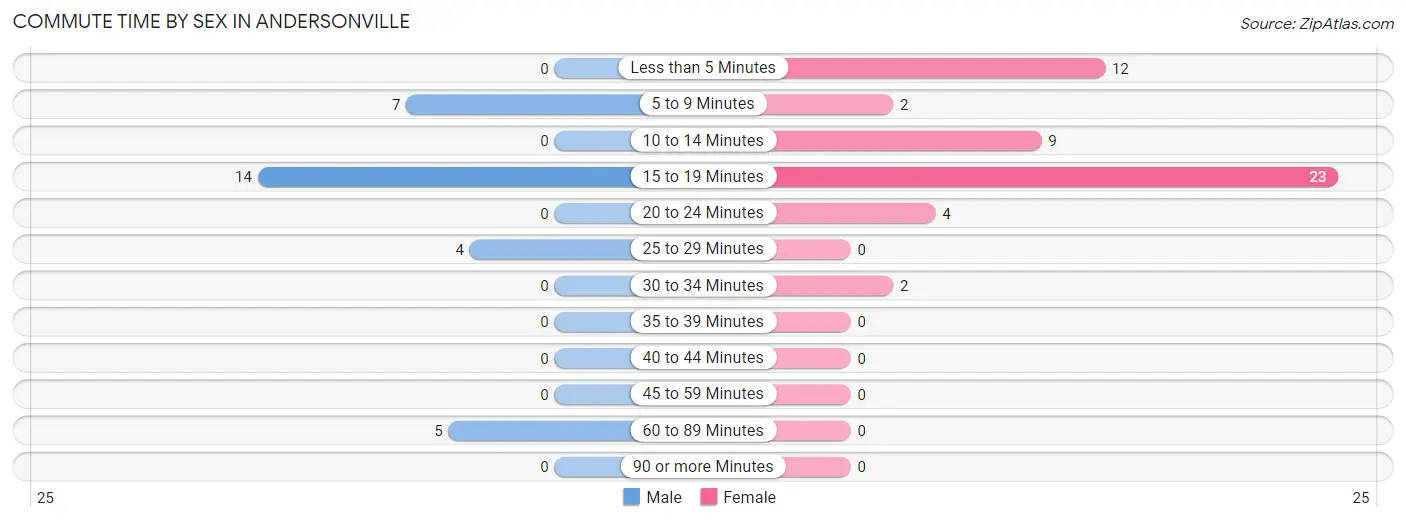
| Commute Time | Male | Female |
| Less than 5 Minutes | 0 (0.0%) | 12 (23.1%) |
| 5 to 9 Minutes | 7 (23.3%) | 2 (3.8%) |
| 10 to 14 Minutes | 0 (0.0%) | 9 (17.3%) |
| 15 to 19 Minutes | 14 (46.7%) | 23 (44.2%) |
| 20 to 24 Minutes | 0 (0.0%) | 4 (7.7%) |
| 25 to 29 Minutes | 4 (13.3%) | 0 (0.0%) |
| 30 to 34 Minutes | 0 (0.0%) | 2 (3.8%) |
| 35 to 39 Minutes | 0 (0.0%) | 0 (0.0%) |
| 40 to 44 Minutes | 0 (0.0%) | 0 (0.0%) |
| 45 to 59 Minutes | 0 (0.0%) | 0 (0.0%) |
| 60 to 89 Minutes | 5 (16.7%) | 0 (0.0%) |
| 90 or more Minutes | 0 (0.0%) | 0 (0.0%) |
Time of Departure to Work by Sex in Andersonville
The most frequent times of departure to work in Andersonville are 6:00 AM to 6:29 AM (12, 40.0%) for males and 11:00 AM to 11:59 AM (12, 23.1%) for females.
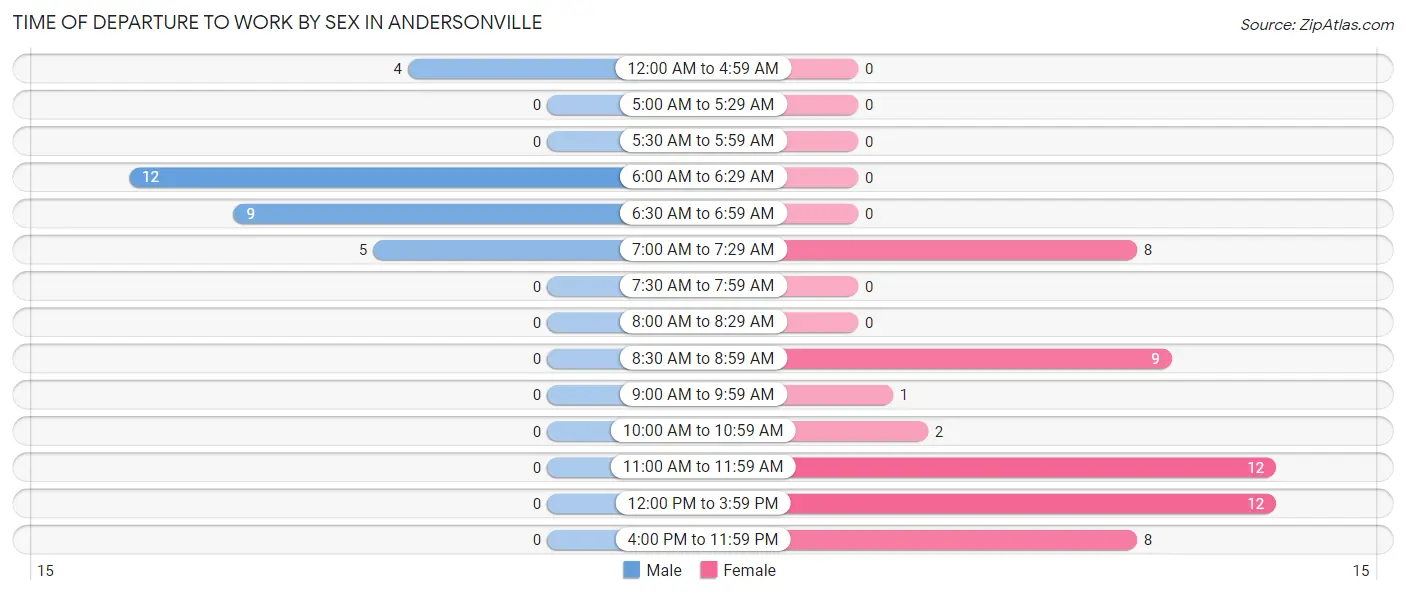
| Time of Departure | Male | Female |
| 12:00 AM to 4:59 AM | 4 (13.3%) | 0 (0.0%) |
| 5:00 AM to 5:29 AM | 0 (0.0%) | 0 (0.0%) |
| 5:30 AM to 5:59 AM | 0 (0.0%) | 0 (0.0%) |
| 6:00 AM to 6:29 AM | 12 (40.0%) | 0 (0.0%) |
| 6:30 AM to 6:59 AM | 9 (30.0%) | 0 (0.0%) |
| 7:00 AM to 7:29 AM | 5 (16.7%) | 8 (15.4%) |
| 7:30 AM to 7:59 AM | 0 (0.0%) | 0 (0.0%) |
| 8:00 AM to 8:29 AM | 0 (0.0%) | 0 (0.0%) |
| 8:30 AM to 8:59 AM | 0 (0.0%) | 9 (17.3%) |
| 9:00 AM to 9:59 AM | 0 (0.0%) | 1 (1.9%) |
| 10:00 AM to 10:59 AM | 0 (0.0%) | 2 (3.8%) |
| 11:00 AM to 11:59 AM | 0 (0.0%) | 12 (23.1%) |
| 12:00 PM to 3:59 PM | 0 (0.0%) | 12 (23.1%) |
| 4:00 PM to 11:59 PM | 0 (0.0%) | 8 (15.4%) |
| Total | 30 (100.0%) | 52 (100.0%) |
Housing Occupancy in Andersonville
Occupancy by Ownership in Andersonville
Of the total 121 dwellings in Andersonville, owner-occupied units account for 45 (37.2%), while renter-occupied units make up 76 (62.8%).
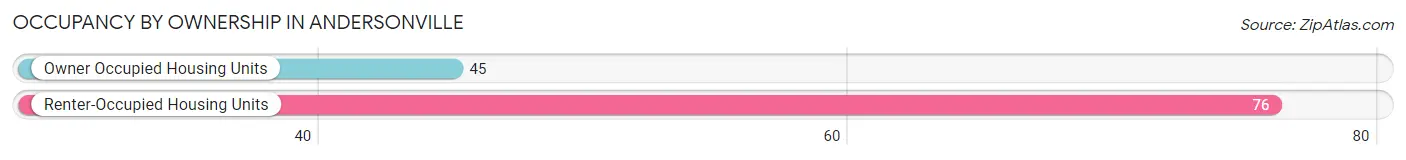
| Occupancy | # Housing Units | % Housing Units |
| Owner Occupied Housing Units | 45 | 37.2% |
| Renter-Occupied Housing Units | 76 | 62.8% |
| Total Occupied Housing Units | 121 | 100.0% |
Occupancy by Household Size in Andersonville
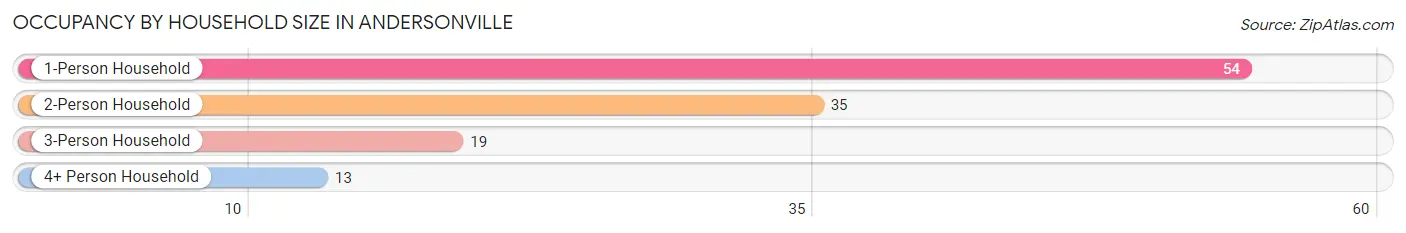
| Household Size | # Housing Units | % Housing Units |
| 1-Person Household | 54 | 44.6% |
| 2-Person Household | 35 | 28.9% |
| 3-Person Household | 19 | 15.7% |
| 4+ Person Household | 13 | 10.7% |
| Total Housing Units | 121 | 100.0% |
Occupancy by Ownership by Household Size in Andersonville
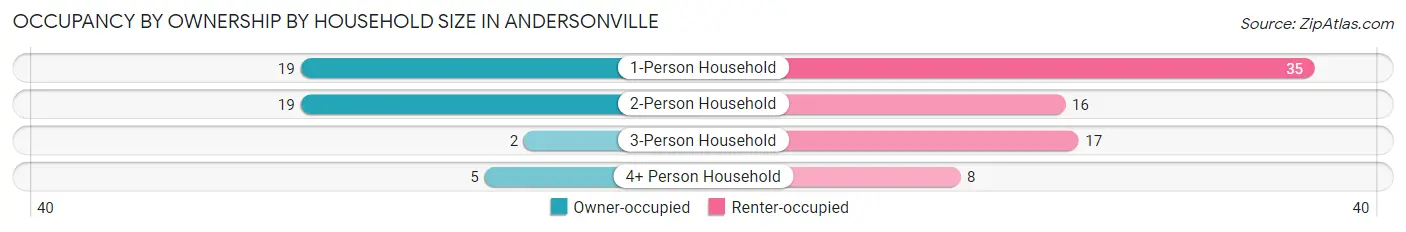
| Household Size | Owner-occupied | Renter-occupied |
| 1-Person Household | 19 (35.2%) | 35 (64.8%) |
| 2-Person Household | 19 (54.3%) | 16 (45.7%) |
| 3-Person Household | 2 (10.5%) | 17 (89.5%) |
| 4+ Person Household | 5 (38.5%) | 8 (61.5%) |
| Total Housing Units | 45 (37.2%) | 76 (62.8%) |
Occupancy by Educational Attainment in Andersonville
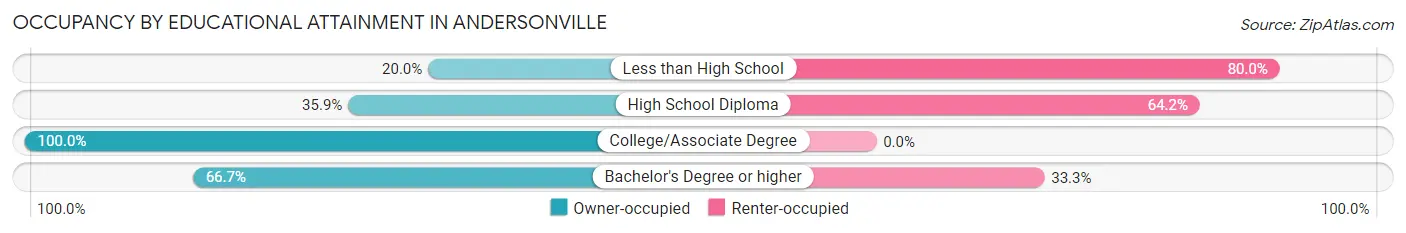
| Household Size | Owner-occupied | Renter-occupied |
| Less than High School | 10 (20.0%) | 40 (80.0%) |
| High School Diploma | 19 (35.8%) | 34 (64.1%) |
| College/Associate Degree | 12 (100.0%) | 0 (0.0%) |
| Bachelor's Degree or higher | 4 (66.7%) | 2 (33.3%) |
Occupancy by Age of Householder in Andersonville
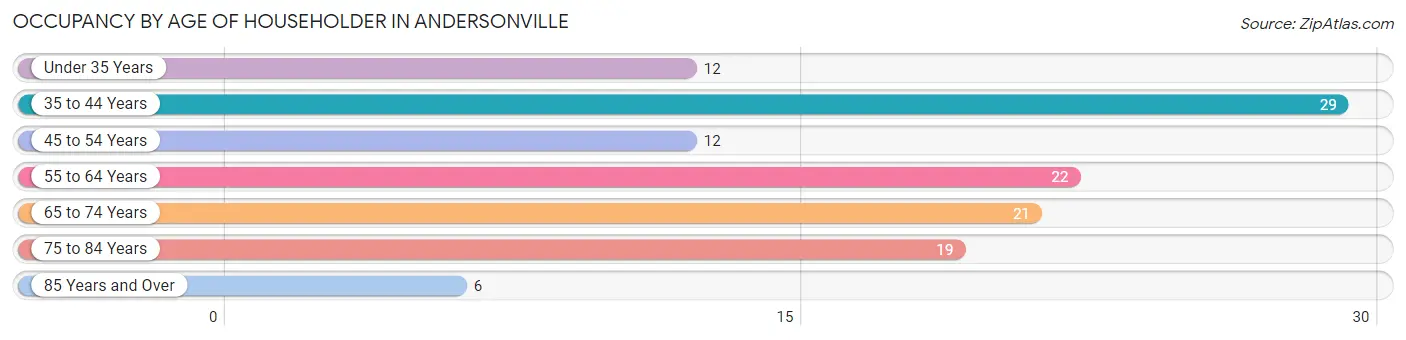
| Age Bracket | # Households | % Households |
| Under 35 Years | 12 | 9.9% |
| 35 to 44 Years | 29 | 24.0% |
| 45 to 54 Years | 12 | 9.9% |
| 55 to 64 Years | 22 | 18.2% |
| 65 to 74 Years | 21 | 17.4% |
| 75 to 84 Years | 19 | 15.7% |
| 85 Years and Over | 6 | 5.0% |
| Total | 121 | 100.0% |
Housing Finances in Andersonville
Median Income by Occupancy in Andersonville
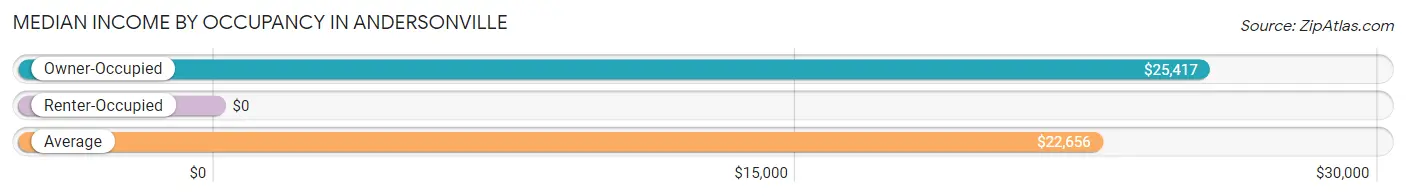
| Occupancy Type | # Households | Median Income |
| Owner-Occupied | 45 (37.2%) | $25,417 |
| Renter-Occupied | 76 (62.8%) | $0 |
| Average | 121 (100.0%) | $22,656 |
Occupancy by Householder Income Bracket in Andersonville
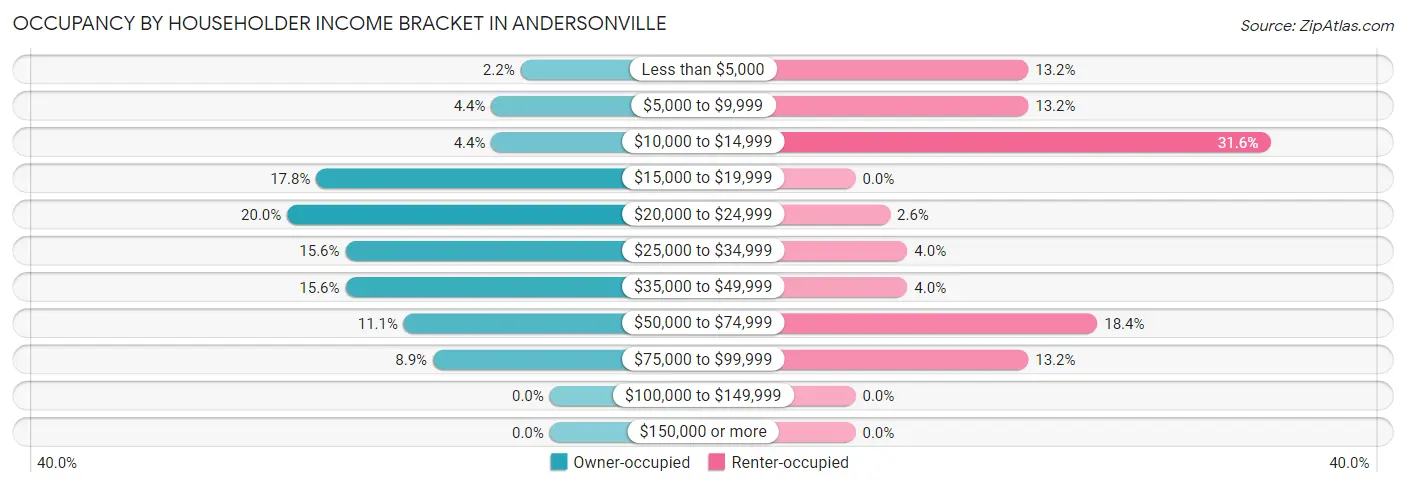
| Income Bracket | Owner-occupied | Renter-occupied |
| Less than $5,000 | 1 (2.2%) | 10 (13.2%) |
| $5,000 to $9,999 | 2 (4.4%) | 10 (13.2%) |
| $10,000 to $14,999 | 2 (4.4%) | 24 (31.6%) |
| $15,000 to $19,999 | 8 (17.8%) | 0 (0.0%) |
| $20,000 to $24,999 | 9 (20.0%) | 2 (2.6%) |
| $25,000 to $34,999 | 7 (15.6%) | 3 (4.0%) |
| $35,000 to $49,999 | 7 (15.6%) | 3 (4.0%) |
| $50,000 to $74,999 | 5 (11.1%) | 14 (18.4%) |
| $75,000 to $99,999 | 4 (8.9%) | 10 (13.2%) |
| $100,000 to $149,999 | 0 (0.0%) | 0 (0.0%) |
| $150,000 or more | 0 (0.0%) | 0 (0.0%) |
| Total | 45 (100.0%) | 76 (100.0%) |
Monthly Housing Cost Tiers in Andersonville
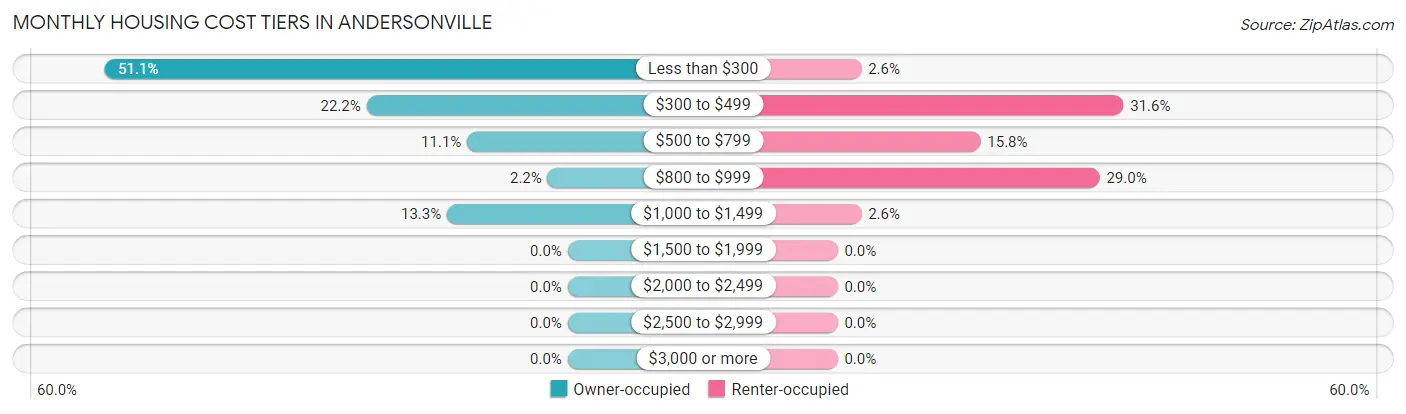
| Monthly Cost | Owner-occupied | Renter-occupied |
| Less than $300 | 23 (51.1%) | 2 (2.6%) |
| $300 to $499 | 10 (22.2%) | 24 (31.6%) |
| $500 to $799 | 5 (11.1%) | 12 (15.8%) |
| $800 to $999 | 1 (2.2%) | 22 (28.9%) |
| $1,000 to $1,499 | 6 (13.3%) | 2 (2.6%) |
| $1,500 to $1,999 | 0 (0.0%) | 0 (0.0%) |
| $2,000 to $2,499 | 0 (0.0%) | 0 (0.0%) |
| $2,500 to $2,999 | 0 (0.0%) | 0 (0.0%) |
| $3,000 or more | 0 (0.0%) | 0 (0.0%) |
| Total | 45 (100.0%) | 76 (100.0%) |
Physical Housing Characteristics in Andersonville
Housing Structures in Andersonville
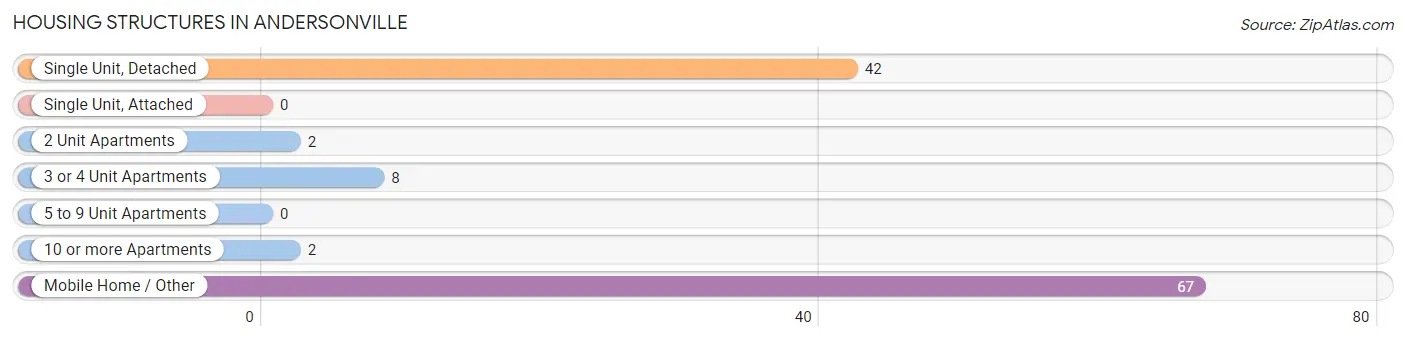
| Structure Type | # Housing Units | % Housing Units |
| Single Unit, Detached | 42 | 34.7% |
| Single Unit, Attached | 0 | 0.0% |
| 2 Unit Apartments | 2 | 1.7% |
| 3 or 4 Unit Apartments | 8 | 6.6% |
| 5 to 9 Unit Apartments | 0 | 0.0% |
| 10 or more Apartments | 2 | 1.7% |
| Mobile Home / Other | 67 | 55.4% |
| Total | 121 | 100.0% |
Housing Structures by Occupancy in Andersonville
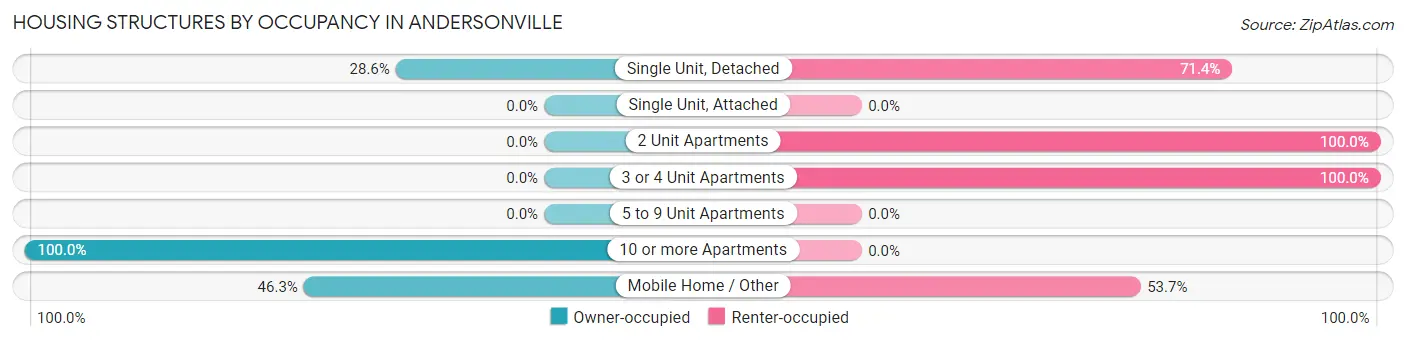
| Structure Type | Owner-occupied | Renter-occupied |
| Single Unit, Detached | 12 (28.6%) | 30 (71.4%) |
| Single Unit, Attached | 0 (0.0%) | 0 (0.0%) |
| 2 Unit Apartments | 0 (0.0%) | 2 (100.0%) |
| 3 or 4 Unit Apartments | 0 (0.0%) | 8 (100.0%) |
| 5 to 9 Unit Apartments | 0 (0.0%) | 0 (0.0%) |
| 10 or more Apartments | 2 (100.0%) | 0 (0.0%) |
| Mobile Home / Other | 31 (46.3%) | 36 (53.7%) |
| Total | 45 (37.2%) | 76 (62.8%) |
Housing Structures by Number of Rooms in Andersonville
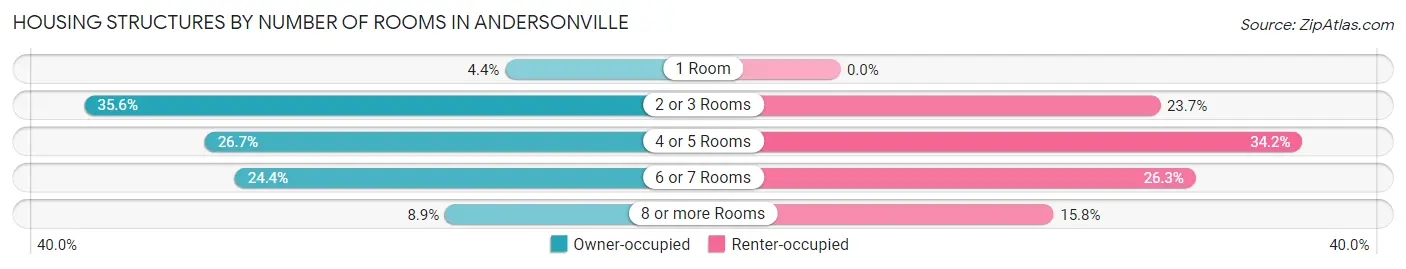
| Number of Rooms | Owner-occupied | Renter-occupied |
| 1 Room | 2 (4.4%) | 0 (0.0%) |
| 2 or 3 Rooms | 16 (35.6%) | 18 (23.7%) |
| 4 or 5 Rooms | 12 (26.7%) | 26 (34.2%) |
| 6 or 7 Rooms | 11 (24.4%) | 20 (26.3%) |
| 8 or more Rooms | 4 (8.9%) | 12 (15.8%) |
| Total | 45 (100.0%) | 76 (100.0%) |
Housing Structure by Heating Type in Andersonville
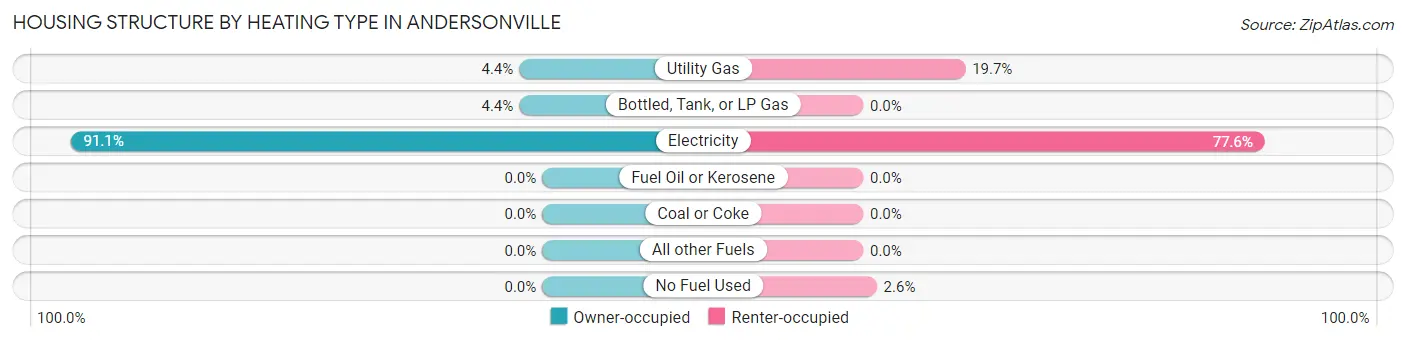
| Heating Type | Owner-occupied | Renter-occupied |
| Utility Gas | 2 (4.4%) | 15 (19.7%) |
| Bottled, Tank, or LP Gas | 2 (4.4%) | 0 (0.0%) |
| Electricity | 41 (91.1%) | 59 (77.6%) |
| Fuel Oil or Kerosene | 0 (0.0%) | 0 (0.0%) |
| Coal or Coke | 0 (0.0%) | 0 (0.0%) |
| All other Fuels | 0 (0.0%) | 0 (0.0%) |
| No Fuel Used | 0 (0.0%) | 2 (2.6%) |
| Total | 45 (100.0%) | 76 (100.0%) |
Household Vehicle Usage in Andersonville
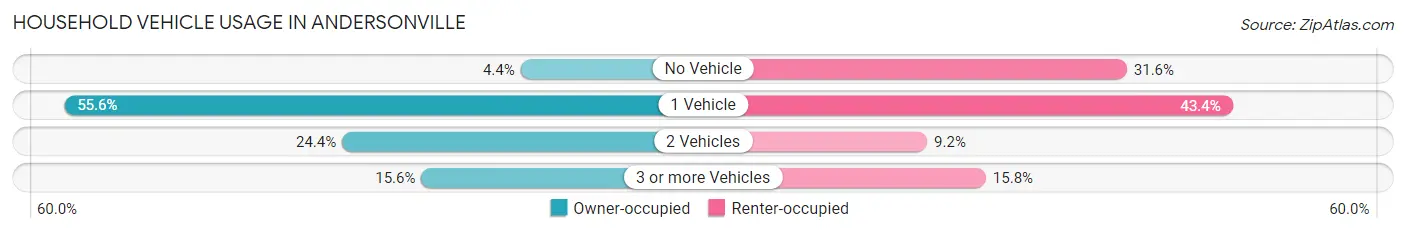
| Vehicles per Household | Owner-occupied | Renter-occupied |
| No Vehicle | 2 (4.4%) | 24 (31.6%) |
| 1 Vehicle | 25 (55.6%) | 33 (43.4%) |
| 2 Vehicles | 11 (24.4%) | 7 (9.2%) |
| 3 or more Vehicles | 7 (15.6%) | 12 (15.8%) |
| Total | 45 (100.0%) | 76 (100.0%) |
Real Estate & Mortgages in Andersonville
Real Estate and Mortgage Overview in Andersonville
| Characteristic | Without Mortgage | With Mortgage |
| Housing Units | 37 | 8 |
| Median Property Value | $20,800 | $85,000 |
| Median Household Income | $30,417 | $0 |
| Monthly Housing Costs | $278 | $0 |
| Real Estate Taxes | $527 | $0 |
Property Value by Mortgage Status in Andersonville
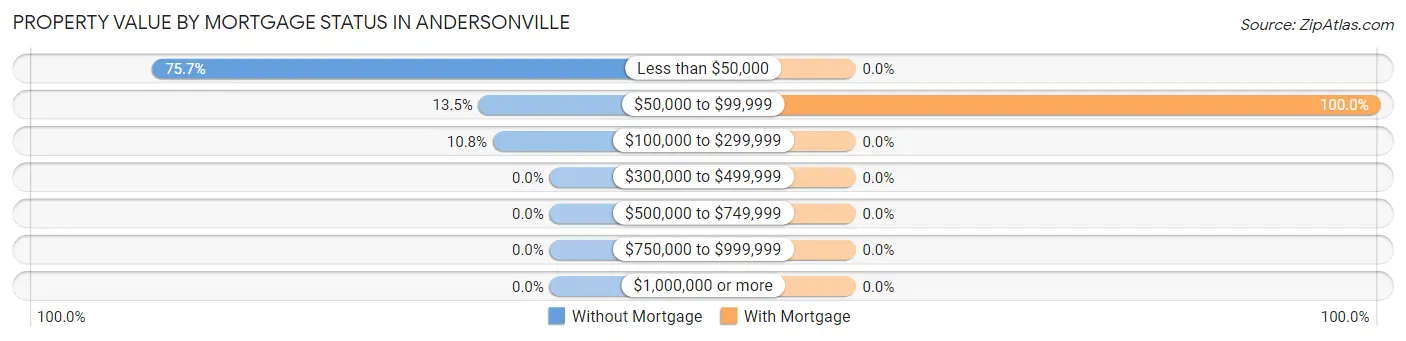
| Property Value | Without Mortgage | With Mortgage |
| Less than $50,000 | 28 (75.7%) | 0 (0.0%) |
| $50,000 to $99,999 | 5 (13.5%) | 8 (100.0%) |
| $100,000 to $299,999 | 4 (10.8%) | 0 (0.0%) |
| $300,000 to $499,999 | 0 (0.0%) | 0 (0.0%) |
| $500,000 to $749,999 | 0 (0.0%) | 0 (0.0%) |
| $750,000 to $999,999 | 0 (0.0%) | 0 (0.0%) |
| $1,000,000 or more | 0 (0.0%) | 0 (0.0%) |
| Total | 37 (100.0%) | 8 (100.0%) |
Household Income by Mortgage Status in Andersonville
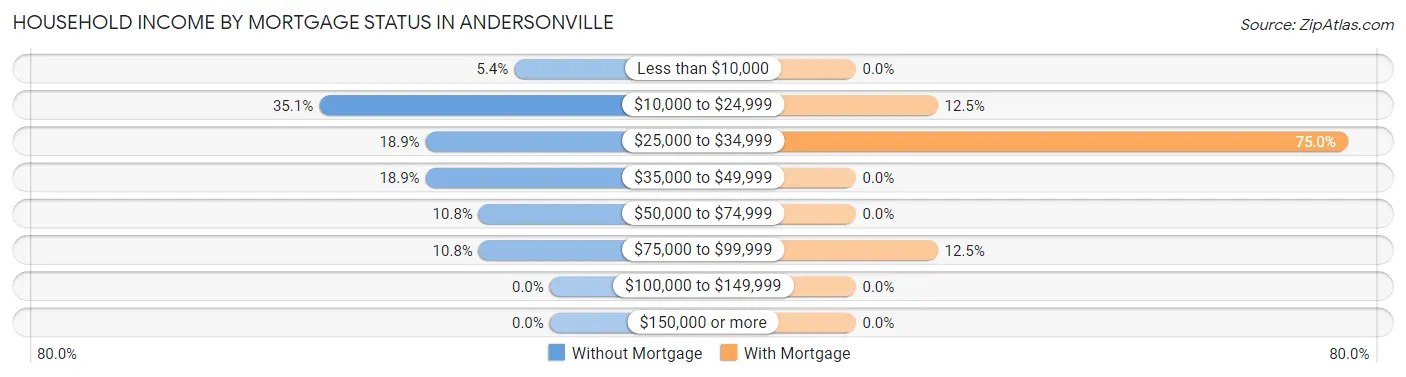
| Household Income | Without Mortgage | With Mortgage |
| Less than $10,000 | 2 (5.4%) | 0 (0.0%) |
| $10,000 to $24,999 | 13 (35.1%) | 1 (12.5%) |
| $25,000 to $34,999 | 7 (18.9%) | 6 (75.0%) |
| $35,000 to $49,999 | 7 (18.9%) | 0 (0.0%) |
| $50,000 to $74,999 | 4 (10.8%) | 0 (0.0%) |
| $75,000 to $99,999 | 4 (10.8%) | 1 (12.5%) |
| $100,000 to $149,999 | 0 (0.0%) | 0 (0.0%) |
| $150,000 or more | 0 (0.0%) | 0 (0.0%) |
| Total | 37 (100.0%) | 8 (100.0%) |
Property Value to Household Income Ratio in Andersonville
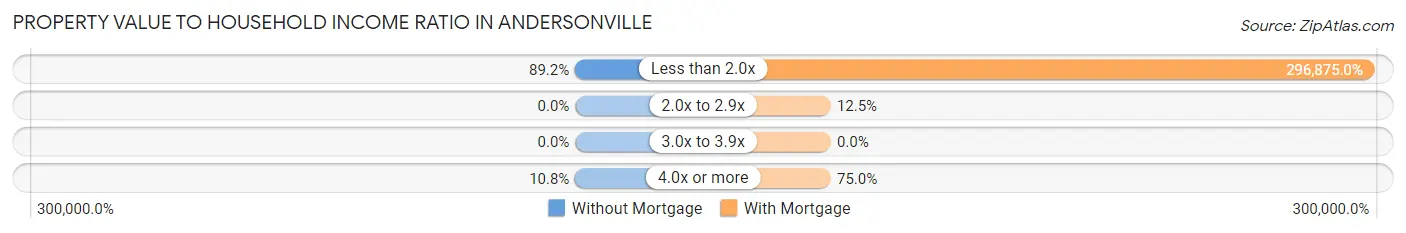
| Value-to-Income Ratio | Without Mortgage | With Mortgage |
| Less than 2.0x | 33 (89.2%) | 23,750 (296,875.0%) |
| 2.0x to 2.9x | 0 (0.0%) | 1 (12.5%) |
| 3.0x to 3.9x | 0 (0.0%) | 0 (0.0%) |
| 4.0x or more | 4 (10.8%) | 6 (75.0%) |
| Total | 37 (100.0%) | 8 (100.0%) |
Real Estate Taxes by Mortgage Status in Andersonville
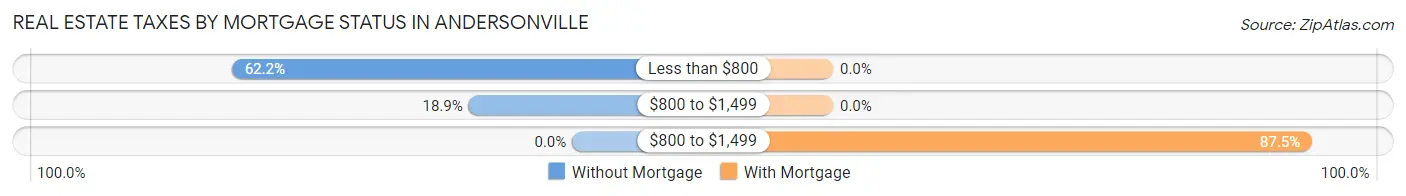
| Property Taxes | Without Mortgage | With Mortgage |
| Less than $800 | 23 (62.2%) | 0 (0.0%) |
| $800 to $1,499 | 7 (18.9%) | 0 (0.0%) |
| $800 to $1,499 | 0 (0.0%) | 7 (87.5%) |
| Total | 37 (100.0%) | 8 (100.0%) |
Health & Disability in Andersonville
Health Insurance Coverage by Age in Andersonville
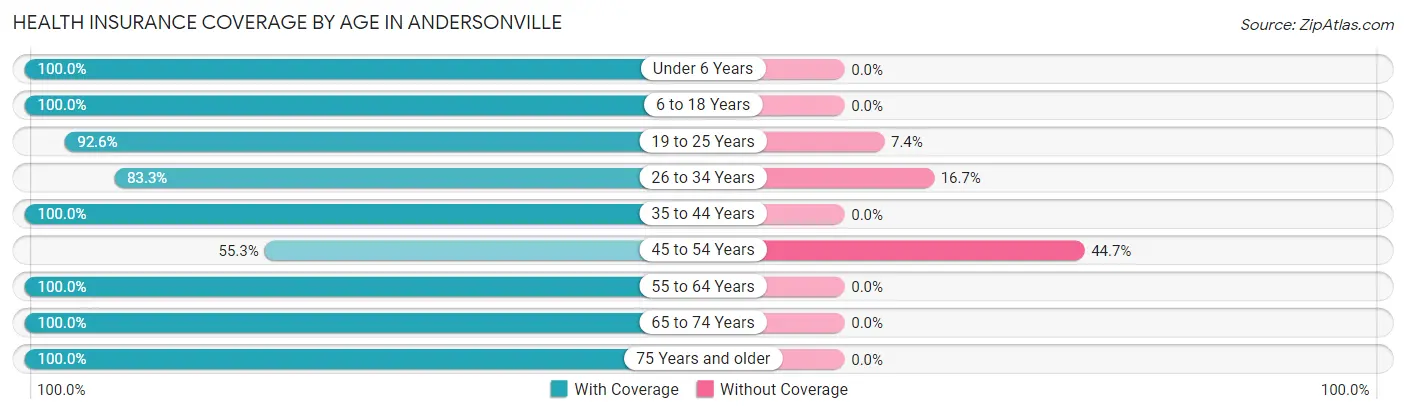
| Age Bracket | With Coverage | Without Coverage |
| Under 6 Years | 13 (100.0%) | 0 (0.0%) |
| 6 to 18 Years | 88 (100.0%) | 0 (0.0%) |
| 19 to 25 Years | 25 (92.6%) | 2 (7.4%) |
| 26 to 34 Years | 10 (83.3%) | 2 (16.7%) |
| 35 to 44 Years | 37 (100.0%) | 0 (0.0%) |
| 45 to 54 Years | 21 (55.3%) | 17 (44.7%) |
| 55 to 64 Years | 26 (100.0%) | 0 (0.0%) |
| 65 to 74 Years | 27 (100.0%) | 0 (0.0%) |
| 75 Years and older | 28 (100.0%) | 0 (0.0%) |
| Total | 275 (92.9%) | 21 (7.1%) |
Health Insurance Coverage by Citizenship Status in Andersonville
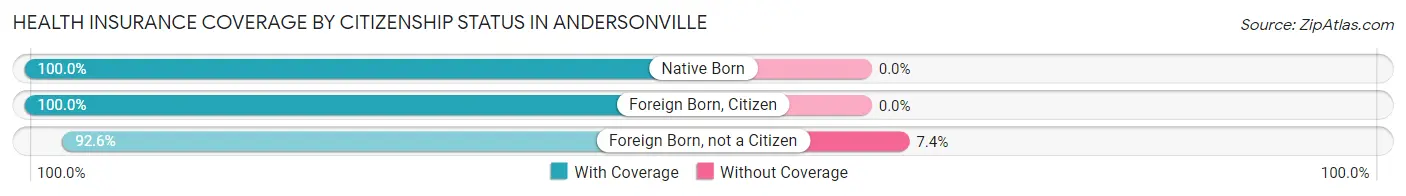
| Citizenship Status | With Coverage | Without Coverage |
| Native Born | 13 (100.0%) | 0 (0.0%) |
| Foreign Born, Citizen | 88 (100.0%) | 0 (0.0%) |
| Foreign Born, not a Citizen | 25 (92.6%) | 2 (7.4%) |
Health Insurance Coverage by Household Income in Andersonville
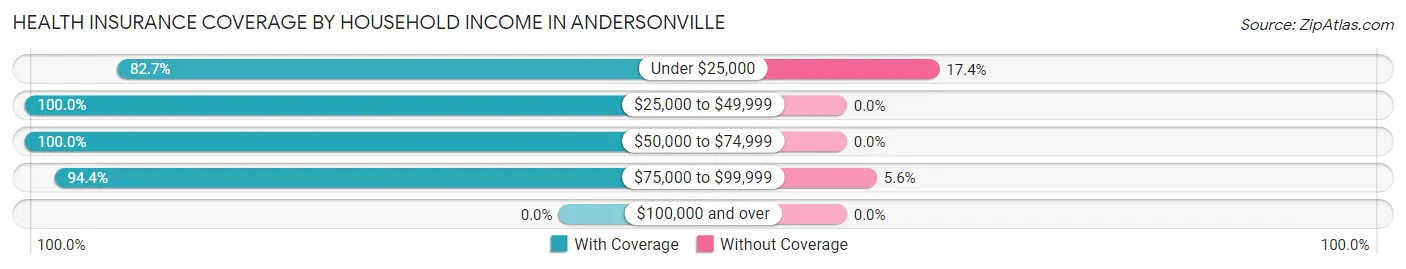
| Household Income | With Coverage | Without Coverage |
| Under $25,000 | 81 (82.7%) | 17 (17.3%) |
| $25,000 to $49,999 | 60 (100.0%) | 0 (0.0%) |
| $50,000 to $74,999 | 67 (100.0%) | 0 (0.0%) |
| $75,000 to $99,999 | 67 (94.4%) | 4 (5.6%) |
| $100,000 and over | 0 (0.0%) | 0 (0.0%) |
Public vs Private Health Insurance Coverage by Age in Andersonville
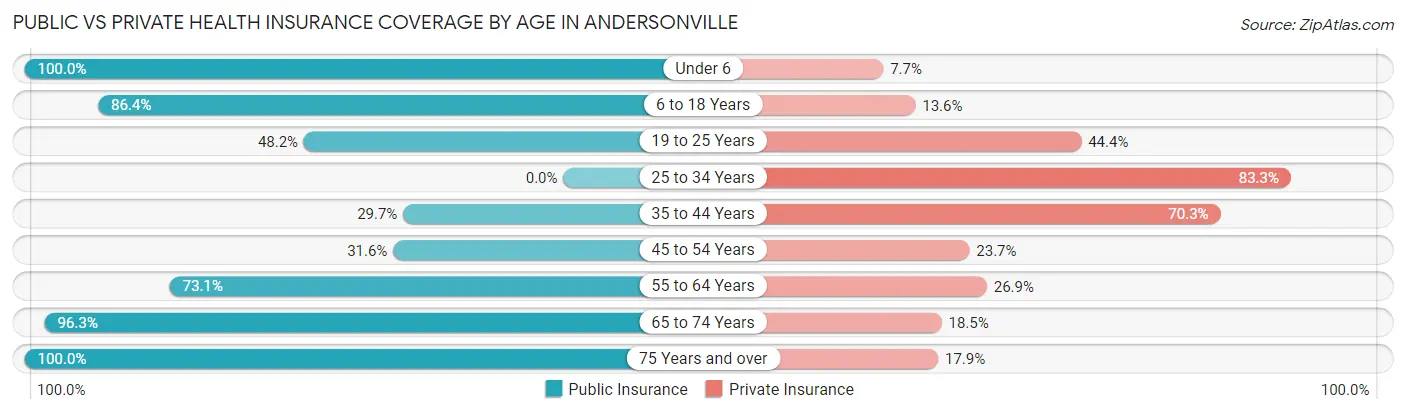
| Age Bracket | Public Insurance | Private Insurance |
| Under 6 | 13 (100.0%) | 1 (7.7%) |
| 6 to 18 Years | 76 (86.4%) | 12 (13.6%) |
| 19 to 25 Years | 13 (48.1%) | 12 (44.4%) |
| 25 to 34 Years | 0 (0.0%) | 10 (83.3%) |
| 35 to 44 Years | 11 (29.7%) | 26 (70.3%) |
| 45 to 54 Years | 12 (31.6%) | 9 (23.7%) |
| 55 to 64 Years | 19 (73.1%) | 7 (26.9%) |
| 65 to 74 Years | 26 (96.3%) | 5 (18.5%) |
| 75 Years and over | 28 (100.0%) | 5 (17.9%) |
| Total | 198 (66.9%) | 87 (29.4%) |
Disability Status by Sex by Age in Andersonville
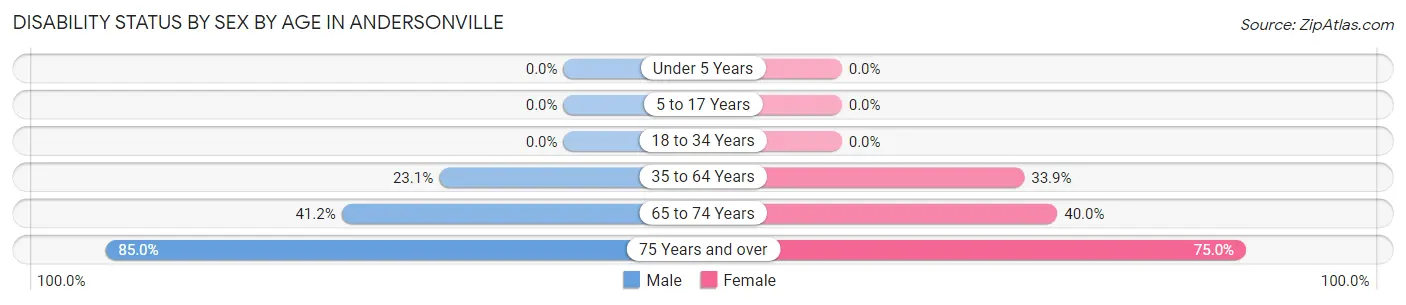
| Age Bracket | Male | Female |
| Under 5 Years | 0 (0.0%) | 0 (0.0%) |
| 5 to 17 Years | 0 (0.0%) | 0 (0.0%) |
| 18 to 34 Years | 0 (0.0%) | 0 (0.0%) |
| 35 to 64 Years | 9 (23.1%) | 21 (33.9%) |
| 65 to 74 Years | 7 (41.2%) | 4 (40.0%) |
| 75 Years and over | 17 (85.0%) | 6 (75.0%) |
Disability Class by Sex by Age in Andersonville
Disability Class: Hearing Difficulty
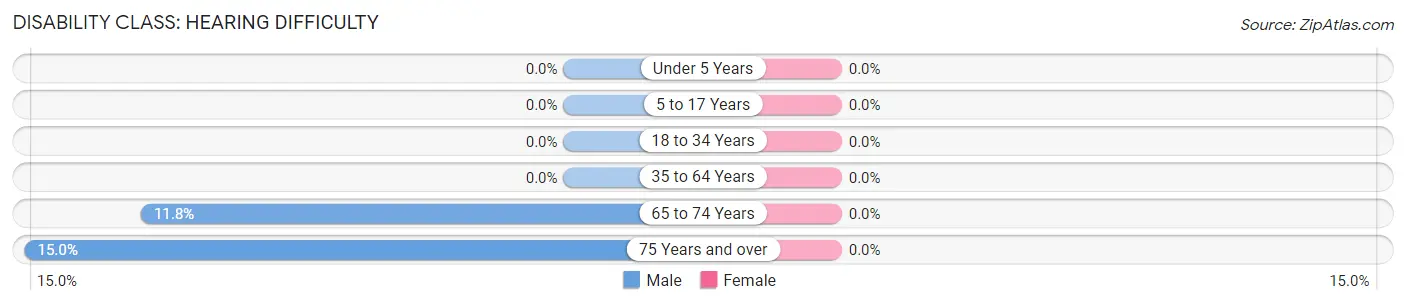
| Age Bracket | Male | Female |
| Under 5 Years | 0 (0.0%) | 0 (0.0%) |
| 5 to 17 Years | 0 (0.0%) | 0 (0.0%) |
| 18 to 34 Years | 0 (0.0%) | 0 (0.0%) |
| 35 to 64 Years | 0 (0.0%) | 0 (0.0%) |
| 65 to 74 Years | 2 (11.8%) | 0 (0.0%) |
| 75 Years and over | 3 (15.0%) | 0 (0.0%) |
Disability Class: Vision Difficulty
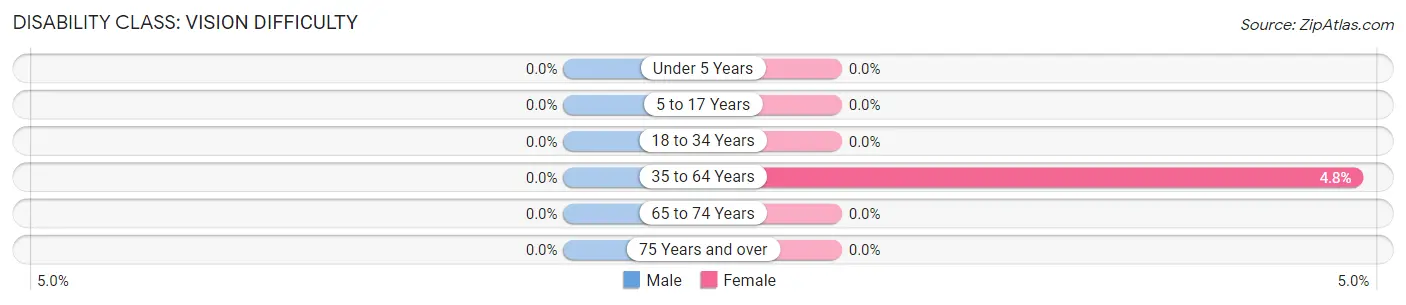
| Age Bracket | Male | Female |
| Under 5 Years | 0 (0.0%) | 0 (0.0%) |
| 5 to 17 Years | 0 (0.0%) | 0 (0.0%) |
| 18 to 34 Years | 0 (0.0%) | 0 (0.0%) |
| 35 to 64 Years | 0 (0.0%) | 3 (4.8%) |
| 65 to 74 Years | 0 (0.0%) | 0 (0.0%) |
| 75 Years and over | 0 (0.0%) | 0 (0.0%) |
Disability Class: Cognitive Difficulty
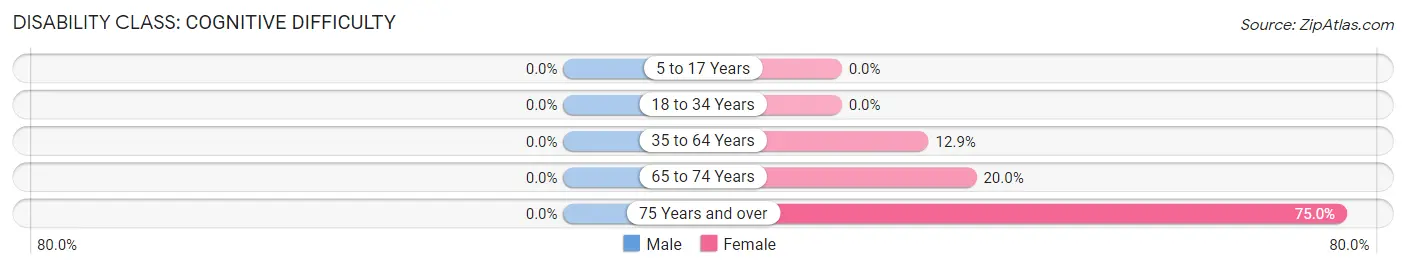
| Age Bracket | Male | Female |
| 5 to 17 Years | 0 (0.0%) | 0 (0.0%) |
| 18 to 34 Years | 0 (0.0%) | 0 (0.0%) |
| 35 to 64 Years | 0 (0.0%) | 8 (12.9%) |
| 65 to 74 Years | 0 (0.0%) | 2 (20.0%) |
| 75 Years and over | 0 (0.0%) | 6 (75.0%) |
Disability Class: Ambulatory Difficulty
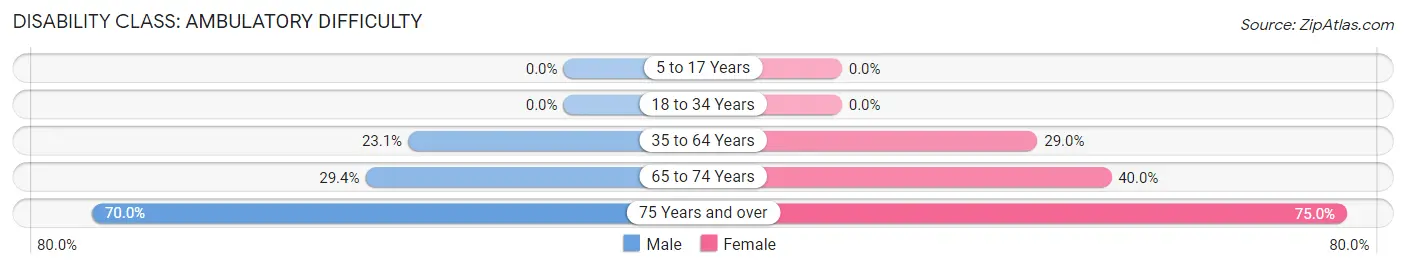
| Age Bracket | Male | Female |
| 5 to 17 Years | 0 (0.0%) | 0 (0.0%) |
| 18 to 34 Years | 0 (0.0%) | 0 (0.0%) |
| 35 to 64 Years | 9 (23.1%) | 18 (29.0%) |
| 65 to 74 Years | 5 (29.4%) | 4 (40.0%) |
| 75 Years and over | 14 (70.0%) | 6 (75.0%) |
Disability Class: Self-Care Difficulty
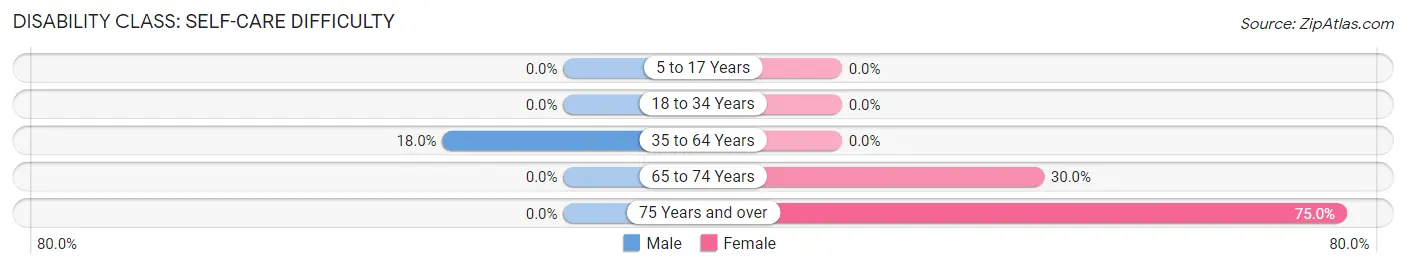
| Age Bracket | Male | Female |
| 5 to 17 Years | 0 (0.0%) | 0 (0.0%) |
| 18 to 34 Years | 0 (0.0%) | 0 (0.0%) |
| 35 to 64 Years | 7 (17.9%) | 0 (0.0%) |
| 65 to 74 Years | 0 (0.0%) | 3 (30.0%) |
| 75 Years and over | 0 (0.0%) | 6 (75.0%) |
Technology Access in Andersonville
Computing Device Access in Andersonville
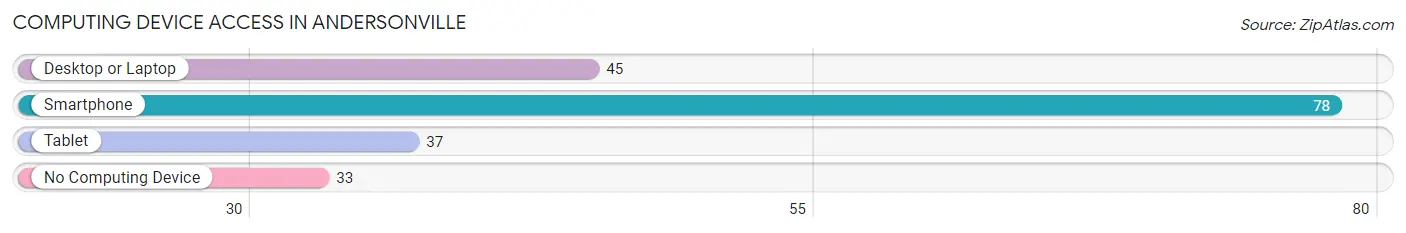
| Device Type | # Households | % Households |
| Desktop or Laptop | 45 | 37.2% |
| Smartphone | 78 | 64.5% |
| Tablet | 37 | 30.6% |
| No Computing Device | 33 | 27.3% |
| Total | 121 | 100.0% |
Internet Access in Andersonville
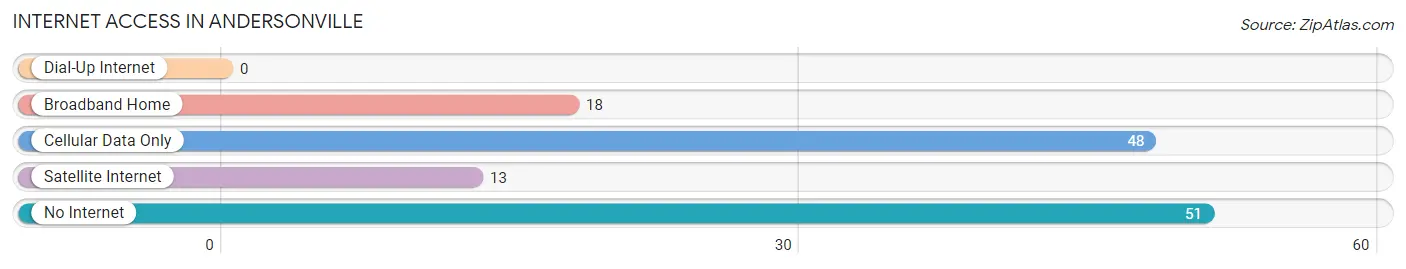
| Internet Type | # Households | % Households |
| Dial-Up Internet | 0 | 0.0% |
| Broadband Home | 18 | 14.9% |
| Cellular Data Only | 48 | 39.7% |
| Satellite Internet | 13 | 10.7% |
| No Internet | 51 | 42.1% |
| Total | 121 | 100.0% |
Andersonville Summary
Andersonville, Georgia is a small town located in Sumter County, Georgia. It is situated about 10 miles south of Americus and about 20 miles north of Albany. The town was founded in 1853 and was named after the Confederate war hero, General Robert Anderson. The town is best known for the Andersonville National Historic Site, which is the site of the infamous Civil War prison camp.
History
The town of Andersonville was founded in 1853 by the Georgia General Assembly. The town was named after General Robert Anderson, a Confederate war hero. Andersonville was originally a small farming community, but it soon became a major trading center for the surrounding area. The town was also home to a number of businesses, including a cotton gin, a grist mill, and a sawmill.
During the Civil War, Andersonville was the site of a Confederate prison camp. The camp, which was officially known as Camp Sumter, was established in February 1864 and was used to house Union prisoners of war. The camp was notorious for its poor conditions and high mortality rate. Over 45,000 Union prisoners were held at the camp during its 14-month existence, and nearly 13,000 of them died due to disease, malnutrition, and exposure.
After the war, Andersonville was slowly rebuilt. The town was incorporated in 1872 and the population began to grow. In the late 19th century, the town was home to a number of businesses, including a cotton gin, a grist mill, and a sawmill. The town also had a number of churches, schools, and other civic organizations.
In 1970, the Andersonville National Historic Site was established to commemorate the Civil War prison camp. The site includes the National Prisoner of War Museum, which houses artifacts and exhibits related to the camp. The site also includes the Andersonville National Cemetery, which is the final resting place for many of the Union soldiers who died at the camp.
Geography
Andersonville is located in Sumter County, Georgia. The town is situated about 10 miles south of Americus and about 20 miles north of Albany. The town is located in the Flint River Valley, which is part of the larger Piedmont Plateau region. The town is surrounded by rolling hills and is located near the Flint River.
The climate in Andersonville is humid subtropical, with hot, humid summers and mild winters. The average annual temperature is around 70 degrees Fahrenheit, and the average annual precipitation is around 50 inches.
Economy
The economy of Andersonville is largely based on agriculture and tourism. The town is home to a number of farms, which produce a variety of crops, including cotton, corn, soybeans, and peanuts. The town is also home to a number of tourist attractions, including the Andersonville National Historic Site and the Andersonville National Cemetery.
The town is also home to a number of businesses, including restaurants, retail stores, and service providers. The town is served by a number of major highways, including Interstate 75 and U.S. Route 19.
Demographics
As of the 2010 census, the population of Andersonville was 1,819. The racial makeup of the town was 79.3% White, 17.2% African American, 0.7% Native American, 0.3% Asian, 0.1% Pacific Islander, and 2.4% from other races. The median household income was $30,938, and the median family income was $37,813.
Conclusion
Andersonville, Georgia is a small town located in Sumter County, Georgia. The town was founded in 1853 and was named after the Confederate war hero, General Robert Anderson. The town is best known for the Andersonville National Historic Site, which is the site of the infamous Civil War prison camp. The town’s economy is largely based on agriculture and tourism, and the population of the town is 1,819 as of the 2010 census. Andersonville is a small town with a rich history and a bright future.
Common Questions
What is Per Capita Income in Andersonville?
Per Capita income in Andersonville is $14,556.
What is the Median Family Income in Andersonville?
Median Family Income in Andersonville is $63,125.
What is the Median Household income in Andersonville?
Median Household Income in Andersonville is $22,656.
What is Income or Wage Gap in Andersonville?
Income or Wage Gap in Andersonville is 69.3%.
Women in Andersonville earn 30.7 cents for every dollar earned by a man.
What is Inequality or Gini Index in Andersonville?
Inequality or Gini Index in Andersonville is 0.46.
What is the Total Population of Andersonville?
Total Population of Andersonville is 296.
What is the Total Male Population of Andersonville?
Total Male Population of Andersonville is 120.
What is the Total Female Population of Andersonville?
Total Female Population of Andersonville is 176.
What is the Ratio of Males per 100 Females in Andersonville?
There are 68.18 Males per 100 Females in Andersonville.
What is the Ratio of Females per 100 Males in Andersonville?
There are 146.67 Females per 100 Males in Andersonville.
What is the Median Population Age in Andersonville?
Median Population Age in Andersonville is 36.5 Years.
What is the Average Family Size in Andersonville
Average Family Size in Andersonville is 3.8 People.
What is the Average Household Size in Andersonville
Average Household Size in Andersonville is 2.5 People.
How Large is the Labor Force in Andersonville?
There are 100 People in the Labor Forcein in Andersonville.
What is the Percentage of People in the Labor Force in Andersonville?
42.9% of People are in the Labor Force in Andersonville.
What is the Unemployment Rate in Andersonville?
Unemployment Rate in Andersonville is 10.0%.