Zip Codes with the Highest Percentage of Population Employed in Food Preparation & Serving in Stone Mountain, GA
RELATED REPORTS & OPTIONS
Food Preparation & Serving
Stone Mountain
Compare Zip Codes
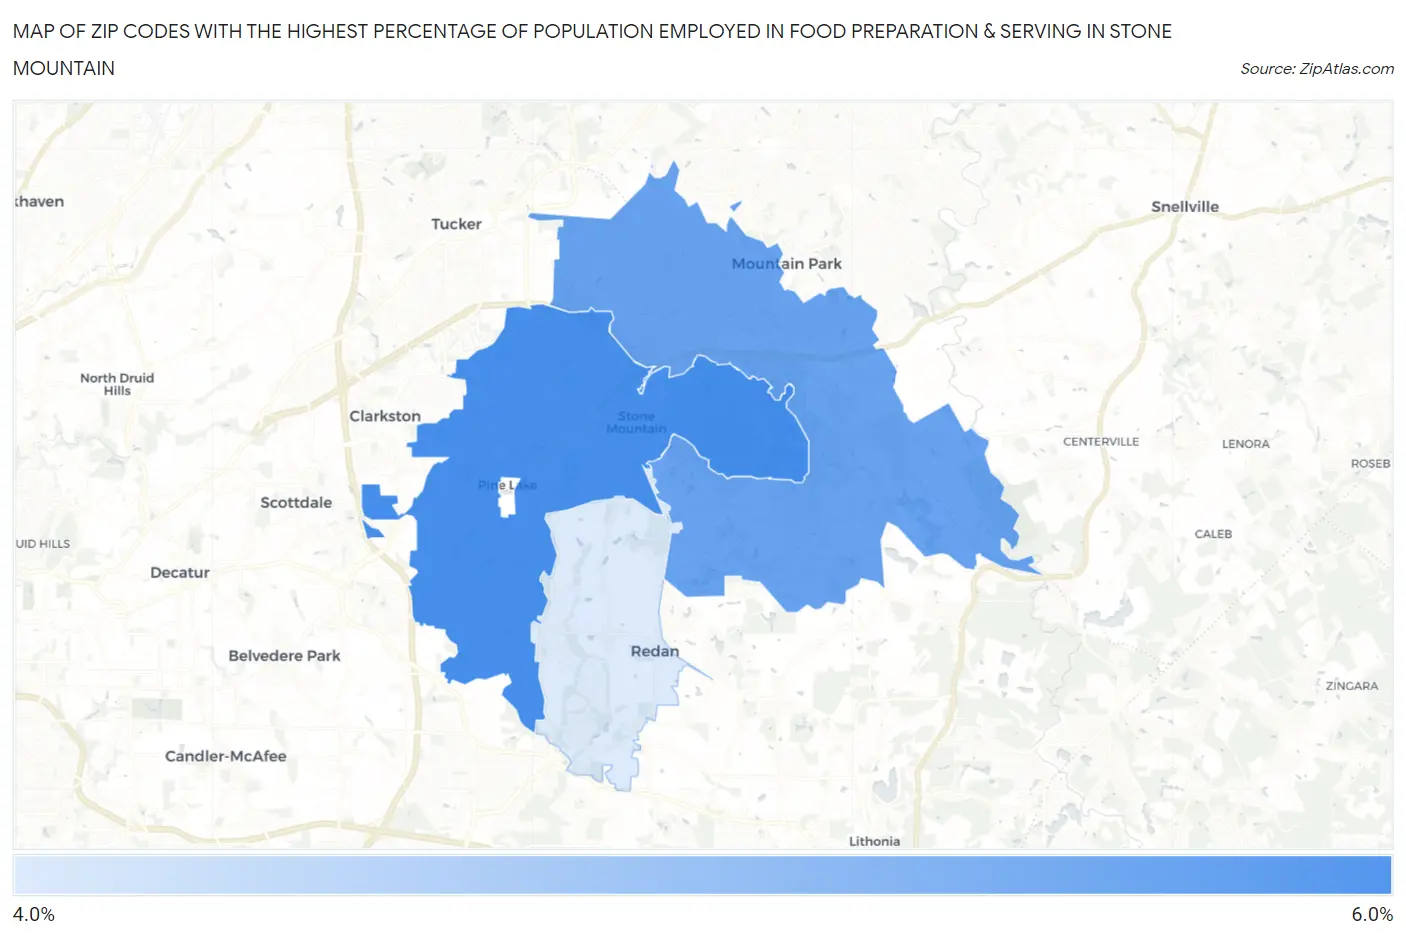
Map of Zip Codes with the Highest Percentage of Population Employed in Food Preparation & Serving in Stone Mountain
4.7%
5.2%
Zip Codes with the Highest Percentage of Population Employed in Food Preparation & Serving in Stone Mountain, GA
| Zip Code | % Employed | vs State | vs National | |
| 1. | 30083 | 5.2% | 5.1%(+0.051)#275 | 5.3%(-0.091)#12,161 |
| 2. | 30087 | 5.1% | 5.1%(-0.047)#287 | 5.3%(-0.189)#12,554 |
| 3. | 30088 | 4.7% | 5.1%(-0.414)#324 | 5.3%(-0.555)#14,033 |
1
Common Questions
What are the Top Zip Codes with the Highest Percentage of Population Employed in Food Preparation & Serving in Stone Mountain, GA?
Top Zip Codes with the Highest Percentage of Population Employed in Food Preparation & Serving in Stone Mountain, GA are:
What zip code has the Highest Percentage of Population Employed in Food Preparation & Serving in Stone Mountain, GA?
30083 has the Highest Percentage of Population Employed in Food Preparation & Serving in Stone Mountain, GA with 5.2%.
What is the Percentage of Population Employed in Food Preparation & Serving in Stone Mountain, GA?
Percentage of Population Employed in Food Preparation & Serving in Stone Mountain is 8.9%.
What is the Percentage of Population Employed in Food Preparation & Serving in Georgia?
Percentage of Population Employed in Food Preparation & Serving in Georgia is 5.1%.
What is the Percentage of Population Employed in Food Preparation & Serving in the United States?
Percentage of Population Employed in Food Preparation & Serving in the United States is 5.3%.