Blue Ridge, GA Map & Demographics
Blue Ridge Map
Blue Ridge Overview
$23,530
PER CAPITA INCOME
$53,583
AVG FAMILY INCOME
$34,659
AVG HOUSEHOLD INCOME
25.7%
WAGE / INCOME GAP [ % ]
74.3¢/ $1
WAGE / INCOME GAP [ $ ]
$5,786
FAMILY INCOME DEFICIT
0.45
INEQUALITY / GINI INDEX
1,366
TOTAL POPULATION
683
MALE POPULATION
683
FEMALE POPULATION
100.00
MALES / 100 FEMALES
100.00
FEMALES / 100 MALES
47.3
MEDIAN AGE
2.7
AVG FAMILY SIZE
2.0
AVG HOUSEHOLD SIZE
442
LABOR FORCE [ PEOPLE ]
39.0%
PERCENT IN LABOR FORCE
0.9%
UNEMPLOYMENT RATE
Blue Ridge Zip Codes
Income in Blue Ridge
Income Overview in Blue Ridge
Per Capita Income in Blue Ridge is $23,530, while median incomes of families and households are $53,583 and $34,659 respectively.
| Characteristic | Number | Measure |
| Per Capita Income | 1,366 | $23,530 |
| Median Family Income | 317 | $53,583 |
| Mean Family Income | 317 | $63,844 |
| Median Household Income | 616 | $34,659 |
| Mean Household Income | 616 | $50,632 |
| Income Deficit | 317 | $5,786 |
| Wage / Income Gap (%) | 1,366 | 25.72% |
| Wage / Income Gap ($) | 1,366 | 74.28¢ per $1 |
| Gini / Inequality Index | 1,366 | 0.45 |
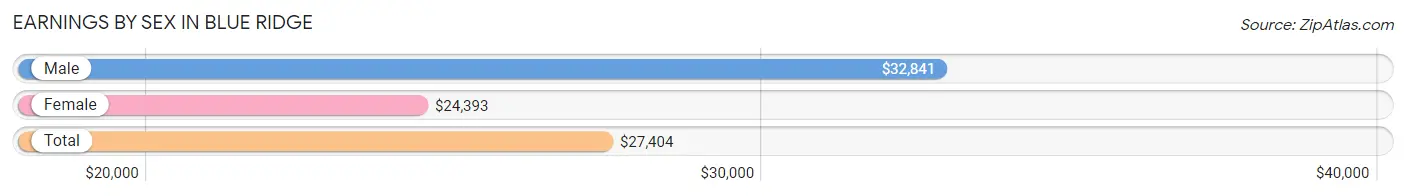
Earnings by Sex in Blue Ridge
Average Earnings in Blue Ridge are $27,404, $32,841 for men and $24,393 for women, a difference of 25.7%.
| Sex | Number | Average Earnings |
| Male | 301 (57.4%) | $32,841 |
| Female | 223 (42.6%) | $24,393 |
| Total | 524 (100.0%) | $27,404 |
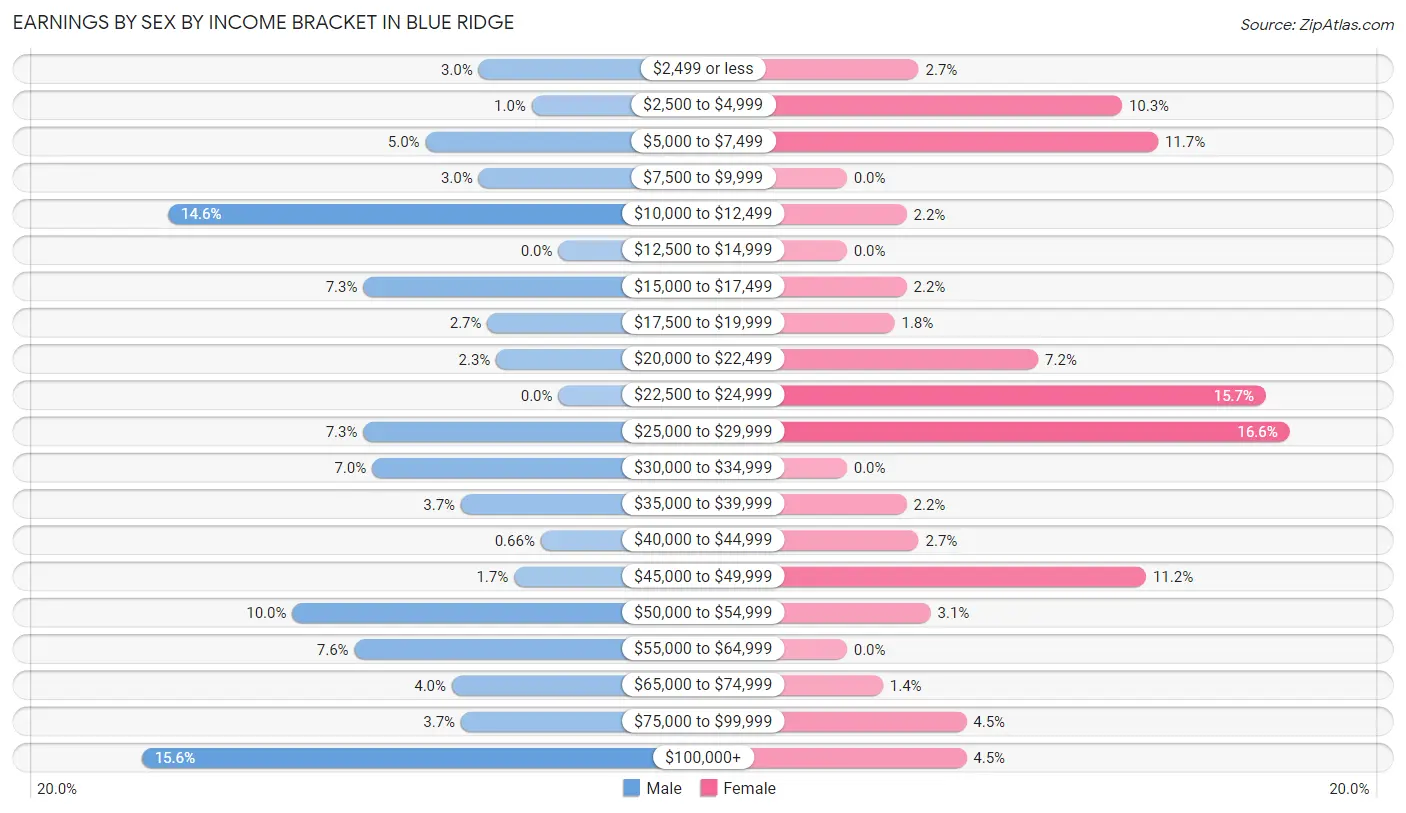
Earnings by Sex by Income Bracket in Blue Ridge
The most common earnings brackets in Blue Ridge are $100,000+ for men (47 | 15.6%) and $25,000 to $29,999 for women (37 | 16.6%).
| Income | Male | Female |
| $2,499 or less | 9 (3.0%) | 6 (2.7%) |
| $2,500 to $4,999 | 3 (1.0%) | 23 (10.3%) |
| $5,000 to $7,499 | 15 (5.0%) | 26 (11.7%) |
| $7,500 to $9,999 | 9 (3.0%) | 0 (0.0%) |
| $10,000 to $12,499 | 44 (14.6%) | 5 (2.2%) |
| $12,500 to $14,999 | 0 (0.0%) | 0 (0.0%) |
| $15,000 to $17,499 | 22 (7.3%) | 5 (2.2%) |
| $17,500 to $19,999 | 8 (2.7%) | 4 (1.8%) |
| $20,000 to $22,499 | 7 (2.3%) | 16 (7.2%) |
| $22,500 to $24,999 | 0 (0.0%) | 35 (15.7%) |
| $25,000 to $29,999 | 22 (7.3%) | 37 (16.6%) |
| $30,000 to $34,999 | 21 (7.0%) | 0 (0.0%) |
| $35,000 to $39,999 | 11 (3.6%) | 5 (2.2%) |
| $40,000 to $44,999 | 2 (0.7%) | 6 (2.7%) |
| $45,000 to $49,999 | 5 (1.7%) | 25 (11.2%) |
| $50,000 to $54,999 | 30 (10.0%) | 7 (3.1%) |
| $55,000 to $64,999 | 23 (7.6%) | 0 (0.0%) |
| $65,000 to $74,999 | 12 (4.0%) | 3 (1.3%) |
| $75,000 to $99,999 | 11 (3.6%) | 10 (4.5%) |
| $100,000+ | 47 (15.6%) | 10 (4.5%) |
| Total | 301 (100.0%) | 223 (100.0%) |
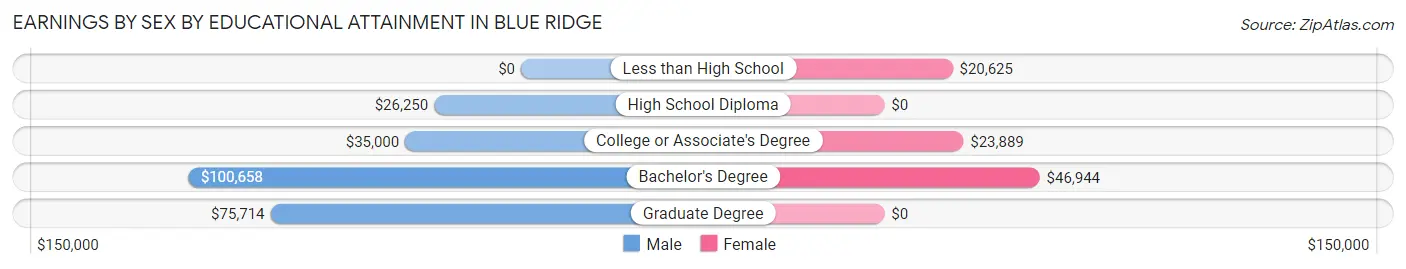
Earnings by Sex by Educational Attainment in Blue Ridge
Average earnings in Blue Ridge are $39,205 for men and $24,861 for women, a difference of 36.6%. Men with an educational attainment of bachelor's degree enjoy the highest average annual earnings of $100,658, while those with high school diploma education earn the least with $26,250. Women with an educational attainment of bachelor's degree earn the most with the average annual earnings of $46,944, while those with less than high school education have the smallest earnings of $20,625.
| Educational Attainment | Male Income | Female Income |
| Less than High School | - | - |
| High School Diploma | $26,250 | $0 |
| College or Associate's Degree | $35,000 | $23,889 |
| Bachelor's Degree | $100,658 | $46,944 |
| Graduate Degree | $75,714 | $0 |
| Total | $39,205 | $24,861 |
Family Income in Blue Ridge
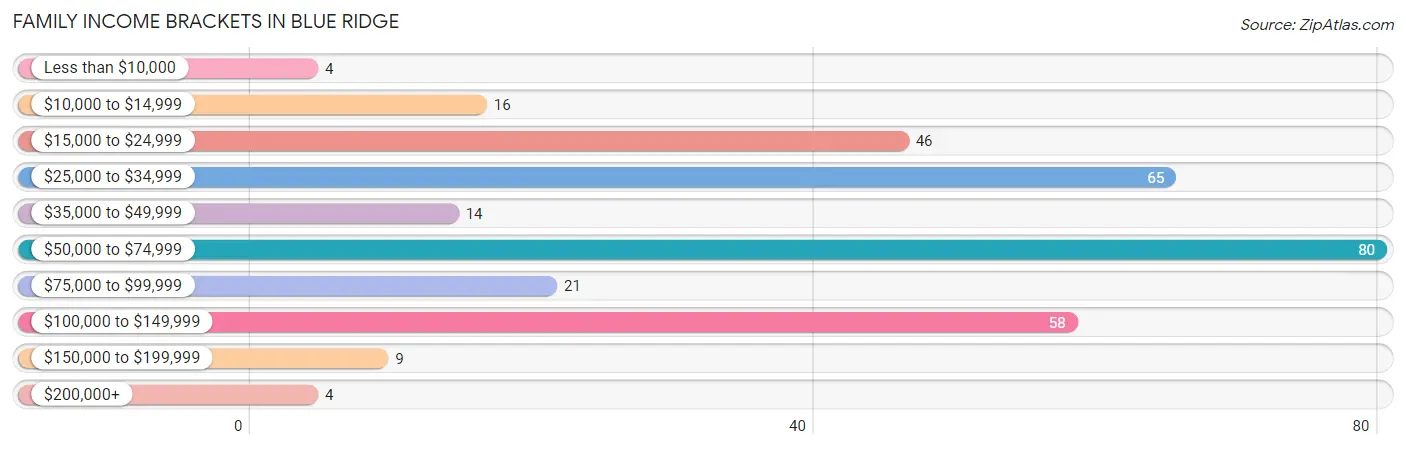
Family Income Brackets in Blue Ridge
According to the Blue Ridge family income data, there are 80 families falling into the $50,000 to $74,999 income range, which is the most common income bracket and makes up 25.2% of all families. Conversely, the less than $10,000 income bracket is the least frequent group with only 4 families (1.3%) belonging to this category.
| Income Bracket | # Families | % Families |
| Less than $10,000 | 4 | 1.3% |
| $10,000 to $14,999 | 16 | 5.0% |
| $15,000 to $24,999 | 46 | 14.5% |
| $25,000 to $34,999 | 65 | 20.5% |
| $35,000 to $49,999 | 14 | 4.4% |
| $50,000 to $74,999 | 80 | 25.2% |
| $75,000 to $99,999 | 21 | 6.6% |
| $100,000 to $149,999 | 58 | 18.3% |
| $150,000 to $199,999 | 9 | 2.8% |
| $200,000+ | 4 | 1.3% |
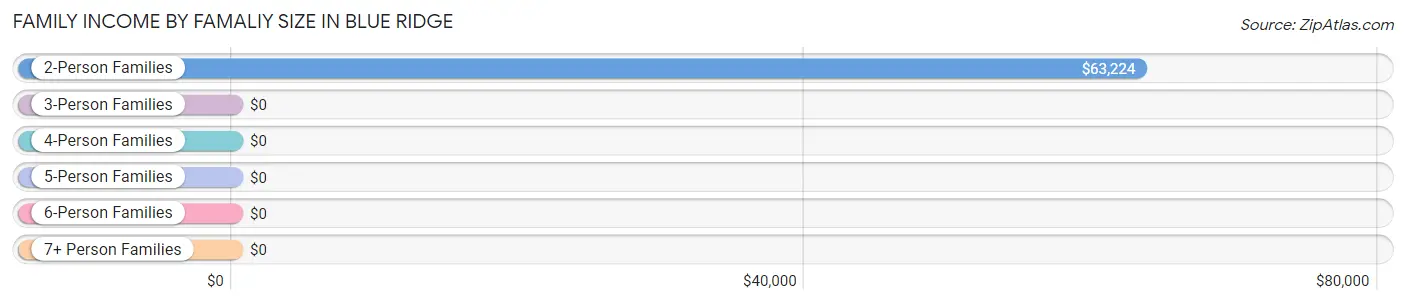
Family Income by Famaliy Size in Blue Ridge
2-person families (148 | 46.7%) account for the highest median family income in Blue Ridge with $63,224 per family, while 2-person families (148 | 46.7%) have the highest median income of $31,612 per family member.
| Income Bracket | # Families | Median Income |
| 2-Person Families | 148 (46.7%) | $63,224 |
| 3-Person Families | 75 (23.7%) | $0 |
| 4-Person Families | 76 (24.0%) | $0 |
| 5-Person Families | 18 (5.7%) | $0 |
| 6-Person Families | 0 (0.0%) | $0 |
| 7+ Person Families | 0 (0.0%) | $0 |
| Total | 317 (100.0%) | $53,583 |
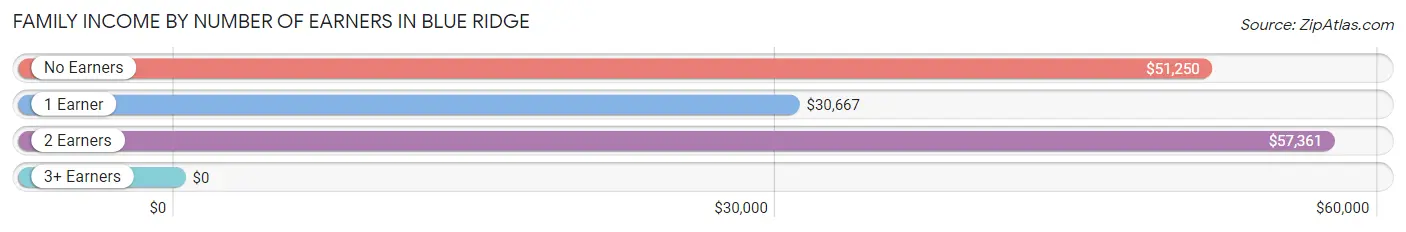
Family Income by Number of Earners in Blue Ridge
| Number of Earners | # Families | Median Income |
| No Earners | 81 (25.6%) | $51,250 |
| 1 Earner | 124 (39.1%) | $30,667 |
| 2 Earners | 112 (35.3%) | $57,361 |
| 3+ Earners | 0 (0.0%) | $0 |
| Total | 317 (100.0%) | $53,583 |
Household Income in Blue Ridge
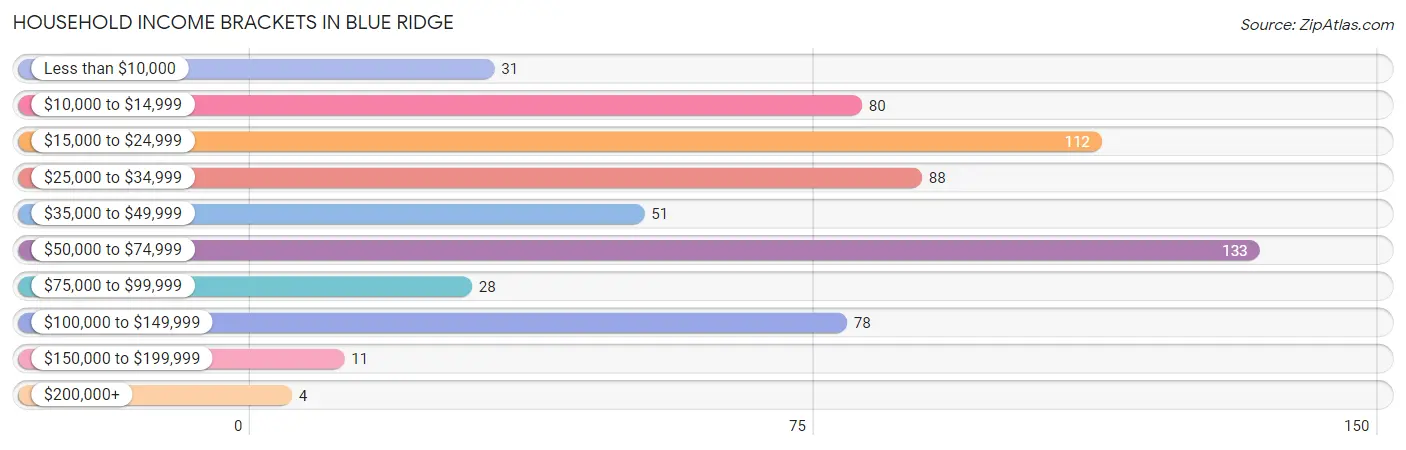
Household Income Brackets in Blue Ridge
With 133 households falling in the category, the $50,000 to $74,999 income range is the most frequent in Blue Ridge, accounting for 21.6% of all households. In contrast, only 4 households (0.6%) fall into the $200,000+ income bracket, making it the least populous group.
| Income Bracket | # Households | % Households |
| Less than $10,000 | 31 | 5.0% |
| $10,000 to $14,999 | 80 | 13.0% |
| $15,000 to $24,999 | 112 | 18.2% |
| $25,000 to $34,999 | 88 | 14.3% |
| $35,000 to $49,999 | 51 | 8.3% |
| $50,000 to $74,999 | 133 | 21.6% |
| $75,000 to $99,999 | 28 | 4.5% |
| $100,000 to $149,999 | 78 | 12.7% |
| $150,000 to $199,999 | 11 | 1.8% |
| $200,000+ | 4 | 0.6% |
Household Income by Householder Age in Blue Ridge
The median household income in Blue Ridge is $34,659, with the highest median household income of $54,083 found in the 25 to 44 years age bracket for the primary householder. A total of 193 households (31.3%) fall into this category. Meanwhile, the 15 to 24 years age bracket for the primary householder has the lowest median household income of $2,499, with 17 households (2.8%) in this group.
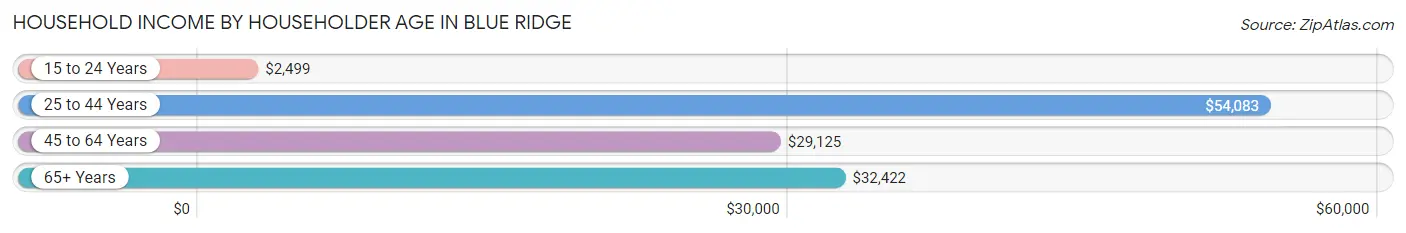
| Income Bracket | # Households | Median Income |
| 15 to 24 Years | 17 (2.8%) | $2,499 |
| 25 to 44 Years | 193 (31.3%) | $54,083 |
| 45 to 64 Years | 147 (23.9%) | $29,125 |
| 65+ Years | 259 (42.0%) | $32,422 |
| Total | 616 (100.0%) | $34,659 |
Poverty in Blue Ridge
Income Below Poverty by Sex and Age in Blue Ridge
With 22.2% poverty level for males and 32.6% for females among the residents of Blue Ridge, 5 year old males and 55 to 64 year old females are the most vulnerable to poverty, with 5 males (100.0%) and 44 females (84.6%) in their respective age groups living below the poverty level.
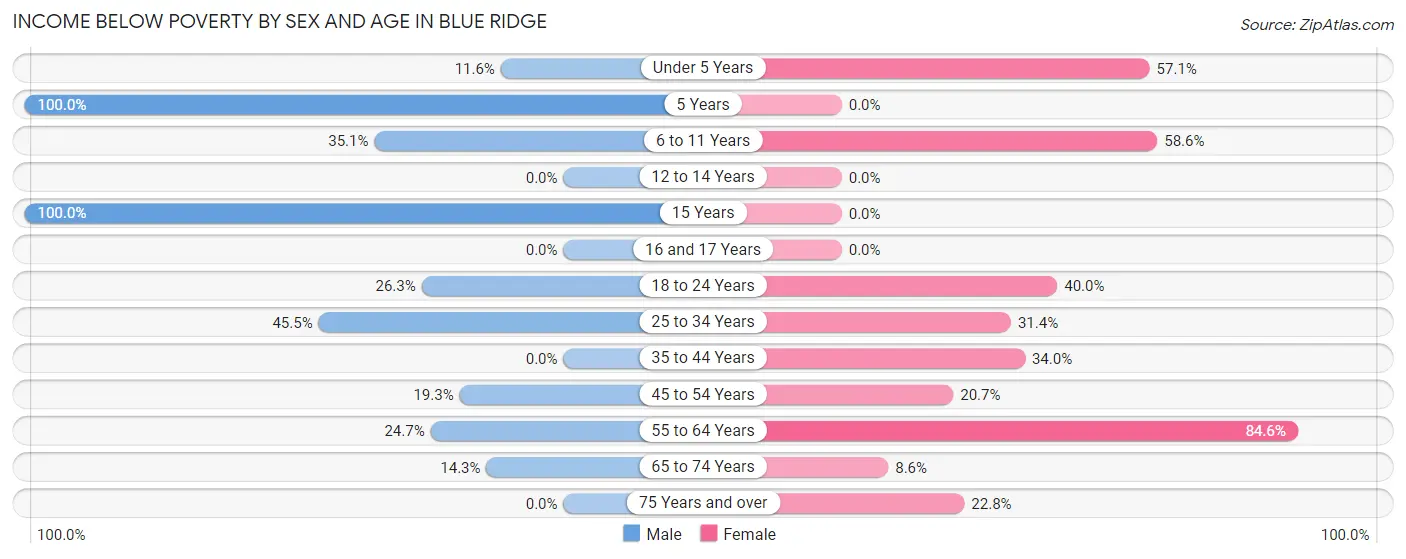
| Age Bracket | Male | Female |
| Under 5 Years | 5 (11.6%) | 16 (57.1%) |
| 5 Years | 5 (100.0%) | 0 (0.0%) |
| 6 to 11 Years | 20 (35.1%) | 41 (58.6%) |
| 12 to 14 Years | 0 (0.0%) | 0 (0.0%) |
| 15 Years | 8 (100.0%) | 0 (0.0%) |
| 16 and 17 Years | 0 (0.0%) | 0 (0.0%) |
| 18 to 24 Years | 10 (26.3%) | 12 (40.0%) |
| 25 to 34 Years | 45 (45.5%) | 27 (31.4%) |
| 35 to 44 Years | 0 (0.0%) | 17 (34.0%) |
| 45 to 54 Years | 16 (19.3%) | 12 (20.7%) |
| 55 to 64 Years | 18 (24.7%) | 44 (84.6%) |
| 65 to 74 Years | 3 (14.3%) | 12 (8.6%) |
| 75 Years and over | 0 (0.0%) | 28 (22.8%) |
| Total | 130 (22.2%) | 209 (32.6%) |
Income Above Poverty by Sex and Age in Blue Ridge
According to the poverty statistics in Blue Ridge, males aged 12 to 14 years and females aged 16 and 17 years are the age groups that are most secure financially, with 100.0% of males and 100.0% of females in these age groups living above the poverty line.
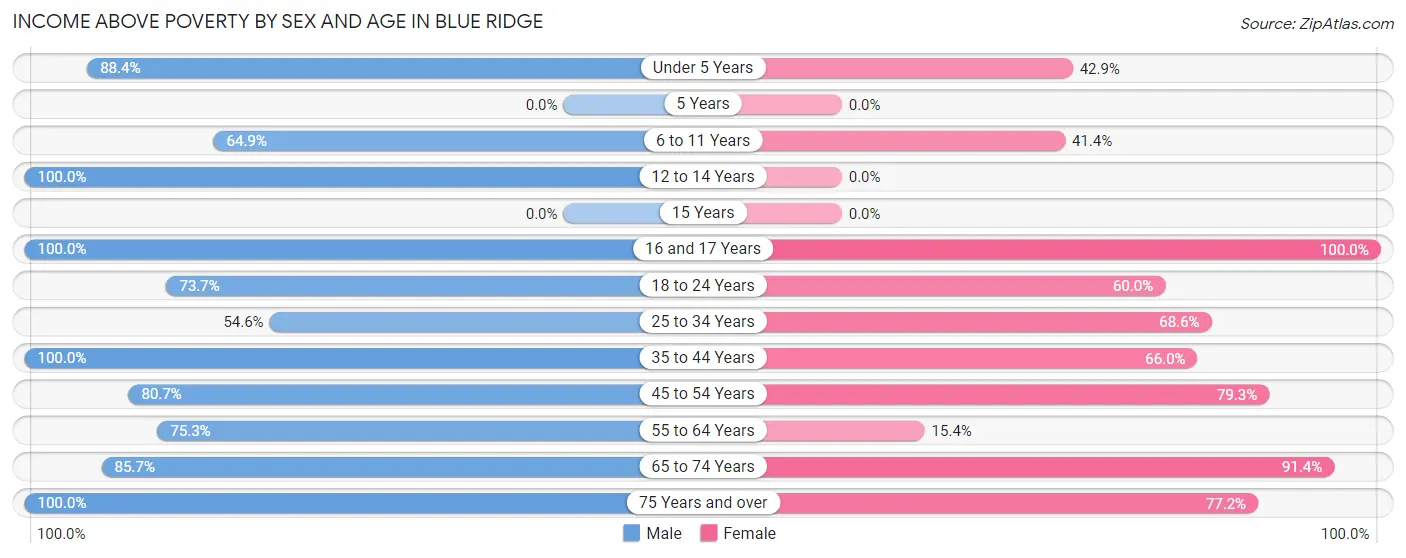
| Age Bracket | Male | Female |
| Under 5 Years | 38 (88.4%) | 12 (42.9%) |
| 5 Years | 0 (0.0%) | 0 (0.0%) |
| 6 to 11 Years | 37 (64.9%) | 29 (41.4%) |
| 12 to 14 Years | 21 (100.0%) | 0 (0.0%) |
| 15 Years | 0 (0.0%) | 0 (0.0%) |
| 16 and 17 Years | 9 (100.0%) | 5 (100.0%) |
| 18 to 24 Years | 28 (73.7%) | 18 (60.0%) |
| 25 to 34 Years | 54 (54.5%) | 59 (68.6%) |
| 35 to 44 Years | 74 (100.0%) | 33 (66.0%) |
| 45 to 54 Years | 67 (80.7%) | 46 (79.3%) |
| 55 to 64 Years | 55 (75.3%) | 8 (15.4%) |
| 65 to 74 Years | 18 (85.7%) | 127 (91.4%) |
| 75 Years and over | 55 (100.0%) | 95 (77.2%) |
| Total | 456 (77.8%) | 432 (67.4%) |
Income Below Poverty Among Married-Couple Families in Blue Ridge
The poverty statistics for married-couple families in Blue Ridge show that 15.6% or 35 of the total 225 families live below the poverty line. Families with no children have the highest poverty rate of 20.9%, comprising of 31 families. On the other hand, families with 3 or 4 children have the lowest poverty rate of 0.0%, which includes 0 families.
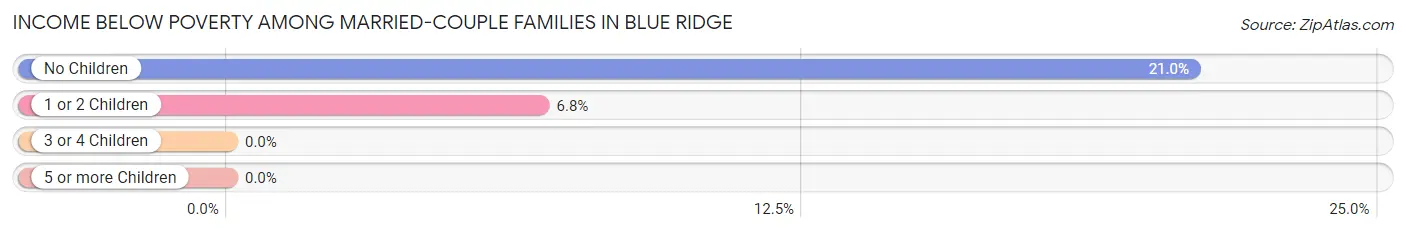
| Children | Above Poverty | Below Poverty |
| No Children | 117 (79.0%) | 31 (20.9%) |
| 1 or 2 Children | 55 (93.2%) | 4 (6.8%) |
| 3 or 4 Children | 18 (100.0%) | 0 (0.0%) |
| 5 or more Children | 0 (0.0%) | 0 (0.0%) |
| Total | 190 (84.4%) | 35 (15.6%) |
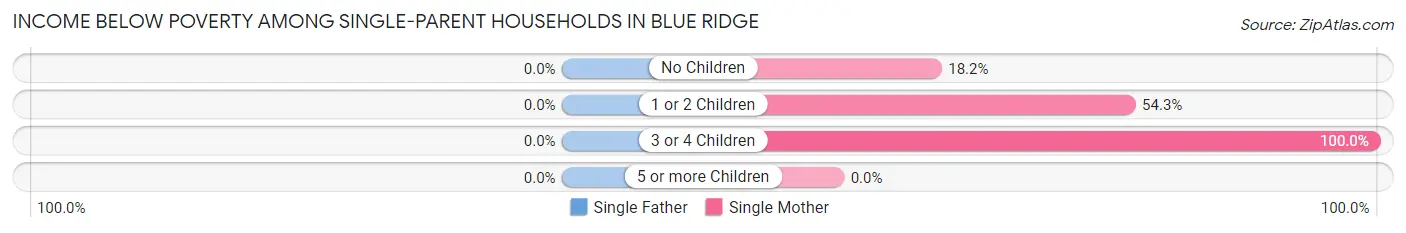
Income Below Poverty Among Single-Parent Households in Blue Ridge
| Children | Single Father | Single Mother |
| No Children | 0 (0.0%) | 2 (18.2%) |
| 1 or 2 Children | 0 (0.0%) | 19 (54.3%) |
| 3 or 4 Children | 0 (0.0%) | 16 (100.0%) |
| 5 or more Children | 0 (0.0%) | 0 (0.0%) |
| Total | 0 (0.0%) | 37 (59.7%) |
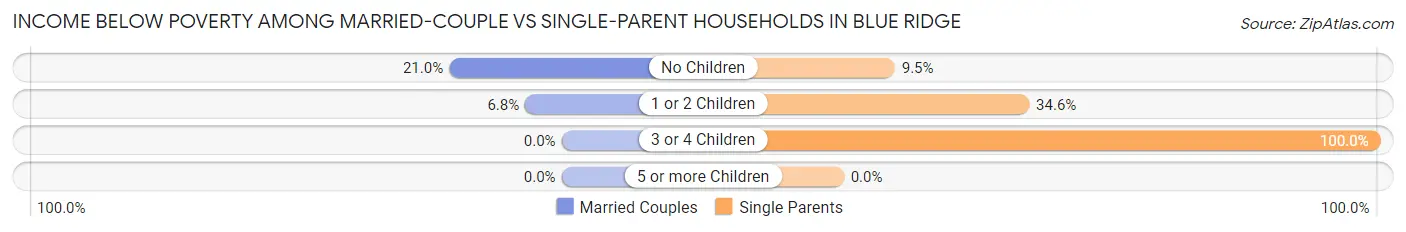
Income Below Poverty Among Married-Couple vs Single-Parent Households in Blue Ridge
The poverty data for Blue Ridge shows that 35 of the married-couple family households (15.6%) and 37 of the single-parent households (40.2%) are living below the poverty level. Within the married-couple family households, those with no children have the highest poverty rate, with 31 households (20.9%) falling below the poverty line. Among the single-parent households, those with 3 or 4 children have the highest poverty rate, with 16 household (100.0%) living below poverty.
| Children | Married-Couple Families | Single-Parent Households |
| No Children | 31 (20.9%) | 2 (9.5%) |
| 1 or 2 Children | 4 (6.8%) | 19 (34.5%) |
| 3 or 4 Children | 0 (0.0%) | 16 (100.0%) |
| 5 or more Children | 0 (0.0%) | 0 (0.0%) |
| Total | 35 (15.6%) | 37 (40.2%) |
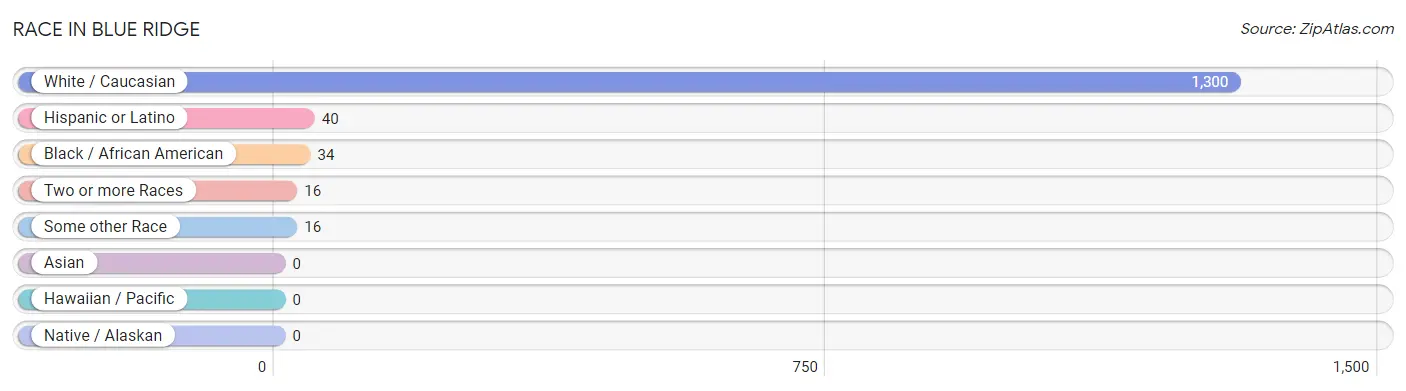
Race in Blue Ridge
The most populous races in Blue Ridge are White / Caucasian (1,300 | 95.2%), Hispanic or Latino (40 | 2.9%), and Black / African American (34 | 2.5%).
| Race | # Population | % Population |
| Asian | 0 | 0.0% |
| Black / African American | 34 | 2.5% |
| Hawaiian / Pacific | 0 | 0.0% |
| Hispanic or Latino | 40 | 2.9% |
| Native / Alaskan | 0 | 0.0% |
| White / Caucasian | 1,300 | 95.2% |
| Two or more Races | 16 | 1.2% |
| Some other Race | 16 | 1.2% |
| Total | 1,366 | 100.0% |
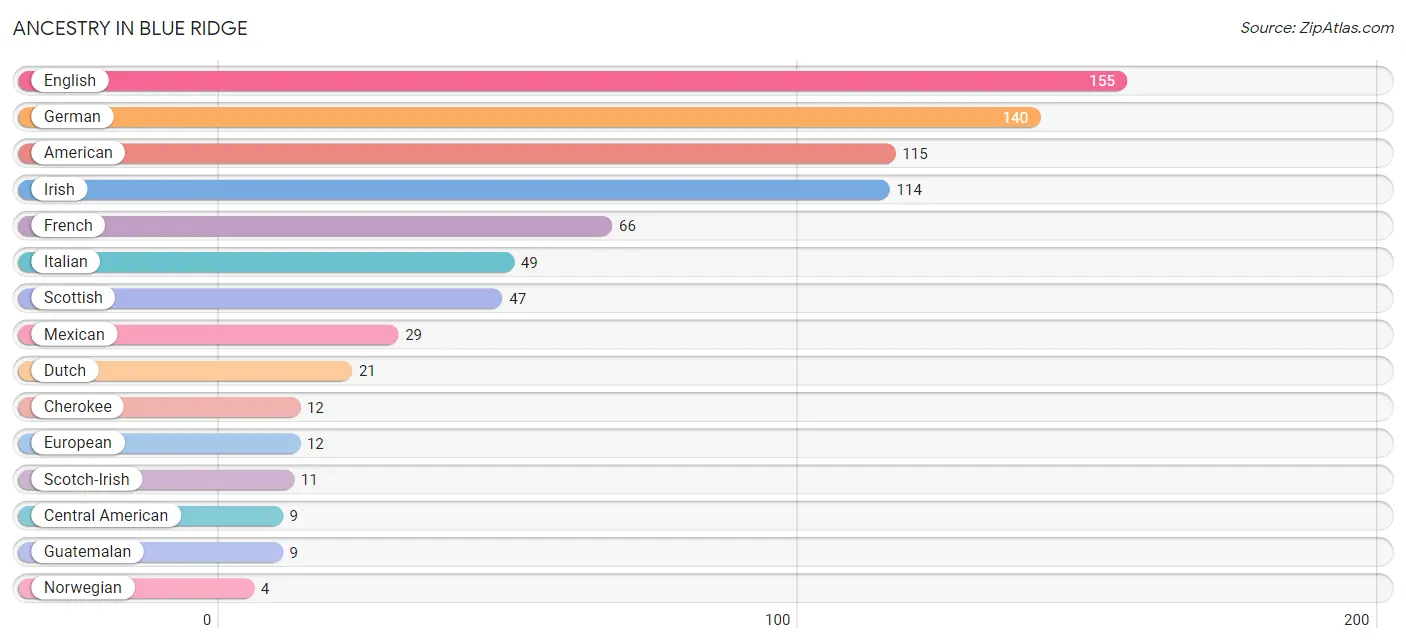
Ancestry in Blue Ridge
The most populous ancestries reported in Blue Ridge are English (155 | 11.4%), German (140 | 10.2%), American (115 | 8.4%), Irish (114 | 8.4%), and French (66 | 4.8%), together accounting for 43.2% of all Blue Ridge residents.
| Ancestry | # Population | % Population |
| American | 115 | 8.4% |
| Central American | 9 | 0.7% |
| Cherokee | 12 | 0.9% |
| Dutch | 21 | 1.5% |
| English | 155 | 11.4% |
| European | 12 | 0.9% |
| French | 66 | 4.8% |
| German | 140 | 10.2% |
| Guatemalan | 9 | 0.7% |
| Irish | 114 | 8.4% |
| Italian | 49 | 3.6% |
| Mexican | 29 | 2.1% |
| Norwegian | 4 | 0.3% |
| Portuguese | 4 | 0.3% |
| Scotch-Irish | 11 | 0.8% |
| Scottish | 47 | 3.4% | View All 16 Rows |
Immigrants in Blue Ridge
The most numerous immigrant groups reported in Blue Ridge came from Central America (18 | 1.3%), Latin America (18 | 1.3%), Guatemala (12 | 0.9%), Eastern Europe (6 | 0.4%), and Europe (6 | 0.4%), together accounting for 4.4% of all Blue Ridge residents.
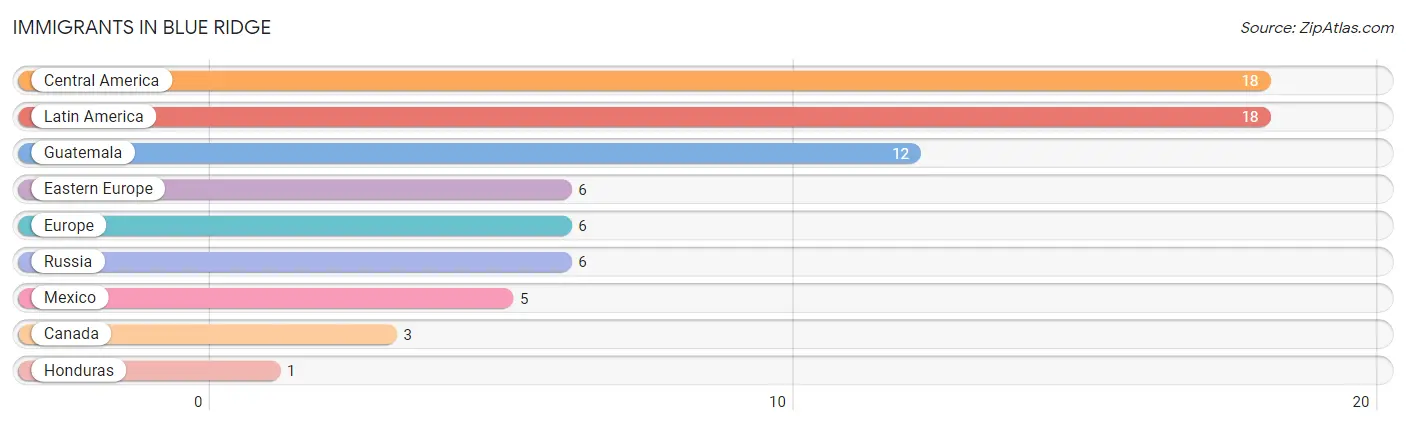
| Immigration Origin | # Population | % Population |
| Canada | 3 | 0.2% |
| Central America | 18 | 1.3% |
| Eastern Europe | 6 | 0.4% |
| Europe | 6 | 0.4% |
| Guatemala | 12 | 0.9% |
| Honduras | 1 | 0.1% |
| Latin America | 18 | 1.3% |
| Mexico | 5 | 0.4% |
| Russia | 6 | 0.4% | View All 9 Rows |
Sex and Age in Blue Ridge
Sex and Age in Blue Ridge
The most populous age groups in Blue Ridge are 30 to 34 Years (70 | 10.2%) for men and 70 to 74 Years (90 | 13.2%) for women.
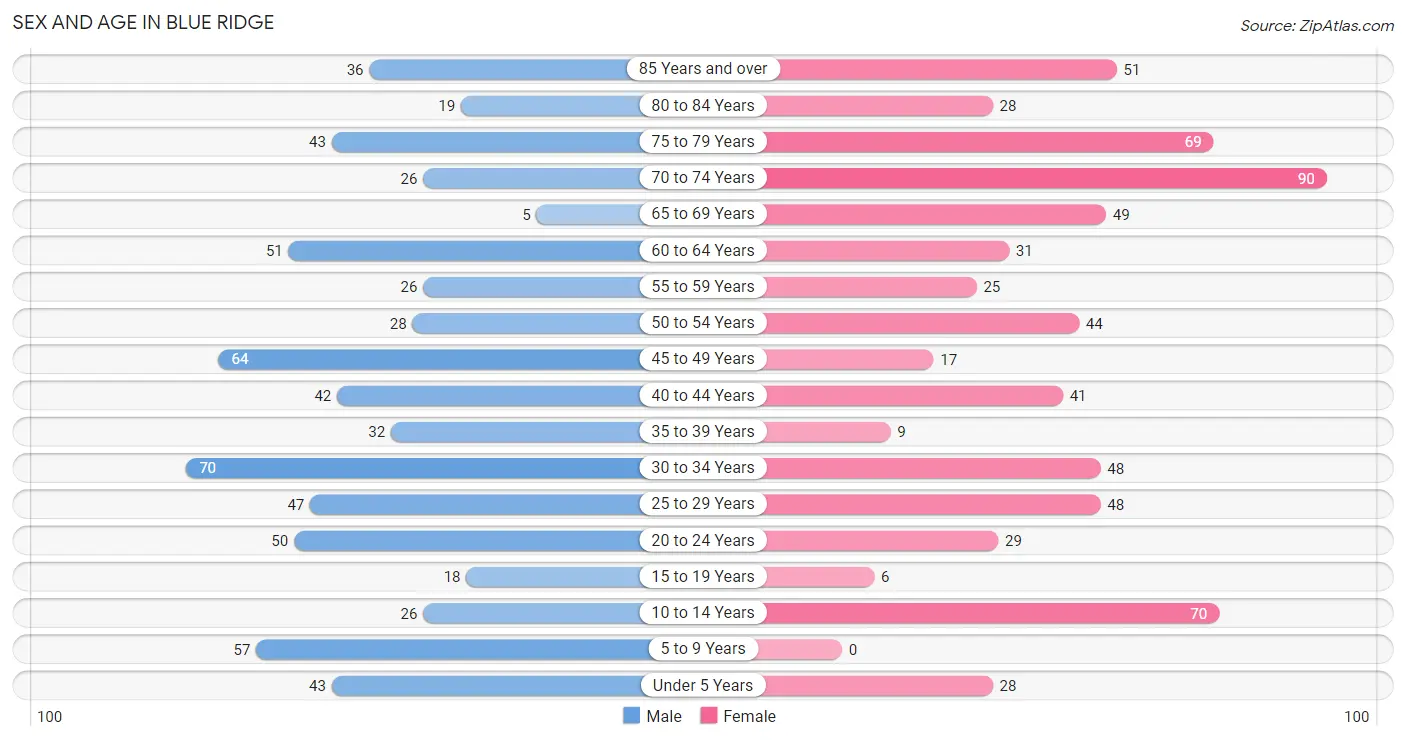
| Age Bracket | Male | Female |
| Under 5 Years | 43 (6.3%) | 28 (4.1%) |
| 5 to 9 Years | 57 (8.4%) | 0 (0.0%) |
| 10 to 14 Years | 26 (3.8%) | 70 (10.2%) |
| 15 to 19 Years | 18 (2.6%) | 6 (0.9%) |
| 20 to 24 Years | 50 (7.3%) | 29 (4.3%) |
| 25 to 29 Years | 47 (6.9%) | 48 (7.0%) |
| 30 to 34 Years | 70 (10.2%) | 48 (7.0%) |
| 35 to 39 Years | 32 (4.7%) | 9 (1.3%) |
| 40 to 44 Years | 42 (6.1%) | 41 (6.0%) |
| 45 to 49 Years | 64 (9.4%) | 17 (2.5%) |
| 50 to 54 Years | 28 (4.1%) | 44 (6.4%) |
| 55 to 59 Years | 26 (3.8%) | 25 (3.7%) |
| 60 to 64 Years | 51 (7.5%) | 31 (4.5%) |
| 65 to 69 Years | 5 (0.7%) | 49 (7.2%) |
| 70 to 74 Years | 26 (3.8%) | 90 (13.2%) |
| 75 to 79 Years | 43 (6.3%) | 69 (10.1%) |
| 80 to 84 Years | 19 (2.8%) | 28 (4.1%) |
| 85 Years and over | 36 (5.3%) | 51 (7.5%) |
| Total | 683 (100.0%) | 683 (100.0%) |
Families and Households in Blue Ridge
Median Family Size in Blue Ridge
The median family size in Blue Ridge is 2.69 persons per family, with single female/mother families (62 | 19.6%) accounting for the largest median family size of 3.08 persons per family. On the other hand, single male/father families (30 | 9.5%) represent the smallest median family size with 2.40 persons per family.
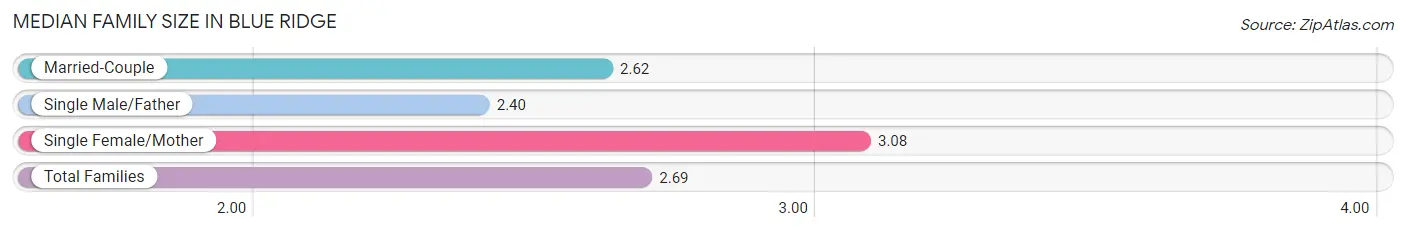
| Family Type | # Families | Family Size |
| Married-Couple | 225 (71.0%) | 2.62 |
| Single Male/Father | 30 (9.5%) | 2.40 |
| Single Female/Mother | 62 (19.6%) | 3.08 |
| Total Families | 317 (100.0%) | 2.69 |
Median Household Size in Blue Ridge
The median household size in Blue Ridge is 1.99 persons per household, with single female/mother households (62 | 10.1%) accounting for the largest median household size of 3.65 persons per household. non-family households (299 | 48.5%) represent the smallest median household size with 1.12 persons per household.
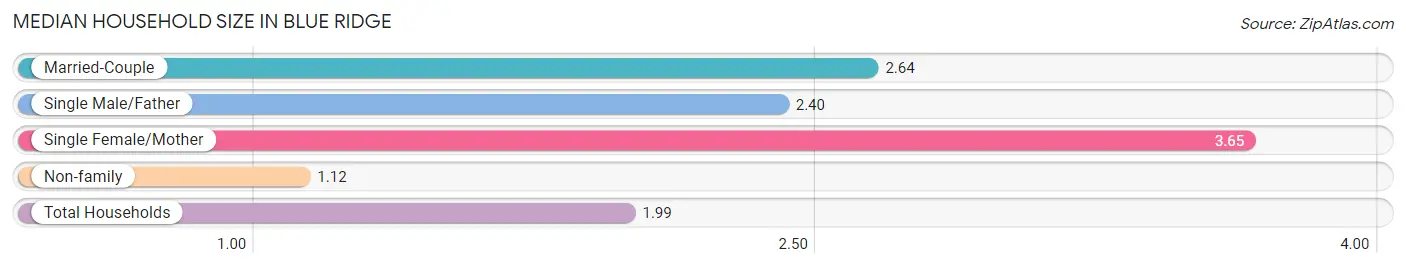
| Household Type | # Households | Household Size |
| Married-Couple | 225 (36.5%) | 2.64 |
| Single Male/Father | 30 (4.9%) | 2.40 |
| Single Female/Mother | 62 (10.1%) | 3.65 |
| Non-family | 299 (48.5%) | 1.12 |
| Total Households | 616 (100.0%) | 1.99 |
Household Size by Marriage Status in Blue Ridge
Out of a total of 616 households in Blue Ridge, 317 (51.5%) are family households, while 299 (48.5%) are nonfamily households. The most numerous type of family households are 2-person households, comprising 126, and the most common type of nonfamily households are 1-person households, comprising 268.
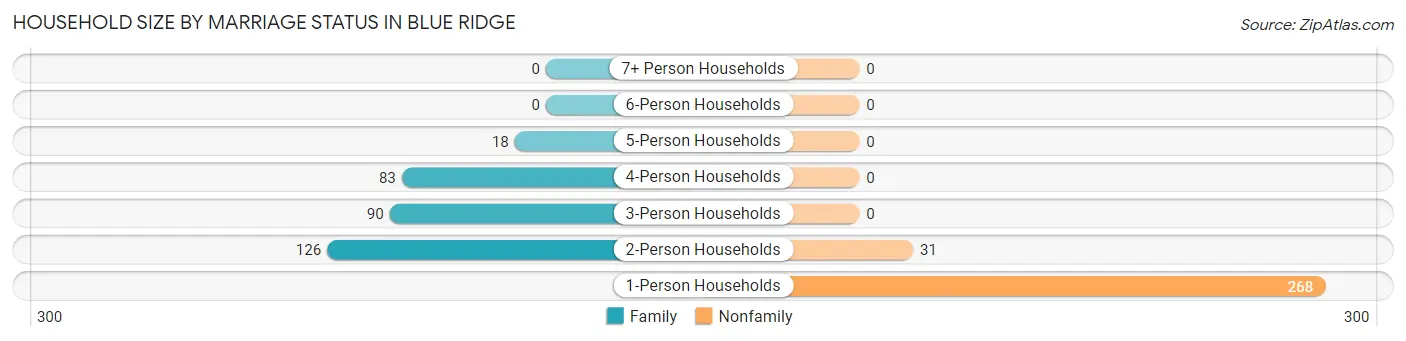
| Household Size | Family Households | Nonfamily Households |
| 1-Person Households | - | 268 (43.5%) |
| 2-Person Households | 126 (20.4%) | 31 (5.0%) |
| 3-Person Households | 90 (14.6%) | 0 (0.0%) |
| 4-Person Households | 83 (13.5%) | 0 (0.0%) |
| 5-Person Households | 18 (2.9%) | 0 (0.0%) |
| 6-Person Households | 0 (0.0%) | 0 (0.0%) |
| 7+ Person Households | 0 (0.0%) | 0 (0.0%) |
| Total | 317 (51.5%) | 299 (48.5%) |
Female Fertility in Blue Ridge
Fertility by Age in Blue Ridge
Average fertility rate in Blue Ridge is 15.0 births per 1,000 women. Women in the age bracket of 20 to 34 years have the highest fertility rate with 24.0 births per 1,000 women. Women in the age bracket of 20 to 34 years acount for 100.0% of all women with births.
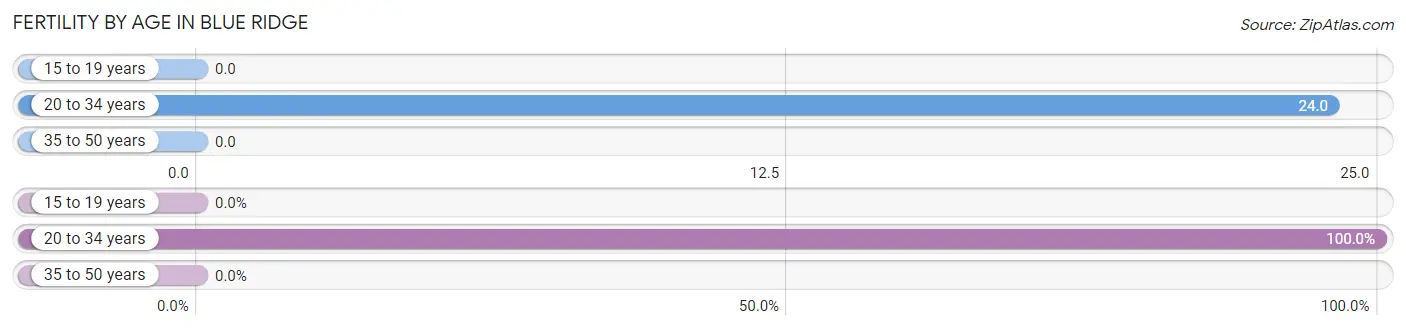
| Age Bracket | Women with Births | Births / 1,000 Women |
| 15 to 19 years | 0 (0.0%) | 0.0 |
| 20 to 34 years | 3 (100.0%) | 24.0 |
| 35 to 50 years | 0 (0.0%) | 0.0 |
| Total | 3 (100.0%) | 15.0 |
Fertility by Age by Marriage Status in Blue Ridge
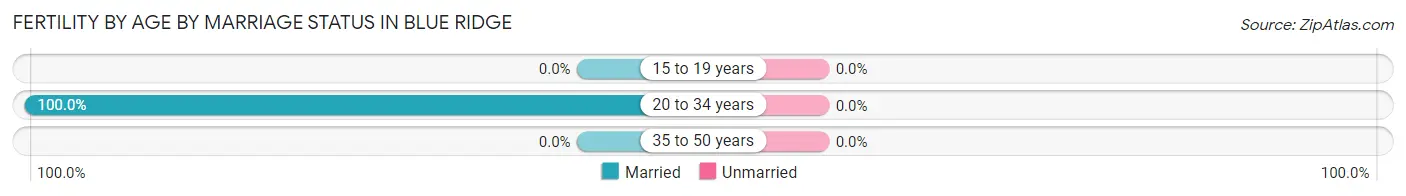
| Age Bracket | Married | Unmarried |
| 15 to 19 years | 0 (0.0%) | 0 (0.0%) |
| 20 to 34 years | 3 (100.0%) | 0 (0.0%) |
| 35 to 50 years | 0 (0.0%) | 0 (0.0%) |
| Total | 3 (100.0%) | 0 (0.0%) |
Fertility by Education in Blue Ridge
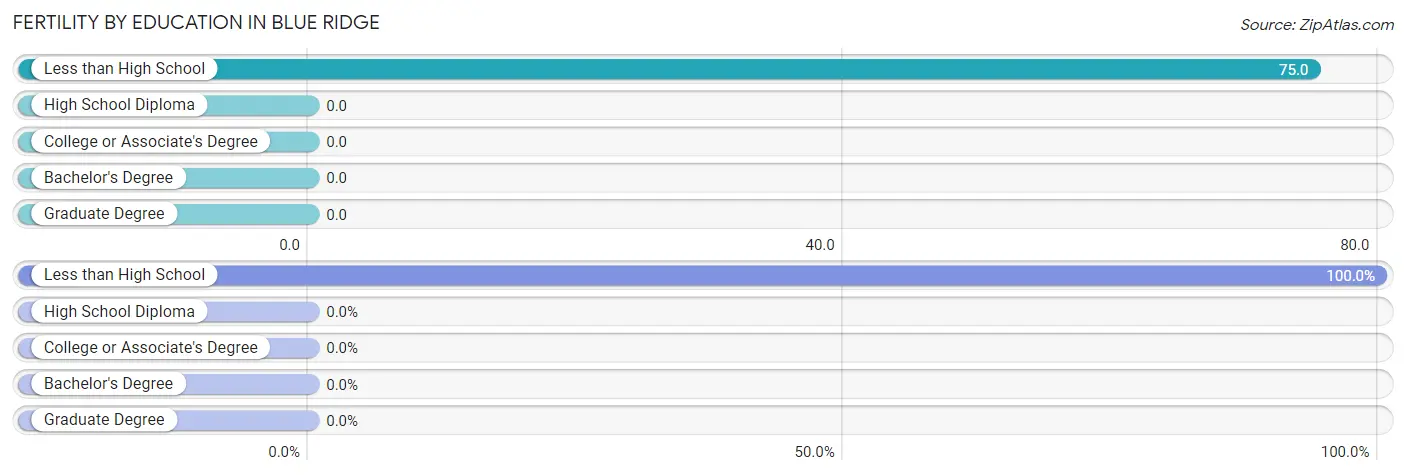
| Educational Attainment | Women with Births | Births / 1,000 Women |
| Less than High School | 3 (100.0%) | 75.0 |
| High School Diploma | 0 (0.0%) | 0.0 |
| College or Associate's Degree | 0 (0.0%) | 0.0 |
| Bachelor's Degree | 0 (0.0%) | 0.0 |
| Graduate Degree | 0 (0.0%) | 0.0 |
| Total | 3 (100.0%) | 15.0 |
Fertility by Education by Marriage Status in Blue Ridge
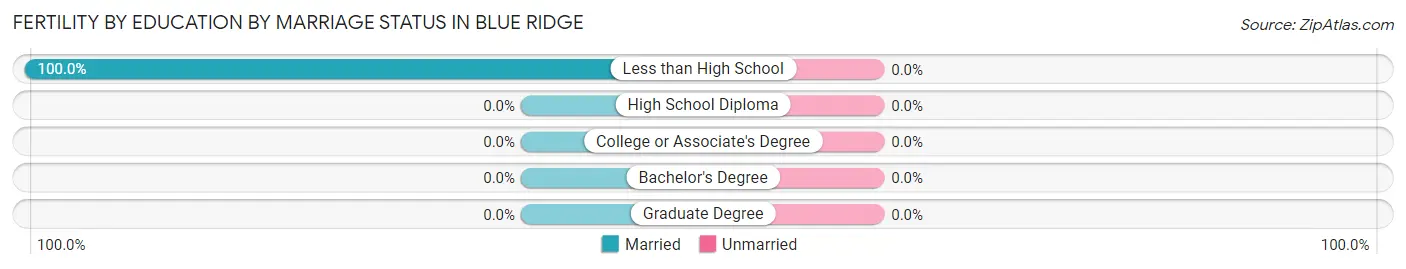
| Educational Attainment | Married | Unmarried |
| Less than High School | 3 (100.0%) | 0 (0.0%) |
| High School Diploma | 0 (0.0%) | 0 (0.0%) |
| College or Associate's Degree | 0 (0.0%) | 0 (0.0%) |
| Bachelor's Degree | 0 (0.0%) | 0 (0.0%) |
| Graduate Degree | 0 (0.0%) | 0 (0.0%) |
| Total | 3 (100.0%) | 0 (0.0%) |
Employment Characteristics in Blue Ridge
Employment by Class of Employer in Blue Ridge
Among the 422 employed individuals in Blue Ridge, private company employees (303 | 71.8%), self-employed (not incorporated) (37 | 8.8%), and federal government employees (33 | 7.8%) make up the most common classes of employment.
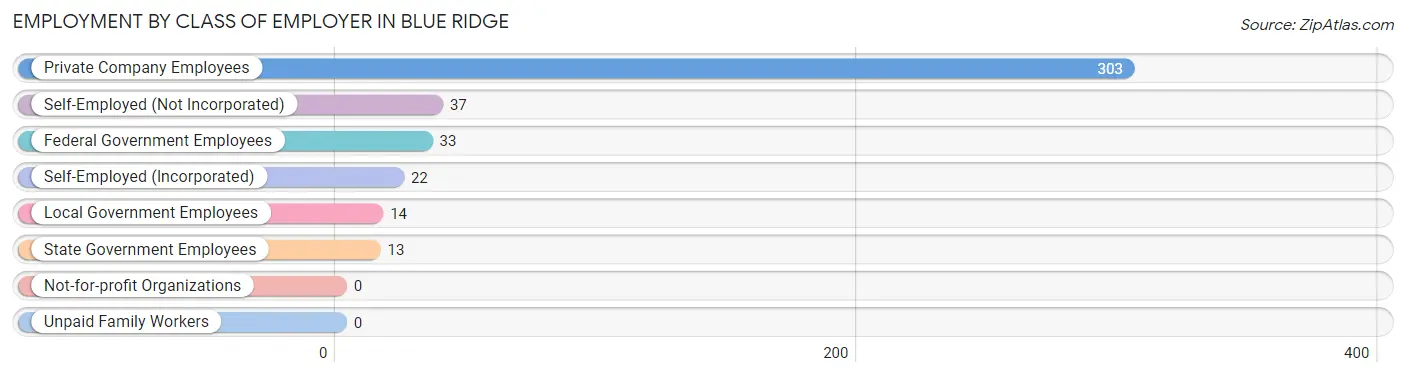
| Employer Class | # Employees | % Employees |
| Private Company Employees | 303 | 71.8% |
| Self-Employed (Incorporated) | 22 | 5.2% |
| Self-Employed (Not Incorporated) | 37 | 8.8% |
| Not-for-profit Organizations | 0 | 0.0% |
| Local Government Employees | 14 | 3.3% |
| State Government Employees | 13 | 3.1% |
| Federal Government Employees | 33 | 7.8% |
| Unpaid Family Workers | 0 | 0.0% |
| Total | 422 | 100.0% |
Employment Status by Age in Blue Ridge
According to the labor force statistics for Blue Ridge, out of the total population over 16 years of age (1,134), 39.0% or 442 individuals are in the labor force, with 0.9% or 4 of them unemployed. The age group with the highest labor force participation rate is 25 to 29 years, with 81.1% or 77 individuals in the labor force. Within the labor force, the 75 years and over age range has the highest percentage of unemployed individuals, with 50.0% or 4 of them being unemployed.
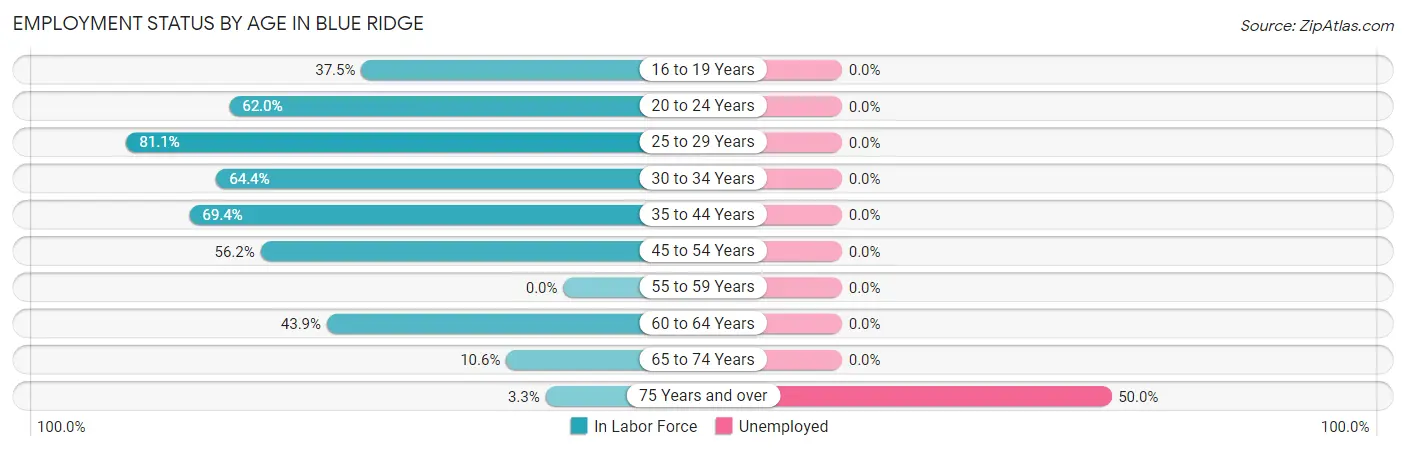
| Age Bracket | In Labor Force | Unemployed |
| 16 to 19 Years | 6 (37.5%) | 0 (0.0%) |
| 20 to 24 Years | 49 (62.0%) | 0 (0.0%) |
| 25 to 29 Years | 77 (81.1%) | 0 (0.0%) |
| 30 to 34 Years | 76 (64.4%) | 0 (0.0%) |
| 35 to 44 Years | 86 (69.4%) | 0 (0.0%) |
| 45 to 54 Years | 86 (56.2%) | 0 (0.0%) |
| 55 to 59 Years | 0 (0.0%) | 0 (0.0%) |
| 60 to 64 Years | 36 (43.9%) | 0 (0.0%) |
| 65 to 74 Years | 18 (10.6%) | 0 (0.0%) |
| 75 Years and over | 8 (3.3%) | 4 (50.0%) |
| Total | 442 (39.0%) | 4 (0.9%) |
Employment Status by Educational Attainment in Blue Ridge
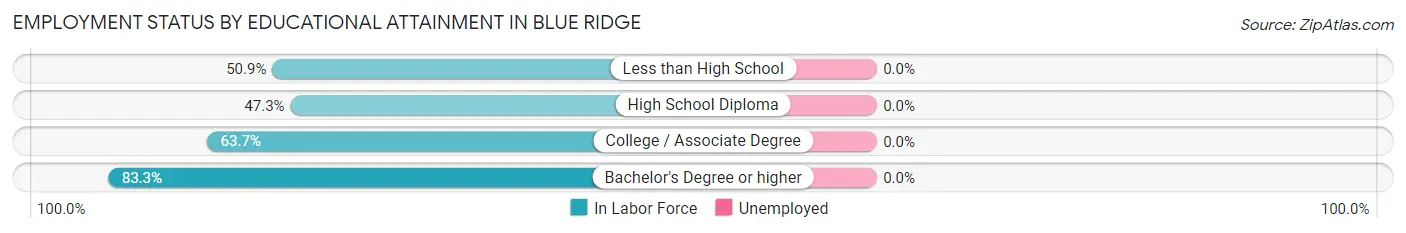
| Educational Attainment | In Labor Force | Unemployed |
| Less than High School | 88 (50.9%) | 0 (0.0%) |
| High School Diploma | 87 (47.3%) | 0 (0.0%) |
| College / Associate Degree | 116 (63.7%) | 0 (0.0%) |
| Bachelor's Degree or higher | 70 (83.3%) | 0 (0.0%) |
| Total | 361 (57.9%) | 0 (0.0%) |
Employment Occupations by Sex in Blue Ridge
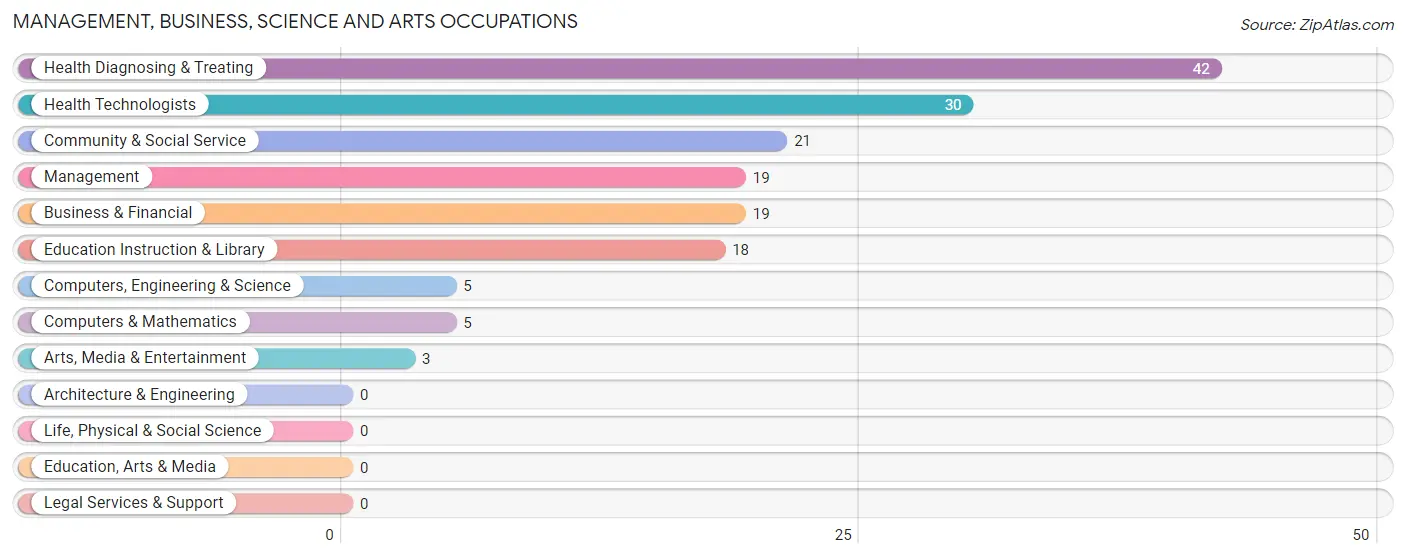
Management, Business, Science and Arts Occupations
The most common Management, Business, Science and Arts occupations in Blue Ridge are Health Diagnosing & Treating (42 | 9.6%), Health Technologists (30 | 6.9%), Community & Social Service (21 | 4.8%), Management (19 | 4.3%), and Business & Financial (19 | 4.3%).
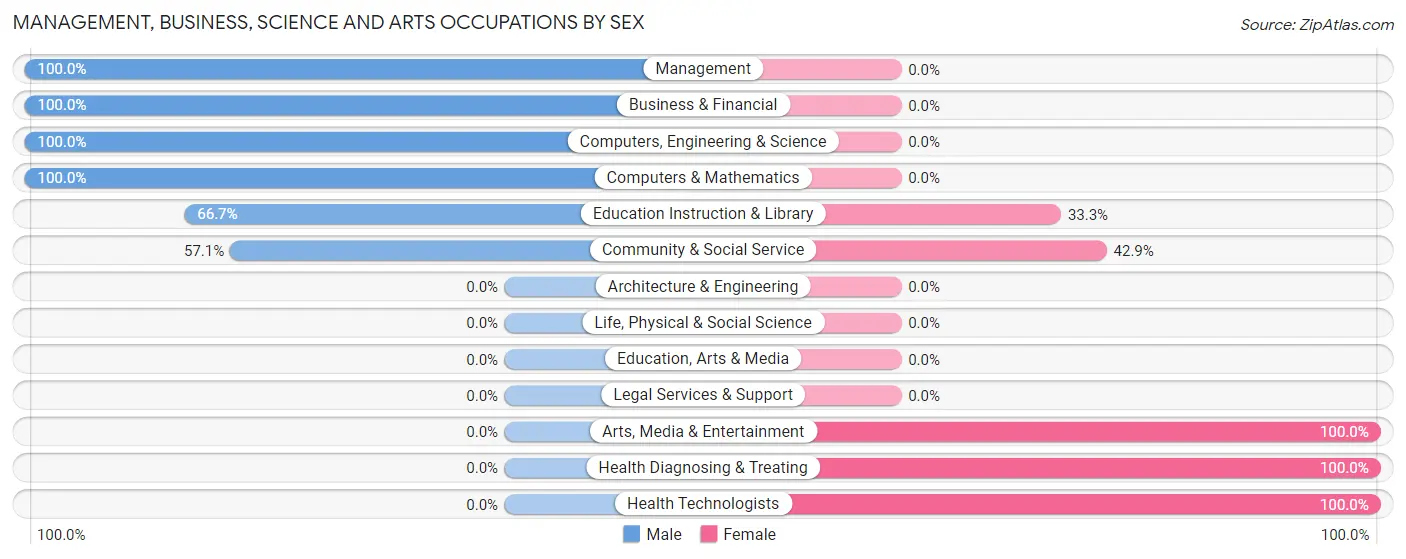
Management, Business, Science and Arts Occupations by Sex
Within the Management, Business, Science and Arts occupations in Blue Ridge, the most male-oriented occupations are Management (100.0%), Business & Financial (100.0%), and Computers, Engineering & Science (100.0%), while the most female-oriented occupations are Arts, Media & Entertainment (100.0%), Health Diagnosing & Treating (100.0%), and Health Technologists (100.0%).
| Occupation | Male | Female |
| Management | 19 (100.0%) | 0 (0.0%) |
| Business & Financial | 19 (100.0%) | 0 (0.0%) |
| Computers, Engineering & Science | 5 (100.0%) | 0 (0.0%) |
| Computers & Mathematics | 5 (100.0%) | 0 (0.0%) |
| Architecture & Engineering | 0 (0.0%) | 0 (0.0%) |
| Life, Physical & Social Science | 0 (0.0%) | 0 (0.0%) |
| Community & Social Service | 12 (57.1%) | 9 (42.9%) |
| Education, Arts & Media | 0 (0.0%) | 0 (0.0%) |
| Legal Services & Support | 0 (0.0%) | 0 (0.0%) |
| Education Instruction & Library | 12 (66.7%) | 6 (33.3%) |
| Arts, Media & Entertainment | 0 (0.0%) | 3 (100.0%) |
| Health Diagnosing & Treating | 0 (0.0%) | 42 (100.0%) |
| Health Technologists | 0 (0.0%) | 30 (100.0%) |
| Total (Category) | 55 (51.9%) | 51 (48.1%) |
| Total (Overall) | 261 (59.6%) | 177 (40.4%) |
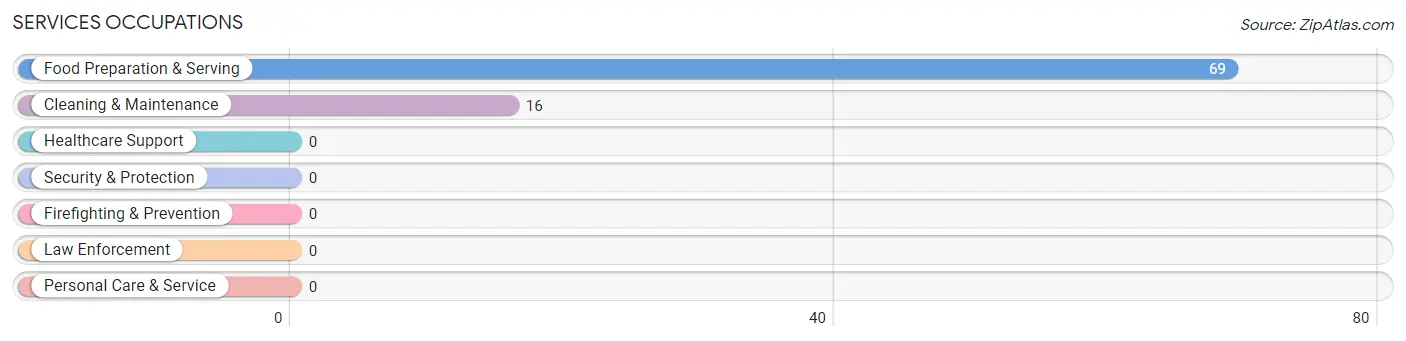
Services Occupations
The most common Services occupations in Blue Ridge are Food Preparation & Serving (69 | 15.8%), and Cleaning & Maintenance (16 | 3.6%).
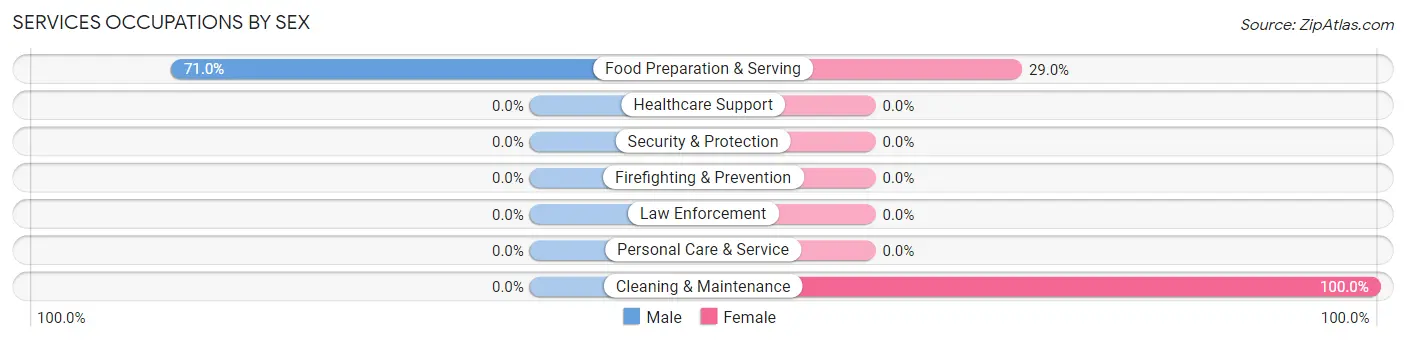
Services Occupations by Sex
| Occupation | Male | Female |
| Healthcare Support | 0 (0.0%) | 0 (0.0%) |
| Security & Protection | 0 (0.0%) | 0 (0.0%) |
| Firefighting & Prevention | 0 (0.0%) | 0 (0.0%) |
| Law Enforcement | 0 (0.0%) | 0 (0.0%) |
| Food Preparation & Serving | 49 (71.0%) | 20 (29.0%) |
| Cleaning & Maintenance | 0 (0.0%) | 16 (100.0%) |
| Personal Care & Service | 0 (0.0%) | 0 (0.0%) |
| Total (Category) | 49 (57.7%) | 36 (42.3%) |
| Total (Overall) | 261 (59.6%) | 177 (40.4%) |
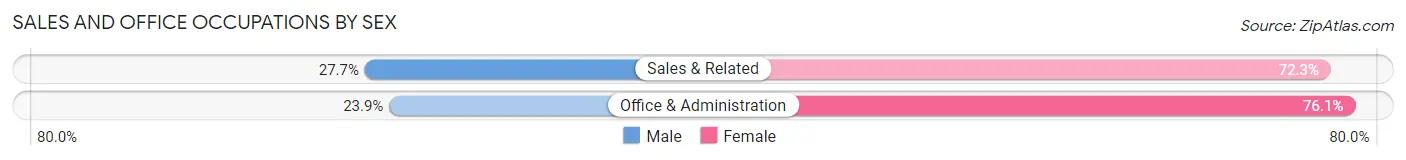
Sales and Office Occupations
The most common Sales and Office occupations in Blue Ridge are Sales & Related (47 | 10.7%), and Office & Administration (46 | 10.5%).

Sales and Office Occupations by Sex
| Occupation | Male | Female |
| Sales & Related | 13 (27.7%) | 34 (72.3%) |
| Office & Administration | 11 (23.9%) | 35 (76.1%) |
| Total (Category) | 24 (25.8%) | 69 (74.2%) |
| Total (Overall) | 261 (59.6%) | 177 (40.4%) |
Natural Resources, Construction and Maintenance Occupations
The most common Natural Resources, Construction and Maintenance occupations in Blue Ridge are Construction & Extraction (45 | 10.3%), and Installation, Maintenance & Repair (5 | 1.1%).
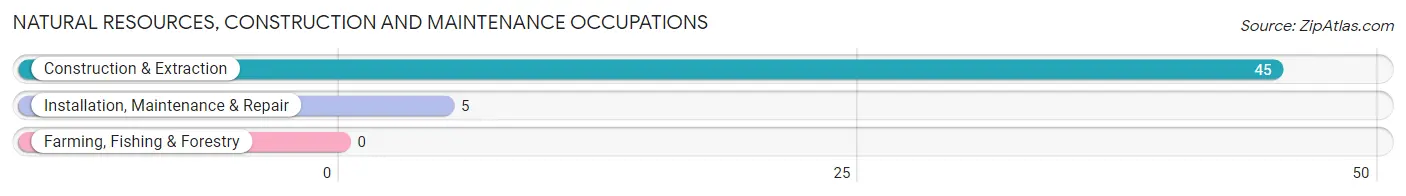
Natural Resources, Construction and Maintenance Occupations by Sex

| Occupation | Male | Female |
| Farming, Fishing & Forestry | 0 (0.0%) | 0 (0.0%) |
| Construction & Extraction | 45 (100.0%) | 0 (0.0%) |
| Installation, Maintenance & Repair | 5 (100.0%) | 0 (0.0%) |
| Total (Category) | 50 (100.0%) | 0 (0.0%) |
| Total (Overall) | 261 (59.6%) | 177 (40.4%) |
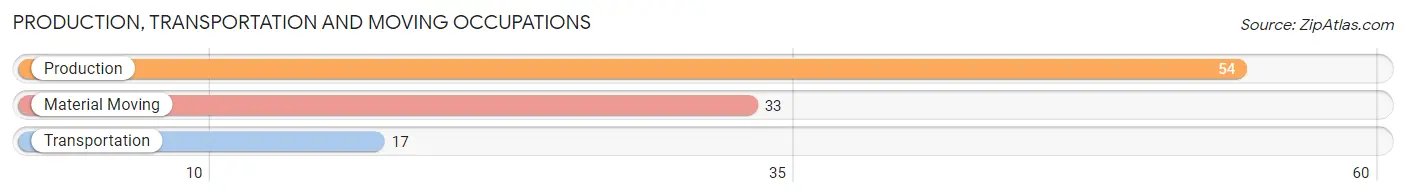
Production, Transportation and Moving Occupations
The most common Production, Transportation and Moving occupations in Blue Ridge are Production (54 | 12.3%), Material Moving (33 | 7.5%), and Transportation (17 | 3.9%).
Production, Transportation and Moving Occupations by Sex
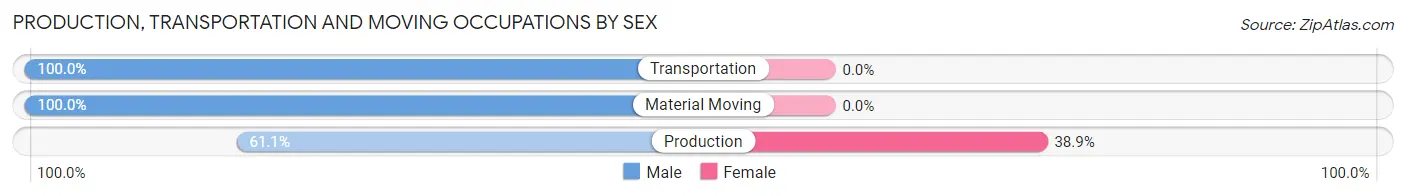
| Occupation | Male | Female |
| Production | 33 (61.1%) | 21 (38.9%) |
| Transportation | 17 (100.0%) | 0 (0.0%) |
| Material Moving | 33 (100.0%) | 0 (0.0%) |
| Total (Category) | 83 (79.8%) | 21 (20.2%) |
| Total (Overall) | 261 (59.6%) | 177 (40.4%) |
Employment Industries by Sex in Blue Ridge
Employment Industries in Blue Ridge
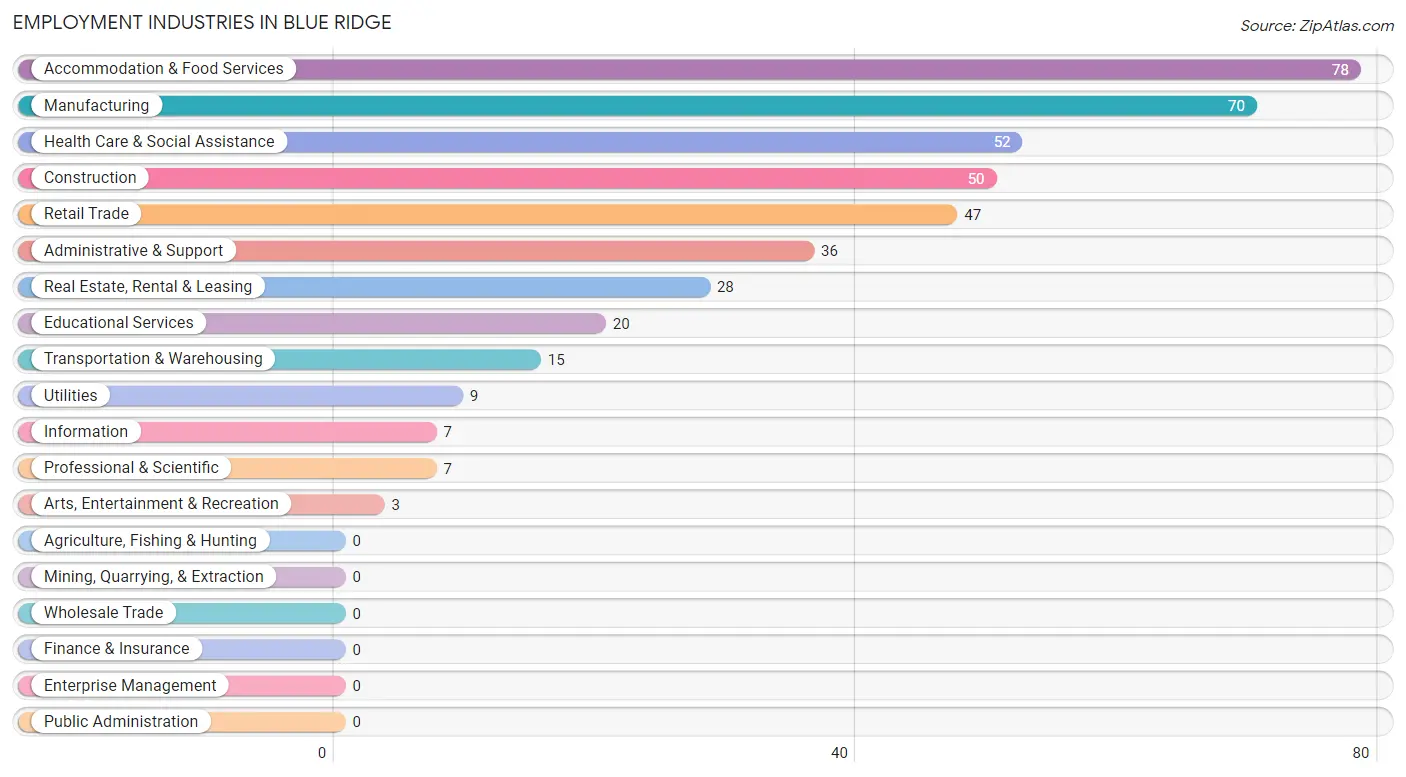
The major employment industries in Blue Ridge include Accommodation & Food Services (78 | 17.8%), Manufacturing (70 | 16.0%), Health Care & Social Assistance (52 | 11.9%), Construction (50 | 11.4%), and Retail Trade (47 | 10.7%).
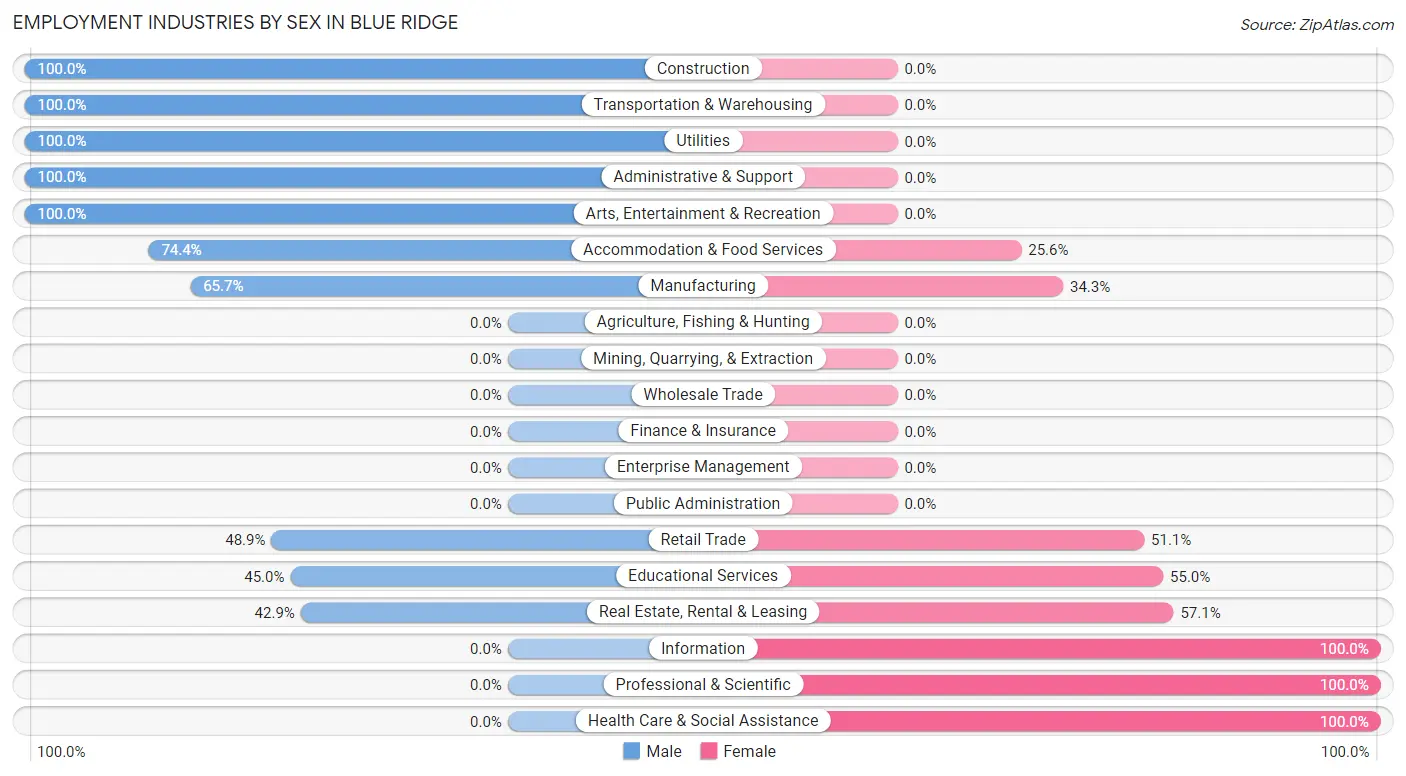
Employment Industries by Sex in Blue Ridge
The Blue Ridge industries that see more men than women are Construction (100.0%), Transportation & Warehousing (100.0%), and Utilities (100.0%), whereas the industries that tend to have a higher number of women are Information (100.0%), Professional & Scientific (100.0%), and Health Care & Social Assistance (100.0%).
| Industry | Male | Female |
| Agriculture, Fishing & Hunting | 0 (0.0%) | 0 (0.0%) |
| Mining, Quarrying, & Extraction | 0 (0.0%) | 0 (0.0%) |
| Construction | 50 (100.0%) | 0 (0.0%) |
| Manufacturing | 46 (65.7%) | 24 (34.3%) |
| Wholesale Trade | 0 (0.0%) | 0 (0.0%) |
| Retail Trade | 23 (48.9%) | 24 (51.1%) |
| Transportation & Warehousing | 15 (100.0%) | 0 (0.0%) |
| Utilities | 9 (100.0%) | 0 (0.0%) |
| Information | 0 (0.0%) | 7 (100.0%) |
| Finance & Insurance | 0 (0.0%) | 0 (0.0%) |
| Real Estate, Rental & Leasing | 12 (42.9%) | 16 (57.1%) |
| Professional & Scientific | 0 (0.0%) | 7 (100.0%) |
| Enterprise Management | 0 (0.0%) | 0 (0.0%) |
| Administrative & Support | 36 (100.0%) | 0 (0.0%) |
| Educational Services | 9 (45.0%) | 11 (55.0%) |
| Health Care & Social Assistance | 0 (0.0%) | 52 (100.0%) |
| Arts, Entertainment & Recreation | 3 (100.0%) | 0 (0.0%) |
| Accommodation & Food Services | 58 (74.4%) | 20 (25.6%) |
| Public Administration | 0 (0.0%) | 0 (0.0%) |
| Total | 261 (59.6%) | 177 (40.4%) |
Education in Blue Ridge
School Enrollment in Blue Ridge
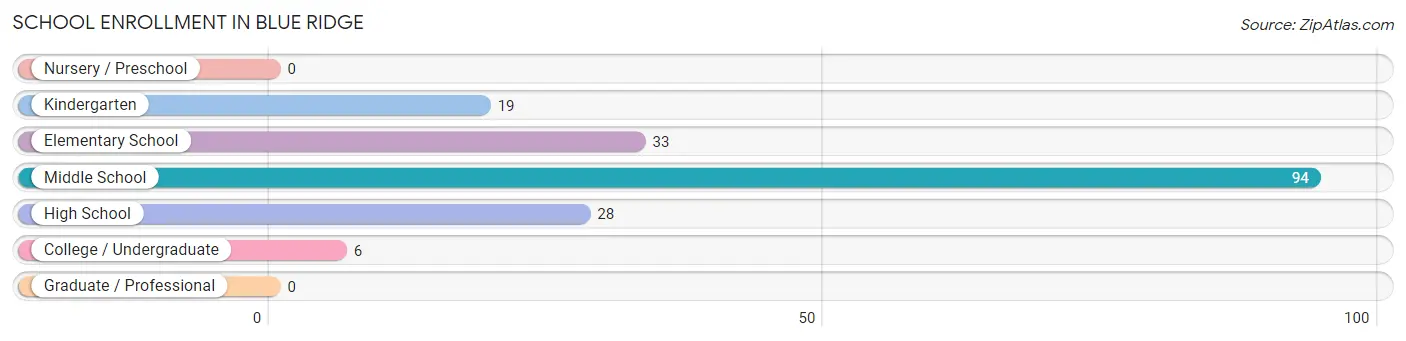
The most common levels of schooling among the 180 students in Blue Ridge are middle school (94 | 52.2%), elementary school (33 | 18.3%), and high school (28 | 15.6%).
| School Level | # Students | % Students |
| Nursery / Preschool | 0 | 0.0% |
| Kindergarten | 19 | 10.6% |
| Elementary School | 33 | 18.3% |
| Middle School | 94 | 52.2% |
| High School | 28 | 15.6% |
| College / Undergraduate | 6 | 3.3% |
| Graduate / Professional | 0 | 0.0% |
| Total | 180 | 100.0% |
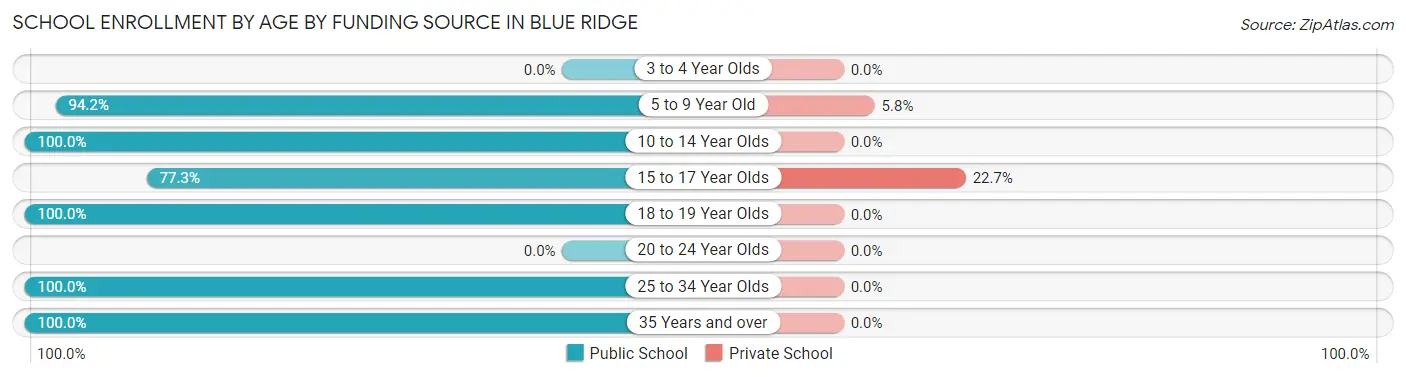
School Enrollment by Age by Funding Source in Blue Ridge
Out of a total of 180 students who are enrolled in schools in Blue Ridge, 8 (4.4%) attend a private institution, while the remaining 172 (95.6%) are enrolled in public schools. The age group of 15 to 17 year olds has the highest likelihood of being enrolled in private schools, with 5 (22.7% in the age bracket) enrolled. Conversely, the age group of 10 to 14 year olds has the lowest likelihood of being enrolled in a private school, with 96 (100.0% in the age bracket) attending a public institution.
| Age Bracket | Public School | Private School |
| 3 to 4 Year Olds | 0 (0.0%) | 0 (0.0%) |
| 5 to 9 Year Old | 49 (94.2%) | 3 (5.8%) |
| 10 to 14 Year Olds | 96 (100.0%) | 0 (0.0%) |
| 15 to 17 Year Olds | 17 (77.3%) | 5 (22.7%) |
| 18 to 19 Year Olds | 1 (100.0%) | 0 (0.0%) |
| 20 to 24 Year Olds | 0 (0.0%) | 0 (0.0%) |
| 25 to 34 Year Olds | 6 (100.0%) | 0 (0.0%) |
| 35 Years and over | 3 (100.0%) | 0 (0.0%) |
| Total | 172 (95.6%) | 8 (4.4%) |
Educational Attainment by Field of Study in Blue Ridge
Business (43 | 20.6%), education (39 | 18.7%), computers & mathematics (36 | 17.2%), bio, nature & agricultural (24 | 11.5%), and arts & humanities (24 | 11.5%) are the most common fields of study among 209 individuals in Blue Ridge who have obtained a bachelor's degree or higher.
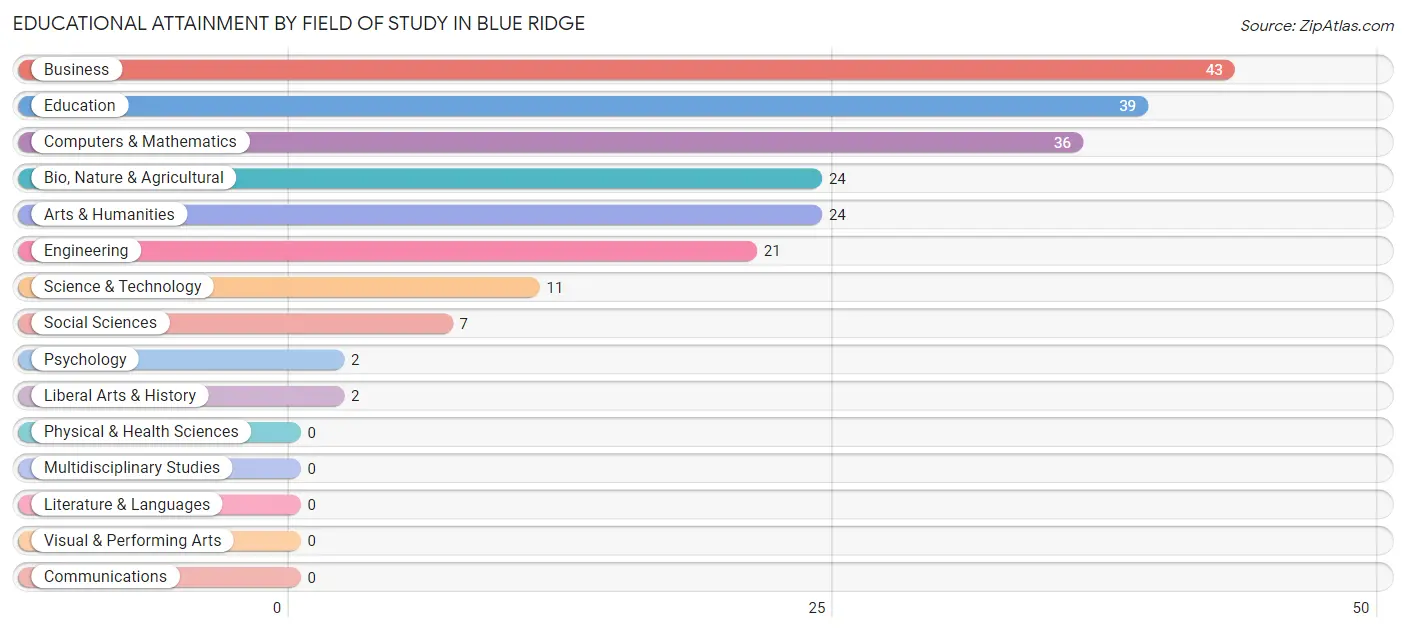
| Field of Study | # Graduates | % Graduates |
| Computers & Mathematics | 36 | 17.2% |
| Bio, Nature & Agricultural | 24 | 11.5% |
| Physical & Health Sciences | 0 | 0.0% |
| Psychology | 2 | 1.0% |
| Social Sciences | 7 | 3.4% |
| Engineering | 21 | 10.1% |
| Multidisciplinary Studies | 0 | 0.0% |
| Science & Technology | 11 | 5.3% |
| Business | 43 | 20.6% |
| Education | 39 | 18.7% |
| Literature & Languages | 0 | 0.0% |
| Liberal Arts & History | 2 | 1.0% |
| Visual & Performing Arts | 0 | 0.0% |
| Communications | 0 | 0.0% |
| Arts & Humanities | 24 | 11.5% |
| Total | 209 | 100.0% |
Transportation & Commute in Blue Ridge
Vehicle Availability by Sex in Blue Ridge
The most prevalent vehicle ownership categories in Blue Ridge are males with 2 vehicles (68, accounting for 26.4%) and females with 2 vehicles (44, making up 41.5%).
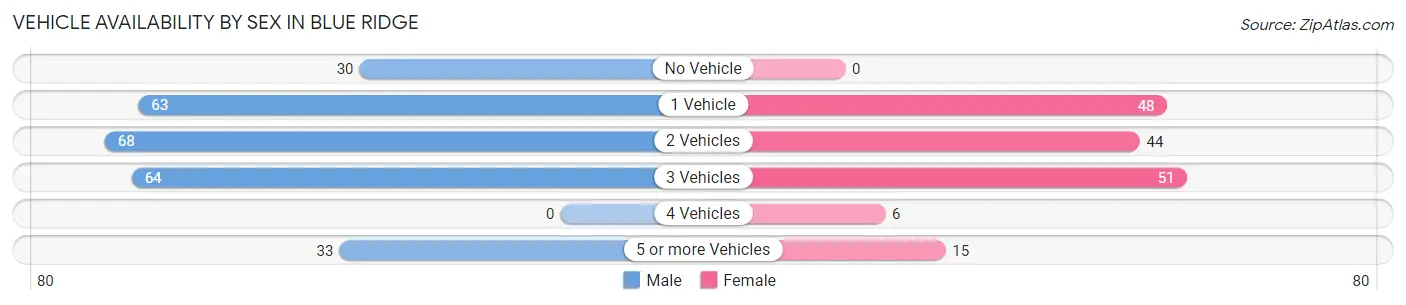
| Vehicles Available | Male | Female |
| No Vehicle | 30 (11.6%) | 0 (0.0%) |
| 1 Vehicle | 63 (24.4%) | 48 (29.3%) |
| 2 Vehicles | 68 (26.4%) | 44 (26.8%) |
| 3 Vehicles | 64 (24.8%) | 51 (31.1%) |
| 4 Vehicles | 0 (0.0%) | 6 (3.7%) |
| 5 or more Vehicles | 33 (12.8%) | 15 (9.1%) |
| Total | 258 (100.0%) | 164 (100.0%) |
Commute Time in Blue Ridge
The most frequently occuring commute durations in Blue Ridge are 5 to 9 minutes (108 commuters, 26.7%), 15 to 19 minutes (101 commuters, 25.0%), and 30 to 34 minutes (43 commuters, 10.6%).
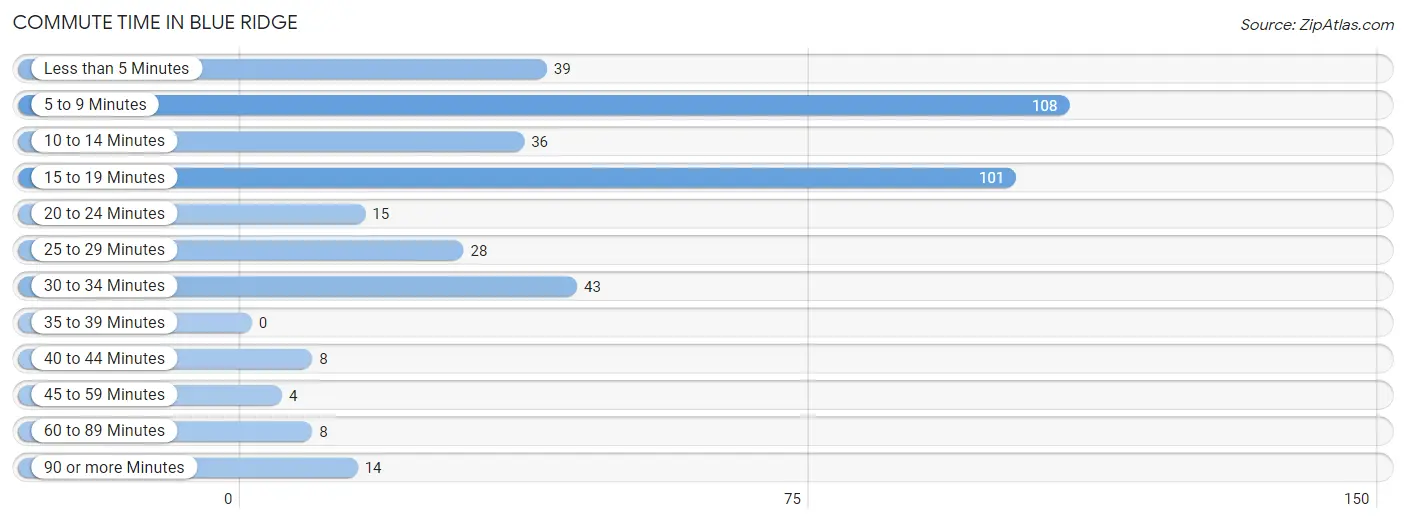
| Commute Time | # Commuters | % Commuters |
| Less than 5 Minutes | 39 | 9.7% |
| 5 to 9 Minutes | 108 | 26.7% |
| 10 to 14 Minutes | 36 | 8.9% |
| 15 to 19 Minutes | 101 | 25.0% |
| 20 to 24 Minutes | 15 | 3.7% |
| 25 to 29 Minutes | 28 | 6.9% |
| 30 to 34 Minutes | 43 | 10.6% |
| 35 to 39 Minutes | 0 | 0.0% |
| 40 to 44 Minutes | 8 | 2.0% |
| 45 to 59 Minutes | 4 | 1.0% |
| 60 to 89 Minutes | 8 | 2.0% |
| 90 or more Minutes | 14 | 3.5% |
Commute Time by Sex in Blue Ridge
The most common commute times in Blue Ridge are 5 to 9 minutes (64 commuters, 25.3%) for males and 15 to 19 minutes (54 commuters, 35.8%) for females.
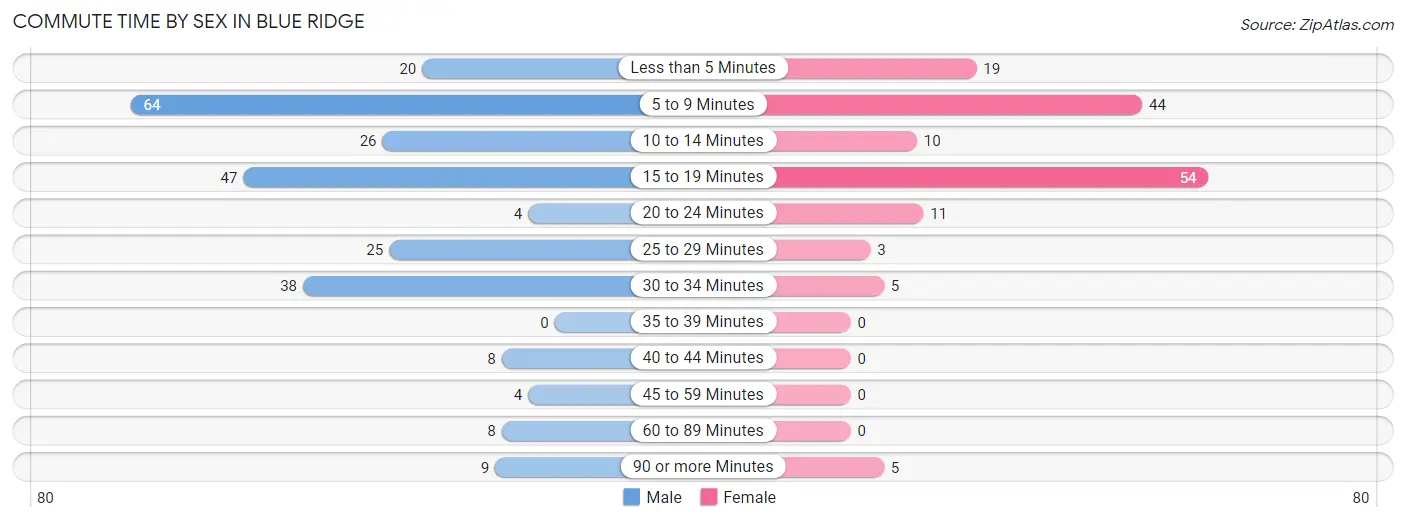
| Commute Time | Male | Female |
| Less than 5 Minutes | 20 (7.9%) | 19 (12.6%) |
| 5 to 9 Minutes | 64 (25.3%) | 44 (29.1%) |
| 10 to 14 Minutes | 26 (10.3%) | 10 (6.6%) |
| 15 to 19 Minutes | 47 (18.6%) | 54 (35.8%) |
| 20 to 24 Minutes | 4 (1.6%) | 11 (7.3%) |
| 25 to 29 Minutes | 25 (9.9%) | 3 (2.0%) |
| 30 to 34 Minutes | 38 (15.0%) | 5 (3.3%) |
| 35 to 39 Minutes | 0 (0.0%) | 0 (0.0%) |
| 40 to 44 Minutes | 8 (3.2%) | 0 (0.0%) |
| 45 to 59 Minutes | 4 (1.6%) | 0 (0.0%) |
| 60 to 89 Minutes | 8 (3.2%) | 0 (0.0%) |
| 90 or more Minutes | 9 (3.6%) | 5 (3.3%) |
Time of Departure to Work by Sex in Blue Ridge
The most frequent times of departure to work in Blue Ridge are 7:00 AM to 7:29 AM (44, 17.4%) for males and 7:30 AM to 7:59 AM (39, 25.8%) for females.
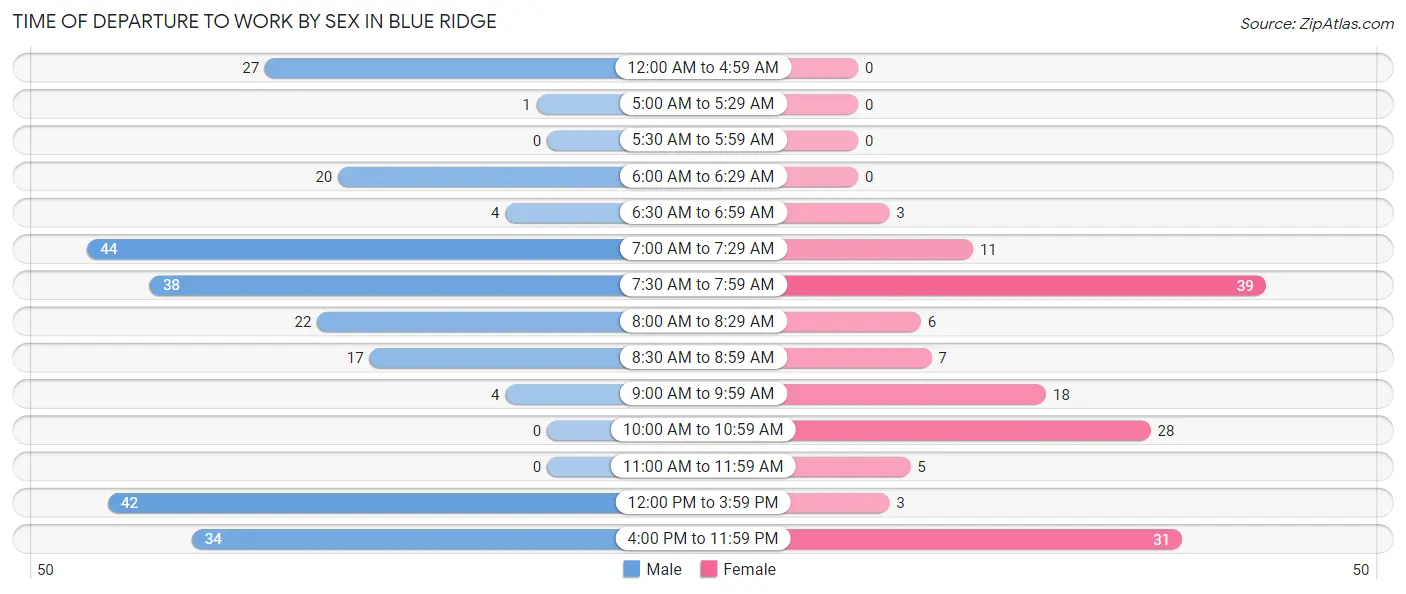
| Time of Departure | Male | Female |
| 12:00 AM to 4:59 AM | 27 (10.7%) | 0 (0.0%) |
| 5:00 AM to 5:29 AM | 1 (0.4%) | 0 (0.0%) |
| 5:30 AM to 5:59 AM | 0 (0.0%) | 0 (0.0%) |
| 6:00 AM to 6:29 AM | 20 (7.9%) | 0 (0.0%) |
| 6:30 AM to 6:59 AM | 4 (1.6%) | 3 (2.0%) |
| 7:00 AM to 7:29 AM | 44 (17.4%) | 11 (7.3%) |
| 7:30 AM to 7:59 AM | 38 (15.0%) | 39 (25.8%) |
| 8:00 AM to 8:29 AM | 22 (8.7%) | 6 (4.0%) |
| 8:30 AM to 8:59 AM | 17 (6.7%) | 7 (4.6%) |
| 9:00 AM to 9:59 AM | 4 (1.6%) | 18 (11.9%) |
| 10:00 AM to 10:59 AM | 0 (0.0%) | 28 (18.5%) |
| 11:00 AM to 11:59 AM | 0 (0.0%) | 5 (3.3%) |
| 12:00 PM to 3:59 PM | 42 (16.6%) | 3 (2.0%) |
| 4:00 PM to 11:59 PM | 34 (13.4%) | 31 (20.5%) |
| Total | 253 (100.0%) | 151 (100.0%) |
Housing Occupancy in Blue Ridge
Occupancy by Ownership in Blue Ridge
Of the total 616 dwellings in Blue Ridge, owner-occupied units account for 304 (49.3%), while renter-occupied units make up 312 (50.6%).
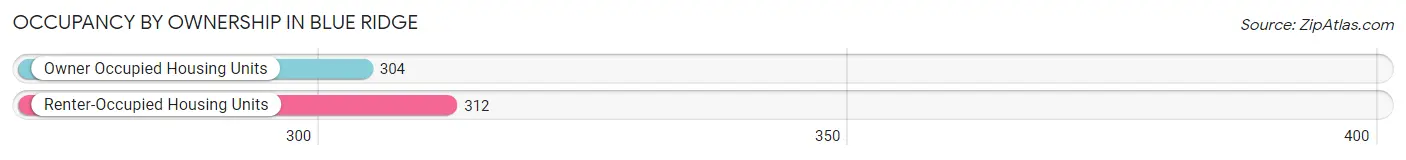
| Occupancy | # Housing Units | % Housing Units |
| Owner Occupied Housing Units | 304 | 49.3% |
| Renter-Occupied Housing Units | 312 | 50.6% |
| Total Occupied Housing Units | 616 | 100.0% |
Occupancy by Household Size in Blue Ridge
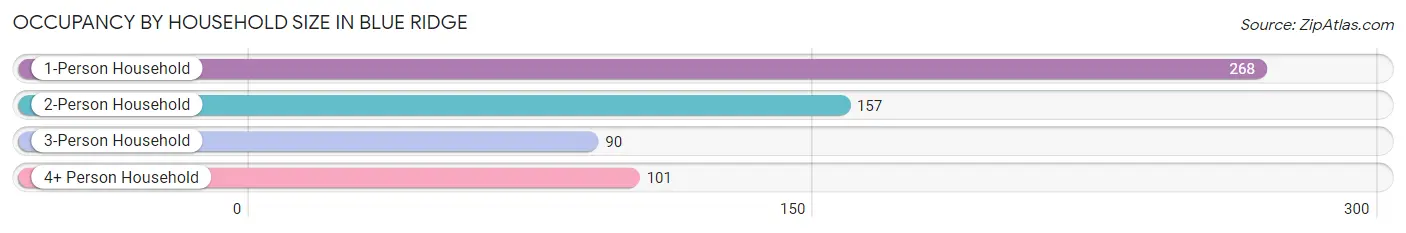
| Household Size | # Housing Units | % Housing Units |
| 1-Person Household | 268 | 43.5% |
| 2-Person Household | 157 | 25.5% |
| 3-Person Household | 90 | 14.6% |
| 4+ Person Household | 101 | 16.4% |
| Total Housing Units | 616 | 100.0% |
Occupancy by Ownership by Household Size in Blue Ridge
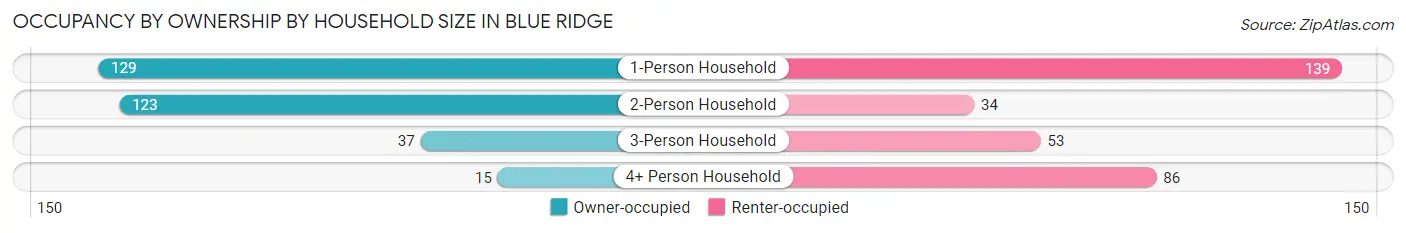
| Household Size | Owner-occupied | Renter-occupied |
| 1-Person Household | 129 (48.1%) | 139 (51.9%) |
| 2-Person Household | 123 (78.3%) | 34 (21.7%) |
| 3-Person Household | 37 (41.1%) | 53 (58.9%) |
| 4+ Person Household | 15 (14.8%) | 86 (85.2%) |
| Total Housing Units | 304 (49.3%) | 312 (50.6%) |
Occupancy by Educational Attainment in Blue Ridge
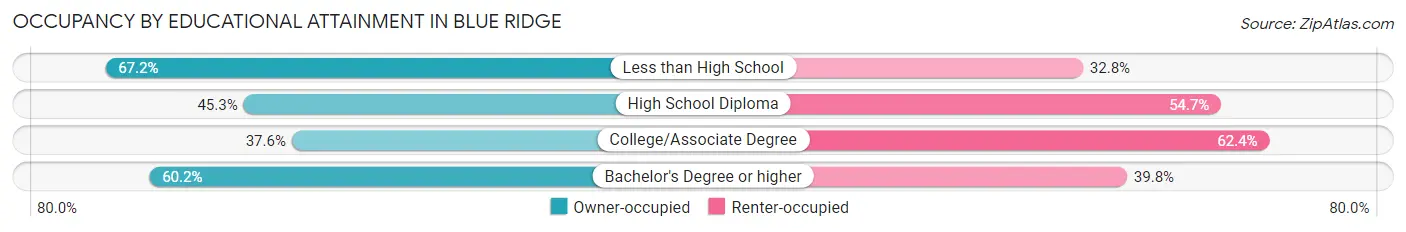
| Household Size | Owner-occupied | Renter-occupied |
| Less than High School | 82 (67.2%) | 40 (32.8%) |
| High School Diploma | 96 (45.3%) | 116 (54.7%) |
| College/Associate Degree | 73 (37.6%) | 121 (62.4%) |
| Bachelor's Degree or higher | 53 (60.2%) | 35 (39.8%) |
Occupancy by Age of Householder in Blue Ridge
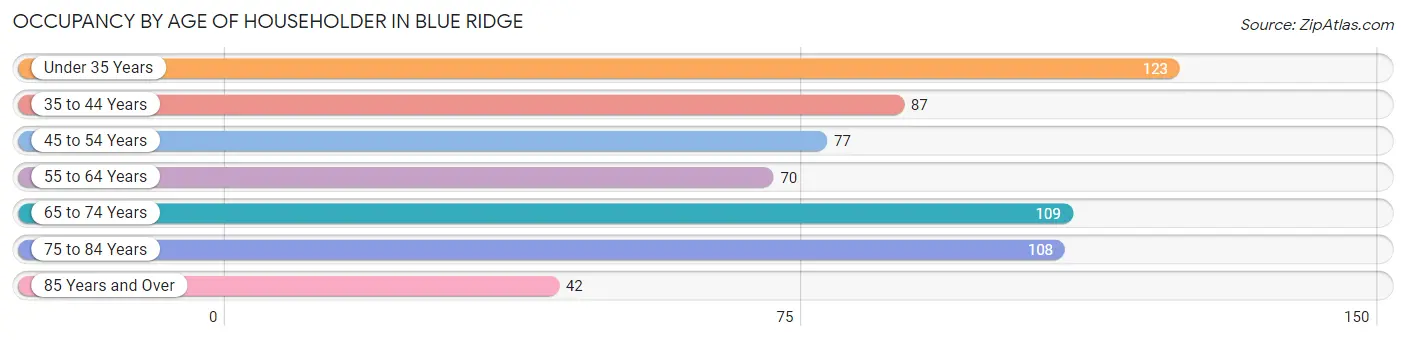
| Age Bracket | # Households | % Households |
| Under 35 Years | 123 | 20.0% |
| 35 to 44 Years | 87 | 14.1% |
| 45 to 54 Years | 77 | 12.5% |
| 55 to 64 Years | 70 | 11.4% |
| 65 to 74 Years | 109 | 17.7% |
| 75 to 84 Years | 108 | 17.5% |
| 85 Years and Over | 42 | 6.8% |
| Total | 616 | 100.0% |
Housing Finances in Blue Ridge
Median Income by Occupancy in Blue Ridge
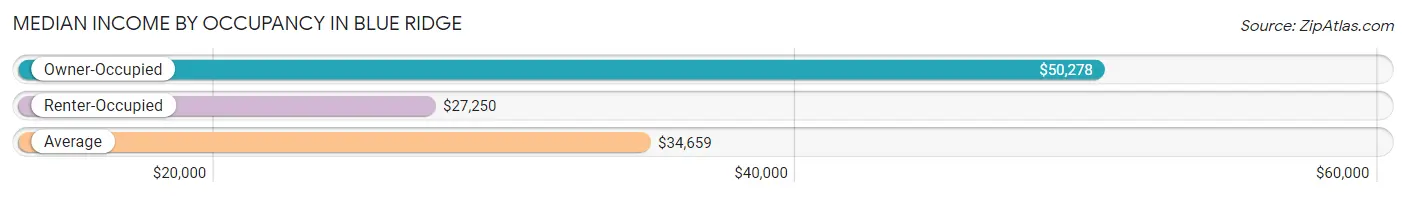
| Occupancy Type | # Households | Median Income |
| Owner-Occupied | 304 (49.3%) | $50,278 |
| Renter-Occupied | 312 (50.6%) | $27,250 |
| Average | 616 (100.0%) | $34,659 |
Occupancy by Householder Income Bracket in Blue Ridge
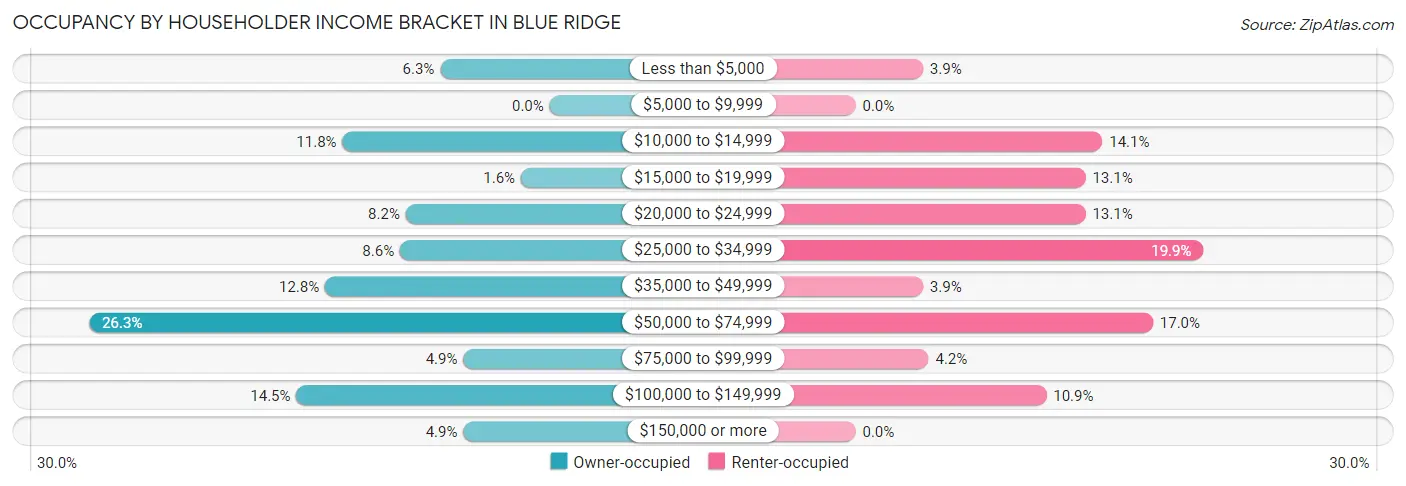
| Income Bracket | Owner-occupied | Renter-occupied |
| Less than $5,000 | 19 (6.2%) | 12 (3.8%) |
| $5,000 to $9,999 | 0 (0.0%) | 0 (0.0%) |
| $10,000 to $14,999 | 36 (11.8%) | 44 (14.1%) |
| $15,000 to $19,999 | 5 (1.6%) | 41 (13.1%) |
| $20,000 to $24,999 | 25 (8.2%) | 41 (13.1%) |
| $25,000 to $34,999 | 26 (8.6%) | 62 (19.9%) |
| $35,000 to $49,999 | 39 (12.8%) | 12 (3.8%) |
| $50,000 to $74,999 | 80 (26.3%) | 53 (17.0%) |
| $75,000 to $99,999 | 15 (4.9%) | 13 (4.2%) |
| $100,000 to $149,999 | 44 (14.5%) | 34 (10.9%) |
| $150,000 or more | 15 (4.9%) | 0 (0.0%) |
| Total | 304 (100.0%) | 312 (100.0%) |
Monthly Housing Cost Tiers in Blue Ridge
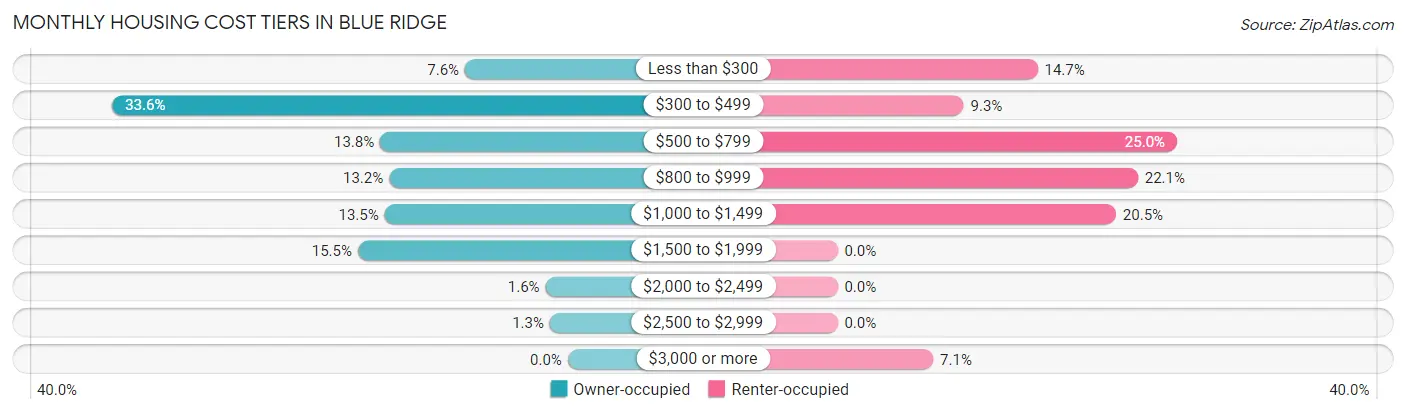
| Monthly Cost | Owner-occupied | Renter-occupied |
| Less than $300 | 23 (7.6%) | 46 (14.7%) |
| $300 to $499 | 102 (33.6%) | 29 (9.3%) |
| $500 to $799 | 42 (13.8%) | 78 (25.0%) |
| $800 to $999 | 40 (13.2%) | 69 (22.1%) |
| $1,000 to $1,499 | 41 (13.5%) | 64 (20.5%) |
| $1,500 to $1,999 | 47 (15.5%) | 0 (0.0%) |
| $2,000 to $2,499 | 5 (1.6%) | 0 (0.0%) |
| $2,500 to $2,999 | 4 (1.3%) | 0 (0.0%) |
| $3,000 or more | 0 (0.0%) | 22 (7.0%) |
| Total | 304 (100.0%) | 312 (100.0%) |
Physical Housing Characteristics in Blue Ridge
Housing Structures in Blue Ridge
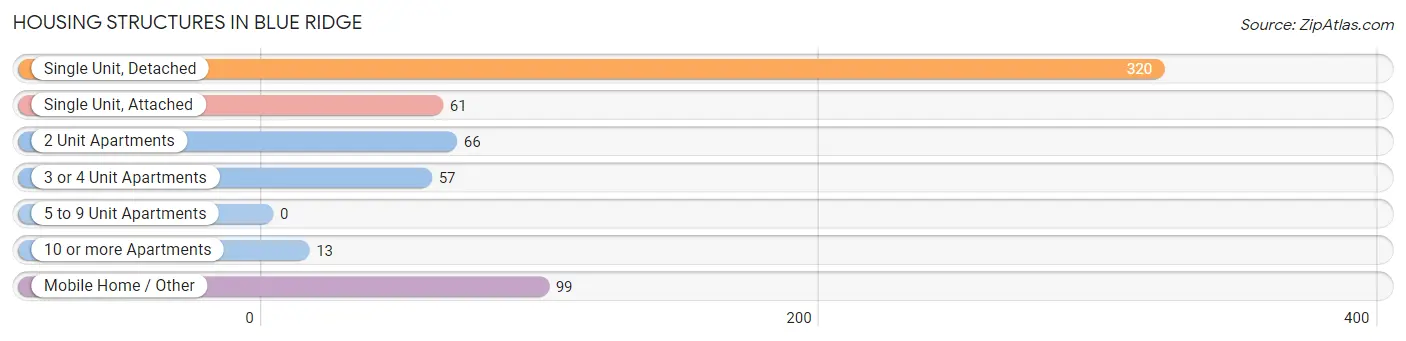
| Structure Type | # Housing Units | % Housing Units |
| Single Unit, Detached | 320 | 51.9% |
| Single Unit, Attached | 61 | 9.9% |
| 2 Unit Apartments | 66 | 10.7% |
| 3 or 4 Unit Apartments | 57 | 9.2% |
| 5 to 9 Unit Apartments | 0 | 0.0% |
| 10 or more Apartments | 13 | 2.1% |
| Mobile Home / Other | 99 | 16.1% |
| Total | 616 | 100.0% |
Housing Structures by Occupancy in Blue Ridge
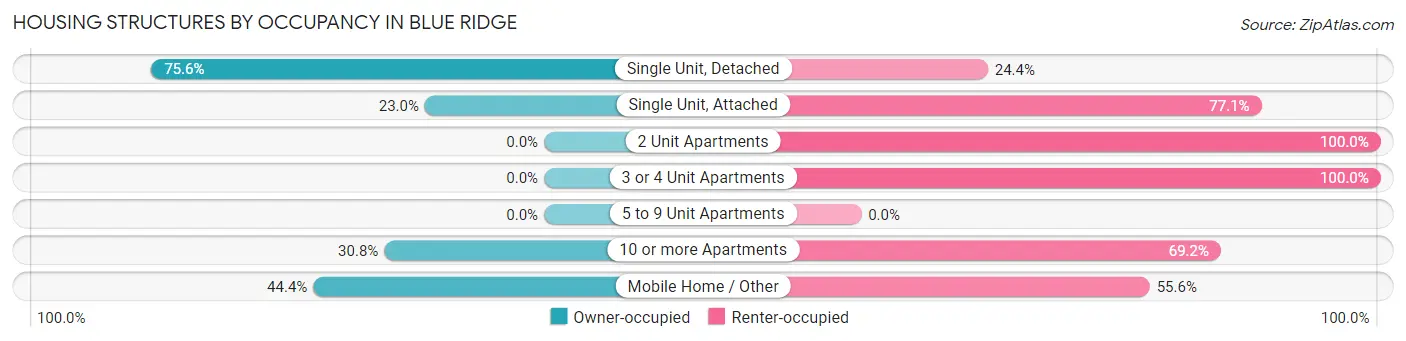
| Structure Type | Owner-occupied | Renter-occupied |
| Single Unit, Detached | 242 (75.6%) | 78 (24.4%) |
| Single Unit, Attached | 14 (23.0%) | 47 (77.0%) |
| 2 Unit Apartments | 0 (0.0%) | 66 (100.0%) |
| 3 or 4 Unit Apartments | 0 (0.0%) | 57 (100.0%) |
| 5 to 9 Unit Apartments | 0 (0.0%) | 0 (0.0%) |
| 10 or more Apartments | 4 (30.8%) | 9 (69.2%) |
| Mobile Home / Other | 44 (44.4%) | 55 (55.6%) |
| Total | 304 (49.3%) | 312 (50.6%) |
Housing Structures by Number of Rooms in Blue Ridge
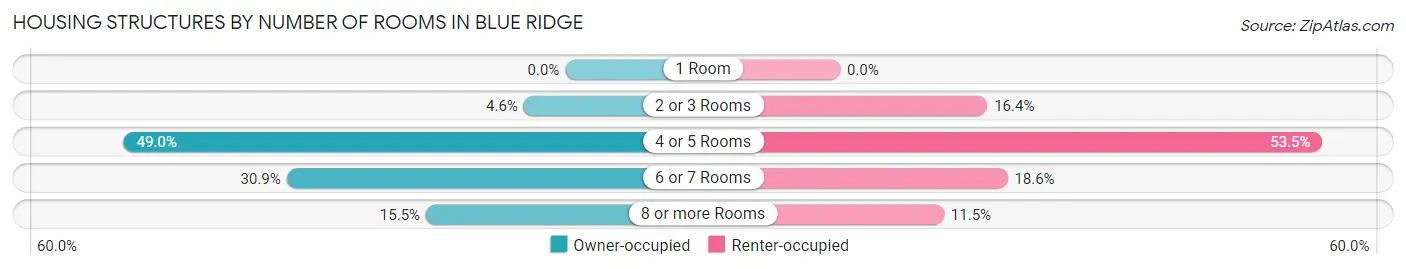
| Number of Rooms | Owner-occupied | Renter-occupied |
| 1 Room | 0 (0.0%) | 0 (0.0%) |
| 2 or 3 Rooms | 14 (4.6%) | 51 (16.4%) |
| 4 or 5 Rooms | 149 (49.0%) | 167 (53.5%) |
| 6 or 7 Rooms | 94 (30.9%) | 58 (18.6%) |
| 8 or more Rooms | 47 (15.5%) | 36 (11.5%) |
| Total | 304 (100.0%) | 312 (100.0%) |
Housing Structure by Heating Type in Blue Ridge
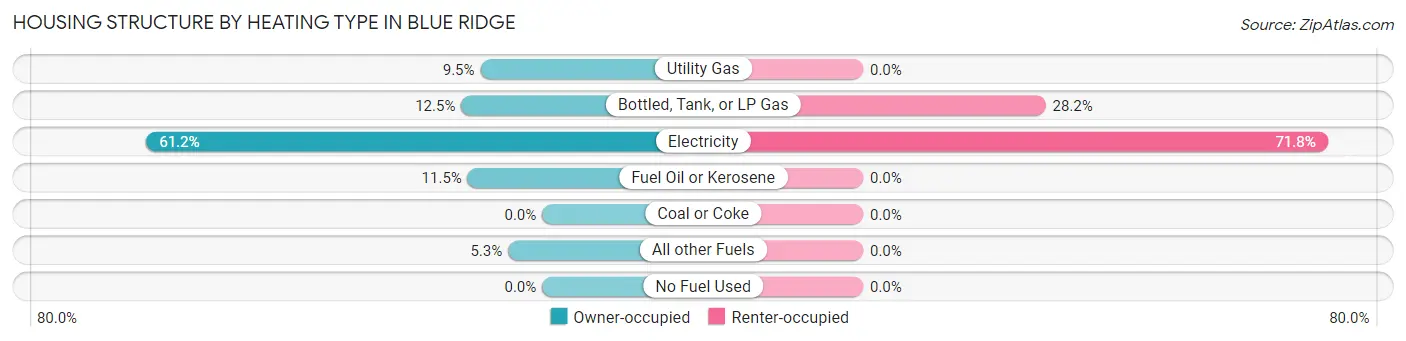
| Heating Type | Owner-occupied | Renter-occupied |
| Utility Gas | 29 (9.5%) | 0 (0.0%) |
| Bottled, Tank, or LP Gas | 38 (12.5%) | 88 (28.2%) |
| Electricity | 186 (61.2%) | 224 (71.8%) |
| Fuel Oil or Kerosene | 35 (11.5%) | 0 (0.0%) |
| Coal or Coke | 0 (0.0%) | 0 (0.0%) |
| All other Fuels | 16 (5.3%) | 0 (0.0%) |
| No Fuel Used | 0 (0.0%) | 0 (0.0%) |
| Total | 304 (100.0%) | 312 (100.0%) |
Household Vehicle Usage in Blue Ridge
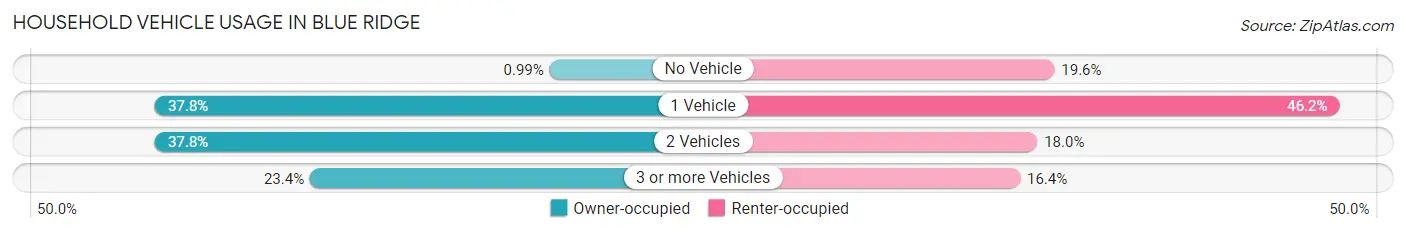
| Vehicles per Household | Owner-occupied | Renter-occupied |
| No Vehicle | 3 (1.0%) | 61 (19.6%) |
| 1 Vehicle | 115 (37.8%) | 144 (46.2%) |
| 2 Vehicles | 115 (37.8%) | 56 (17.9%) |
| 3 or more Vehicles | 71 (23.4%) | 51 (16.4%) |
| Total | 304 (100.0%) | 312 (100.0%) |
Real Estate & Mortgages in Blue Ridge
Real Estate and Mortgage Overview in Blue Ridge
| Characteristic | Without Mortgage | With Mortgage |
| Housing Units | 159 | 145 |
| Median Property Value | $179,500 | $232,300 |
| Median Household Income | $38,250 | $15 |
| Monthly Housing Costs | $353 | $0 |
| Real Estate Taxes | $444 | $5 |
Property Value by Mortgage Status in Blue Ridge
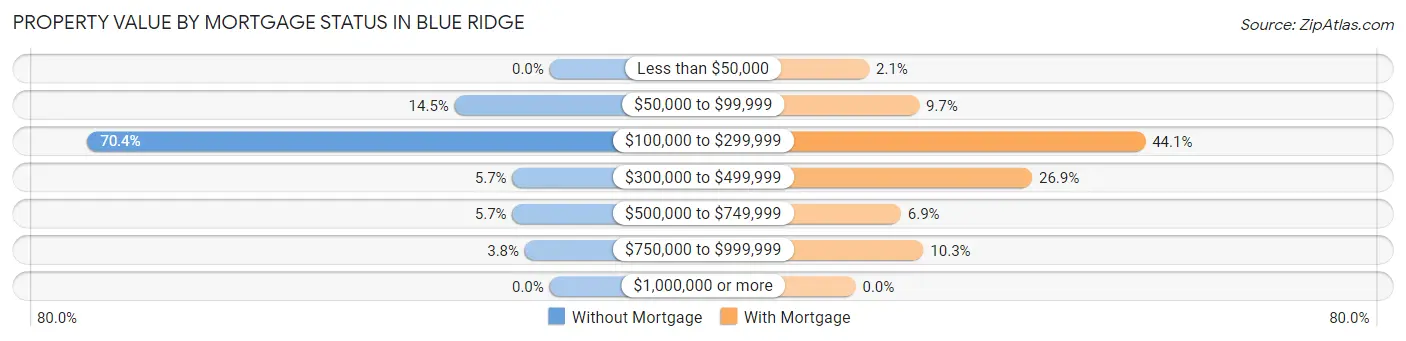
| Property Value | Without Mortgage | With Mortgage |
| Less than $50,000 | 0 (0.0%) | 3 (2.1%) |
| $50,000 to $99,999 | 23 (14.5%) | 14 (9.7%) |
| $100,000 to $299,999 | 112 (70.4%) | 64 (44.1%) |
| $300,000 to $499,999 | 9 (5.7%) | 39 (26.9%) |
| $500,000 to $749,999 | 9 (5.7%) | 10 (6.9%) |
| $750,000 to $999,999 | 6 (3.8%) | 15 (10.3%) |
| $1,000,000 or more | 0 (0.0%) | 0 (0.0%) |
| Total | 159 (100.0%) | 145 (100.0%) |
Household Income by Mortgage Status in Blue Ridge
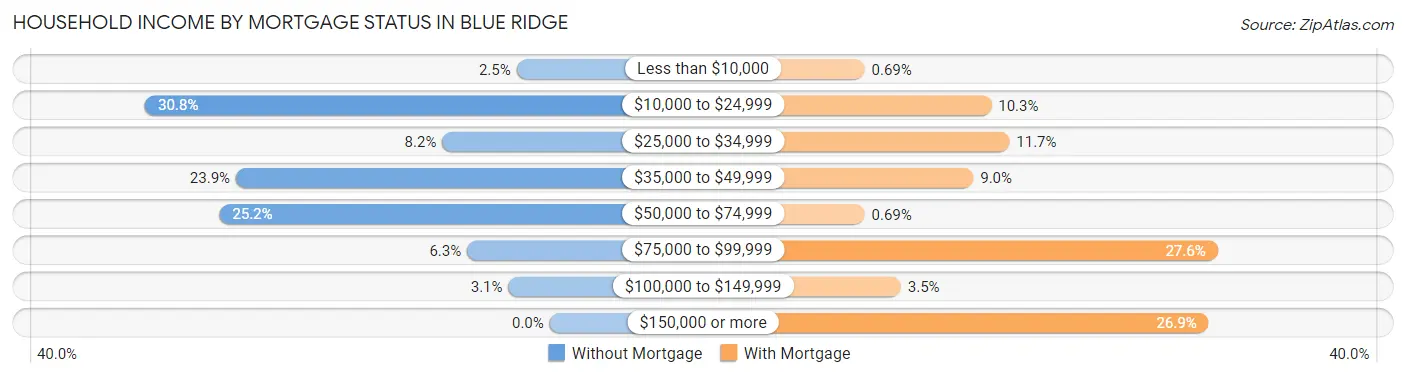
| Household Income | Without Mortgage | With Mortgage |
| Less than $10,000 | 4 (2.5%) | 1 (0.7%) |
| $10,000 to $24,999 | 49 (30.8%) | 15 (10.3%) |
| $25,000 to $34,999 | 13 (8.2%) | 17 (11.7%) |
| $35,000 to $49,999 | 38 (23.9%) | 13 (9.0%) |
| $50,000 to $74,999 | 40 (25.2%) | 1 (0.7%) |
| $75,000 to $99,999 | 10 (6.3%) | 40 (27.6%) |
| $100,000 to $149,999 | 5 (3.1%) | 5 (3.5%) |
| $150,000 or more | 0 (0.0%) | 39 (26.9%) |
| Total | 159 (100.0%) | 145 (100.0%) |
Property Value to Household Income Ratio in Blue Ridge
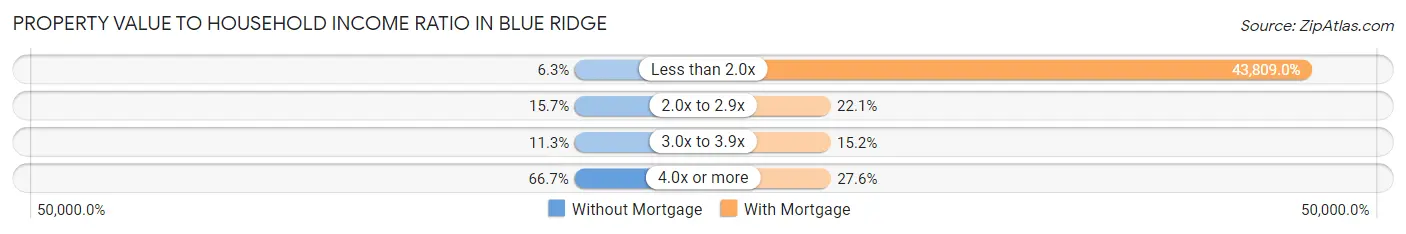
| Value-to-Income Ratio | Without Mortgage | With Mortgage |
| Less than 2.0x | 10 (6.3%) | 63,523 (43,809.0%) |
| 2.0x to 2.9x | 25 (15.7%) | 32 (22.1%) |
| 3.0x to 3.9x | 18 (11.3%) | 22 (15.2%) |
| 4.0x or more | 106 (66.7%) | 40 (27.6%) |
| Total | 159 (100.0%) | 145 (100.0%) |
Real Estate Taxes by Mortgage Status in Blue Ridge
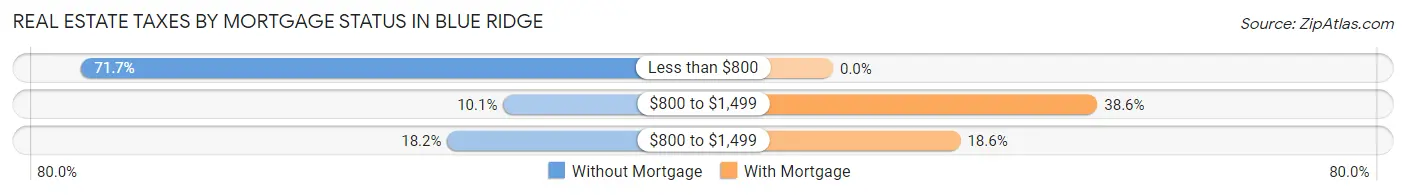
| Property Taxes | Without Mortgage | With Mortgage |
| Less than $800 | 114 (71.7%) | 0 (0.0%) |
| $800 to $1,499 | 16 (10.1%) | 56 (38.6%) |
| $800 to $1,499 | 29 (18.2%) | 27 (18.6%) |
| Total | 159 (100.0%) | 145 (100.0%) |
Health & Disability in Blue Ridge
Health Insurance Coverage by Age in Blue Ridge
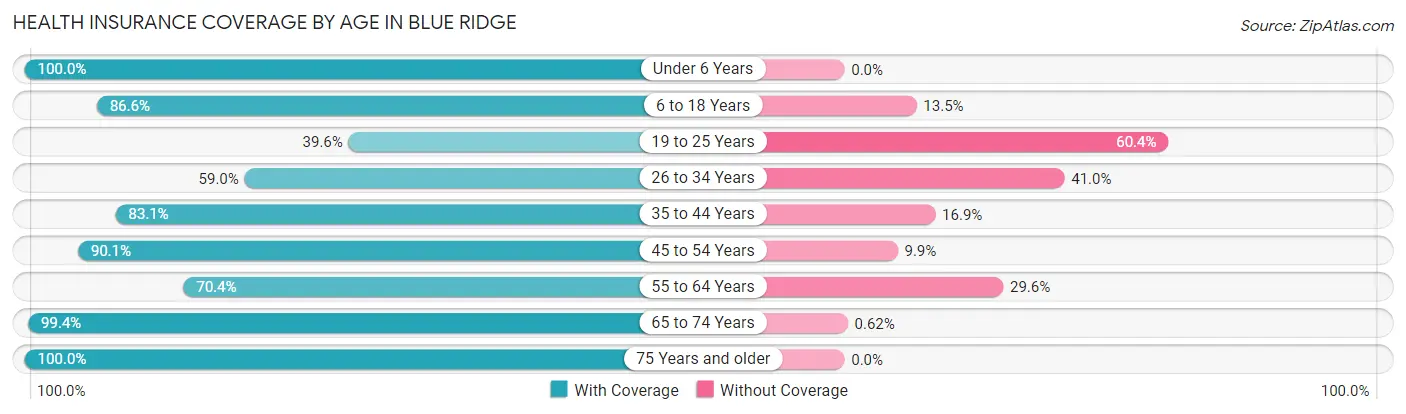
| Age Bracket | With Coverage | Without Coverage |
| Under 6 Years | 76 (100.0%) | 0 (0.0%) |
| 6 to 18 Years | 148 (86.6%) | 23 (13.5%) |
| 19 to 25 Years | 38 (39.6%) | 58 (60.4%) |
| 26 to 34 Years | 92 (59.0%) | 64 (41.0%) |
| 35 to 44 Years | 103 (83.1%) | 21 (16.9%) |
| 45 to 54 Years | 127 (90.1%) | 14 (9.9%) |
| 55 to 64 Years | 88 (70.4%) | 37 (29.6%) |
| 65 to 74 Years | 159 (99.4%) | 1 (0.6%) |
| 75 Years and older | 178 (100.0%) | 0 (0.0%) |
| Total | 1,009 (82.2%) | 218 (17.8%) |
Health Insurance Coverage by Citizenship Status in Blue Ridge
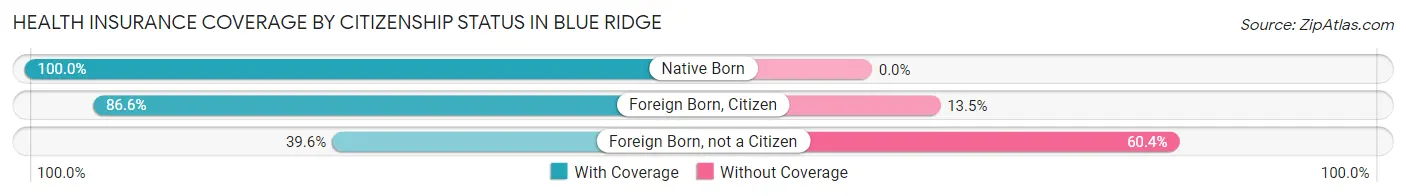
| Citizenship Status | With Coverage | Without Coverage |
| Native Born | 76 (100.0%) | 0 (0.0%) |
| Foreign Born, Citizen | 148 (86.6%) | 23 (13.5%) |
| Foreign Born, not a Citizen | 38 (39.6%) | 58 (60.4%) |
Health Insurance Coverage by Household Income in Blue Ridge
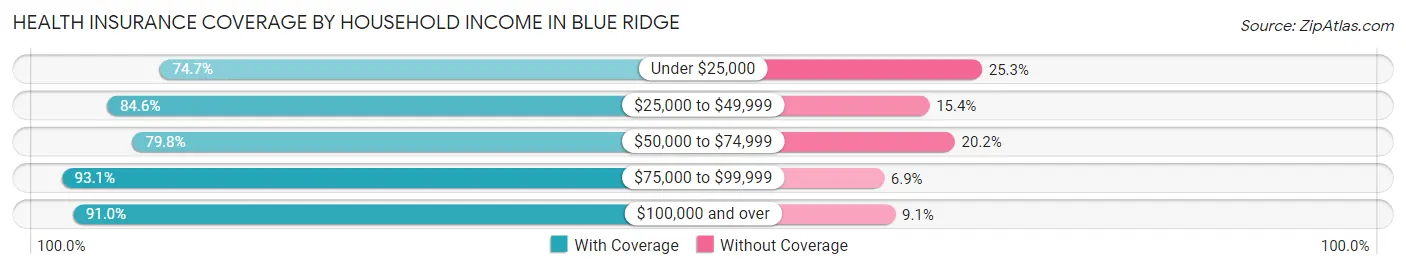
| Household Income | With Coverage | Without Coverage |
| Under $25,000 | 254 (74.7%) | 86 (25.3%) |
| $25,000 to $49,999 | 230 (84.6%) | 42 (15.4%) |
| $50,000 to $74,999 | 257 (79.8%) | 65 (20.2%) |
| $75,000 to $99,999 | 67 (93.1%) | 5 (6.9%) |
| $100,000 and over | 201 (90.9%) | 20 (9.0%) |
Public vs Private Health Insurance Coverage by Age in Blue Ridge
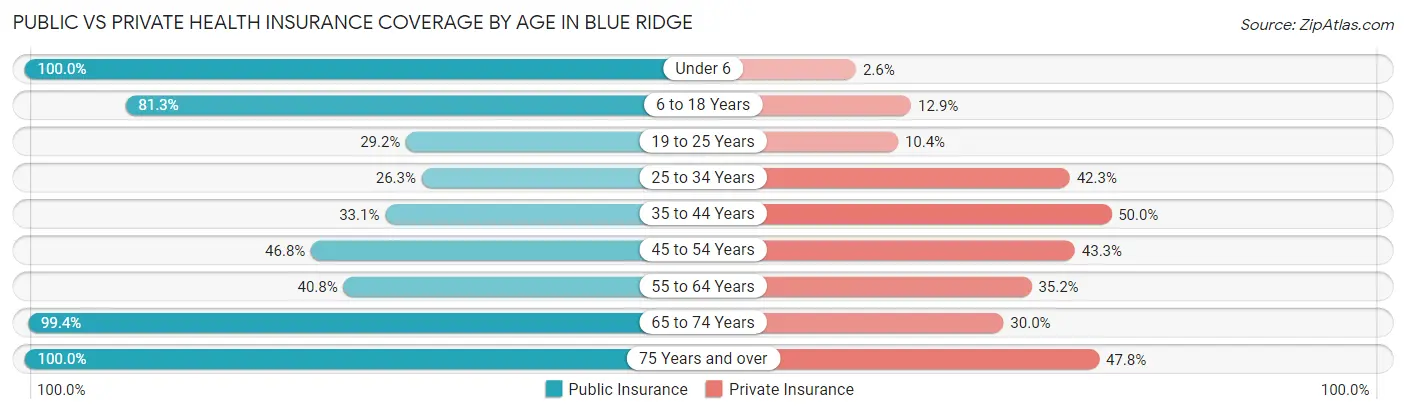
| Age Bracket | Public Insurance | Private Insurance |
| Under 6 | 76 (100.0%) | 2 (2.6%) |
| 6 to 18 Years | 139 (81.3%) | 22 (12.9%) |
| 19 to 25 Years | 28 (29.2%) | 10 (10.4%) |
| 25 to 34 Years | 41 (26.3%) | 66 (42.3%) |
| 35 to 44 Years | 41 (33.1%) | 62 (50.0%) |
| 45 to 54 Years | 66 (46.8%) | 61 (43.3%) |
| 55 to 64 Years | 51 (40.8%) | 44 (35.2%) |
| 65 to 74 Years | 159 (99.4%) | 48 (30.0%) |
| 75 Years and over | 178 (100.0%) | 85 (47.7%) |
| Total | 779 (63.5%) | 400 (32.6%) |
Disability Status by Sex by Age in Blue Ridge
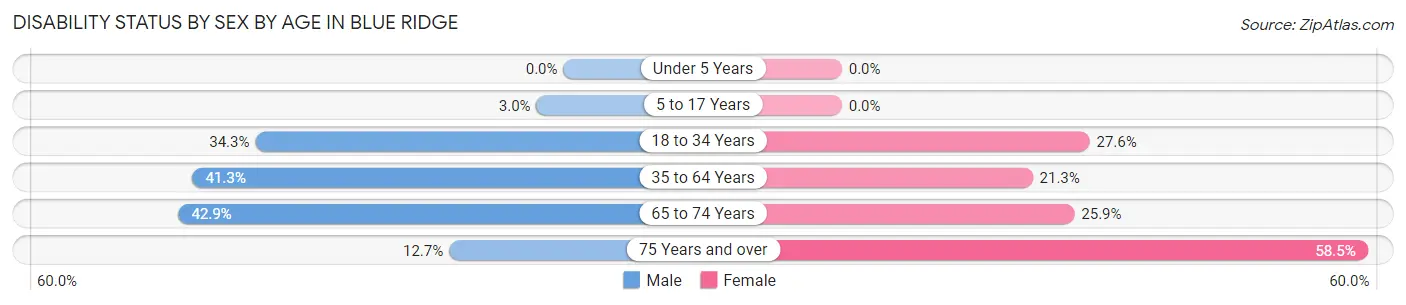
| Age Bracket | Male | Female |
| Under 5 Years | 0 (0.0%) | 0 (0.0%) |
| 5 to 17 Years | 3 (3.0%) | 0 (0.0%) |
| 18 to 34 Years | 47 (34.3%) | 32 (27.6%) |
| 35 to 64 Years | 95 (41.3%) | 34 (21.2%) |
| 65 to 74 Years | 9 (42.9%) | 36 (25.9%) |
| 75 Years and over | 7 (12.7%) | 72 (58.5%) |
Disability Class by Sex by Age in Blue Ridge
Disability Class: Hearing Difficulty
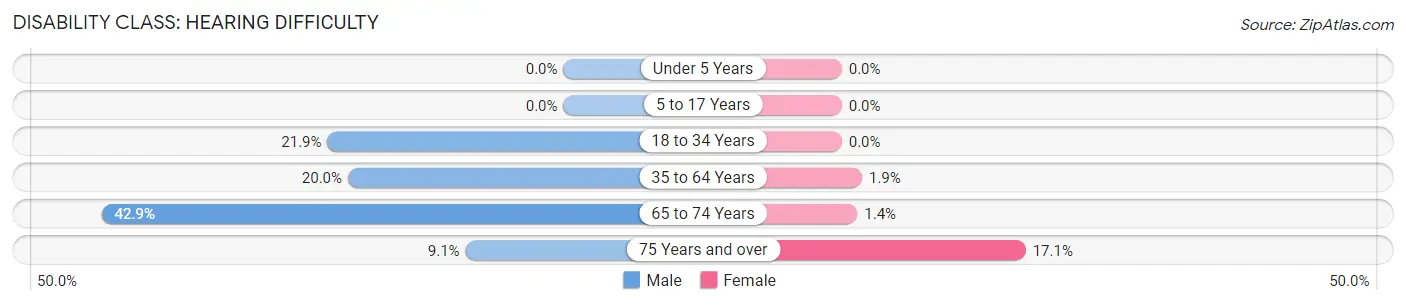
| Age Bracket | Male | Female |
| Under 5 Years | 0 (0.0%) | 0 (0.0%) |
| 5 to 17 Years | 0 (0.0%) | 0 (0.0%) |
| 18 to 34 Years | 30 (21.9%) | 0 (0.0%) |
| 35 to 64 Years | 46 (20.0%) | 3 (1.9%) |
| 65 to 74 Years | 9 (42.9%) | 2 (1.4%) |
| 75 Years and over | 5 (9.1%) | 21 (17.1%) |
Disability Class: Vision Difficulty
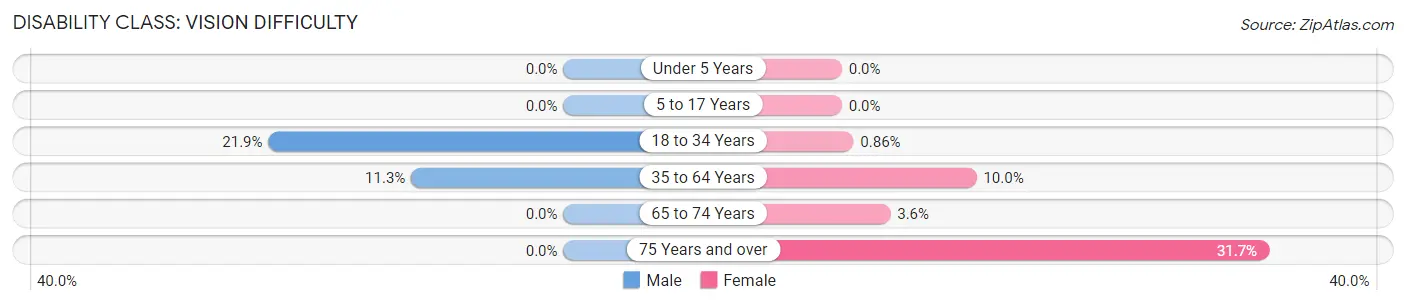
| Age Bracket | Male | Female |
| Under 5 Years | 0 (0.0%) | 0 (0.0%) |
| 5 to 17 Years | 0 (0.0%) | 0 (0.0%) |
| 18 to 34 Years | 30 (21.9%) | 1 (0.9%) |
| 35 to 64 Years | 26 (11.3%) | 16 (10.0%) |
| 65 to 74 Years | 0 (0.0%) | 5 (3.6%) |
| 75 Years and over | 0 (0.0%) | 39 (31.7%) |
Disability Class: Cognitive Difficulty
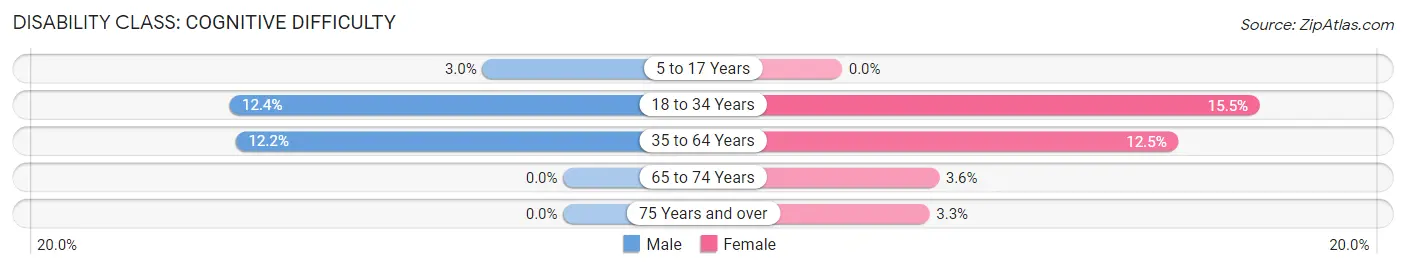
| Age Bracket | Male | Female |
| 5 to 17 Years | 3 (3.0%) | 0 (0.0%) |
| 18 to 34 Years | 17 (12.4%) | 18 (15.5%) |
| 35 to 64 Years | 28 (12.2%) | 20 (12.5%) |
| 65 to 74 Years | 0 (0.0%) | 5 (3.6%) |
| 75 Years and over | 0 (0.0%) | 4 (3.3%) |
Disability Class: Ambulatory Difficulty
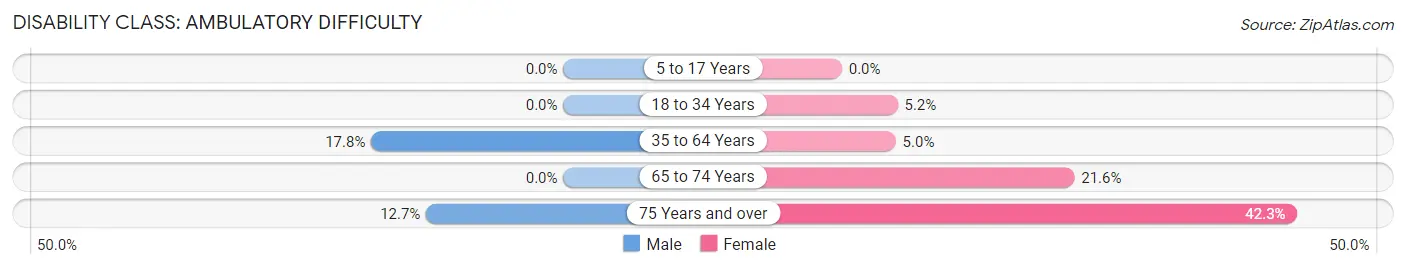
| Age Bracket | Male | Female |
| 5 to 17 Years | 0 (0.0%) | 0 (0.0%) |
| 18 to 34 Years | 0 (0.0%) | 6 (5.2%) |
| 35 to 64 Years | 41 (17.8%) | 8 (5.0%) |
| 65 to 74 Years | 0 (0.0%) | 30 (21.6%) |
| 75 Years and over | 7 (12.7%) | 52 (42.3%) |
Disability Class: Self-Care Difficulty
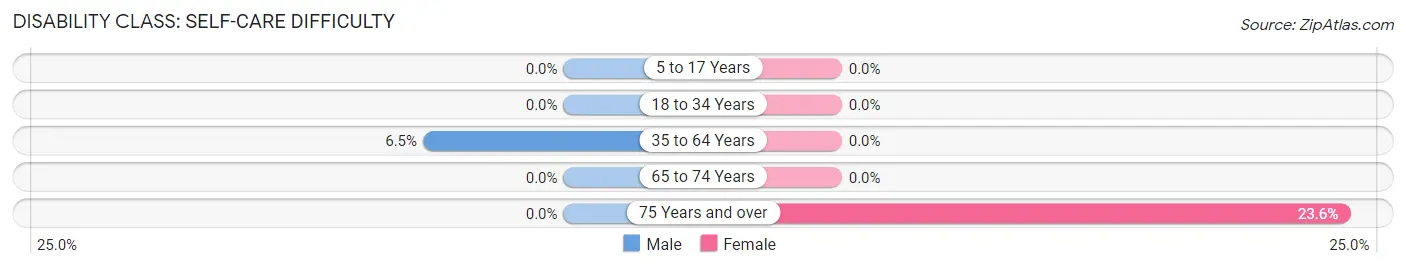
| Age Bracket | Male | Female |
| 5 to 17 Years | 0 (0.0%) | 0 (0.0%) |
| 18 to 34 Years | 0 (0.0%) | 0 (0.0%) |
| 35 to 64 Years | 15 (6.5%) | 0 (0.0%) |
| 65 to 74 Years | 0 (0.0%) | 0 (0.0%) |
| 75 Years and over | 0 (0.0%) | 29 (23.6%) |
Technology Access in Blue Ridge
Computing Device Access in Blue Ridge
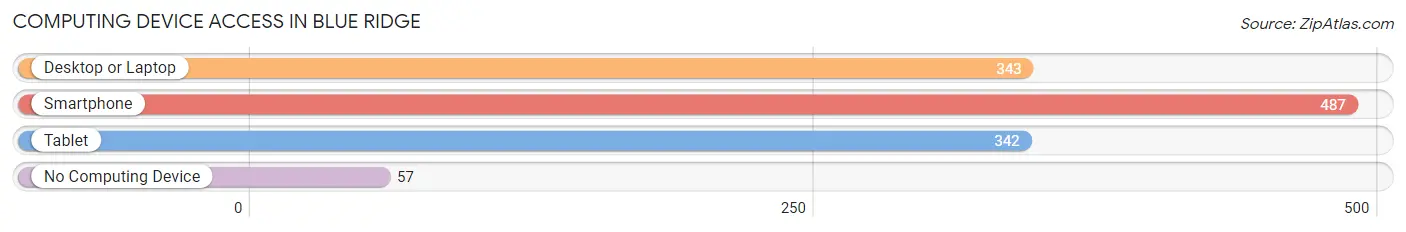
| Device Type | # Households | % Households |
| Desktop or Laptop | 343 | 55.7% |
| Smartphone | 487 | 79.1% |
| Tablet | 342 | 55.5% |
| No Computing Device | 57 | 9.2% |
| Total | 616 | 100.0% |
Internet Access in Blue Ridge
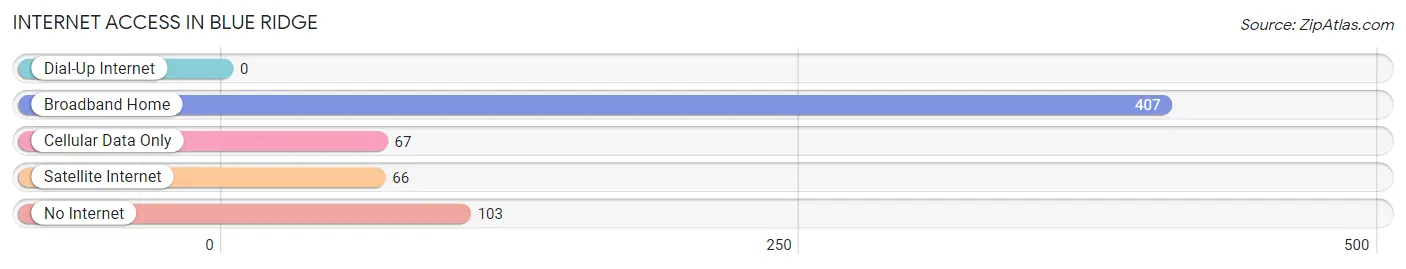
| Internet Type | # Households | % Households |
| Dial-Up Internet | 0 | 0.0% |
| Broadband Home | 407 | 66.1% |
| Cellular Data Only | 67 | 10.9% |
| Satellite Internet | 66 | 10.7% |
| No Internet | 103 | 16.7% |
| Total | 616 | 100.0% |
Blue Ridge Summary
Introduction
Blue Ridge, Georgia is a small city located in the Appalachian Mountains of northern Georgia. It is the county seat of Fannin County and is situated along the Toccoa River. The city has a population of 1,290 as of the 2010 census and is the second-largest city in the county. Blue Ridge is known for its scenic beauty, outdoor recreation, and vibrant downtown.
History
Blue Ridge was founded in 1887 as a railroad town. The town was named after the Blue Ridge Mountains, which are located nearby. The town was originally known as McCaysville, but the name was changed to Blue Ridge in 1890. The town was incorporated in 1906.
The town grew rapidly in the early 20th century, and by the 1920s, it had become a popular tourist destination. The town was home to several resorts, including the Blue Ridge Inn, which was built in 1921. The town also had a thriving lumber industry, and the town's economy was largely based on the lumber industry until the 1950s.
In the 1950s, the town began to decline as the lumber industry declined. The town's population decreased, and the downtown area became run-down. In the 1970s, the town began to experience a resurgence as the downtown area was revitalized and the town became a popular tourist destination once again.
Geography
Blue Ridge is located in the Appalachian Mountains of northern Georgia. The city is situated along the Toccoa River, which is a tributary of the Chattahoochee River. The city is located at the intersection of US Highway 76 and Georgia State Route 5. The city is surrounded by the Chattahoochee National Forest and is located near the Blue Ridge Mountains.
The city has a total area of 2.2 square miles, all of which is land. The city has a humid subtropical climate, with hot, humid summers and mild winters. The average annual temperature is 61 degrees Fahrenheit, and the average annual precipitation is 48 inches.
Economy
Blue Ridge's economy is largely based on tourism. The city is home to several resorts, including the Blue Ridge Inn, which was built in 1921. The city is also home to several wineries, breweries, and distilleries, as well as several antique shops and art galleries. The city is also home to several outdoor recreation activities, including hiking, fishing, and camping.
The city is also home to several manufacturing companies, including a furniture manufacturer and a paper mill. The city is also home to several retail stores, including a grocery store, a hardware store, and several clothing stores.
Demographics
As of the 2010 census, the city had a population of 1,290. The racial makeup of the city was 95.2% White, 0.9% African American, 0.2% Native American, 0.2% Asian, 0.1% Pacific Islander, 1.2% from other races, and 2.2% from two or more races. Hispanic or Latino of any race were 3.2% of the population.
The median income for a household in the city was $30,938, and the median income for a family was $37,500. The per capita income for the city was $17,845. About 15.2% of the population was below the poverty line.
Conclusion
Blue Ridge, Georgia is a small city located in the Appalachian Mountains of northern Georgia. The city has a population of 1,290 as of the 2010 census and is the second-largest city in the county. Blue Ridge is known for its scenic beauty, outdoor recreation, and vibrant downtown. The city's economy is largely based on tourism, and the city is home to several resorts, wineries, breweries, and distilleries. The city also has several manufacturing companies and retail stores. The city has a population that is 95.2% White, 0.9% African American, 0.2% Native American, 0.2% Asian, 0.1% Pacific Islander, 1.2% from other races, and 2.2% from two or more races. The median income for a household in the city was $30,938, and the median income for a family was $37,500.
Common Questions
What is Per Capita Income in Blue Ridge?
Per Capita income in Blue Ridge is $23,530.
What is the Median Family Income in Blue Ridge?
Median Family Income in Blue Ridge is $53,583.
What is the Median Household income in Blue Ridge?
Median Household Income in Blue Ridge is $34,659.
What is Income or Wage Gap in Blue Ridge?
Income or Wage Gap in Blue Ridge is 25.7%.
Women in Blue Ridge earn 74.3 cents for every dollar earned by a man.
What is Family Income Deficit in Blue Ridge?
Family Income Deficit in Blue Ridge is $5,786.
Families that are below poverty line in Blue Ridge earn $5,786 less on average than the poverty threshold level.
What is Inequality or Gini Index in Blue Ridge?
Inequality or Gini Index in Blue Ridge is 0.45.
What is the Total Population of Blue Ridge?
Total Population of Blue Ridge is 1,366.
What is the Total Male Population of Blue Ridge?
Total Male Population of Blue Ridge is 683.
What is the Total Female Population of Blue Ridge?
Total Female Population of Blue Ridge is 683.
What is the Ratio of Males per 100 Females in Blue Ridge?
There are 100.00 Males per 100 Females in Blue Ridge.
What is the Ratio of Females per 100 Males in Blue Ridge?
There are 100.00 Females per 100 Males in Blue Ridge.
What is the Median Population Age in Blue Ridge?
Median Population Age in Blue Ridge is 47.3 Years.
What is the Average Family Size in Blue Ridge
Average Family Size in Blue Ridge is 2.7 People.
What is the Average Household Size in Blue Ridge
Average Household Size in Blue Ridge is 2.0 People.
How Large is the Labor Force in Blue Ridge?
There are 442 People in the Labor Forcein in Blue Ridge.
What is the Percentage of People in the Labor Force in Blue Ridge?
39.0% of People are in the Labor Force in Blue Ridge.
What is the Unemployment Rate in Blue Ridge?
Unemployment Rate in Blue Ridge is 0.9%.