Cities with the Most Immigrants from Latin America in Georgia
RELATED REPORTS & OPTIONS
Latin America
Georgia
Compare Cities
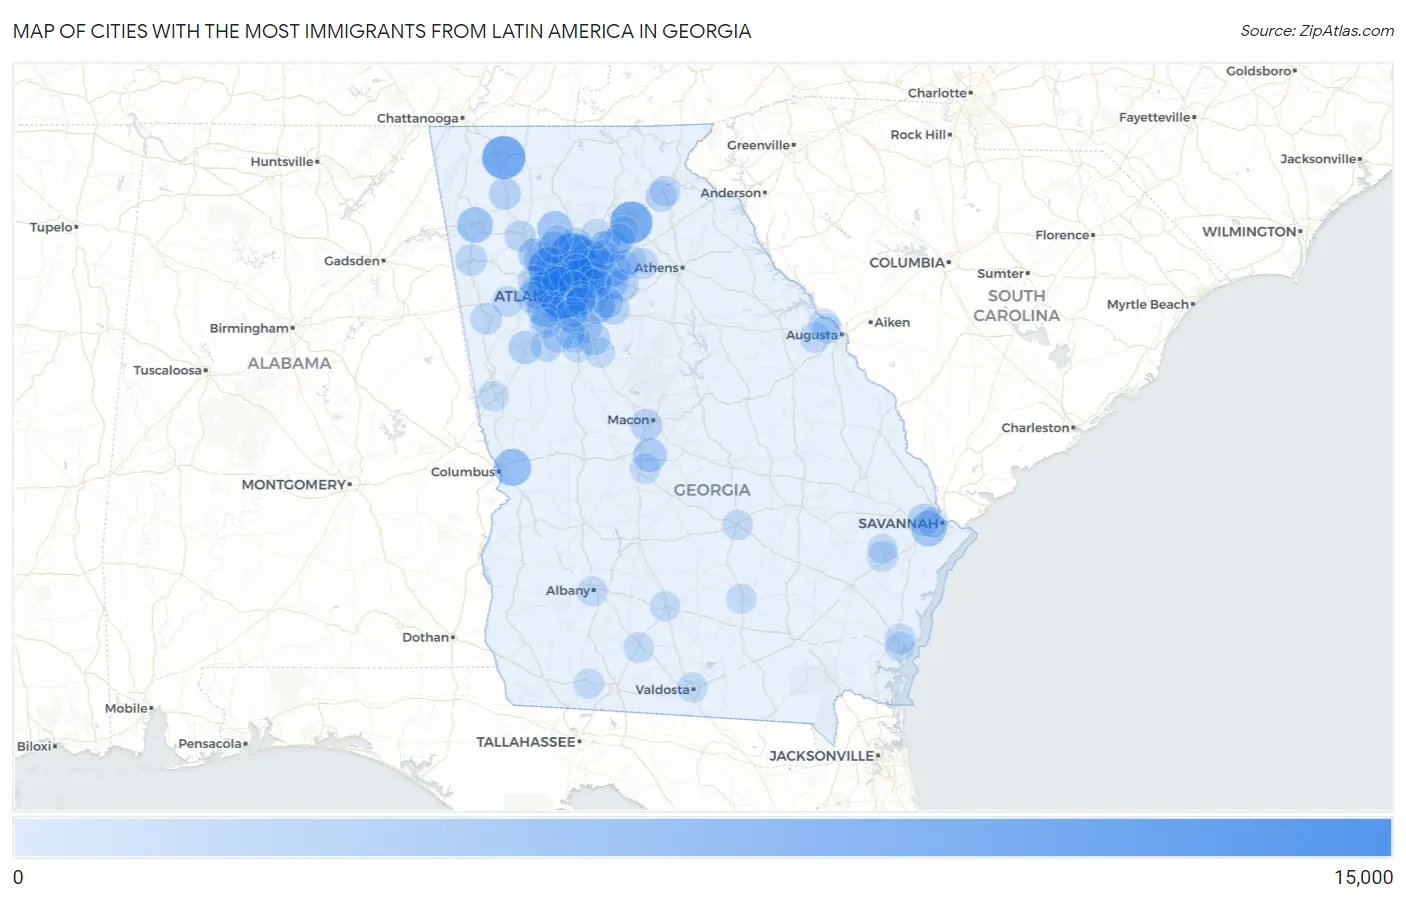
Map of Cities with the Most Immigrants from Latin America in Georgia
0
15,000
Cities with the Most Immigrants from Latin America in Georgia
| City | Latin America | vs State | vs National | |
| 1. | Atlanta | 11,945 | 538,775(2.22%)#1 | 22,649,518(0.05%)#285 |
| 2. | Roswell | 9,677 | 538,775(1.80%)#2 | 22,649,518(0.04%)#345 |
| 3. | Dalton | 8,105 | 538,775(1.50%)#3 | 22,649,518(0.04%)#410 |
| 4. | Marietta | 8,084 | 538,775(1.50%)#4 | 22,649,518(0.04%)#412 |
| 5. | Gainesville | 7,504 | 538,775(1.39%)#5 | 22,649,518(0.03%)#450 |
| 6. | Athens-Clarke County Unified Government (Balance) | 5,825 | 538,775(1.08%)#6 | 22,649,518(0.03%)#574 |
| 7. | Sandy Springs | 5,676 | 538,775(1.05%)#7 | 22,649,518(0.03%)#594 |
| 8. | Chamblee | 5,670 | 538,775(1.05%)#8 | 22,649,518(0.03%)#597 |
| 9. | Brookhaven | 5,393 | 538,775(1.00%)#9 | 22,649,518(0.02%)#629 |
| 10. | Mableton | 4,779 | 538,775(0.89%)#10 | 22,649,518(0.02%)#699 |
| 11. | Stonecrest | 4,710 | 538,775(0.87%)#11 | 22,649,518(0.02%)#706 |
| 12. | Columbus | 4,674 | 538,775(0.87%)#12 | 22,649,518(0.02%)#712 |
| 13. | Lawrenceville | 4,360 | 538,775(0.81%)#13 | 22,649,518(0.02%)#745 |
| 14. | South Fulton | 4,060 | 538,775(0.75%)#14 | 22,649,518(0.02%)#788 |
| 15. | Rome | 3,724 | 538,775(0.69%)#15 | 22,649,518(0.02%)#841 |
| 16. | Johns Creek | 3,697 | 538,775(0.69%)#16 | 22,649,518(0.02%)#849 |
| 17. | Smyrna | 3,642 | 538,775(0.68%)#17 | 22,649,518(0.02%)#861 |
| 18. | Savannah | 3,524 | 538,775(0.65%)#18 | 22,649,518(0.02%)#888 |
| 19. | Canton | 3,519 | 538,775(0.65%)#19 | 22,649,518(0.02%)#889 |
| 20. | Peachtree Corners | 3,185 | 538,775(0.59%)#20 | 22,649,518(0.01%)#954 |
| 21. | Norcross | 3,174 | 538,775(0.59%)#21 | 22,649,518(0.01%)#956 |
| 22. | Fair Oaks | 3,090 | 538,775(0.57%)#22 | 22,649,518(0.01%)#974 |
| 23. | Alpharetta | 2,865 | 538,775(0.53%)#23 | 22,649,518(0.01%)#1,043 |
| 24. | Kennesaw | 2,795 | 538,775(0.52%)#24 | 22,649,518(0.01%)#1,057 |
| 25. | Doraville | 2,725 | 538,775(0.51%)#25 | 22,649,518(0.01%)#1,075 |
| 26. | Buford | 2,670 | 538,775(0.50%)#26 | 22,649,518(0.01%)#1,093 |
| 27. | Lilburn | 2,583 | 538,775(0.48%)#27 | 22,649,518(0.01%)#1,116 |
| 28. | Lithia Springs | 2,564 | 538,775(0.48%)#28 | 22,649,518(0.01%)#1,125 |
| 29. | Warner Robins | 2,543 | 538,775(0.47%)#29 | 22,649,518(0.01%)#1,133 |
| 30. | Augusta-Richmond County Consolidated Government (Balance) | 2,446 | 538,775(0.45%)#30 | 22,649,518(0.01%)#1,164 |
| 31. | Snellville | 2,414 | 538,775(0.45%)#31 | 22,649,518(0.01%)#1,173 |
| 32. | Acworth | 2,390 | 538,775(0.44%)#32 | 22,649,518(0.01%)#1,185 |
| 33. | Duluth | 2,265 | 538,775(0.42%)#33 | 22,649,518(0.01%)#1,225 |
| 34. | Newnan | 2,260 | 538,775(0.42%)#34 | 22,649,518(0.01%)#1,226 |
| 35. | Redan | 2,190 | 538,775(0.41%)#35 | 22,649,518(0.01%)#1,250 |
| 36. | Tucker | 2,174 | 538,775(0.40%)#36 | 22,649,518(0.01%)#1,262 |
| 37. | Sugar Hill | 2,059 | 538,775(0.38%)#37 | 22,649,518(0.01%)#1,318 |
| 38. | Forest Park | 2,038 | 538,775(0.38%)#38 | 22,649,518(0.01%)#1,328 |
| 39. | Mcdonough | 1,980 | 538,775(0.37%)#39 | 22,649,518(0.01%)#1,352 |
| 40. | Loganville | 1,980 | 538,775(0.37%)#40 | 22,649,518(0.01%)#1,353 |
| 41. | Pooler | 1,888 | 538,775(0.35%)#41 | 22,649,518(0.01%)#1,404 |
| 42. | Milton | 1,886 | 538,775(0.35%)#42 | 22,649,518(0.01%)#1,405 |
| 43. | Woodstock | 1,757 | 538,775(0.33%)#43 | 22,649,518(0.01%)#1,470 |
| 44. | Dunwoody | 1,681 | 538,775(0.31%)#44 | 22,649,518(0.01%)#1,510 |
| 45. | Calhoun | 1,673 | 538,775(0.31%)#45 | 22,649,518(0.01%)#1,513 |
| 46. | Macon Bibb County | 1,631 | 538,775(0.30%)#46 | 22,649,518(0.01%)#1,541 |
| 47. | Douglasville | 1,479 | 538,775(0.27%)#47 | 22,649,518(0.01%)#1,635 |
| 48. | Cedartown | 1,434 | 538,775(0.27%)#48 | 22,649,518(0.01%)#1,676 |
| 49. | Powder Springs | 1,429 | 538,775(0.27%)#49 | 22,649,518(0.01%)#1,681 |
| 50. | Conyers | 1,427 | 538,775(0.26%)#50 | 22,649,518(0.01%)#1,685 |
| 51. | Carrollton | 1,332 | 538,775(0.25%)#51 | 22,649,518(0.01%)#1,770 |
| 52. | Lakeview Estates | 1,269 | 538,775(0.24%)#52 | 22,649,518(0.01%)#1,830 |
| 53. | Peachtree City | 1,253 | 538,775(0.23%)#53 | 22,649,518(0.01%)#1,844 |
| 54. | Hapeville | 1,202 | 538,775(0.22%)#54 | 22,649,518(0.01%)#1,908 |
| 55. | Cartersville | 1,155 | 538,775(0.21%)#55 | 22,649,518(0.01%)#1,956 |
| 56. | Stockbridge | 1,147 | 538,775(0.21%)#56 | 22,649,518(0.01%)#1,968 |
| 57. | East Point | 1,142 | 538,775(0.21%)#57 | 22,649,518(0.01%)#1,971 |
| 58. | Winder | 1,135 | 538,775(0.21%)#58 | 22,649,518(0.01%)#1,975 |
| 59. | Baldwin | 1,120 | 538,775(0.21%)#59 | 22,649,518(0.00%)#1,990 |
| 60. | Hinesville | 1,053 | 538,775(0.20%)#60 | 22,649,518(0.00%)#2,071 |
| 61. | Garden City | 1,027 | 538,775(0.19%)#61 | 22,649,518(0.00%)#2,099 |
| 62. | Mountain Park | 998 | 538,775(0.19%)#62 | 22,649,518(0.00%)#2,146 |
| 63. | Cornelia | 978 | 538,775(0.18%)#63 | 22,649,518(0.00%)#2,174 |
| 64. | Union City | 955 | 538,775(0.18%)#64 | 22,649,518(0.00%)#2,212 |
| 65. | Grovetown | 934 | 538,775(0.17%)#65 | 22,649,518(0.00%)#2,250 |
| 66. | Evans | 927 | 538,775(0.17%)#66 | 22,649,518(0.00%)#2,257 |
| 67. | Villa Rica | 909 | 538,775(0.17%)#67 | 22,649,518(0.00%)#2,278 |
| 68. | Moultrie | 857 | 538,775(0.16%)#68 | 22,649,518(0.00%)#2,350 |
| 69. | Fayetteville | 852 | 538,775(0.16%)#69 | 22,649,518(0.00%)#2,361 |
| 70. | Perry | 812 | 538,775(0.15%)#70 | 22,649,518(0.00%)#2,430 |
| 71. | Mcrae Helena | 792 | 538,775(0.15%)#71 | 22,649,518(0.00%)#2,483 |
| 72. | Lovejoy | 789 | 538,775(0.15%)#72 | 22,649,518(0.00%)#2,487 |
| 73. | Fairburn | 787 | 538,775(0.15%)#73 | 22,649,518(0.00%)#2,494 |
| 74. | Cairo | 770 | 538,775(0.14%)#74 | 22,649,518(0.00%)#2,526 |
| 75. | Dacula | 738 | 538,775(0.14%)#75 | 22,649,518(0.00%)#2,602 |
| 76. | Tifton | 735 | 538,775(0.14%)#76 | 22,649,518(0.00%)#2,609 |
| 77. | Suwanee | 732 | 538,775(0.14%)#77 | 22,649,518(0.00%)#2,615 |
| 78. | Valdosta | 726 | 538,775(0.13%)#78 | 22,649,518(0.00%)#2,628 |
| 79. | Lagrange | 692 | 538,775(0.13%)#79 | 22,649,518(0.00%)#2,702 |
| 80. | Belvedere Park | 690 | 538,775(0.13%)#80 | 22,649,518(0.00%)#2,709 |
| 81. | Oakwood | 679 | 538,775(0.13%)#81 | 22,649,518(0.00%)#2,734 |
| 82. | Albany | 664 | 538,775(0.12%)#82 | 22,649,518(0.00%)#2,761 |
| 83. | Douglas | 655 | 538,775(0.12%)#83 | 22,649,518(0.00%)#2,778 |
| 84. | Vinings | 652 | 538,775(0.12%)#84 | 22,649,518(0.00%)#2,788 |
| 85. | North Druid Hills | 613 | 538,775(0.11%)#85 | 22,649,518(0.00%)#2,890 |
| 86. | Morrow | 611 | 538,775(0.11%)#86 | 22,649,518(0.00%)#2,899 |
| 87. | Country Club Estates | 608 | 538,775(0.11%)#87 | 22,649,518(0.00%)#2,905 |
| 88. | Auburn | 601 | 538,775(0.11%)#88 | 22,649,518(0.00%)#2,925 |
| 89. | Panthersville | 600 | 538,775(0.11%)#89 | 22,649,518(0.00%)#2,928 |
| 90. | Martinez | 585 | 538,775(0.11%)#90 | 22,649,518(0.00%)#2,979 |
| 91. | Flowery Branch | 582 | 538,775(0.11%)#91 | 22,649,518(0.00%)#2,993 |
| 92. | Candler Mcafee | 575 | 538,775(0.11%)#92 | 22,649,518(0.00%)#3,021 |
| 93. | Cumming | 562 | 538,775(0.10%)#93 | 22,649,518(0.00%)#3,056 |
| 94. | Brunswick | 551 | 538,775(0.10%)#94 | 22,649,518(0.00%)#3,091 |
| 95. | Hampton | 543 | 538,775(0.10%)#95 | 22,649,518(0.00%)#3,121 |
| 96. | Fort Stewart | 539 | 538,775(0.10%)#96 | 22,649,518(0.00%)#3,139 |
| 97. | Locust Grove | 526 | 538,775(0.10%)#97 | 22,649,518(0.00%)#3,194 |
| 98. | Conley | 519 | 538,775(0.10%)#98 | 22,649,518(0.00%)#3,210 |
| 99. | Holly Springs | 516 | 538,775(0.10%)#99 | 22,649,518(0.00%)#3,219 |
| 100. | Irondale | 511 | 538,775(0.09%)#100 | 22,649,518(0.00%)#3,242 |
Common Questions
What are the Top 10 Cities with the Most Immigrants from Latin America in Georgia?
Top 10 Cities with the Most Immigrants from Latin America in Georgia are:
#1
11,945
#2
9,677
#3
8,105
#4
8,084
#5
7,504
#6
5,676
#7
5,670
#8
5,393
#9
4,779
#10
4,710
What city has the Most Immigrants from Latin America in Georgia?
Atlanta has the Most Immigrants from Latin America in Georgia with 11,945.
What is the Total Immigrants from Latin America in the State of Georgia?
Total Immigrants from Latin America in Georgia is 538,775.
What is the Total Immigrants from Latin America in the United States?
Total Immigrants from Latin America in the United States is 22,649,518.