Zip Codes with the Highest Percentage of Population Employed in Food Preparation & Serving in Moultrie, GA
RELATED REPORTS & OPTIONS
Food Preparation & Serving
Moultrie
Compare Zip Codes
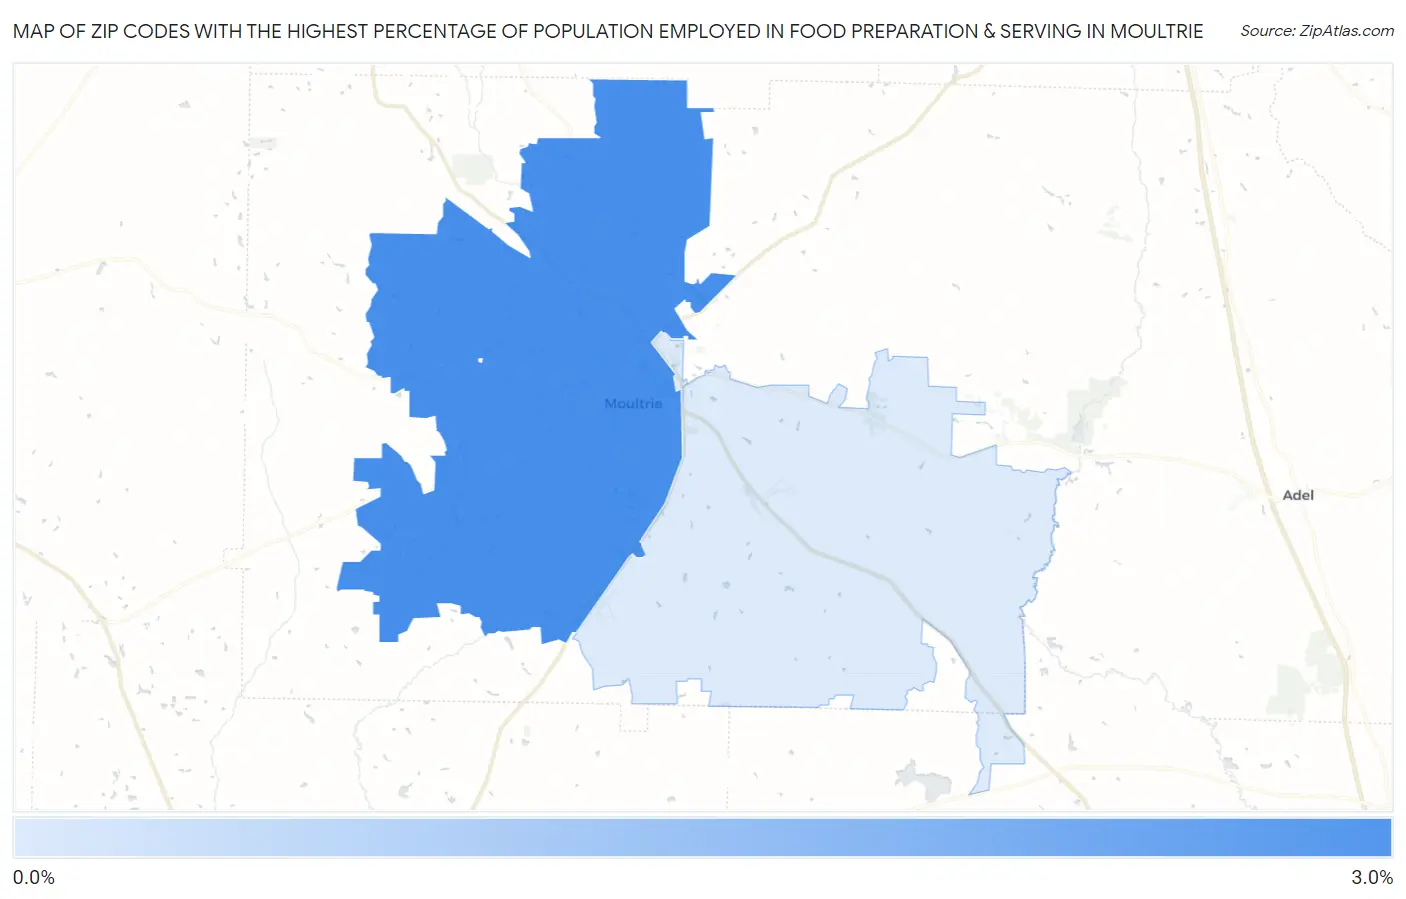
Map of Zip Codes with the Highest Percentage of Population Employed in Food Preparation & Serving in Moultrie
0.62%
3.0%
Zip Codes with the Highest Percentage of Population Employed in Food Preparation & Serving in Moultrie, GA
| Zip Code | % Employed | vs State | vs National | |
| 1. | 31768 | 3.0% | 5.1%(-2.17)#506 | 5.3%(-2.31)#21,347 |
| 2. | 31788 | 0.62% | 5.1%(-4.52)#642 | 5.3%(-4.66)#27,553 |
1
Common Questions
What are the Top Zip Codes with the Highest Percentage of Population Employed in Food Preparation & Serving in Moultrie, GA?
Top Zip Codes with the Highest Percentage of Population Employed in Food Preparation & Serving in Moultrie, GA are:
What zip code has the Highest Percentage of Population Employed in Food Preparation & Serving in Moultrie, GA?
31768 has the Highest Percentage of Population Employed in Food Preparation & Serving in Moultrie, GA with 3.0%.
What is the Percentage of Population Employed in Food Preparation & Serving in Moultrie, GA?
Percentage of Population Employed in Food Preparation & Serving in Moultrie is 3.1%.
What is the Percentage of Population Employed in Food Preparation & Serving in Georgia?
Percentage of Population Employed in Food Preparation & Serving in Georgia is 5.1%.
What is the Percentage of Population Employed in Food Preparation & Serving in the United States?
Percentage of Population Employed in Food Preparation & Serving in the United States is 5.3%.