Waverly Hall, GA Map & Demographics
Waverly Hall Map
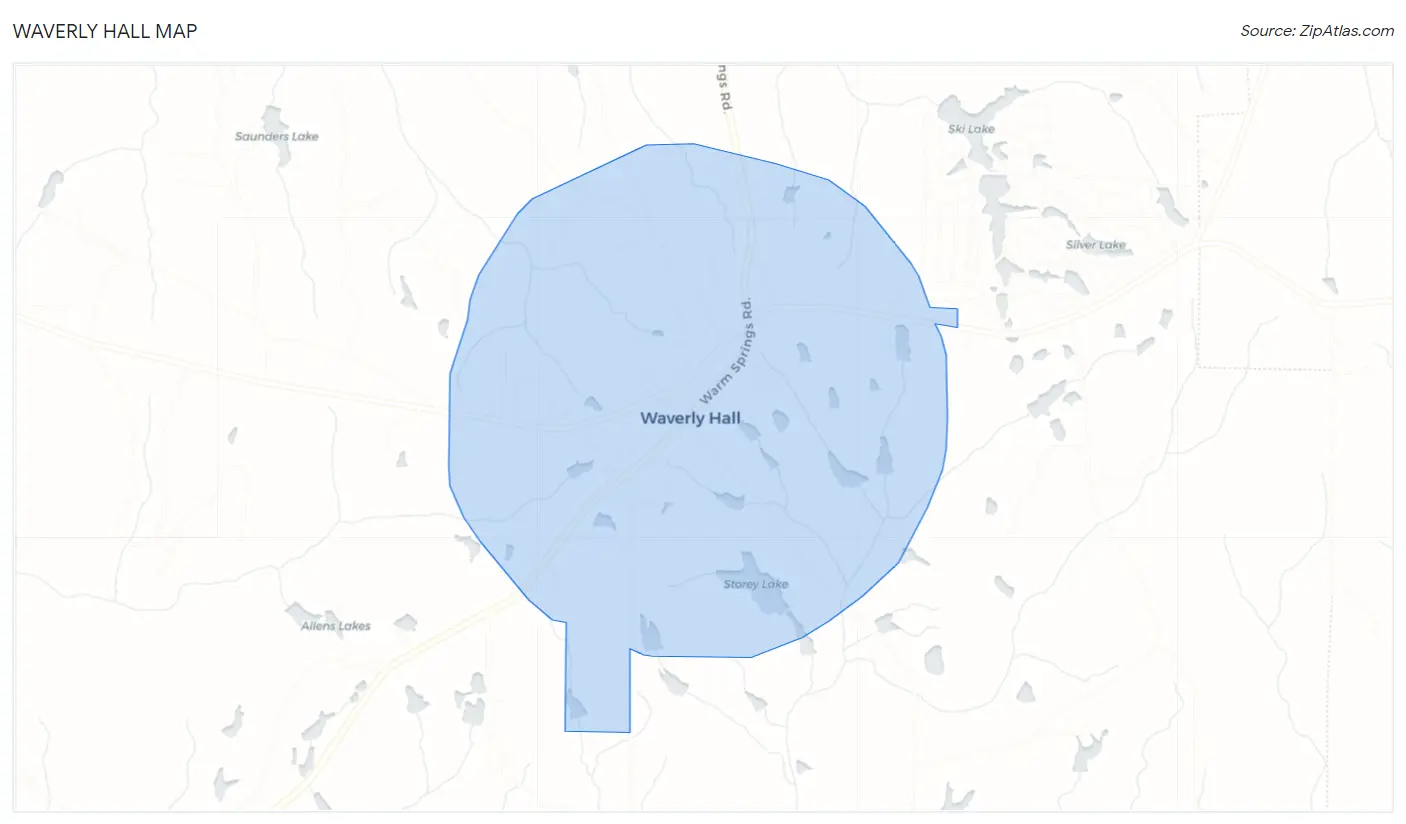
Waverly Hall Overview
$17,880
PER CAPITA INCOME
$45,441
AVG FAMILY INCOME
$38,281
AVG HOUSEHOLD INCOME
0.44
INEQUALITY / GINI INDEX
700
TOTAL POPULATION
320
MALE POPULATION
380
FEMALE POPULATION
84.21
MALES / 100 FEMALES
118.75
FEMALES / 100 MALES
53.5
MEDIAN AGE
3.4
AVG FAMILY SIZE
2.7
AVG HOUSEHOLD SIZE
247
LABOR FORCE [ PEOPLE ]
38.4%
PERCENT IN LABOR FORCE
5.3%
UNEMPLOYMENT RATE
Waverly Hall Zip Codes
Waverly Hall Area Codes
Income in Waverly Hall
Income Overview in Waverly Hall
Per Capita Income in Waverly Hall is $17,880, while median incomes of families and households are $45,441 and $38,281 respectively.
| Characteristic | Number | Measure |
| Per Capita Income | 700 | $17,880 |
| Median Family Income | 154 | $45,441 |
| Mean Family Income | 154 | $53,293 |
| Median Household Income | 223 | $38,281 |
| Mean Household Income | 223 | $47,569 |
| Income Deficit | 154 | $0 |
| Wage / Income Gap (%) | 700 | 0.00% |
| Wage / Income Gap ($) | 700 | 100.00¢ per $1 |
| Gini / Inequality Index | 700 | 0.44 |
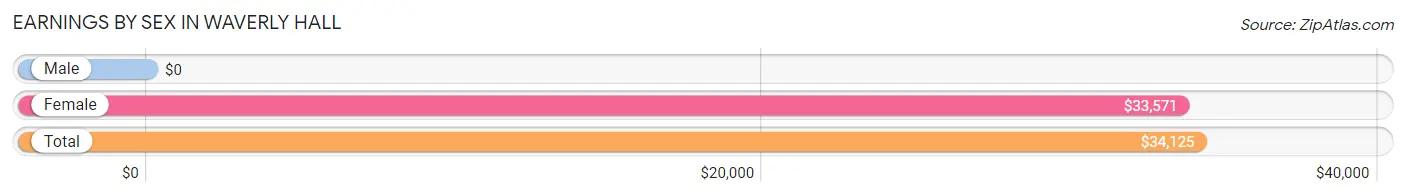
Earnings by Sex in Waverly Hall
| Sex | Number | Average Earnings |
| Male | 165 (64.7%) | $0 |
| Female | 90 (35.3%) | $33,571 |
| Total | 255 (100.0%) | $34,125 |
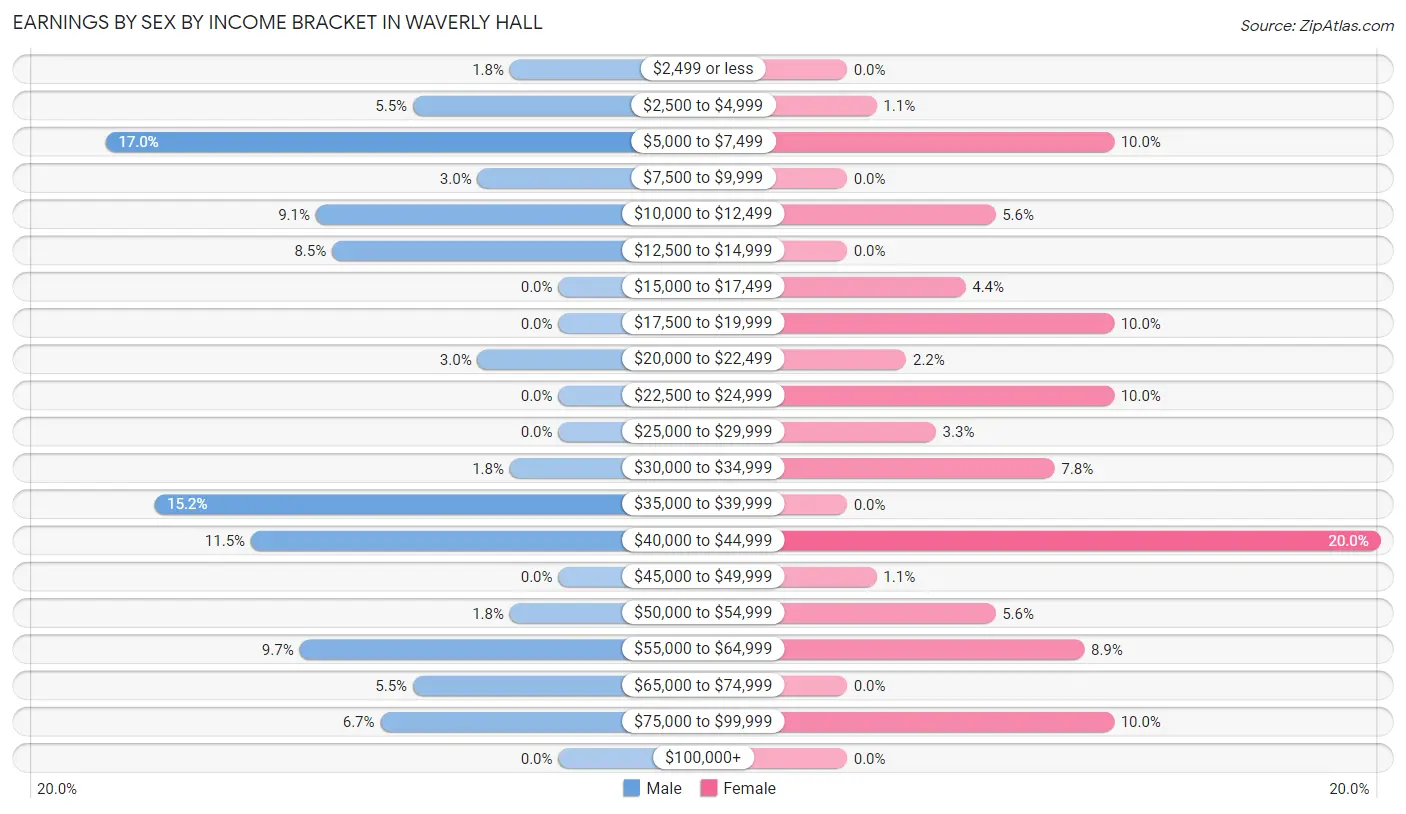
Earnings by Sex by Income Bracket in Waverly Hall
The most common earnings brackets in Waverly Hall are $5,000 to $7,499 for men (28 | 17.0%) and $40,000 to $44,999 for women (18 | 20.0%).
| Income | Male | Female |
| $2,499 or less | 3 (1.8%) | 0 (0.0%) |
| $2,500 to $4,999 | 9 (5.4%) | 1 (1.1%) |
| $5,000 to $7,499 | 28 (17.0%) | 9 (10.0%) |
| $7,500 to $9,999 | 5 (3.0%) | 0 (0.0%) |
| $10,000 to $12,499 | 15 (9.1%) | 5 (5.6%) |
| $12,500 to $14,999 | 14 (8.5%) | 0 (0.0%) |
| $15,000 to $17,499 | 0 (0.0%) | 4 (4.4%) |
| $17,500 to $19,999 | 0 (0.0%) | 9 (10.0%) |
| $20,000 to $22,499 | 5 (3.0%) | 2 (2.2%) |
| $22,500 to $24,999 | 0 (0.0%) | 9 (10.0%) |
| $25,000 to $29,999 | 0 (0.0%) | 3 (3.3%) |
| $30,000 to $34,999 | 3 (1.8%) | 7 (7.8%) |
| $35,000 to $39,999 | 25 (15.1%) | 0 (0.0%) |
| $40,000 to $44,999 | 19 (11.5%) | 18 (20.0%) |
| $45,000 to $49,999 | 0 (0.0%) | 1 (1.1%) |
| $50,000 to $54,999 | 3 (1.8%) | 5 (5.6%) |
| $55,000 to $64,999 | 16 (9.7%) | 8 (8.9%) |
| $65,000 to $74,999 | 9 (5.4%) | 0 (0.0%) |
| $75,000 to $99,999 | 11 (6.7%) | 9 (10.0%) |
| $100,000+ | 0 (0.0%) | 0 (0.0%) |
| Total | 165 (100.0%) | 90 (100.0%) |
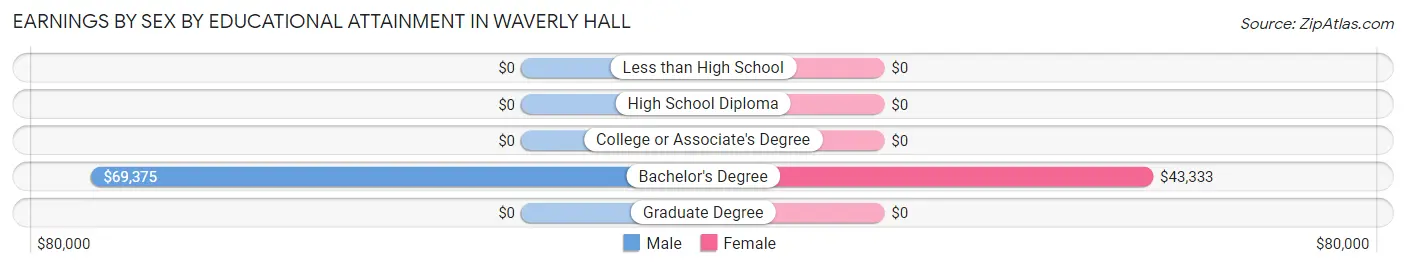
Earnings by Sex by Educational Attainment in Waverly Hall
Average earnings in Waverly Hall are $35,956 for men and $41,250 for women, a difference of 12.8%. Men with an educational attainment of bachelor's degree enjoy the highest average annual earnings of $69,375, while those with bachelor's degree education earn the least with $69,375. Women with an educational attainment of bachelor's degree earn the most with the average annual earnings of $43,333, while those with bachelor's degree education have the smallest earnings of $43,333.
| Educational Attainment | Male Income | Female Income |
| Less than High School | - | - |
| High School Diploma | - | - |
| College or Associate's Degree | - | - |
| Bachelor's Degree | $69,375 | $43,333 |
| Graduate Degree | - | - |
| Total | $35,956 | $41,250 |
Family Income in Waverly Hall
Family Income Brackets in Waverly Hall
According to the Waverly Hall family income data, there are 39 families falling into the less than $10,000 income range, which is the most common income bracket and makes up 25.3% of all families.
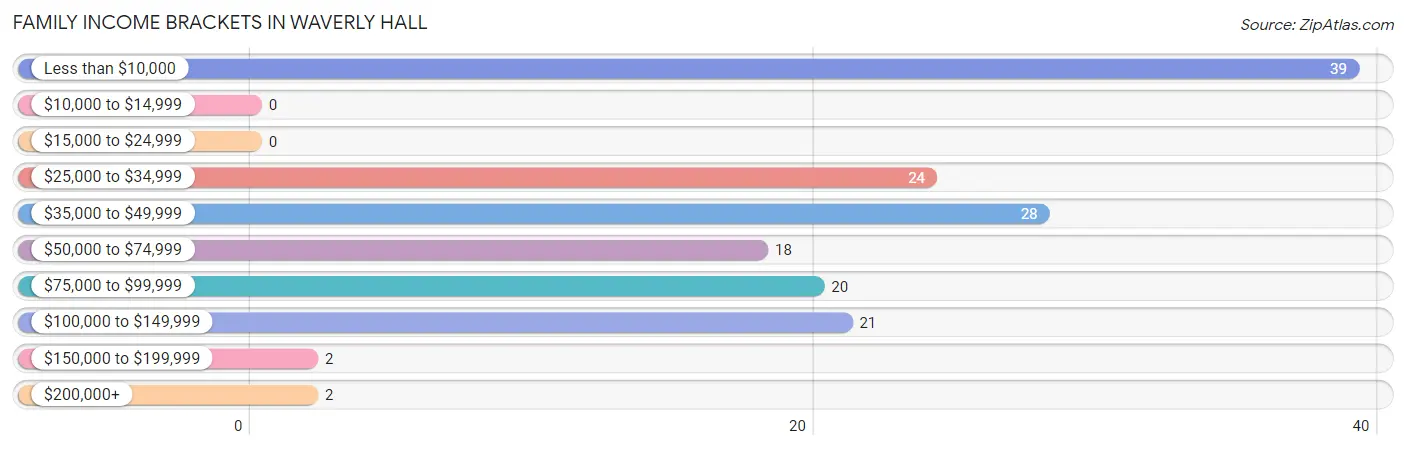
| Income Bracket | # Families | % Families |
| Less than $10,000 | 39 | 25.3% |
| $10,000 to $14,999 | 0 | 0.0% |
| $15,000 to $24,999 | 0 | 0.0% |
| $25,000 to $34,999 | 24 | 15.6% |
| $35,000 to $49,999 | 28 | 18.2% |
| $50,000 to $74,999 | 18 | 11.7% |
| $75,000 to $99,999 | 20 | 13.0% |
| $100,000 to $149,999 | 21 | 13.6% |
| $150,000 to $199,999 | 2 | 1.3% |
| $200,000+ | 2 | 1.3% |
Family Income by Famaliy Size in Waverly Hall
3-person families (59 | 38.3%) account for the highest median family income in Waverly Hall with $44,792 per family, while 3-person families (59 | 38.3%) have the highest median income of $14,931 per family member.
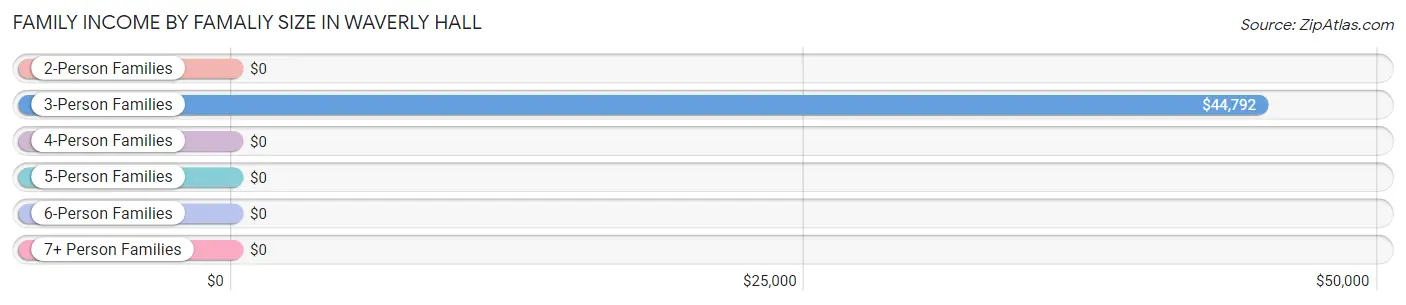
| Income Bracket | # Families | Median Income |
| 2-Person Families | 73 (47.4%) | $0 |
| 3-Person Families | 59 (38.3%) | $44,792 |
| 4-Person Families | 22 (14.3%) | $0 |
| 5-Person Families | 0 (0.0%) | $0 |
| 6-Person Families | 0 (0.0%) | $0 |
| 7+ Person Families | 0 (0.0%) | $0 |
| Total | 154 (100.0%) | $45,441 |
Family Income by Number of Earners in Waverly Hall
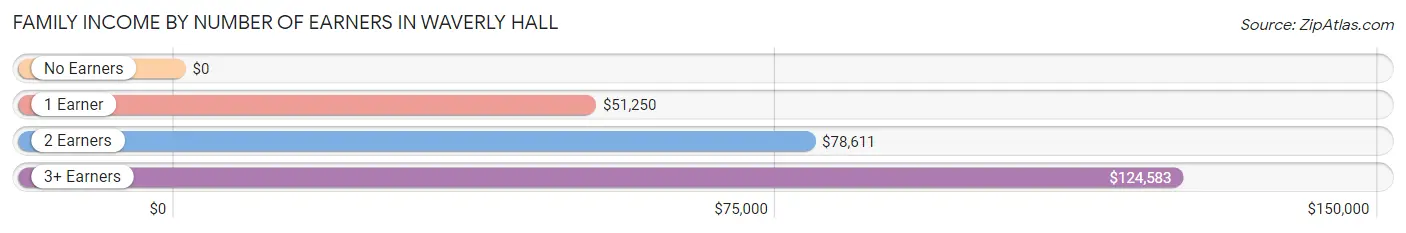
| Number of Earners | # Families | Median Income |
| No Earners | 61 (39.6%) | $0 |
| 1 Earner | 44 (28.6%) | $51,250 |
| 2 Earners | 38 (24.7%) | $78,611 |
| 3+ Earners | 11 (7.1%) | $124,583 |
| Total | 154 (100.0%) | $45,441 |
Household Income in Waverly Hall
Household Income Brackets in Waverly Hall
With 40 households falling in the category, the $25,000 to $34,999 income range is the most frequent in Waverly Hall, accounting for 17.9% of all households. In contrast, only 2 households (0.9%) fall into the $150,000 to $199,999 income bracket, making it the least populous group.
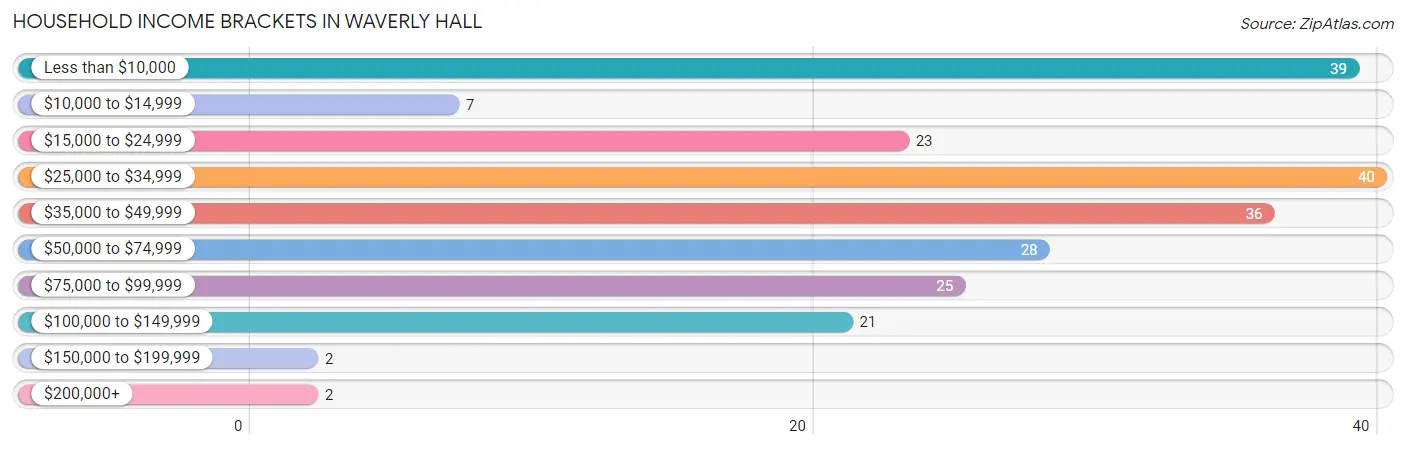
| Income Bracket | # Households | % Households |
| Less than $10,000 | 39 | 17.5% |
| $10,000 to $14,999 | 7 | 3.1% |
| $15,000 to $24,999 | 23 | 10.3% |
| $25,000 to $34,999 | 40 | 17.9% |
| $35,000 to $49,999 | 36 | 16.1% |
| $50,000 to $74,999 | 28 | 12.6% |
| $75,000 to $99,999 | 25 | 11.2% |
| $100,000 to $149,999 | 21 | 9.4% |
| $150,000 to $199,999 | 2 | 0.9% |
| $200,000+ | 2 | 0.9% |
Household Income by Householder Age in Waverly Hall
The median household income in Waverly Hall is $38,281, with the highest median household income of $83,750 found in the 25 to 44 years age bracket for the primary householder. A total of 37 households (16.6%) fall into this category.
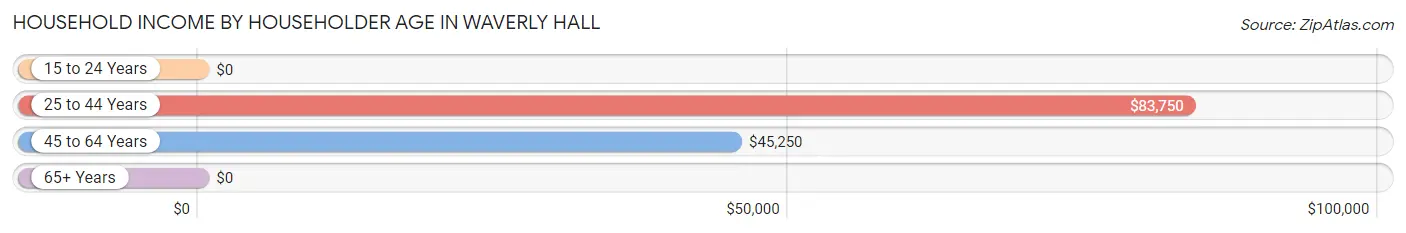
| Income Bracket | # Households | Median Income |
| 15 to 24 Years | 0 (0.0%) | $0 |
| 25 to 44 Years | 37 (16.6%) | $83,750 |
| 45 to 64 Years | 61 (27.4%) | $45,250 |
| 65+ Years | 125 (56.0%) | $0 |
| Total | 223 (100.0%) | $38,281 |
Poverty in Waverly Hall
Income Below Poverty by Sex and Age in Waverly Hall
With 15.4% poverty level for males and 22.7% for females among the residents of Waverly Hall, 45 to 54 year old males and 6 to 11 year old females are the most vulnerable to poverty, with 47 males (90.4%) and 10 females (83.3%) in their respective age groups living below the poverty level.
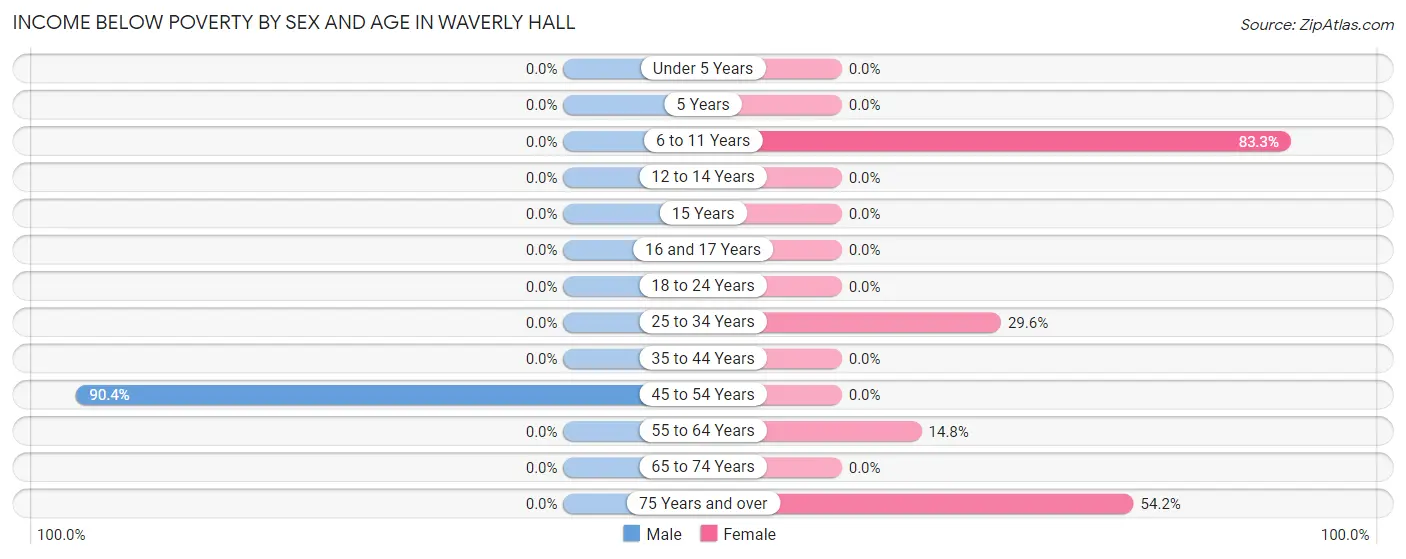
| Age Bracket | Male | Female |
| Under 5 Years | 0 (0.0%) | 0 (0.0%) |
| 5 Years | 0 (0.0%) | 0 (0.0%) |
| 6 to 11 Years | 0 (0.0%) | 10 (83.3%) |
| 12 to 14 Years | 0 (0.0%) | 0 (0.0%) |
| 15 Years | 0 (0.0%) | 0 (0.0%) |
| 16 and 17 Years | 0 (0.0%) | 0 (0.0%) |
| 18 to 24 Years | 0 (0.0%) | 0 (0.0%) |
| 25 to 34 Years | 0 (0.0%) | 13 (29.5%) |
| 35 to 44 Years | 0 (0.0%) | 0 (0.0%) |
| 45 to 54 Years | 47 (90.4%) | 0 (0.0%) |
| 55 to 64 Years | 0 (0.0%) | 4 (14.8%) |
| 65 to 74 Years | 0 (0.0%) | 0 (0.0%) |
| 75 Years and over | 0 (0.0%) | 39 (54.2%) |
| Total | 47 (15.4%) | 66 (22.7%) |
Income Above Poverty by Sex and Age in Waverly Hall
According to the poverty statistics in Waverly Hall, males aged under 5 years and females aged under 5 years are the age groups that are most secure financially, with 100.0% of males and 100.0% of females in these age groups living above the poverty line.
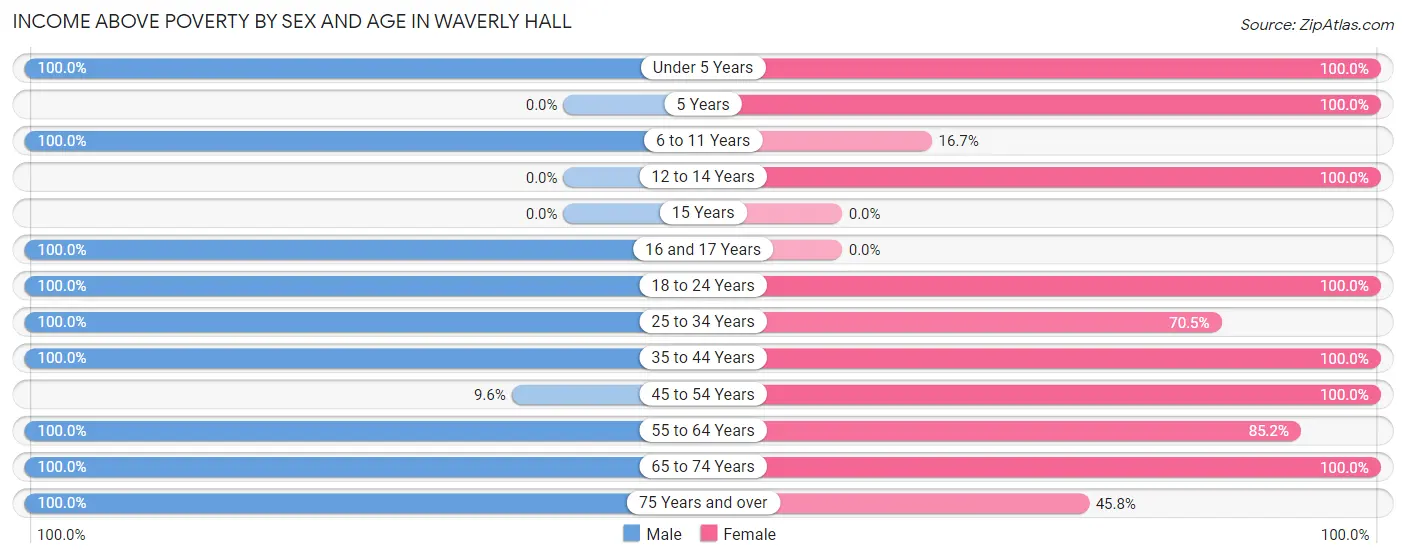
| Age Bracket | Male | Female |
| Under 5 Years | 17 (100.0%) | 2 (100.0%) |
| 5 Years | 0 (0.0%) | 3 (100.0%) |
| 6 to 11 Years | 3 (100.0%) | 2 (16.7%) |
| 12 to 14 Years | 0 (0.0%) | 18 (100.0%) |
| 15 Years | 0 (0.0%) | 0 (0.0%) |
| 16 and 17 Years | 7 (100.0%) | 0 (0.0%) |
| 18 to 24 Years | 26 (100.0%) | 31 (100.0%) |
| 25 to 34 Years | 51 (100.0%) | 31 (70.5%) |
| 35 to 44 Years | 63 (100.0%) | 10 (100.0%) |
| 45 to 54 Years | 5 (9.6%) | 47 (100.0%) |
| 55 to 64 Years | 41 (100.0%) | 23 (85.2%) |
| 65 to 74 Years | 26 (100.0%) | 25 (100.0%) |
| 75 Years and over | 19 (100.0%) | 33 (45.8%) |
| Total | 258 (84.6%) | 225 (77.3%) |
Income Below Poverty Among Married-Couple Families in Waverly Hall
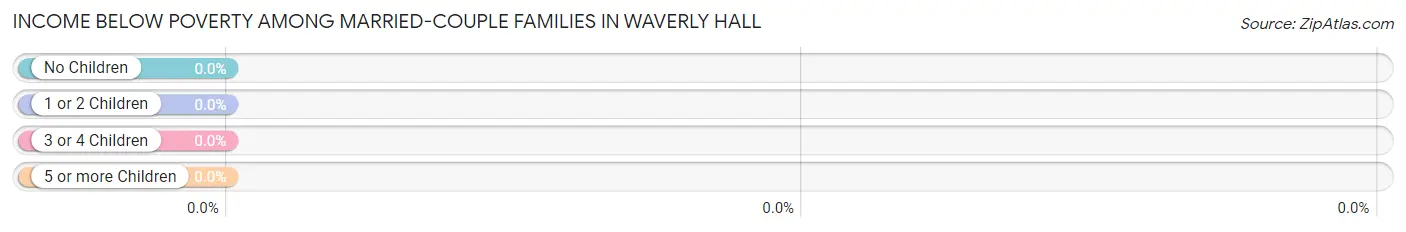
| Children | Above Poverty | Below Poverty |
| No Children | 63 (100.0%) | 0 (0.0%) |
| 1 or 2 Children | 4 (100.0%) | 0 (0.0%) |
| 3 or 4 Children | 0 (0.0%) | 0 (0.0%) |
| 5 or more Children | 0 (0.0%) | 0 (0.0%) |
| Total | 67 (100.0%) | 0 (0.0%) |
Income Below Poverty Among Single-Parent Households in Waverly Hall
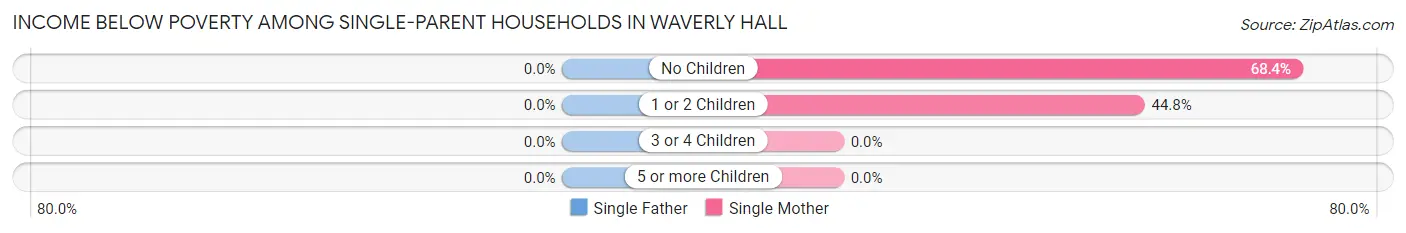
| Children | Single Father | Single Mother |
| No Children | 0 (0.0%) | 26 (68.4%) |
| 1 or 2 Children | 0 (0.0%) | 13 (44.8%) |
| 3 or 4 Children | 0 (0.0%) | 0 (0.0%) |
| 5 or more Children | 0 (0.0%) | 0 (0.0%) |
| Total | 0 (0.0%) | 39 (58.2%) |
Income Below Poverty Among Married-Couple vs Single-Parent Households in Waverly Hall
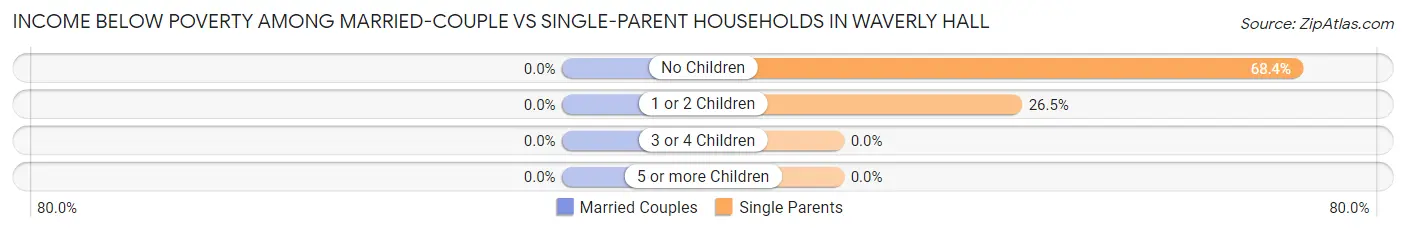
| Children | Married-Couple Families | Single-Parent Households |
| No Children | 0 (0.0%) | 26 (68.4%) |
| 1 or 2 Children | 0 (0.0%) | 13 (26.5%) |
| 3 or 4 Children | 0 (0.0%) | 0 (0.0%) |
| 5 or more Children | 0 (0.0%) | 0 (0.0%) |
| Total | 0 (0.0%) | 39 (44.8%) |
Race in Waverly Hall
The most populous races in Waverly Hall are White / Caucasian (346 | 49.4%), Black / African American (336 | 48.0%), and Two or more Races (13 | 1.9%).
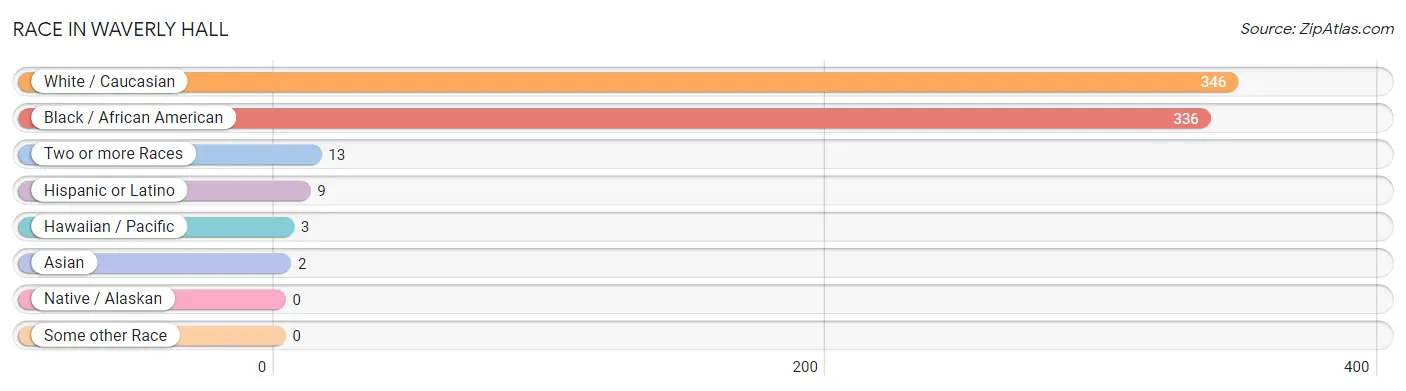
| Race | # Population | % Population |
| Asian | 2 | 0.3% |
| Black / African American | 336 | 48.0% |
| Hawaiian / Pacific | 3 | 0.4% |
| Hispanic or Latino | 9 | 1.3% |
| Native / Alaskan | 0 | 0.0% |
| White / Caucasian | 346 | 49.4% |
| Two or more Races | 13 | 1.9% |
| Some other Race | 0 | 0.0% |
| Total | 700 | 100.0% |
Ancestry in Waverly Hall
The most populous ancestries reported in Waverly Hall are Irish (140 | 20.0%), German (102 | 14.6%), English (70 | 10.0%), American (26 | 3.7%), and Scottish (12 | 1.7%), together accounting for 50.0% of all Waverly Hall residents.
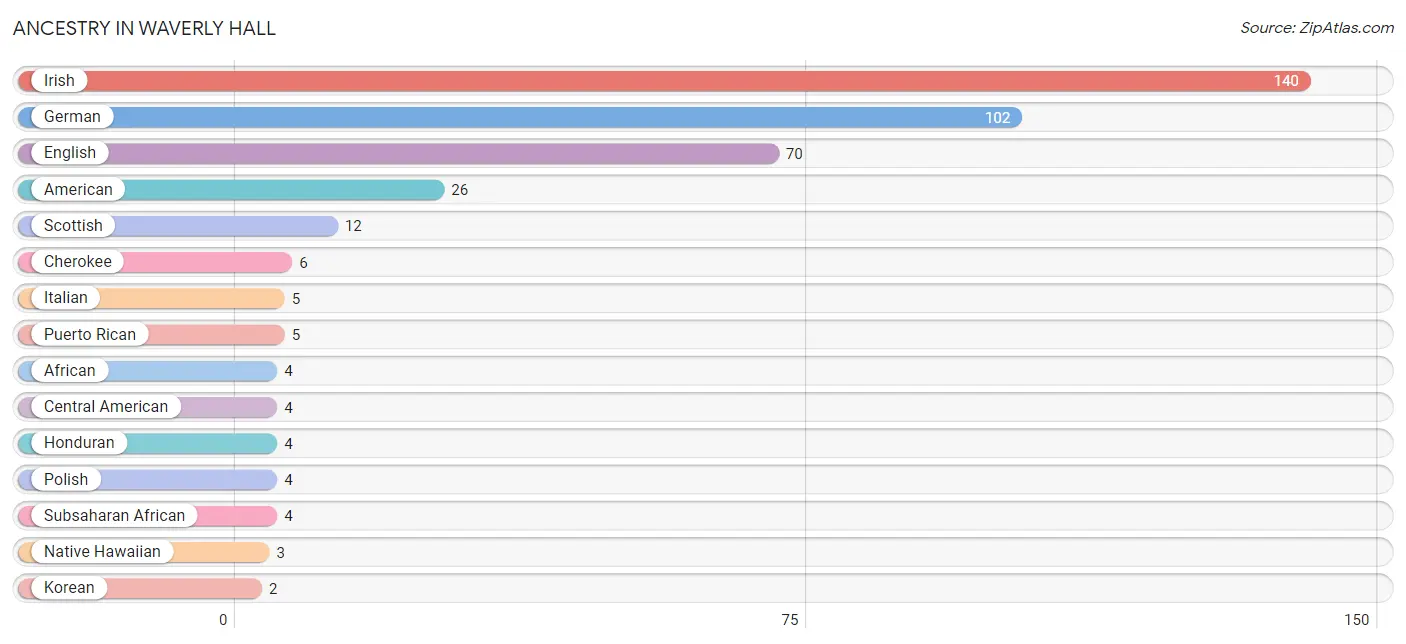
| Ancestry | # Population | % Population |
| African | 4 | 0.6% |
| American | 26 | 3.7% |
| Central American | 4 | 0.6% |
| Cherokee | 6 | 0.9% |
| English | 70 | 10.0% |
| German | 102 | 14.6% |
| Honduran | 4 | 0.6% |
| Irish | 140 | 20.0% |
| Italian | 5 | 0.7% |
| Korean | 2 | 0.3% |
| Native Hawaiian | 3 | 0.4% |
| Polish | 4 | 0.6% |
| Puerto Rican | 5 | 0.7% |
| Scotch-Irish | 2 | 0.3% |
| Scottish | 12 | 1.7% |
| Subsaharan African | 4 | 0.6% |
| Swedish | 2 | 0.3% | View All 17 Rows |
Immigrants in Waverly Hall
The most numerous immigrant groups reported in Waverly Hall came from England (3 | 0.4%), Europe (3 | 0.4%), Northern Europe (3 | 0.4%), Asia (2 | 0.3%), and Philippines (2 | 0.3%), together accounting for 1.9% of all Waverly Hall residents.
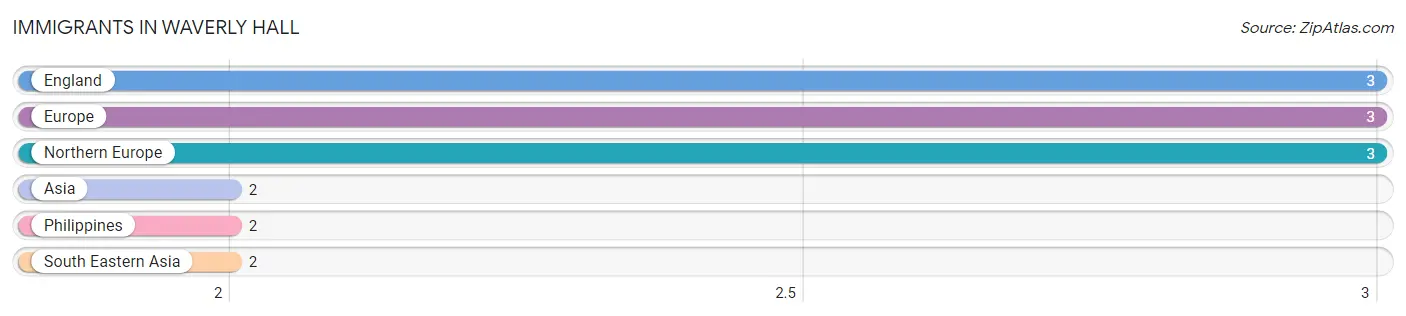
| Immigration Origin | # Population | % Population |
| Asia | 2 | 0.3% |
| England | 3 | 0.4% |
| Europe | 3 | 0.4% |
| Northern Europe | 3 | 0.4% |
| Philippines | 2 | 0.3% |
| South Eastern Asia | 2 | 0.3% | View All 6 Rows |
Sex and Age in Waverly Hall
Sex and Age in Waverly Hall
The most populous age groups in Waverly Hall are 35 to 39 Years (61 | 19.1%) for men and 75 to 79 Years (60 | 15.8%) for women.
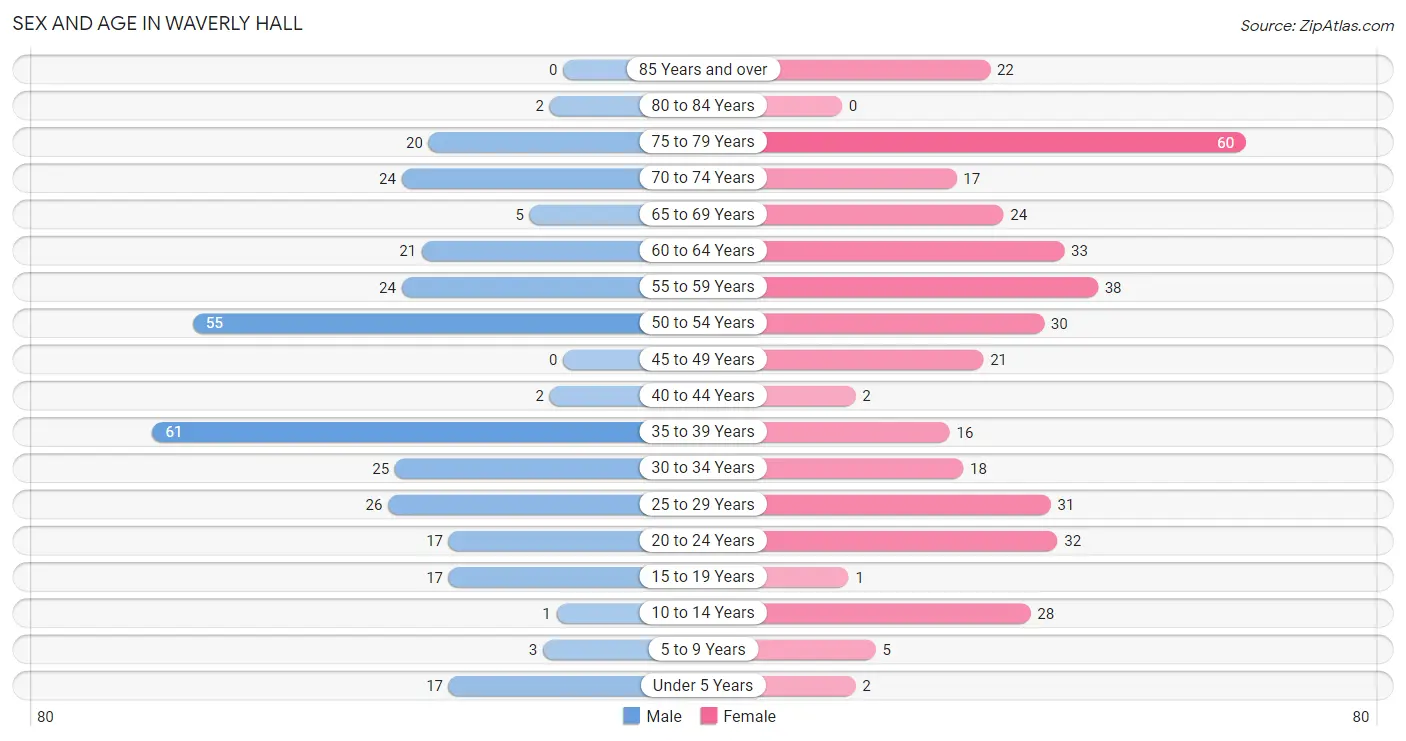
| Age Bracket | Male | Female |
| Under 5 Years | 17 (5.3%) | 2 (0.5%) |
| 5 to 9 Years | 3 (0.9%) | 5 (1.3%) |
| 10 to 14 Years | 1 (0.3%) | 28 (7.4%) |
| 15 to 19 Years | 17 (5.3%) | 1 (0.3%) |
| 20 to 24 Years | 17 (5.3%) | 32 (8.4%) |
| 25 to 29 Years | 26 (8.1%) | 31 (8.2%) |
| 30 to 34 Years | 25 (7.8%) | 18 (4.7%) |
| 35 to 39 Years | 61 (19.1%) | 16 (4.2%) |
| 40 to 44 Years | 2 (0.6%) | 2 (0.5%) |
| 45 to 49 Years | 0 (0.0%) | 21 (5.5%) |
| 50 to 54 Years | 55 (17.2%) | 30 (7.9%) |
| 55 to 59 Years | 24 (7.5%) | 38 (10.0%) |
| 60 to 64 Years | 21 (6.6%) | 33 (8.7%) |
| 65 to 69 Years | 5 (1.6%) | 24 (6.3%) |
| 70 to 74 Years | 24 (7.5%) | 17 (4.5%) |
| 75 to 79 Years | 20 (6.2%) | 60 (15.8%) |
| 80 to 84 Years | 2 (0.6%) | 0 (0.0%) |
| 85 Years and over | 0 (0.0%) | 22 (5.8%) |
| Total | 320 (100.0%) | 380 (100.0%) |
Families and Households in Waverly Hall
Median Family Size in Waverly Hall
The median family size in Waverly Hall is 3.36 persons per family, with single male/father families (20 | 13.0%) accounting for the largest median family size of 4.35 persons per family. On the other hand, married-couple families (67 | 43.5%) represent the smallest median family size with 2.97 persons per family.
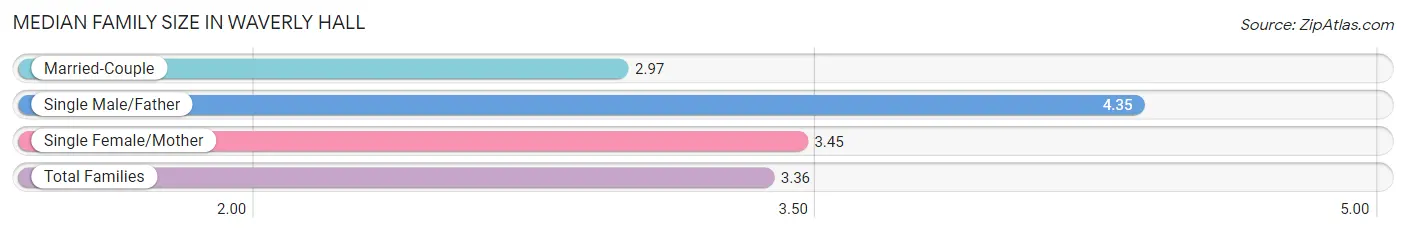
| Family Type | # Families | Family Size |
| Married-Couple | 67 (43.5%) | 2.97 |
| Single Male/Father | 20 (13.0%) | 4.35 |
| Single Female/Mother | 67 (43.5%) | 3.45 |
| Total Families | 154 (100.0%) | 3.36 |
Median Household Size in Waverly Hall
The median household size in Waverly Hall is 2.67 persons per household, with single male/father households (20 | 9.0%) accounting for the largest median household size of 4.55 persons per household. non-family households (69 | 30.9%) represent the smallest median household size with 1.09 persons per household.
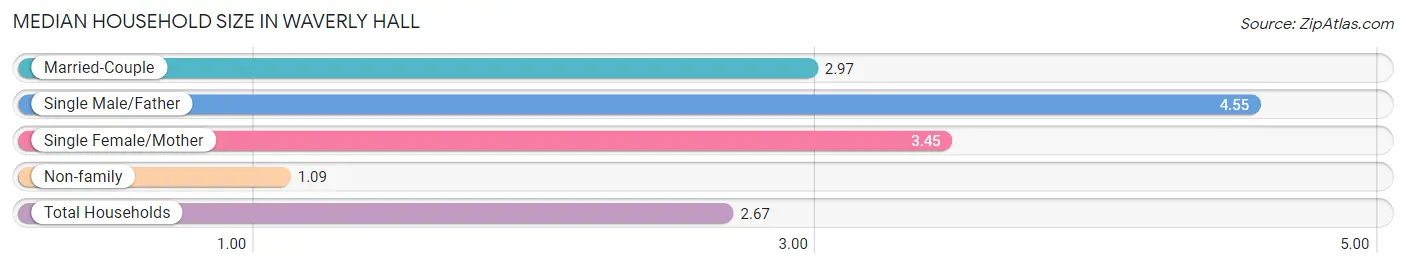
| Household Type | # Households | Household Size |
| Married-Couple | 67 (30.0%) | 2.97 |
| Single Male/Father | 20 (9.0%) | 4.55 |
| Single Female/Mother | 67 (30.0%) | 3.45 |
| Non-family | 69 (30.9%) | 1.09 |
| Total Households | 223 (100.0%) | 2.67 |
Household Size by Marriage Status in Waverly Hall
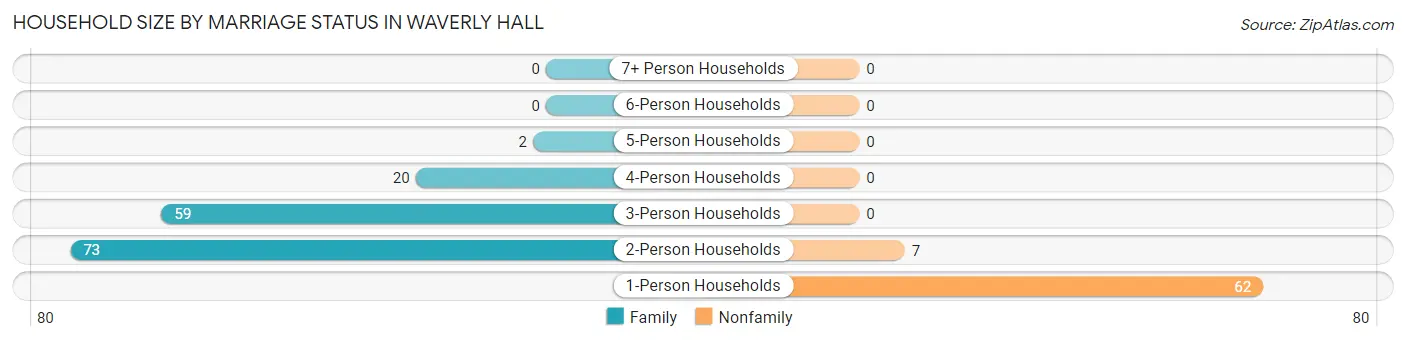
Out of a total of 223 households in Waverly Hall, 154 (69.1%) are family households, while 69 (30.9%) are nonfamily households. The most numerous type of family households are 2-person households, comprising 73, and the most common type of nonfamily households are 1-person households, comprising 62.
| Household Size | Family Households | Nonfamily Households |
| 1-Person Households | - | 62 (27.8%) |
| 2-Person Households | 73 (32.7%) | 7 (3.1%) |
| 3-Person Households | 59 (26.5%) | 0 (0.0%) |
| 4-Person Households | 20 (9.0%) | 0 (0.0%) |
| 5-Person Households | 2 (0.9%) | 0 (0.0%) |
| 6-Person Households | 0 (0.0%) | 0 (0.0%) |
| 7+ Person Households | 0 (0.0%) | 0 (0.0%) |
| Total | 154 (69.1%) | 69 (30.9%) |
Female Fertility in Waverly Hall
Fertility by Age in Waverly Hall
| Age Bracket | Women with Births | Births / 1,000 Women |
| 15 to 19 years | 0 (0.0%) | 0.0 |
| 20 to 34 years | 0 (0.0%) | 0.0 |
| 35 to 50 years | 0 (0.0%) | 0.0 |
| Total | 0 (0.0%) | 0.0 |
Fertility by Age by Marriage Status in Waverly Hall
| Age Bracket | Married | Unmarried |
| 15 to 19 years | 0 (0.0%) | 0 (0.0%) |
| 20 to 34 years | 0 (0.0%) | 0 (0.0%) |
| 35 to 50 years | 0 (0.0%) | 0 (0.0%) |
| Total | 0 (0.0%) | 0 (0.0%) |
Fertility by Education in Waverly Hall
| Educational Attainment | Women with Births | Births / 1,000 Women |
| Less than High School | 0 (0.0%) | 0.0 |
| High School Diploma | 0 (0.0%) | 0.0 |
| College or Associate's Degree | 0 (0.0%) | 0.0 |
| Bachelor's Degree | 0 (0.0%) | 0.0 |
| Graduate Degree | 0 (0.0%) | 0.0 |
| Total | 0 (0.0%) | 0.0 |
Fertility by Education by Marriage Status in Waverly Hall
| Educational Attainment | Married | Unmarried |
| Less than High School | 0 (0.0%) | 0 (0.0%) |
| High School Diploma | 0 (0.0%) | 0 (0.0%) |
| College or Associate's Degree | 0 (0.0%) | 0 (0.0%) |
| Bachelor's Degree | 0 (0.0%) | 0 (0.0%) |
| Graduate Degree | 0 (0.0%) | 0 (0.0%) |
| Total | 0 (0.0%) | 0 (0.0%) |
Employment Characteristics in Waverly Hall
Employment by Class of Employer in Waverly Hall
Among the 234 employed individuals in Waverly Hall, private company employees (172 | 73.5%), not-for-profit organizations (24 | 10.3%), and local government employees (14 | 6.0%) make up the most common classes of employment.
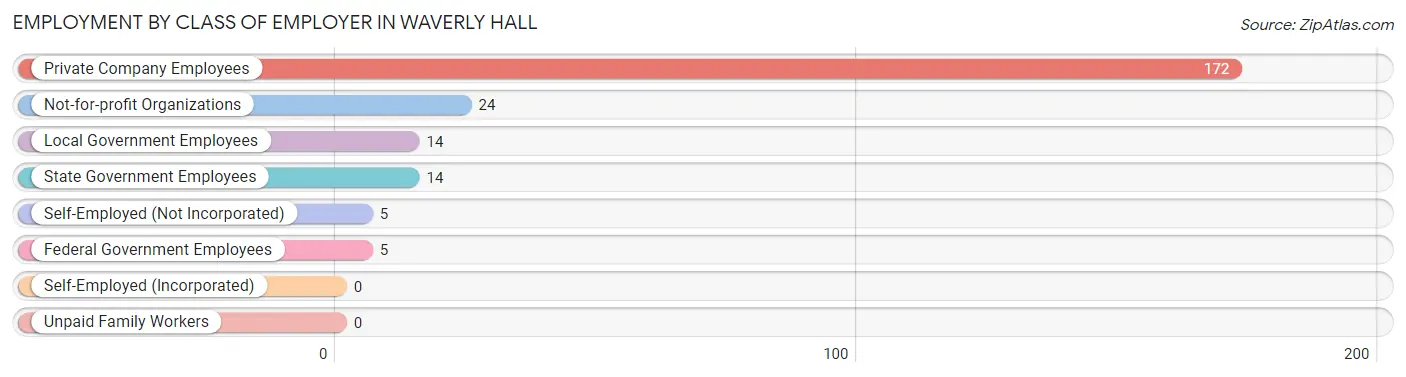
| Employer Class | # Employees | % Employees |
| Private Company Employees | 172 | 73.5% |
| Self-Employed (Incorporated) | 0 | 0.0% |
| Self-Employed (Not Incorporated) | 5 | 2.1% |
| Not-for-profit Organizations | 24 | 10.3% |
| Local Government Employees | 14 | 6.0% |
| State Government Employees | 14 | 6.0% |
| Federal Government Employees | 5 | 2.1% |
| Unpaid Family Workers | 0 | 0.0% |
| Total | 234 | 100.0% |
Employment Status by Age in Waverly Hall
According to the labor force statistics for Waverly Hall, out of the total population over 16 years of age (644), 38.4% or 247 individuals are in the labor force, with 5.3% or 13 of them unemployed. The age group with the highest labor force participation rate is 30 to 34 years, with 88.4% or 38 individuals in the labor force. Within the labor force, the 30 to 34 years age range has the highest percentage of unemployed individuals, with 34.2% or 13 of them being unemployed.
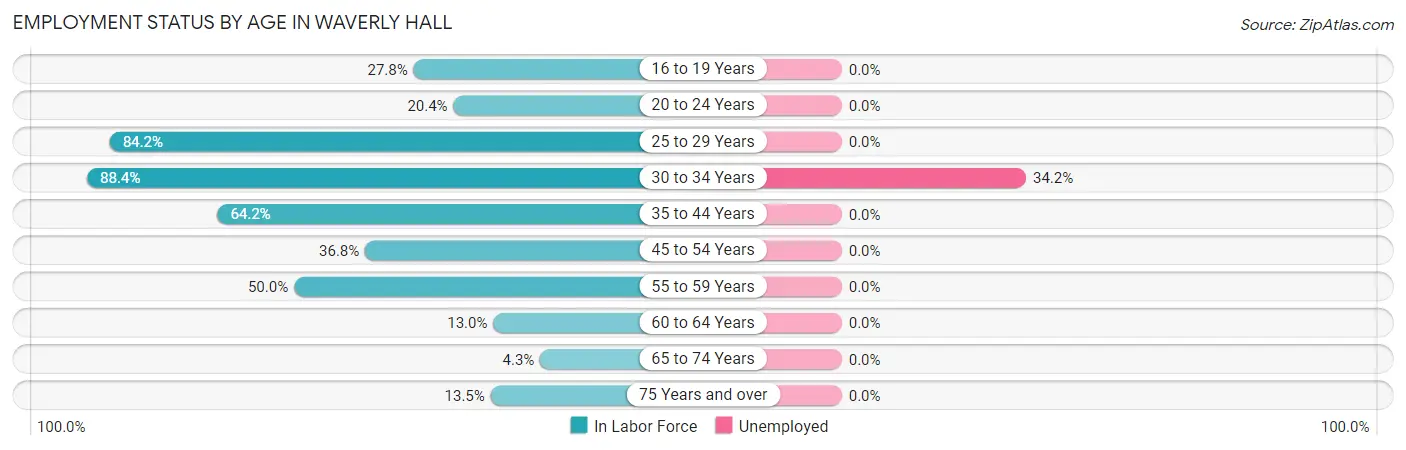
| Age Bracket | In Labor Force | Unemployed |
| 16 to 19 Years | 5 (27.8%) | 0 (0.0%) |
| 20 to 24 Years | 10 (20.4%) | 0 (0.0%) |
| 25 to 29 Years | 48 (84.2%) | 0 (0.0%) |
| 30 to 34 Years | 38 (88.4%) | 13 (34.2%) |
| 35 to 44 Years | 52 (64.2%) | 0 (0.0%) |
| 45 to 54 Years | 39 (36.8%) | 0 (0.0%) |
| 55 to 59 Years | 31 (50.0%) | 0 (0.0%) |
| 60 to 64 Years | 7 (13.0%) | 0 (0.0%) |
| 65 to 74 Years | 3 (4.3%) | 0 (0.0%) |
| 75 Years and over | 14 (13.5%) | 0 (0.0%) |
| Total | 247 (38.4%) | 13 (5.3%) |
Employment Status by Educational Attainment in Waverly Hall
According to labor force statistics for Waverly Hall, 53.3% of individuals (215) out of the total population between 25 and 64 years of age (403) are in the labor force, with 6.0% or 13 of them being unemployed. The group with the highest labor force participation rate are those with the educational attainment of college / associate degree, with 78.4% or 91 individuals in the labor force. Within the labor force, individuals with high school diploma education have the highest percentage of unemployment, with 18.8% or 13 of them being unemployed.
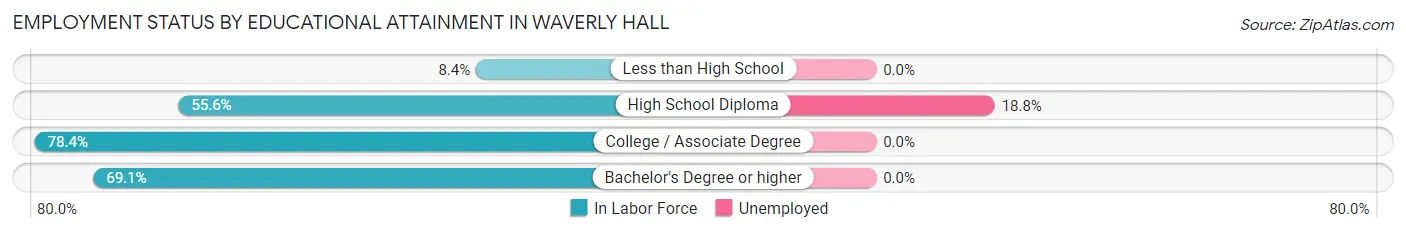
| Educational Attainment | In Labor Force | Unemployed |
| Less than High School | 8 (8.4%) | 0 (0.0%) |
| High School Diploma | 69 (55.6%) | 23 (18.8%) |
| College / Associate Degree | 91 (78.4%) | 0 (0.0%) |
| Bachelor's Degree or higher | 47 (69.1%) | 0 (0.0%) |
| Total | 215 (53.3%) | 24 (6.0%) |
Employment Occupations by Sex in Waverly Hall
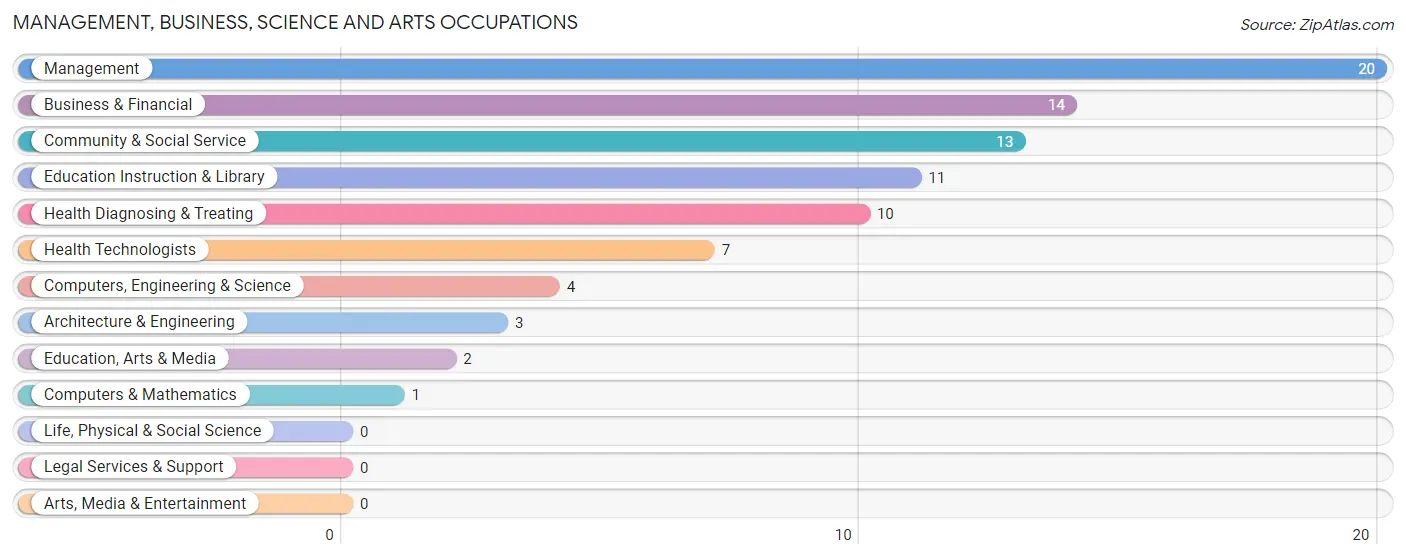
Management, Business, Science and Arts Occupations
The most common Management, Business, Science and Arts occupations in Waverly Hall are Management (20 | 8.6%), Business & Financial (14 | 6.0%), Community & Social Service (13 | 5.6%), Education Instruction & Library (11 | 4.7%), and Health Diagnosing & Treating (10 | 4.3%).
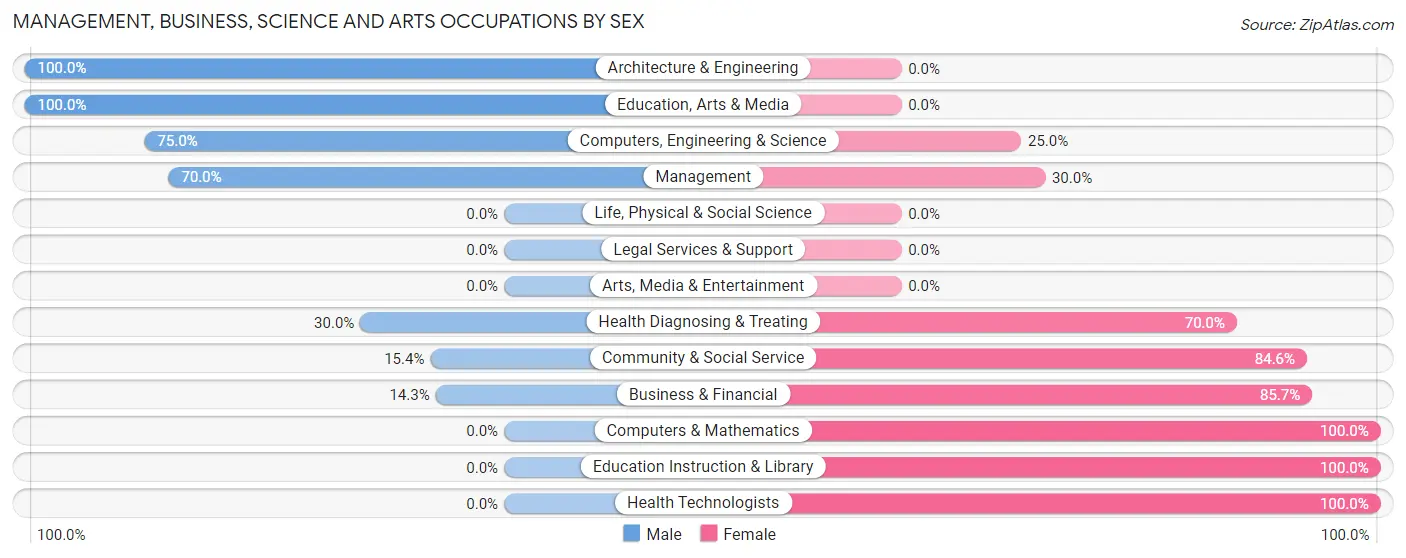
Management, Business, Science and Arts Occupations by Sex
Within the Management, Business, Science and Arts occupations in Waverly Hall, the most male-oriented occupations are Architecture & Engineering (100.0%), Education, Arts & Media (100.0%), and Computers, Engineering & Science (75.0%), while the most female-oriented occupations are Computers & Mathematics (100.0%), Education Instruction & Library (100.0%), and Health Technologists (100.0%).
| Occupation | Male | Female |
| Management | 14 (70.0%) | 6 (30.0%) |
| Business & Financial | 2 (14.3%) | 12 (85.7%) |
| Computers, Engineering & Science | 3 (75.0%) | 1 (25.0%) |
| Computers & Mathematics | 0 (0.0%) | 1 (100.0%) |
| Architecture & Engineering | 3 (100.0%) | 0 (0.0%) |
| Life, Physical & Social Science | 0 (0.0%) | 0 (0.0%) |
| Community & Social Service | 2 (15.4%) | 11 (84.6%) |
| Education, Arts & Media | 2 (100.0%) | 0 (0.0%) |
| Legal Services & Support | 0 (0.0%) | 0 (0.0%) |
| Education Instruction & Library | 0 (0.0%) | 11 (100.0%) |
| Arts, Media & Entertainment | 0 (0.0%) | 0 (0.0%) |
| Health Diagnosing & Treating | 3 (30.0%) | 7 (70.0%) |
| Health Technologists | 0 (0.0%) | 7 (100.0%) |
| Total (Category) | 24 (39.3%) | 37 (60.7%) |
| Total (Overall) | 145 (62.0%) | 89 (38.0%) |
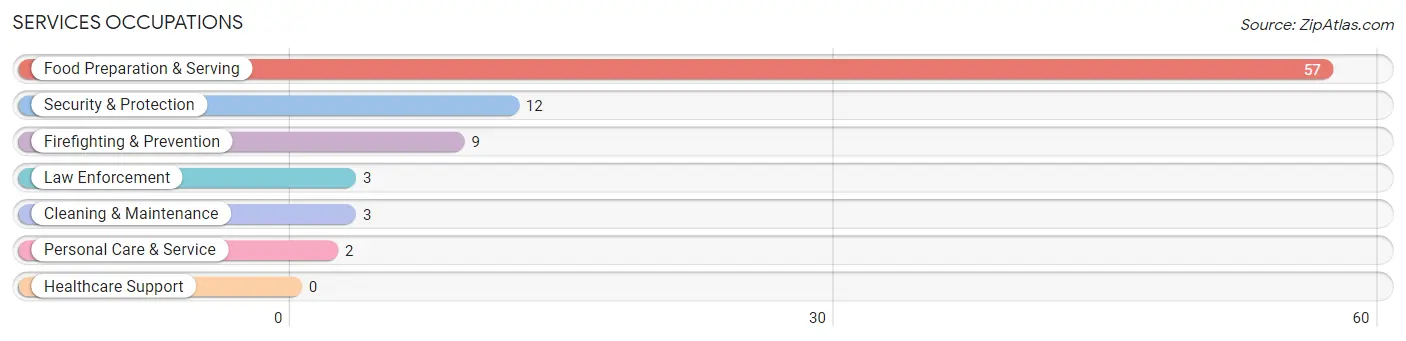
Services Occupations
The most common Services occupations in Waverly Hall are Food Preparation & Serving (57 | 24.4%), Security & Protection (12 | 5.1%), Firefighting & Prevention (9 | 3.8%), Law Enforcement (3 | 1.3%), and Cleaning & Maintenance (3 | 1.3%).
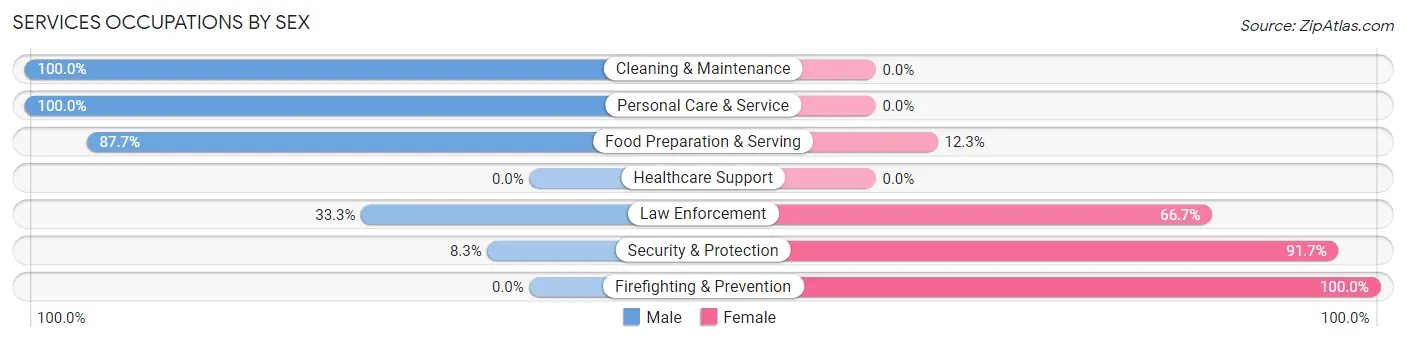
Services Occupations by Sex
Within the Services occupations in Waverly Hall, the most male-oriented occupations are Cleaning & Maintenance (100.0%), Personal Care & Service (100.0%), and Food Preparation & Serving (87.7%), while the most female-oriented occupations are Firefighting & Prevention (100.0%), Security & Protection (91.7%), and Law Enforcement (66.7%).
| Occupation | Male | Female |
| Healthcare Support | 0 (0.0%) | 0 (0.0%) |
| Security & Protection | 1 (8.3%) | 11 (91.7%) |
| Firefighting & Prevention | 0 (0.0%) | 9 (100.0%) |
| Law Enforcement | 1 (33.3%) | 2 (66.7%) |
| Food Preparation & Serving | 50 (87.7%) | 7 (12.3%) |
| Cleaning & Maintenance | 3 (100.0%) | 0 (0.0%) |
| Personal Care & Service | 2 (100.0%) | 0 (0.0%) |
| Total (Category) | 56 (75.7%) | 18 (24.3%) |
| Total (Overall) | 145 (62.0%) | 89 (38.0%) |
Sales and Office Occupations
The most common Sales and Office occupations in Waverly Hall are Sales & Related (18 | 7.7%), and Office & Administration (16 | 6.8%).
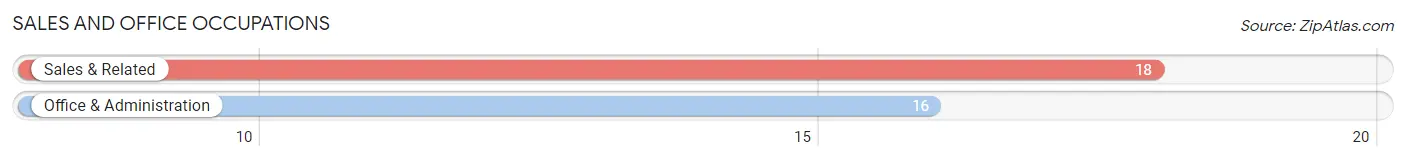
Sales and Office Occupations by Sex
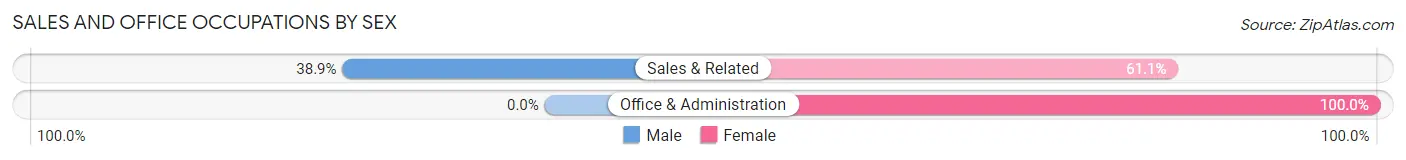
| Occupation | Male | Female |
| Sales & Related | 7 (38.9%) | 11 (61.1%) |
| Office & Administration | 0 (0.0%) | 16 (100.0%) |
| Total (Category) | 7 (20.6%) | 27 (79.4%) |
| Total (Overall) | 145 (62.0%) | 89 (38.0%) |
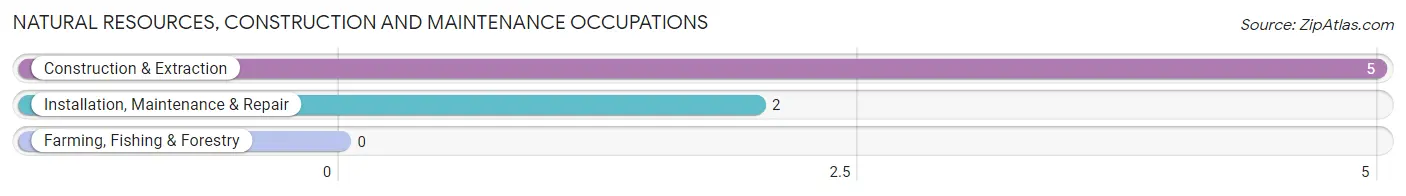
Natural Resources, Construction and Maintenance Occupations
The most common Natural Resources, Construction and Maintenance occupations in Waverly Hall are Construction & Extraction (5 | 2.1%), and Installation, Maintenance & Repair (2 | 0.9%).
Natural Resources, Construction and Maintenance Occupations by Sex
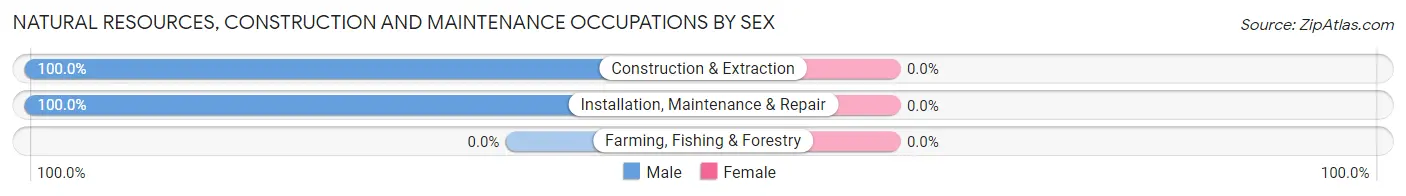
| Occupation | Male | Female |
| Farming, Fishing & Forestry | 0 (0.0%) | 0 (0.0%) |
| Construction & Extraction | 5 (100.0%) | 0 (0.0%) |
| Installation, Maintenance & Repair | 2 (100.0%) | 0 (0.0%) |
| Total (Category) | 7 (100.0%) | 0 (0.0%) |
| Total (Overall) | 145 (62.0%) | 89 (38.0%) |
Production, Transportation and Moving Occupations
The most common Production, Transportation and Moving occupations in Waverly Hall are Material Moving (26 | 11.1%), Transportation (18 | 7.7%), and Production (14 | 6.0%).
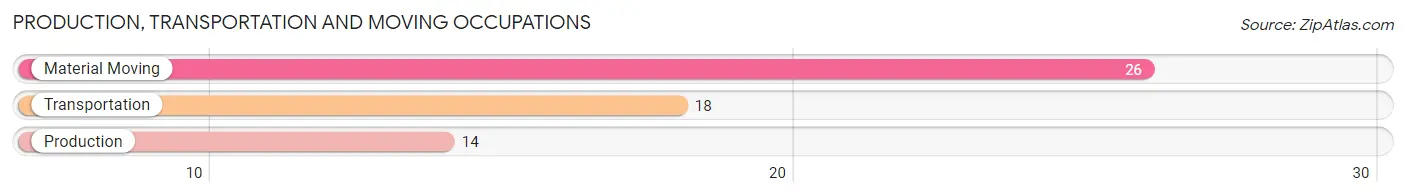
Production, Transportation and Moving Occupations by Sex
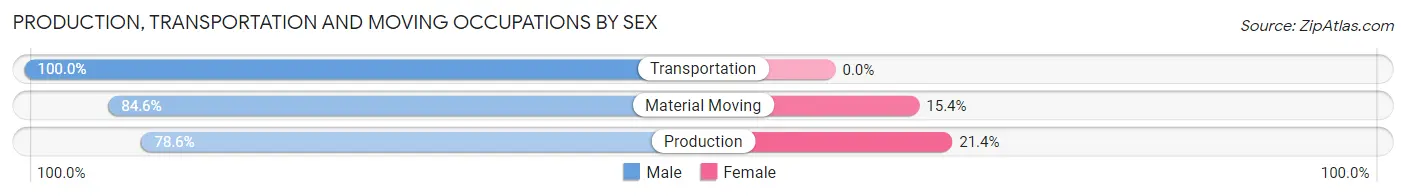
| Occupation | Male | Female |
| Production | 11 (78.6%) | 3 (21.4%) |
| Transportation | 18 (100.0%) | 0 (0.0%) |
| Material Moving | 22 (84.6%) | 4 (15.4%) |
| Total (Category) | 51 (87.9%) | 7 (12.1%) |
| Total (Overall) | 145 (62.0%) | 89 (38.0%) |
Employment Industries by Sex in Waverly Hall
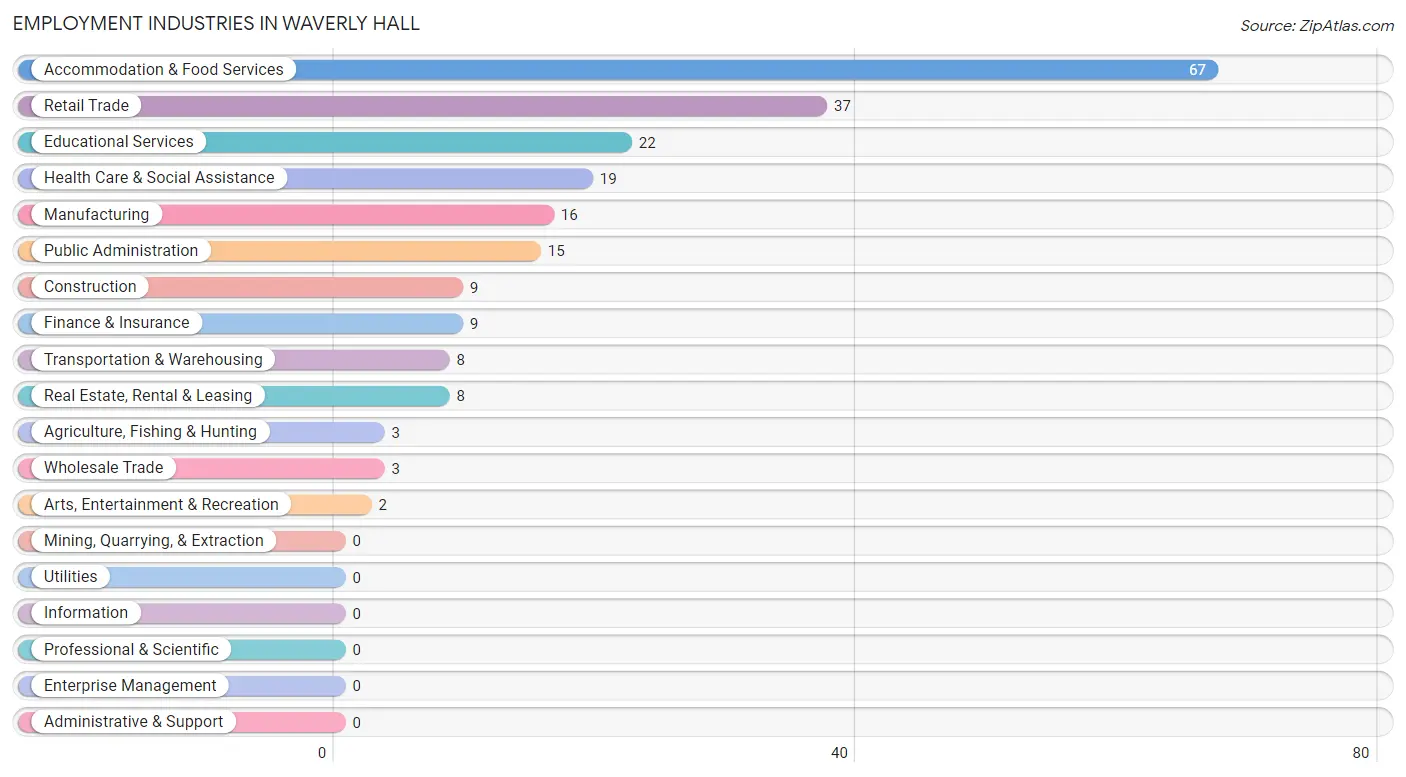
Employment Industries in Waverly Hall
The major employment industries in Waverly Hall include Accommodation & Food Services (67 | 28.6%), Retail Trade (37 | 15.8%), Educational Services (22 | 9.4%), Health Care & Social Assistance (19 | 8.1%), and Manufacturing (16 | 6.8%).
Employment Industries by Sex in Waverly Hall
The Waverly Hall industries that see more men than women are Agriculture, Fishing & Hunting (100.0%), Construction (100.0%), and Manufacturing (100.0%), whereas the industries that tend to have a higher number of women are Wholesale Trade (100.0%), Finance & Insurance (100.0%), and Educational Services (100.0%).
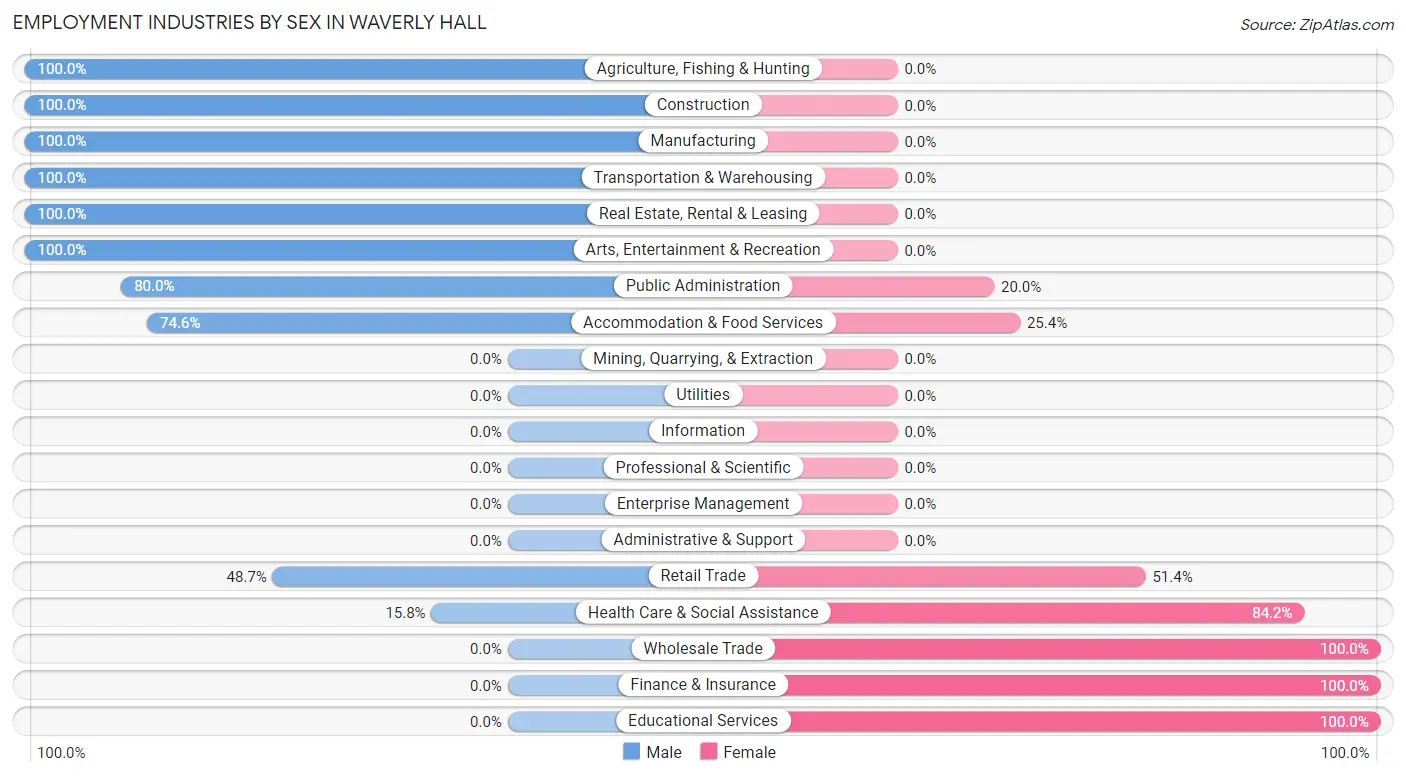
| Industry | Male | Female |
| Agriculture, Fishing & Hunting | 3 (100.0%) | 0 (0.0%) |
| Mining, Quarrying, & Extraction | 0 (0.0%) | 0 (0.0%) |
| Construction | 9 (100.0%) | 0 (0.0%) |
| Manufacturing | 16 (100.0%) | 0 (0.0%) |
| Wholesale Trade | 0 (0.0%) | 3 (100.0%) |
| Retail Trade | 18 (48.6%) | 19 (51.3%) |
| Transportation & Warehousing | 8 (100.0%) | 0 (0.0%) |
| Utilities | 0 (0.0%) | 0 (0.0%) |
| Information | 0 (0.0%) | 0 (0.0%) |
| Finance & Insurance | 0 (0.0%) | 9 (100.0%) |
| Real Estate, Rental & Leasing | 8 (100.0%) | 0 (0.0%) |
| Professional & Scientific | 0 (0.0%) | 0 (0.0%) |
| Enterprise Management | 0 (0.0%) | 0 (0.0%) |
| Administrative & Support | 0 (0.0%) | 0 (0.0%) |
| Educational Services | 0 (0.0%) | 22 (100.0%) |
| Health Care & Social Assistance | 3 (15.8%) | 16 (84.2%) |
| Arts, Entertainment & Recreation | 2 (100.0%) | 0 (0.0%) |
| Accommodation & Food Services | 50 (74.6%) | 17 (25.4%) |
| Public Administration | 12 (80.0%) | 3 (20.0%) |
| Total | 145 (62.0%) | 89 (38.0%) |
Education in Waverly Hall
School Enrollment in Waverly Hall
The most common levels of schooling among the 66 students in Waverly Hall are high school (30 | 45.5%), college / undergraduate (14 | 21.2%), and middle school (11 | 16.7%).
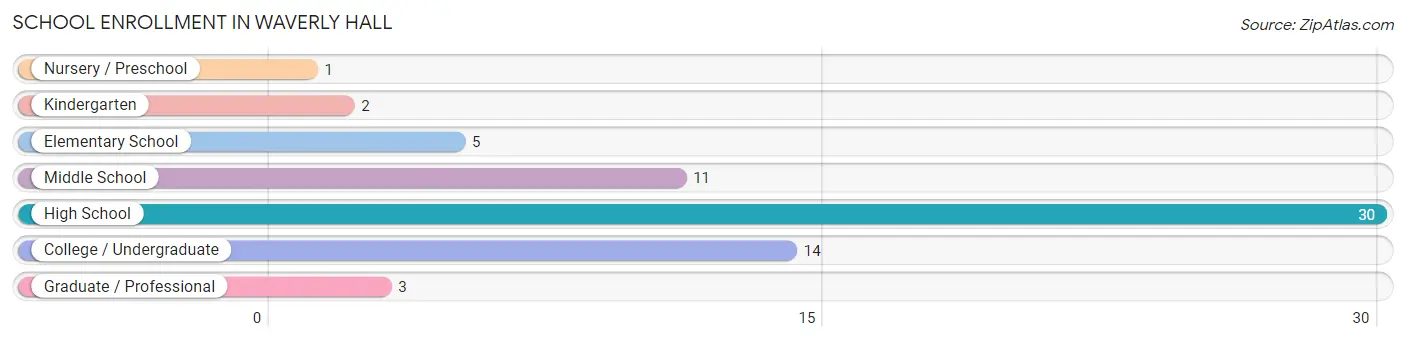
| School Level | # Students | % Students |
| Nursery / Preschool | 1 | 1.5% |
| Kindergarten | 2 | 3.0% |
| Elementary School | 5 | 7.6% |
| Middle School | 11 | 16.7% |
| High School | 30 | 45.5% |
| College / Undergraduate | 14 | 21.2% |
| Graduate / Professional | 3 | 4.5% |
| Total | 66 | 100.0% |
School Enrollment by Age by Funding Source in Waverly Hall
Out of a total of 66 students who are enrolled in schools in Waverly Hall, 4 (6.1%) attend a private institution, while the remaining 62 (93.9%) are enrolled in public schools. The age group of 35 years and over has the highest likelihood of being enrolled in private schools, with 4 (100.0% in the age bracket) enrolled. Conversely, the age group of 5 to 9 year old has the lowest likelihood of being enrolled in a private school, with 8 (100.0% in the age bracket) attending a public institution.
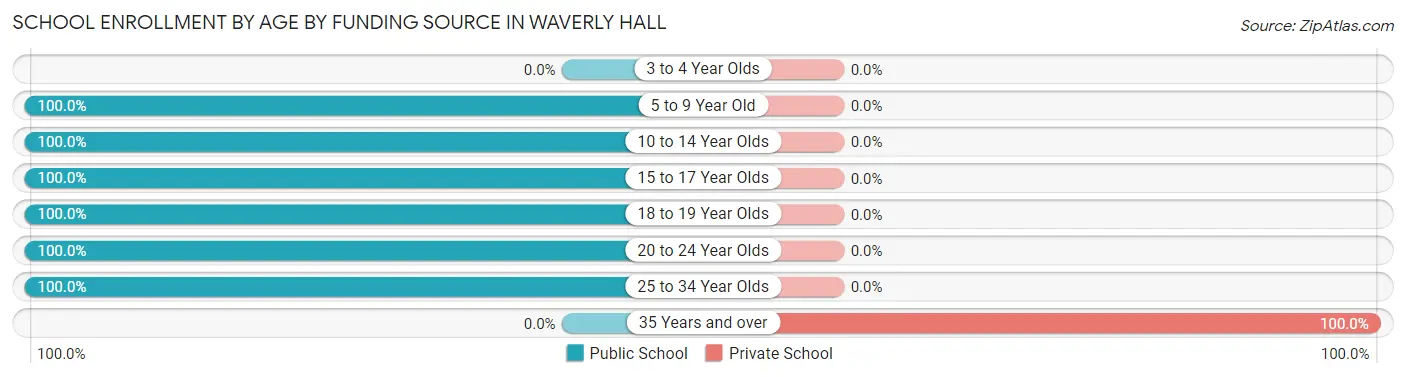
| Age Bracket | Public School | Private School |
| 3 to 4 Year Olds | 0 (0.0%) | 0 (0.0%) |
| 5 to 9 Year Old | 8 (100.0%) | 0 (0.0%) |
| 10 to 14 Year Olds | 29 (100.0%) | 0 (0.0%) |
| 15 to 17 Year Olds | 9 (100.0%) | 0 (0.0%) |
| 18 to 19 Year Olds | 9 (100.0%) | 0 (0.0%) |
| 20 to 24 Year Olds | 4 (100.0%) | 0 (0.0%) |
| 25 to 34 Year Olds | 3 (100.0%) | 0 (0.0%) |
| 35 Years and over | 0 (0.0%) | 4 (100.0%) |
| Total | 62 (93.9%) | 4 (6.1%) |
Educational Attainment by Field of Study in Waverly Hall
Education (21 | 20.0%), business (20 | 19.1%), psychology (14 | 13.3%), science & technology (11 | 10.5%), and communications (10 | 9.5%) are the most common fields of study among 105 individuals in Waverly Hall who have obtained a bachelor's degree or higher.
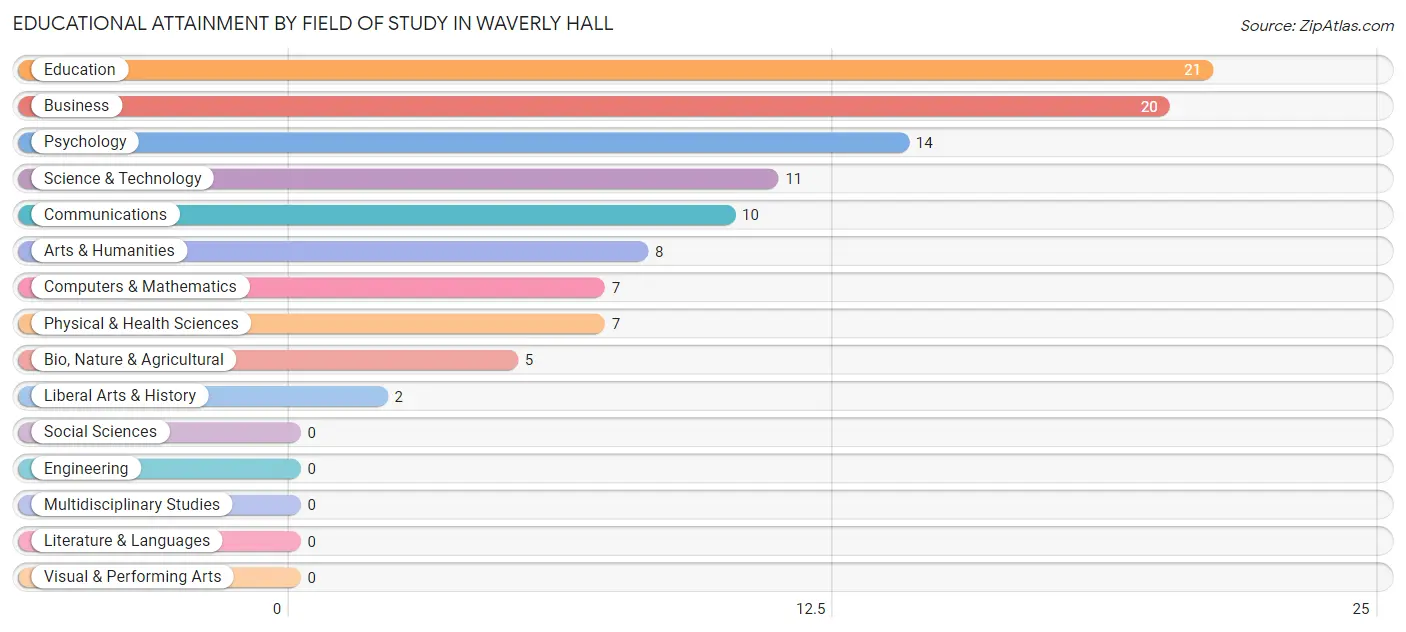
| Field of Study | # Graduates | % Graduates |
| Computers & Mathematics | 7 | 6.7% |
| Bio, Nature & Agricultural | 5 | 4.8% |
| Physical & Health Sciences | 7 | 6.7% |
| Psychology | 14 | 13.3% |
| Social Sciences | 0 | 0.0% |
| Engineering | 0 | 0.0% |
| Multidisciplinary Studies | 0 | 0.0% |
| Science & Technology | 11 | 10.5% |
| Business | 20 | 19.1% |
| Education | 21 | 20.0% |
| Literature & Languages | 0 | 0.0% |
| Liberal Arts & History | 2 | 1.9% |
| Visual & Performing Arts | 0 | 0.0% |
| Communications | 10 | 9.5% |
| Arts & Humanities | 8 | 7.6% |
| Total | 105 | 100.0% |
Transportation & Commute in Waverly Hall
Vehicle Availability by Sex in Waverly Hall
The most prevalent vehicle ownership categories in Waverly Hall are males with 2 vehicles (77, accounting for 53.1%) and females with 2 vehicles (20, making up 86.5%).
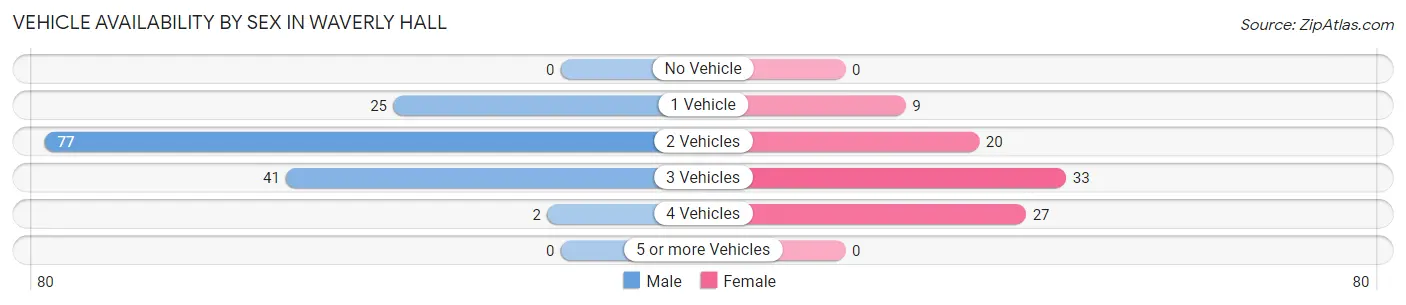
| Vehicles Available | Male | Female |
| No Vehicle | 0 (0.0%) | 0 (0.0%) |
| 1 Vehicle | 25 (17.2%) | 9 (10.1%) |
| 2 Vehicles | 77 (53.1%) | 20 (22.5%) |
| 3 Vehicles | 41 (28.3%) | 33 (37.1%) |
| 4 Vehicles | 2 (1.4%) | 27 (30.3%) |
| 5 or more Vehicles | 0 (0.0%) | 0 (0.0%) |
| Total | 145 (100.0%) | 89 (100.0%) |
Commute Time in Waverly Hall
The most frequently occuring commute durations in Waverly Hall are 30 to 34 minutes (49 commuters, 21.2%), 45 to 59 minutes (40 commuters, 17.3%), and less than 5 minutes (36 commuters, 15.6%).
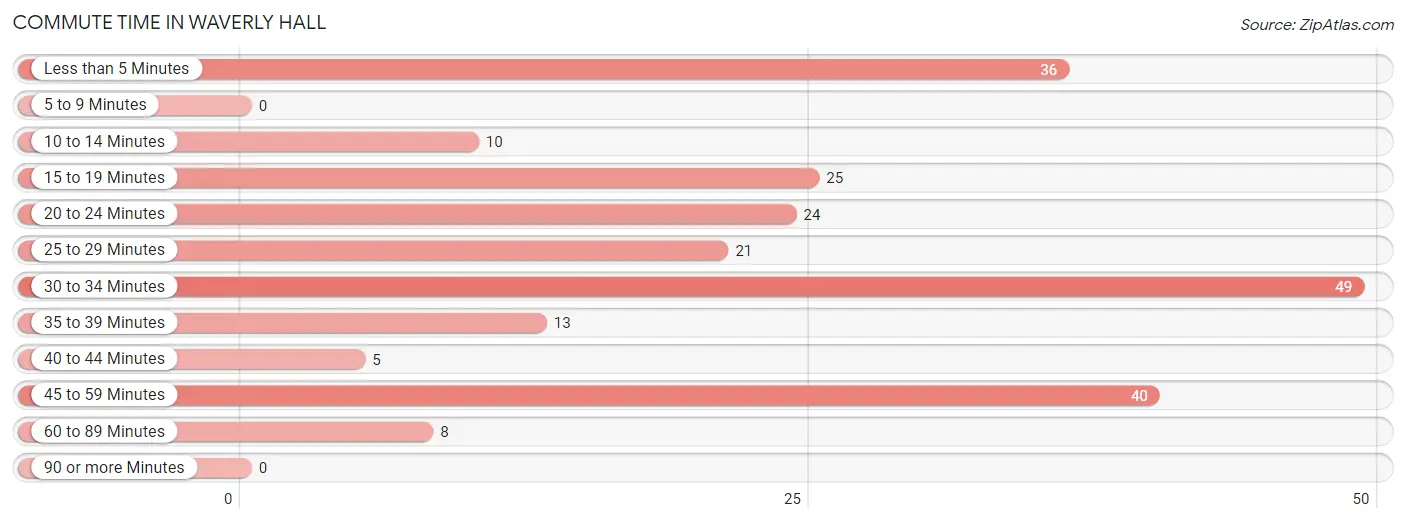
| Commute Time | # Commuters | % Commuters |
| Less than 5 Minutes | 36 | 15.6% |
| 5 to 9 Minutes | 0 | 0.0% |
| 10 to 14 Minutes | 10 | 4.3% |
| 15 to 19 Minutes | 25 | 10.8% |
| 20 to 24 Minutes | 24 | 10.4% |
| 25 to 29 Minutes | 21 | 9.1% |
| 30 to 34 Minutes | 49 | 21.2% |
| 35 to 39 Minutes | 13 | 5.6% |
| 40 to 44 Minutes | 5 | 2.2% |
| 45 to 59 Minutes | 40 | 17.3% |
| 60 to 89 Minutes | 8 | 3.5% |
| 90 or more Minutes | 0 | 0.0% |
Commute Time by Sex in Waverly Hall
The most common commute times in Waverly Hall are 45 to 59 minutes (39 commuters, 26.9%) for males and 25 to 29 minutes (21 commuters, 24.4%) for females.
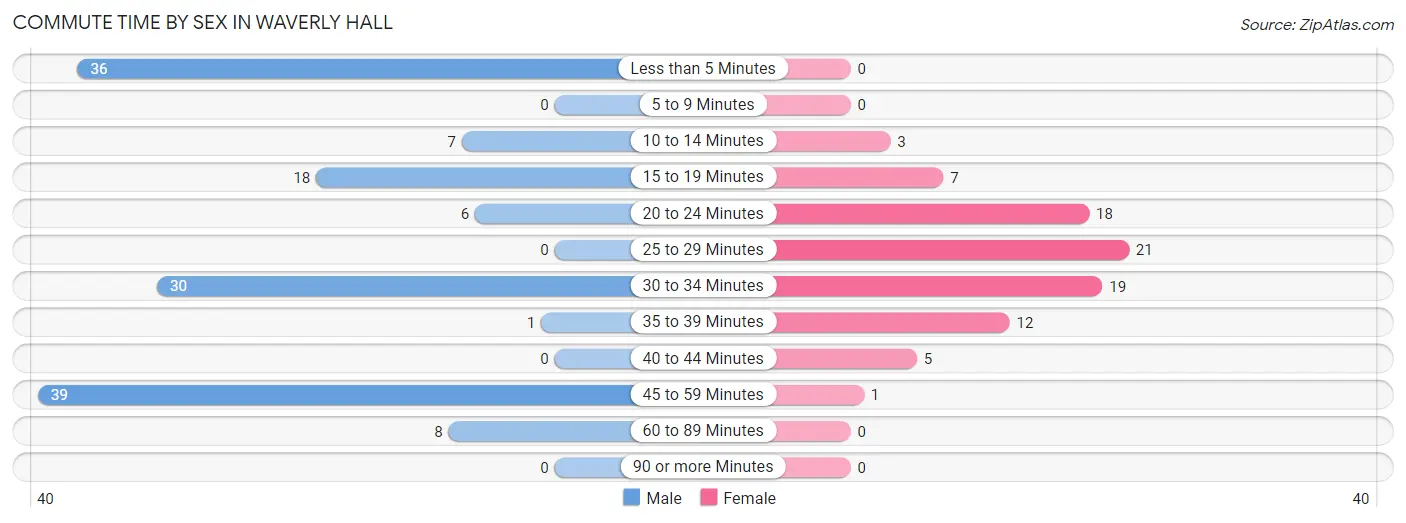
| Commute Time | Male | Female |
| Less than 5 Minutes | 36 (24.8%) | 0 (0.0%) |
| 5 to 9 Minutes | 0 (0.0%) | 0 (0.0%) |
| 10 to 14 Minutes | 7 (4.8%) | 3 (3.5%) |
| 15 to 19 Minutes | 18 (12.4%) | 7 (8.1%) |
| 20 to 24 Minutes | 6 (4.1%) | 18 (20.9%) |
| 25 to 29 Minutes | 0 (0.0%) | 21 (24.4%) |
| 30 to 34 Minutes | 30 (20.7%) | 19 (22.1%) |
| 35 to 39 Minutes | 1 (0.7%) | 12 (14.0%) |
| 40 to 44 Minutes | 0 (0.0%) | 5 (5.8%) |
| 45 to 59 Minutes | 39 (26.9%) | 1 (1.2%) |
| 60 to 89 Minutes | 8 (5.5%) | 0 (0.0%) |
| 90 or more Minutes | 0 (0.0%) | 0 (0.0%) |
Time of Departure to Work by Sex in Waverly Hall
The most frequent times of departure to work in Waverly Hall are 5:00 AM to 5:29 AM (31, 21.4%) for males and 7:30 AM to 7:59 AM (14, 16.3%) for females.
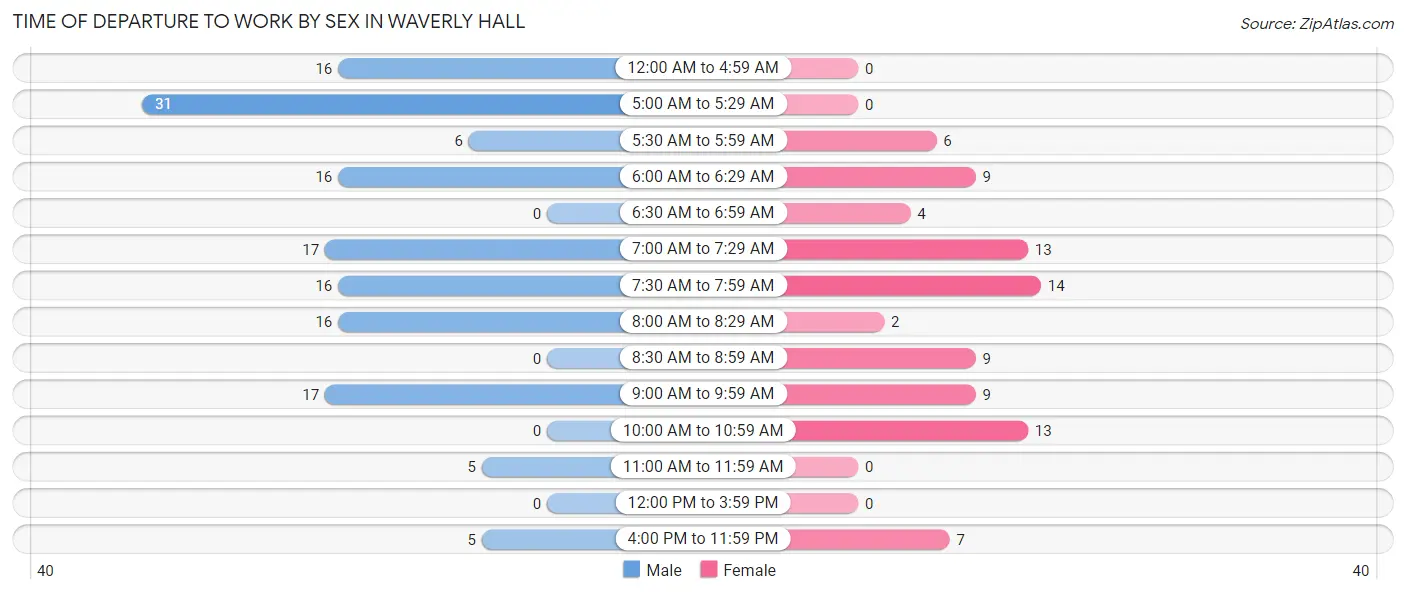
| Time of Departure | Male | Female |
| 12:00 AM to 4:59 AM | 16 (11.0%) | 0 (0.0%) |
| 5:00 AM to 5:29 AM | 31 (21.4%) | 0 (0.0%) |
| 5:30 AM to 5:59 AM | 6 (4.1%) | 6 (7.0%) |
| 6:00 AM to 6:29 AM | 16 (11.0%) | 9 (10.5%) |
| 6:30 AM to 6:59 AM | 0 (0.0%) | 4 (4.6%) |
| 7:00 AM to 7:29 AM | 17 (11.7%) | 13 (15.1%) |
| 7:30 AM to 7:59 AM | 16 (11.0%) | 14 (16.3%) |
| 8:00 AM to 8:29 AM | 16 (11.0%) | 2 (2.3%) |
| 8:30 AM to 8:59 AM | 0 (0.0%) | 9 (10.5%) |
| 9:00 AM to 9:59 AM | 17 (11.7%) | 9 (10.5%) |
| 10:00 AM to 10:59 AM | 0 (0.0%) | 13 (15.1%) |
| 11:00 AM to 11:59 AM | 5 (3.5%) | 0 (0.0%) |
| 12:00 PM to 3:59 PM | 0 (0.0%) | 0 (0.0%) |
| 4:00 PM to 11:59 PM | 5 (3.5%) | 7 (8.1%) |
| Total | 145 (100.0%) | 86 (100.0%) |
Housing Occupancy in Waverly Hall
Occupancy by Ownership in Waverly Hall
Of the total 223 dwellings in Waverly Hall, owner-occupied units account for 186 (83.4%), while renter-occupied units make up 37 (16.6%).
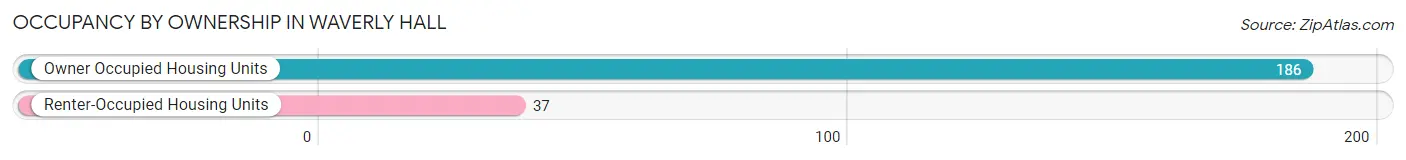
| Occupancy | # Housing Units | % Housing Units |
| Owner Occupied Housing Units | 186 | 83.4% |
| Renter-Occupied Housing Units | 37 | 16.6% |
| Total Occupied Housing Units | 223 | 100.0% |
Occupancy by Household Size in Waverly Hall
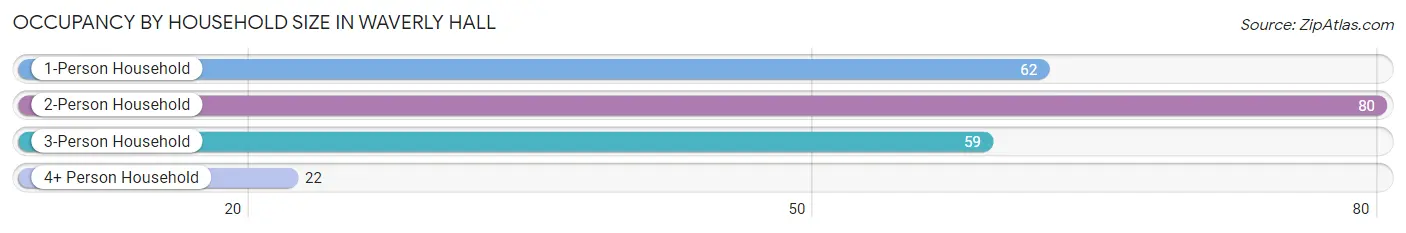
| Household Size | # Housing Units | % Housing Units |
| 1-Person Household | 62 | 27.8% |
| 2-Person Household | 80 | 35.9% |
| 3-Person Household | 59 | 26.5% |
| 4+ Person Household | 22 | 9.9% |
| Total Housing Units | 223 | 100.0% |
Occupancy by Ownership by Household Size in Waverly Hall
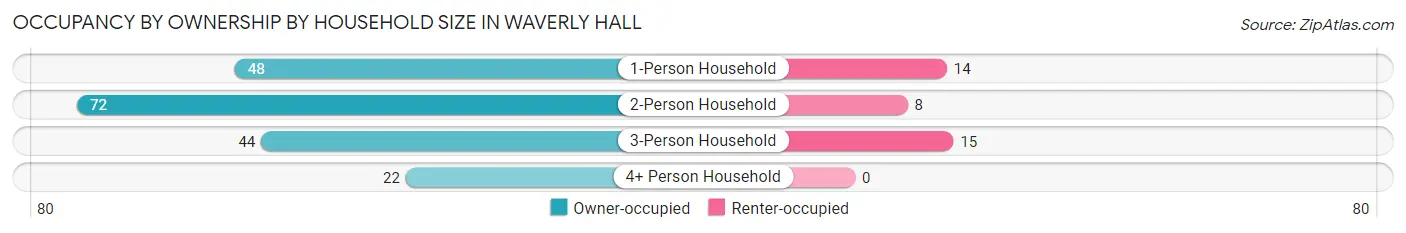
| Household Size | Owner-occupied | Renter-occupied |
| 1-Person Household | 48 (77.4%) | 14 (22.6%) |
| 2-Person Household | 72 (90.0%) | 8 (10.0%) |
| 3-Person Household | 44 (74.6%) | 15 (25.4%) |
| 4+ Person Household | 22 (100.0%) | 0 (0.0%) |
| Total Housing Units | 186 (83.4%) | 37 (16.6%) |
Occupancy by Educational Attainment in Waverly Hall
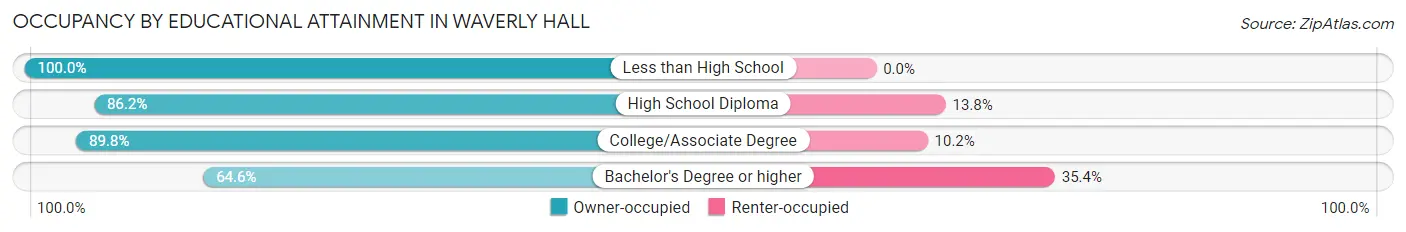
| Household Size | Owner-occupied | Renter-occupied |
| Less than High School | 17 (100.0%) | 0 (0.0%) |
| High School Diploma | 94 (86.2%) | 15 (13.8%) |
| College/Associate Degree | 44 (89.8%) | 5 (10.2%) |
| Bachelor's Degree or higher | 31 (64.6%) | 17 (35.4%) |
Occupancy by Age of Householder in Waverly Hall
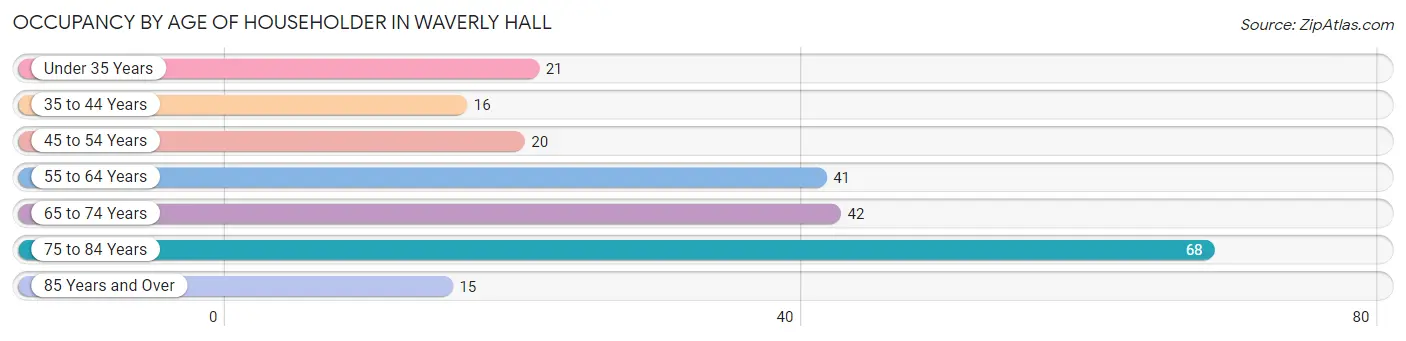
| Age Bracket | # Households | % Households |
| Under 35 Years | 21 | 9.4% |
| 35 to 44 Years | 16 | 7.2% |
| 45 to 54 Years | 20 | 9.0% |
| 55 to 64 Years | 41 | 18.4% |
| 65 to 74 Years | 42 | 18.8% |
| 75 to 84 Years | 68 | 30.5% |
| 85 Years and Over | 15 | 6.7% |
| Total | 223 | 100.0% |
Housing Finances in Waverly Hall
Median Income by Occupancy in Waverly Hall
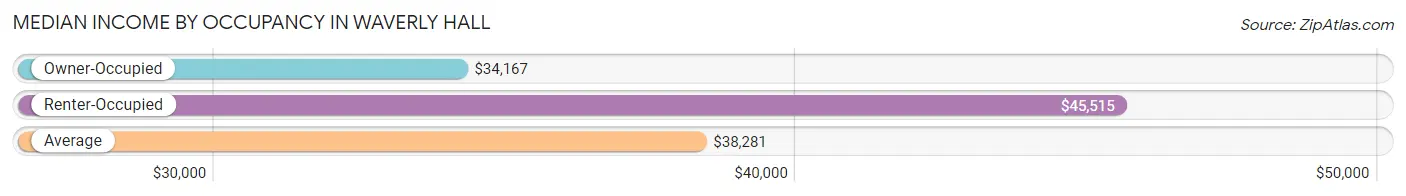
| Occupancy Type | # Households | Median Income |
| Owner-Occupied | 186 (83.4%) | $34,167 |
| Renter-Occupied | 37 (16.6%) | $45,515 |
| Average | 223 (100.0%) | $38,281 |
Occupancy by Householder Income Bracket in Waverly Hall
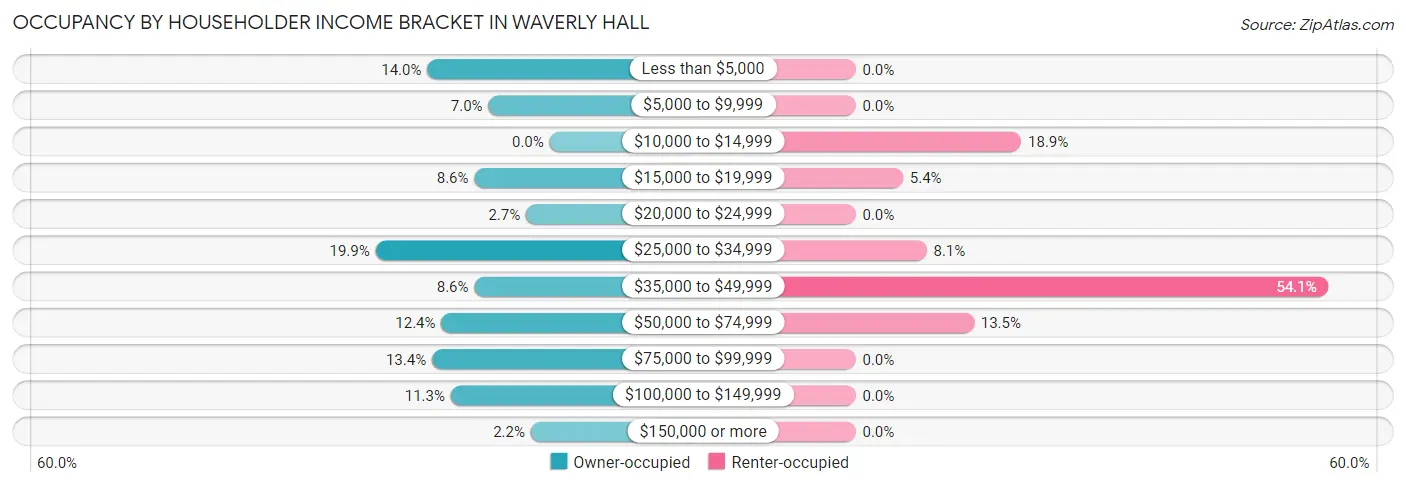
| Income Bracket | Owner-occupied | Renter-occupied |
| Less than $5,000 | 26 (14.0%) | 0 (0.0%) |
| $5,000 to $9,999 | 13 (7.0%) | 0 (0.0%) |
| $10,000 to $14,999 | 0 (0.0%) | 7 (18.9%) |
| $15,000 to $19,999 | 16 (8.6%) | 2 (5.4%) |
| $20,000 to $24,999 | 5 (2.7%) | 0 (0.0%) |
| $25,000 to $34,999 | 37 (19.9%) | 3 (8.1%) |
| $35,000 to $49,999 | 16 (8.6%) | 20 (54.0%) |
| $50,000 to $74,999 | 23 (12.4%) | 5 (13.5%) |
| $75,000 to $99,999 | 25 (13.4%) | 0 (0.0%) |
| $100,000 to $149,999 | 21 (11.3%) | 0 (0.0%) |
| $150,000 or more | 4 (2.1%) | 0 (0.0%) |
| Total | 186 (100.0%) | 37 (100.0%) |
Monthly Housing Cost Tiers in Waverly Hall
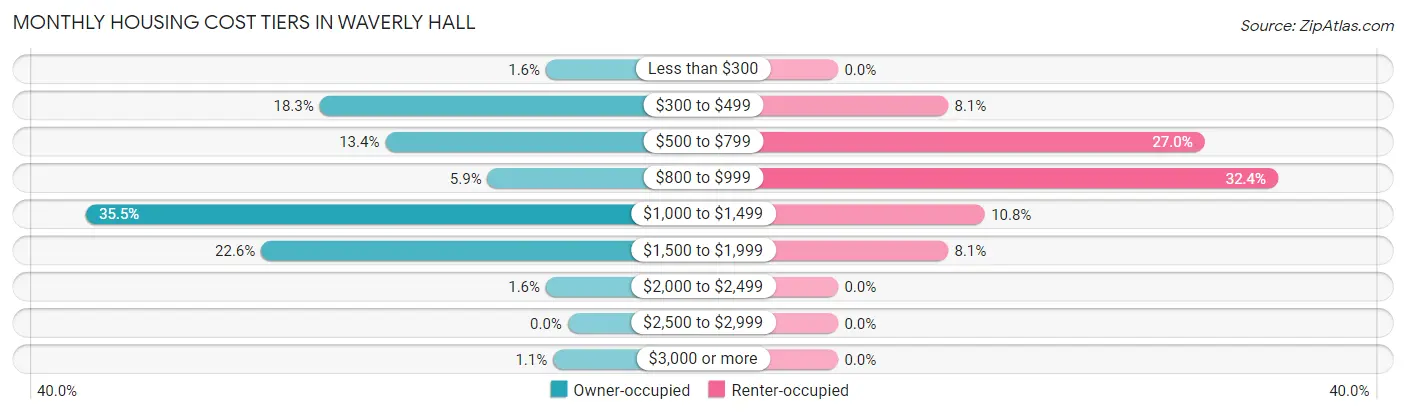
| Monthly Cost | Owner-occupied | Renter-occupied |
| Less than $300 | 3 (1.6%) | 0 (0.0%) |
| $300 to $499 | 34 (18.3%) | 3 (8.1%) |
| $500 to $799 | 25 (13.4%) | 10 (27.0%) |
| $800 to $999 | 11 (5.9%) | 12 (32.4%) |
| $1,000 to $1,499 | 66 (35.5%) | 4 (10.8%) |
| $1,500 to $1,999 | 42 (22.6%) | 3 (8.1%) |
| $2,000 to $2,499 | 3 (1.6%) | 0 (0.0%) |
| $2,500 to $2,999 | 0 (0.0%) | 0 (0.0%) |
| $3,000 or more | 2 (1.1%) | 0 (0.0%) |
| Total | 186 (100.0%) | 37 (100.0%) |
Physical Housing Characteristics in Waverly Hall
Housing Structures in Waverly Hall
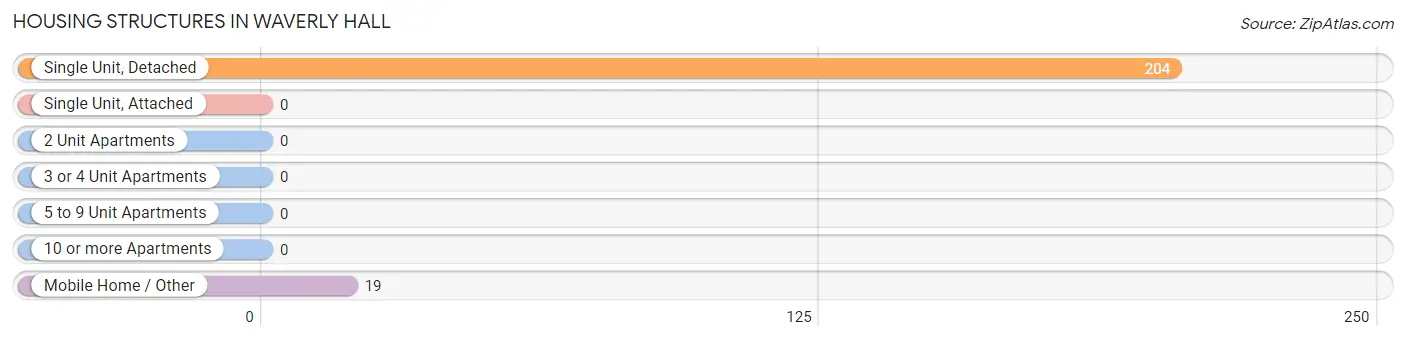
| Structure Type | # Housing Units | % Housing Units |
| Single Unit, Detached | 204 | 91.5% |
| Single Unit, Attached | 0 | 0.0% |
| 2 Unit Apartments | 0 | 0.0% |
| 3 or 4 Unit Apartments | 0 | 0.0% |
| 5 to 9 Unit Apartments | 0 | 0.0% |
| 10 or more Apartments | 0 | 0.0% |
| Mobile Home / Other | 19 | 8.5% |
| Total | 223 | 100.0% |
Housing Structures by Occupancy in Waverly Hall
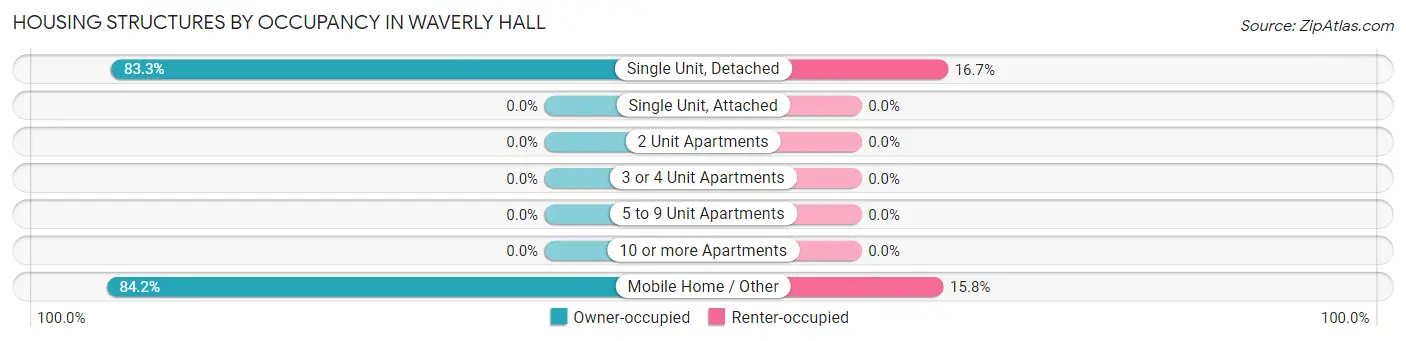
| Structure Type | Owner-occupied | Renter-occupied |
| Single Unit, Detached | 170 (83.3%) | 34 (16.7%) |
| Single Unit, Attached | 0 (0.0%) | 0 (0.0%) |
| 2 Unit Apartments | 0 (0.0%) | 0 (0.0%) |
| 3 or 4 Unit Apartments | 0 (0.0%) | 0 (0.0%) |
| 5 to 9 Unit Apartments | 0 (0.0%) | 0 (0.0%) |
| 10 or more Apartments | 0 (0.0%) | 0 (0.0%) |
| Mobile Home / Other | 16 (84.2%) | 3 (15.8%) |
| Total | 186 (83.4%) | 37 (16.6%) |
Housing Structures by Number of Rooms in Waverly Hall
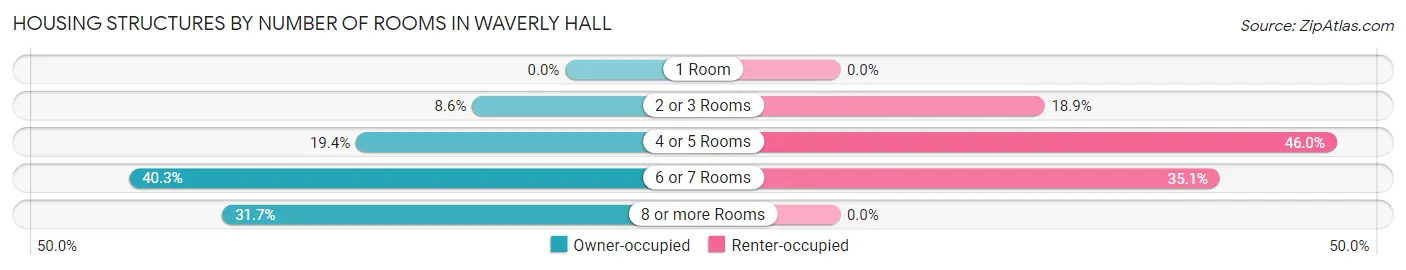
| Number of Rooms | Owner-occupied | Renter-occupied |
| 1 Room | 0 (0.0%) | 0 (0.0%) |
| 2 or 3 Rooms | 16 (8.6%) | 7 (18.9%) |
| 4 or 5 Rooms | 36 (19.4%) | 17 (46.0%) |
| 6 or 7 Rooms | 75 (40.3%) | 13 (35.1%) |
| 8 or more Rooms | 59 (31.7%) | 0 (0.0%) |
| Total | 186 (100.0%) | 37 (100.0%) |
Housing Structure by Heating Type in Waverly Hall
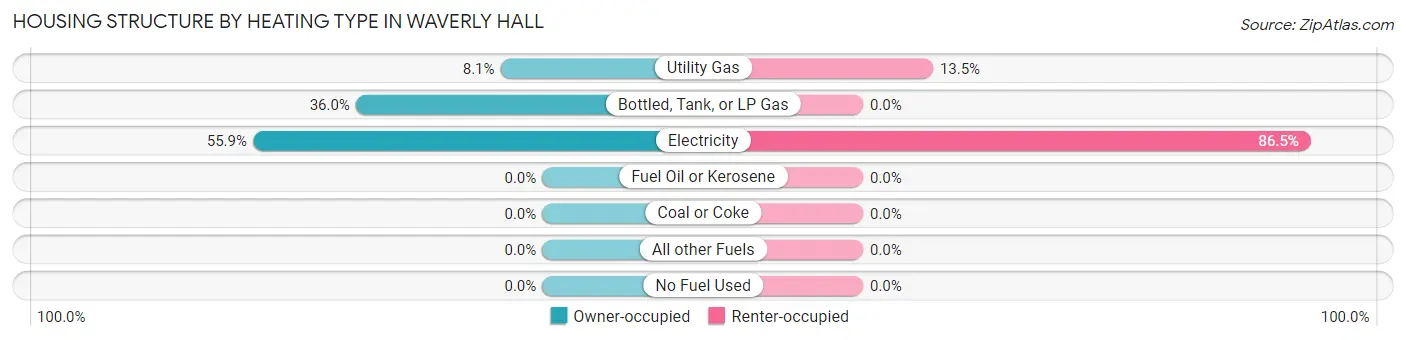
| Heating Type | Owner-occupied | Renter-occupied |
| Utility Gas | 15 (8.1%) | 5 (13.5%) |
| Bottled, Tank, or LP Gas | 67 (36.0%) | 0 (0.0%) |
| Electricity | 104 (55.9%) | 32 (86.5%) |
| Fuel Oil or Kerosene | 0 (0.0%) | 0 (0.0%) |
| Coal or Coke | 0 (0.0%) | 0 (0.0%) |
| All other Fuels | 0 (0.0%) | 0 (0.0%) |
| No Fuel Used | 0 (0.0%) | 0 (0.0%) |
| Total | 186 (100.0%) | 37 (100.0%) |
Household Vehicle Usage in Waverly Hall
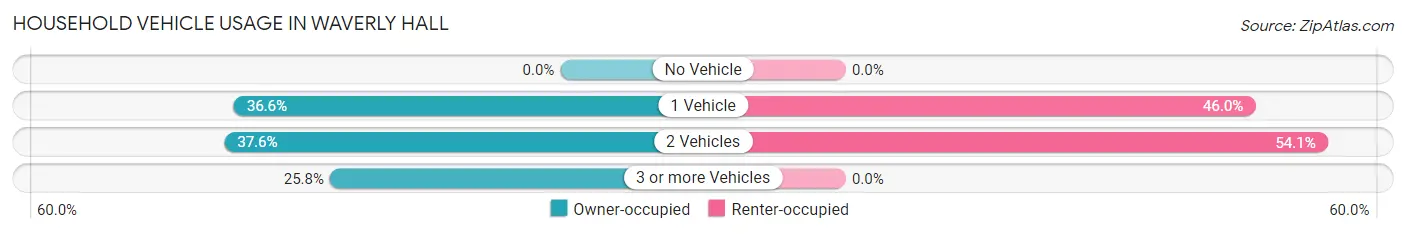
| Vehicles per Household | Owner-occupied | Renter-occupied |
| No Vehicle | 0 (0.0%) | 0 (0.0%) |
| 1 Vehicle | 68 (36.6%) | 17 (46.0%) |
| 2 Vehicles | 70 (37.6%) | 20 (54.0%) |
| 3 or more Vehicles | 48 (25.8%) | 0 (0.0%) |
| Total | 186 (100.0%) | 37 (100.0%) |
Real Estate & Mortgages in Waverly Hall
Real Estate and Mortgage Overview in Waverly Hall
| Characteristic | Without Mortgage | With Mortgage |
| Housing Units | 67 | 119 |
| Median Property Value | $190,600 | $146,900 |
| Median Household Income | $33,438 | $3 |
| Monthly Housing Costs | $553 | $0 |
| Real Estate Taxes | - | - |
Property Value by Mortgage Status in Waverly Hall
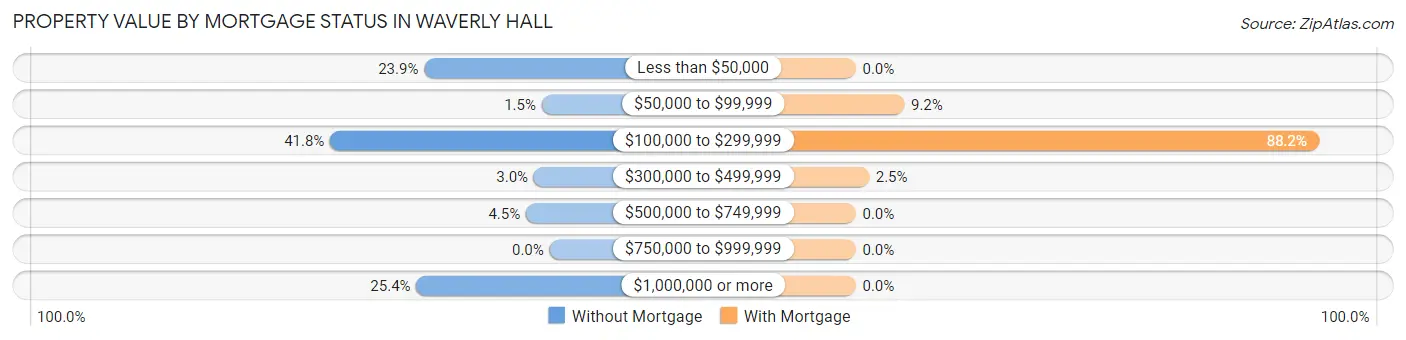
| Property Value | Without Mortgage | With Mortgage |
| Less than $50,000 | 16 (23.9%) | 0 (0.0%) |
| $50,000 to $99,999 | 1 (1.5%) | 11 (9.2%) |
| $100,000 to $299,999 | 28 (41.8%) | 105 (88.2%) |
| $300,000 to $499,999 | 2 (3.0%) | 3 (2.5%) |
| $500,000 to $749,999 | 3 (4.5%) | 0 (0.0%) |
| $750,000 to $999,999 | 0 (0.0%) | 0 (0.0%) |
| $1,000,000 or more | 17 (25.4%) | 0 (0.0%) |
| Total | 67 (100.0%) | 119 (100.0%) |
Household Income by Mortgage Status in Waverly Hall
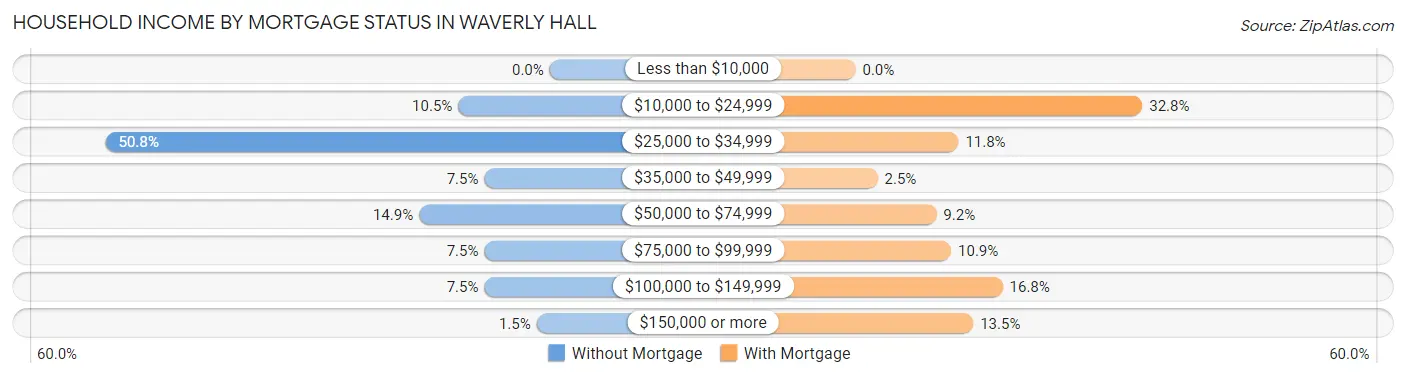
| Household Income | Without Mortgage | With Mortgage |
| Less than $10,000 | 0 (0.0%) | 0 (0.0%) |
| $10,000 to $24,999 | 7 (10.4%) | 39 (32.8%) |
| $25,000 to $34,999 | 34 (50.7%) | 14 (11.8%) |
| $35,000 to $49,999 | 5 (7.5%) | 3 (2.5%) |
| $50,000 to $74,999 | 10 (14.9%) | 11 (9.2%) |
| $75,000 to $99,999 | 5 (7.5%) | 13 (10.9%) |
| $100,000 to $149,999 | 5 (7.5%) | 20 (16.8%) |
| $150,000 or more | 1 (1.5%) | 16 (13.5%) |
| Total | 67 (100.0%) | 119 (100.0%) |
Property Value to Household Income Ratio in Waverly Hall
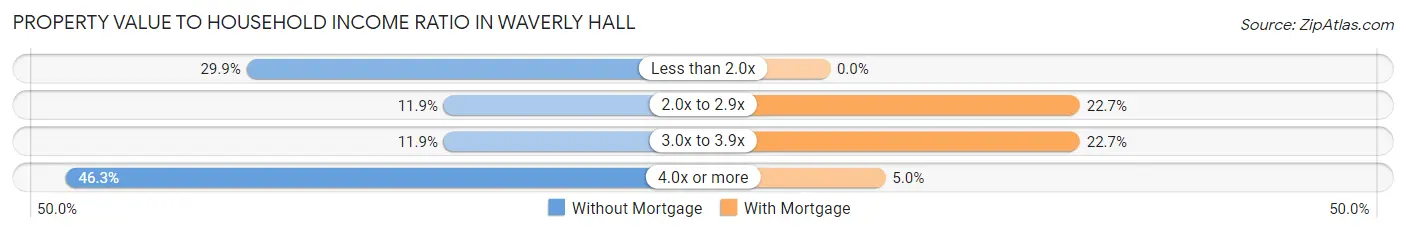
| Value-to-Income Ratio | Without Mortgage | With Mortgage |
| Less than 2.0x | 20 (29.8%) | 0 (0.0%) |
| 2.0x to 2.9x | 8 (11.9%) | 27 (22.7%) |
| 3.0x to 3.9x | 8 (11.9%) | 27 (22.7%) |
| 4.0x or more | 31 (46.3%) | 6 (5.0%) |
| Total | 67 (100.0%) | 119 (100.0%) |
Real Estate Taxes by Mortgage Status in Waverly Hall
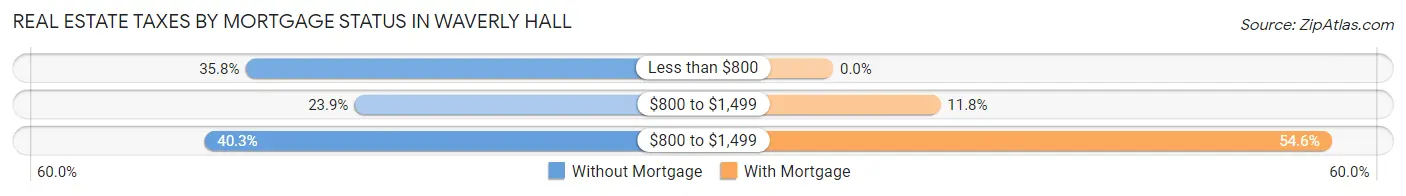
| Property Taxes | Without Mortgage | With Mortgage |
| Less than $800 | 24 (35.8%) | 0 (0.0%) |
| $800 to $1,499 | 16 (23.9%) | 14 (11.8%) |
| $800 to $1,499 | 27 (40.3%) | 65 (54.6%) |
| Total | 67 (100.0%) | 119 (100.0%) |
Health & Disability in Waverly Hall
Health Insurance Coverage by Age in Waverly Hall
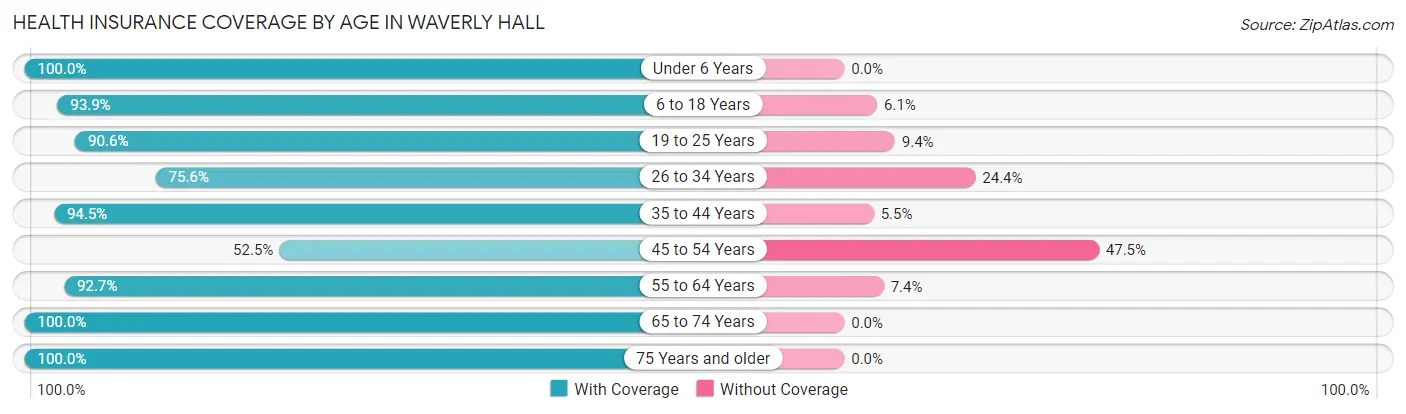
| Age Bracket | With Coverage | Without Coverage |
| Under 6 Years | 22 (100.0%) | 0 (0.0%) |
| 6 to 18 Years | 46 (93.9%) | 3 (6.1%) |
| 19 to 25 Years | 48 (90.6%) | 5 (9.4%) |
| 26 to 34 Years | 68 (75.6%) | 22 (24.4%) |
| 35 to 44 Years | 69 (94.5%) | 4 (5.5%) |
| 45 to 54 Years | 52 (52.5%) | 47 (47.5%) |
| 55 to 64 Years | 63 (92.6%) | 5 (7.3%) |
| 65 to 74 Years | 51 (100.0%) | 0 (0.0%) |
| 75 Years and older | 91 (100.0%) | 0 (0.0%) |
| Total | 510 (85.6%) | 86 (14.4%) |
Health Insurance Coverage by Citizenship Status in Waverly Hall
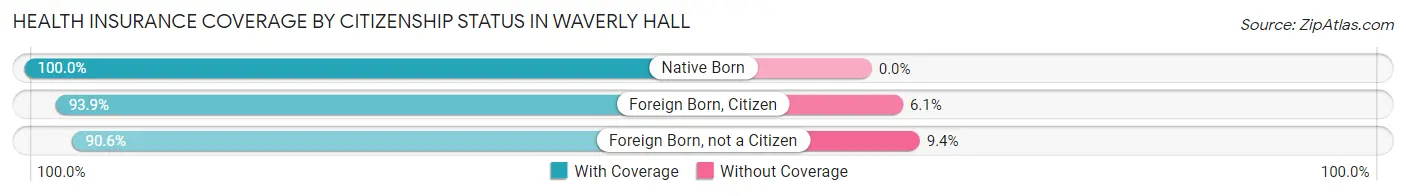
| Citizenship Status | With Coverage | Without Coverage |
| Native Born | 22 (100.0%) | 0 (0.0%) |
| Foreign Born, Citizen | 46 (93.9%) | 3 (6.1%) |
| Foreign Born, not a Citizen | 48 (90.6%) | 5 (9.4%) |
Health Insurance Coverage by Household Income in Waverly Hall
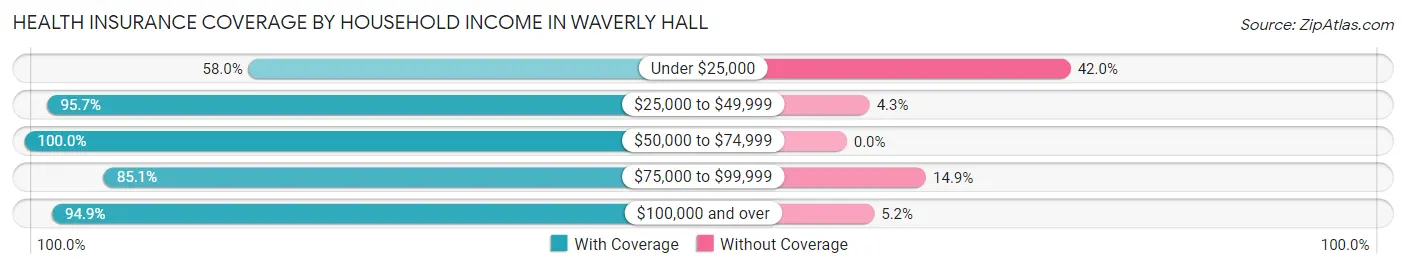
| Household Income | With Coverage | Without Coverage |
| Under $25,000 | 83 (58.0%) | 60 (42.0%) |
| $25,000 to $49,999 | 223 (95.7%) | 10 (4.3%) |
| $50,000 to $74,999 | 49 (100.0%) | 0 (0.0%) |
| $75,000 to $99,999 | 63 (85.1%) | 11 (14.9%) |
| $100,000 and over | 92 (94.9%) | 5 (5.1%) |
Public vs Private Health Insurance Coverage by Age in Waverly Hall
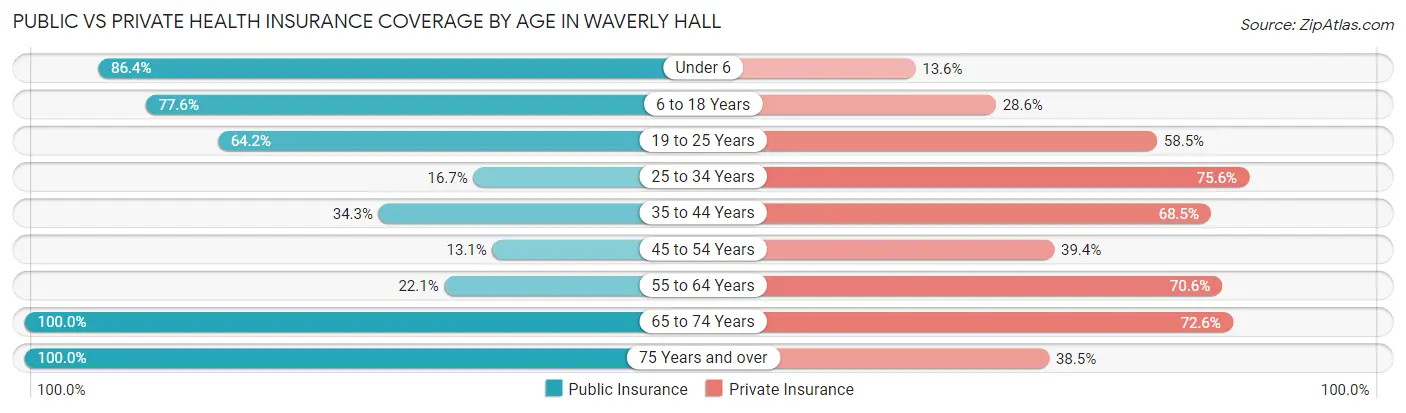
| Age Bracket | Public Insurance | Private Insurance |
| Under 6 | 19 (86.4%) | 3 (13.6%) |
| 6 to 18 Years | 38 (77.5%) | 14 (28.6%) |
| 19 to 25 Years | 34 (64.1%) | 31 (58.5%) |
| 25 to 34 Years | 15 (16.7%) | 68 (75.6%) |
| 35 to 44 Years | 25 (34.3%) | 50 (68.5%) |
| 45 to 54 Years | 13 (13.1%) | 39 (39.4%) |
| 55 to 64 Years | 15 (22.1%) | 48 (70.6%) |
| 65 to 74 Years | 51 (100.0%) | 37 (72.6%) |
| 75 Years and over | 91 (100.0%) | 35 (38.5%) |
| Total | 301 (50.5%) | 325 (54.5%) |
Disability Status by Sex by Age in Waverly Hall
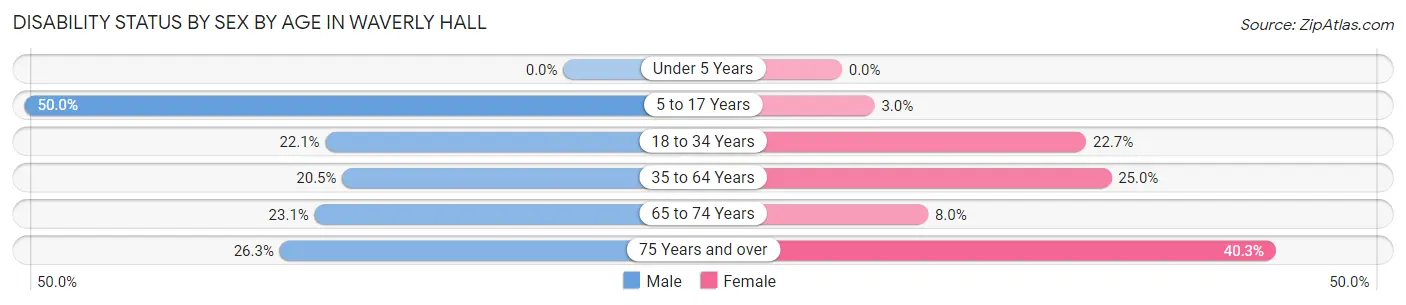
| Age Bracket | Male | Female |
| Under 5 Years | 0 (0.0%) | 0 (0.0%) |
| 5 to 17 Years | 5 (50.0%) | 1 (3.0%) |
| 18 to 34 Years | 17 (22.1%) | 17 (22.7%) |
| 35 to 64 Years | 32 (20.5%) | 21 (25.0%) |
| 65 to 74 Years | 6 (23.1%) | 2 (8.0%) |
| 75 Years and over | 5 (26.3%) | 29 (40.3%) |
Disability Class by Sex by Age in Waverly Hall
Disability Class: Hearing Difficulty
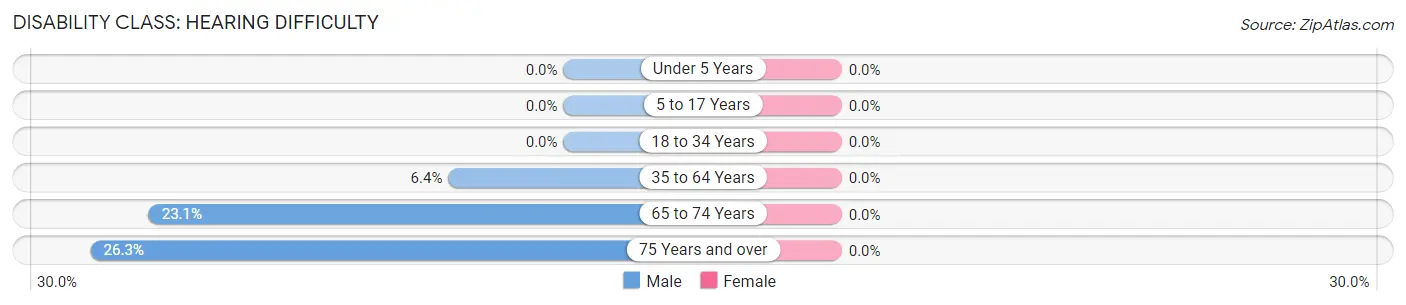
| Age Bracket | Male | Female |
| Under 5 Years | 0 (0.0%) | 0 (0.0%) |
| 5 to 17 Years | 0 (0.0%) | 0 (0.0%) |
| 18 to 34 Years | 0 (0.0%) | 0 (0.0%) |
| 35 to 64 Years | 10 (6.4%) | 0 (0.0%) |
| 65 to 74 Years | 6 (23.1%) | 0 (0.0%) |
| 75 Years and over | 5 (26.3%) | 0 (0.0%) |
Disability Class: Vision Difficulty
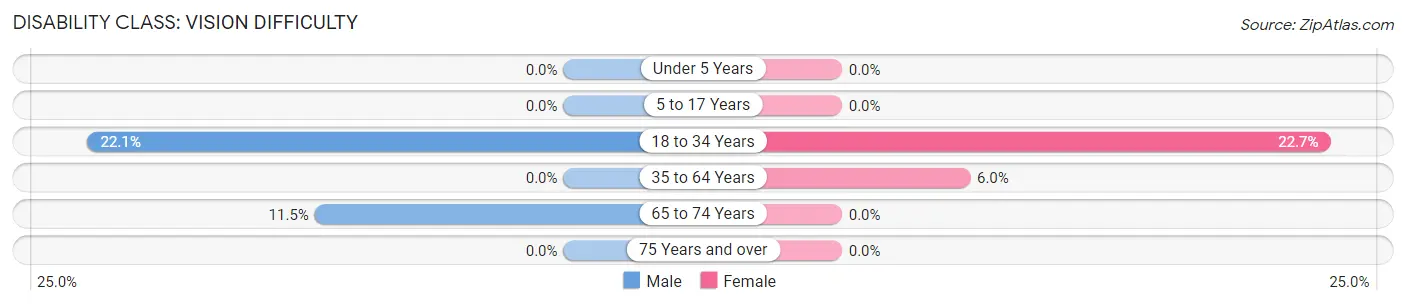
| Age Bracket | Male | Female |
| Under 5 Years | 0 (0.0%) | 0 (0.0%) |
| 5 to 17 Years | 0 (0.0%) | 0 (0.0%) |
| 18 to 34 Years | 17 (22.1%) | 17 (22.7%) |
| 35 to 64 Years | 0 (0.0%) | 5 (5.9%) |
| 65 to 74 Years | 3 (11.5%) | 0 (0.0%) |
| 75 Years and over | 0 (0.0%) | 0 (0.0%) |
Disability Class: Cognitive Difficulty
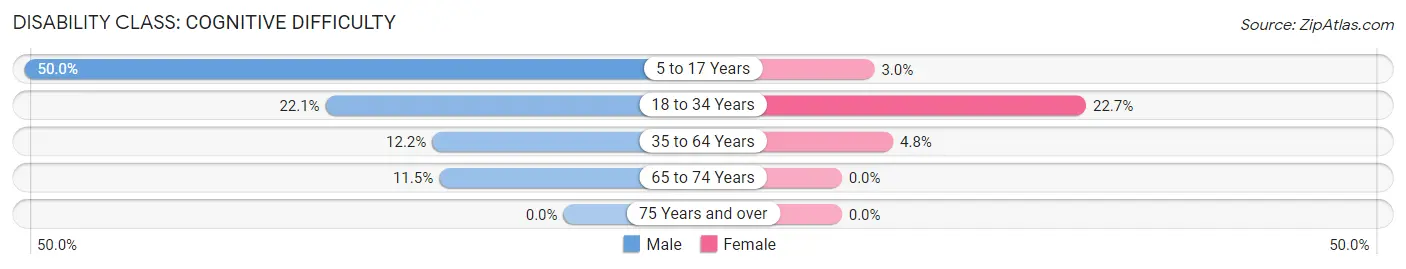
| Age Bracket | Male | Female |
| 5 to 17 Years | 5 (50.0%) | 1 (3.0%) |
| 18 to 34 Years | 17 (22.1%) | 17 (22.7%) |
| 35 to 64 Years | 19 (12.2%) | 4 (4.8%) |
| 65 to 74 Years | 3 (11.5%) | 0 (0.0%) |
| 75 Years and over | 0 (0.0%) | 0 (0.0%) |
Disability Class: Ambulatory Difficulty
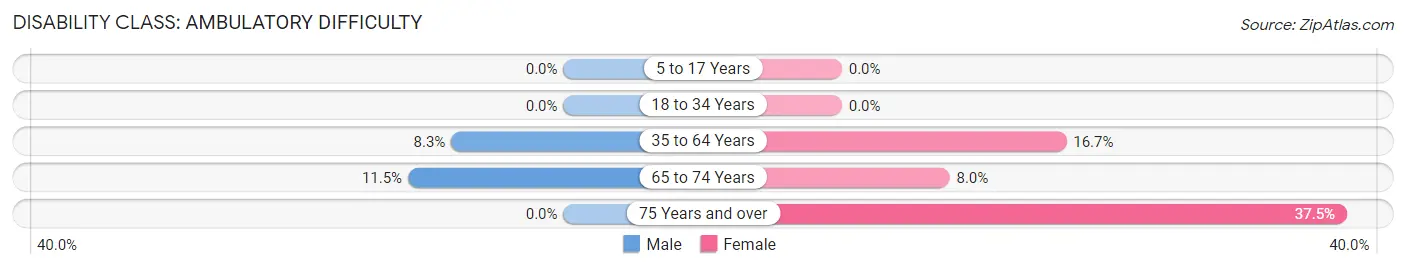
| Age Bracket | Male | Female |
| 5 to 17 Years | 0 (0.0%) | 0 (0.0%) |
| 18 to 34 Years | 0 (0.0%) | 0 (0.0%) |
| 35 to 64 Years | 13 (8.3%) | 14 (16.7%) |
| 65 to 74 Years | 3 (11.5%) | 2 (8.0%) |
| 75 Years and over | 0 (0.0%) | 27 (37.5%) |
Disability Class: Self-Care Difficulty
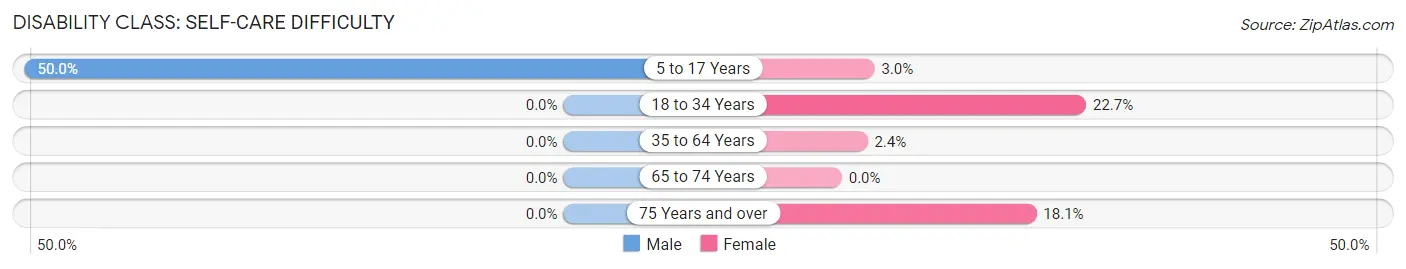
| Age Bracket | Male | Female |
| 5 to 17 Years | 5 (50.0%) | 1 (3.0%) |
| 18 to 34 Years | 0 (0.0%) | 17 (22.7%) |
| 35 to 64 Years | 0 (0.0%) | 2 (2.4%) |
| 65 to 74 Years | 0 (0.0%) | 0 (0.0%) |
| 75 Years and over | 0 (0.0%) | 13 (18.1%) |
Technology Access in Waverly Hall
Computing Device Access in Waverly Hall
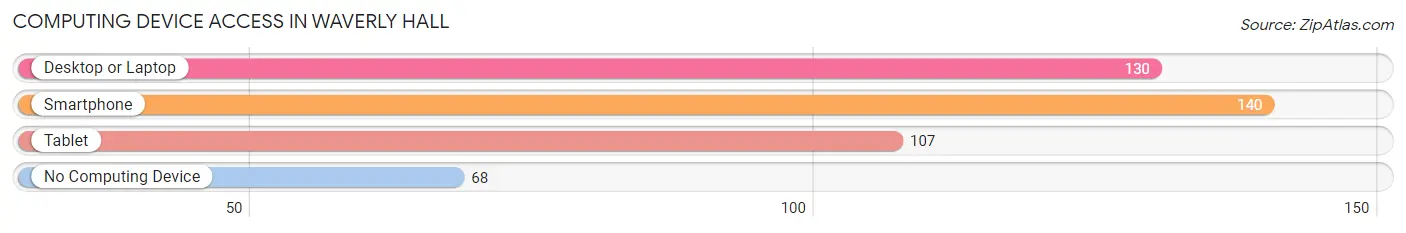
| Device Type | # Households | % Households |
| Desktop or Laptop | 130 | 58.3% |
| Smartphone | 140 | 62.8% |
| Tablet | 107 | 48.0% |
| No Computing Device | 68 | 30.5% |
| Total | 223 | 100.0% |
Internet Access in Waverly Hall
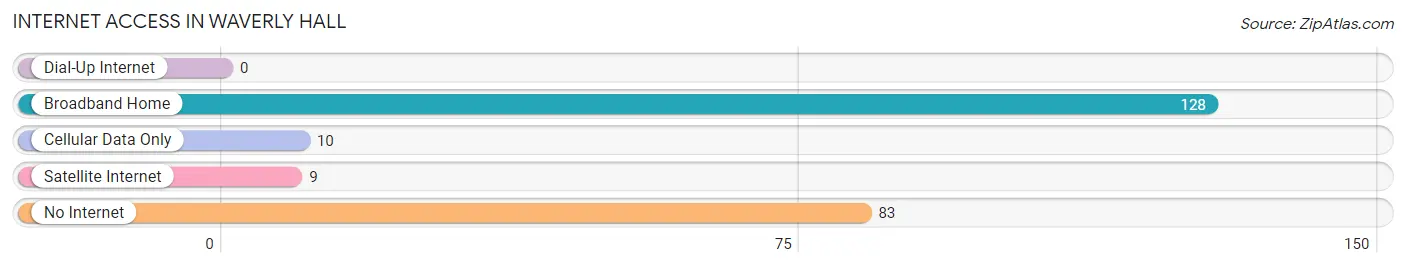
| Internet Type | # Households | % Households |
| Dial-Up Internet | 0 | 0.0% |
| Broadband Home | 128 | 57.4% |
| Cellular Data Only | 10 | 4.5% |
| Satellite Internet | 9 | 4.0% |
| No Internet | 83 | 37.2% |
| Total | 223 | 100.0% |
Waverly Hall Summary
Waverly Hall is a small town located in Harris County, Georgia, United States. It is situated in the foothills of the Appalachian Mountains, approximately 30 miles south of Columbus, Georgia. The town was founded in 1832 and is named after the Waverly Plantation, which was owned by the prominent local family of the same name. As of the 2010 census, the population of Waverly Hall was 1,093.
Geography
Waverly Hall is located at 32°47'25" North, 84°45'45" West (32.790278, -84.7625). The town is situated in the foothills of the Appalachian Mountains, approximately 30 miles south of Columbus, Georgia. The town is located in the Chattahoochee-Oconee National Forest and is surrounded by the towns of Hamilton, Pine Mountain, and Shiloh.
The town has a total area of 1.2 square miles, all of which is land. The terrain is mostly hilly, with some flat areas. The town is located in the Piedmont region of Georgia, which is characterized by rolling hills and red clay soil.
Climate
Waverly Hall has a humid subtropical climate, with hot, humid summers and mild winters. The average annual temperature is 61.3°F, with an average high of 79.2°F in July and an average low of 43.4°F in January. The average annual precipitation is 48.3 inches, with an average of 5.3 inches of snowfall per year.
Demographics
As of the 2010 census, the population of Waverly Hall was 1,093. The racial makeup of the town was 87.3% White, 9.2% African American, 0.7% Native American, 0.3% Asian, 0.1% Pacific Islander, 0.9% from other races, and 1.5% from two or more races. Hispanic or Latino of any race were 2.2% of the population.
The median household income in Waverly Hall was $41,250, and the median family income was $48,750. The per capita income for the town was $19,945. About 11.2% of families and 14.2% of the population were below the poverty line, including 18.2% of those under age 18 and 8.3% of those age 65 or over.
Economy
The economy of Waverly Hall is largely based on agriculture and forestry. The town is home to several farms, which produce a variety of crops, including corn, soybeans, cotton, and peanuts. The town is also home to several timber companies, which harvest and process timber for use in construction and other industries.
The town is also home to several small businesses, including restaurants, convenience stores, and auto repair shops. The town is also home to a few manufacturing companies, which produce a variety of products, including furniture, clothing, and automotive parts.
Education
Waverly Hall is served by the Harris County School District. The town is home to Waverly Hall Elementary School, which serves students in grades K-5. The town is also home to Harris County High School, which serves students in grades 9-12.
The town is also home to several private schools, including Waverly Hall Christian Academy, which serves students in grades K-12. The town is also home to several colleges and universities, including Columbus State University, which is located approximately 30 miles away in Columbus, Georgia.
Conclusion
Waverly Hall is a small town located in Harris County, Georgia, United States. It is situated in the foothills of the Appalachian Mountains, approximately 30 miles south of Columbus, Georgia. The town was founded in 1832 and is named after the Waverly Plantation, which was owned by the prominent local family of the same name. As of the 2010 census, the population of Waverly Hall was 1,093. The town has a humid subtropical climate, with hot, humid summers and mild winters. The economy of Waverly Hall is largely based on agriculture and forestry. The town is served by the Harris County School District and is home to several private schools. Waverly Hall is a small, rural town with a rich history and a strong sense of community.
Common Questions
What is Per Capita Income in Waverly Hall?
Per Capita income in Waverly Hall is $17,880.
What is the Median Family Income in Waverly Hall?
Median Family Income in Waverly Hall is $45,441.
What is the Median Household income in Waverly Hall?
Median Household Income in Waverly Hall is $38,281.
What is Inequality or Gini Index in Waverly Hall?
Inequality or Gini Index in Waverly Hall is 0.44.
What is the Total Population of Waverly Hall?
Total Population of Waverly Hall is 700.
What is the Total Male Population of Waverly Hall?
Total Male Population of Waverly Hall is 320.
What is the Total Female Population of Waverly Hall?
Total Female Population of Waverly Hall is 380.
What is the Ratio of Males per 100 Females in Waverly Hall?
There are 84.21 Males per 100 Females in Waverly Hall.
What is the Ratio of Females per 100 Males in Waverly Hall?
There are 118.75 Females per 100 Males in Waverly Hall.
What is the Median Population Age in Waverly Hall?
Median Population Age in Waverly Hall is 53.5 Years.
What is the Average Family Size in Waverly Hall
Average Family Size in Waverly Hall is 3.4 People.
What is the Average Household Size in Waverly Hall
Average Household Size in Waverly Hall is 2.7 People.
How Large is the Labor Force in Waverly Hall?
There are 247 People in the Labor Forcein in Waverly Hall.
What is the Percentage of People in the Labor Force in Waverly Hall?
38.4% of People are in the Labor Force in Waverly Hall.
What is the Unemployment Rate in Waverly Hall?
Unemployment Rate in Waverly Hall is 5.3%.