Roberta, GA Map & Demographics
Roberta Map
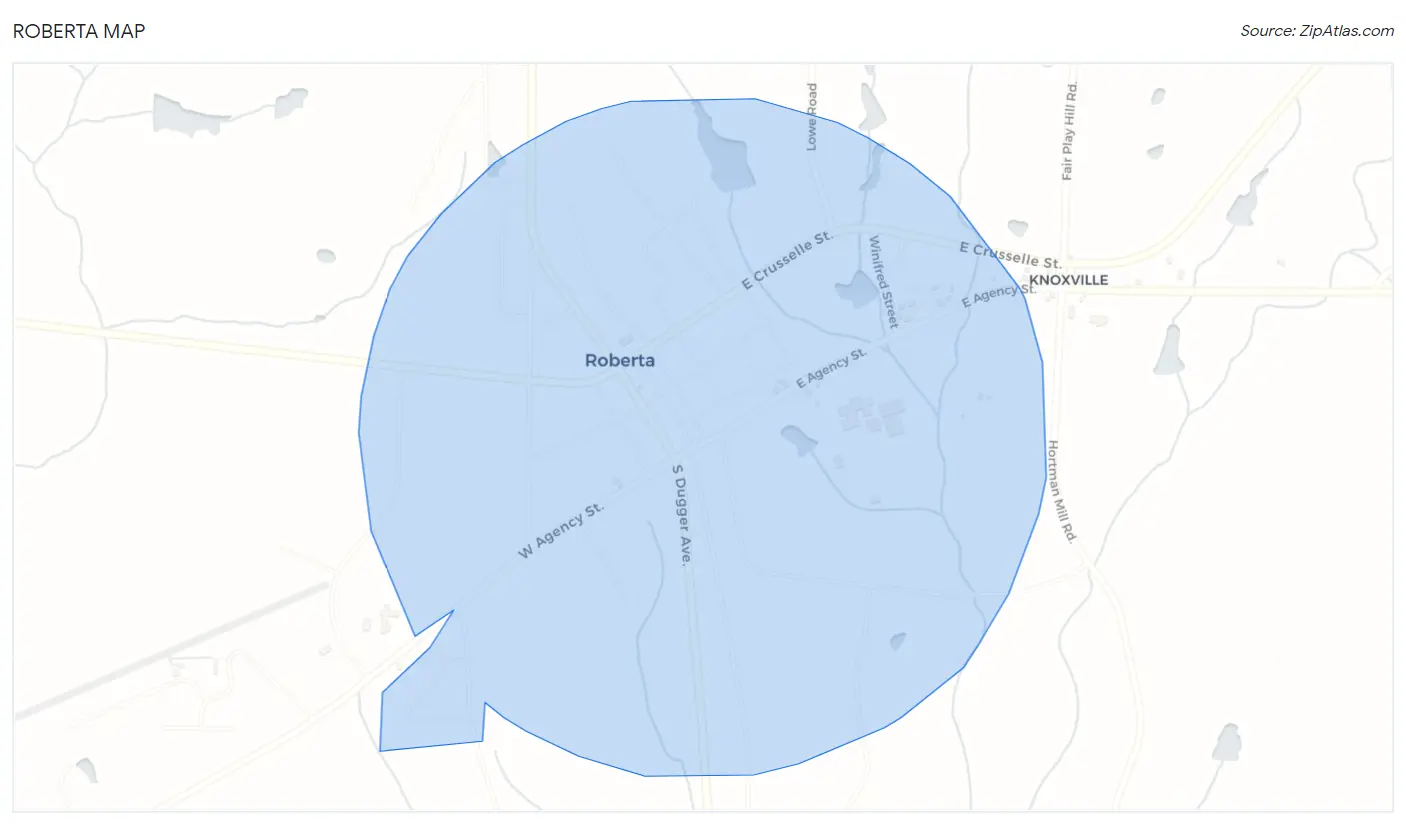
Roberta Overview
$17,392
PER CAPITA INCOME
$48,250
AVG FAMILY INCOME
$41,500
AVG HOUSEHOLD INCOME
65.0%
WAGE / INCOME GAP [ % ]
35.0¢/ $1
WAGE / INCOME GAP [ $ ]
$9,821
FAMILY INCOME DEFICIT
0.47
INEQUALITY / GINI INDEX
1,462
TOTAL POPULATION
567
MALE POPULATION
895
FEMALE POPULATION
63.35
MALES / 100 FEMALES
157.85
FEMALES / 100 MALES
30.3
MEDIAN AGE
4.0
AVG FAMILY SIZE
3.0
AVG HOUSEHOLD SIZE
515
LABOR FORCE [ PEOPLE ]
50.3%
PERCENT IN LABOR FORCE
12.5%
UNEMPLOYMENT RATE
Roberta Zip Codes
Roberta Area Codes
Income in Roberta
Income Overview in Roberta
Per Capita Income in Roberta is $17,392, while median incomes of families and households are $48,250 and $41,500 respectively.
| Characteristic | Number | Measure |
| Per Capita Income | 1,462 | $17,392 |
| Median Family Income | 265 | $48,250 |
| Mean Family Income | 265 | $58,374 |
| Median Household Income | 464 | $41,500 |
| Mean Household Income | 464 | $47,669 |
| Income Deficit | 265 | $9,821 |
| Wage / Income Gap (%) | 1,462 | 65.00% |
| Wage / Income Gap ($) | 1,462 | 35.00¢ per $1 |
| Gini / Inequality Index | 1,462 | 0.47 |
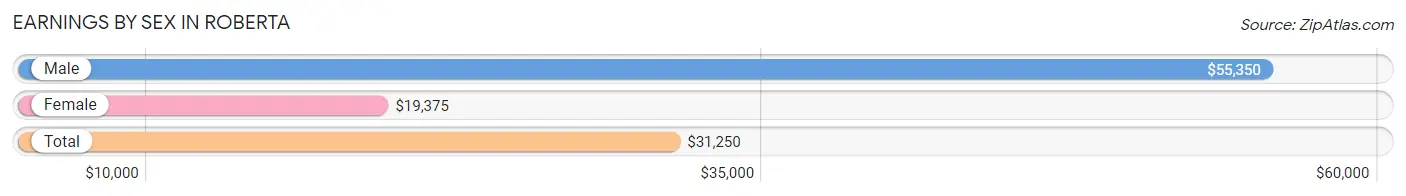
Earnings by Sex in Roberta
Average Earnings in Roberta are $31,250, $55,350 for men and $19,375 for women, a difference of 65.0%.
| Sex | Number | Average Earnings |
| Male | 230 (48.2%) | $55,350 |
| Female | 247 (51.8%) | $19,375 |
| Total | 477 (100.0%) | $31,250 |
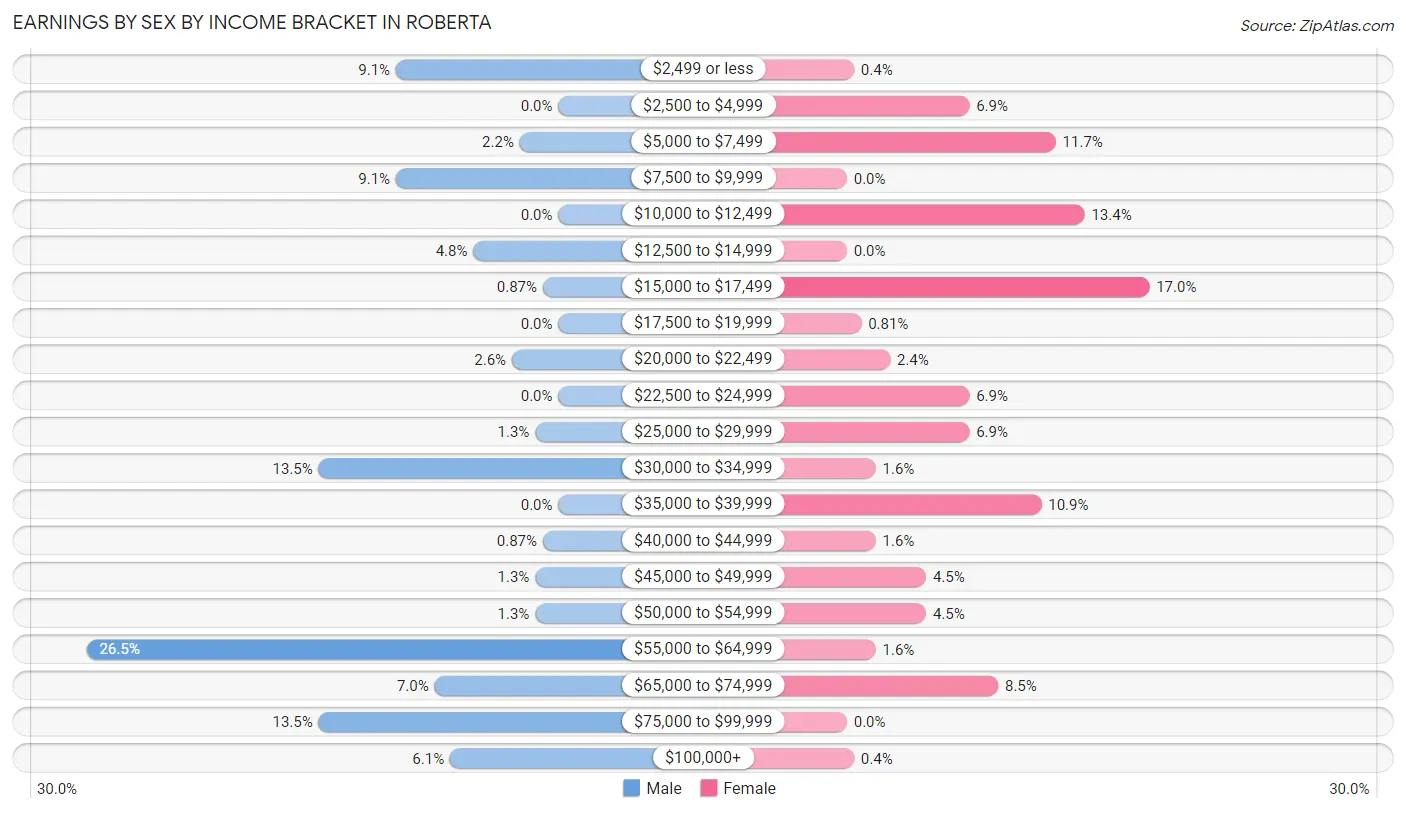
Earnings by Sex by Income Bracket in Roberta
The most common earnings brackets in Roberta are $55,000 to $64,999 for men (61 | 26.5%) and $15,000 to $17,499 for women (42 | 17.0%).
| Income | Male | Female |
| $2,499 or less | 21 (9.1%) | 1 (0.4%) |
| $2,500 to $4,999 | 0 (0.0%) | 17 (6.9%) |
| $5,000 to $7,499 | 5 (2.2%) | 29 (11.7%) |
| $7,500 to $9,999 | 21 (9.1%) | 0 (0.0%) |
| $10,000 to $12,499 | 0 (0.0%) | 33 (13.4%) |
| $12,500 to $14,999 | 11 (4.8%) | 0 (0.0%) |
| $15,000 to $17,499 | 2 (0.9%) | 42 (17.0%) |
| $17,500 to $19,999 | 0 (0.0%) | 2 (0.8%) |
| $20,000 to $22,499 | 6 (2.6%) | 6 (2.4%) |
| $22,500 to $24,999 | 0 (0.0%) | 17 (6.9%) |
| $25,000 to $29,999 | 3 (1.3%) | 17 (6.9%) |
| $30,000 to $34,999 | 31 (13.5%) | 4 (1.6%) |
| $35,000 to $39,999 | 0 (0.0%) | 27 (10.9%) |
| $40,000 to $44,999 | 2 (0.9%) | 4 (1.6%) |
| $45,000 to $49,999 | 3 (1.3%) | 11 (4.4%) |
| $50,000 to $54,999 | 3 (1.3%) | 11 (4.4%) |
| $55,000 to $64,999 | 61 (26.5%) | 4 (1.6%) |
| $65,000 to $74,999 | 16 (7.0%) | 21 (8.5%) |
| $75,000 to $99,999 | 31 (13.5%) | 0 (0.0%) |
| $100,000+ | 14 (6.1%) | 1 (0.4%) |
| Total | 230 (100.0%) | 247 (100.0%) |
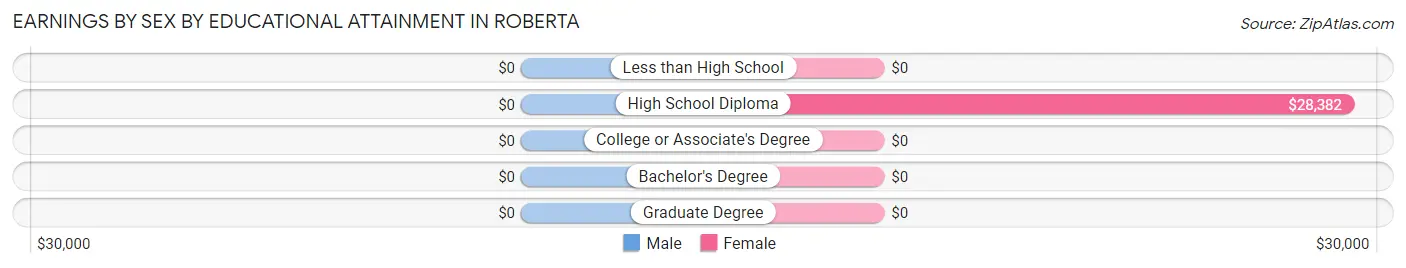
Earnings by Sex by Educational Attainment in Roberta
| Educational Attainment | Male Income | Female Income |
| Less than High School | - | - |
| High School Diploma | - | - |
| College or Associate's Degree | - | - |
| Bachelor's Degree | - | - |
| Graduate Degree | - | - |
| Total | - | - |
Family Income in Roberta
Family Income Brackets in Roberta
According to the Roberta family income data, there are 43 families falling into the $50,000 to $74,999 income range, which is the most common income bracket and makes up 16.2% of all families. Conversely, the $200,000+ income bracket is the least frequent group with only 2 families (0.7%) belonging to this category.
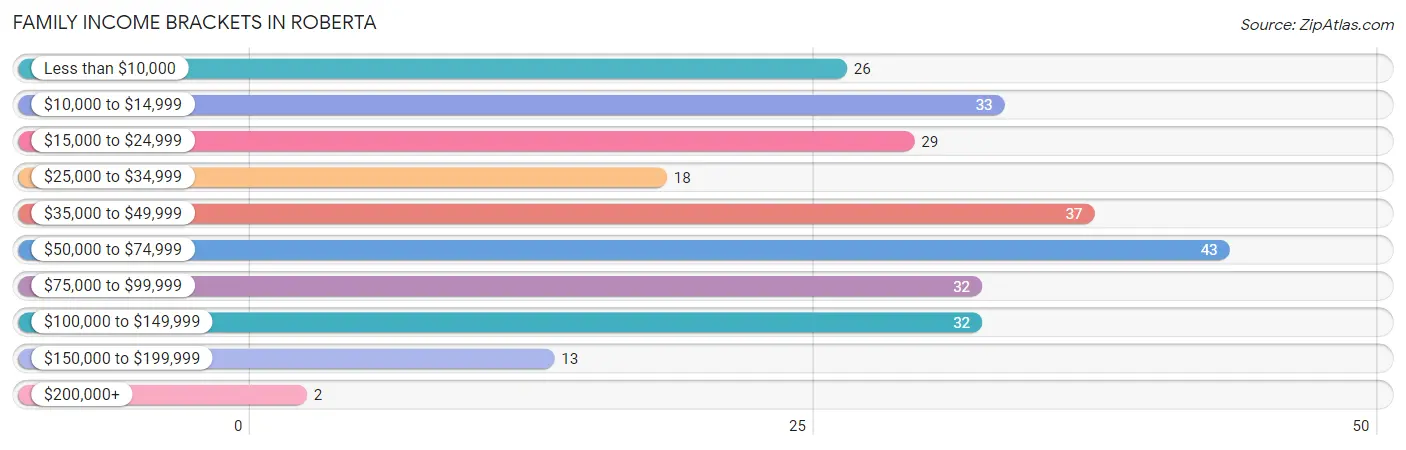
| Income Bracket | # Families | % Families |
| Less than $10,000 | 26 | 9.8% |
| $10,000 to $14,999 | 33 | 12.5% |
| $15,000 to $24,999 | 29 | 10.9% |
| $25,000 to $34,999 | 18 | 6.8% |
| $35,000 to $49,999 | 37 | 14.0% |
| $50,000 to $74,999 | 43 | 16.2% |
| $75,000 to $99,999 | 32 | 12.1% |
| $100,000 to $149,999 | 32 | 12.1% |
| $150,000 to $199,999 | 13 | 4.9% |
| $200,000+ | 2 | 0.8% |
Family Income by Famaliy Size in Roberta
3-person families (55 | 20.7%) account for the highest median family income in Roberta with $48,173 per family, while 2-person families (148 | 55.8%) have the highest median income of $17,353 per family member.
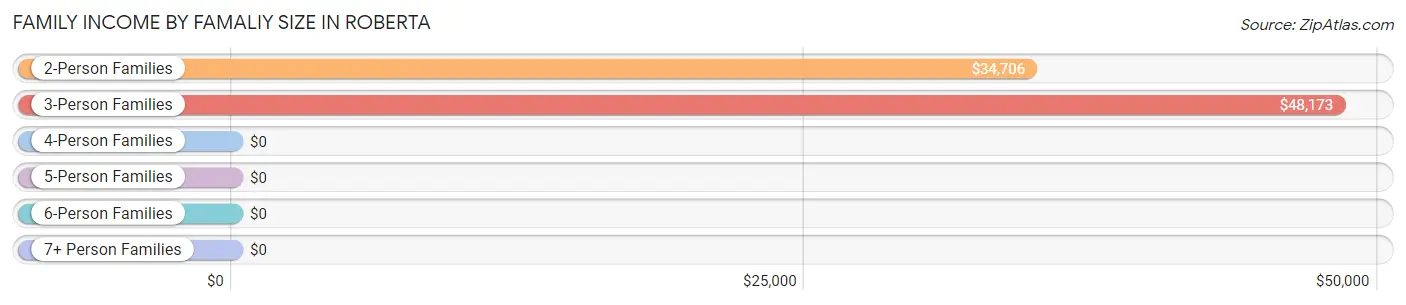
| Income Bracket | # Families | Median Income |
| 2-Person Families | 148 (55.8%) | $34,706 |
| 3-Person Families | 55 (20.7%) | $48,173 |
| 4-Person Families | 23 (8.7%) | $0 |
| 5-Person Families | 27 (10.2%) | $0 |
| 6-Person Families | 6 (2.3%) | $0 |
| 7+ Person Families | 6 (2.3%) | $0 |
| Total | 265 (100.0%) | $48,250 |
Family Income by Number of Earners in Roberta
The median family income in Roberta is $48,250, with families comprising 3+ earners (16) having the highest median family income of $126,000, while families with 1 earner (171) have the lowest median family income of $33,456, accounting for 6.0% and 64.5% of families, respectively.
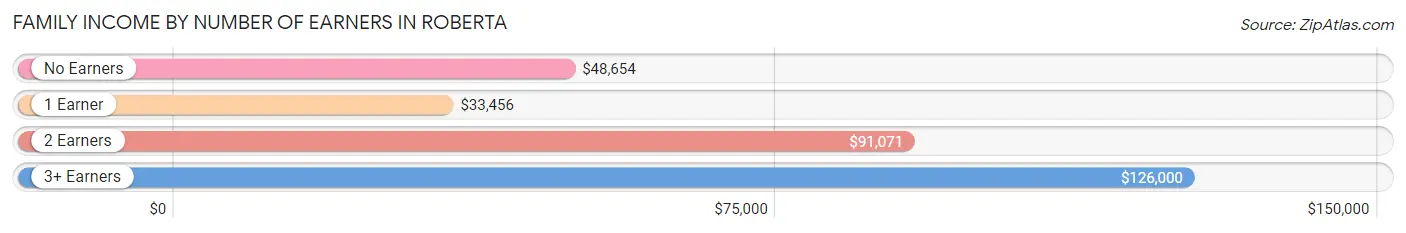
| Number of Earners | # Families | Median Income |
| No Earners | 38 (14.3%) | $48,654 |
| 1 Earner | 171 (64.5%) | $33,456 |
| 2 Earners | 40 (15.1%) | $91,071 |
| 3+ Earners | 16 (6.0%) | $126,000 |
| Total | 265 (100.0%) | $48,250 |
Household Income in Roberta
Household Income Brackets in Roberta
With 104 households falling in the category, the $50,000 to $74,999 income range is the most frequent in Roberta, accounting for 22.4% of all households. In contrast, only 2 households (0.4%) fall into the $200,000+ income bracket, making it the least populous group.
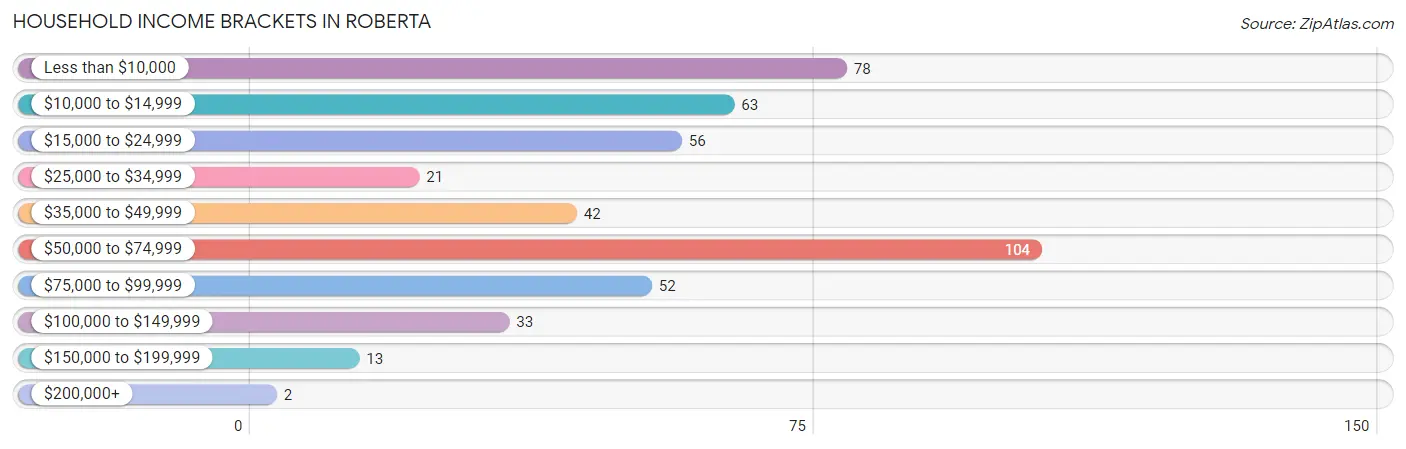
| Income Bracket | # Households | % Households |
| Less than $10,000 | 78 | 16.8% |
| $10,000 to $14,999 | 63 | 13.6% |
| $15,000 to $24,999 | 56 | 12.1% |
| $25,000 to $34,999 | 21 | 4.5% |
| $35,000 to $49,999 | 42 | 9.1% |
| $50,000 to $74,999 | 104 | 22.4% |
| $75,000 to $99,999 | 52 | 11.2% |
| $100,000 to $149,999 | 33 | 7.1% |
| $150,000 to $199,999 | 13 | 2.8% |
| $200,000+ | 2 | 0.4% |
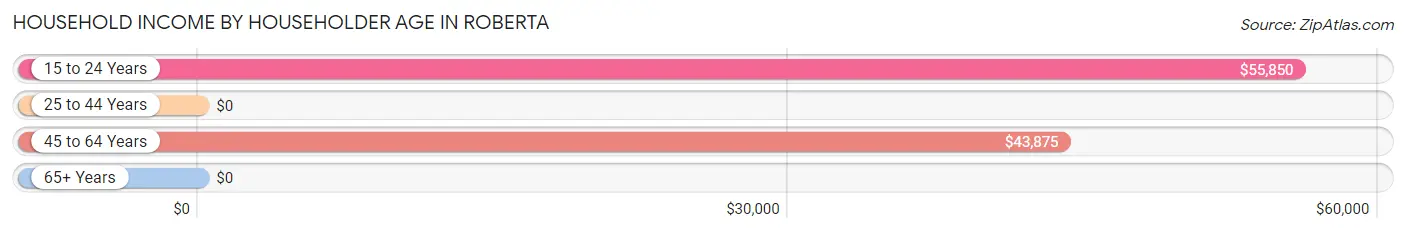
Household Income by Householder Age in Roberta
The median household income in Roberta is $41,500, with the highest median household income of $55,850 found in the 15 to 24 years age bracket for the primary householder. A total of 72 households (15.5%) fall into this category. Meanwhile, the 25 to 44 years age bracket for the primary householder has the lowest median household income of $0, with 151 households (32.5%) in this group.
| Income Bracket | # Households | Median Income |
| 15 to 24 Years | 72 (15.5%) | $55,850 |
| 25 to 44 Years | 151 (32.5%) | $0 |
| 45 to 64 Years | 93 (20.0%) | $43,875 |
| 65+ Years | 148 (31.9%) | $0 |
| Total | 464 (100.0%) | $41,500 |
Poverty in Roberta
Income Below Poverty by Sex and Age in Roberta
With 28.9% poverty level for males and 48.9% for females among the residents of Roberta, 15 year old males and 16 and 17 year old females are the most vulnerable to poverty, with 33 males (100.0%) and 40 females (100.0%) in their respective age groups living below the poverty level.
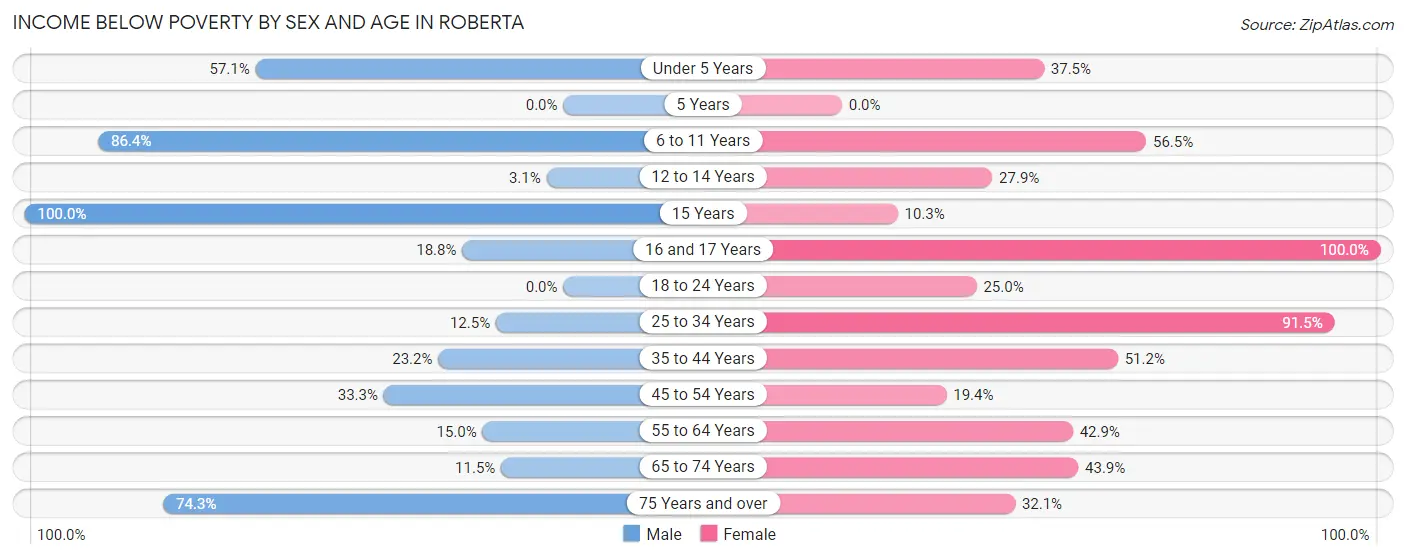
| Age Bracket | Male | Female |
| Under 5 Years | 8 (57.1%) | 3 (37.5%) |
| 5 Years | 0 (0.0%) | 0 (0.0%) |
| 6 to 11 Years | 38 (86.4%) | 109 (56.5%) |
| 12 to 14 Years | 2 (3.1%) | 12 (27.9%) |
| 15 Years | 33 (100.0%) | 3 (10.3%) |
| 16 and 17 Years | 6 (18.8%) | 40 (100.0%) |
| 18 to 24 Years | 0 (0.0%) | 15 (25.0%) |
| 25 to 34 Years | 9 (12.5%) | 75 (91.5%) |
| 35 to 44 Years | 13 (23.2%) | 63 (51.2%) |
| 45 to 54 Years | 9 (33.3%) | 13 (19.4%) |
| 55 to 64 Years | 9 (15.0%) | 15 (42.9%) |
| 65 to 74 Years | 3 (11.5%) | 50 (43.9%) |
| 75 Years and over | 26 (74.3%) | 9 (32.1%) |
| Total | 156 (28.9%) | 407 (48.9%) |
Income Above Poverty by Sex and Age in Roberta
According to the poverty statistics in Roberta, males aged 18 to 24 years and females aged 5 years are the age groups that are most secure financially, with 100.0% of males and 100.0% of females in these age groups living above the poverty line.
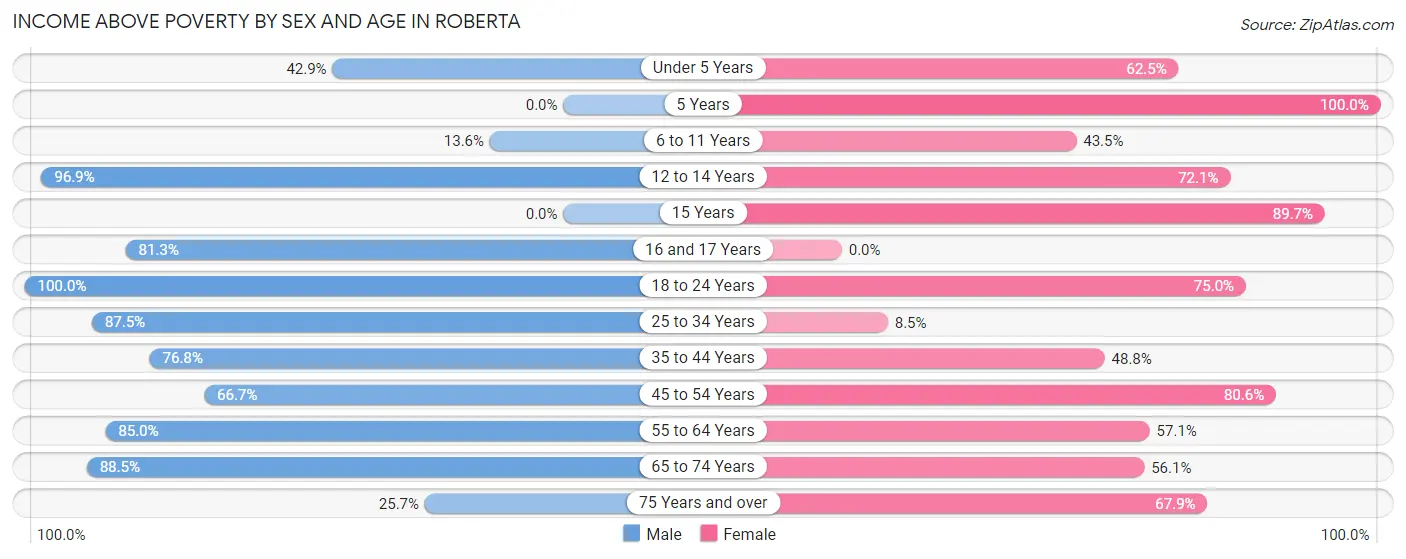
| Age Bracket | Male | Female |
| Under 5 Years | 6 (42.9%) | 5 (62.5%) |
| 5 Years | 0 (0.0%) | 11 (100.0%) |
| 6 to 11 Years | 6 (13.6%) | 84 (43.5%) |
| 12 to 14 Years | 62 (96.9%) | 31 (72.1%) |
| 15 Years | 0 (0.0%) | 26 (89.7%) |
| 16 and 17 Years | 26 (81.2%) | 0 (0.0%) |
| 18 to 24 Years | 76 (100.0%) | 45 (75.0%) |
| 25 to 34 Years | 63 (87.5%) | 7 (8.5%) |
| 35 to 44 Years | 43 (76.8%) | 60 (48.8%) |
| 45 to 54 Years | 18 (66.7%) | 54 (80.6%) |
| 55 to 64 Years | 51 (85.0%) | 20 (57.1%) |
| 65 to 74 Years | 23 (88.5%) | 64 (56.1%) |
| 75 Years and over | 9 (25.7%) | 19 (67.9%) |
| Total | 383 (71.1%) | 426 (51.1%) |
Income Below Poverty Among Married-Couple Families in Roberta
The poverty statistics for married-couple families in Roberta show that 11.9% or 13 of the total 109 families live below the poverty line. Families with no children have the highest poverty rate of 16.7%, comprising of 9 families. On the other hand, families with 3 or 4 children have the lowest poverty rate of 0.0%, which includes 0 families.
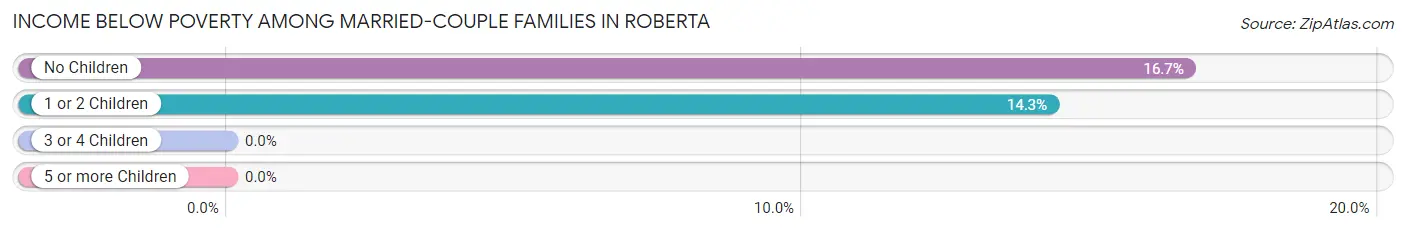
| Children | Above Poverty | Below Poverty |
| No Children | 45 (83.3%) | 9 (16.7%) |
| 1 or 2 Children | 24 (85.7%) | 4 (14.3%) |
| 3 or 4 Children | 27 (100.0%) | 0 (0.0%) |
| 5 or more Children | 0 (0.0%) | 0 (0.0%) |
| Total | 96 (88.1%) | 13 (11.9%) |
Income Below Poverty Among Single-Parent Households in Roberta
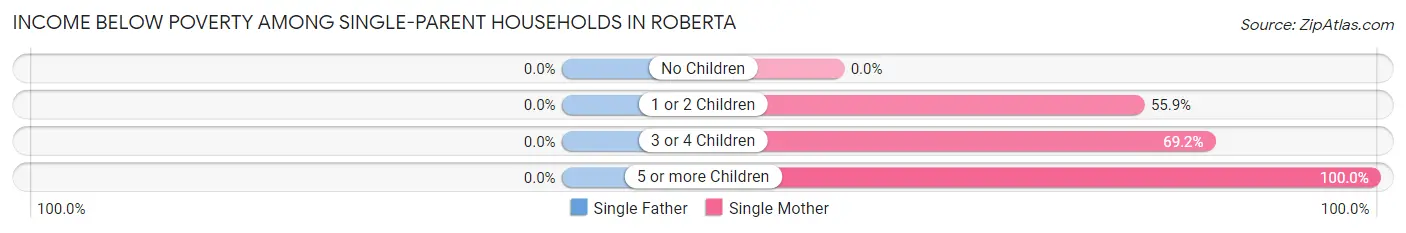
| Children | Single Father | Single Mother |
| No Children | 0 (0.0%) | 0 (0.0%) |
| 1 or 2 Children | 0 (0.0%) | 66 (55.9%) |
| 3 or 4 Children | 0 (0.0%) | 9 (69.2%) |
| 5 or more Children | 0 (0.0%) | 2 (100.0%) |
| Total | 0 (0.0%) | 77 (51.7%) |
Income Below Poverty Among Married-Couple vs Single-Parent Households in Roberta
The poverty data for Roberta shows that 13 of the married-couple family households (11.9%) and 77 of the single-parent households (49.4%) are living below the poverty level. Within the married-couple family households, those with no children have the highest poverty rate, with 9 households (16.7%) falling below the poverty line. Among the single-parent households, those with 5 or more children have the highest poverty rate, with 2 household (100.0%) living below poverty.
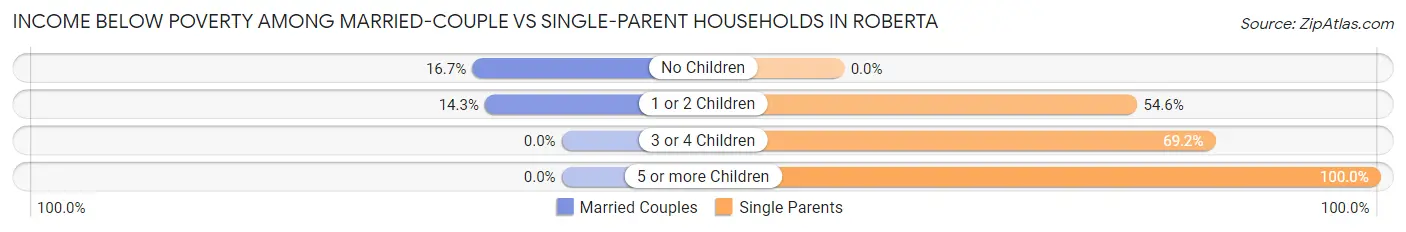
| Children | Married-Couple Families | Single-Parent Households |
| No Children | 9 (16.7%) | 0 (0.0%) |
| 1 or 2 Children | 4 (14.3%) | 66 (54.5%) |
| 3 or 4 Children | 0 (0.0%) | 9 (69.2%) |
| 5 or more Children | 0 (0.0%) | 2 (100.0%) |
| Total | 13 (11.9%) | 77 (49.4%) |
Race in Roberta
The most populous races in Roberta are White / Caucasian (789 | 54.0%), Black / African American (650 | 44.5%), and Two or more Races (23 | 1.6%).
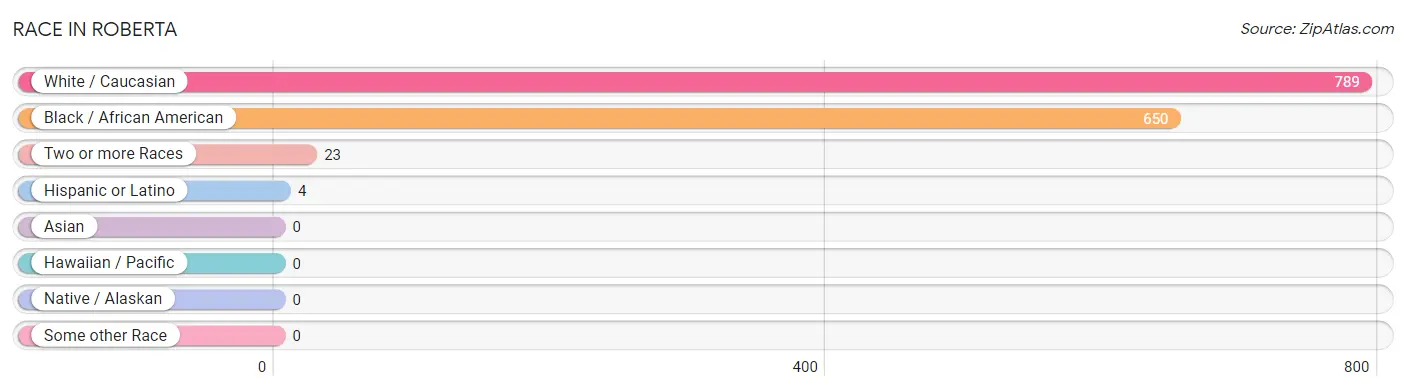
| Race | # Population | % Population |
| Asian | 0 | 0.0% |
| Black / African American | 650 | 44.5% |
| Hawaiian / Pacific | 0 | 0.0% |
| Hispanic or Latino | 4 | 0.3% |
| Native / Alaskan | 0 | 0.0% |
| White / Caucasian | 789 | 54.0% |
| Two or more Races | 23 | 1.6% |
| Some other Race | 0 | 0.0% |
| Total | 1,462 | 100.0% |
Ancestry in Roberta
The most populous ancestries reported in Roberta are American (143 | 9.8%), English (106 | 7.2%), German (78 | 5.3%), European (40 | 2.7%), and Italian (39 | 2.7%), together accounting for 27.8% of all Roberta residents.
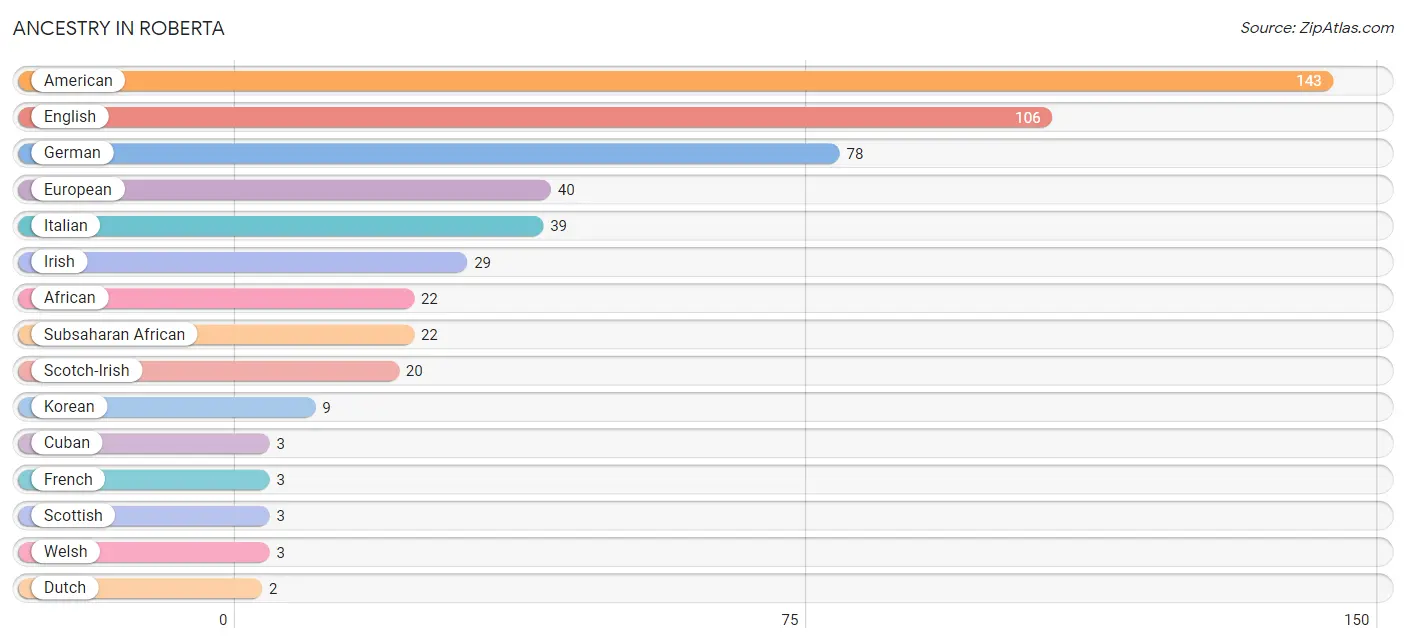
| Ancestry | # Population | % Population |
| African | 22 | 1.5% |
| American | 143 | 9.8% |
| Arab | 1 | 0.1% |
| Blackfeet | 1 | 0.1% |
| British | 1 | 0.1% |
| Cherokee | 1 | 0.1% |
| Cuban | 3 | 0.2% |
| Dutch | 2 | 0.1% |
| Eastern European | 1 | 0.1% |
| English | 106 | 7.2% |
| European | 40 | 2.7% |
| French | 3 | 0.2% |
| German | 78 | 5.3% |
| Irish | 29 | 2.0% |
| Italian | 39 | 2.7% |
| Korean | 9 | 0.6% |
| Lebanese | 1 | 0.1% |
| Scotch-Irish | 20 | 1.4% |
| Scottish | 3 | 0.2% |
| South American | 1 | 0.1% |
| Subsaharan African | 22 | 1.5% |
| Welsh | 3 | 0.2% | View All 22 Rows |
Immigrants in Roberta
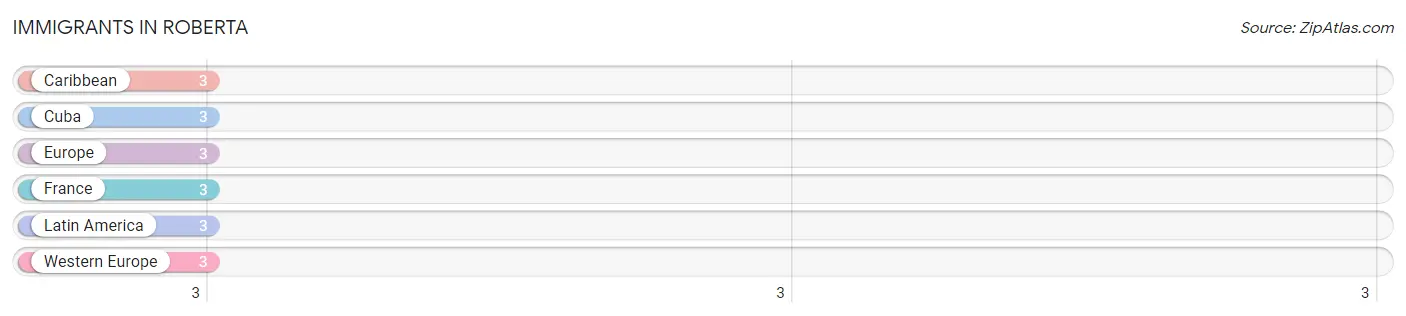
The most numerous immigrant groups reported in Roberta came from Caribbean (3 | 0.2%), Cuba (3 | 0.2%), Europe (3 | 0.2%), France (3 | 0.2%), and Latin America (3 | 0.2%), together accounting for 1.0% of all Roberta residents.
| Immigration Origin | # Population | % Population |
| Caribbean | 3 | 0.2% |
| Cuba | 3 | 0.2% |
| Europe | 3 | 0.2% |
| France | 3 | 0.2% |
| Latin America | 3 | 0.2% |
| Western Europe | 3 | 0.2% | View All 6 Rows |
Sex and Age in Roberta
Sex and Age in Roberta
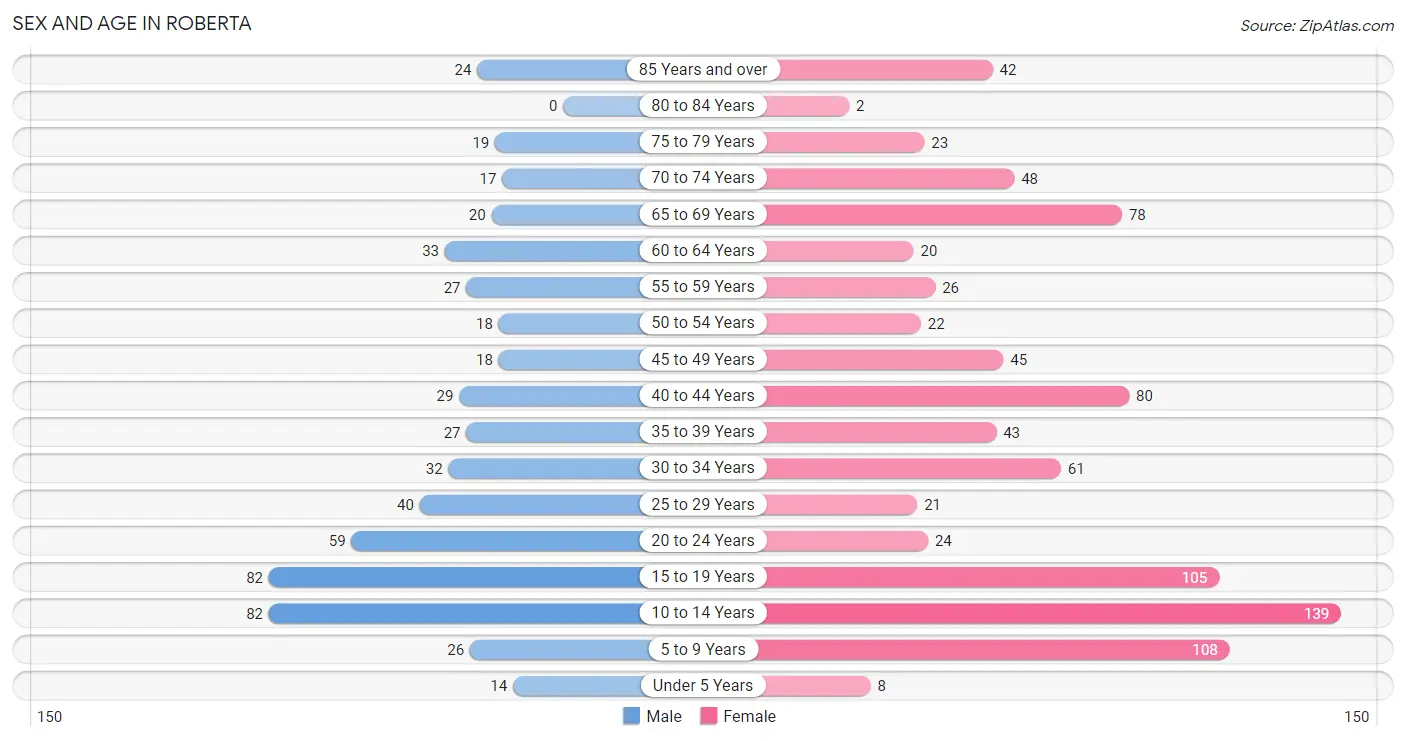
The most populous age groups in Roberta are 10 to 14 Years (82 | 14.5%) for men and 10 to 14 Years (139 | 15.5%) for women.
| Age Bracket | Male | Female |
| Under 5 Years | 14 (2.5%) | 8 (0.9%) |
| 5 to 9 Years | 26 (4.6%) | 108 (12.1%) |
| 10 to 14 Years | 82 (14.5%) | 139 (15.5%) |
| 15 to 19 Years | 82 (14.5%) | 105 (11.7%) |
| 20 to 24 Years | 59 (10.4%) | 24 (2.7%) |
| 25 to 29 Years | 40 (7.0%) | 21 (2.4%) |
| 30 to 34 Years | 32 (5.6%) | 61 (6.8%) |
| 35 to 39 Years | 27 (4.8%) | 43 (4.8%) |
| 40 to 44 Years | 29 (5.1%) | 80 (8.9%) |
| 45 to 49 Years | 18 (3.2%) | 45 (5.0%) |
| 50 to 54 Years | 18 (3.2%) | 22 (2.5%) |
| 55 to 59 Years | 27 (4.8%) | 26 (2.9%) |
| 60 to 64 Years | 33 (5.8%) | 20 (2.2%) |
| 65 to 69 Years | 20 (3.5%) | 78 (8.7%) |
| 70 to 74 Years | 17 (3.0%) | 48 (5.4%) |
| 75 to 79 Years | 19 (3.4%) | 23 (2.6%) |
| 80 to 84 Years | 0 (0.0%) | 2 (0.2%) |
| 85 Years and over | 24 (4.2%) | 42 (4.7%) |
| Total | 567 (100.0%) | 895 (100.0%) |
Families and Households in Roberta
Median Family Size in Roberta
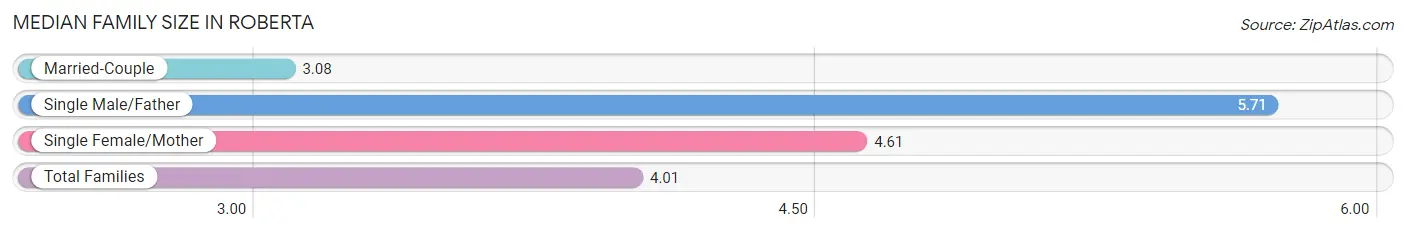
The median family size in Roberta is 4.01 persons per family, with single male/father families (7 | 2.6%) accounting for the largest median family size of 5.71 persons per family. On the other hand, married-couple families (109 | 41.1%) represent the smallest median family size with 3.08 persons per family.
| Family Type | # Families | Family Size |
| Married-Couple | 109 (41.1%) | 3.08 |
| Single Male/Father | 7 (2.6%) | 5.71 |
| Single Female/Mother | 149 (56.2%) | 4.61 |
| Total Families | 265 (100.0%) | 4.01 |
Median Household Size in Roberta
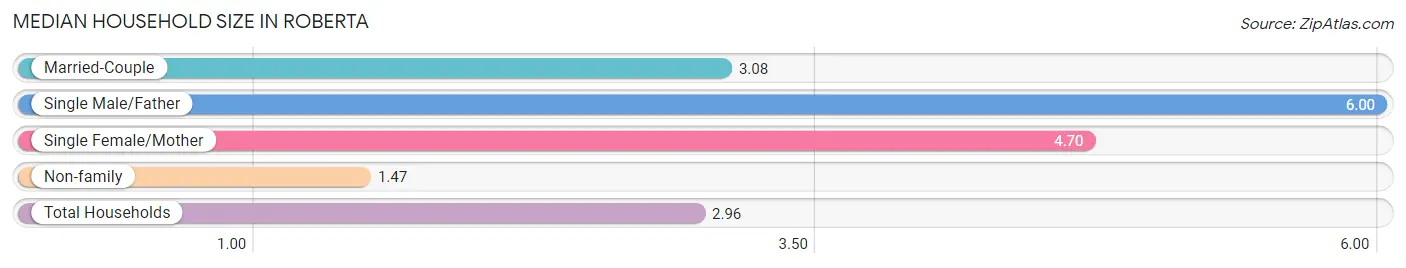
The median household size in Roberta is 2.96 persons per household, with single male/father households (7 | 1.5%) accounting for the largest median household size of 6 persons per household. non-family households (199 | 42.9%) represent the smallest median household size with 1.47 persons per household.
| Household Type | # Households | Household Size |
| Married-Couple | 109 (23.5%) | 3.08 |
| Single Male/Father | 7 (1.5%) | 6.00 |
| Single Female/Mother | 149 (32.1%) | 4.70 |
| Non-family | 199 (42.9%) | 1.47 |
| Total Households | 464 (100.0%) | 2.96 |
Household Size by Marriage Status in Roberta
Out of a total of 464 households in Roberta, 265 (57.1%) are family households, while 199 (42.9%) are nonfamily households. The most numerous type of family households are 2-person households, comprising 148, and the most common type of nonfamily households are 1-person households, comprising 135.
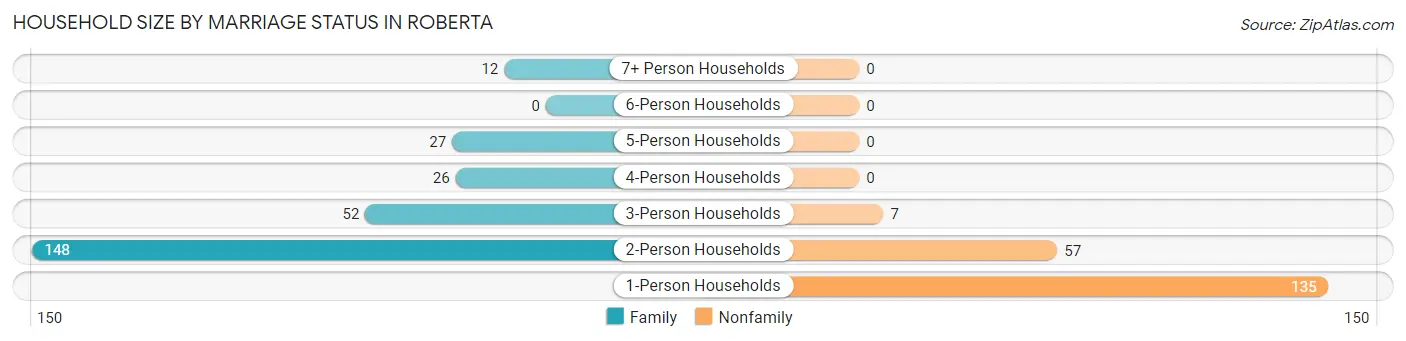
| Household Size | Family Households | Nonfamily Households |
| 1-Person Households | - | 135 (29.1%) |
| 2-Person Households | 148 (31.9%) | 57 (12.3%) |
| 3-Person Households | 52 (11.2%) | 7 (1.5%) |
| 4-Person Households | 26 (5.6%) | 0 (0.0%) |
| 5-Person Households | 27 (5.8%) | 0 (0.0%) |
| 6-Person Households | 0 (0.0%) | 0 (0.0%) |
| 7+ Person Households | 12 (2.6%) | 0 (0.0%) |
| Total | 265 (57.1%) | 199 (42.9%) |
Female Fertility in Roberta
Fertility by Age in Roberta
Average fertility rate in Roberta is 11.0 births per 1,000 women. Women in the age bracket of 20 to 34 years have the highest fertility rate with 38.0 births per 1,000 women. Women in the age bracket of 20 to 34 years acount for 100.0% of all women with births.
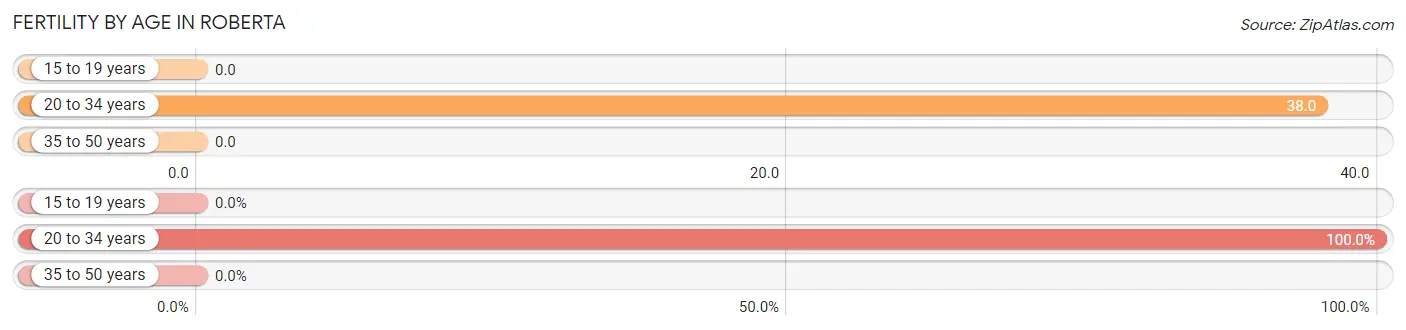
| Age Bracket | Women with Births | Births / 1,000 Women |
| 15 to 19 years | 0 (0.0%) | 0.0 |
| 20 to 34 years | 4 (100.0%) | 38.0 |
| 35 to 50 years | 0 (0.0%) | 0.0 |
| Total | 4 (100.0%) | 11.0 |
Fertility by Age by Marriage Status in Roberta
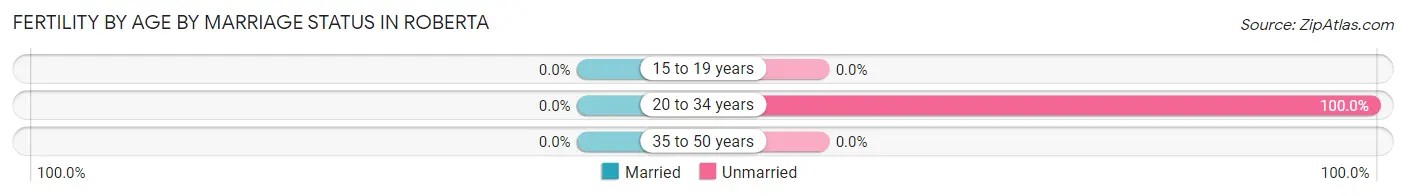
| Age Bracket | Married | Unmarried |
| 15 to 19 years | 0 (0.0%) | 0 (0.0%) |
| 20 to 34 years | 0 (0.0%) | 4 (100.0%) |
| 35 to 50 years | 0 (0.0%) | 0 (0.0%) |
| Total | 0 (0.0%) | 4 (100.0%) |
Fertility by Education in Roberta
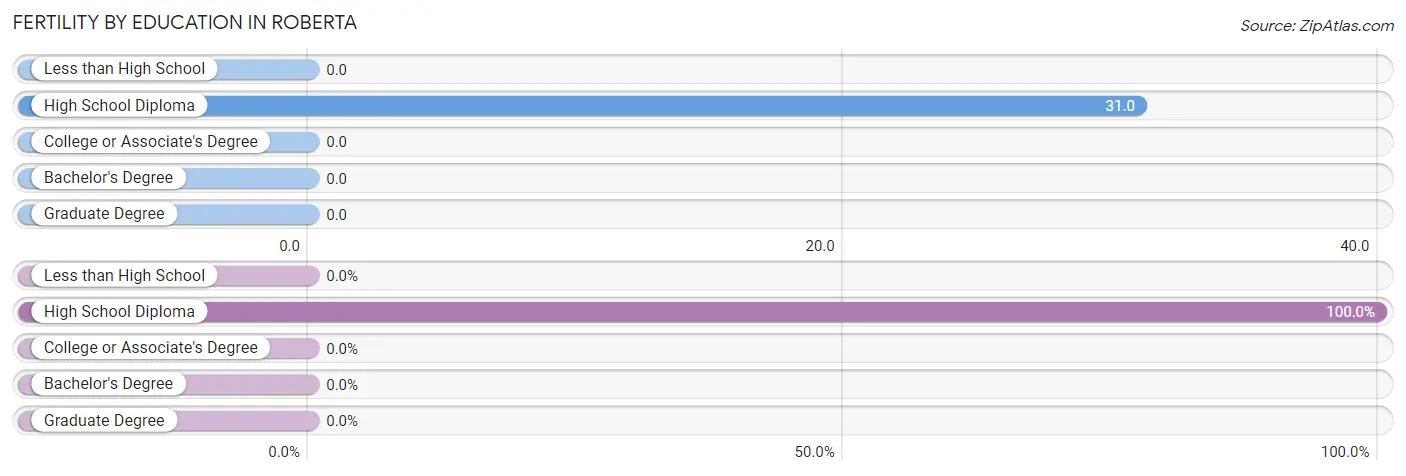
| Educational Attainment | Women with Births | Births / 1,000 Women |
| Less than High School | 0 (0.0%) | 0.0 |
| High School Diploma | 4 (100.0%) | 31.0 |
| College or Associate's Degree | 0 (0.0%) | 0.0 |
| Bachelor's Degree | 0 (0.0%) | 0.0 |
| Graduate Degree | 0 (0.0%) | 0.0 |
| Total | 4 (100.0%) | 11.0 |
Fertility by Education by Marriage Status in Roberta
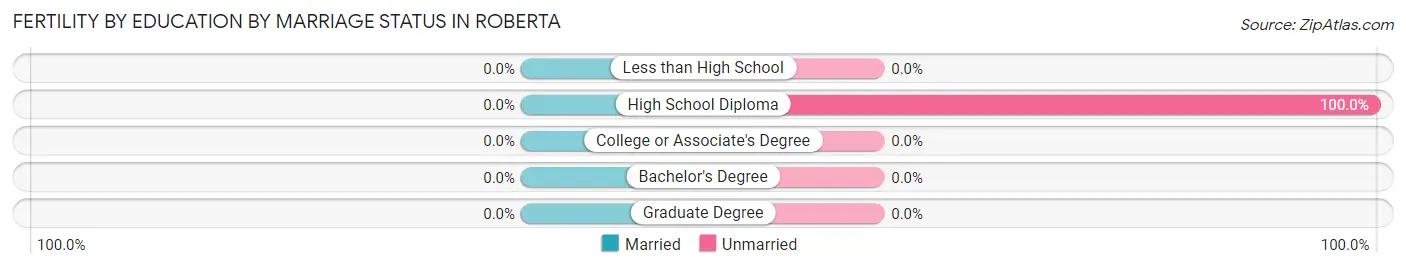
| Educational Attainment | Married | Unmarried |
| Less than High School | 0 (0.0%) | 0 (0.0%) |
| High School Diploma | 0 (0.0%) | 4 (100.0%) |
| College or Associate's Degree | 0 (0.0%) | 0 (0.0%) |
| Bachelor's Degree | 0 (0.0%) | 0 (0.0%) |
| Graduate Degree | 0 (0.0%) | 0 (0.0%) |
| Total | 0 (0.0%) | 4 (100.0%) |
Employment Characteristics in Roberta
Employment by Class of Employer in Roberta
Among the 451 employed individuals in Roberta, private company employees (222 | 49.2%), self-employed (not incorporated) (88 | 19.5%), and local government employees (45 | 10.0%) make up the most common classes of employment.
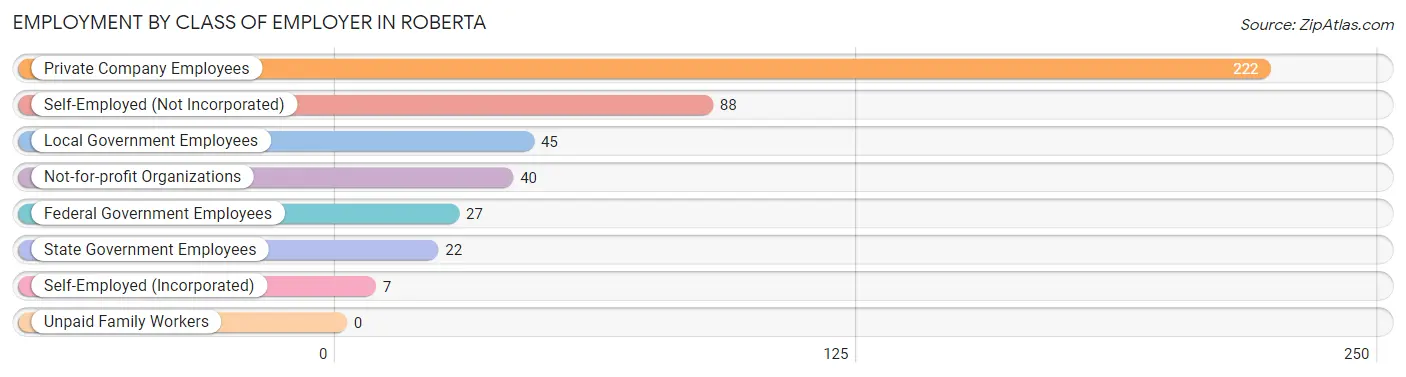
| Employer Class | # Employees | % Employees |
| Private Company Employees | 222 | 49.2% |
| Self-Employed (Incorporated) | 7 | 1.5% |
| Self-Employed (Not Incorporated) | 88 | 19.5% |
| Not-for-profit Organizations | 40 | 8.9% |
| Local Government Employees | 45 | 10.0% |
| State Government Employees | 22 | 4.9% |
| Federal Government Employees | 27 | 6.0% |
| Unpaid Family Workers | 0 | 0.0% |
| Total | 451 | 100.0% |
Employment Status by Age in Roberta
According to the labor force statistics for Roberta, out of the total population over 16 years of age (1,023), 50.3% or 515 individuals are in the labor force, with 12.5% or 64 of them unemployed. The age group with the highest labor force participation rate is 20 to 24 years, with 98.8% or 82 individuals in the labor force. Within the labor force, the 30 to 34 years age range has the highest percentage of unemployed individuals, with 67.9% or 55 of them being unemployed.
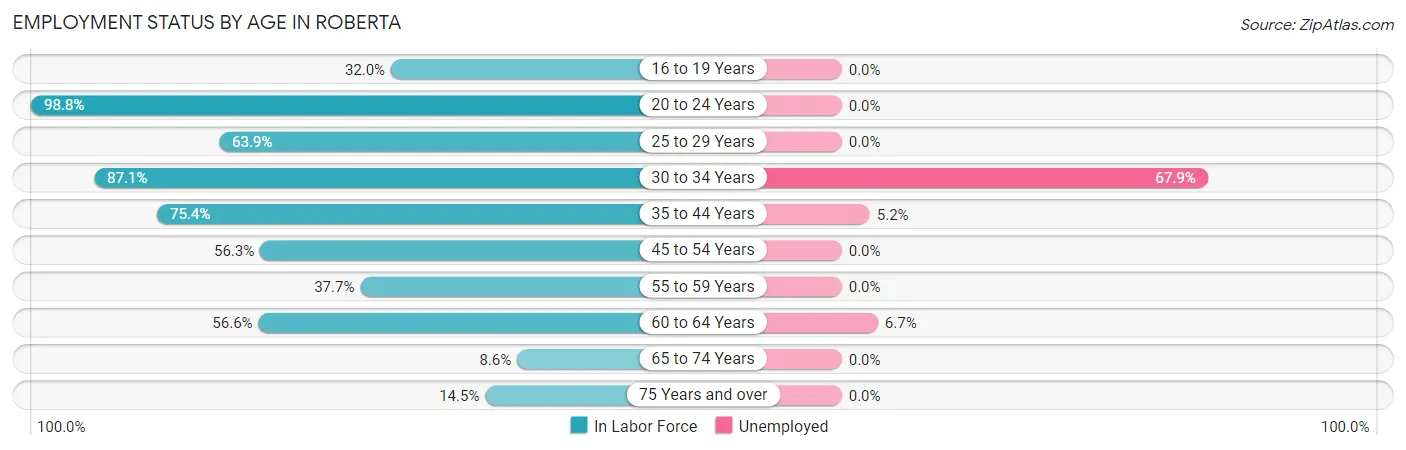
| Age Bracket | In Labor Force | Unemployed |
| 16 to 19 Years | 40 (32.0%) | 0 (0.0%) |
| 20 to 24 Years | 82 (98.8%) | 0 (0.0%) |
| 25 to 29 Years | 39 (63.9%) | 0 (0.0%) |
| 30 to 34 Years | 81 (87.1%) | 55 (67.9%) |
| 35 to 44 Years | 135 (75.4%) | 7 (5.2%) |
| 45 to 54 Years | 58 (56.3%) | 0 (0.0%) |
| 55 to 59 Years | 20 (37.7%) | 0 (0.0%) |
| 60 to 64 Years | 30 (56.6%) | 2 (6.7%) |
| 65 to 74 Years | 14 (8.6%) | 0 (0.0%) |
| 75 Years and over | 16 (14.5%) | 0 (0.0%) |
| Total | 515 (50.3%) | 64 (12.5%) |
Employment Status by Educational Attainment in Roberta
According to labor force statistics for Roberta, 67.0% of individuals (363) out of the total population between 25 and 64 years of age (542) are in the labor force, with 17.6% or 64 of them being unemployed. The group with the highest labor force participation rate are those with the educational attainment of bachelor's degree or higher, with 90.5% or 57 individuals in the labor force. Within the labor force, individuals with less than high school education have the highest percentage of unemployment, with 87.5% or 7 of them being unemployed.
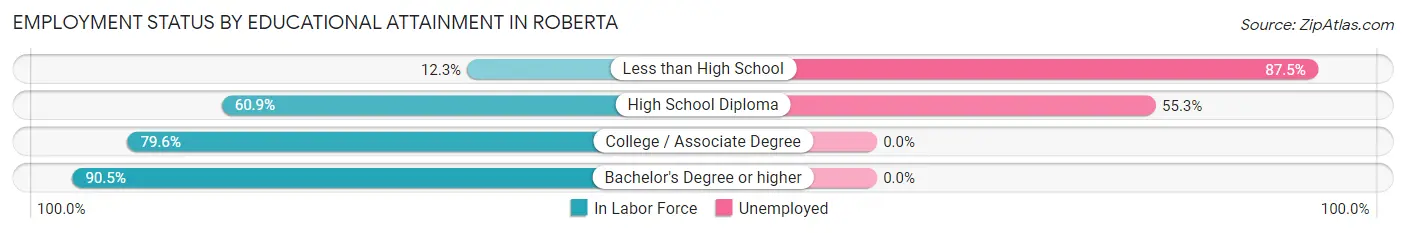
| Educational Attainment | In Labor Force | Unemployed |
| Less than High School | 8 (12.3%) | 57 (87.5%) |
| High School Diploma | 103 (60.9%) | 93 (55.3%) |
| College / Associate Degree | 195 (79.6%) | 0 (0.0%) |
| Bachelor's Degree or higher | 57 (90.5%) | 0 (0.0%) |
| Total | 363 (67.0%) | 95 (17.6%) |
Employment Occupations by Sex in Roberta
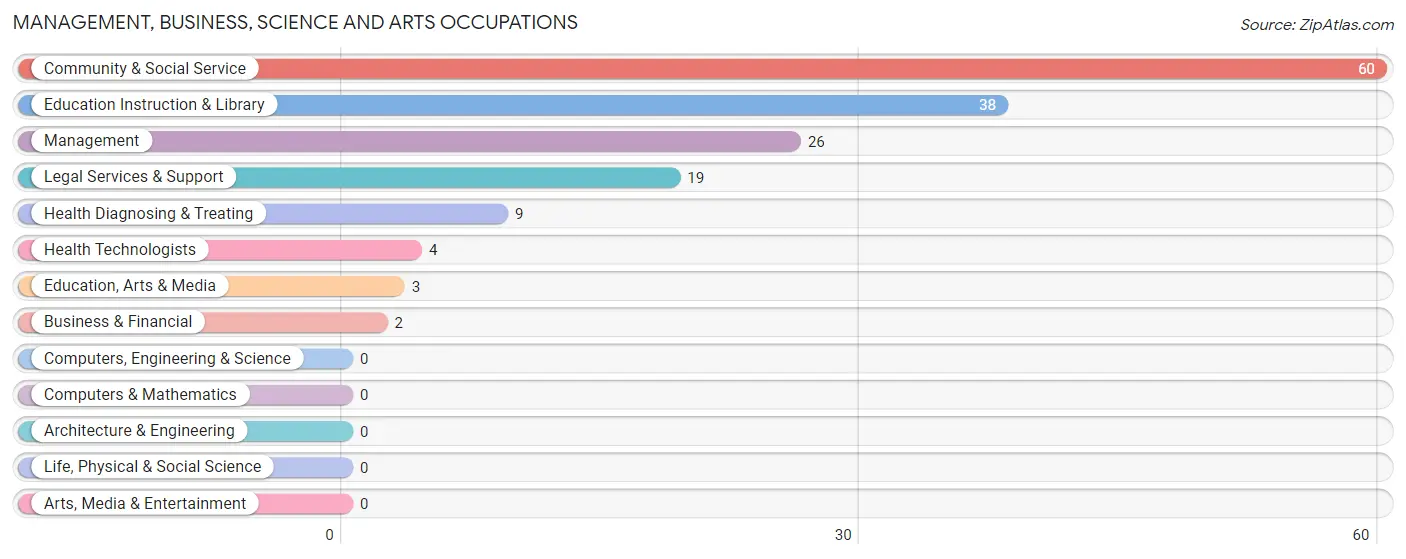
Management, Business, Science and Arts Occupations
The most common Management, Business, Science and Arts occupations in Roberta are Community & Social Service (60 | 13.4%), Education Instruction & Library (38 | 8.5%), Management (26 | 5.8%), Legal Services & Support (19 | 4.3%), and Health Diagnosing & Treating (9 | 2.0%).
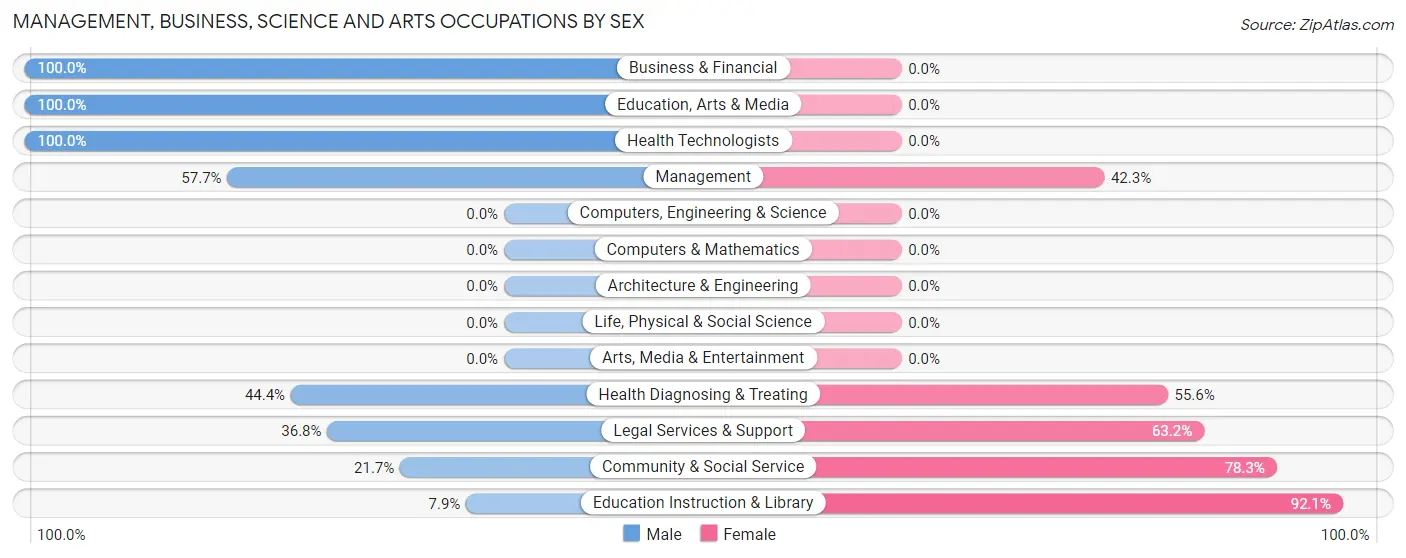
Management, Business, Science and Arts Occupations by Sex
Within the Management, Business, Science and Arts occupations in Roberta, the most male-oriented occupations are Business & Financial (100.0%), Education, Arts & Media (100.0%), and Health Technologists (100.0%), while the most female-oriented occupations are Education Instruction & Library (92.1%), Community & Social Service (78.3%), and Legal Services & Support (63.2%).
| Occupation | Male | Female |
| Management | 15 (57.7%) | 11 (42.3%) |
| Business & Financial | 2 (100.0%) | 0 (0.0%) |
| Computers, Engineering & Science | 0 (0.0%) | 0 (0.0%) |
| Computers & Mathematics | 0 (0.0%) | 0 (0.0%) |
| Architecture & Engineering | 0 (0.0%) | 0 (0.0%) |
| Life, Physical & Social Science | 0 (0.0%) | 0 (0.0%) |
| Community & Social Service | 13 (21.7%) | 47 (78.3%) |
| Education, Arts & Media | 3 (100.0%) | 0 (0.0%) |
| Legal Services & Support | 7 (36.8%) | 12 (63.2%) |
| Education Instruction & Library | 3 (7.9%) | 35 (92.1%) |
| Arts, Media & Entertainment | 0 (0.0%) | 0 (0.0%) |
| Health Diagnosing & Treating | 4 (44.4%) | 5 (55.6%) |
| Health Technologists | 4 (100.0%) | 0 (0.0%) |
| Total (Category) | 34 (35.0%) | 63 (64.9%) |
| Total (Overall) | 209 (46.8%) | 238 (53.2%) |
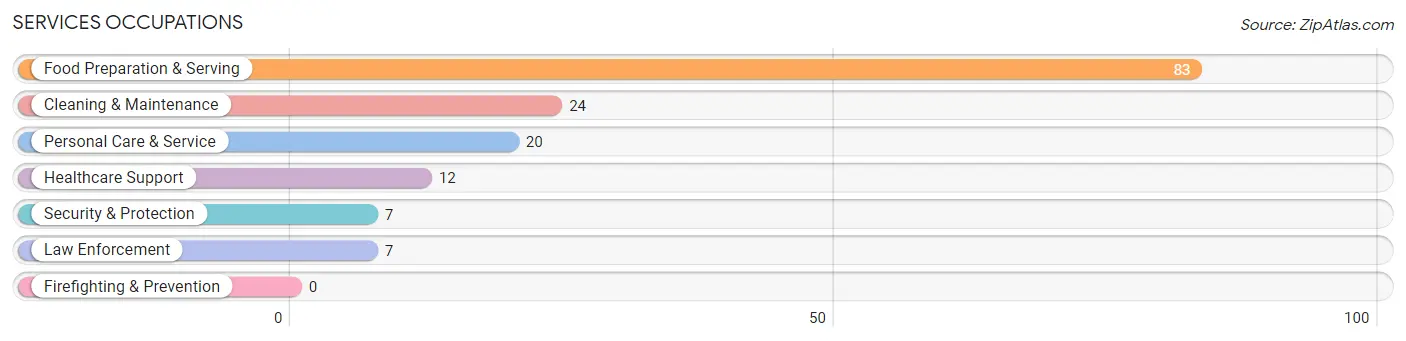
Services Occupations
The most common Services occupations in Roberta are Food Preparation & Serving (83 | 18.6%), Cleaning & Maintenance (24 | 5.4%), Personal Care & Service (20 | 4.5%), Healthcare Support (12 | 2.7%), and Security & Protection (7 | 1.6%).
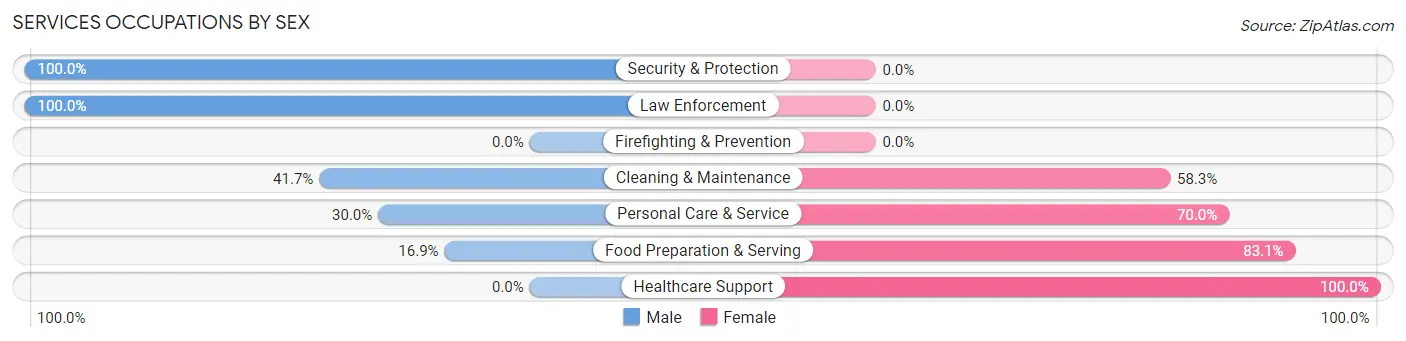
Services Occupations by Sex
Within the Services occupations in Roberta, the most male-oriented occupations are Security & Protection (100.0%), Law Enforcement (100.0%), and Cleaning & Maintenance (41.7%), while the most female-oriented occupations are Healthcare Support (100.0%), Food Preparation & Serving (83.1%), and Personal Care & Service (70.0%).
| Occupation | Male | Female |
| Healthcare Support | 0 (0.0%) | 12 (100.0%) |
| Security & Protection | 7 (100.0%) | 0 (0.0%) |
| Firefighting & Prevention | 0 (0.0%) | 0 (0.0%) |
| Law Enforcement | 7 (100.0%) | 0 (0.0%) |
| Food Preparation & Serving | 14 (16.9%) | 69 (83.1%) |
| Cleaning & Maintenance | 10 (41.7%) | 14 (58.3%) |
| Personal Care & Service | 6 (30.0%) | 14 (70.0%) |
| Total (Category) | 37 (25.3%) | 109 (74.7%) |
| Total (Overall) | 209 (46.8%) | 238 (53.2%) |
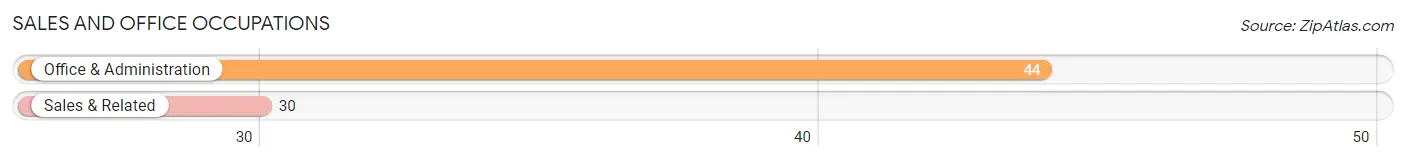
Sales and Office Occupations
The most common Sales and Office occupations in Roberta are Office & Administration (44 | 9.8%), and Sales & Related (30 | 6.7%).
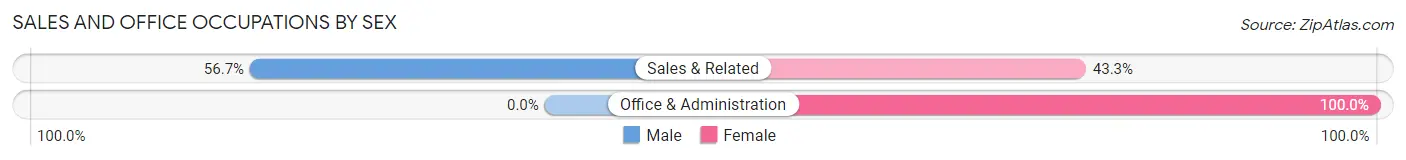
Sales and Office Occupations by Sex
| Occupation | Male | Female |
| Sales & Related | 17 (56.7%) | 13 (43.3%) |
| Office & Administration | 0 (0.0%) | 44 (100.0%) |
| Total (Category) | 17 (23.0%) | 57 (77.0%) |
| Total (Overall) | 209 (46.8%) | 238 (53.2%) |
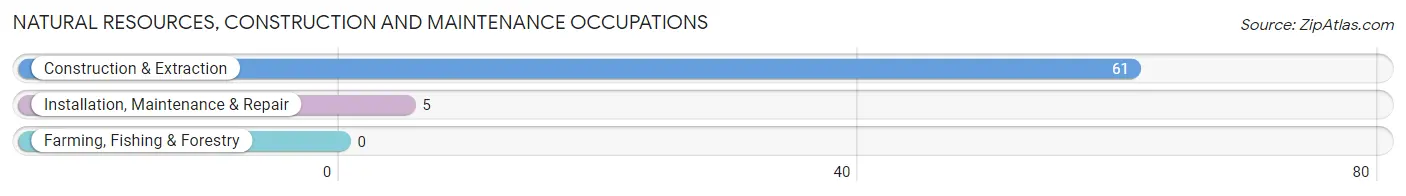
Natural Resources, Construction and Maintenance Occupations
The most common Natural Resources, Construction and Maintenance occupations in Roberta are Construction & Extraction (61 | 13.7%), and Installation, Maintenance & Repair (5 | 1.1%).
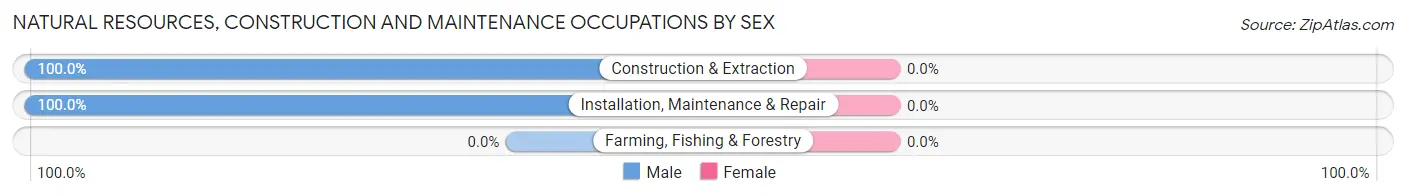
Natural Resources, Construction and Maintenance Occupations by Sex
| Occupation | Male | Female |
| Farming, Fishing & Forestry | 0 (0.0%) | 0 (0.0%) |
| Construction & Extraction | 61 (100.0%) | 0 (0.0%) |
| Installation, Maintenance & Repair | 5 (100.0%) | 0 (0.0%) |
| Total (Category) | 66 (100.0%) | 0 (0.0%) |
| Total (Overall) | 209 (46.8%) | 238 (53.2%) |
Production, Transportation and Moving Occupations
The most common Production, Transportation and Moving occupations in Roberta are Material Moving (38 | 8.5%), and Production (26 | 5.8%).
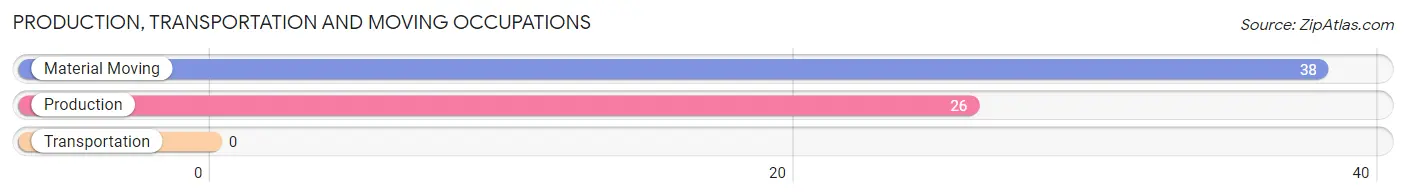
Production, Transportation and Moving Occupations by Sex
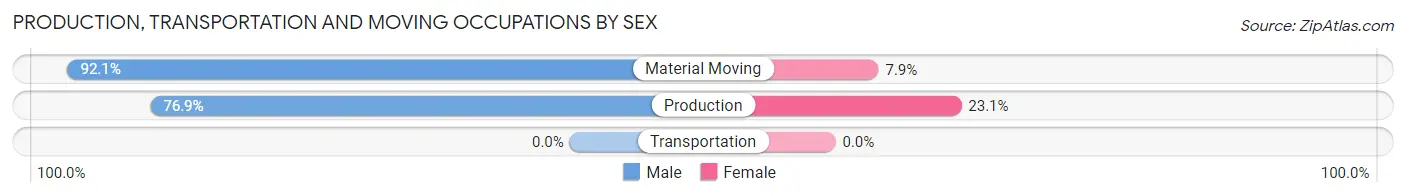
| Occupation | Male | Female |
| Production | 20 (76.9%) | 6 (23.1%) |
| Transportation | 0 (0.0%) | 0 (0.0%) |
| Material Moving | 35 (92.1%) | 3 (7.9%) |
| Total (Category) | 55 (85.9%) | 9 (14.1%) |
| Total (Overall) | 209 (46.8%) | 238 (53.2%) |
Employment Industries by Sex in Roberta
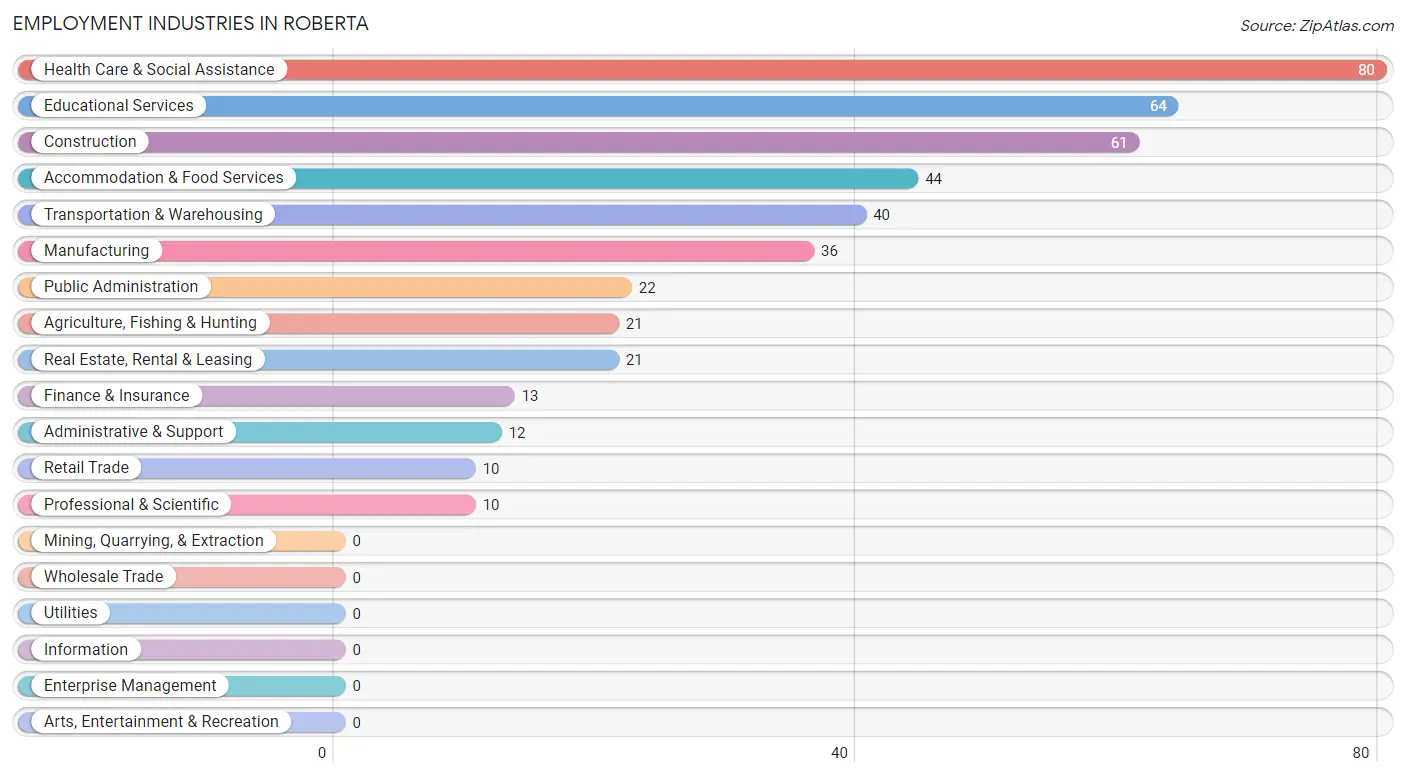
Employment Industries in Roberta
The major employment industries in Roberta include Health Care & Social Assistance (80 | 17.9%), Educational Services (64 | 14.3%), Construction (61 | 13.7%), Accommodation & Food Services (44 | 9.8%), and Transportation & Warehousing (40 | 8.9%).
Employment Industries by Sex in Roberta
The Roberta industries that see more men than women are Construction (100.0%), Finance & Insurance (100.0%), and Professional & Scientific (90.0%), whereas the industries that tend to have a higher number of women are Administrative & Support (100.0%), Agriculture, Fishing & Hunting (95.2%), and Health Care & Social Assistance (87.5%).
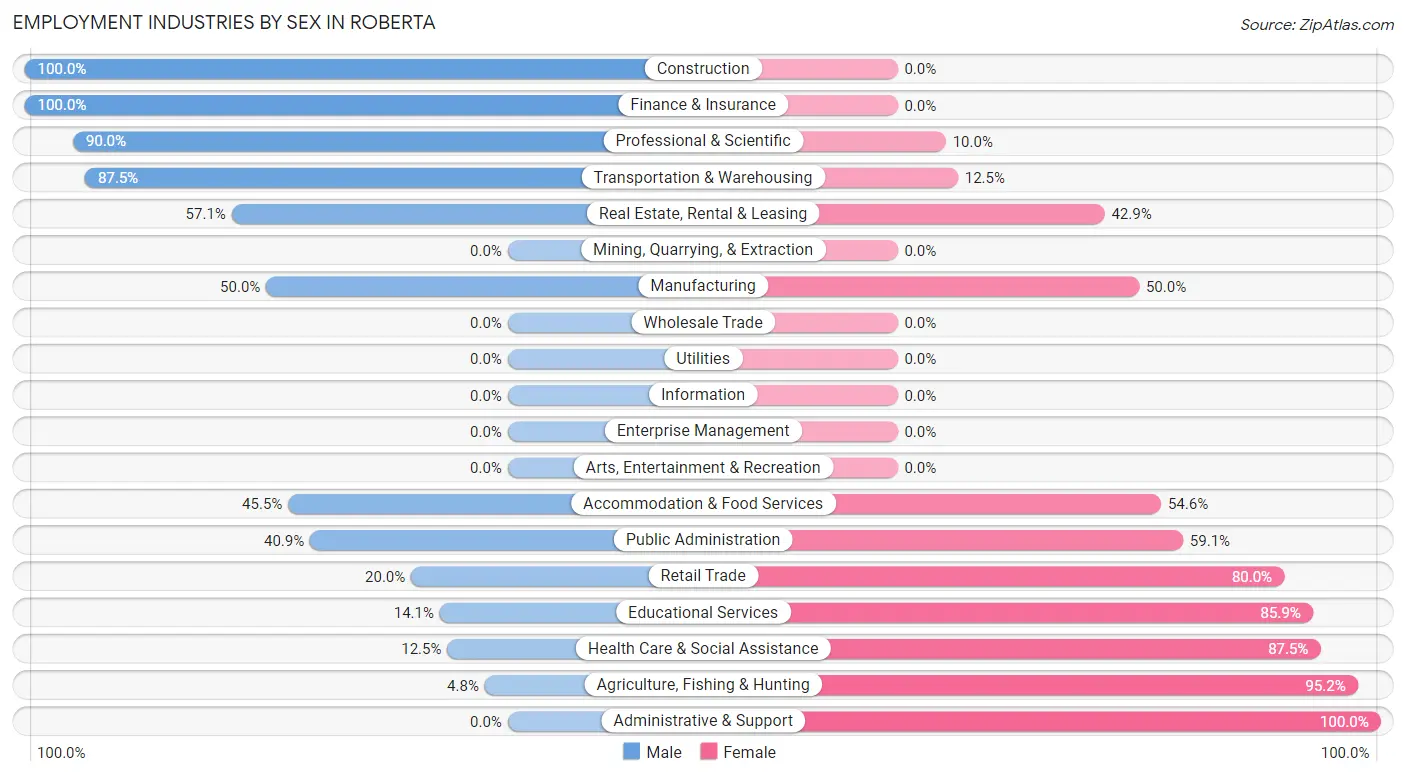
| Industry | Male | Female |
| Agriculture, Fishing & Hunting | 1 (4.8%) | 20 (95.2%) |
| Mining, Quarrying, & Extraction | 0 (0.0%) | 0 (0.0%) |
| Construction | 61 (100.0%) | 0 (0.0%) |
| Manufacturing | 18 (50.0%) | 18 (50.0%) |
| Wholesale Trade | 0 (0.0%) | 0 (0.0%) |
| Retail Trade | 2 (20.0%) | 8 (80.0%) |
| Transportation & Warehousing | 35 (87.5%) | 5 (12.5%) |
| Utilities | 0 (0.0%) | 0 (0.0%) |
| Information | 0 (0.0%) | 0 (0.0%) |
| Finance & Insurance | 13 (100.0%) | 0 (0.0%) |
| Real Estate, Rental & Leasing | 12 (57.1%) | 9 (42.9%) |
| Professional & Scientific | 9 (90.0%) | 1 (10.0%) |
| Enterprise Management | 0 (0.0%) | 0 (0.0%) |
| Administrative & Support | 0 (0.0%) | 12 (100.0%) |
| Educational Services | 9 (14.1%) | 55 (85.9%) |
| Health Care & Social Assistance | 10 (12.5%) | 70 (87.5%) |
| Arts, Entertainment & Recreation | 0 (0.0%) | 0 (0.0%) |
| Accommodation & Food Services | 20 (45.5%) | 24 (54.5%) |
| Public Administration | 9 (40.9%) | 13 (59.1%) |
| Total | 209 (46.8%) | 238 (53.2%) |
Education in Roberta
School Enrollment in Roberta
The most common levels of schooling among the 545 students in Roberta are high school (169 | 31.0%), middle school (151 | 27.7%), and elementary school (127 | 23.3%).
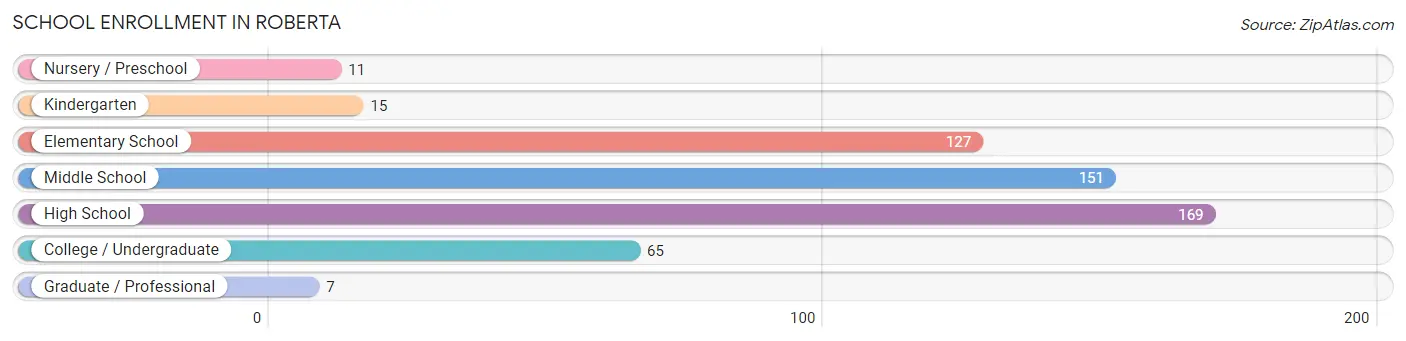
| School Level | # Students | % Students |
| Nursery / Preschool | 11 | 2.0% |
| Kindergarten | 15 | 2.8% |
| Elementary School | 127 | 23.3% |
| Middle School | 151 | 27.7% |
| High School | 169 | 31.0% |
| College / Undergraduate | 65 | 11.9% |
| Graduate / Professional | 7 | 1.3% |
| Total | 545 | 100.0% |
School Enrollment by Age by Funding Source in Roberta
Out of a total of 545 students who are enrolled in schools in Roberta, 49 (9.0%) attend a private institution, while the remaining 496 (91.0%) are enrolled in public schools. The age group of 3 to 4 year olds has the highest likelihood of being enrolled in private schools, with 3 (27.3% in the age bracket) enrolled. Conversely, the age group of 15 to 17 year olds has the lowest likelihood of being enrolled in a private school, with 134 (100.0% in the age bracket) attending a public institution.
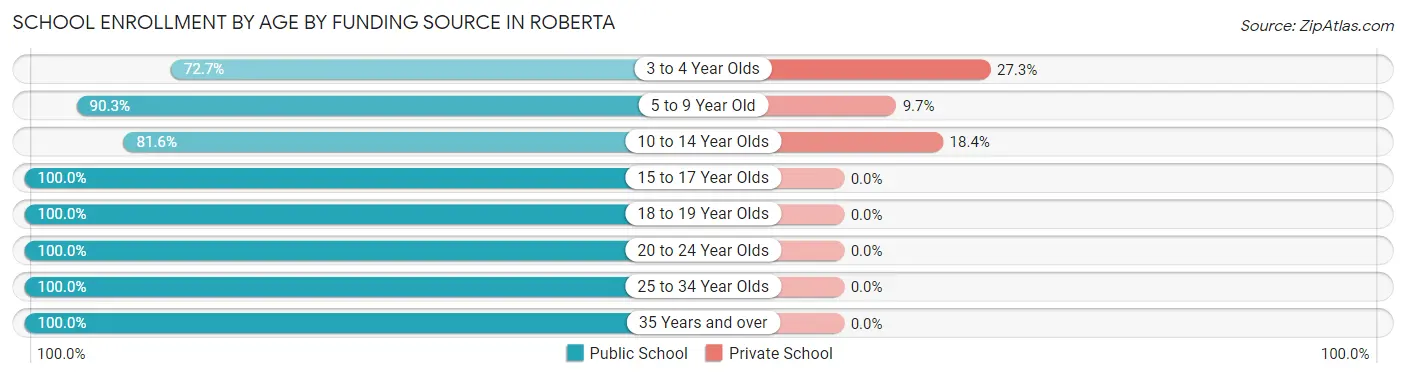
| Age Bracket | Public School | Private School |
| 3 to 4 Year Olds | 8 (72.7%) | 3 (27.3%) |
| 5 to 9 Year Old | 121 (90.3%) | 13 (9.7%) |
| 10 to 14 Year Olds | 146 (81.6%) | 33 (18.4%) |
| 15 to 17 Year Olds | 134 (100.0%) | 0 (0.0%) |
| 18 to 19 Year Olds | 52 (100.0%) | 0 (0.0%) |
| 20 to 24 Year Olds | 1 (100.0%) | 0 (0.0%) |
| 25 to 34 Year Olds | 8 (100.0%) | 0 (0.0%) |
| 35 Years and over | 26 (100.0%) | 0 (0.0%) |
| Total | 496 (91.0%) | 49 (9.0%) |
Educational Attainment by Field of Study in Roberta
Business (28 | 32.6%), social sciences (25 | 29.1%), education (24 | 27.9%), arts & humanities (4 | 4.6%), and science & technology (3 | 3.5%) are the most common fields of study among 86 individuals in Roberta who have obtained a bachelor's degree or higher.
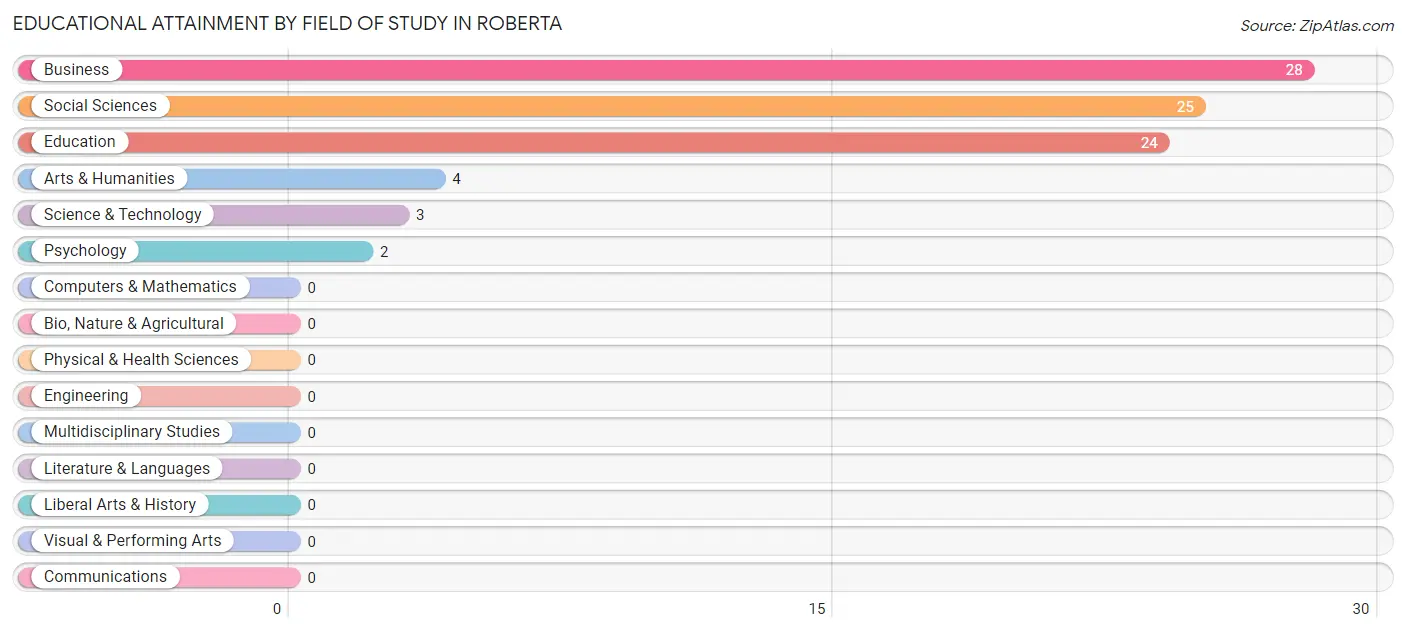
| Field of Study | # Graduates | % Graduates |
| Computers & Mathematics | 0 | 0.0% |
| Bio, Nature & Agricultural | 0 | 0.0% |
| Physical & Health Sciences | 0 | 0.0% |
| Psychology | 2 | 2.3% |
| Social Sciences | 25 | 29.1% |
| Engineering | 0 | 0.0% |
| Multidisciplinary Studies | 0 | 0.0% |
| Science & Technology | 3 | 3.5% |
| Business | 28 | 32.6% |
| Education | 24 | 27.9% |
| Literature & Languages | 0 | 0.0% |
| Liberal Arts & History | 0 | 0.0% |
| Visual & Performing Arts | 0 | 0.0% |
| Communications | 0 | 0.0% |
| Arts & Humanities | 4 | 4.6% |
| Total | 86 | 100.0% |
Transportation & Commute in Roberta
Vehicle Availability by Sex in Roberta
The most prevalent vehicle ownership categories in Roberta are males with no vehicle (62, accounting for 29.7%) and females with no vehicle (2, making up 25.6%).
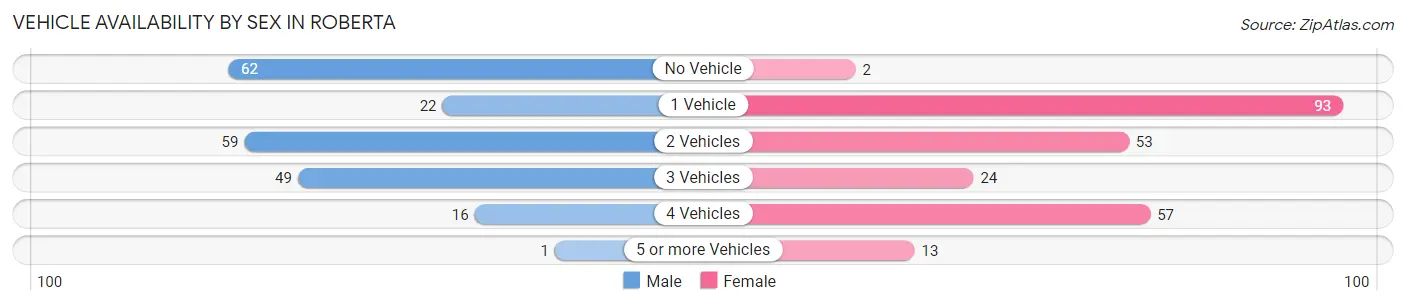
| Vehicles Available | Male | Female |
| No Vehicle | 62 (29.7%) | 2 (0.8%) |
| 1 Vehicle | 22 (10.5%) | 93 (38.4%) |
| 2 Vehicles | 59 (28.2%) | 53 (21.9%) |
| 3 Vehicles | 49 (23.4%) | 24 (9.9%) |
| 4 Vehicles | 16 (7.7%) | 57 (23.5%) |
| 5 or more Vehicles | 1 (0.5%) | 13 (5.4%) |
| Total | 209 (100.0%) | 242 (100.0%) |
Commute Time in Roberta
The most frequently occuring commute durations in Roberta are 45 to 59 minutes (95 commuters, 22.5%), 5 to 9 minutes (94 commuters, 22.2%), and 30 to 34 minutes (71 commuters, 16.8%).
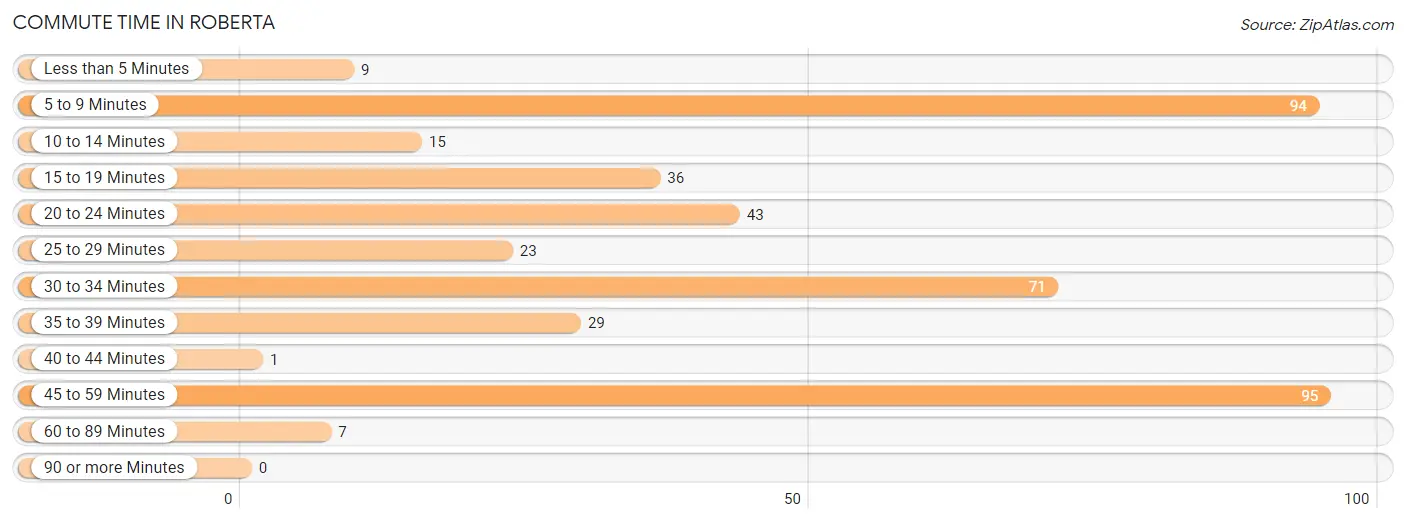
| Commute Time | # Commuters | % Commuters |
| Less than 5 Minutes | 9 | 2.1% |
| 5 to 9 Minutes | 94 | 22.2% |
| 10 to 14 Minutes | 15 | 3.5% |
| 15 to 19 Minutes | 36 | 8.5% |
| 20 to 24 Minutes | 43 | 10.2% |
| 25 to 29 Minutes | 23 | 5.4% |
| 30 to 34 Minutes | 71 | 16.8% |
| 35 to 39 Minutes | 29 | 6.9% |
| 40 to 44 Minutes | 1 | 0.2% |
| 45 to 59 Minutes | 95 | 22.5% |
| 60 to 89 Minutes | 7 | 1.7% |
| 90 or more Minutes | 0 | 0.0% |
Commute Time by Sex in Roberta
The most common commute times in Roberta are 5 to 9 minutes (72 commuters, 35.8%) for males and 45 to 59 minutes (74 commuters, 33.3%) for females.
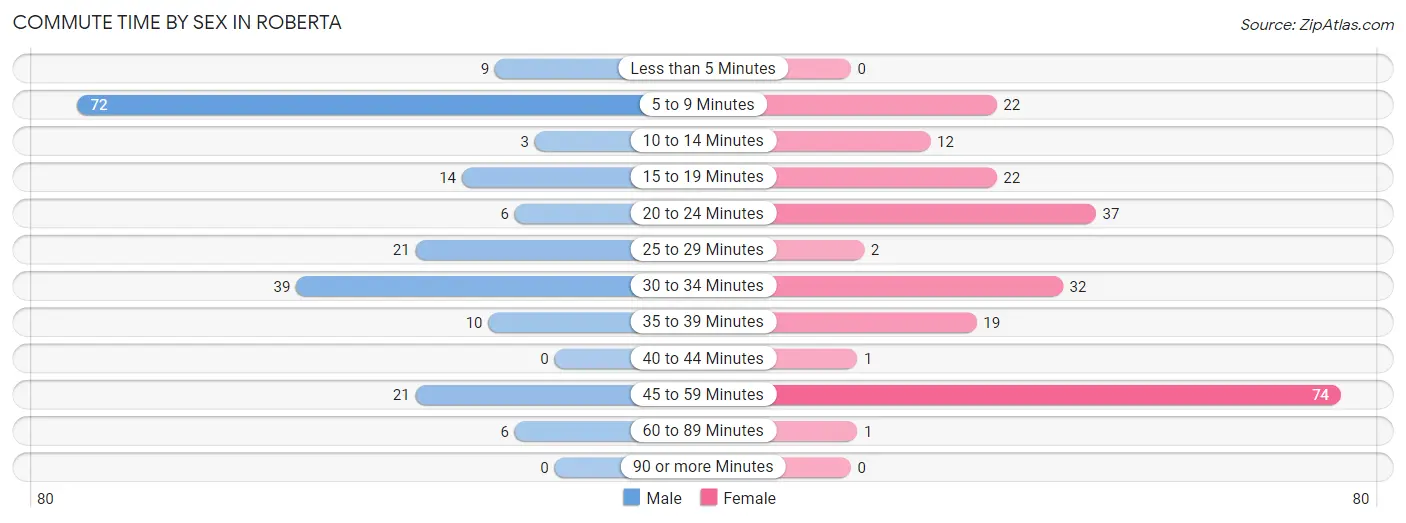
| Commute Time | Male | Female |
| Less than 5 Minutes | 9 (4.5%) | 0 (0.0%) |
| 5 to 9 Minutes | 72 (35.8%) | 22 (9.9%) |
| 10 to 14 Minutes | 3 (1.5%) | 12 (5.4%) |
| 15 to 19 Minutes | 14 (7.0%) | 22 (9.9%) |
| 20 to 24 Minutes | 6 (3.0%) | 37 (16.7%) |
| 25 to 29 Minutes | 21 (10.4%) | 2 (0.9%) |
| 30 to 34 Minutes | 39 (19.4%) | 32 (14.4%) |
| 35 to 39 Minutes | 10 (5.0%) | 19 (8.6%) |
| 40 to 44 Minutes | 0 (0.0%) | 1 (0.4%) |
| 45 to 59 Minutes | 21 (10.4%) | 74 (33.3%) |
| 60 to 89 Minutes | 6 (3.0%) | 1 (0.4%) |
| 90 or more Minutes | 0 (0.0%) | 0 (0.0%) |
Time of Departure to Work by Sex in Roberta
The most frequent times of departure to work in Roberta are 6:00 AM to 6:29 AM (50, 24.9%) for males and 7:00 AM to 7:29 AM (68, 30.6%) for females.
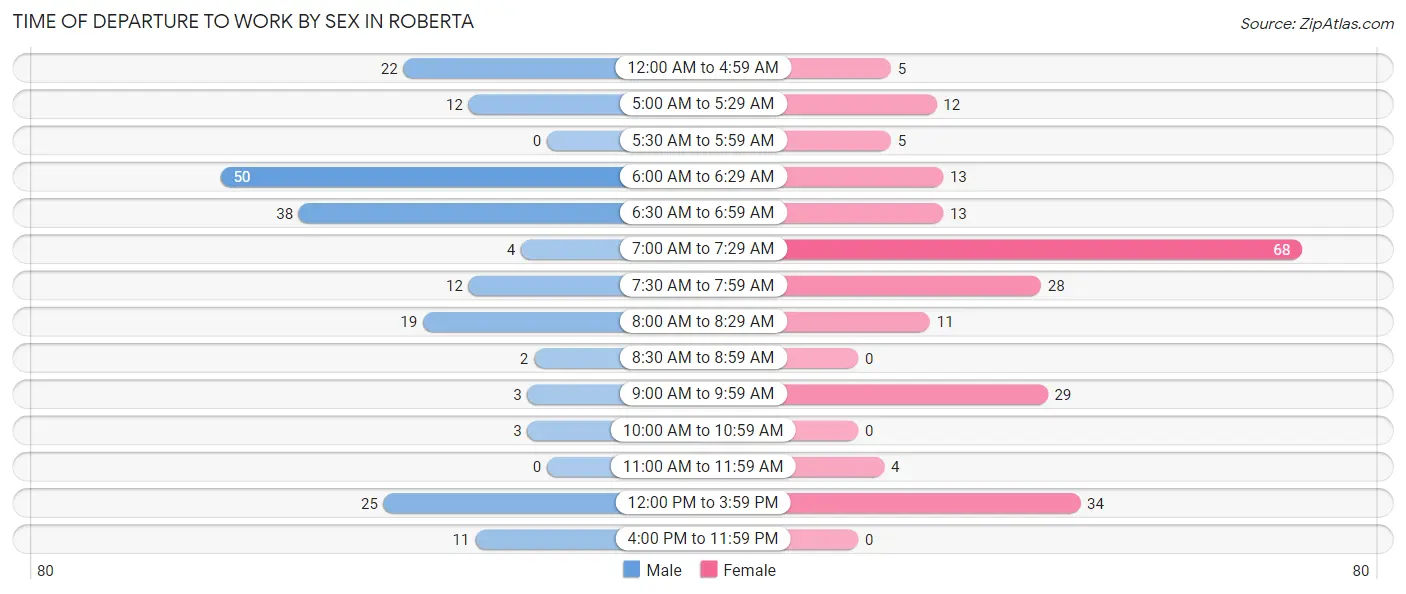
| Time of Departure | Male | Female |
| 12:00 AM to 4:59 AM | 22 (11.0%) | 5 (2.2%) |
| 5:00 AM to 5:29 AM | 12 (6.0%) | 12 (5.4%) |
| 5:30 AM to 5:59 AM | 0 (0.0%) | 5 (2.2%) |
| 6:00 AM to 6:29 AM | 50 (24.9%) | 13 (5.9%) |
| 6:30 AM to 6:59 AM | 38 (18.9%) | 13 (5.9%) |
| 7:00 AM to 7:29 AM | 4 (2.0%) | 68 (30.6%) |
| 7:30 AM to 7:59 AM | 12 (6.0%) | 28 (12.6%) |
| 8:00 AM to 8:29 AM | 19 (9.5%) | 11 (5.0%) |
| 8:30 AM to 8:59 AM | 2 (1.0%) | 0 (0.0%) |
| 9:00 AM to 9:59 AM | 3 (1.5%) | 29 (13.1%) |
| 10:00 AM to 10:59 AM | 3 (1.5%) | 0 (0.0%) |
| 11:00 AM to 11:59 AM | 0 (0.0%) | 4 (1.8%) |
| 12:00 PM to 3:59 PM | 25 (12.4%) | 34 (15.3%) |
| 4:00 PM to 11:59 PM | 11 (5.5%) | 0 (0.0%) |
| Total | 201 (100.0%) | 222 (100.0%) |
Housing Occupancy in Roberta
Occupancy by Ownership in Roberta
Of the total 464 dwellings in Roberta, owner-occupied units account for 175 (37.7%), while renter-occupied units make up 289 (62.3%).
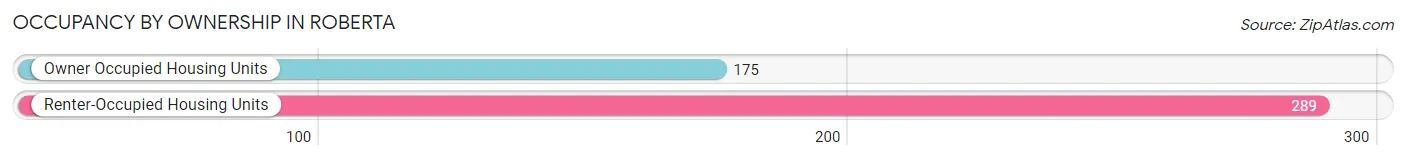
| Occupancy | # Housing Units | % Housing Units |
| Owner Occupied Housing Units | 175 | 37.7% |
| Renter-Occupied Housing Units | 289 | 62.3% |
| Total Occupied Housing Units | 464 | 100.0% |
Occupancy by Household Size in Roberta
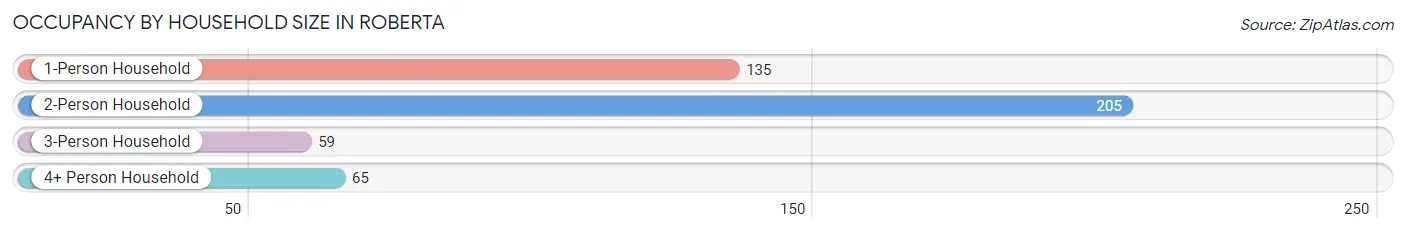
| Household Size | # Housing Units | % Housing Units |
| 1-Person Household | 135 | 29.1% |
| 2-Person Household | 205 | 44.2% |
| 3-Person Household | 59 | 12.7% |
| 4+ Person Household | 65 | 14.0% |
| Total Housing Units | 464 | 100.0% |
Occupancy by Ownership by Household Size in Roberta
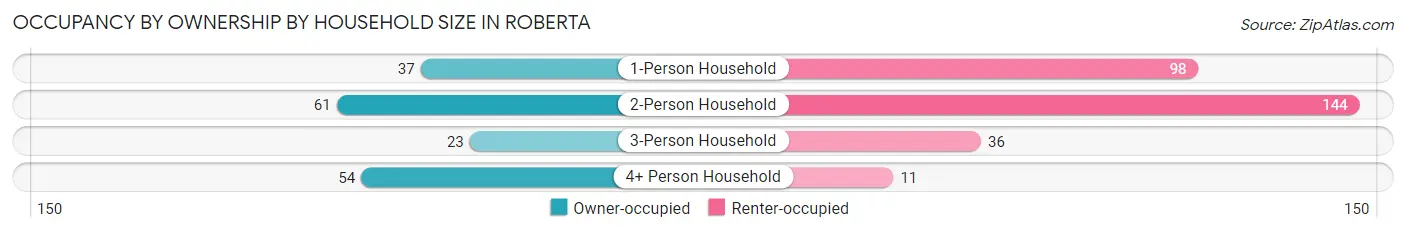
| Household Size | Owner-occupied | Renter-occupied |
| 1-Person Household | 37 (27.4%) | 98 (72.6%) |
| 2-Person Household | 61 (29.8%) | 144 (70.2%) |
| 3-Person Household | 23 (39.0%) | 36 (61.0%) |
| 4+ Person Household | 54 (83.1%) | 11 (16.9%) |
| Total Housing Units | 175 (37.7%) | 289 (62.3%) |
Occupancy by Educational Attainment in Roberta
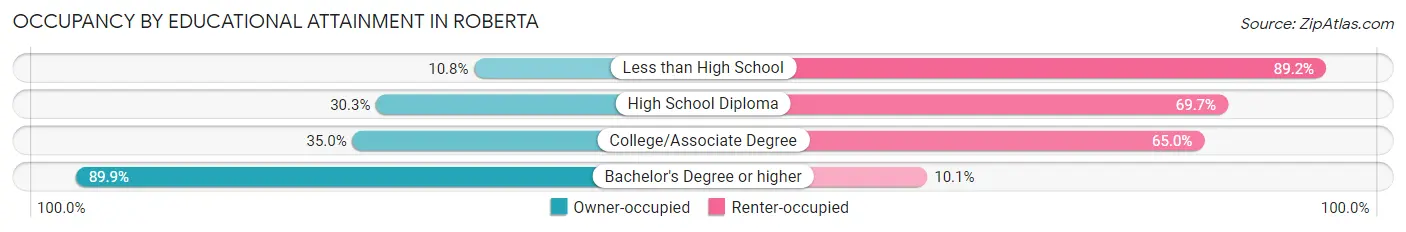
| Household Size | Owner-occupied | Renter-occupied |
| Less than High School | 9 (10.8%) | 74 (89.2%) |
| High School Diploma | 33 (30.3%) | 76 (69.7%) |
| College/Associate Degree | 71 (35.0%) | 132 (65.0%) |
| Bachelor's Degree or higher | 62 (89.9%) | 7 (10.1%) |
Occupancy by Age of Householder in Roberta
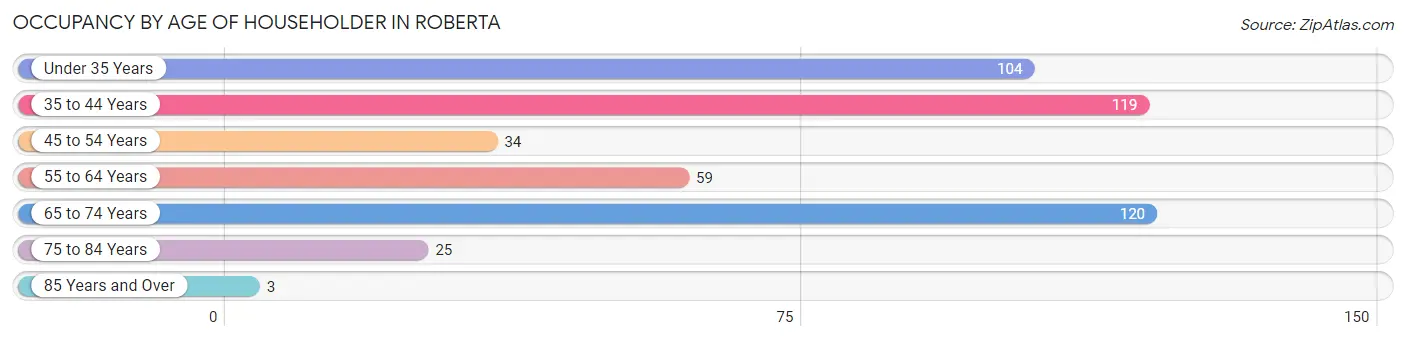
| Age Bracket | # Households | % Households |
| Under 35 Years | 104 | 22.4% |
| 35 to 44 Years | 119 | 25.7% |
| 45 to 54 Years | 34 | 7.3% |
| 55 to 64 Years | 59 | 12.7% |
| 65 to 74 Years | 120 | 25.9% |
| 75 to 84 Years | 25 | 5.4% |
| 85 Years and Over | 3 | 0.6% |
| Total | 464 | 100.0% |
Housing Finances in Roberta
Median Income by Occupancy in Roberta
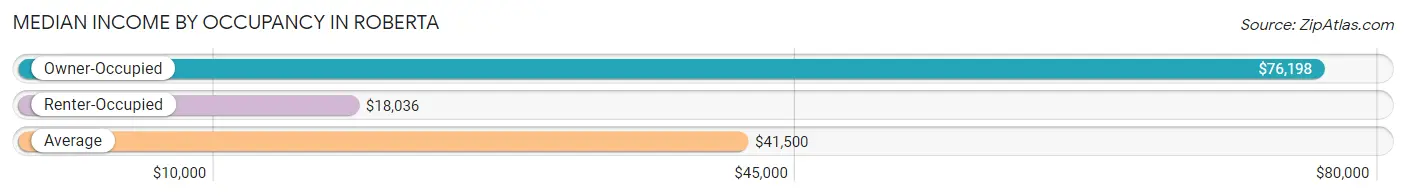
| Occupancy Type | # Households | Median Income |
| Owner-Occupied | 175 (37.7%) | $76,198 |
| Renter-Occupied | 289 (62.3%) | $18,036 |
| Average | 464 (100.0%) | $41,500 |
Occupancy by Householder Income Bracket in Roberta
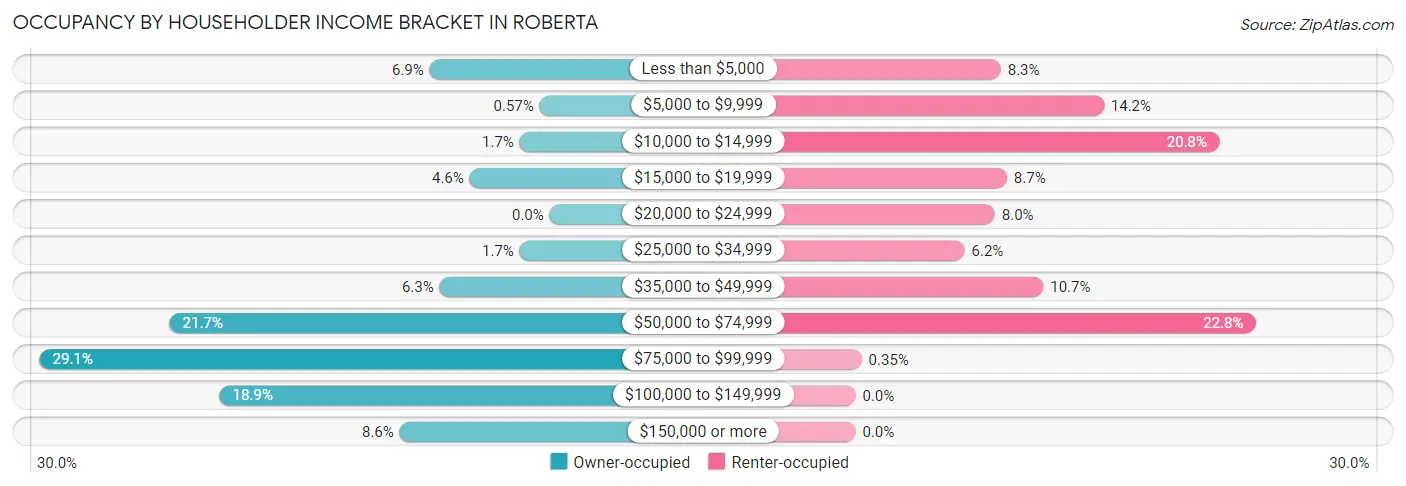
| Income Bracket | Owner-occupied | Renter-occupied |
| Less than $5,000 | 12 (6.9%) | 24 (8.3%) |
| $5,000 to $9,999 | 1 (0.6%) | 41 (14.2%) |
| $10,000 to $14,999 | 3 (1.7%) | 60 (20.8%) |
| $15,000 to $19,999 | 8 (4.6%) | 25 (8.6%) |
| $20,000 to $24,999 | 0 (0.0%) | 23 (8.0%) |
| $25,000 to $34,999 | 3 (1.7%) | 18 (6.2%) |
| $35,000 to $49,999 | 11 (6.3%) | 31 (10.7%) |
| $50,000 to $74,999 | 38 (21.7%) | 66 (22.8%) |
| $75,000 to $99,999 | 51 (29.1%) | 1 (0.4%) |
| $100,000 to $149,999 | 33 (18.9%) | 0 (0.0%) |
| $150,000 or more | 15 (8.6%) | 0 (0.0%) |
| Total | 175 (100.0%) | 289 (100.0%) |
Monthly Housing Cost Tiers in Roberta
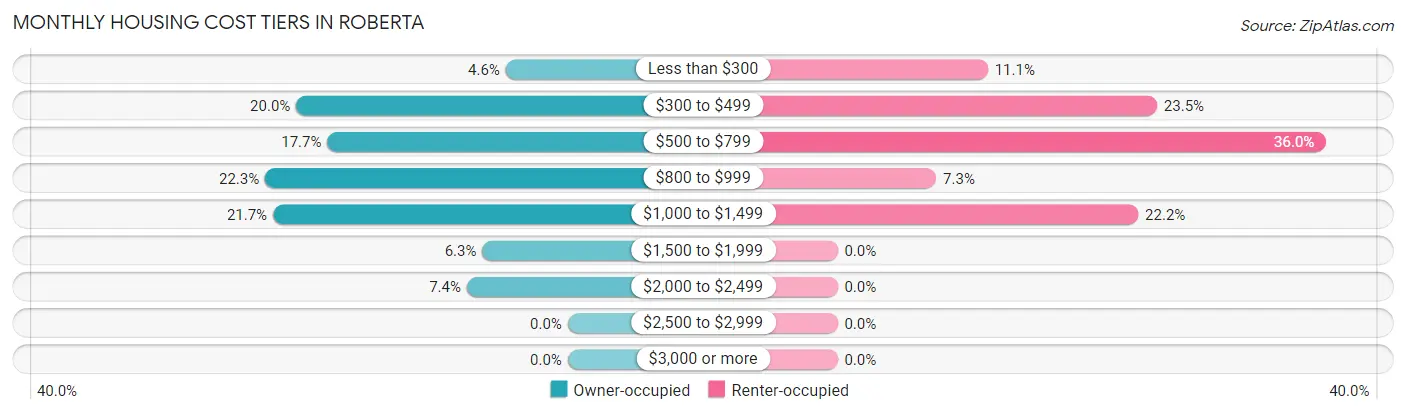
| Monthly Cost | Owner-occupied | Renter-occupied |
| Less than $300 | 8 (4.6%) | 32 (11.1%) |
| $300 to $499 | 35 (20.0%) | 68 (23.5%) |
| $500 to $799 | 31 (17.7%) | 104 (36.0%) |
| $800 to $999 | 39 (22.3%) | 21 (7.3%) |
| $1,000 to $1,499 | 38 (21.7%) | 64 (22.2%) |
| $1,500 to $1,999 | 11 (6.3%) | 0 (0.0%) |
| $2,000 to $2,499 | 13 (7.4%) | 0 (0.0%) |
| $2,500 to $2,999 | 0 (0.0%) | 0 (0.0%) |
| $3,000 or more | 0 (0.0%) | 0 (0.0%) |
| Total | 175 (100.0%) | 289 (100.0%) |
Physical Housing Characteristics in Roberta
Housing Structures in Roberta
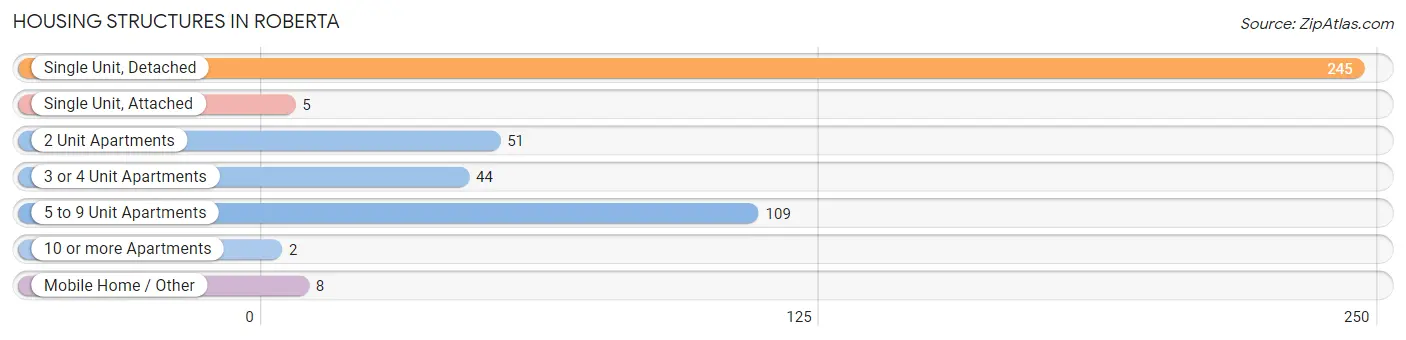
| Structure Type | # Housing Units | % Housing Units |
| Single Unit, Detached | 245 | 52.8% |
| Single Unit, Attached | 5 | 1.1% |
| 2 Unit Apartments | 51 | 11.0% |
| 3 or 4 Unit Apartments | 44 | 9.5% |
| 5 to 9 Unit Apartments | 109 | 23.5% |
| 10 or more Apartments | 2 | 0.4% |
| Mobile Home / Other | 8 | 1.7% |
| Total | 464 | 100.0% |
Housing Structures by Occupancy in Roberta
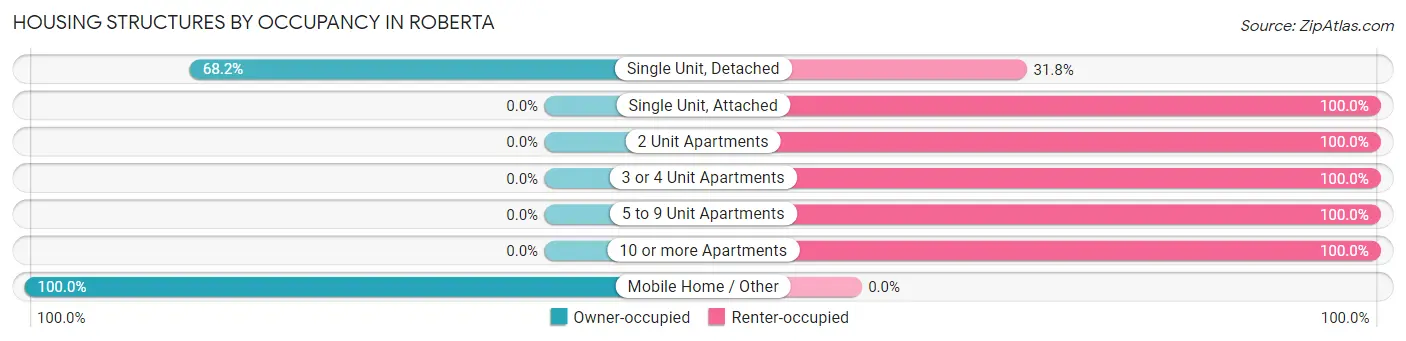
| Structure Type | Owner-occupied | Renter-occupied |
| Single Unit, Detached | 167 (68.2%) | 78 (31.8%) |
| Single Unit, Attached | 0 (0.0%) | 5 (100.0%) |
| 2 Unit Apartments | 0 (0.0%) | 51 (100.0%) |
| 3 or 4 Unit Apartments | 0 (0.0%) | 44 (100.0%) |
| 5 to 9 Unit Apartments | 0 (0.0%) | 109 (100.0%) |
| 10 or more Apartments | 0 (0.0%) | 2 (100.0%) |
| Mobile Home / Other | 8 (100.0%) | 0 (0.0%) |
| Total | 175 (37.7%) | 289 (62.3%) |
Housing Structures by Number of Rooms in Roberta
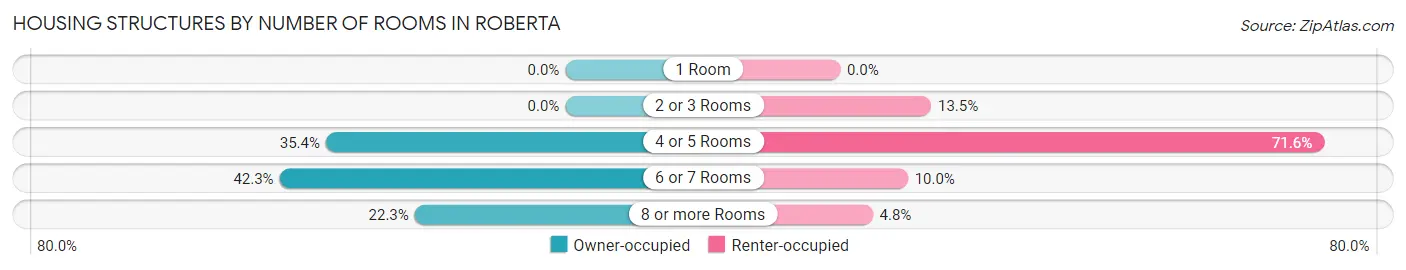
| Number of Rooms | Owner-occupied | Renter-occupied |
| 1 Room | 0 (0.0%) | 0 (0.0%) |
| 2 or 3 Rooms | 0 (0.0%) | 39 (13.5%) |
| 4 or 5 Rooms | 62 (35.4%) | 207 (71.6%) |
| 6 or 7 Rooms | 74 (42.3%) | 29 (10.0%) |
| 8 or more Rooms | 39 (22.3%) | 14 (4.8%) |
| Total | 175 (100.0%) | 289 (100.0%) |
Housing Structure by Heating Type in Roberta

| Heating Type | Owner-occupied | Renter-occupied |
| Utility Gas | 75 (42.9%) | 11 (3.8%) |
| Bottled, Tank, or LP Gas | 3 (1.7%) | 0 (0.0%) |
| Electricity | 86 (49.1%) | 278 (96.2%) |
| Fuel Oil or Kerosene | 0 (0.0%) | 0 (0.0%) |
| Coal or Coke | 0 (0.0%) | 0 (0.0%) |
| All other Fuels | 11 (6.3%) | 0 (0.0%) |
| No Fuel Used | 0 (0.0%) | 0 (0.0%) |
| Total | 175 (100.0%) | 289 (100.0%) |
Household Vehicle Usage in Roberta
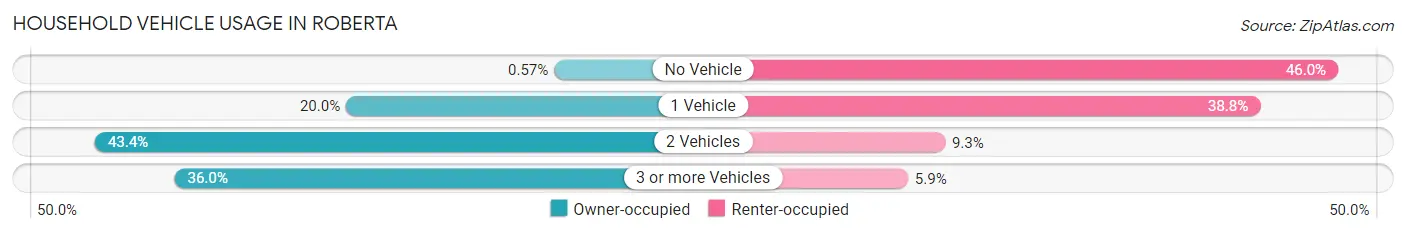
| Vehicles per Household | Owner-occupied | Renter-occupied |
| No Vehicle | 1 (0.6%) | 133 (46.0%) |
| 1 Vehicle | 35 (20.0%) | 112 (38.8%) |
| 2 Vehicles | 76 (43.4%) | 27 (9.3%) |
| 3 or more Vehicles | 63 (36.0%) | 17 (5.9%) |
| Total | 175 (100.0%) | 289 (100.0%) |
Real Estate & Mortgages in Roberta
Real Estate and Mortgage Overview in Roberta
| Characteristic | Without Mortgage | With Mortgage |
| Housing Units | 81 | 94 |
| Median Property Value | $133,700 | $150,000 |
| Median Household Income | $65,625 | $15 |
| Monthly Housing Costs | $508 | $0 |
| Real Estate Taxes | $1,192 | $0 |
Property Value by Mortgage Status in Roberta
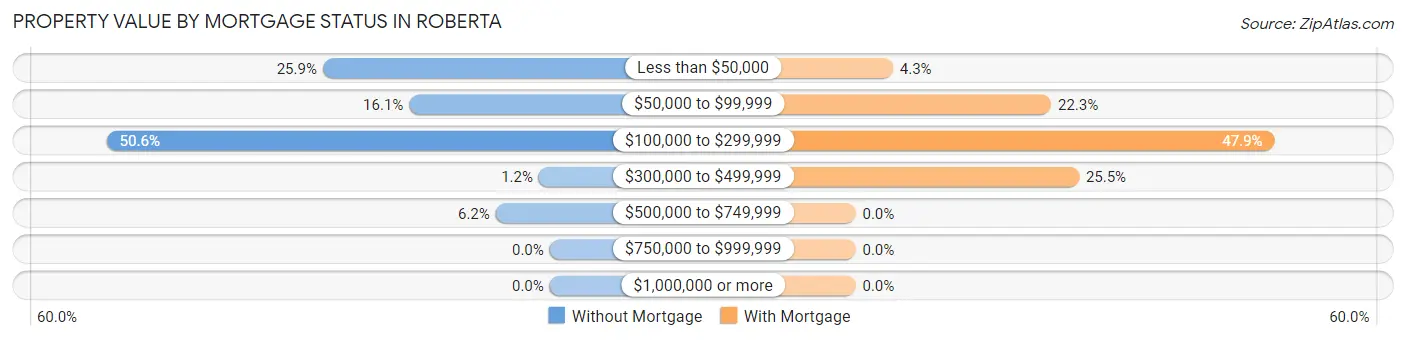
| Property Value | Without Mortgage | With Mortgage |
| Less than $50,000 | 21 (25.9%) | 4 (4.3%) |
| $50,000 to $99,999 | 13 (16.1%) | 21 (22.3%) |
| $100,000 to $299,999 | 41 (50.6%) | 45 (47.9%) |
| $300,000 to $499,999 | 1 (1.2%) | 24 (25.5%) |
| $500,000 to $749,999 | 5 (6.2%) | 0 (0.0%) |
| $750,000 to $999,999 | 0 (0.0%) | 0 (0.0%) |
| $1,000,000 or more | 0 (0.0%) | 0 (0.0%) |
| Total | 81 (100.0%) | 94 (100.0%) |
Household Income by Mortgage Status in Roberta
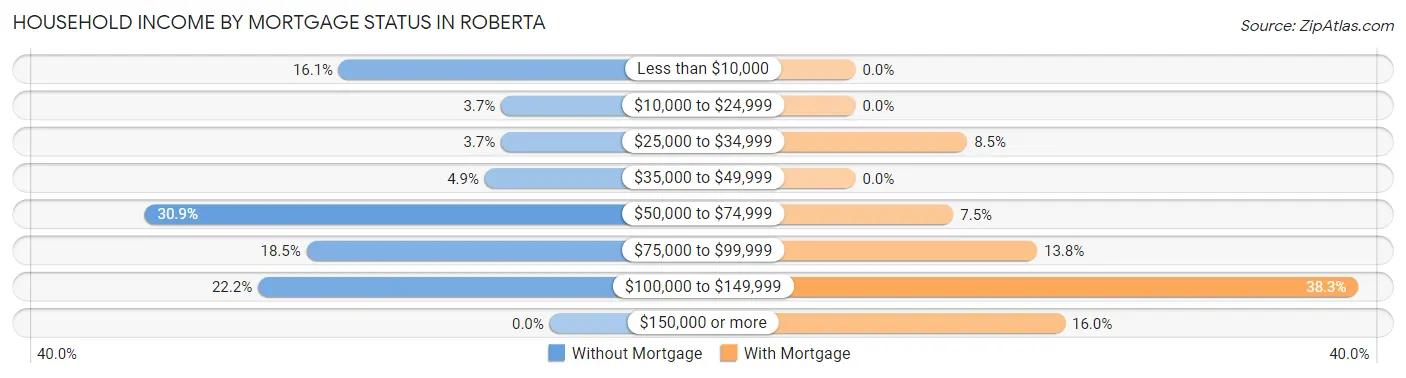
| Household Income | Without Mortgage | With Mortgage |
| Less than $10,000 | 13 (16.1%) | 0 (0.0%) |
| $10,000 to $24,999 | 3 (3.7%) | 0 (0.0%) |
| $25,000 to $34,999 | 3 (3.7%) | 8 (8.5%) |
| $35,000 to $49,999 | 4 (4.9%) | 0 (0.0%) |
| $50,000 to $74,999 | 25 (30.9%) | 7 (7.4%) |
| $75,000 to $99,999 | 15 (18.5%) | 13 (13.8%) |
| $100,000 to $149,999 | 18 (22.2%) | 36 (38.3%) |
| $150,000 or more | 0 (0.0%) | 15 (16.0%) |
| Total | 81 (100.0%) | 94 (100.0%) |
Property Value to Household Income Ratio in Roberta
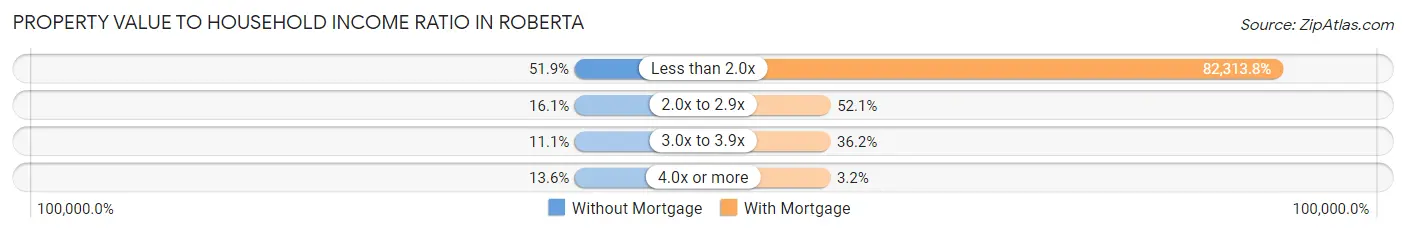
| Value-to-Income Ratio | Without Mortgage | With Mortgage |
| Less than 2.0x | 42 (51.8%) | 77,375 (82,313.8%) |
| 2.0x to 2.9x | 13 (16.1%) | 49 (52.1%) |
| 3.0x to 3.9x | 9 (11.1%) | 34 (36.2%) |
| 4.0x or more | 11 (13.6%) | 3 (3.2%) |
| Total | 81 (100.0%) | 94 (100.0%) |
Real Estate Taxes by Mortgage Status in Roberta
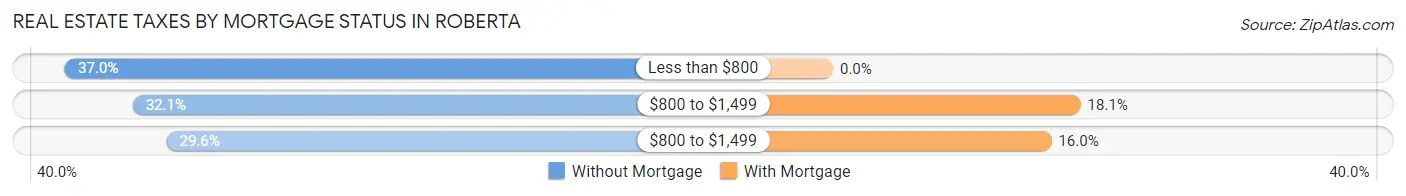
| Property Taxes | Without Mortgage | With Mortgage |
| Less than $800 | 30 (37.0%) | 0 (0.0%) |
| $800 to $1,499 | 26 (32.1%) | 17 (18.1%) |
| $800 to $1,499 | 24 (29.6%) | 15 (16.0%) |
| Total | 81 (100.0%) | 94 (100.0%) |
Health & Disability in Roberta
Health Insurance Coverage by Age in Roberta
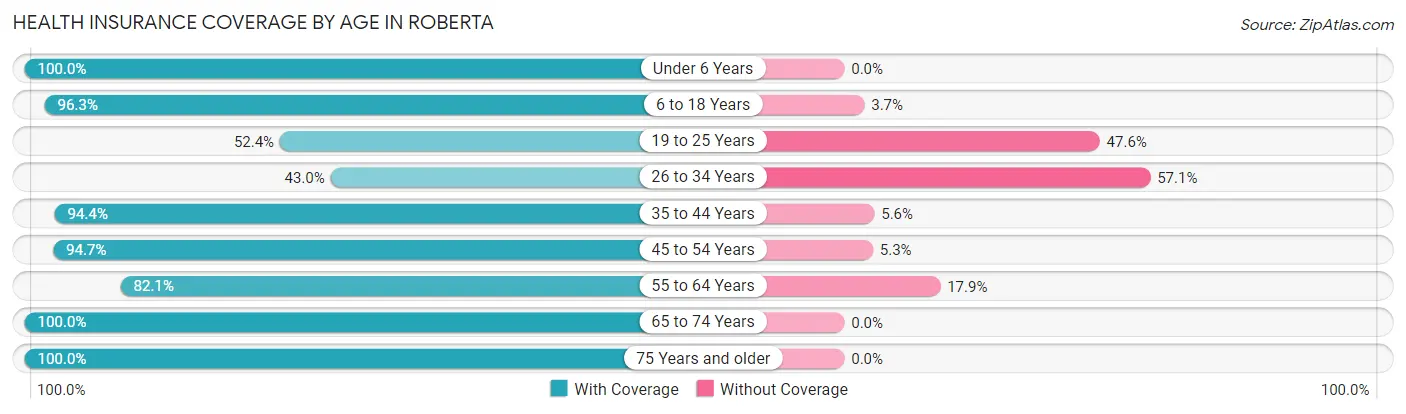
| Age Bracket | With Coverage | Without Coverage |
| Under 6 Years | 33 (100.0%) | 0 (0.0%) |
| 6 to 18 Years | 491 (96.3%) | 19 (3.7%) |
| 19 to 25 Years | 55 (52.4%) | 50 (47.6%) |
| 26 to 34 Years | 64 (42.9%) | 85 (57.1%) |
| 35 to 44 Years | 169 (94.4%) | 10 (5.6%) |
| 45 to 54 Years | 89 (94.7%) | 5 (5.3%) |
| 55 to 64 Years | 78 (82.1%) | 17 (17.9%) |
| 65 to 74 Years | 140 (100.0%) | 0 (0.0%) |
| 75 Years and older | 63 (100.0%) | 0 (0.0%) |
| Total | 1,182 (86.4%) | 186 (13.6%) |
Health Insurance Coverage by Citizenship Status in Roberta
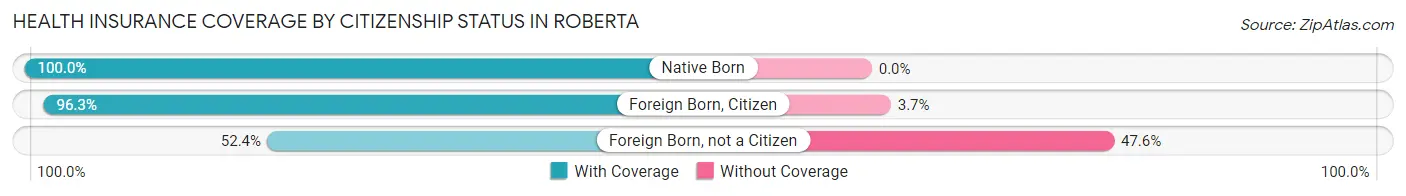
| Citizenship Status | With Coverage | Without Coverage |
| Native Born | 33 (100.0%) | 0 (0.0%) |
| Foreign Born, Citizen | 491 (96.3%) | 19 (3.7%) |
| Foreign Born, not a Citizen | 55 (52.4%) | 50 (47.6%) |
Health Insurance Coverage by Household Income in Roberta
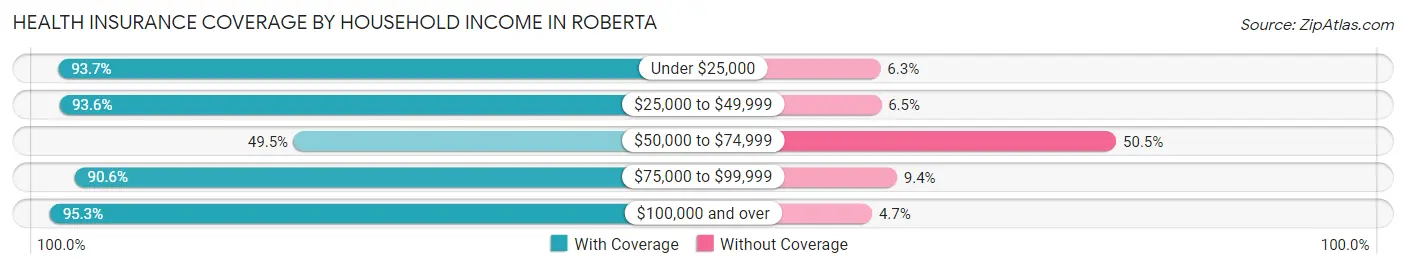
| Household Income | With Coverage | Without Coverage |
| Under $25,000 | 446 (93.7%) | 30 (6.3%) |
| $25,000 to $49,999 | 203 (93.5%) | 14 (6.5%) |
| $50,000 to $74,999 | 108 (49.5%) | 110 (50.5%) |
| $75,000 to $99,999 | 203 (90.6%) | 21 (9.4%) |
| $100,000 and over | 222 (95.3%) | 11 (4.7%) |
Public vs Private Health Insurance Coverage by Age in Roberta
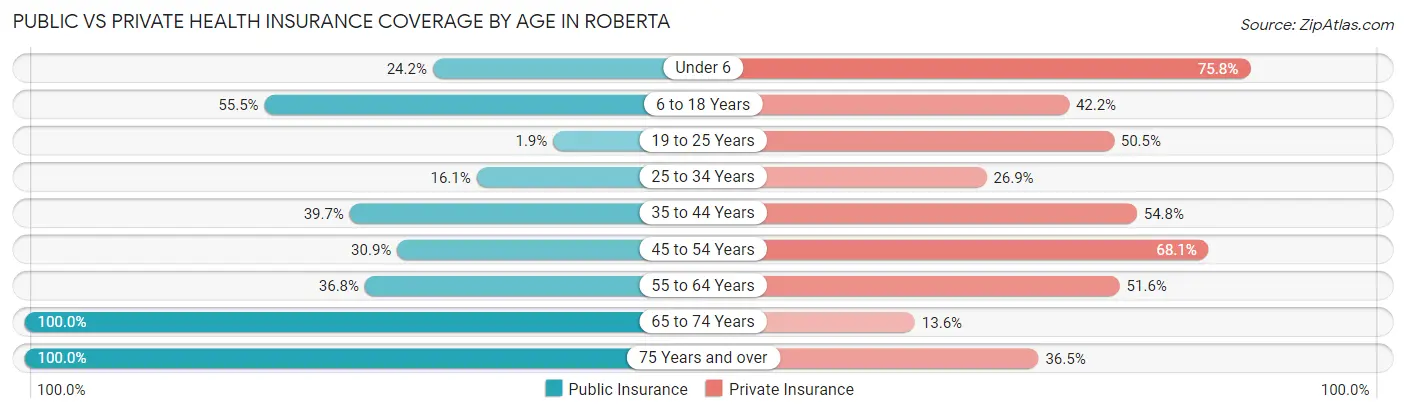
| Age Bracket | Public Insurance | Private Insurance |
| Under 6 | 8 (24.2%) | 25 (75.8%) |
| 6 to 18 Years | 283 (55.5%) | 215 (42.2%) |
| 19 to 25 Years | 2 (1.9%) | 53 (50.5%) |
| 25 to 34 Years | 24 (16.1%) | 40 (26.9%) |
| 35 to 44 Years | 71 (39.7%) | 98 (54.7%) |
| 45 to 54 Years | 29 (30.8%) | 64 (68.1%) |
| 55 to 64 Years | 35 (36.8%) | 49 (51.6%) |
| 65 to 74 Years | 140 (100.0%) | 19 (13.6%) |
| 75 Years and over | 63 (100.0%) | 23 (36.5%) |
| Total | 655 (47.9%) | 586 (42.8%) |
Disability Status by Sex by Age in Roberta
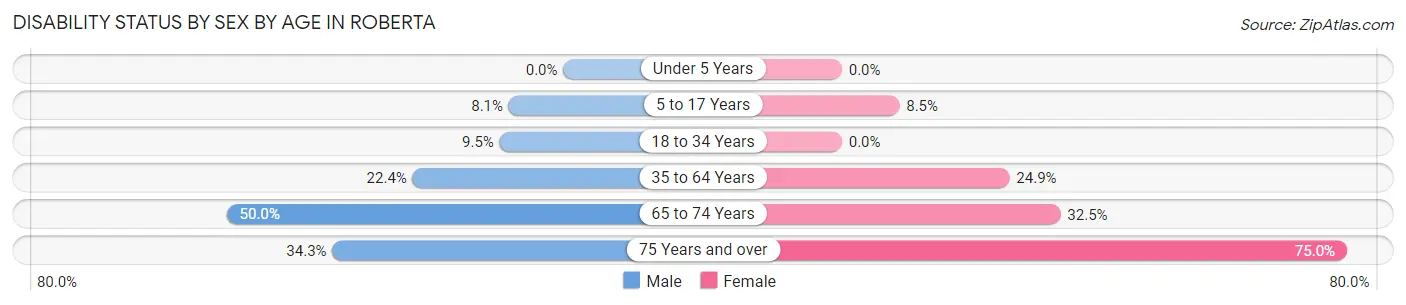
| Age Bracket | Male | Female |
| Under 5 Years | 0 (0.0%) | 0 (0.0%) |
| 5 to 17 Years | 14 (8.1%) | 27 (8.5%) |
| 18 to 34 Years | 14 (9.5%) | 0 (0.0%) |
| 35 to 64 Years | 32 (22.4%) | 56 (24.9%) |
| 65 to 74 Years | 13 (50.0%) | 37 (32.5%) |
| 75 Years and over | 12 (34.3%) | 21 (75.0%) |
Disability Class by Sex by Age in Roberta
Disability Class: Hearing Difficulty
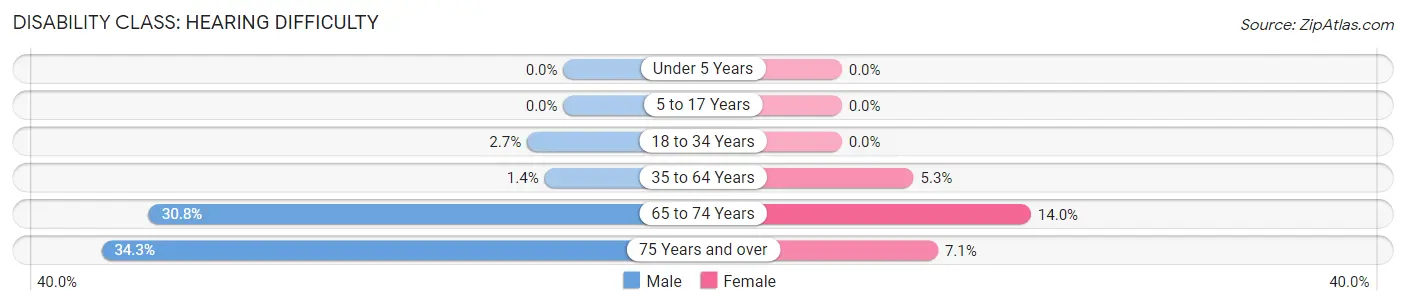
| Age Bracket | Male | Female |
| Under 5 Years | 0 (0.0%) | 0 (0.0%) |
| 5 to 17 Years | 0 (0.0%) | 0 (0.0%) |
| 18 to 34 Years | 4 (2.7%) | 0 (0.0%) |
| 35 to 64 Years | 2 (1.4%) | 12 (5.3%) |
| 65 to 74 Years | 8 (30.8%) | 16 (14.0%) |
| 75 Years and over | 12 (34.3%) | 2 (7.1%) |
Disability Class: Vision Difficulty
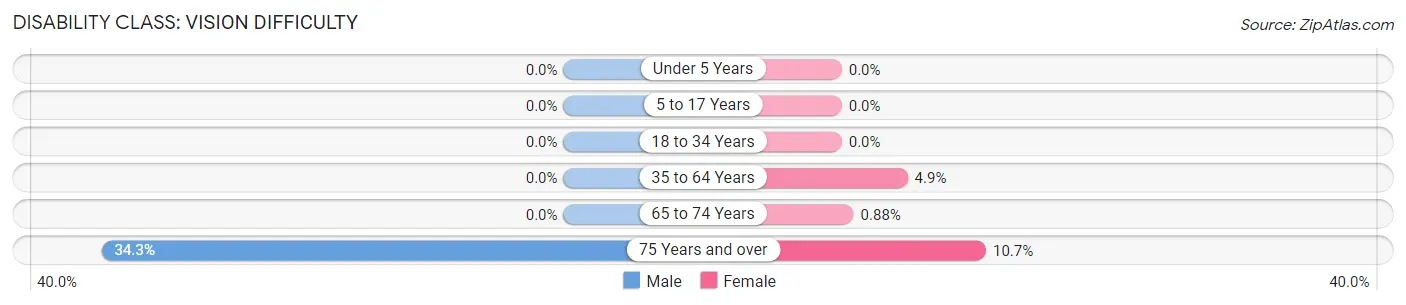
| Age Bracket | Male | Female |
| Under 5 Years | 0 (0.0%) | 0 (0.0%) |
| 5 to 17 Years | 0 (0.0%) | 0 (0.0%) |
| 18 to 34 Years | 0 (0.0%) | 0 (0.0%) |
| 35 to 64 Years | 0 (0.0%) | 11 (4.9%) |
| 65 to 74 Years | 0 (0.0%) | 1 (0.9%) |
| 75 Years and over | 12 (34.3%) | 3 (10.7%) |
Disability Class: Cognitive Difficulty
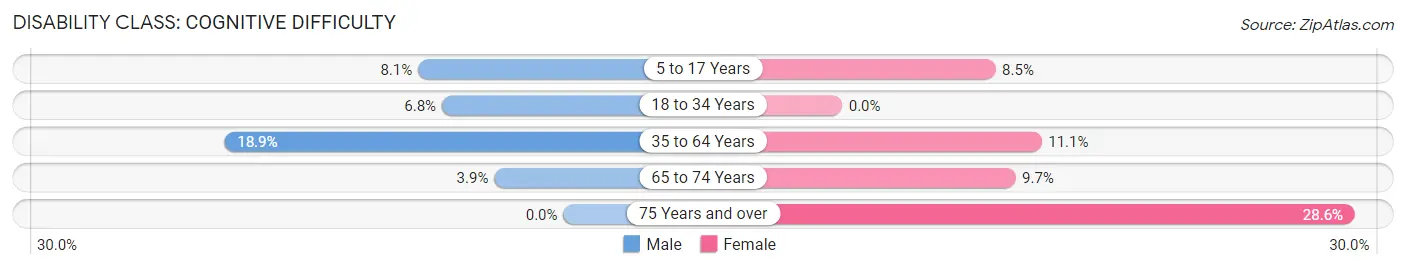
| Age Bracket | Male | Female |
| 5 to 17 Years | 14 (8.1%) | 27 (8.5%) |
| 18 to 34 Years | 10 (6.8%) | 0 (0.0%) |
| 35 to 64 Years | 27 (18.9%) | 25 (11.1%) |
| 65 to 74 Years | 1 (3.8%) | 11 (9.7%) |
| 75 Years and over | 0 (0.0%) | 8 (28.6%) |
Disability Class: Ambulatory Difficulty
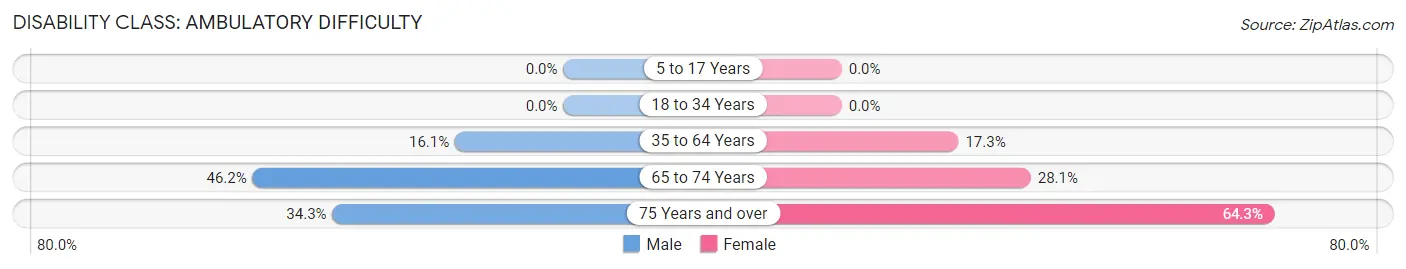
| Age Bracket | Male | Female |
| 5 to 17 Years | 0 (0.0%) | 0 (0.0%) |
| 18 to 34 Years | 0 (0.0%) | 0 (0.0%) |
| 35 to 64 Years | 23 (16.1%) | 39 (17.3%) |
| 65 to 74 Years | 12 (46.2%) | 32 (28.1%) |
| 75 Years and over | 12 (34.3%) | 18 (64.3%) |
Disability Class: Self-Care Difficulty
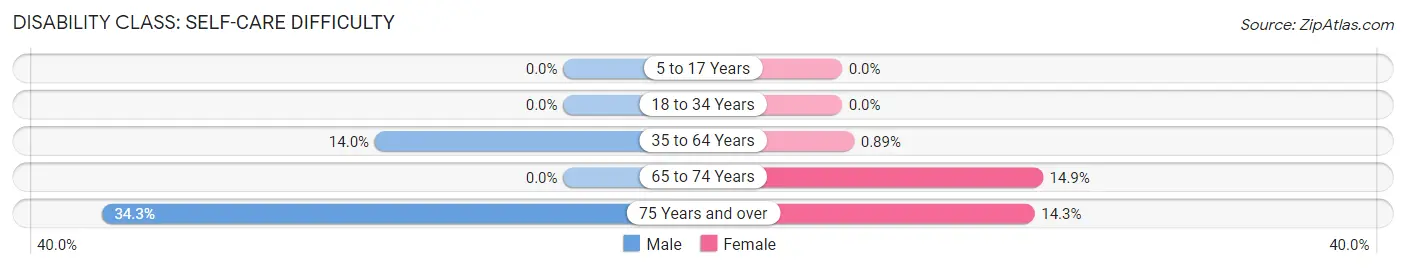
| Age Bracket | Male | Female |
| 5 to 17 Years | 0 (0.0%) | 0 (0.0%) |
| 18 to 34 Years | 0 (0.0%) | 0 (0.0%) |
| 35 to 64 Years | 20 (14.0%) | 2 (0.9%) |
| 65 to 74 Years | 0 (0.0%) | 17 (14.9%) |
| 75 Years and over | 12 (34.3%) | 4 (14.3%) |
Technology Access in Roberta
Computing Device Access in Roberta
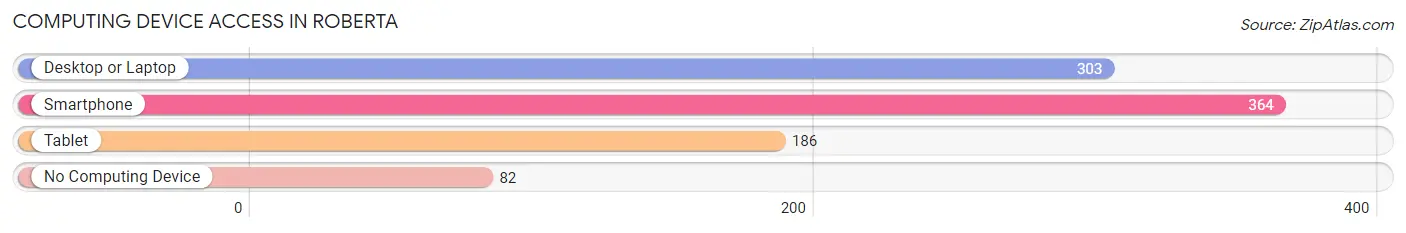
| Device Type | # Households | % Households |
| Desktop or Laptop | 303 | 65.3% |
| Smartphone | 364 | 78.4% |
| Tablet | 186 | 40.1% |
| No Computing Device | 82 | 17.7% |
| Total | 464 | 100.0% |
Internet Access in Roberta
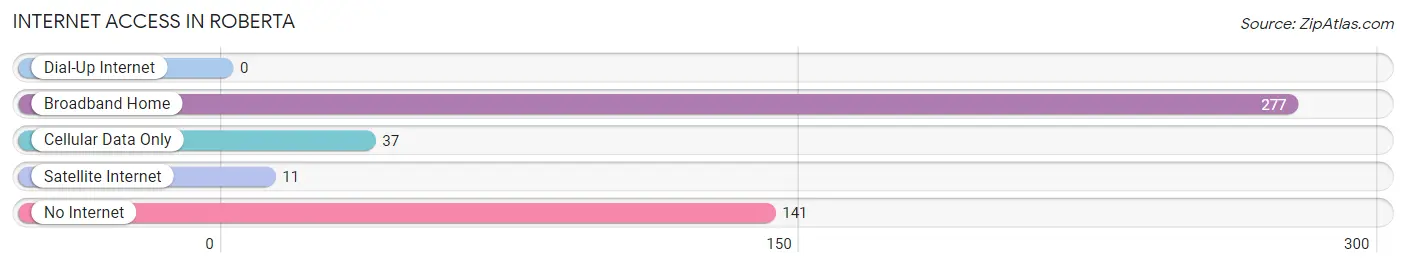
| Internet Type | # Households | % Households |
| Dial-Up Internet | 0 | 0.0% |
| Broadband Home | 277 | 59.7% |
| Cellular Data Only | 37 | 8.0% |
| Satellite Internet | 11 | 2.4% |
| No Internet | 141 | 30.4% |
| Total | 464 | 100.0% |
Roberta Summary
Roberta, Georgia is a small town located in Crawford County, Georgia. It is situated about halfway between Macon and Columbus, Georgia, and is part of the Macon Metropolitan Statistical Area. The town was founded in 1854 and was named after Roberta, the daughter of a local landowner. The population of Roberta was 1,845 as of the 2010 census.
Geography
Roberta is located at 32°45'25" North, 84°14'45" West (32.7569, -84.2458). The town is situated in the Piedmont region of Georgia, and is located in the Flint River watershed. The town is located on the western edge of Crawford County, and is bordered by Talbot County to the west, Taylor County to the north, and Peach County to the south. The town is located about halfway between Macon and Columbus, Georgia, and is part of the Macon Metropolitan Statistical Area.
The town has a total area of 2.2 square miles, all of which is land. The town is located in a hilly area, and is surrounded by forests and farmland. The town is located near the Flint River, which is a major tributary of the Chattahoochee River.
History
Roberta was founded in 1854 and was named after Roberta, the daughter of a local landowner. The town was originally a small farming community, and the main crops grown in the area were cotton and corn. The town was also home to several sawmills and gristmills.
In the late 19th century, the town began to grow and develop. The town was incorporated in 1891, and the first mayor was elected in 1892. The town was connected to the railroad in 1895, and the first post office was established in 1896.
In the early 20th century, the town continued to grow and develop. The town was home to several businesses, including a bank, a hotel, a movie theater, and several stores. The town also had a school, a library, and a hospital.
Economy
The economy of Roberta is largely based on agriculture and manufacturing. The town is home to several farms, which produce cotton, corn, soybeans, and other crops. The town is also home to several manufacturing companies, which produce a variety of products, including furniture, textiles, and automotive parts.
The town is also home to several retail stores, restaurants, and other businesses. The town is served by several major highways, including Interstate 75, which runs through the town.
Demographics
As of the 2010 census, the population of Roberta was 1,845. The racial makeup of the town was 79.2% White, 17.7% African American, 0.3% Native American, 0.3% Asian, 0.1% Pacific Islander, 0.7% from other races, and 1.9% from two or more races. Hispanic or Latino of any race were 2.2% of the population.
The median household income in Roberta was $30,938, and the median family income was $37,917. The per capita income in the town was $15,945. About 17.2% of the population was below the poverty line.
Common Questions
What is Per Capita Income in Roberta?
Per Capita income in Roberta is $17,392.
What is the Median Family Income in Roberta?
Median Family Income in Roberta is $48,250.
What is the Median Household income in Roberta?
Median Household Income in Roberta is $41,500.
What is Income or Wage Gap in Roberta?
Income or Wage Gap in Roberta is 65.0%.
Women in Roberta earn 35.0 cents for every dollar earned by a man.
What is Family Income Deficit in Roberta?
Family Income Deficit in Roberta is $9,821.
Families that are below poverty line in Roberta earn $9,821 less on average than the poverty threshold level.
What is Inequality or Gini Index in Roberta?
Inequality or Gini Index in Roberta is 0.47.
What is the Total Population of Roberta?
Total Population of Roberta is 1,462.
What is the Total Male Population of Roberta?
Total Male Population of Roberta is 567.
What is the Total Female Population of Roberta?
Total Female Population of Roberta is 895.
What is the Ratio of Males per 100 Females in Roberta?
There are 63.35 Males per 100 Females in Roberta.
What is the Ratio of Females per 100 Males in Roberta?
There are 157.85 Females per 100 Males in Roberta.
What is the Median Population Age in Roberta?
Median Population Age in Roberta is 30.3 Years.
What is the Average Family Size in Roberta
Average Family Size in Roberta is 4.0 People.
What is the Average Household Size in Roberta
Average Household Size in Roberta is 3.0 People.
How Large is the Labor Force in Roberta?
There are 515 People in the Labor Forcein in Roberta.
What is the Percentage of People in the Labor Force in Roberta?
50.3% of People are in the Labor Force in Roberta.
What is the Unemployment Rate in Roberta?
Unemployment Rate in Roberta is 12.5%.