Ideal, GA Map & Demographics
Ideal Map
Ideal Overview
$10,839
PER CAPITA INCOME
$23,375
AVG FAMILY INCOME
$21,800
AVG HOUSEHOLD INCOME
0.39
INEQUALITY / GINI INDEX
625
TOTAL POPULATION
187
MALE POPULATION
438
FEMALE POPULATION
42.69
MALES / 100 FEMALES
234.22
FEMALES / 100 MALES
39.0
MEDIAN AGE
3.8
AVG FAMILY SIZE
3.0
AVG HOUSEHOLD SIZE
168
LABOR FORCE [ PEOPLE ]
35.6%
PERCENT IN LABOR FORCE
6.5%
UNEMPLOYMENT RATE
Ideal Zip Codes
Ideal Area Codes
Income in Ideal
Income Overview in Ideal
Per Capita Income in Ideal is $10,839, while median incomes of families and households are $23,375 and $21,800 respectively.
| Characteristic | Number | Measure |
| Per Capita Income | 625 | $10,839 |
| Median Family Income | 123 | $23,375 |
| Mean Family Income | 123 | $32,668 |
| Median Household Income | 182 | $21,800 |
| Mean Household Income | 182 | $29,190 |
| Income Deficit | 123 | $0 |
| Wage / Income Gap (%) | 625 | 0.00% |
| Wage / Income Gap ($) | 625 | 100.00¢ per $1 |
| Gini / Inequality Index | 625 | 0.39 |
Earnings by Sex in Ideal
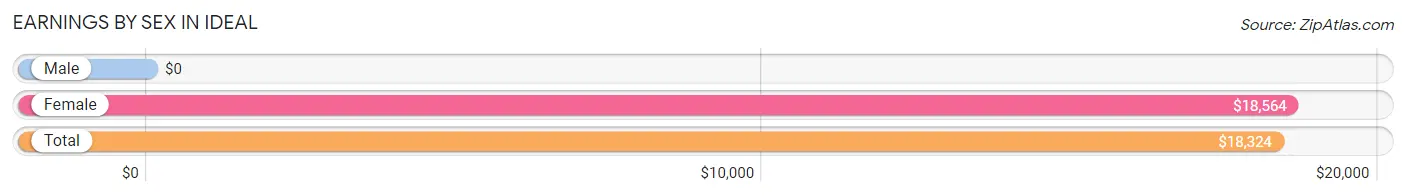
| Sex | Number | Average Earnings |
| Male | 23 (14.3%) | $0 |
| Female | 138 (85.7%) | $18,564 |
| Total | 161 (100.0%) | $18,324 |
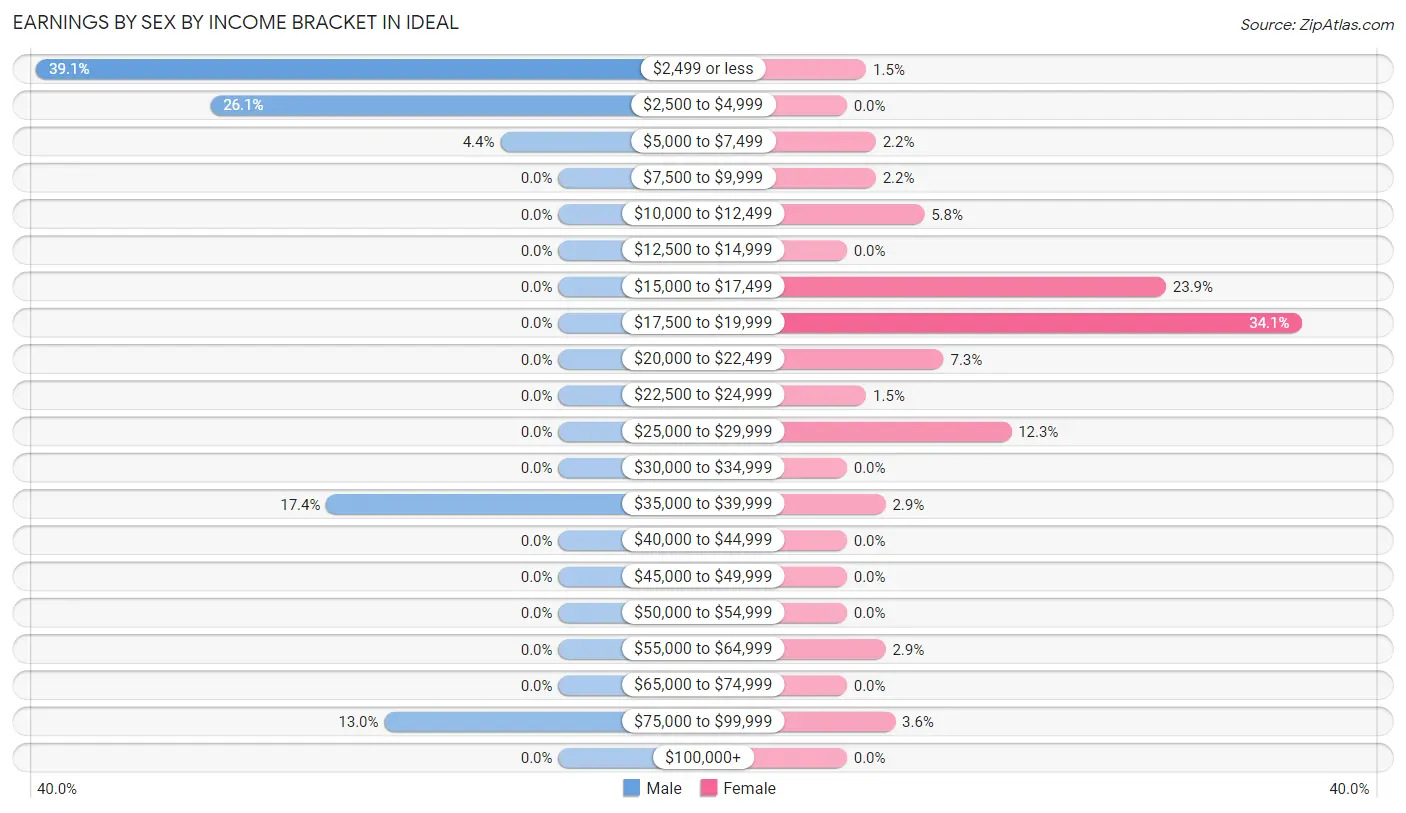
Earnings by Sex by Income Bracket in Ideal
The most common earnings brackets in Ideal are $2,499 or less for men (9 | 39.1%) and $17,500 to $19,999 for women (47 | 34.1%).
| Income | Male | Female |
| $2,499 or less | 9 (39.1%) | 2 (1.5%) |
| $2,500 to $4,999 | 6 (26.1%) | 0 (0.0%) |
| $5,000 to $7,499 | 1 (4.3%) | 3 (2.2%) |
| $7,500 to $9,999 | 0 (0.0%) | 3 (2.2%) |
| $10,000 to $12,499 | 0 (0.0%) | 8 (5.8%) |
| $12,500 to $14,999 | 0 (0.0%) | 0 (0.0%) |
| $15,000 to $17,499 | 0 (0.0%) | 33 (23.9%) |
| $17,500 to $19,999 | 0 (0.0%) | 47 (34.1%) |
| $20,000 to $22,499 | 0 (0.0%) | 10 (7.2%) |
| $22,500 to $24,999 | 0 (0.0%) | 2 (1.5%) |
| $25,000 to $29,999 | 0 (0.0%) | 17 (12.3%) |
| $30,000 to $34,999 | 0 (0.0%) | 0 (0.0%) |
| $35,000 to $39,999 | 4 (17.4%) | 4 (2.9%) |
| $40,000 to $44,999 | 0 (0.0%) | 0 (0.0%) |
| $45,000 to $49,999 | 0 (0.0%) | 0 (0.0%) |
| $50,000 to $54,999 | 0 (0.0%) | 0 (0.0%) |
| $55,000 to $64,999 | 0 (0.0%) | 4 (2.9%) |
| $65,000 to $74,999 | 0 (0.0%) | 0 (0.0%) |
| $75,000 to $99,999 | 3 (13.0%) | 5 (3.6%) |
| $100,000+ | 0 (0.0%) | 0 (0.0%) |
| Total | 23 (100.0%) | 138 (100.0%) |
Earnings by Sex by Educational Attainment in Ideal
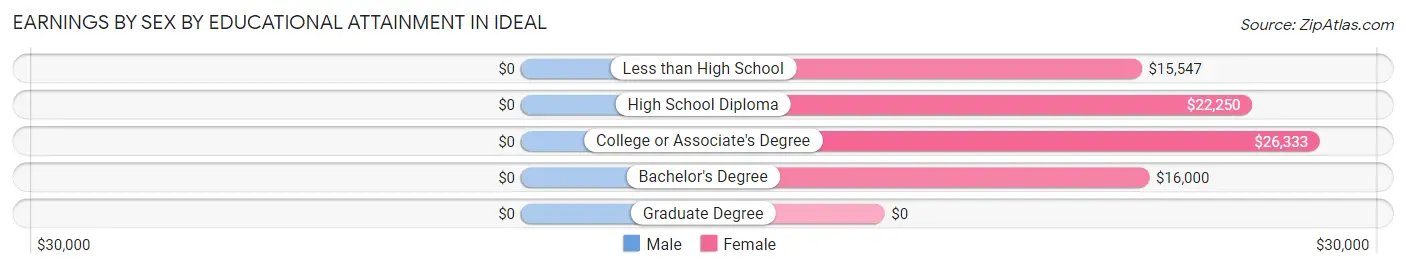
| Educational Attainment | Male Income | Female Income |
| Less than High School | - | - |
| High School Diploma | - | - |
| College or Associate's Degree | - | - |
| Bachelor's Degree | - | - |
| Graduate Degree | - | - |
| Total | - | - |
Family Income in Ideal
Family Income Brackets in Ideal
According to the Ideal family income data, there are 56 families falling into the $15,000 to $24,999 income range, which is the most common income bracket and makes up 45.5% of all families.
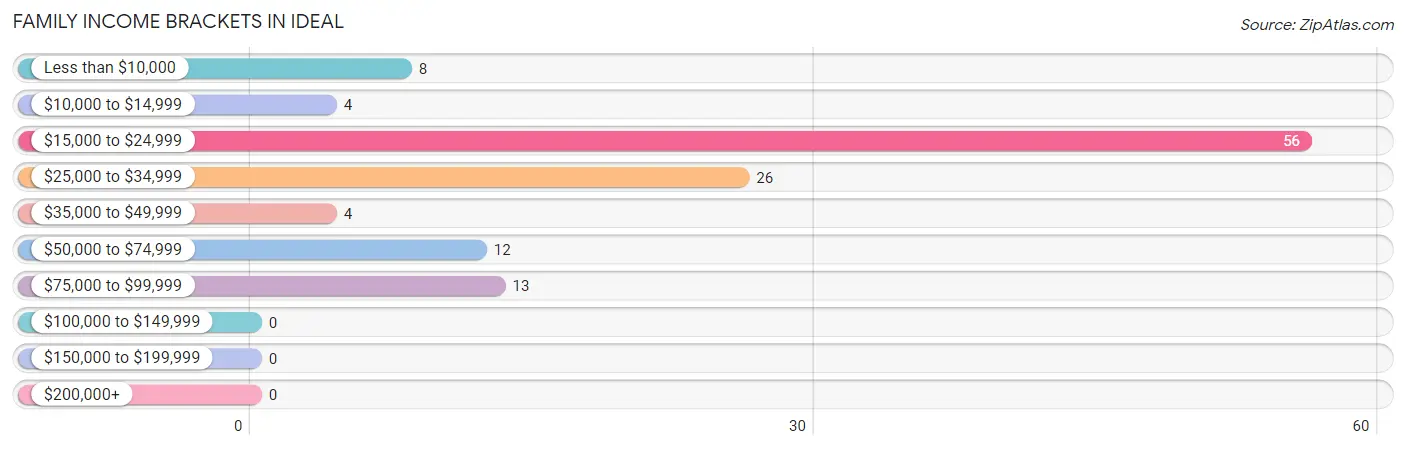
| Income Bracket | # Families | % Families |
| Less than $10,000 | 8 | 6.5% |
| $10,000 to $14,999 | 4 | 3.3% |
| $15,000 to $24,999 | 56 | 45.5% |
| $25,000 to $34,999 | 26 | 21.1% |
| $35,000 to $49,999 | 4 | 3.3% |
| $50,000 to $74,999 | 12 | 9.8% |
| $75,000 to $99,999 | 13 | 10.6% |
| $100,000 to $149,999 | 0 | 0.0% |
| $150,000 to $199,999 | 0 | 0.0% |
| $200,000+ | 0 | 0.0% |
Family Income by Famaliy Size in Ideal
5-person families (38 | 30.9%) account for the highest median family income in Ideal with $31,635 per family, while 2-person families (61 | 49.6%) have the highest median income of $11,106 per family member.
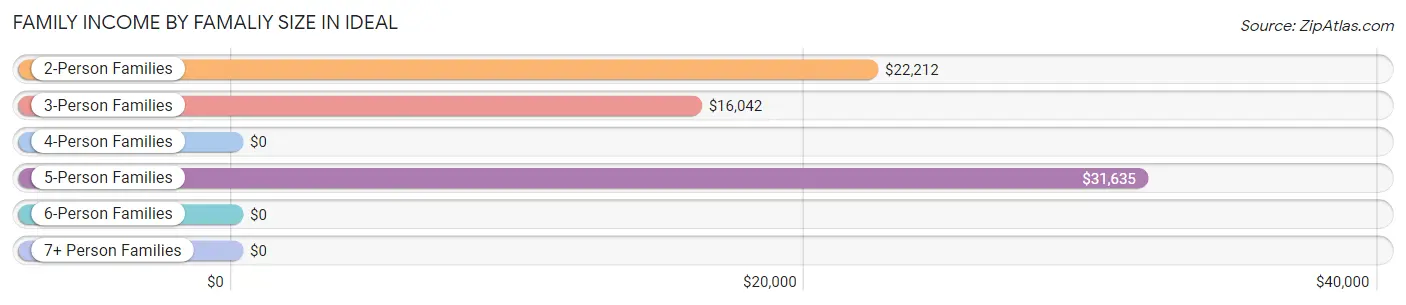
| Income Bracket | # Families | Median Income |
| 2-Person Families | 61 (49.6%) | $22,212 |
| 3-Person Families | 21 (17.1%) | $16,042 |
| 4-Person Families | 3 (2.4%) | $0 |
| 5-Person Families | 38 (30.9%) | $31,635 |
| 6-Person Families | 0 (0.0%) | $0 |
| 7+ Person Families | 0 (0.0%) | $0 |
| Total | 123 (100.0%) | $23,375 |
Family Income by Number of Earners in Ideal
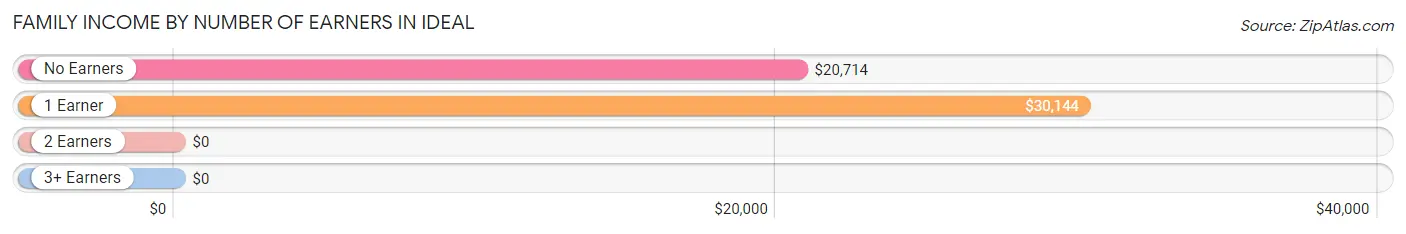
| Number of Earners | # Families | Median Income |
| No Earners | 36 (29.3%) | $20,714 |
| 1 Earner | 73 (59.4%) | $30,144 |
| 2 Earners | 12 (9.8%) | $0 |
| 3+ Earners | 2 (1.6%) | $0 |
| Total | 123 (100.0%) | $23,375 |
Household Income in Ideal
Household Income Brackets in Ideal
With 65 households falling in the category, the $15,000 to $24,999 income range is the most frequent in Ideal, accounting for 35.7% of all households.
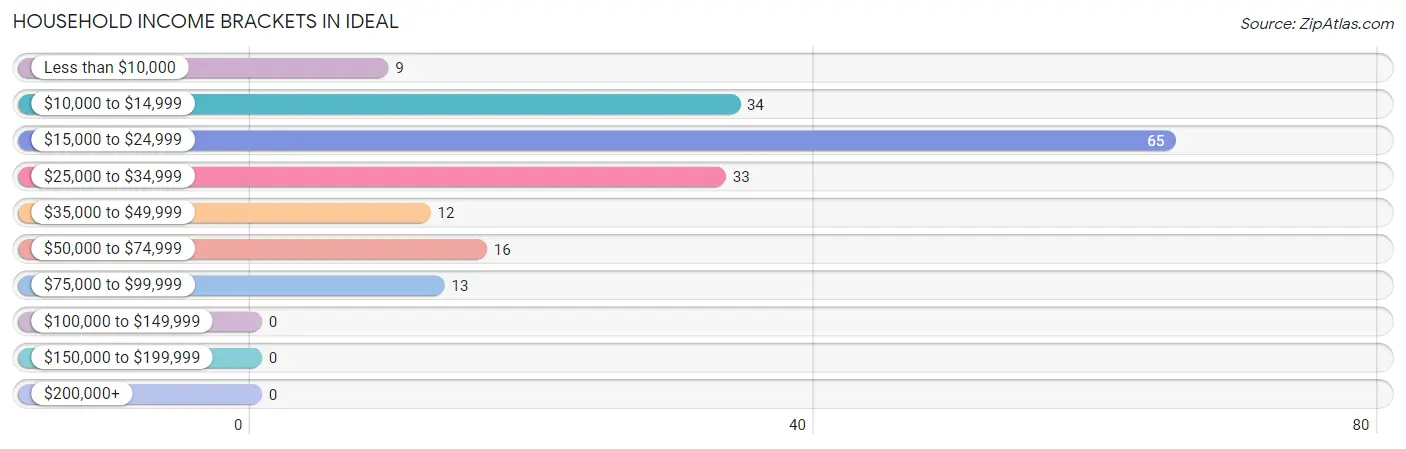
| Income Bracket | # Households | % Households |
| Less than $10,000 | 9 | 4.9% |
| $10,000 to $14,999 | 34 | 18.7% |
| $15,000 to $24,999 | 65 | 35.7% |
| $25,000 to $34,999 | 33 | 18.1% |
| $35,000 to $49,999 | 12 | 6.6% |
| $50,000 to $74,999 | 16 | 8.8% |
| $75,000 to $99,999 | 13 | 7.1% |
| $100,000 to $149,999 | 0 | 0.0% |
| $150,000 to $199,999 | 0 | 0.0% |
| $200,000+ | 0 | 0.0% |
Household Income by Householder Age in Ideal
The median household income in Ideal is $21,800, with the highest median household income of $30,433 found in the 25 to 44 years age bracket for the primary householder. A total of 61 households (33.5%) fall into this category.
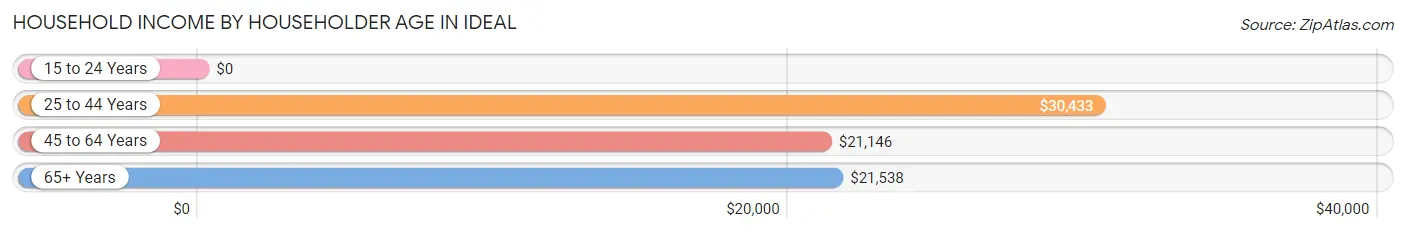
| Income Bracket | # Households | Median Income |
| 15 to 24 Years | 0 (0.0%) | $0 |
| 25 to 44 Years | 61 (33.5%) | $30,433 |
| 45 to 64 Years | 53 (29.1%) | $21,146 |
| 65+ Years | 68 (37.4%) | $21,538 |
| Total | 182 (100.0%) | $21,800 |
Poverty in Ideal
Income Below Poverty by Sex and Age in Ideal
With 39.7% poverty level for males and 70.2% for females among the residents of Ideal, under 5 year old males and under 5 year old females are the most vulnerable to poverty, with 13 males (100.0%) and 49 females (100.0%) in their respective age groups living below the poverty level.
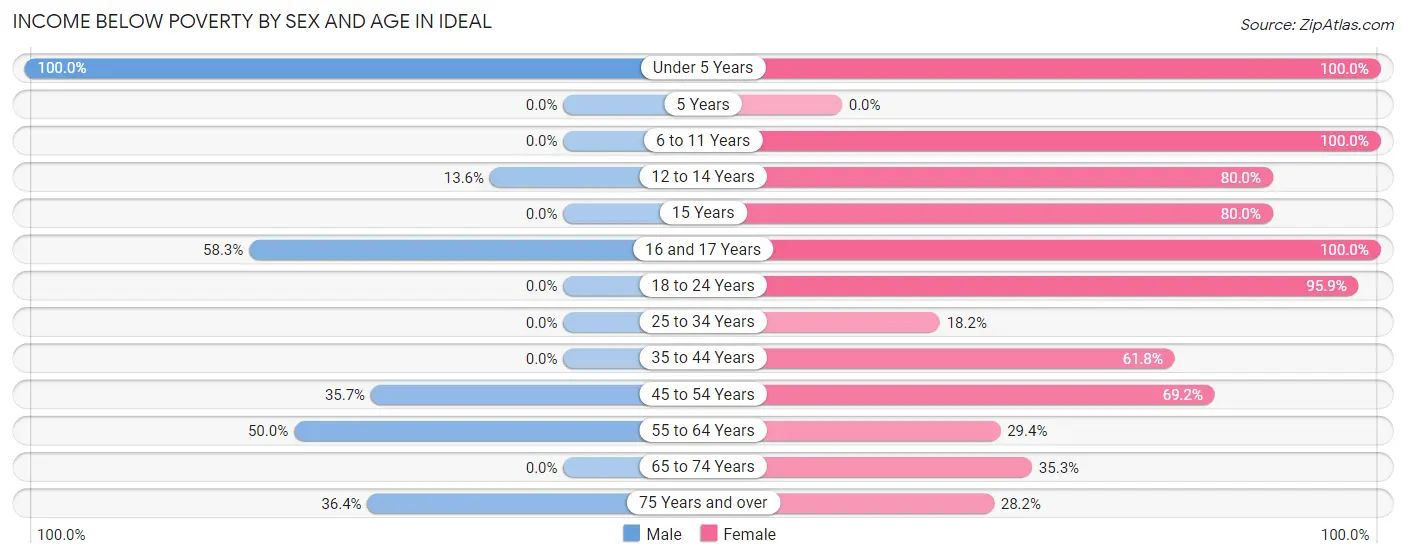
| Age Bracket | Male | Female |
| Under 5 Years | 13 (100.0%) | 49 (100.0%) |
| 5 Years | 0 (0.0%) | 0 (0.0%) |
| 6 to 11 Years | 0 (0.0%) | 26 (100.0%) |
| 12 to 14 Years | 3 (13.6%) | 28 (80.0%) |
| 15 Years | 0 (0.0%) | 4 (80.0%) |
| 16 and 17 Years | 21 (58.3%) | 35 (100.0%) |
| 18 to 24 Years | 0 (0.0%) | 47 (95.9%) |
| 25 to 34 Years | 0 (0.0%) | 2 (18.2%) |
| 35 to 44 Years | 0 (0.0%) | 55 (61.8%) |
| 45 to 54 Years | 10 (35.7%) | 9 (69.2%) |
| 55 to 64 Years | 3 (50.0%) | 10 (29.4%) |
| 65 to 74 Years | 0 (0.0%) | 6 (35.3%) |
| 75 Years and over | 4 (36.4%) | 11 (28.2%) |
| Total | 54 (39.7%) | 282 (70.2%) |
Income Above Poverty by Sex and Age in Ideal
According to the poverty statistics in Ideal, males aged 6 to 11 years and females aged 25 to 34 years are the age groups that are most secure financially, with 100.0% of males and 81.8% of females in these age groups living above the poverty line.
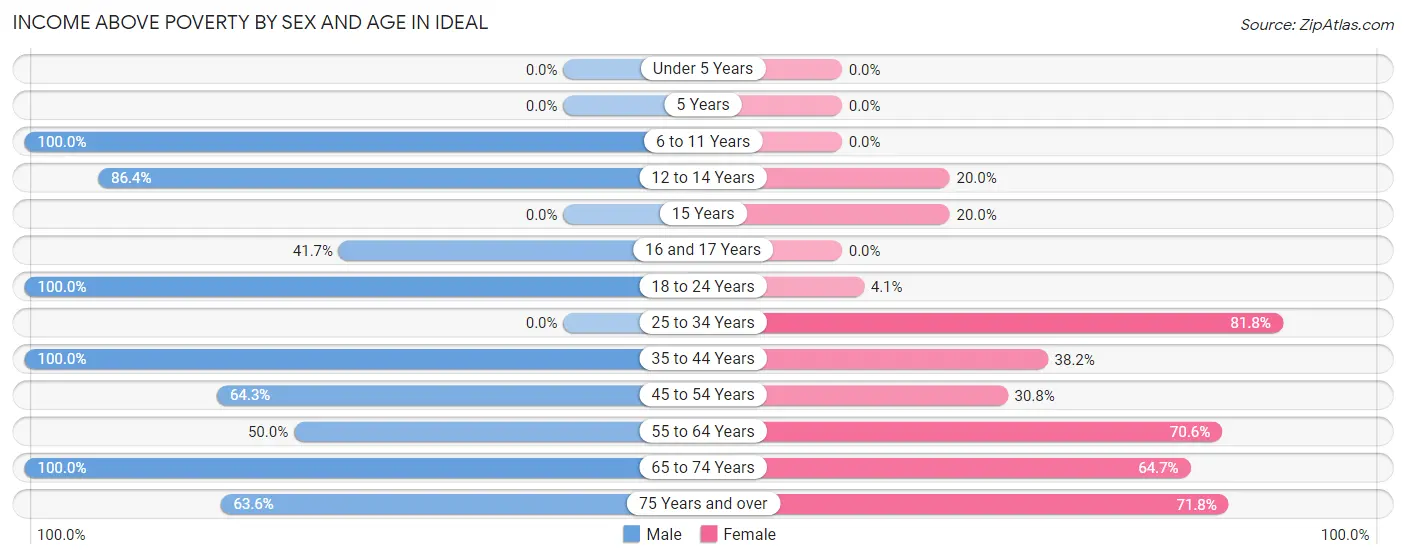
| Age Bracket | Male | Female |
| Under 5 Years | 0 (0.0%) | 0 (0.0%) |
| 5 Years | 0 (0.0%) | 0 (0.0%) |
| 6 to 11 Years | 3 (100.0%) | 0 (0.0%) |
| 12 to 14 Years | 19 (86.4%) | 7 (20.0%) |
| 15 Years | 0 (0.0%) | 1 (20.0%) |
| 16 and 17 Years | 15 (41.7%) | 0 (0.0%) |
| 18 to 24 Years | 2 (100.0%) | 2 (4.1%) |
| 25 to 34 Years | 0 (0.0%) | 9 (81.8%) |
| 35 to 44 Years | 3 (100.0%) | 34 (38.2%) |
| 45 to 54 Years | 18 (64.3%) | 4 (30.8%) |
| 55 to 64 Years | 3 (50.0%) | 24 (70.6%) |
| 65 to 74 Years | 12 (100.0%) | 11 (64.7%) |
| 75 Years and over | 7 (63.6%) | 28 (71.8%) |
| Total | 82 (60.3%) | 120 (29.8%) |
Income Below Poverty Among Married-Couple Families in Ideal
The poverty statistics for married-couple families in Ideal show that 16.0% or 4 of the total 25 families live below the poverty line. Families with 1 or 2 children have the highest poverty rate of 60.0%, comprising of 3 families. On the other hand, families with no children have the lowest poverty rate of 5.0%, which includes 1 families.
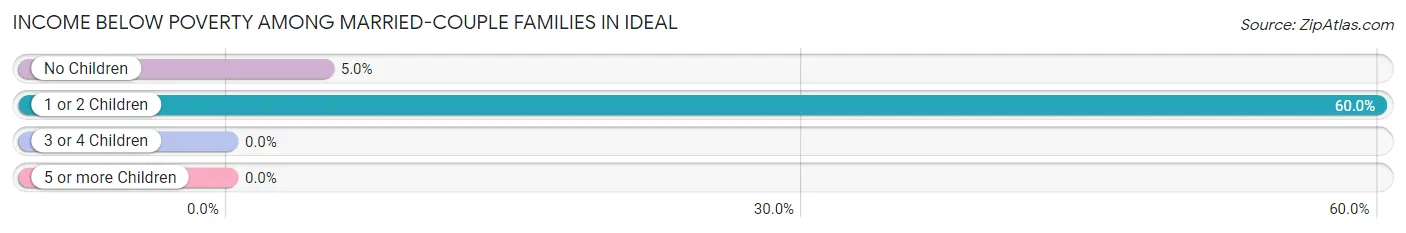
| Children | Above Poverty | Below Poverty |
| No Children | 19 (95.0%) | 1 (5.0%) |
| 1 or 2 Children | 2 (40.0%) | 3 (60.0%) |
| 3 or 4 Children | 0 (0.0%) | 0 (0.0%) |
| 5 or more Children | 0 (0.0%) | 0 (0.0%) |
| Total | 21 (84.0%) | 4 (16.0%) |
Income Below Poverty Among Single-Parent Households in Ideal
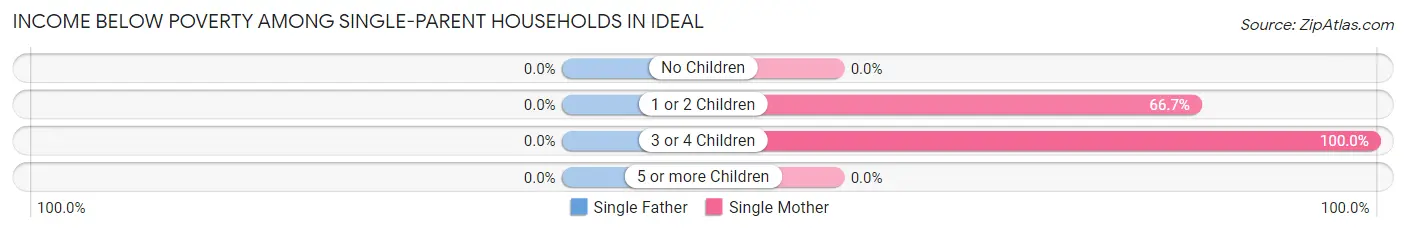
| Children | Single Father | Single Mother |
| No Children | 0 (0.0%) | 0 (0.0%) |
| 1 or 2 Children | 0 (0.0%) | 34 (66.7%) |
| 3 or 4 Children | 0 (0.0%) | 28 (100.0%) |
| 5 or more Children | 0 (0.0%) | 0 (0.0%) |
| Total | 0 (0.0%) | 62 (66.0%) |
Income Below Poverty Among Married-Couple vs Single-Parent Households in Ideal
The poverty data for Ideal shows that 4 of the married-couple family households (16.0%) and 62 of the single-parent households (63.3%) are living below the poverty level. Within the married-couple family households, those with 1 or 2 children have the highest poverty rate, with 3 households (60.0%) falling below the poverty line. Among the single-parent households, those with 3 or 4 children have the highest poverty rate, with 28 household (100.0%) living below poverty.
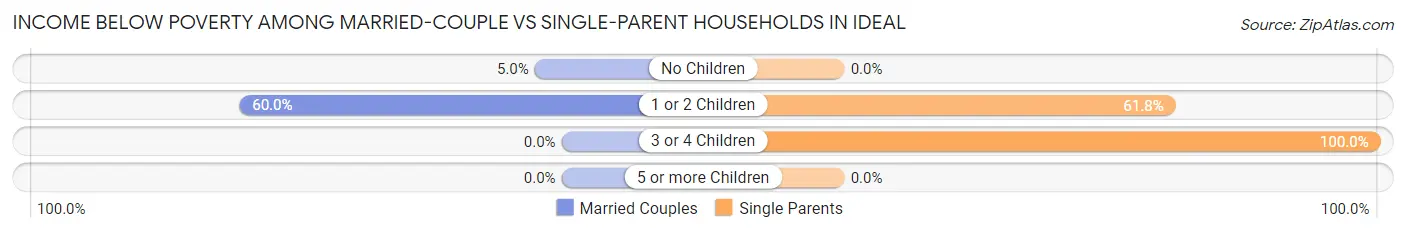
| Children | Married-Couple Families | Single-Parent Households |
| No Children | 1 (5.0%) | 0 (0.0%) |
| 1 or 2 Children | 3 (60.0%) | 34 (61.8%) |
| 3 or 4 Children | 0 (0.0%) | 28 (100.0%) |
| 5 or more Children | 0 (0.0%) | 0 (0.0%) |
| Total | 4 (16.0%) | 62 (63.3%) |
Race in Ideal
The most populous races in Ideal are Black / African American (531 | 85.0%), and White / Caucasian (94 | 15.0%).
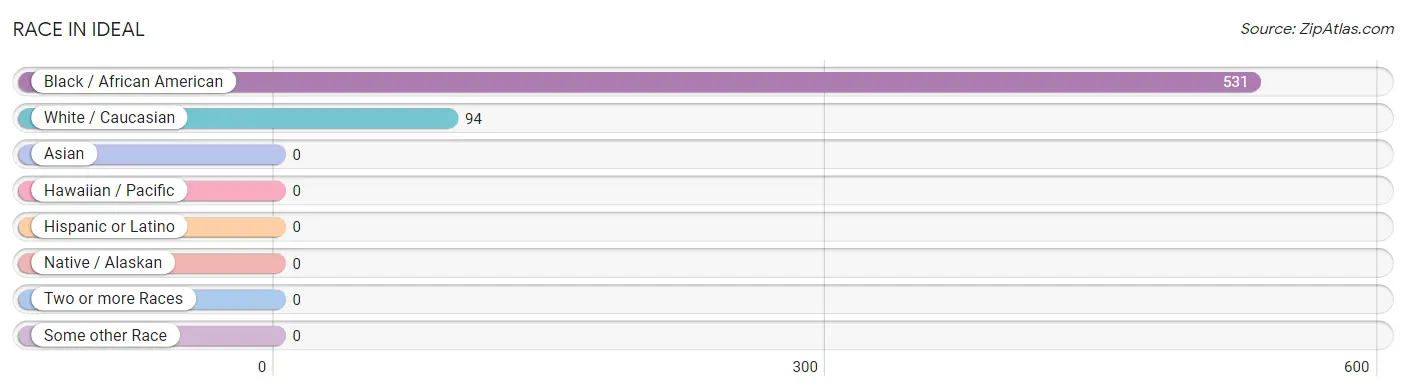
| Race | # Population | % Population |
| Asian | 0 | 0.0% |
| Black / African American | 531 | 85.0% |
| Hawaiian / Pacific | 0 | 0.0% |
| Hispanic or Latino | 0 | 0.0% |
| Native / Alaskan | 0 | 0.0% |
| White / Caucasian | 94 | 15.0% |
| Two or more Races | 0 | 0.0% |
| Some other Race | 0 | 0.0% |
| Total | 625 | 100.0% |
Ancestry in Ideal
The most populous ancestries reported in Ideal are American (12 | 1.9%), German (4 | 0.6%), and French (2 | 0.3%), together accounting for 2.9% of all Ideal residents.
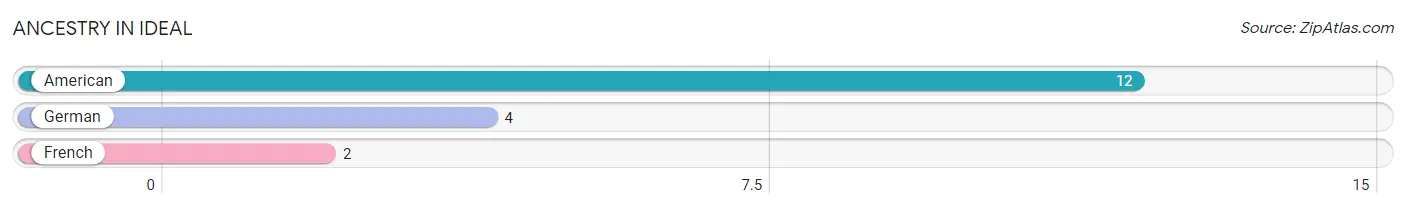
| Ancestry | # Population | % Population |
| American | 12 | 1.9% |
| French | 2 | 0.3% |
| German | 4 | 0.6% | View All 3 Rows |
Immigrants in Ideal

| Immigration Origin | # Population | % Population | View All 0 Rows |
Sex and Age in Ideal
Sex and Age in Ideal
The most populous age groups in Ideal are 15 to 19 Years (38 | 20.3%) for men and 15 to 19 Years (89 | 20.3%) for women.
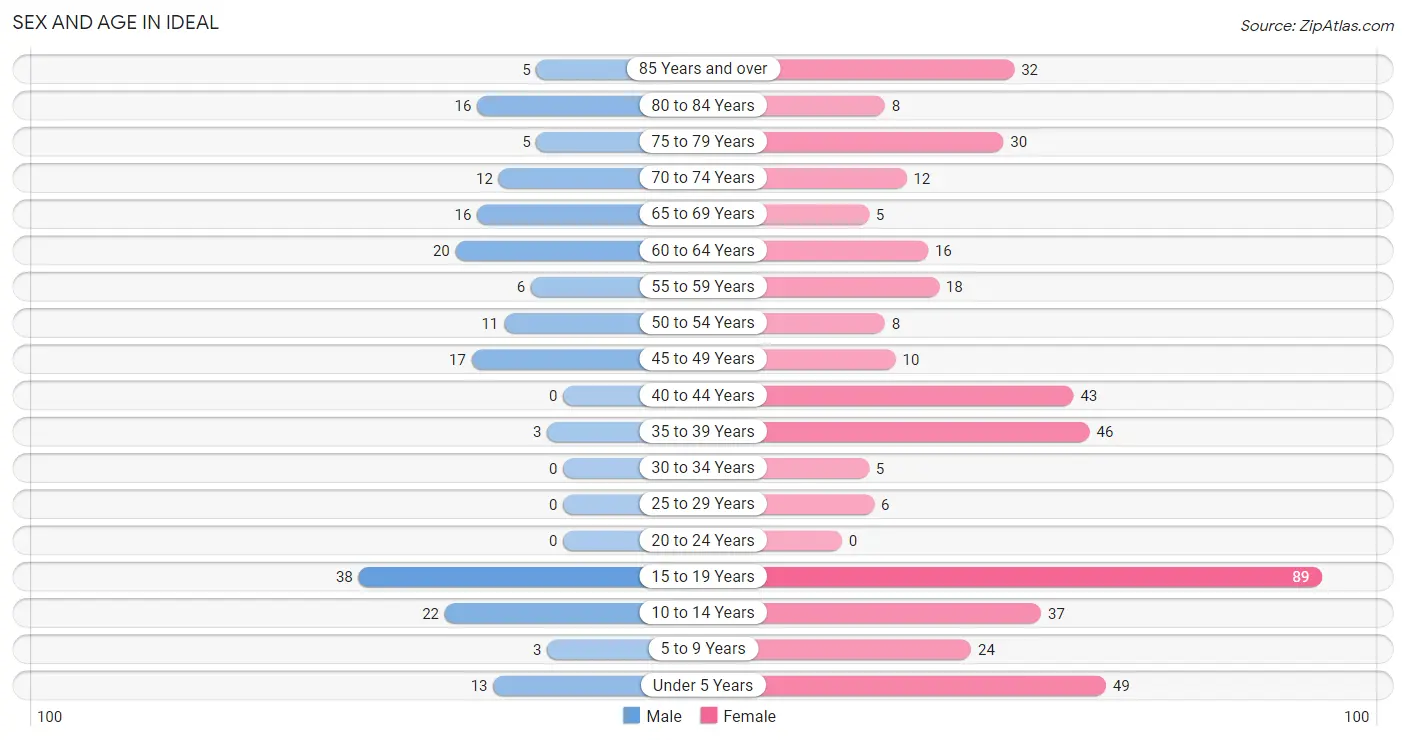
| Age Bracket | Male | Female |
| Under 5 Years | 13 (7.0%) | 49 (11.2%) |
| 5 to 9 Years | 3 (1.6%) | 24 (5.5%) |
| 10 to 14 Years | 22 (11.8%) | 37 (8.5%) |
| 15 to 19 Years | 38 (20.3%) | 89 (20.3%) |
| 20 to 24 Years | 0 (0.0%) | 0 (0.0%) |
| 25 to 29 Years | 0 (0.0%) | 6 (1.4%) |
| 30 to 34 Years | 0 (0.0%) | 5 (1.1%) |
| 35 to 39 Years | 3 (1.6%) | 46 (10.5%) |
| 40 to 44 Years | 0 (0.0%) | 43 (9.8%) |
| 45 to 49 Years | 17 (9.1%) | 10 (2.3%) |
| 50 to 54 Years | 11 (5.9%) | 8 (1.8%) |
| 55 to 59 Years | 6 (3.2%) | 18 (4.1%) |
| 60 to 64 Years | 20 (10.7%) | 16 (3.6%) |
| 65 to 69 Years | 16 (8.6%) | 5 (1.1%) |
| 70 to 74 Years | 12 (6.4%) | 12 (2.7%) |
| 75 to 79 Years | 5 (2.7%) | 30 (6.9%) |
| 80 to 84 Years | 16 (8.6%) | 8 (1.8%) |
| 85 Years and over | 5 (2.7%) | 32 (7.3%) |
| Total | 187 (100.0%) | 438 (100.0%) |
Families and Households in Ideal
Median Family Size in Ideal
The median family size in Ideal is 3.80 persons per family, with single female/mother families (94 | 76.4%) accounting for the largest median family size of 4.22 persons per family. On the other hand, single male/father families (4 | 3.3%) represent the smallest median family size with 1.75 persons per family.
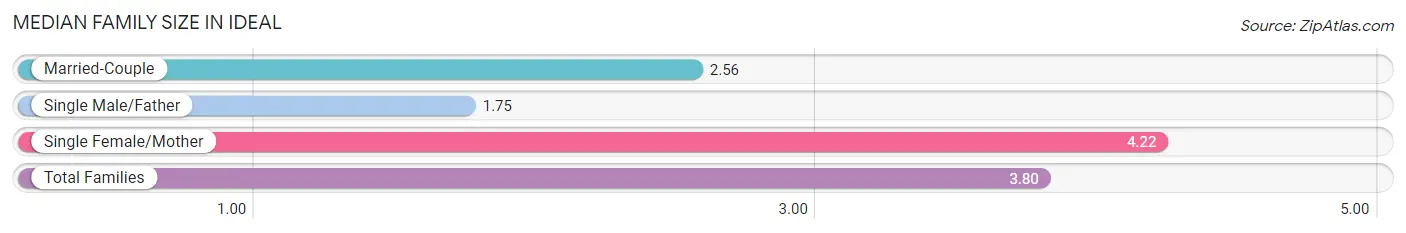
| Family Type | # Families | Family Size |
| Married-Couple | 25 (20.3%) | 2.56 |
| Single Male/Father | 4 (3.3%) | 1.75 |
| Single Female/Mother | 94 (76.4%) | 4.22 |
| Total Families | 123 (100.0%) | 3.80 |
Median Household Size in Ideal
The median household size in Ideal is 2.96 persons per household, with single female/mother households (94 | 51.6%) accounting for the largest median household size of 4.27 persons per household. non-family households (59 | 32.4%) represent the smallest median household size with 1.12 persons per household.
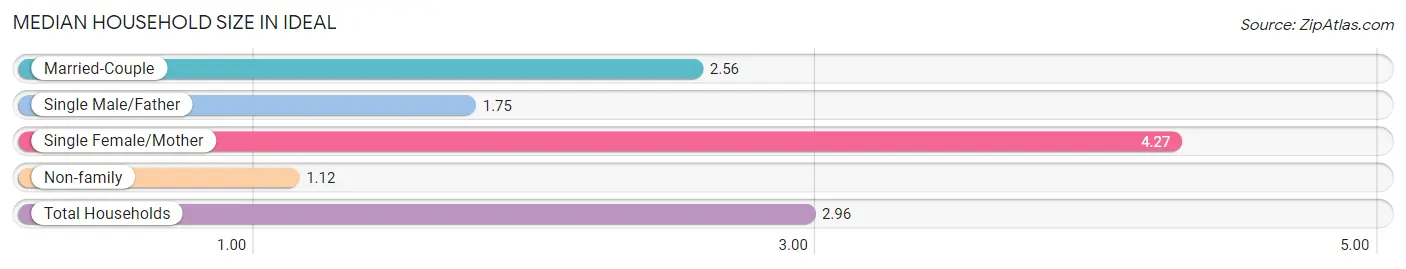
| Household Type | # Households | Household Size |
| Married-Couple | 25 (13.7%) | 2.56 |
| Single Male/Father | 4 (2.2%) | 1.75 |
| Single Female/Mother | 94 (51.6%) | 4.27 |
| Non-family | 59 (32.4%) | 1.12 |
| Total Households | 182 (100.0%) | 2.96 |
Household Size by Marriage Status in Ideal
Out of a total of 182 households in Ideal, 123 (67.6%) are family households, while 59 (32.4%) are nonfamily households. The most numerous type of family households are 2-person households, comprising 61, and the most common type of nonfamily households are 1-person households, comprising 55.
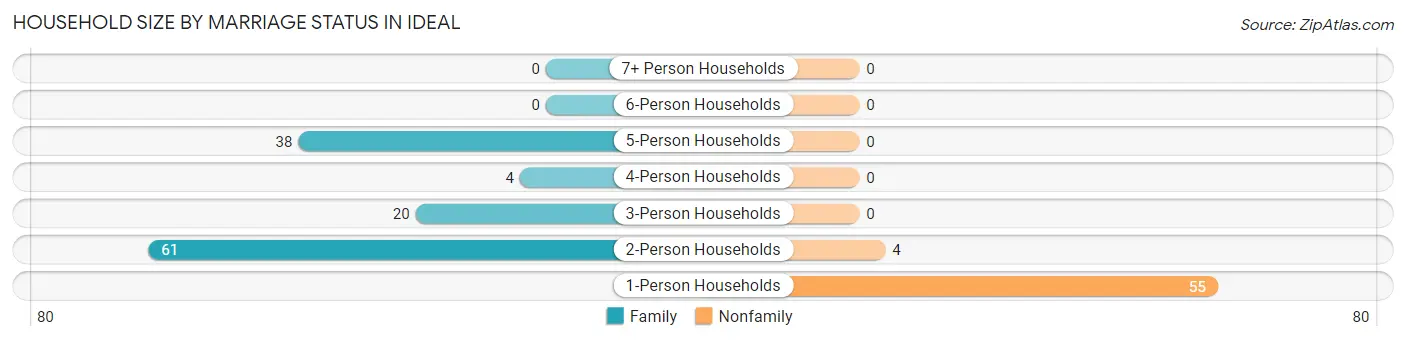
| Household Size | Family Households | Nonfamily Households |
| 1-Person Households | - | 55 (30.2%) |
| 2-Person Households | 61 (33.5%) | 4 (2.2%) |
| 3-Person Households | 20 (11.0%) | 0 (0.0%) |
| 4-Person Households | 4 (2.2%) | 0 (0.0%) |
| 5-Person Households | 38 (20.9%) | 0 (0.0%) |
| 6-Person Households | 0 (0.0%) | 0 (0.0%) |
| 7+ Person Households | 0 (0.0%) | 0 (0.0%) |
| Total | 123 (67.6%) | 59 (32.4%) |
Female Fertility in Ideal
Fertility by Age in Ideal
Average fertility rate in Ideal is 407.0 births per 1,000 women. Women in the age bracket of 15 to 19 years have the highest fertility rate with 888.0 births per 1,000 women. Women in the age bracket of 15 to 19 years acount for 97.5% of all women with births.
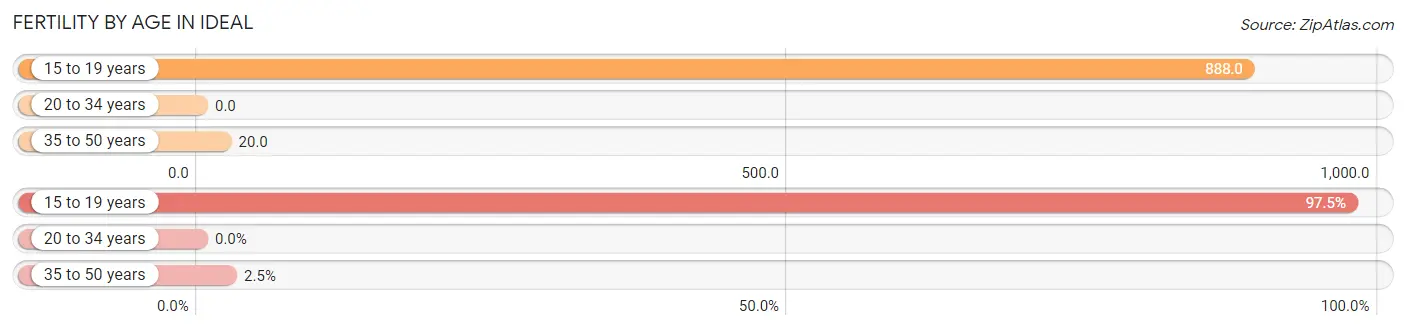
| Age Bracket | Women with Births | Births / 1,000 Women |
| 15 to 19 years | 79 (97.5%) | 888.0 |
| 20 to 34 years | 0 (0.0%) | 0.0 |
| 35 to 50 years | 2 (2.5%) | 20.0 |
| Total | 81 (100.0%) | 407.0 |
Fertility by Age by Marriage Status in Ideal
2.5% of women with births (81) in Ideal are married. The highest percentage of unmarried women with births falls into 15 to 19 years age bracket with 100.0% of them unmarried at the time of birth, while the lowest percentage of unmarried women with births belong to 35 to 50 years age bracket with 0.0% of them unmarried.
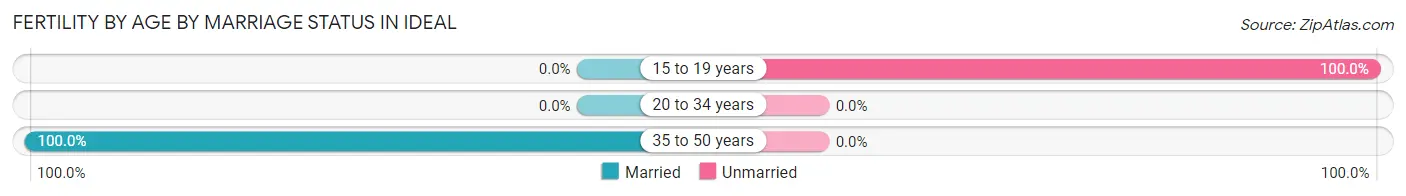
| Age Bracket | Married | Unmarried |
| 15 to 19 years | 0 (0.0%) | 79 (100.0%) |
| 20 to 34 years | 0 (0.0%) | 0 (0.0%) |
| 35 to 50 years | 2 (100.0%) | 0 (0.0%) |
| Total | 2 (2.5%) | 79 (97.5%) |
Fertility by Education in Ideal
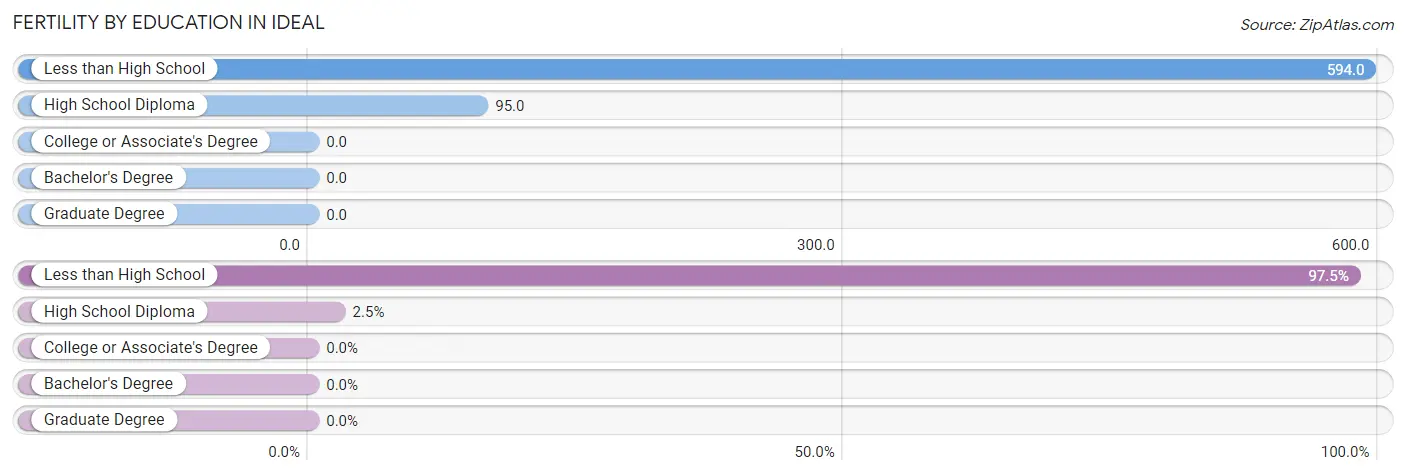
| Educational Attainment | Women with Births | Births / 1,000 Women |
| Less than High School | 79 (97.5%) | 594.0 |
| High School Diploma | 2 (2.5%) | 95.0 |
| College or Associate's Degree | 0 (0.0%) | 0.0 |
| Bachelor's Degree | 0 (0.0%) | 0.0 |
| Graduate Degree | 0 (0.0%) | 0.0 |
| Total | 81 (100.0%) | 407.0 |
Fertility by Education by Marriage Status in Ideal
97.5% of women with births in Ideal are unmarried. Women with the educational attainment of high school diploma are most likely to be married with 100.0% of them married at childbirth, while women with the educational attainment of less than high school are least likely to be married with 100.0% of them unmarried at childbirth.
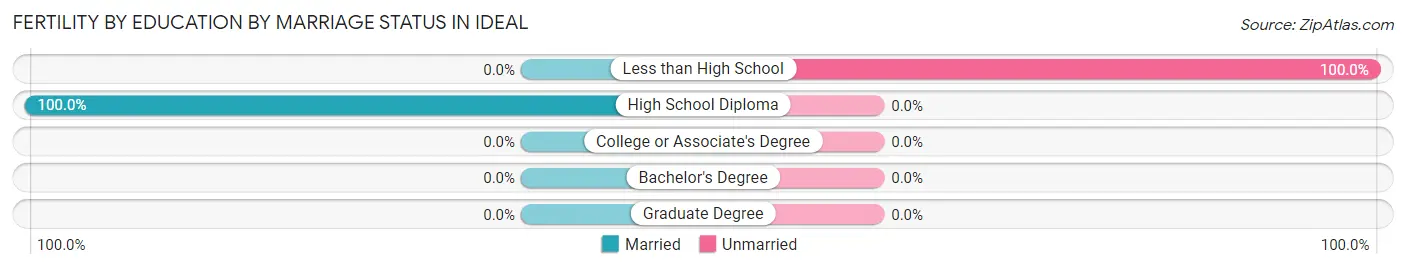
| Educational Attainment | Married | Unmarried |
| Less than High School | 0 (0.0%) | 79 (100.0%) |
| High School Diploma | 2 (100.0%) | 0 (0.0%) |
| College or Associate's Degree | 0 (0.0%) | 0 (0.0%) |
| Bachelor's Degree | 0 (0.0%) | 0 (0.0%) |
| Graduate Degree | 0 (0.0%) | 0 (0.0%) |
| Total | 2 (2.5%) | 79 (97.5%) |
Employment Characteristics in Ideal
Employment by Class of Employer in Ideal
Among the 157 employed individuals in Ideal, private company employees (109 | 69.4%), not-for-profit organizations (32 | 20.4%), and self-employed (not incorporated) (10 | 6.4%) make up the most common classes of employment.
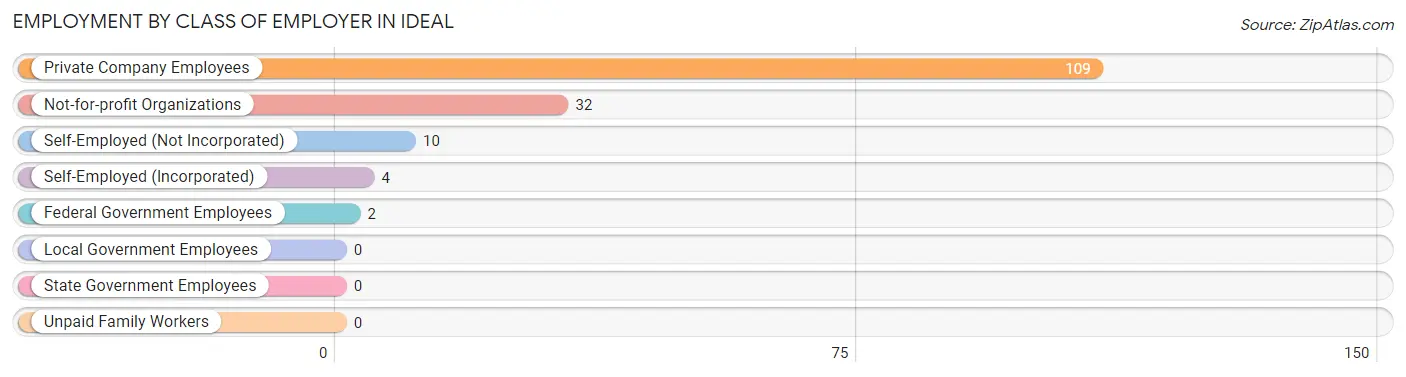
| Employer Class | # Employees | % Employees |
| Private Company Employees | 109 | 69.4% |
| Self-Employed (Incorporated) | 4 | 2.5% |
| Self-Employed (Not Incorporated) | 10 | 6.4% |
| Not-for-profit Organizations | 32 | 20.4% |
| Local Government Employees | 0 | 0.0% |
| State Government Employees | 0 | 0.0% |
| Federal Government Employees | 2 | 1.3% |
| Unpaid Family Workers | 0 | 0.0% |
| Total | 157 | 100.0% |
Employment Status by Age in Ideal
According to the labor force statistics for Ideal, out of the total population over 16 years of age (472), 35.6% or 168 individuals are in the labor force, with 6.5% or 11 of them unemployed. The age group with the highest labor force participation rate is 25 to 29 years, with 100.0% or 6 individuals in the labor force. Within the labor force, the 30 to 34 years age range has the highest percentage of unemployed individuals, with 20.0% or 1 of them being unemployed.
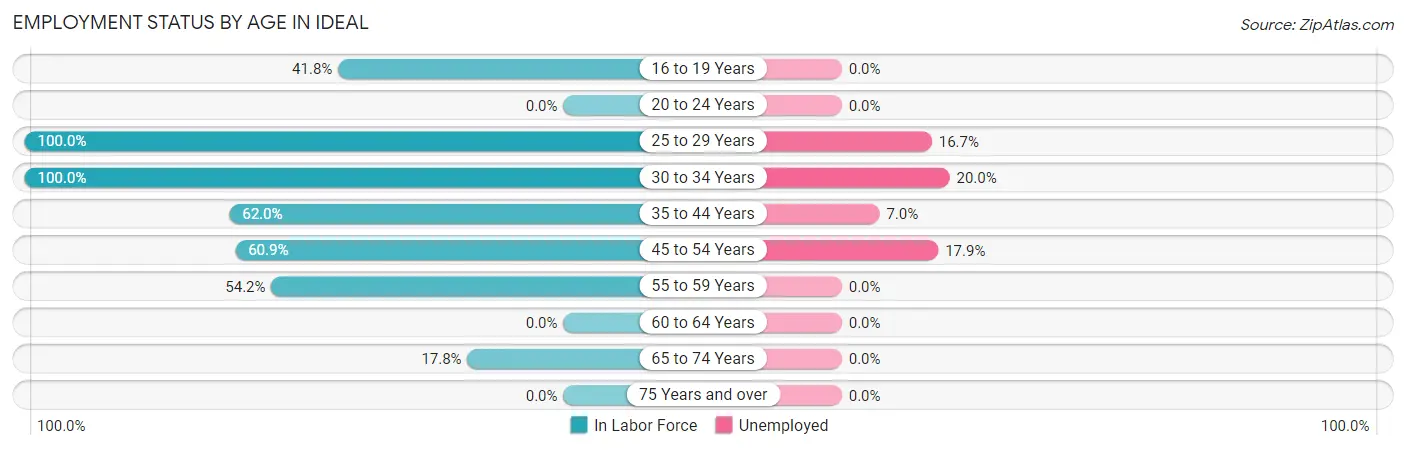
| Age Bracket | In Labor Force | Unemployed |
| 16 to 19 Years | 51 (41.8%) | 0 (0.0%) |
| 20 to 24 Years | 0 (0.0%) | 0 (0.0%) |
| 25 to 29 Years | 6 (100.0%) | 1 (16.7%) |
| 30 to 34 Years | 5 (100.0%) | 1 (20.0%) |
| 35 to 44 Years | 57 (62.0%) | 4 (7.0%) |
| 45 to 54 Years | 28 (60.9%) | 5 (17.9%) |
| 55 to 59 Years | 13 (54.2%) | 0 (0.0%) |
| 60 to 64 Years | 0 (0.0%) | 0 (0.0%) |
| 65 to 74 Years | 8 (17.8%) | 0 (0.0%) |
| 75 Years and over | 0 (0.0%) | 0 (0.0%) |
| Total | 168 (35.6%) | 11 (6.5%) |
Employment Status by Educational Attainment in Ideal
According to labor force statistics for Ideal, 52.2% of individuals (109) out of the total population between 25 and 64 years of age (209) are in the labor force, with 10.1% or 11 of them being unemployed. The group with the highest labor force participation rate are those with the educational attainment of bachelor's degree or higher, with 100.0% or 17 individuals in the labor force. Within the labor force, individuals with less than high school education have the highest percentage of unemployment, with 15.6% or 5 of them being unemployed.
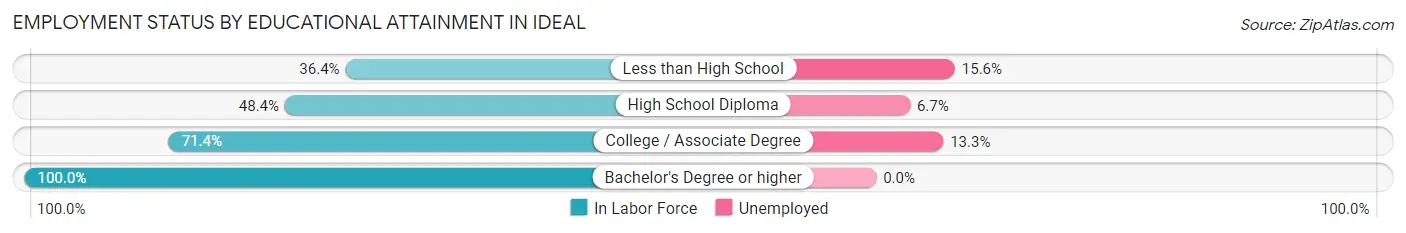
| Educational Attainment | In Labor Force | Unemployed |
| Less than High School | 32 (36.4%) | 14 (15.6%) |
| High School Diploma | 30 (48.4%) | 4 (6.7%) |
| College / Associate Degree | 30 (71.4%) | 6 (13.3%) |
| Bachelor's Degree or higher | 17 (100.0%) | 0 (0.0%) |
| Total | 109 (52.2%) | 21 (10.1%) |
Employment Occupations by Sex in Ideal
Management, Business, Science and Arts Occupations
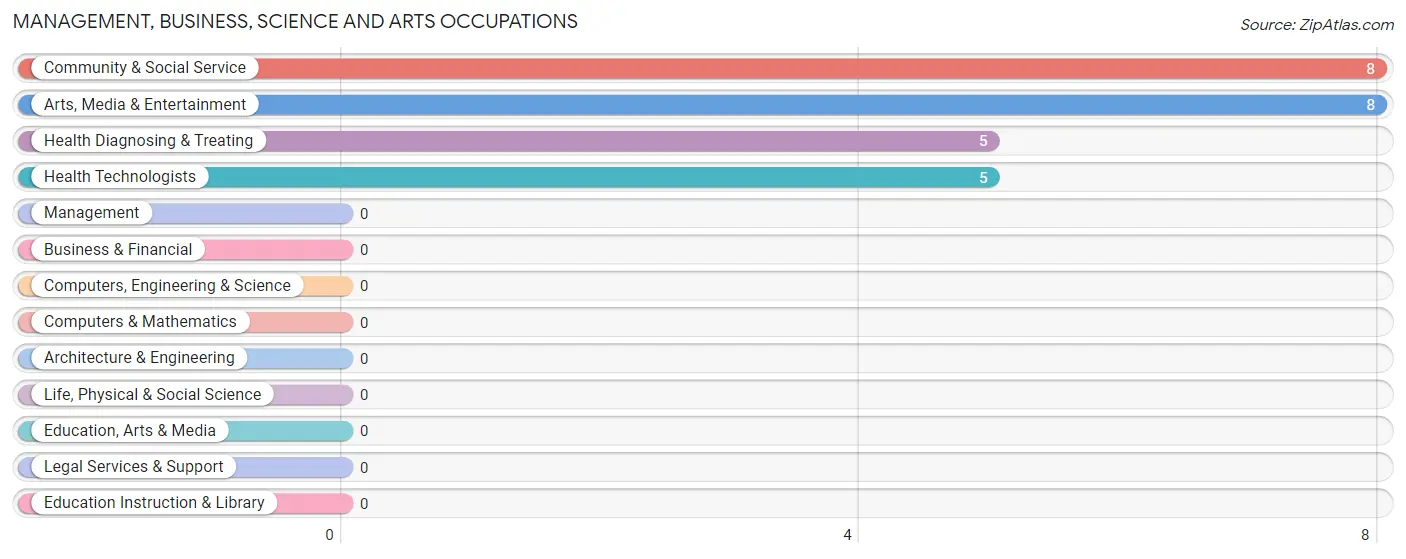
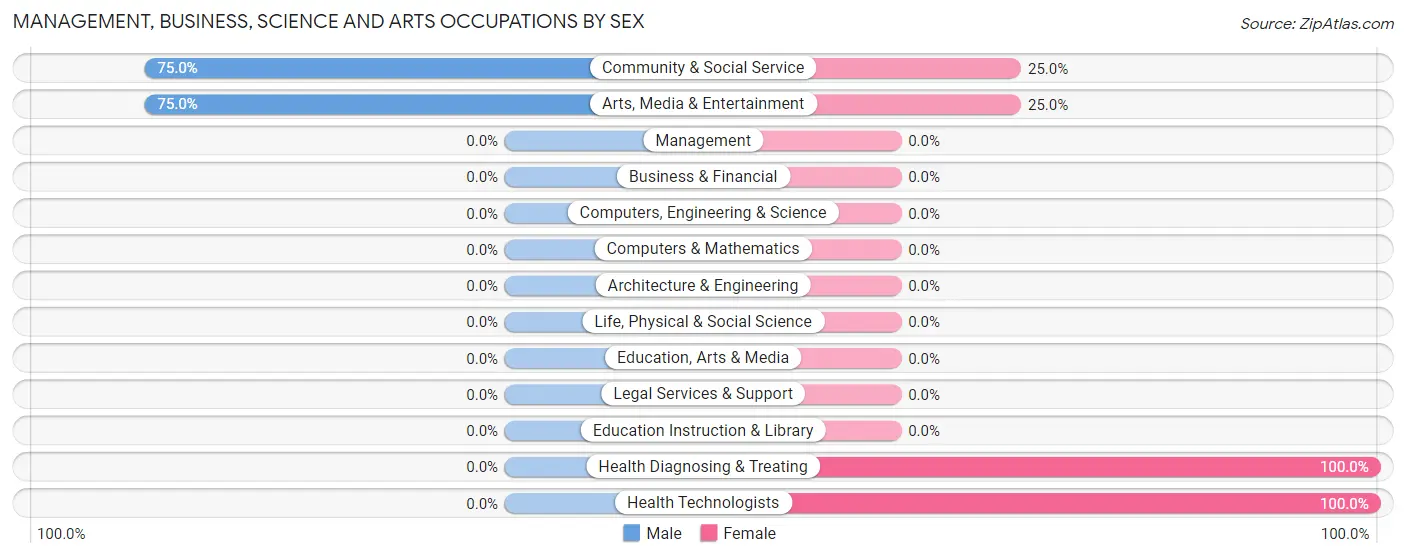
The most common Management, Business, Science and Arts occupations in Ideal are Community & Social Service (8 | 5.1%), Arts, Media & Entertainment (8 | 5.1%), Health Diagnosing & Treating (5 | 3.2%), and Health Technologists (5 | 3.2%).
Management, Business, Science and Arts Occupations by Sex
Within the Management, Business, Science and Arts occupations in Ideal, the most male-oriented occupations are Community & Social Service (75.0%), and Arts, Media & Entertainment (75.0%), while the most female-oriented occupations are Health Diagnosing & Treating (100.0%), Health Technologists (100.0%), and Community & Social Service (25.0%).
| Occupation | Male | Female |
| Management | 0 (0.0%) | 0 (0.0%) |
| Business & Financial | 0 (0.0%) | 0 (0.0%) |
| Computers, Engineering & Science | 0 (0.0%) | 0 (0.0%) |
| Computers & Mathematics | 0 (0.0%) | 0 (0.0%) |
| Architecture & Engineering | 0 (0.0%) | 0 (0.0%) |
| Life, Physical & Social Science | 0 (0.0%) | 0 (0.0%) |
| Community & Social Service | 6 (75.0%) | 2 (25.0%) |
| Education, Arts & Media | 0 (0.0%) | 0 (0.0%) |
| Legal Services & Support | 0 (0.0%) | 0 (0.0%) |
| Education Instruction & Library | 0 (0.0%) | 0 (0.0%) |
| Arts, Media & Entertainment | 6 (75.0%) | 2 (25.0%) |
| Health Diagnosing & Treating | 0 (0.0%) | 5 (100.0%) |
| Health Technologists | 0 (0.0%) | 5 (100.0%) |
| Total (Category) | 6 (46.2%) | 7 (53.8%) |
| Total (Overall) | 23 (14.6%) | 134 (85.4%) |
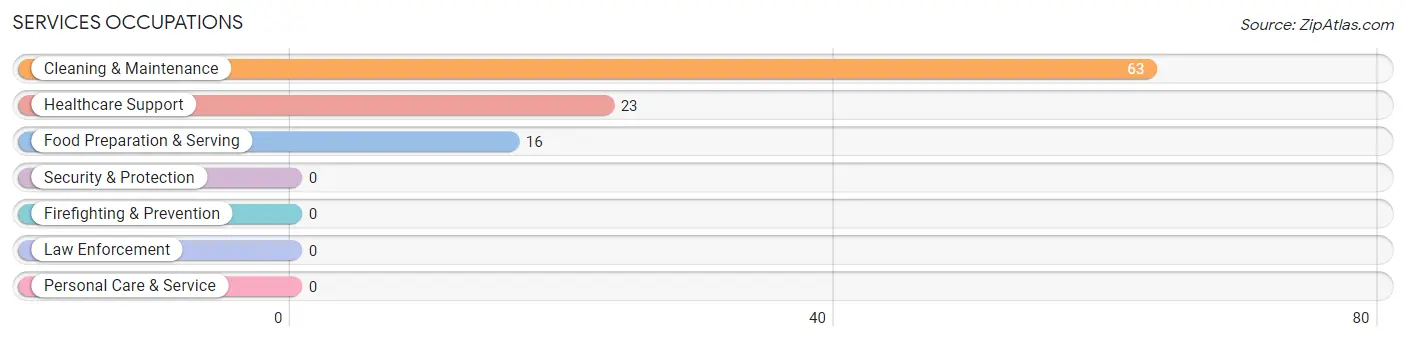
Services Occupations
The most common Services occupations in Ideal are Cleaning & Maintenance (63 | 40.1%), Healthcare Support (23 | 14.6%), and Food Preparation & Serving (16 | 10.2%).
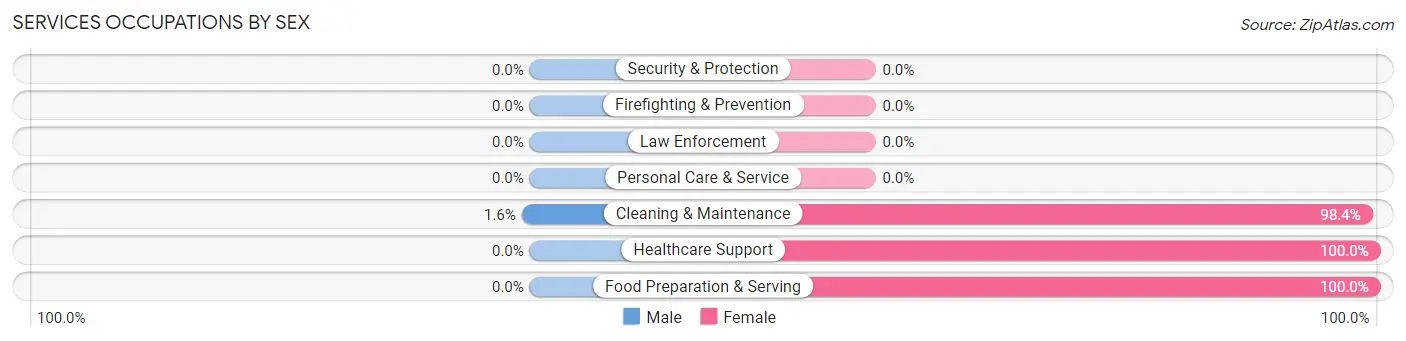
Services Occupations by Sex
| Occupation | Male | Female |
| Healthcare Support | 0 (0.0%) | 23 (100.0%) |
| Security & Protection | 0 (0.0%) | 0 (0.0%) |
| Firefighting & Prevention | 0 (0.0%) | 0 (0.0%) |
| Law Enforcement | 0 (0.0%) | 0 (0.0%) |
| Food Preparation & Serving | 0 (0.0%) | 16 (100.0%) |
| Cleaning & Maintenance | 1 (1.6%) | 62 (98.4%) |
| Personal Care & Service | 0 (0.0%) | 0 (0.0%) |
| Total (Category) | 1 (1.0%) | 101 (99.0%) |
| Total (Overall) | 23 (14.6%) | 134 (85.4%) |
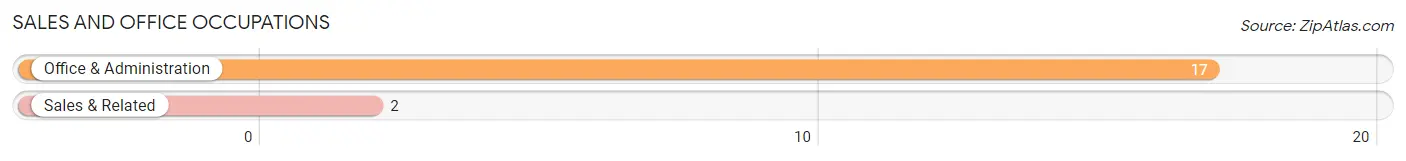
Sales and Office Occupations
The most common Sales and Office occupations in Ideal are Office & Administration (17 | 10.8%), and Sales & Related (2 | 1.3%).
Sales and Office Occupations by Sex

| Occupation | Male | Female |
| Sales & Related | 2 (100.0%) | 0 (0.0%) |
| Office & Administration | 0 (0.0%) | 17 (100.0%) |
| Total (Category) | 2 (10.5%) | 17 (89.5%) |
| Total (Overall) | 23 (14.6%) | 134 (85.4%) |
Natural Resources, Construction and Maintenance Occupations
The most common Natural Resources, Construction and Maintenance occupations in Ideal are , and Farming, Fishing & Forestry (6 | 3.8%).
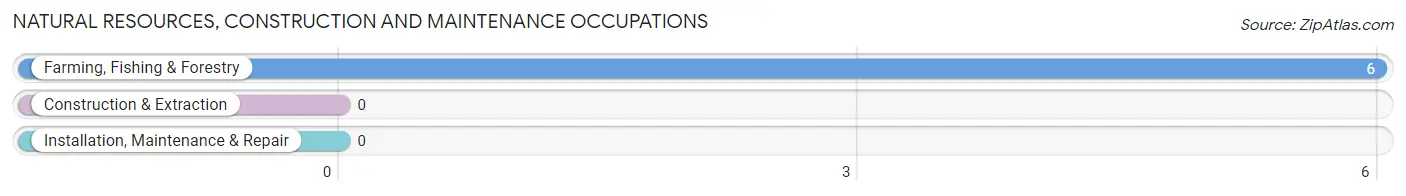
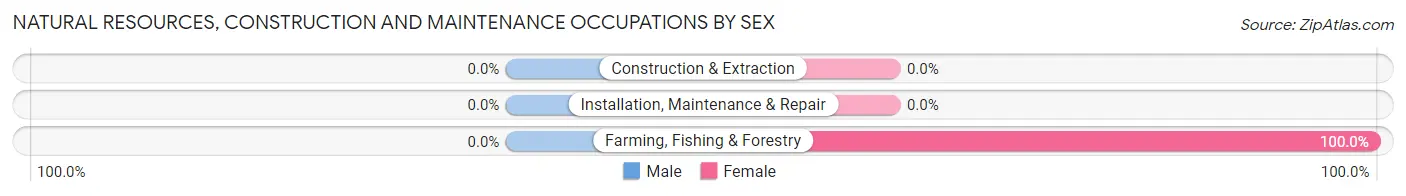
Natural Resources, Construction and Maintenance Occupations by Sex
| Occupation | Male | Female |
| Farming, Fishing & Forestry | 0 (0.0%) | 6 (100.0%) |
| Construction & Extraction | 0 (0.0%) | 0 (0.0%) |
| Installation, Maintenance & Repair | 0 (0.0%) | 0 (0.0%) |
| Total (Category) | 0 (0.0%) | 6 (100.0%) |
| Total (Overall) | 23 (14.6%) | 134 (85.4%) |
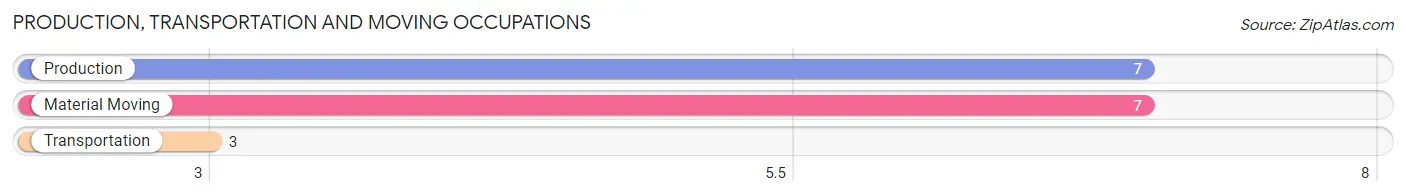
Production, Transportation and Moving Occupations
The most common Production, Transportation and Moving occupations in Ideal are Production (7 | 4.5%), Material Moving (7 | 4.5%), and Transportation (3 | 1.9%).
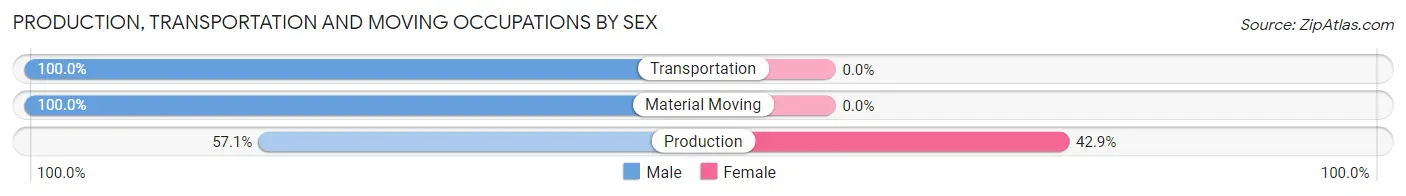
Production, Transportation and Moving Occupations by Sex
| Occupation | Male | Female |
| Production | 4 (57.1%) | 3 (42.9%) |
| Transportation | 3 (100.0%) | 0 (0.0%) |
| Material Moving | 7 (100.0%) | 0 (0.0%) |
| Total (Category) | 14 (82.4%) | 3 (17.6%) |
| Total (Overall) | 23 (14.6%) | 134 (85.4%) |
Employment Industries by Sex in Ideal
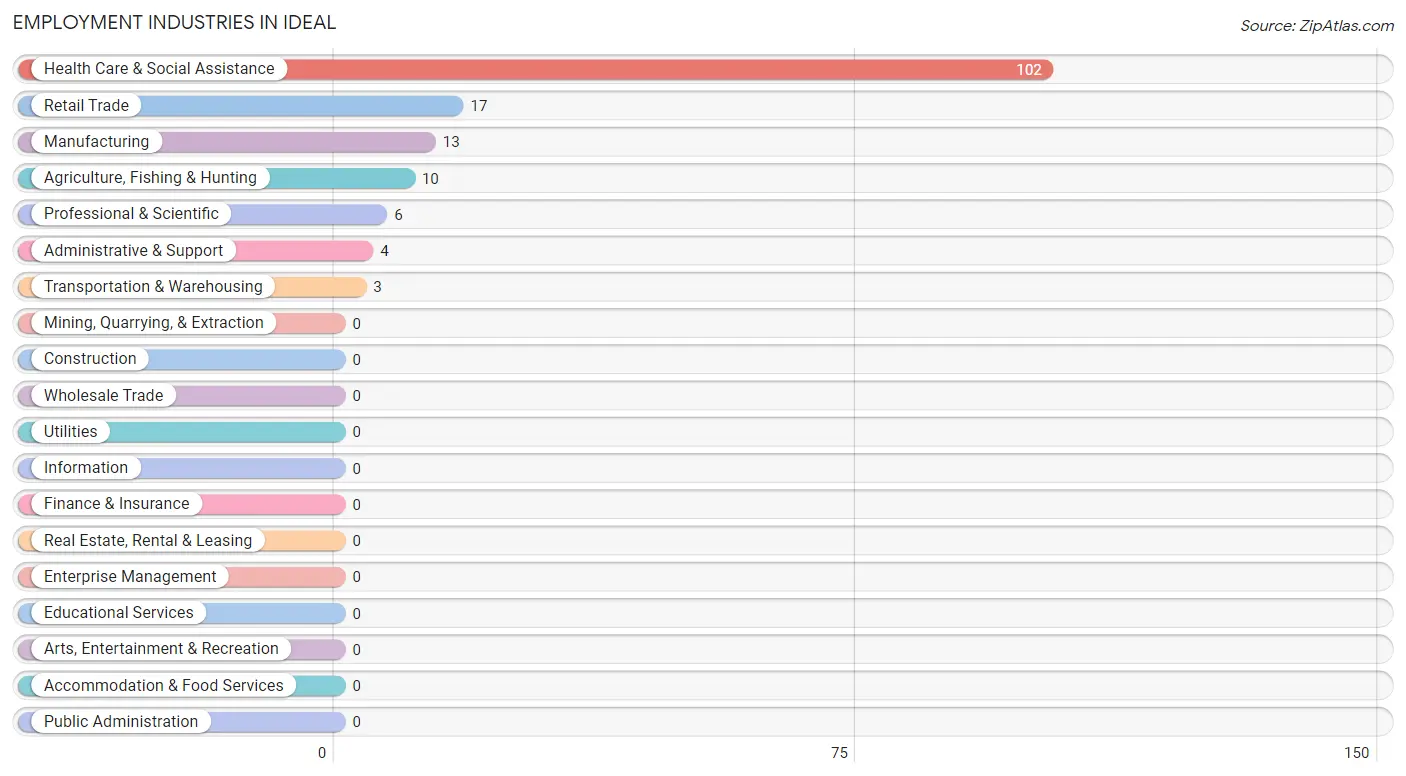
Employment Industries in Ideal
The major employment industries in Ideal include Health Care & Social Assistance (102 | 65.0%), Retail Trade (17 | 10.8%), Manufacturing (13 | 8.3%), Agriculture, Fishing & Hunting (10 | 6.4%), and Professional & Scientific (6 | 3.8%).
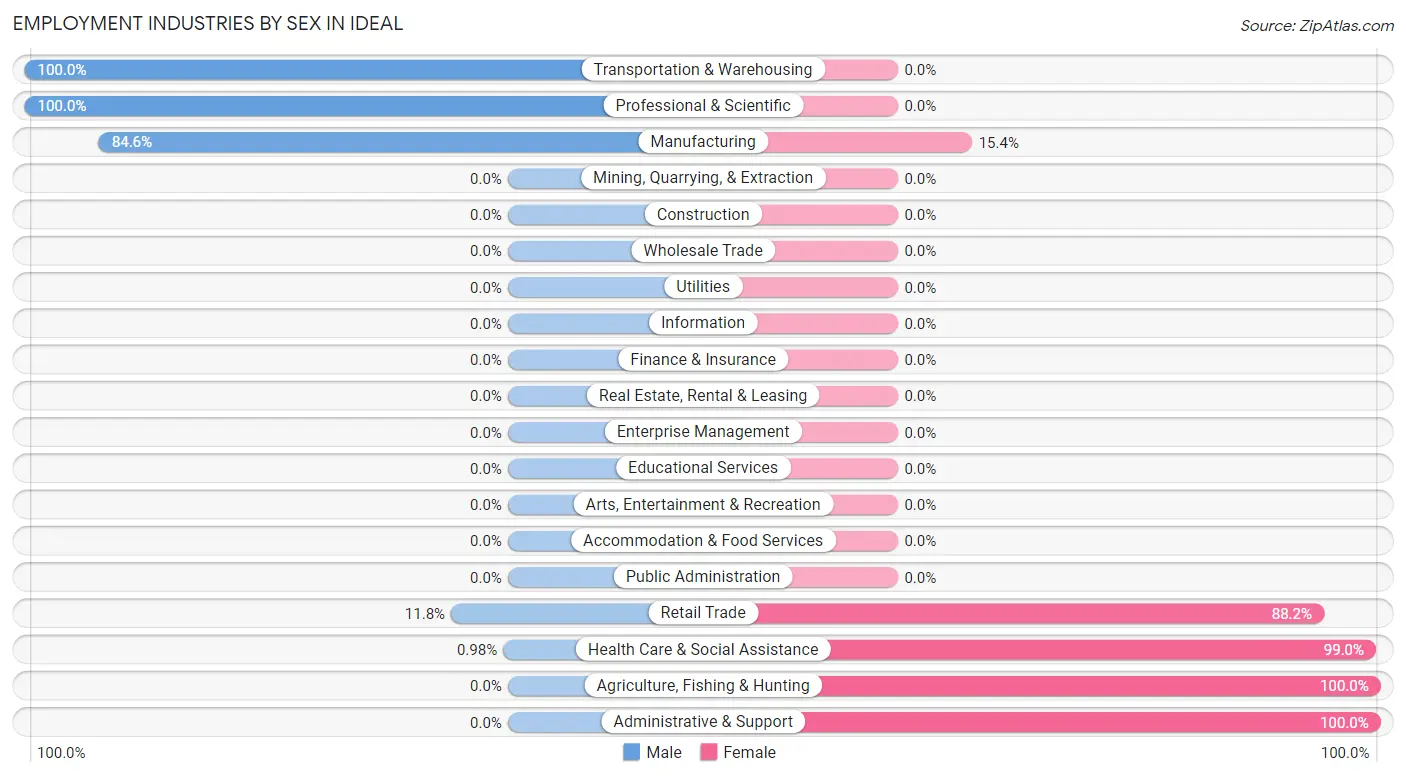
Employment Industries by Sex in Ideal
The Ideal industries that see more men than women are Transportation & Warehousing (100.0%), Professional & Scientific (100.0%), and Manufacturing (84.6%), whereas the industries that tend to have a higher number of women are Agriculture, Fishing & Hunting (100.0%), Administrative & Support (100.0%), and Health Care & Social Assistance (99.0%).
| Industry | Male | Female |
| Agriculture, Fishing & Hunting | 0 (0.0%) | 10 (100.0%) |
| Mining, Quarrying, & Extraction | 0 (0.0%) | 0 (0.0%) |
| Construction | 0 (0.0%) | 0 (0.0%) |
| Manufacturing | 11 (84.6%) | 2 (15.4%) |
| Wholesale Trade | 0 (0.0%) | 0 (0.0%) |
| Retail Trade | 2 (11.8%) | 15 (88.2%) |
| Transportation & Warehousing | 3 (100.0%) | 0 (0.0%) |
| Utilities | 0 (0.0%) | 0 (0.0%) |
| Information | 0 (0.0%) | 0 (0.0%) |
| Finance & Insurance | 0 (0.0%) | 0 (0.0%) |
| Real Estate, Rental & Leasing | 0 (0.0%) | 0 (0.0%) |
| Professional & Scientific | 6 (100.0%) | 0 (0.0%) |
| Enterprise Management | 0 (0.0%) | 0 (0.0%) |
| Administrative & Support | 0 (0.0%) | 4 (100.0%) |
| Educational Services | 0 (0.0%) | 0 (0.0%) |
| Health Care & Social Assistance | 1 (1.0%) | 101 (99.0%) |
| Arts, Entertainment & Recreation | 0 (0.0%) | 0 (0.0%) |
| Accommodation & Food Services | 0 (0.0%) | 0 (0.0%) |
| Public Administration | 0 (0.0%) | 0 (0.0%) |
| Total | 23 (14.6%) | 134 (85.4%) |
Education in Ideal
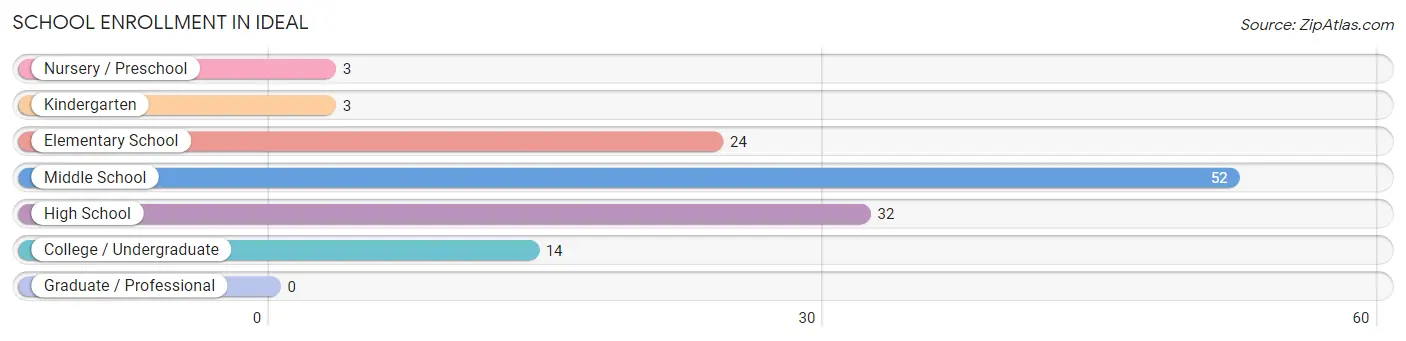
School Enrollment in Ideal
The most common levels of schooling among the 128 students in Ideal are middle school (52 | 40.6%), high school (32 | 25.0%), and elementary school (24 | 18.8%).
| School Level | # Students | % Students |
| Nursery / Preschool | 3 | 2.3% |
| Kindergarten | 3 | 2.3% |
| Elementary School | 24 | 18.8% |
| Middle School | 52 | 40.6% |
| High School | 32 | 25.0% |
| College / Undergraduate | 14 | 10.9% |
| Graduate / Professional | 0 | 0.0% |
| Total | 128 | 100.0% |
School Enrollment by Age by Funding Source in Ideal
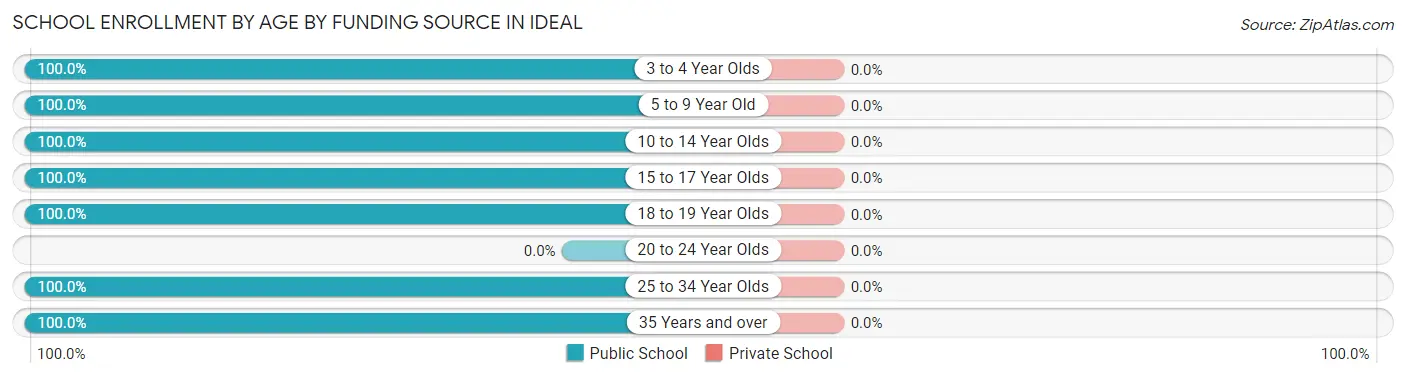
| Age Bracket | Public School | Private School |
| 3 to 4 Year Olds | 3 (100.0%) | 0 (0.0%) |
| 5 to 9 Year Old | 27 (100.0%) | 0 (0.0%) |
| 10 to 14 Year Olds | 59 (100.0%) | 0 (0.0%) |
| 15 to 17 Year Olds | 23 (100.0%) | 0 (0.0%) |
| 18 to 19 Year Olds | 2 (100.0%) | 0 (0.0%) |
| 20 to 24 Year Olds | 0 (0.0%) | 0 (0.0%) |
| 25 to 34 Year Olds | 7 (100.0%) | 0 (0.0%) |
| 35 Years and over | 7 (100.0%) | 0 (0.0%) |
| Total | 128 (100.0%) | 0 (0.0%) |
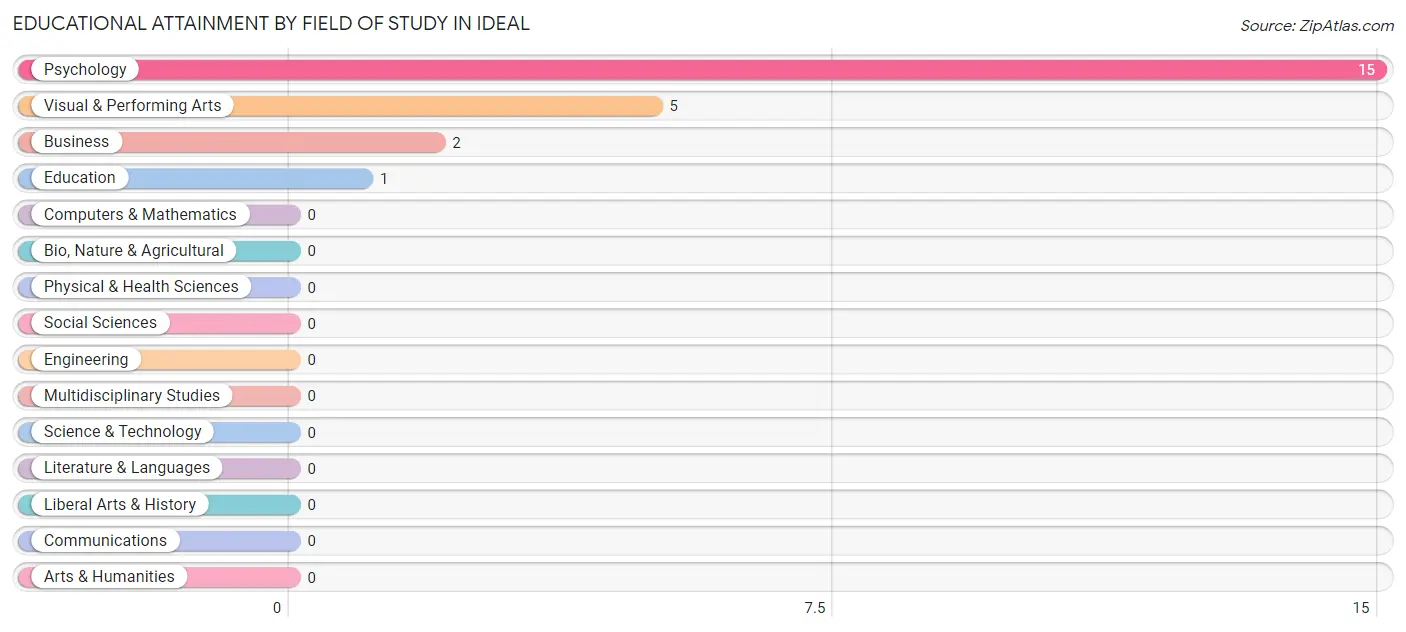
Educational Attainment by Field of Study in Ideal
Psychology (15 | 65.2%), visual & performing arts (5 | 21.7%), business (2 | 8.7%), and education (1 | 4.3%) are the most common fields of study among 23 individuals in Ideal who have obtained a bachelor's degree or higher.
| Field of Study | # Graduates | % Graduates |
| Computers & Mathematics | 0 | 0.0% |
| Bio, Nature & Agricultural | 0 | 0.0% |
| Physical & Health Sciences | 0 | 0.0% |
| Psychology | 15 | 65.2% |
| Social Sciences | 0 | 0.0% |
| Engineering | 0 | 0.0% |
| Multidisciplinary Studies | 0 | 0.0% |
| Science & Technology | 0 | 0.0% |
| Business | 2 | 8.7% |
| Education | 1 | 4.3% |
| Literature & Languages | 0 | 0.0% |
| Liberal Arts & History | 0 | 0.0% |
| Visual & Performing Arts | 5 | 21.7% |
| Communications | 0 | 0.0% |
| Arts & Humanities | 0 | 0.0% |
| Total | 23 | 100.0% |
Transportation & Commute in Ideal
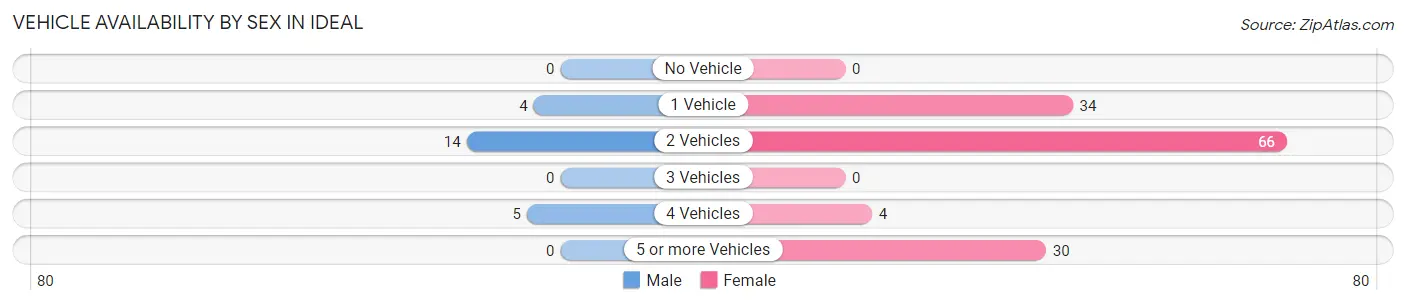
Vehicle Availability by Sex in Ideal
The most prevalent vehicle ownership categories in Ideal are males with 2 vehicles (14, accounting for 60.9%) and females with 2 vehicles (66, making up 10.4%).
| Vehicles Available | Male | Female |
| No Vehicle | 0 (0.0%) | 0 (0.0%) |
| 1 Vehicle | 4 (17.4%) | 34 (25.4%) |
| 2 Vehicles | 14 (60.9%) | 66 (49.2%) |
| 3 Vehicles | 0 (0.0%) | 0 (0.0%) |
| 4 Vehicles | 5 (21.7%) | 4 (3.0%) |
| 5 or more Vehicles | 0 (0.0%) | 30 (22.4%) |
| Total | 23 (100.0%) | 134 (100.0%) |
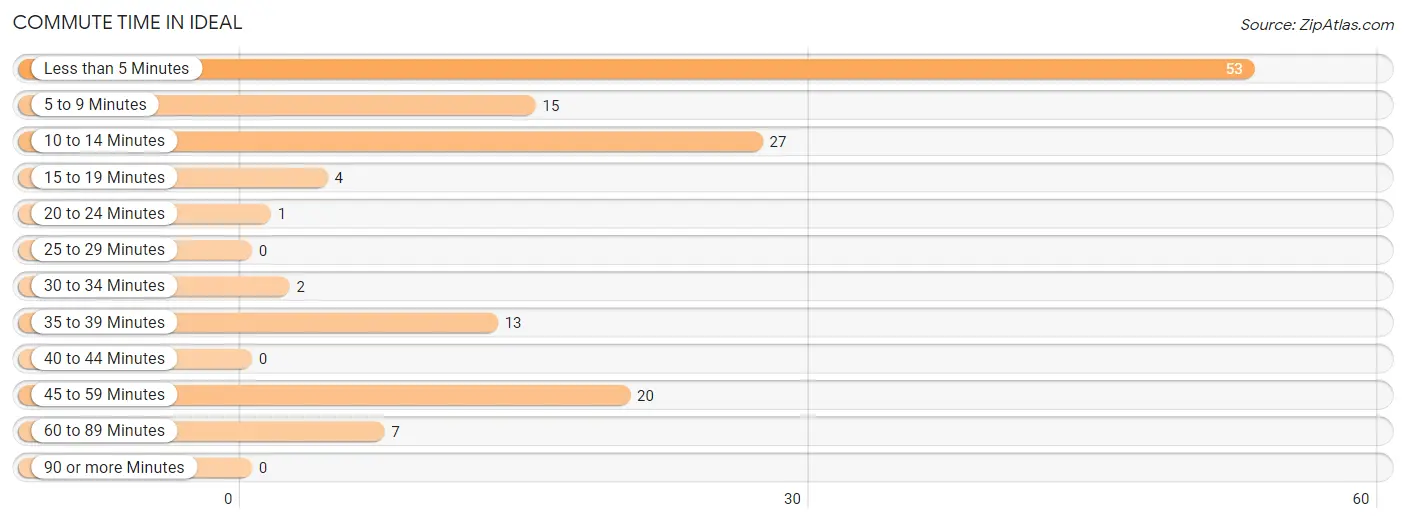
Commute Time in Ideal
The most frequently occuring commute durations in Ideal are less than 5 minutes (53 commuters, 37.3%), 10 to 14 minutes (27 commuters, 19.0%), and 45 to 59 minutes (20 commuters, 14.1%).
| Commute Time | # Commuters | % Commuters |
| Less than 5 Minutes | 53 | 37.3% |
| 5 to 9 Minutes | 15 | 10.6% |
| 10 to 14 Minutes | 27 | 19.0% |
| 15 to 19 Minutes | 4 | 2.8% |
| 20 to 24 Minutes | 1 | 0.7% |
| 25 to 29 Minutes | 0 | 0.0% |
| 30 to 34 Minutes | 2 | 1.4% |
| 35 to 39 Minutes | 13 | 9.1% |
| 40 to 44 Minutes | 0 | 0.0% |
| 45 to 59 Minutes | 20 | 14.1% |
| 60 to 89 Minutes | 7 | 4.9% |
| 90 or more Minutes | 0 | 0.0% |
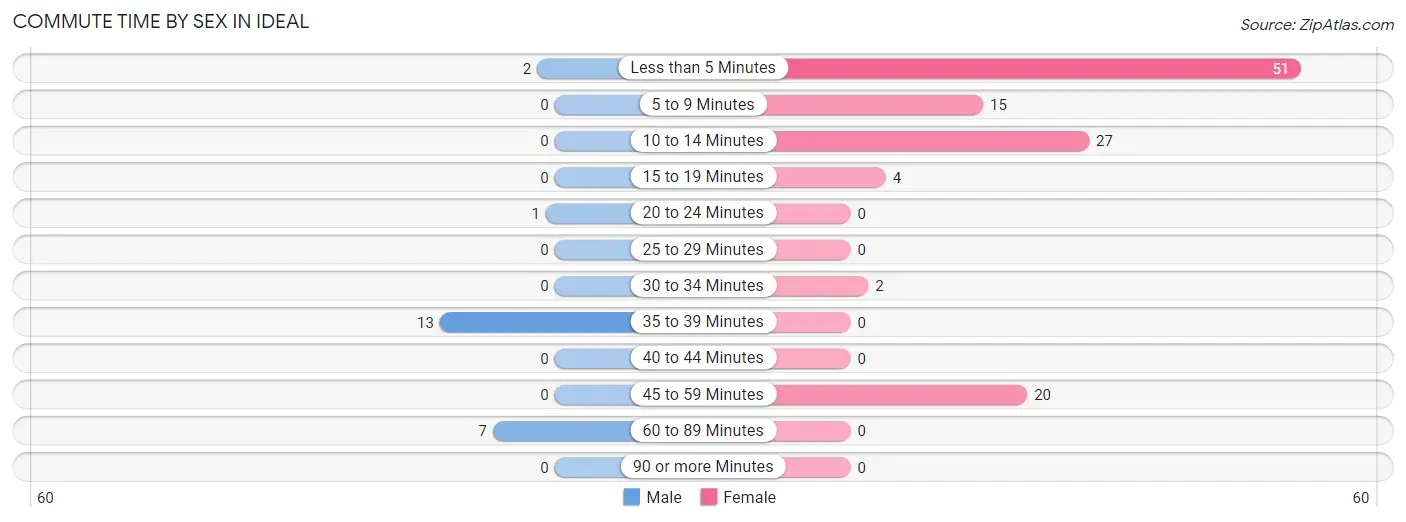
Commute Time by Sex in Ideal
The most common commute times in Ideal are 35 to 39 minutes (13 commuters, 56.5%) for males and less than 5 minutes (51 commuters, 42.9%) for females.
| Commute Time | Male | Female |
| Less than 5 Minutes | 2 (8.7%) | 51 (42.9%) |
| 5 to 9 Minutes | 0 (0.0%) | 15 (12.6%) |
| 10 to 14 Minutes | 0 (0.0%) | 27 (22.7%) |
| 15 to 19 Minutes | 0 (0.0%) | 4 (3.4%) |
| 20 to 24 Minutes | 1 (4.3%) | 0 (0.0%) |
| 25 to 29 Minutes | 0 (0.0%) | 0 (0.0%) |
| 30 to 34 Minutes | 0 (0.0%) | 2 (1.7%) |
| 35 to 39 Minutes | 13 (56.5%) | 0 (0.0%) |
| 40 to 44 Minutes | 0 (0.0%) | 0 (0.0%) |
| 45 to 59 Minutes | 0 (0.0%) | 20 (16.8%) |
| 60 to 89 Minutes | 7 (30.4%) | 0 (0.0%) |
| 90 or more Minutes | 0 (0.0%) | 0 (0.0%) |
Time of Departure to Work by Sex in Ideal
The most frequent times of departure to work in Ideal are 12:00 AM to 4:59 AM (13, 56.5%) for males and 6:00 AM to 6:29 AM (56, 47.1%) for females.
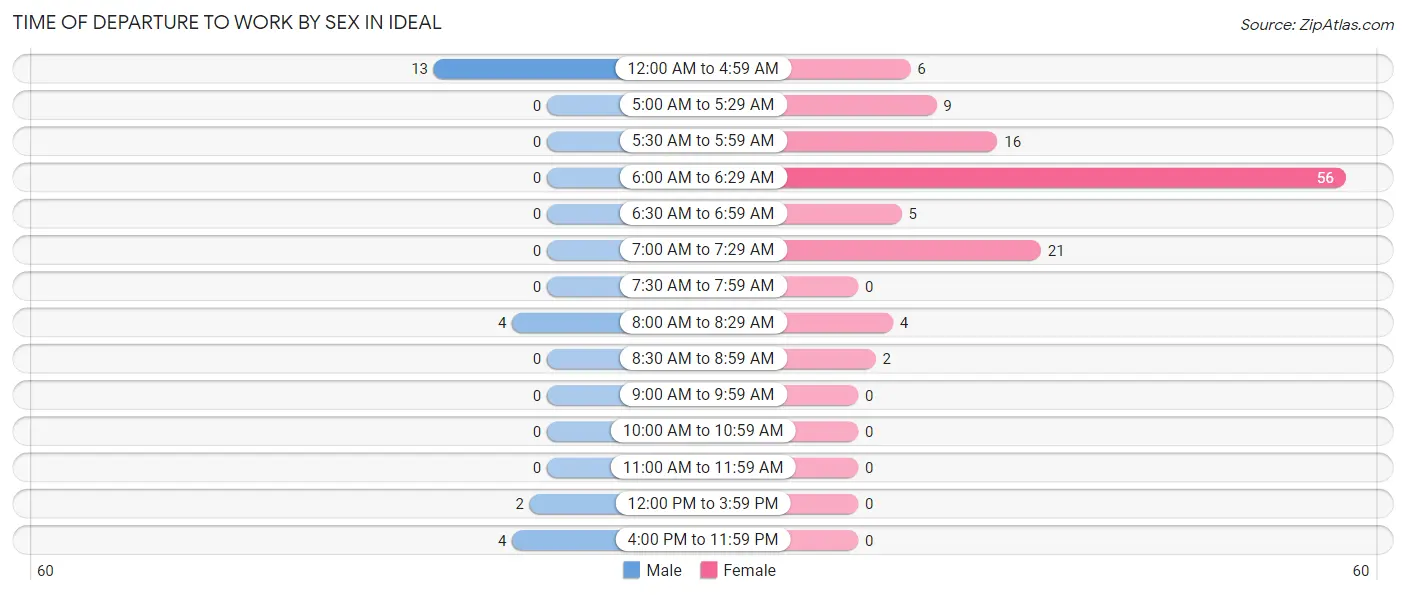
| Time of Departure | Male | Female |
| 12:00 AM to 4:59 AM | 13 (56.5%) | 6 (5.0%) |
| 5:00 AM to 5:29 AM | 0 (0.0%) | 9 (7.6%) |
| 5:30 AM to 5:59 AM | 0 (0.0%) | 16 (13.5%) |
| 6:00 AM to 6:29 AM | 0 (0.0%) | 56 (47.1%) |
| 6:30 AM to 6:59 AM | 0 (0.0%) | 5 (4.2%) |
| 7:00 AM to 7:29 AM | 0 (0.0%) | 21 (17.6%) |
| 7:30 AM to 7:59 AM | 0 (0.0%) | 0 (0.0%) |
| 8:00 AM to 8:29 AM | 4 (17.4%) | 4 (3.4%) |
| 8:30 AM to 8:59 AM | 0 (0.0%) | 2 (1.7%) |
| 9:00 AM to 9:59 AM | 0 (0.0%) | 0 (0.0%) |
| 10:00 AM to 10:59 AM | 0 (0.0%) | 0 (0.0%) |
| 11:00 AM to 11:59 AM | 0 (0.0%) | 0 (0.0%) |
| 12:00 PM to 3:59 PM | 2 (8.7%) | 0 (0.0%) |
| 4:00 PM to 11:59 PM | 4 (17.4%) | 0 (0.0%) |
| Total | 23 (100.0%) | 119 (100.0%) |
Housing Occupancy in Ideal
Occupancy by Ownership in Ideal
Of the total 182 dwellings in Ideal, owner-occupied units account for 93 (51.1%), while renter-occupied units make up 89 (48.9%).
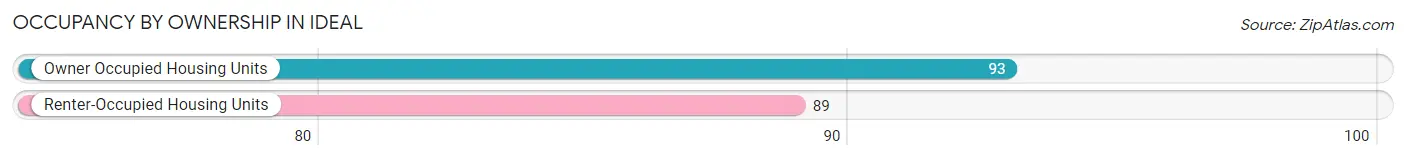
| Occupancy | # Housing Units | % Housing Units |
| Owner Occupied Housing Units | 93 | 51.1% |
| Renter-Occupied Housing Units | 89 | 48.9% |
| Total Occupied Housing Units | 182 | 100.0% |
Occupancy by Household Size in Ideal
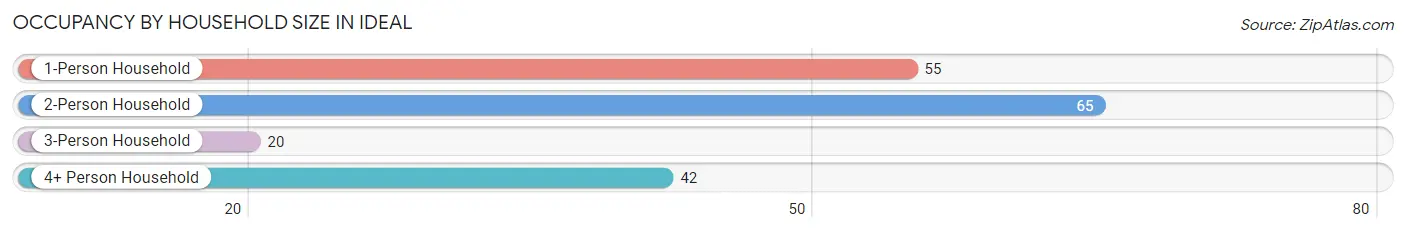
| Household Size | # Housing Units | % Housing Units |
| 1-Person Household | 55 | 30.2% |
| 2-Person Household | 65 | 35.7% |
| 3-Person Household | 20 | 11.0% |
| 4+ Person Household | 42 | 23.1% |
| Total Housing Units | 182 | 100.0% |
Occupancy by Ownership by Household Size in Ideal
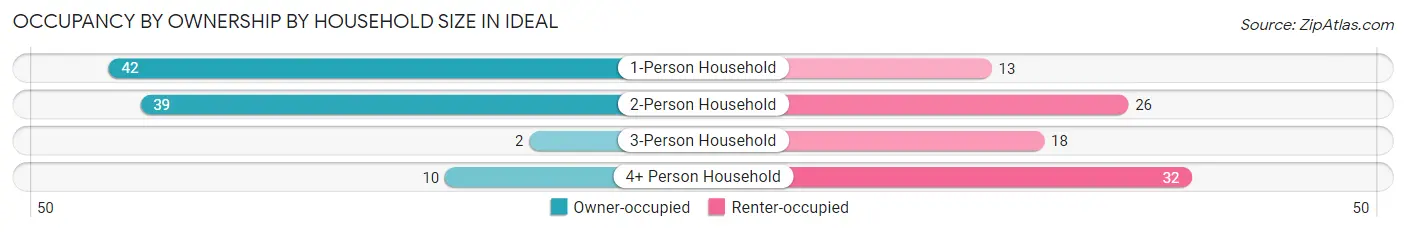
| Household Size | Owner-occupied | Renter-occupied |
| 1-Person Household | 42 (76.4%) | 13 (23.6%) |
| 2-Person Household | 39 (60.0%) | 26 (40.0%) |
| 3-Person Household | 2 (10.0%) | 18 (90.0%) |
| 4+ Person Household | 10 (23.8%) | 32 (76.2%) |
| Total Housing Units | 93 (51.1%) | 89 (48.9%) |
Occupancy by Educational Attainment in Ideal
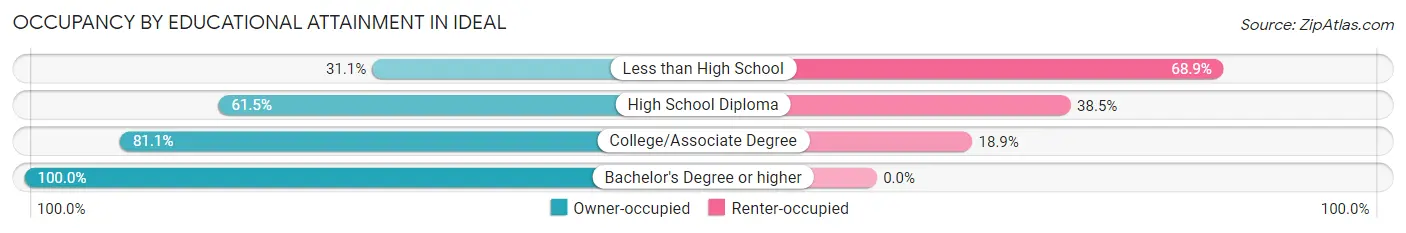
| Household Size | Owner-occupied | Renter-occupied |
| Less than High School | 28 (31.1%) | 62 (68.9%) |
| High School Diploma | 32 (61.5%) | 20 (38.5%) |
| College/Associate Degree | 30 (81.1%) | 7 (18.9%) |
| Bachelor's Degree or higher | 3 (100.0%) | 0 (0.0%) |
Occupancy by Age of Householder in Ideal
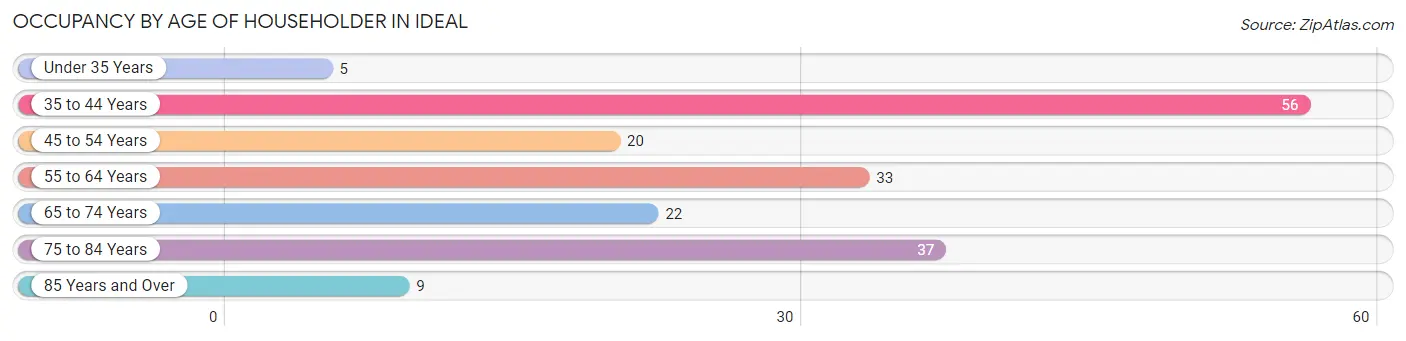
| Age Bracket | # Households | % Households |
| Under 35 Years | 5 | 2.8% |
| 35 to 44 Years | 56 | 30.8% |
| 45 to 54 Years | 20 | 11.0% |
| 55 to 64 Years | 33 | 18.1% |
| 65 to 74 Years | 22 | 12.1% |
| 75 to 84 Years | 37 | 20.3% |
| 85 Years and Over | 9 | 5.0% |
| Total | 182 | 100.0% |
Housing Finances in Ideal
Median Income by Occupancy in Ideal
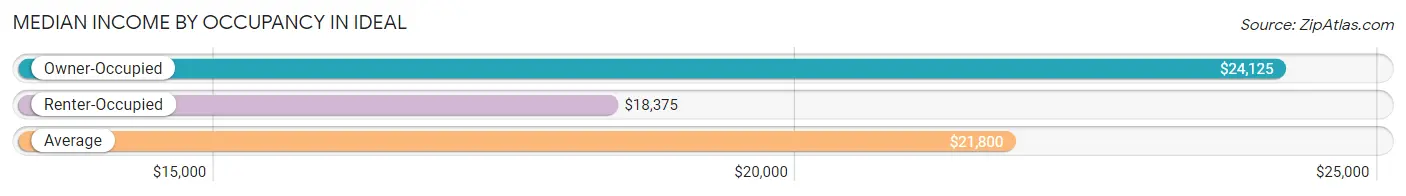
| Occupancy Type | # Households | Median Income |
| Owner-Occupied | 93 (51.1%) | $24,125 |
| Renter-Occupied | 89 (48.9%) | $18,375 |
| Average | 182 (100.0%) | $21,800 |
Occupancy by Householder Income Bracket in Ideal
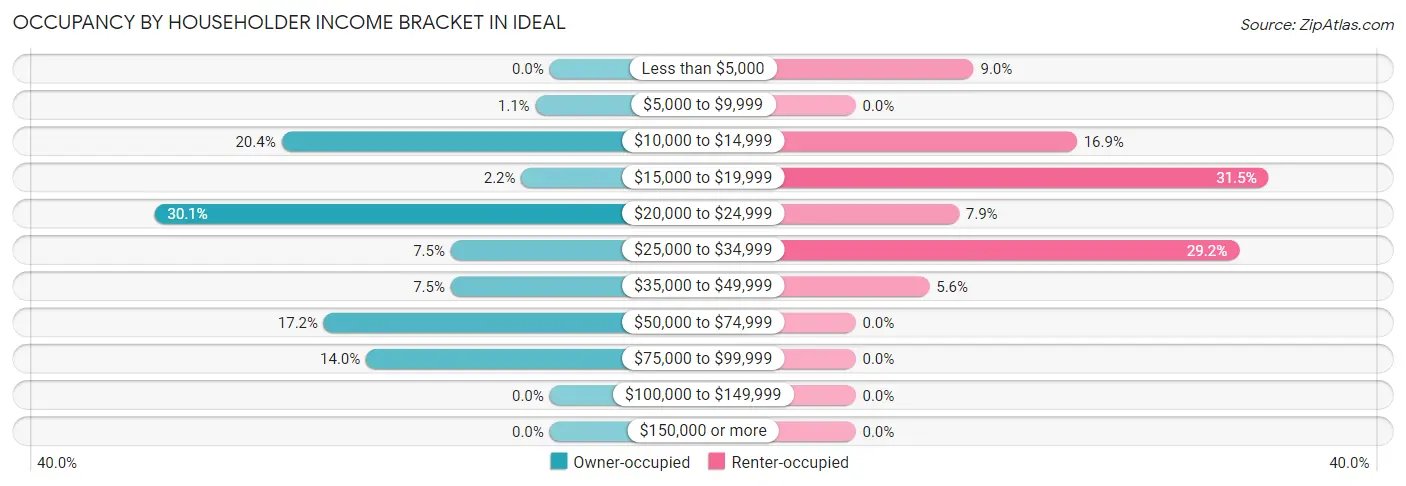
| Income Bracket | Owner-occupied | Renter-occupied |
| Less than $5,000 | 0 (0.0%) | 8 (9.0%) |
| $5,000 to $9,999 | 1 (1.1%) | 0 (0.0%) |
| $10,000 to $14,999 | 19 (20.4%) | 15 (16.9%) |
| $15,000 to $19,999 | 2 (2.1%) | 28 (31.5%) |
| $20,000 to $24,999 | 28 (30.1%) | 7 (7.9%) |
| $25,000 to $34,999 | 7 (7.5%) | 26 (29.2%) |
| $35,000 to $49,999 | 7 (7.5%) | 5 (5.6%) |
| $50,000 to $74,999 | 16 (17.2%) | 0 (0.0%) |
| $75,000 to $99,999 | 13 (14.0%) | 0 (0.0%) |
| $100,000 to $149,999 | 0 (0.0%) | 0 (0.0%) |
| $150,000 or more | 0 (0.0%) | 0 (0.0%) |
| Total | 93 (100.0%) | 89 (100.0%) |
Monthly Housing Cost Tiers in Ideal
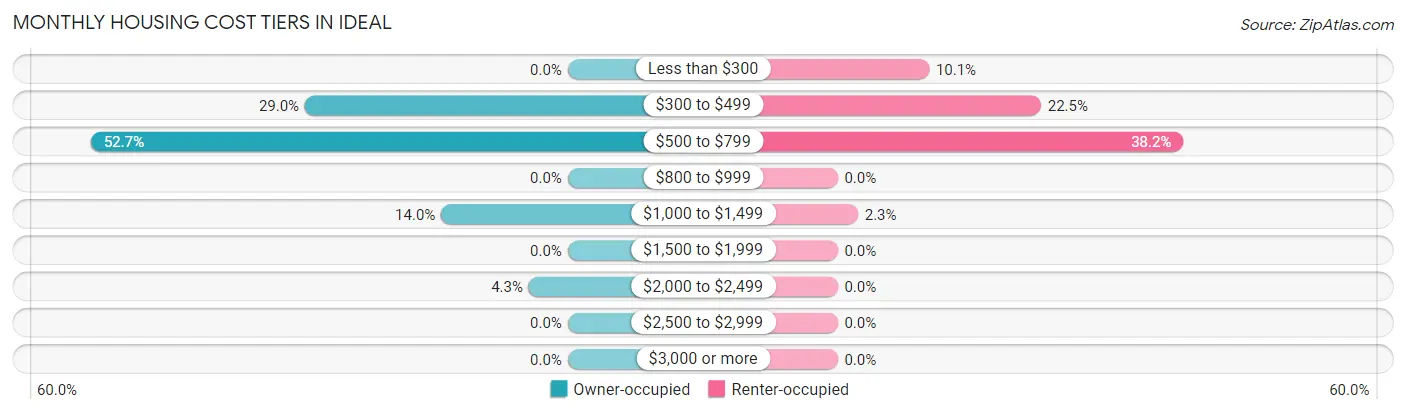
| Monthly Cost | Owner-occupied | Renter-occupied |
| Less than $300 | 0 (0.0%) | 9 (10.1%) |
| $300 to $499 | 27 (29.0%) | 20 (22.5%) |
| $500 to $799 | 49 (52.7%) | 34 (38.2%) |
| $800 to $999 | 0 (0.0%) | 0 (0.0%) |
| $1,000 to $1,499 | 13 (14.0%) | 2 (2.2%) |
| $1,500 to $1,999 | 0 (0.0%) | 0 (0.0%) |
| $2,000 to $2,499 | 4 (4.3%) | 0 (0.0%) |
| $2,500 to $2,999 | 0 (0.0%) | 0 (0.0%) |
| $3,000 or more | 0 (0.0%) | 0 (0.0%) |
| Total | 93 (100.0%) | 89 (100.0%) |
Physical Housing Characteristics in Ideal
Housing Structures in Ideal
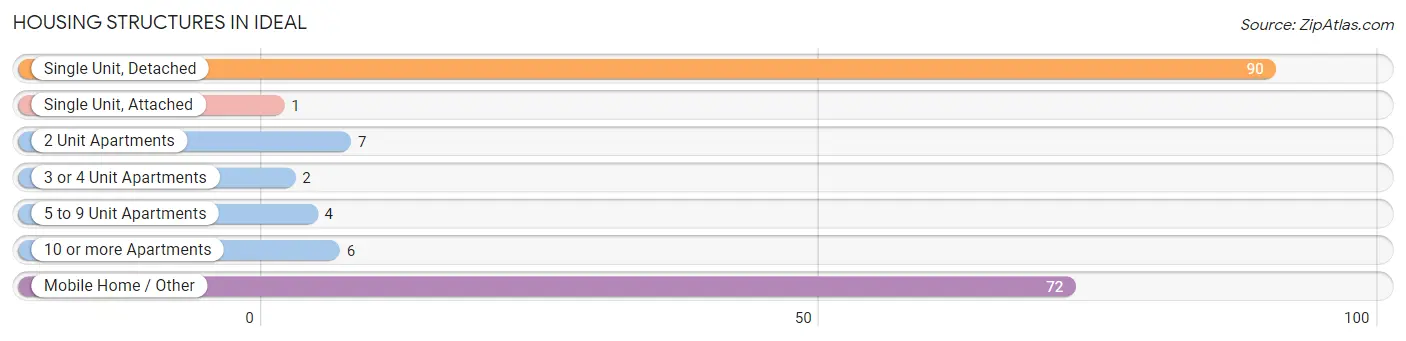
| Structure Type | # Housing Units | % Housing Units |
| Single Unit, Detached | 90 | 49.4% |
| Single Unit, Attached | 1 | 0.5% |
| 2 Unit Apartments | 7 | 3.8% |
| 3 or 4 Unit Apartments | 2 | 1.1% |
| 5 to 9 Unit Apartments | 4 | 2.2% |
| 10 or more Apartments | 6 | 3.3% |
| Mobile Home / Other | 72 | 39.6% |
| Total | 182 | 100.0% |
Housing Structures by Occupancy in Ideal
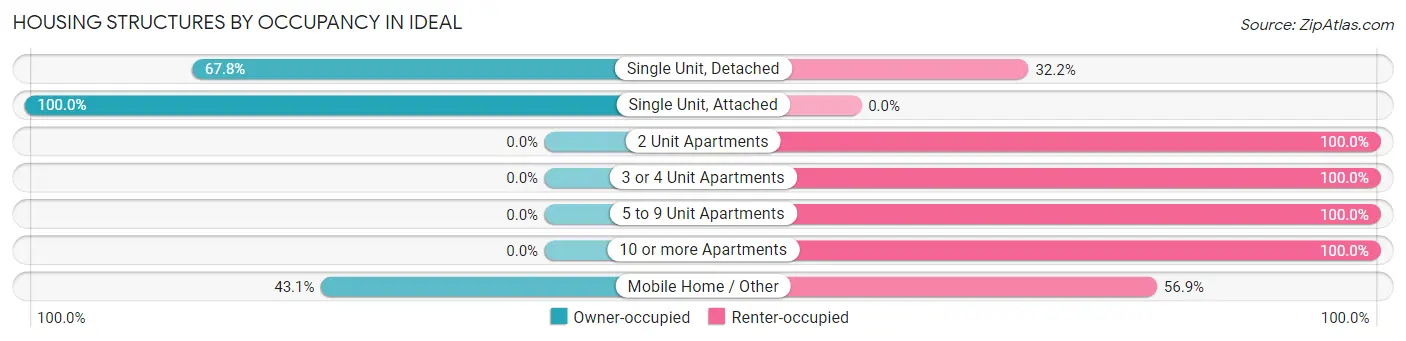
| Structure Type | Owner-occupied | Renter-occupied |
| Single Unit, Detached | 61 (67.8%) | 29 (32.2%) |
| Single Unit, Attached | 1 (100.0%) | 0 (0.0%) |
| 2 Unit Apartments | 0 (0.0%) | 7 (100.0%) |
| 3 or 4 Unit Apartments | 0 (0.0%) | 2 (100.0%) |
| 5 to 9 Unit Apartments | 0 (0.0%) | 4 (100.0%) |
| 10 or more Apartments | 0 (0.0%) | 6 (100.0%) |
| Mobile Home / Other | 31 (43.1%) | 41 (56.9%) |
| Total | 93 (51.1%) | 89 (48.9%) |
Housing Structures by Number of Rooms in Ideal
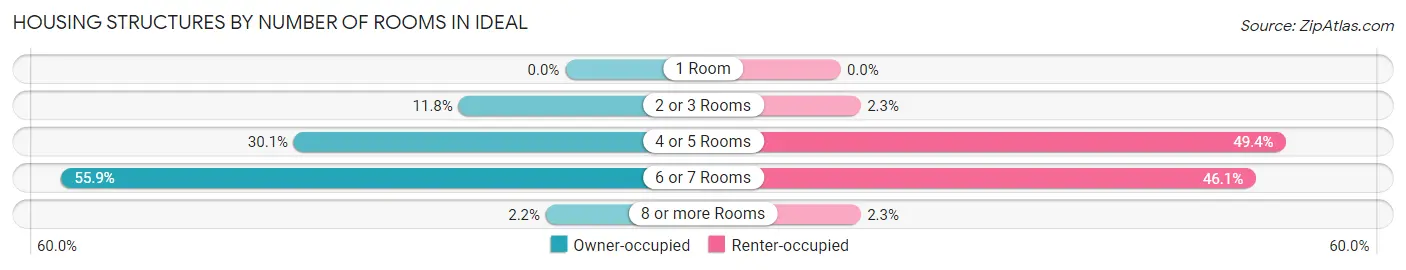
| Number of Rooms | Owner-occupied | Renter-occupied |
| 1 Room | 0 (0.0%) | 0 (0.0%) |
| 2 or 3 Rooms | 11 (11.8%) | 2 (2.2%) |
| 4 or 5 Rooms | 28 (30.1%) | 44 (49.4%) |
| 6 or 7 Rooms | 52 (55.9%) | 41 (46.1%) |
| 8 or more Rooms | 2 (2.1%) | 2 (2.2%) |
| Total | 93 (100.0%) | 89 (100.0%) |
Housing Structure by Heating Type in Ideal
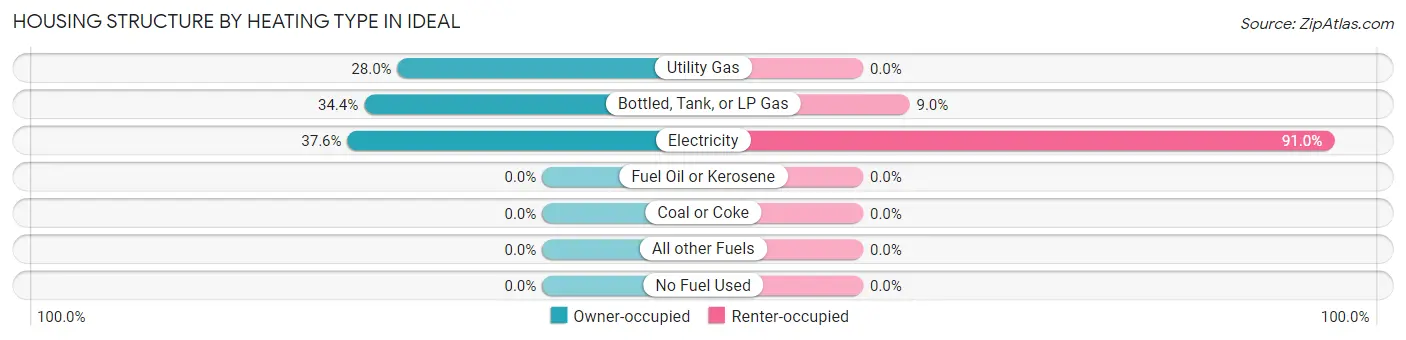
| Heating Type | Owner-occupied | Renter-occupied |
| Utility Gas | 26 (28.0%) | 0 (0.0%) |
| Bottled, Tank, or LP Gas | 32 (34.4%) | 8 (9.0%) |
| Electricity | 35 (37.6%) | 81 (91.0%) |
| Fuel Oil or Kerosene | 0 (0.0%) | 0 (0.0%) |
| Coal or Coke | 0 (0.0%) | 0 (0.0%) |
| All other Fuels | 0 (0.0%) | 0 (0.0%) |
| No Fuel Used | 0 (0.0%) | 0 (0.0%) |
| Total | 93 (100.0%) | 89 (100.0%) |
Household Vehicle Usage in Ideal
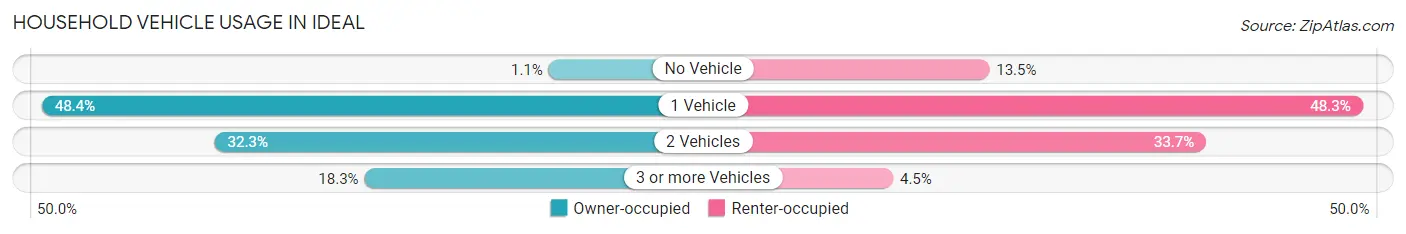
| Vehicles per Household | Owner-occupied | Renter-occupied |
| No Vehicle | 1 (1.1%) | 12 (13.5%) |
| 1 Vehicle | 45 (48.4%) | 43 (48.3%) |
| 2 Vehicles | 30 (32.3%) | 30 (33.7%) |
| 3 or more Vehicles | 17 (18.3%) | 4 (4.5%) |
| Total | 93 (100.0%) | 89 (100.0%) |
Real Estate & Mortgages in Ideal
Real Estate and Mortgage Overview in Ideal
| Characteristic | Without Mortgage | With Mortgage |
| Housing Units | 72 | 21 |
| Median Property Value | - | - |
| Median Household Income | $24,250 | $0 |
| Monthly Housing Costs | $533 | $0 |
| Real Estate Taxes | $640 | $0 |
Property Value by Mortgage Status in Ideal
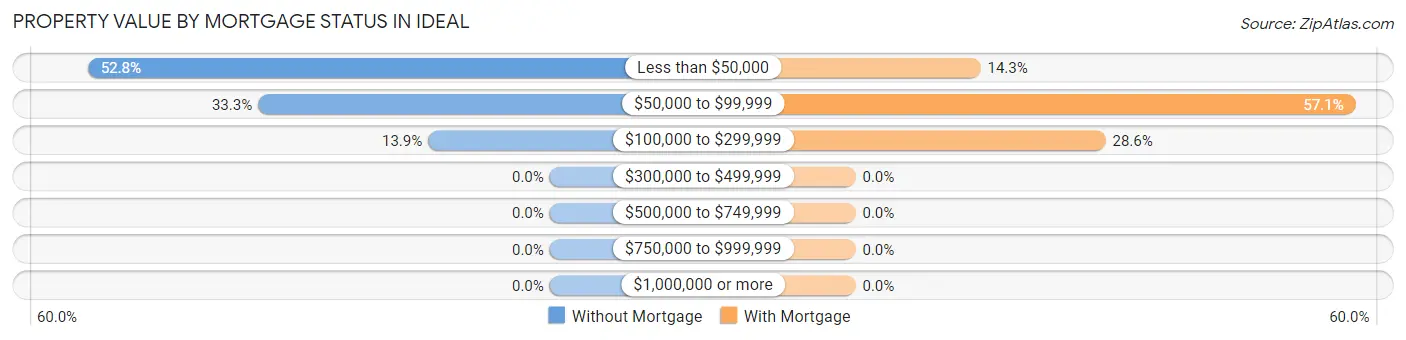
| Property Value | Without Mortgage | With Mortgage |
| Less than $50,000 | 38 (52.8%) | 3 (14.3%) |
| $50,000 to $99,999 | 24 (33.3%) | 12 (57.1%) |
| $100,000 to $299,999 | 10 (13.9%) | 6 (28.6%) |
| $300,000 to $499,999 | 0 (0.0%) | 0 (0.0%) |
| $500,000 to $749,999 | 0 (0.0%) | 0 (0.0%) |
| $750,000 to $999,999 | 0 (0.0%) | 0 (0.0%) |
| $1,000,000 or more | 0 (0.0%) | 0 (0.0%) |
| Total | 72 (100.0%) | 21 (100.0%) |
Household Income by Mortgage Status in Ideal
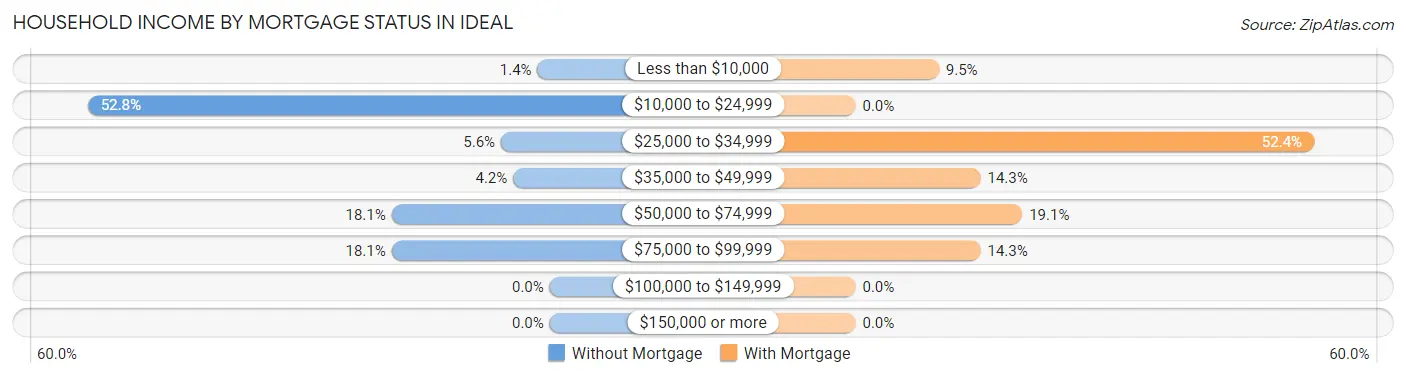
| Household Income | Without Mortgage | With Mortgage |
| Less than $10,000 | 1 (1.4%) | 2 (9.5%) |
| $10,000 to $24,999 | 38 (52.8%) | 0 (0.0%) |
| $25,000 to $34,999 | 4 (5.6%) | 11 (52.4%) |
| $35,000 to $49,999 | 3 (4.2%) | 3 (14.3%) |
| $50,000 to $74,999 | 13 (18.1%) | 4 (19.1%) |
| $75,000 to $99,999 | 13 (18.1%) | 3 (14.3%) |
| $100,000 to $149,999 | 0 (0.0%) | 0 (0.0%) |
| $150,000 or more | 0 (0.0%) | 0 (0.0%) |
| Total | 72 (100.0%) | 21 (100.0%) |
Property Value to Household Income Ratio in Ideal
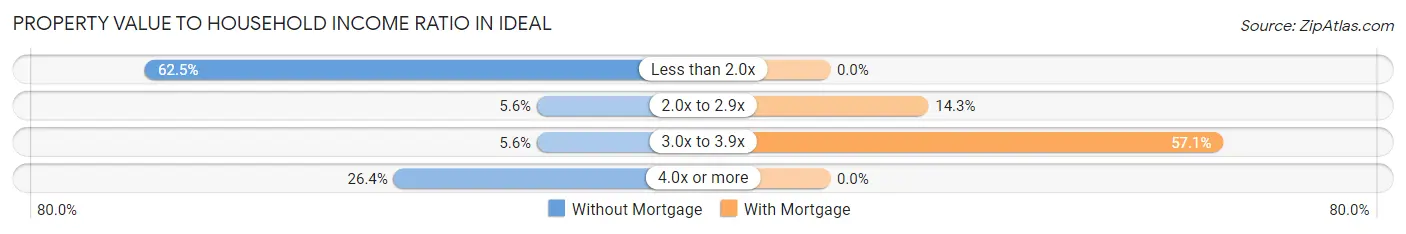
| Value-to-Income Ratio | Without Mortgage | With Mortgage |
| Less than 2.0x | 45 (62.5%) | 0 (0.0%) |
| 2.0x to 2.9x | 4 (5.6%) | 3 (14.3%) |
| 3.0x to 3.9x | 4 (5.6%) | 12 (57.1%) |
| 4.0x or more | 19 (26.4%) | 0 (0.0%) |
| Total | 72 (100.0%) | 21 (100.0%) |
Real Estate Taxes by Mortgage Status in Ideal
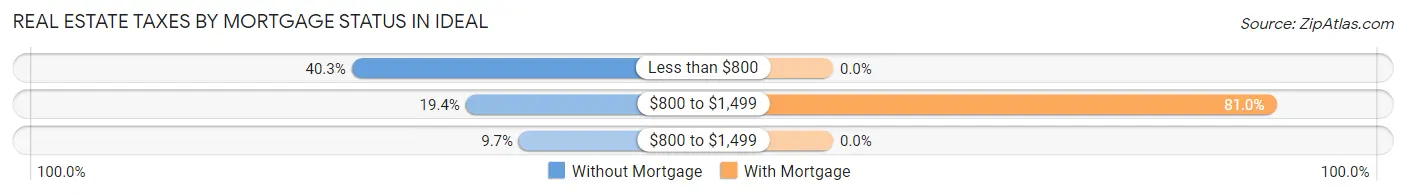
| Property Taxes | Without Mortgage | With Mortgage |
| Less than $800 | 29 (40.3%) | 0 (0.0%) |
| $800 to $1,499 | 14 (19.4%) | 17 (80.9%) |
| $800 to $1,499 | 7 (9.7%) | 0 (0.0%) |
| Total | 72 (100.0%) | 21 (100.0%) |
Health & Disability in Ideal
Health Insurance Coverage by Age in Ideal
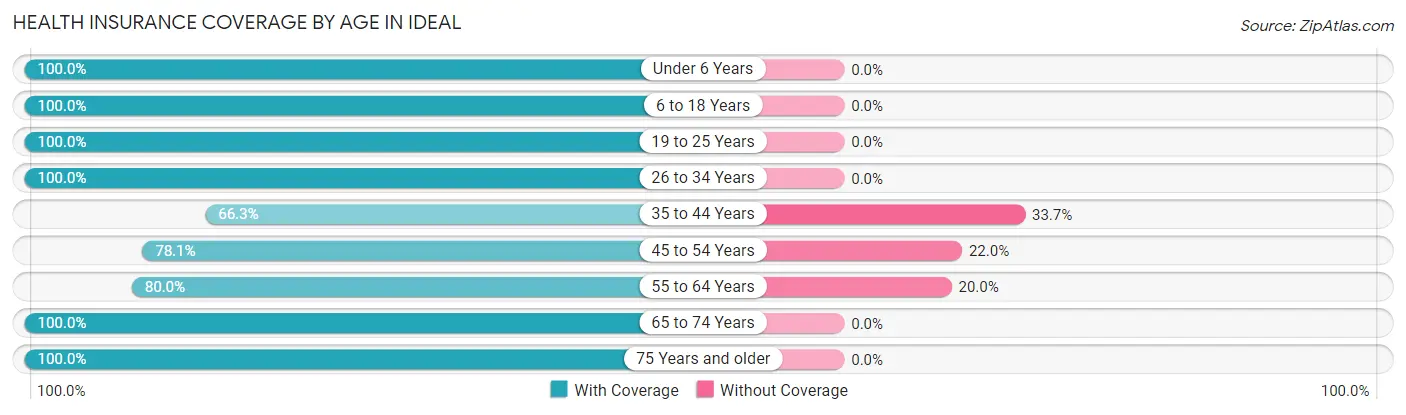
| Age Bracket | With Coverage | Without Coverage |
| Under 6 Years | 62 (100.0%) | 0 (0.0%) |
| 6 to 18 Years | 166 (100.0%) | 0 (0.0%) |
| 19 to 25 Years | 52 (100.0%) | 0 (0.0%) |
| 26 to 34 Years | 6 (100.0%) | 0 (0.0%) |
| 35 to 44 Years | 61 (66.3%) | 31 (33.7%) |
| 45 to 54 Years | 32 (78.0%) | 9 (22.0%) |
| 55 to 64 Years | 32 (80.0%) | 8 (20.0%) |
| 65 to 74 Years | 29 (100.0%) | 0 (0.0%) |
| 75 Years and older | 50 (100.0%) | 0 (0.0%) |
| Total | 490 (91.1%) | 48 (8.9%) |
Health Insurance Coverage by Citizenship Status in Ideal
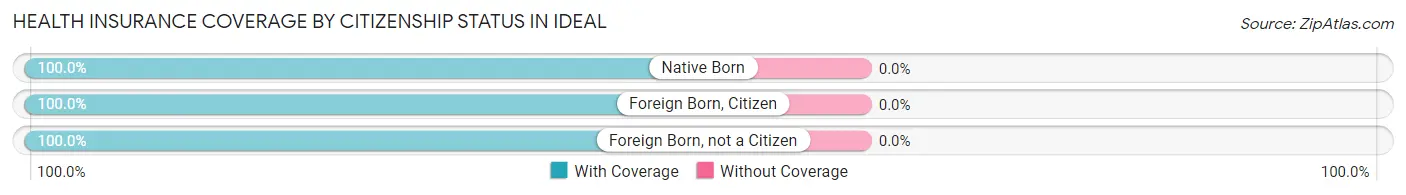
| Citizenship Status | With Coverage | Without Coverage |
| Native Born | 62 (100.0%) | 0 (0.0%) |
| Foreign Born, Citizen | 166 (100.0%) | 0 (0.0%) |
| Foreign Born, not a Citizen | 52 (100.0%) | 0 (0.0%) |
Health Insurance Coverage by Household Income in Ideal
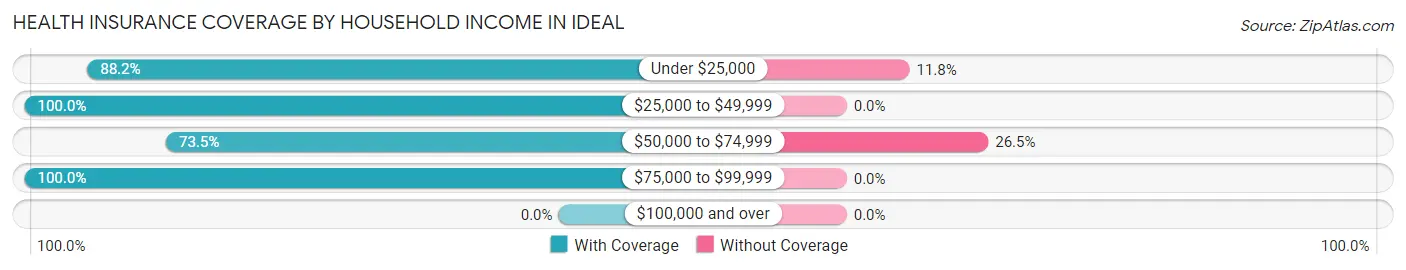
| Household Income | With Coverage | Without Coverage |
| Under $25,000 | 195 (88.2%) | 26 (11.8%) |
| $25,000 to $49,999 | 206 (100.0%) | 0 (0.0%) |
| $50,000 to $74,999 | 61 (73.5%) | 22 (26.5%) |
| $75,000 to $99,999 | 28 (100.0%) | 0 (0.0%) |
| $100,000 and over | 0 (0.0%) | 0 (0.0%) |
Public vs Private Health Insurance Coverage by Age in Ideal
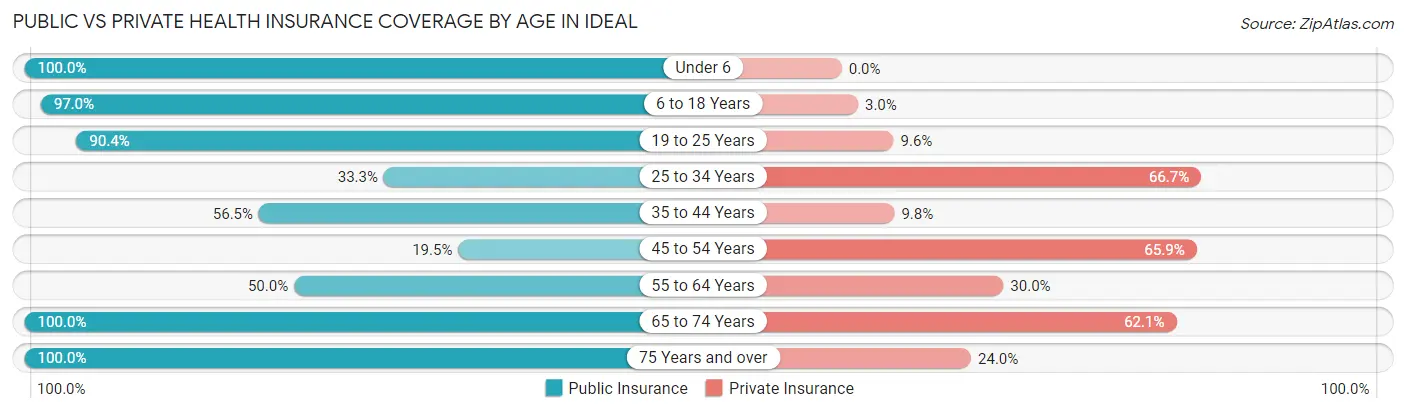
| Age Bracket | Public Insurance | Private Insurance |
| Under 6 | 62 (100.0%) | 0 (0.0%) |
| 6 to 18 Years | 161 (97.0%) | 5 (3.0%) |
| 19 to 25 Years | 47 (90.4%) | 5 (9.6%) |
| 25 to 34 Years | 2 (33.3%) | 4 (66.7%) |
| 35 to 44 Years | 52 (56.5%) | 9 (9.8%) |
| 45 to 54 Years | 8 (19.5%) | 27 (65.8%) |
| 55 to 64 Years | 20 (50.0%) | 12 (30.0%) |
| 65 to 74 Years | 29 (100.0%) | 18 (62.1%) |
| 75 Years and over | 50 (100.0%) | 12 (24.0%) |
| Total | 431 (80.1%) | 92 (17.1%) |
Disability Status by Sex by Age in Ideal
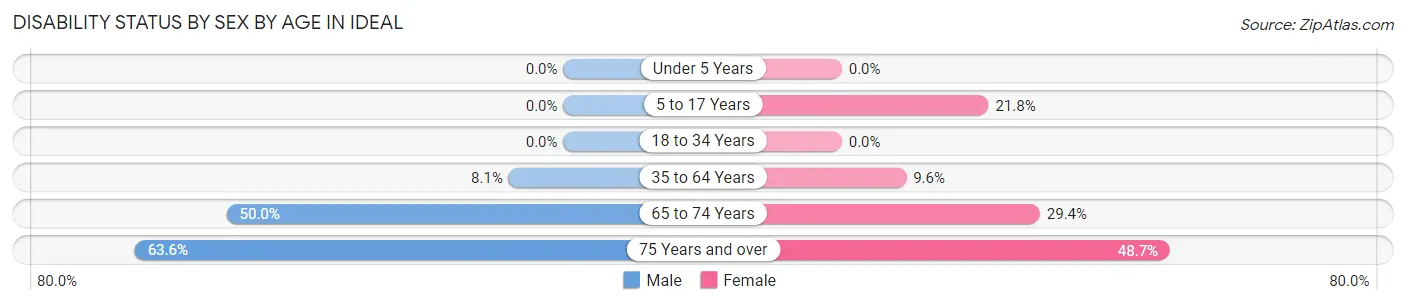
| Age Bracket | Male | Female |
| Under 5 Years | 0 (0.0%) | 0 (0.0%) |
| 5 to 17 Years | 0 (0.0%) | 22 (21.8%) |
| 18 to 34 Years | 0 (0.0%) | 0 (0.0%) |
| 35 to 64 Years | 3 (8.1%) | 13 (9.6%) |
| 65 to 74 Years | 6 (50.0%) | 5 (29.4%) |
| 75 Years and over | 7 (63.6%) | 19 (48.7%) |
Disability Class by Sex by Age in Ideal
Disability Class: Hearing Difficulty
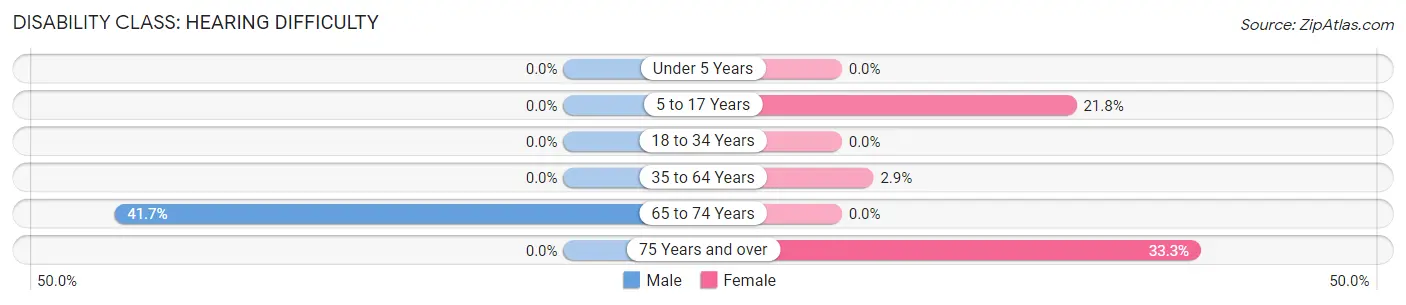
| Age Bracket | Male | Female |
| Under 5 Years | 0 (0.0%) | 0 (0.0%) |
| 5 to 17 Years | 0 (0.0%) | 22 (21.8%) |
| 18 to 34 Years | 0 (0.0%) | 0 (0.0%) |
| 35 to 64 Years | 0 (0.0%) | 4 (2.9%) |
| 65 to 74 Years | 5 (41.7%) | 0 (0.0%) |
| 75 Years and over | 0 (0.0%) | 13 (33.3%) |
Disability Class: Vision Difficulty
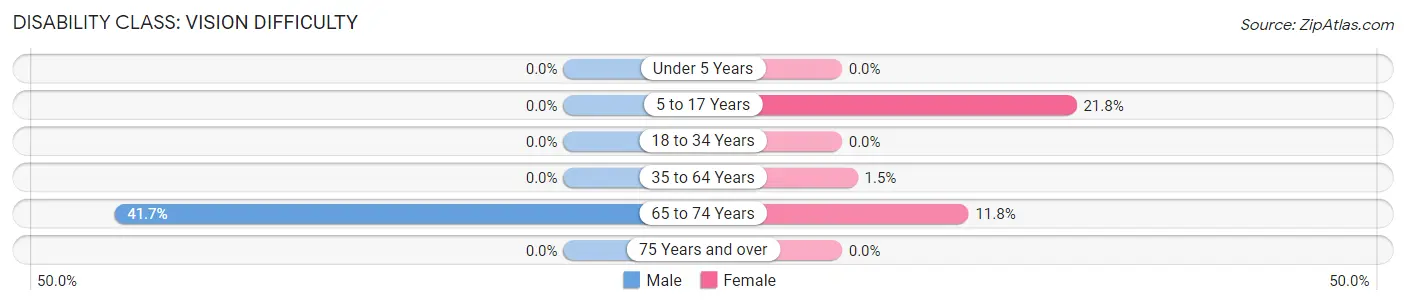
| Age Bracket | Male | Female |
| Under 5 Years | 0 (0.0%) | 0 (0.0%) |
| 5 to 17 Years | 0 (0.0%) | 22 (21.8%) |
| 18 to 34 Years | 0 (0.0%) | 0 (0.0%) |
| 35 to 64 Years | 0 (0.0%) | 2 (1.5%) |
| 65 to 74 Years | 5 (41.7%) | 2 (11.8%) |
| 75 Years and over | 0 (0.0%) | 0 (0.0%) |
Disability Class: Cognitive Difficulty
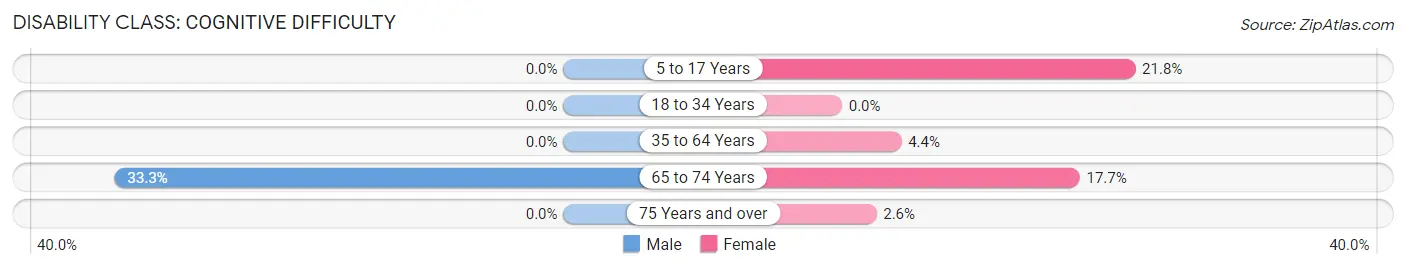
| Age Bracket | Male | Female |
| 5 to 17 Years | 0 (0.0%) | 22 (21.8%) |
| 18 to 34 Years | 0 (0.0%) | 0 (0.0%) |
| 35 to 64 Years | 0 (0.0%) | 6 (4.4%) |
| 65 to 74 Years | 4 (33.3%) | 3 (17.6%) |
| 75 Years and over | 0 (0.0%) | 1 (2.6%) |
Disability Class: Ambulatory Difficulty
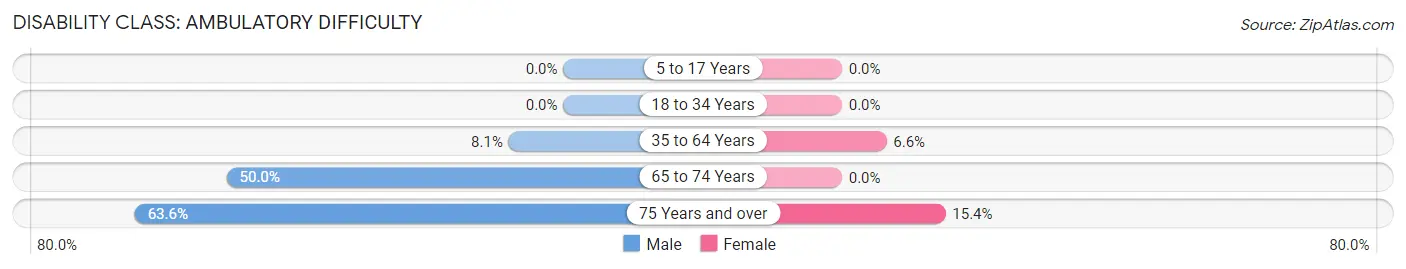
| Age Bracket | Male | Female |
| 5 to 17 Years | 0 (0.0%) | 0 (0.0%) |
| 18 to 34 Years | 0 (0.0%) | 0 (0.0%) |
| 35 to 64 Years | 3 (8.1%) | 9 (6.6%) |
| 65 to 74 Years | 6 (50.0%) | 0 (0.0%) |
| 75 Years and over | 7 (63.6%) | 6 (15.4%) |
Disability Class: Self-Care Difficulty
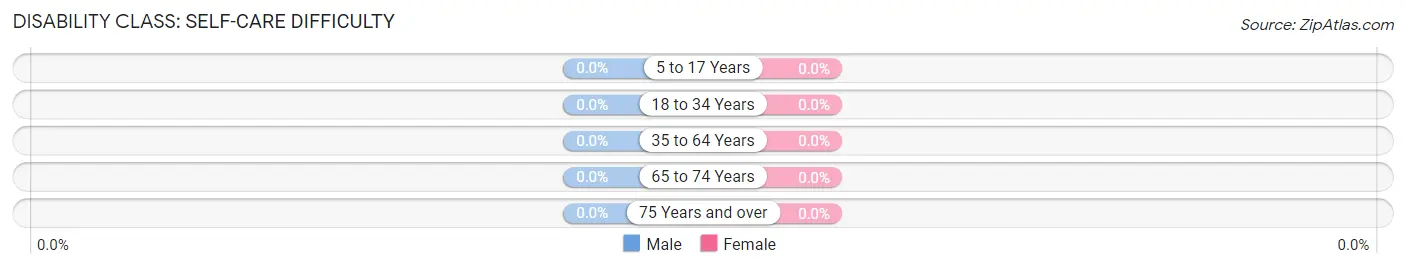
| Age Bracket | Male | Female |
| 5 to 17 Years | 0 (0.0%) | 0 (0.0%) |
| 18 to 34 Years | 0 (0.0%) | 0 (0.0%) |
| 35 to 64 Years | 0 (0.0%) | 0 (0.0%) |
| 65 to 74 Years | 0 (0.0%) | 0 (0.0%) |
| 75 Years and over | 0 (0.0%) | 0 (0.0%) |
Technology Access in Ideal
Computing Device Access in Ideal
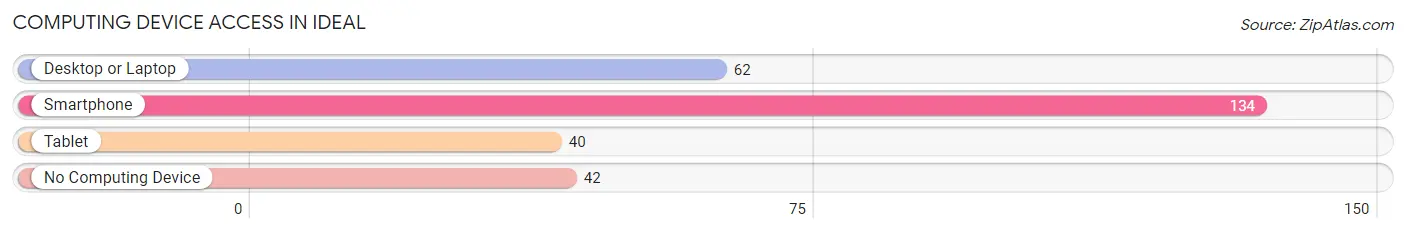
| Device Type | # Households | % Households |
| Desktop or Laptop | 62 | 34.1% |
| Smartphone | 134 | 73.6% |
| Tablet | 40 | 22.0% |
| No Computing Device | 42 | 23.1% |
| Total | 182 | 100.0% |
Internet Access in Ideal
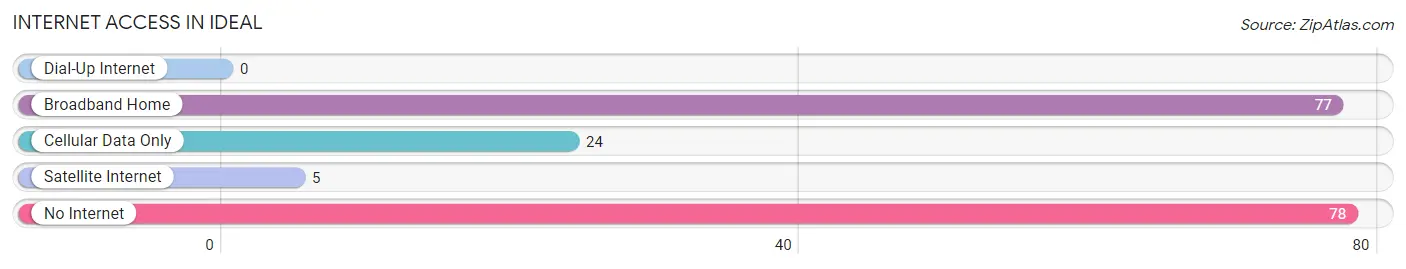
| Internet Type | # Households | % Households |
| Dial-Up Internet | 0 | 0.0% |
| Broadband Home | 77 | 42.3% |
| Cellular Data Only | 24 | 13.2% |
| Satellite Internet | 5 | 2.8% |
| No Internet | 78 | 42.9% |
| Total | 182 | 100.0% |
Ideal Summary
Georgia is a state located in the southeastern United States. It is bordered by Tennessee to the north, North Carolina to the northeast, South Carolina to the southeast, and Alabama to the west. Georgia is the 24th largest state in the United States, with an area of 59,441 square miles. It is the 8th most populous state in the country, with a population of 10,214,860 as of the 2020 census.
History
The area that is now Georgia was first inhabited by Native American tribes, including the Creek, Cherokee, and Choctaw. The first Europeans to explore the area were Spanish explorers in the 16th century. In 1732, the British established the colony of Georgia, which was named after King George II. The colony was established as a buffer between the British colonies in the north and the Spanish colonies in the south.
The American Revolution began in 1775, and Georgia declared its independence from Britain in 1776. Georgia was one of the original 13 colonies that formed the United States of America. In 1788, Georgia became the fourth state to ratify the United States Constitution.
During the Civil War, Georgia seceded from the Union in 1861 and joined the Confederate States of America. After the war, Georgia was readmitted to the Union in 1870.
Geography
Georgia is located in the southeastern United States, bordered by Tennessee to the north, North Carolina to the northeast, South Carolina to the southeast, and Alabama to the west. The state has a total area of 59,441 square miles, making it the 24th largest state in the country.
The state is divided into two distinct regions: the Piedmont region in the north and the Coastal Plain region in the south. The Piedmont region is characterized by rolling hills and is home to the state’s capital, Atlanta. The Coastal Plain region is flat and is home to many of the state’s beaches and barrier islands.
The highest point in Georgia is Brasstown Bald, which has an elevation of 4,784 feet. The lowest point in the state is sea level.
Economy
Georgia has a diverse economy that is driven by agriculture, manufacturing, and services. The state’s agricultural sector is the largest in the country, with crops such as cotton, peanuts, and peaches being the most important. The manufacturing sector is also important, with products such as textiles, chemicals, and paper products being produced in the state. The service sector is the largest in the state, with tourism, finance, and healthcare being the most important industries.
The state’s economy has been growing steadily since the 1990s, and the state’s unemployment rate is currently at 4.2%, which is lower than the national average.
Demographics
As of the 2020 census, Georgia had a population of 10,214,860. The state is racially diverse, with the largest racial groups being White (59.7%), Black or African American (31.5%), and Hispanic or Latino (7.9%).
The state’s largest cities are Atlanta (population 498,044), Augusta (population 197,872), and Columbus (population 189,885). The state’s capital is Atlanta.
The median household income in Georgia is $54,822, which is slightly lower than the national median of $61,937. The poverty rate in the state is 14.2%, which is slightly higher than the national rate of 11.8%.
Common Questions
What is Per Capita Income in Ideal?
Per Capita income in Ideal is $10,839.
What is the Median Family Income in Ideal?
Median Family Income in Ideal is $23,375.
What is the Median Household income in Ideal?
Median Household Income in Ideal is $21,800.
What is Inequality or Gini Index in Ideal?
Inequality or Gini Index in Ideal is 0.39.
What is the Total Population of Ideal?
Total Population of Ideal is 625.
What is the Total Male Population of Ideal?
Total Male Population of Ideal is 187.
What is the Total Female Population of Ideal?
Total Female Population of Ideal is 438.
What is the Ratio of Males per 100 Females in Ideal?
There are 42.69 Males per 100 Females in Ideal.
What is the Ratio of Females per 100 Males in Ideal?
There are 234.22 Females per 100 Males in Ideal.
What is the Median Population Age in Ideal?
Median Population Age in Ideal is 39.0 Years.
What is the Average Family Size in Ideal
Average Family Size in Ideal is 3.8 People.
What is the Average Household Size in Ideal
Average Household Size in Ideal is 3.0 People.
How Large is the Labor Force in Ideal?
There are 168 People in the Labor Forcein in Ideal.
What is the Percentage of People in the Labor Force in Ideal?
35.6% of People are in the Labor Force in Ideal.
What is the Unemployment Rate in Ideal?
Unemployment Rate in Ideal is 6.5%.