Zip Codes with the Highest Percentage of Population Employed in Food Preparation & Serving in Snellville, GA
RELATED REPORTS & OPTIONS
Food Preparation & Serving
Snellville
Compare Zip Codes
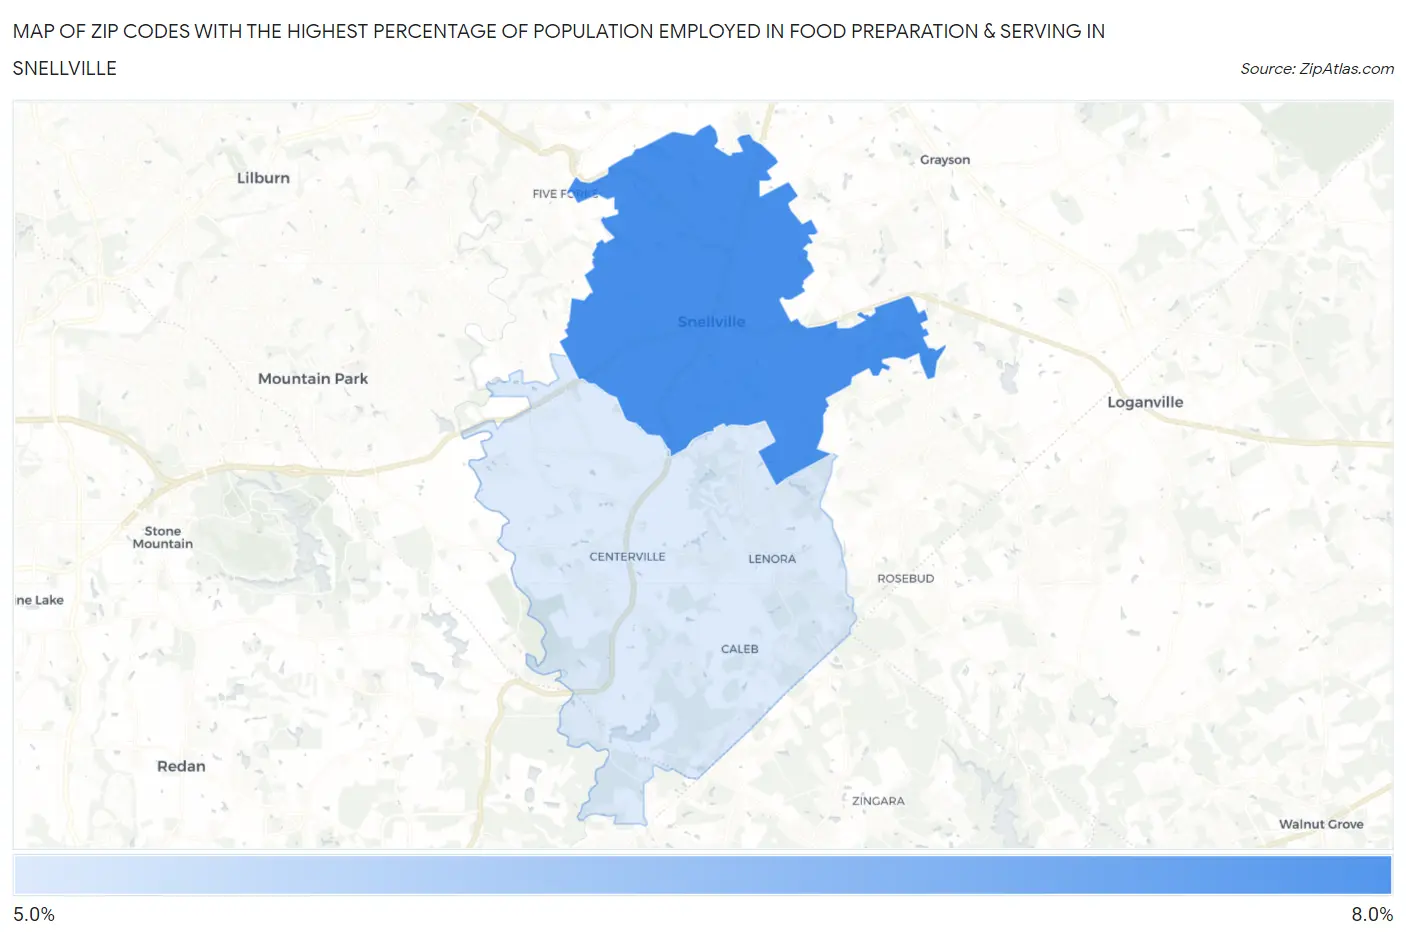
Map of Zip Codes with the Highest Percentage of Population Employed in Food Preparation & Serving in Snellville
5.5%
7.3%
Zip Codes with the Highest Percentage of Population Employed in Food Preparation & Serving in Snellville, GA
| Zip Code | % Employed | vs State | vs National | |
| 1. | 30078 | 7.3% | 5.1%(+2.15)#118 | 5.3%(+2.00)#5,942 |
| 2. | 30039 | 5.5% | 5.1%(+0.372)#250 | 5.3%(+0.231)#11,013 |
1
Common Questions
What are the Top Zip Codes with the Highest Percentage of Population Employed in Food Preparation & Serving in Snellville, GA?
Top Zip Codes with the Highest Percentage of Population Employed in Food Preparation & Serving in Snellville, GA are:
What zip code has the Highest Percentage of Population Employed in Food Preparation & Serving in Snellville, GA?
30078 has the Highest Percentage of Population Employed in Food Preparation & Serving in Snellville, GA with 7.3%.
What is the Percentage of Population Employed in Food Preparation & Serving in Snellville, GA?
Percentage of Population Employed in Food Preparation & Serving in Snellville is 7.3%.
What is the Percentage of Population Employed in Food Preparation & Serving in Georgia?
Percentage of Population Employed in Food Preparation & Serving in Georgia is 5.1%.
What is the Percentage of Population Employed in Food Preparation & Serving in the United States?
Percentage of Population Employed in Food Preparation & Serving in the United States is 5.3%.