Zip Codes with the Highest Percentage of Population Employed in Food Preparation & Serving in Dalton, GA
RELATED REPORTS & OPTIONS
Food Preparation & Serving
Dalton
Compare Zip Codes
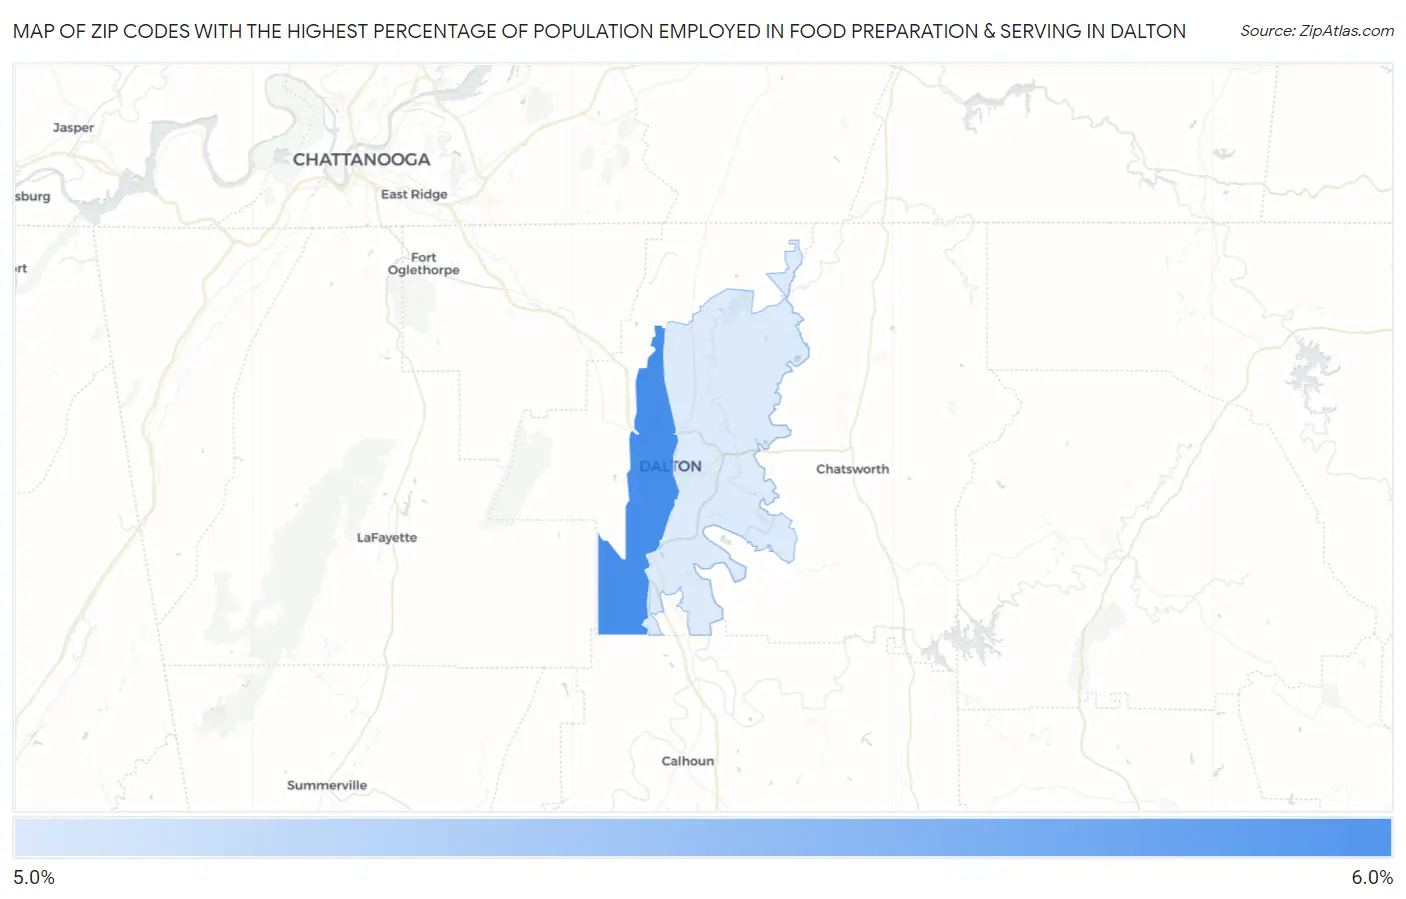
Map of Zip Codes with the Highest Percentage of Population Employed in Food Preparation & Serving in Dalton
5.2%
5.8%
Zip Codes with the Highest Percentage of Population Employed in Food Preparation & Serving in Dalton, GA
| Zip Code | % Employed | vs State | vs National | |
| 1. | 30720 | 5.8% | 5.1%(+0.667)#225 | 5.3%(+0.526)#9,993 |
| 2. | 30721 | 5.2% | 5.1%(+0.012)#281 | 5.3%(-0.129)#12,333 |
1
Common Questions
What are the Top Zip Codes with the Highest Percentage of Population Employed in Food Preparation & Serving in Dalton, GA?
Top Zip Codes with the Highest Percentage of Population Employed in Food Preparation & Serving in Dalton, GA are:
What zip code has the Highest Percentage of Population Employed in Food Preparation & Serving in Dalton, GA?
30720 has the Highest Percentage of Population Employed in Food Preparation & Serving in Dalton, GA with 5.8%.
What is the Percentage of Population Employed in Food Preparation & Serving in Dalton, GA?
Percentage of Population Employed in Food Preparation & Serving in Dalton is 7.0%.
What is the Percentage of Population Employed in Food Preparation & Serving in Georgia?
Percentage of Population Employed in Food Preparation & Serving in Georgia is 5.1%.
What is the Percentage of Population Employed in Food Preparation & Serving in the United States?
Percentage of Population Employed in Food Preparation & Serving in the United States is 5.3%.