Swainsboro, GA Map & Demographics
Swainsboro Map
Swainsboro Overview
$24,617
PER CAPITA INCOME
$45,905
AVG FAMILY INCOME
$44,491
AVG HOUSEHOLD INCOME
12.6%
WAGE / INCOME GAP [ % ]
87.4¢/ $1
WAGE / INCOME GAP [ $ ]
0.54
INEQUALITY / GINI INDEX
7,542
TOTAL POPULATION
3,531
MALE POPULATION
4,011
FEMALE POPULATION
88.03
MALES / 100 FEMALES
113.59
FEMALES / 100 MALES
30.1
MEDIAN AGE
3.1
AVG FAMILY SIZE
2.6
AVG HOUSEHOLD SIZE
2,768
LABOR FORCE [ PEOPLE ]
51.9%
PERCENT IN LABOR FORCE
13.2%
UNEMPLOYMENT RATE
Swainsboro Zip Codes
Income in Swainsboro
Income Overview in Swainsboro
Per Capita Income in Swainsboro is $24,617, while median incomes of families and households are $45,905 and $44,491 respectively.
| Characteristic | Number | Measure |
| Per Capita Income | 7,542 | $24,617 |
| Median Family Income | 1,875 | $45,905 |
| Mean Family Income | 1,875 | $57,304 |
| Median Household Income | 2,764 | $44,491 |
| Mean Household Income | 2,764 | $66,580 |
| Income Deficit | 1,875 | $0 |
| Wage / Income Gap (%) | 7,542 | 12.56% |
| Wage / Income Gap ($) | 7,542 | 87.44¢ per $1 |
| Gini / Inequality Index | 7,542 | 0.54 |
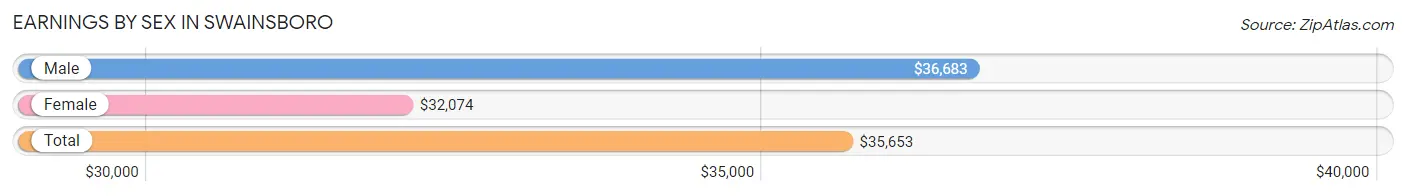
Earnings by Sex in Swainsboro
Average Earnings in Swainsboro are $35,653, $36,683 for men and $32,074 for women, a difference of 12.6%.
| Sex | Number | Average Earnings |
| Male | 1,511 (49.9%) | $36,683 |
| Female | 1,514 (50.0%) | $32,074 |
| Total | 3,025 (100.0%) | $35,653 |
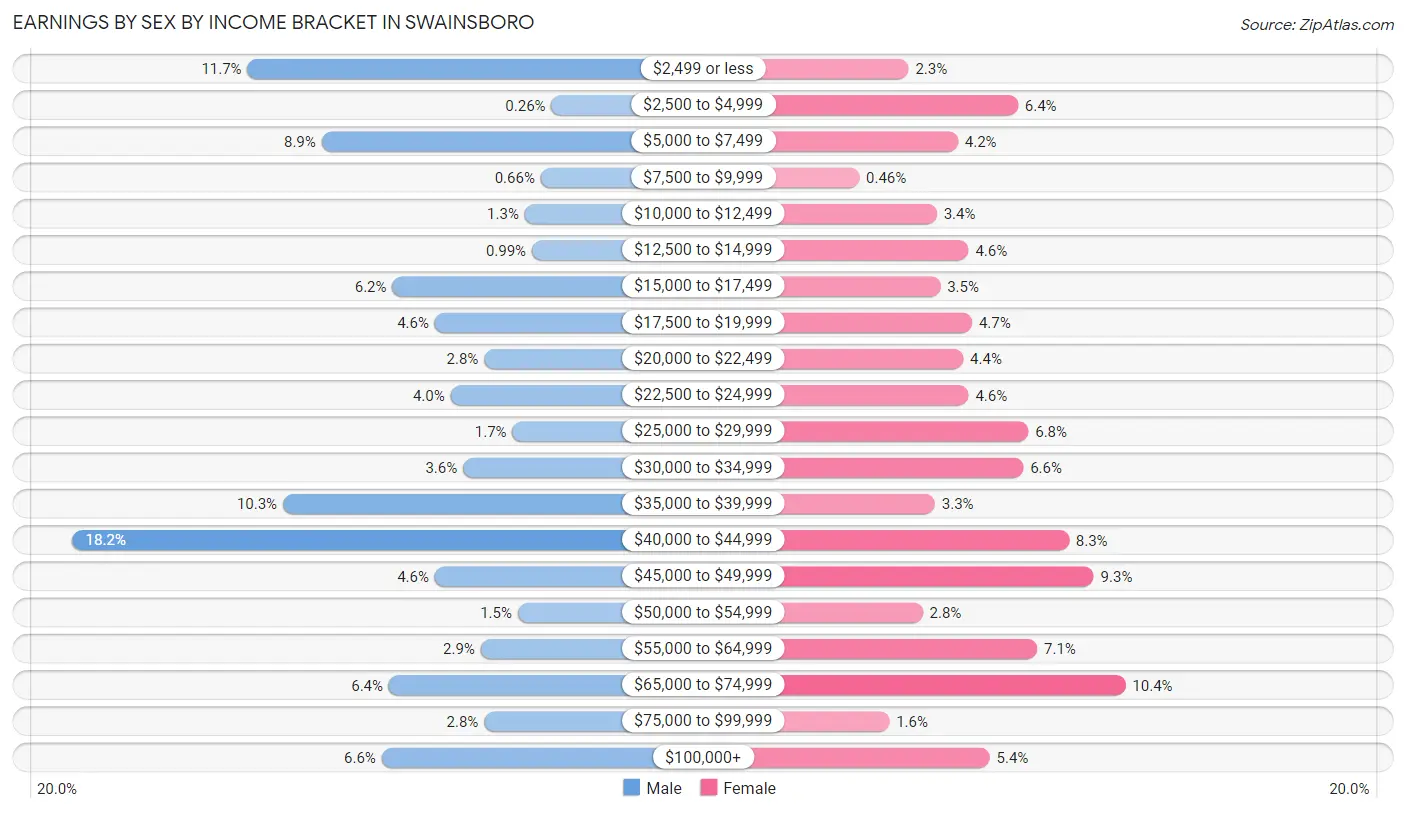
Earnings by Sex by Income Bracket in Swainsboro
The most common earnings brackets in Swainsboro are $40,000 to $44,999 for men (275 | 18.2%) and $65,000 to $74,999 for women (158 | 10.4%).
| Income | Male | Female |
| $2,499 or less | 176 (11.7%) | 35 (2.3%) |
| $2,500 to $4,999 | 4 (0.3%) | 97 (6.4%) |
| $5,000 to $7,499 | 134 (8.9%) | 63 (4.2%) |
| $7,500 to $9,999 | 10 (0.7%) | 7 (0.5%) |
| $10,000 to $12,499 | 19 (1.3%) | 51 (3.4%) |
| $12,500 to $14,999 | 15 (1.0%) | 69 (4.6%) |
| $15,000 to $17,499 | 94 (6.2%) | 53 (3.5%) |
| $17,500 to $19,999 | 70 (4.6%) | 71 (4.7%) |
| $20,000 to $22,499 | 42 (2.8%) | 66 (4.4%) |
| $22,500 to $24,999 | 61 (4.0%) | 69 (4.6%) |
| $25,000 to $29,999 | 26 (1.7%) | 103 (6.8%) |
| $30,000 to $34,999 | 54 (3.6%) | 100 (6.6%) |
| $35,000 to $39,999 | 156 (10.3%) | 50 (3.3%) |
| $40,000 to $44,999 | 275 (18.2%) | 126 (8.3%) |
| $45,000 to $49,999 | 70 (4.6%) | 140 (9.2%) |
| $50,000 to $54,999 | 23 (1.5%) | 43 (2.8%) |
| $55,000 to $64,999 | 44 (2.9%) | 108 (7.1%) |
| $65,000 to $74,999 | 96 (6.4%) | 158 (10.4%) |
| $75,000 to $99,999 | 42 (2.8%) | 24 (1.6%) |
| $100,000+ | 100 (6.6%) | 81 (5.3%) |
| Total | 1,511 (100.0%) | 1,514 (100.0%) |
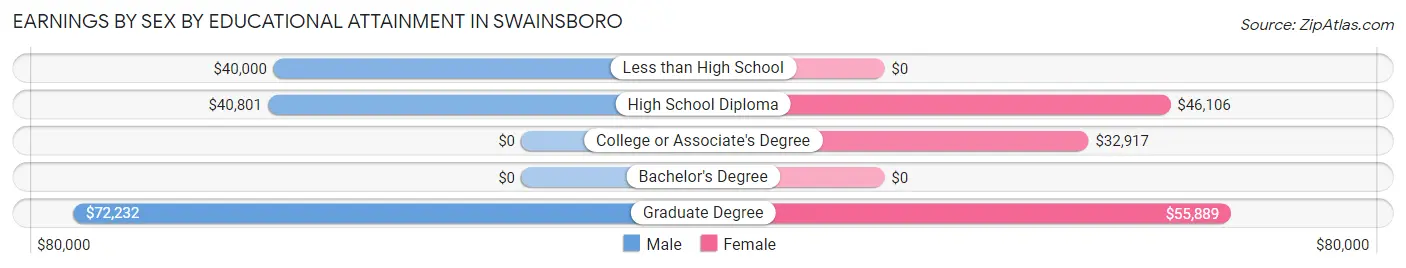
Earnings by Sex by Educational Attainment in Swainsboro
Average earnings in Swainsboro are $40,301 for men and $43,148 for women, a difference of 6.6%. Men with an educational attainment of graduate degree enjoy the highest average annual earnings of $72,232, while those with less than high school education earn the least with $40,000. Women with an educational attainment of graduate degree earn the most with the average annual earnings of $55,889, while those with college or associate's degree education have the smallest earnings of $32,917.
| Educational Attainment | Male Income | Female Income |
| Less than High School | $40,000 | $0 |
| High School Diploma | $40,801 | $46,106 |
| College or Associate's Degree | - | - |
| Bachelor's Degree | - | - |
| Graduate Degree | $72,232 | $55,889 |
| Total | $40,301 | $43,148 |
Family Income in Swainsboro
Family Income Brackets in Swainsboro
According to the Swainsboro family income data, there are 501 families falling into the $35,000 to $49,999 income range, which is the most common income bracket and makes up 26.7% of all families. Conversely, the $150,000 to $199,999 income bracket is the least frequent group with only 13 families (0.7%) belonging to this category.
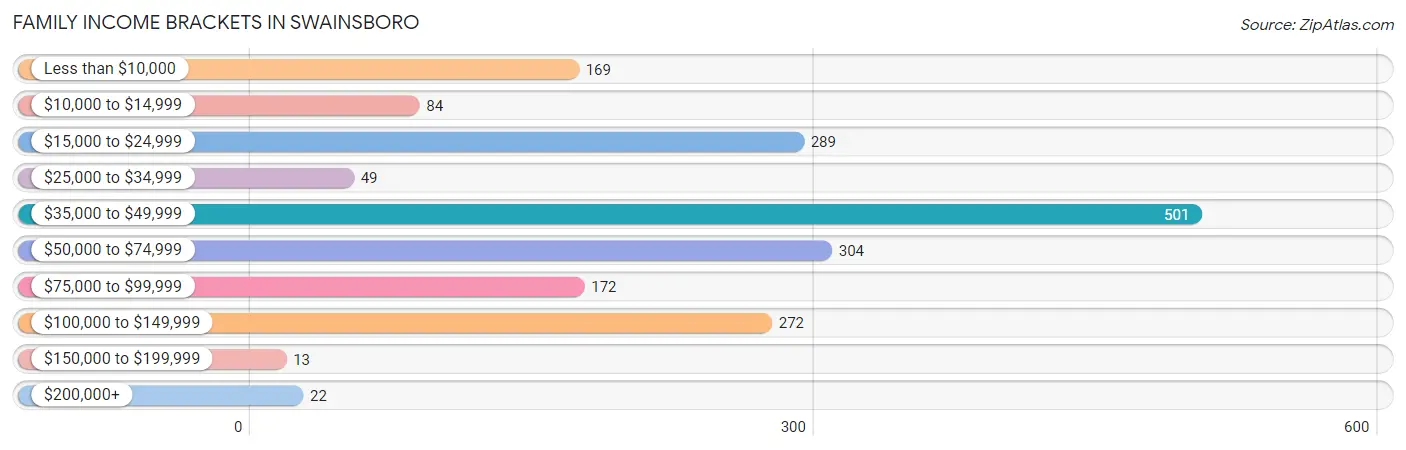
| Income Bracket | # Families | % Families |
| Less than $10,000 | 169 | 9.0% |
| $10,000 to $14,999 | 84 | 4.5% |
| $15,000 to $24,999 | 289 | 15.4% |
| $25,000 to $34,999 | 49 | 2.6% |
| $35,000 to $49,999 | 501 | 26.7% |
| $50,000 to $74,999 | 304 | 16.2% |
| $75,000 to $99,999 | 172 | 9.2% |
| $100,000 to $149,999 | 272 | 14.5% |
| $150,000 to $199,999 | 13 | 0.7% |
| $200,000+ | 22 | 1.2% |
Family Income by Famaliy Size in Swainsboro
5-person families (403 | 21.5%) account for the highest median family income in Swainsboro with $83,984 per family, while 2-person families (805 | 42.9%) have the highest median income of $22,454 per family member.
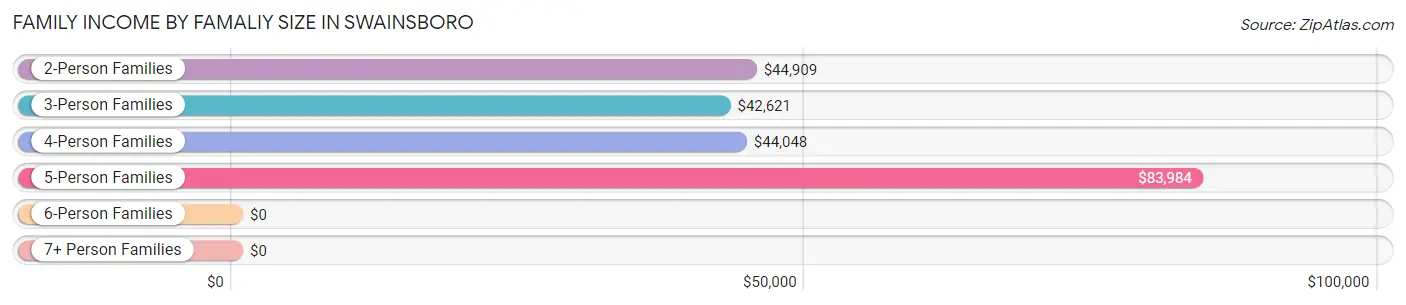
| Income Bracket | # Families | Median Income |
| 2-Person Families | 805 (42.9%) | $44,909 |
| 3-Person Families | 518 (27.6%) | $42,621 |
| 4-Person Families | 124 (6.6%) | $44,048 |
| 5-Person Families | 403 (21.5%) | $83,984 |
| 6-Person Families | 21 (1.1%) | $0 |
| 7+ Person Families | 4 (0.2%) | $0 |
| Total | 1,875 (100.0%) | $45,905 |
Family Income by Number of Earners in Swainsboro
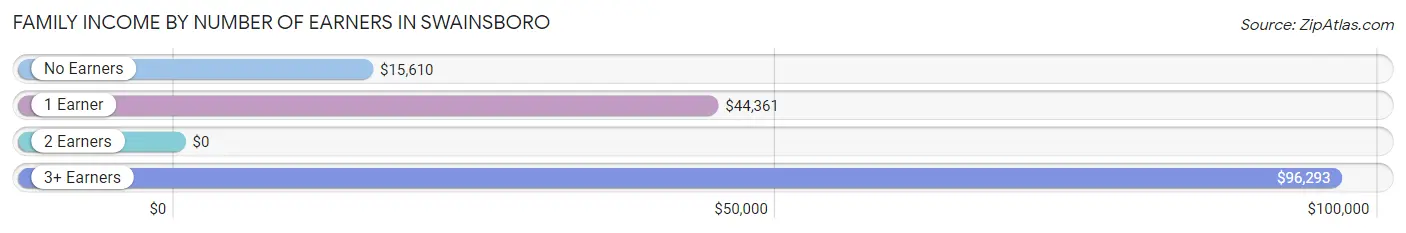
| Number of Earners | # Families | Median Income |
| No Earners | 358 (19.1%) | $15,610 |
| 1 Earner | 857 (45.7%) | $44,361 |
| 2 Earners | 536 (28.6%) | $0 |
| 3+ Earners | 124 (6.6%) | $96,293 |
| Total | 1,875 (100.0%) | $45,905 |
Household Income in Swainsboro
Household Income Brackets in Swainsboro
With 705 households falling in the category, the $35,000 to $49,999 income range is the most frequent in Swainsboro, accounting for 25.5% of all households. In contrast, only 25 households (0.9%) fall into the $150,000 to $199,999 income bracket, making it the least populous group.
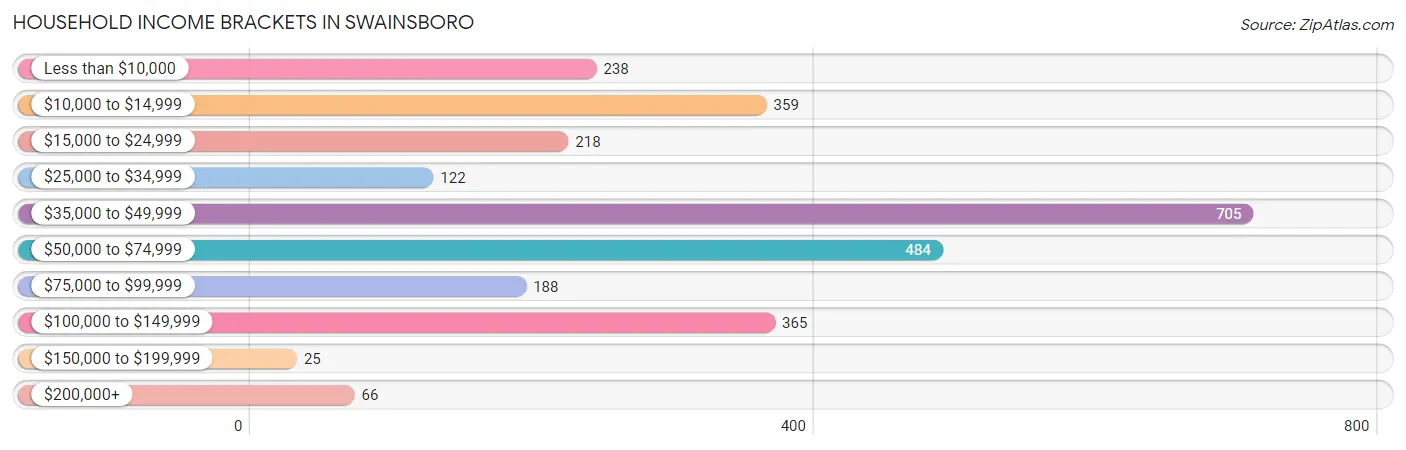
| Income Bracket | # Households | % Households |
| Less than $10,000 | 238 | 8.6% |
| $10,000 to $14,999 | 359 | 13.0% |
| $15,000 to $24,999 | 218 | 7.9% |
| $25,000 to $34,999 | 122 | 4.4% |
| $35,000 to $49,999 | 705 | 25.5% |
| $50,000 to $74,999 | 484 | 17.5% |
| $75,000 to $99,999 | 188 | 6.8% |
| $100,000 to $149,999 | 365 | 13.2% |
| $150,000 to $199,999 | 25 | 0.9% |
| $200,000+ | 66 | 2.4% |
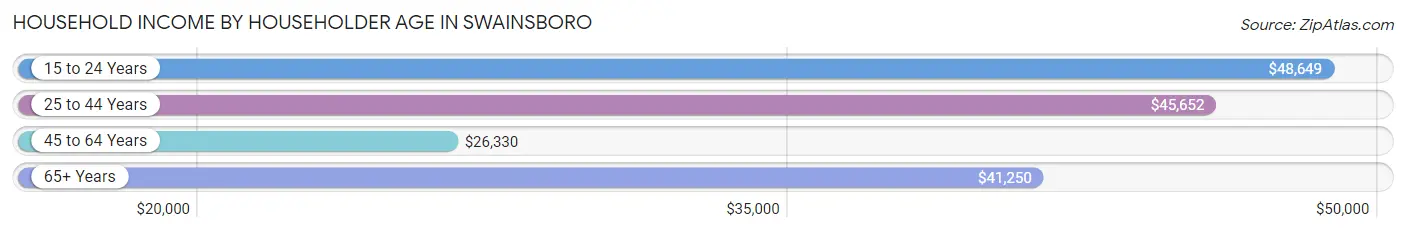
Household Income by Householder Age in Swainsboro
The median household income in Swainsboro is $44,491, with the highest median household income of $48,649 found in the 15 to 24 years age bracket for the primary householder. A total of 187 households (6.8%) fall into this category. Meanwhile, the 45 to 64 years age bracket for the primary householder has the lowest median household income of $26,330, with 708 households (25.6%) in this group.
| Income Bracket | # Households | Median Income |
| 15 to 24 Years | 187 (6.8%) | $48,649 |
| 25 to 44 Years | 1,170 (42.3%) | $45,652 |
| 45 to 64 Years | 708 (25.6%) | $26,330 |
| 65+ Years | 699 (25.3%) | $41,250 |
| Total | 2,764 (100.0%) | $44,491 |
Poverty in Swainsboro
Income Below Poverty by Sex and Age in Swainsboro
With 24.1% poverty level for males and 29.9% for females among the residents of Swainsboro, 5 year old males and 45 to 54 year old females are the most vulnerable to poverty, with 12 males (100.0%) and 168 females (50.3%) in their respective age groups living below the poverty level.
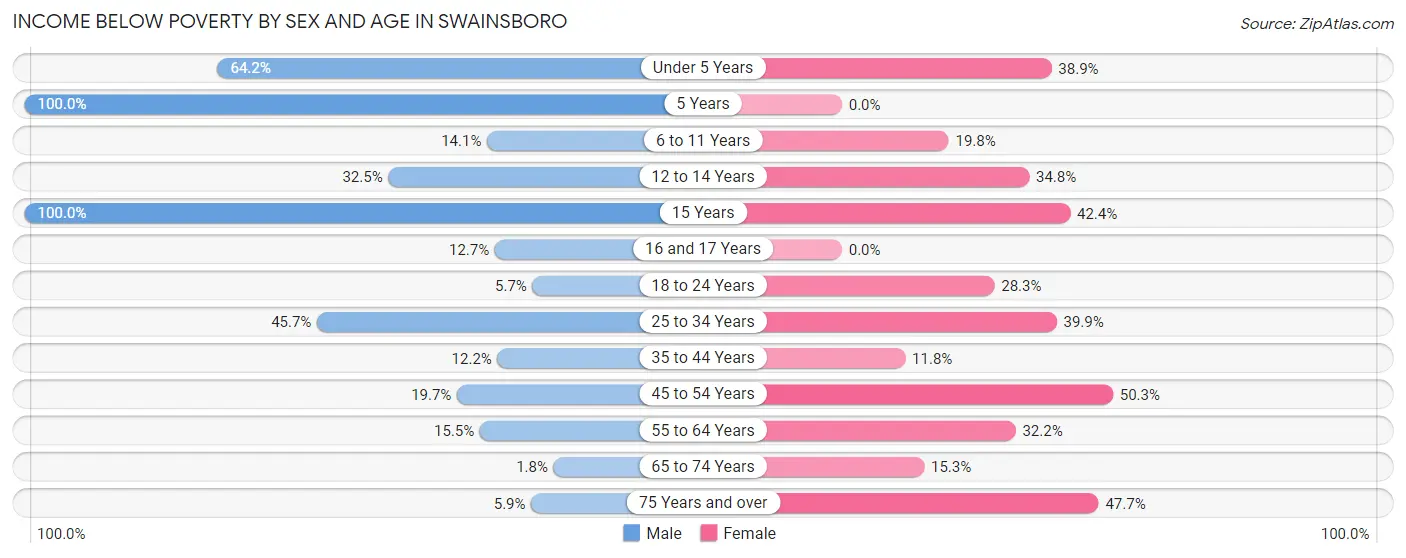
| Age Bracket | Male | Female |
| Under 5 Years | 224 (64.2%) | 100 (38.9%) |
| 5 Years | 12 (100.0%) | 0 (0.0%) |
| 6 to 11 Years | 52 (14.1%) | 88 (19.8%) |
| 12 to 14 Years | 112 (32.5%) | 41 (34.7%) |
| 15 Years | 34 (100.0%) | 61 (42.4%) |
| 16 and 17 Years | 27 (12.7%) | 0 (0.0%) |
| 18 to 24 Years | 25 (5.7%) | 88 (28.3%) |
| 25 to 34 Years | 196 (45.7%) | 226 (39.9%) |
| 35 to 44 Years | 39 (12.2%) | 54 (11.8%) |
| 45 to 54 Years | 52 (19.7%) | 168 (50.3%) |
| 55 to 64 Years | 19 (15.4%) | 138 (32.2%) |
| 65 to 74 Years | 6 (1.8%) | 67 (15.3%) |
| 75 Years and over | 6 (5.9%) | 71 (47.6%) |
| Total | 804 (24.1%) | 1,102 (29.9%) |
Income Above Poverty by Sex and Age in Swainsboro
According to the poverty statistics in Swainsboro, males aged 65 to 74 years and females aged 5 years are the age groups that are most secure financially, with 98.2% of males and 100.0% of females in these age groups living above the poverty line.
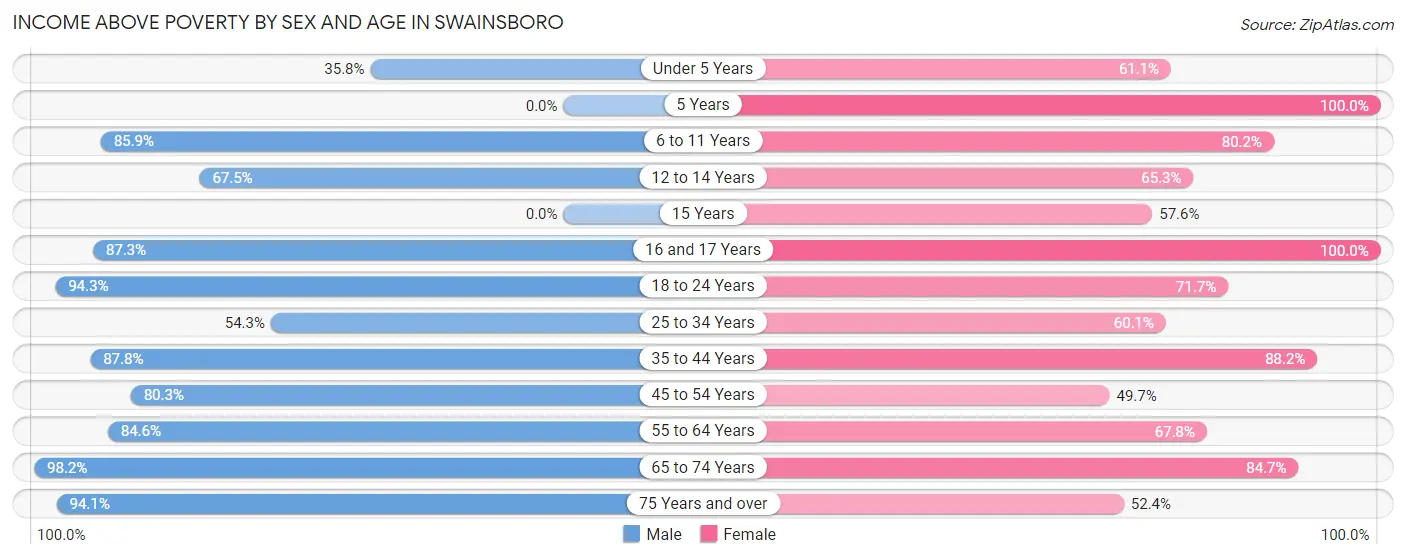
| Age Bracket | Male | Female |
| Under 5 Years | 125 (35.8%) | 157 (61.1%) |
| 5 Years | 0 (0.0%) | 19 (100.0%) |
| 6 to 11 Years | 316 (85.9%) | 356 (80.2%) |
| 12 to 14 Years | 233 (67.5%) | 77 (65.2%) |
| 15 Years | 0 (0.0%) | 83 (57.6%) |
| 16 and 17 Years | 186 (87.3%) | 21 (100.0%) |
| 18 to 24 Years | 414 (94.3%) | 223 (71.7%) |
| 25 to 34 Years | 233 (54.3%) | 341 (60.1%) |
| 35 to 44 Years | 281 (87.8%) | 405 (88.2%) |
| 45 to 54 Years | 212 (80.3%) | 166 (49.7%) |
| 55 to 64 Years | 104 (84.6%) | 290 (67.8%) |
| 65 to 74 Years | 333 (98.2%) | 372 (84.7%) |
| 75 Years and over | 95 (94.1%) | 78 (52.3%) |
| Total | 2,532 (75.9%) | 2,588 (70.1%) |
Income Below Poverty Among Married-Couple Families in Swainsboro
The poverty statistics for married-couple families in Swainsboro show that 7.2% or 65 of the total 906 families live below the poverty line. Families with 3 or 4 children have the highest poverty rate of 12.2%, comprising of 39 families. On the other hand, families with 1 or 2 children have the lowest poverty rate of 0.0%, which includes 0 families.
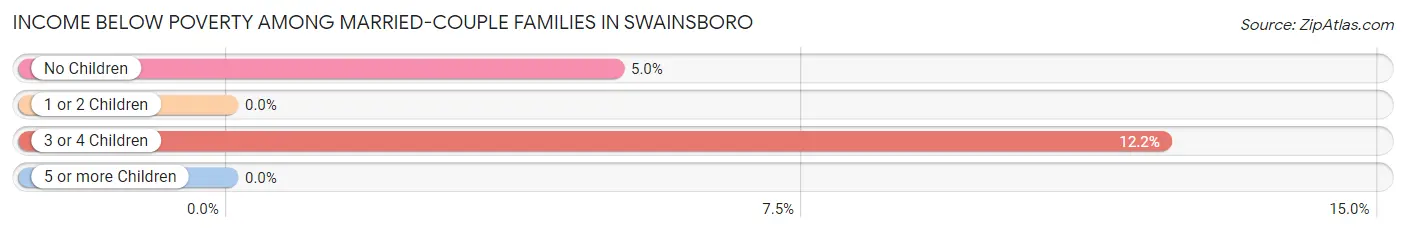
| Children | Above Poverty | Below Poverty |
| No Children | 490 (95.0%) | 26 (5.0%) |
| 1 or 2 Children | 70 (100.0%) | 0 (0.0%) |
| 3 or 4 Children | 281 (87.8%) | 39 (12.2%) |
| 5 or more Children | 0 (0.0%) | 0 (0.0%) |
| Total | 841 (92.8%) | 65 (7.2%) |
Income Below Poverty Among Single-Parent Households in Swainsboro
According to the poverty data in Swainsboro, 22.9% or 11 single-father households and 45.3% or 417 single-mother households are living below the poverty line. Among single-father households, those with 1 or 2 children have the highest poverty rate, with 11 households (22.9%) experiencing poverty. Likewise, among single-mother households, those with 1 or 2 children have the highest poverty rate, with 343 households (54.5%) falling below the poverty line.
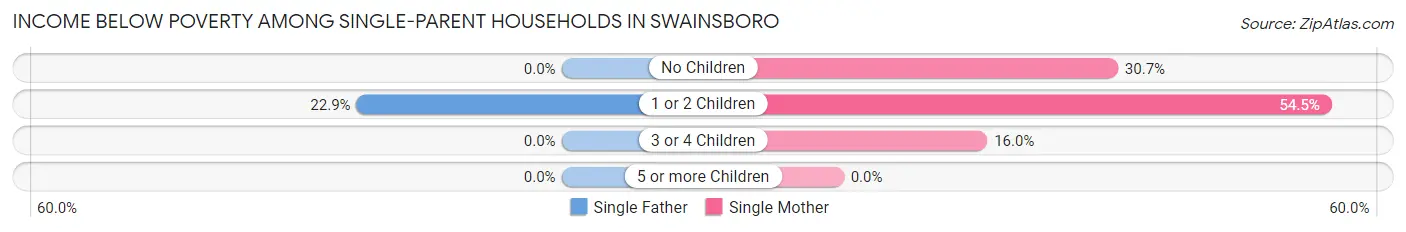
| Children | Single Father | Single Mother |
| No Children | 0 (0.0%) | 57 (30.6%) |
| 1 or 2 Children | 11 (22.9%) | 343 (54.5%) |
| 3 or 4 Children | 0 (0.0%) | 17 (16.0%) |
| 5 or more Children | 0 (0.0%) | 0 (0.0%) |
| Total | 11 (22.9%) | 417 (45.3%) |
Income Below Poverty Among Married-Couple vs Single-Parent Households in Swainsboro
The poverty data for Swainsboro shows that 65 of the married-couple family households (7.2%) and 428 of the single-parent households (44.2%) are living below the poverty level. Within the married-couple family households, those with 3 or 4 children have the highest poverty rate, with 39 households (12.2%) falling below the poverty line. Among the single-parent households, those with 1 or 2 children have the highest poverty rate, with 354 household (52.3%) living below poverty.
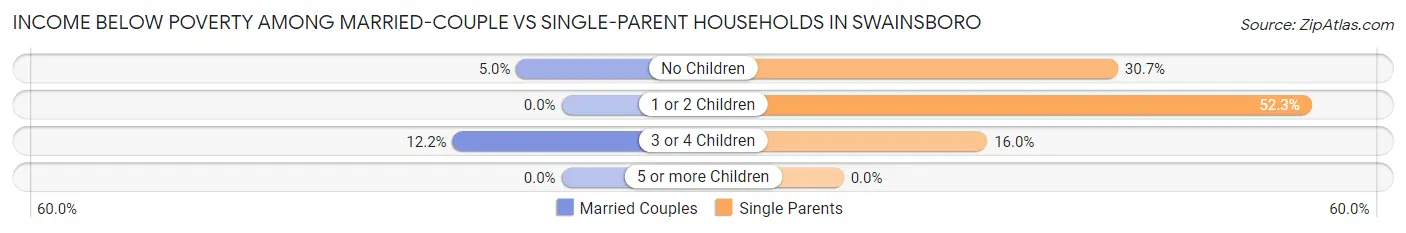
| Children | Married-Couple Families | Single-Parent Households |
| No Children | 26 (5.0%) | 57 (30.6%) |
| 1 or 2 Children | 0 (0.0%) | 354 (52.3%) |
| 3 or 4 Children | 39 (12.2%) | 17 (16.0%) |
| 5 or more Children | 0 (0.0%) | 0 (0.0%) |
| Total | 65 (7.2%) | 428 (44.2%) |
Race in Swainsboro
The most populous races in Swainsboro are Black / African American (4,306 | 57.1%), White / Caucasian (2,600 | 34.5%), and Two or more Races (490 | 6.5%).
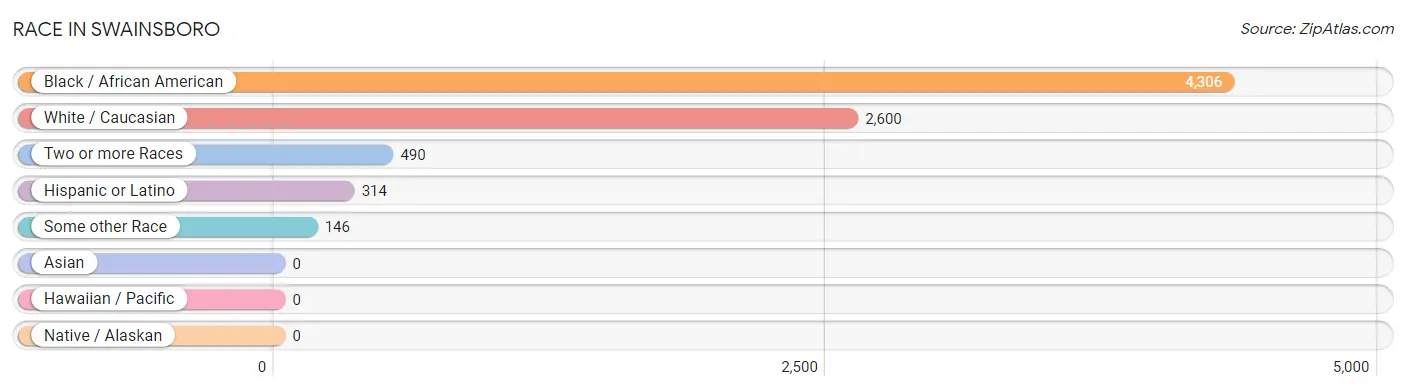
| Race | # Population | % Population |
| Asian | 0 | 0.0% |
| Black / African American | 4,306 | 57.1% |
| Hawaiian / Pacific | 0 | 0.0% |
| Hispanic or Latino | 314 | 4.2% |
| Native / Alaskan | 0 | 0.0% |
| White / Caucasian | 2,600 | 34.5% |
| Two or more Races | 490 | 6.5% |
| Some other Race | 146 | 1.9% |
| Total | 7,542 | 100.0% |
Ancestry in Swainsboro
The most populous ancestries reported in Swainsboro are Irish (343 | 4.5%), American (327 | 4.3%), Mexican (272 | 3.6%), Cherokee (237 | 3.1%), and English (227 | 3.0%), together accounting for 18.6% of all Swainsboro residents.
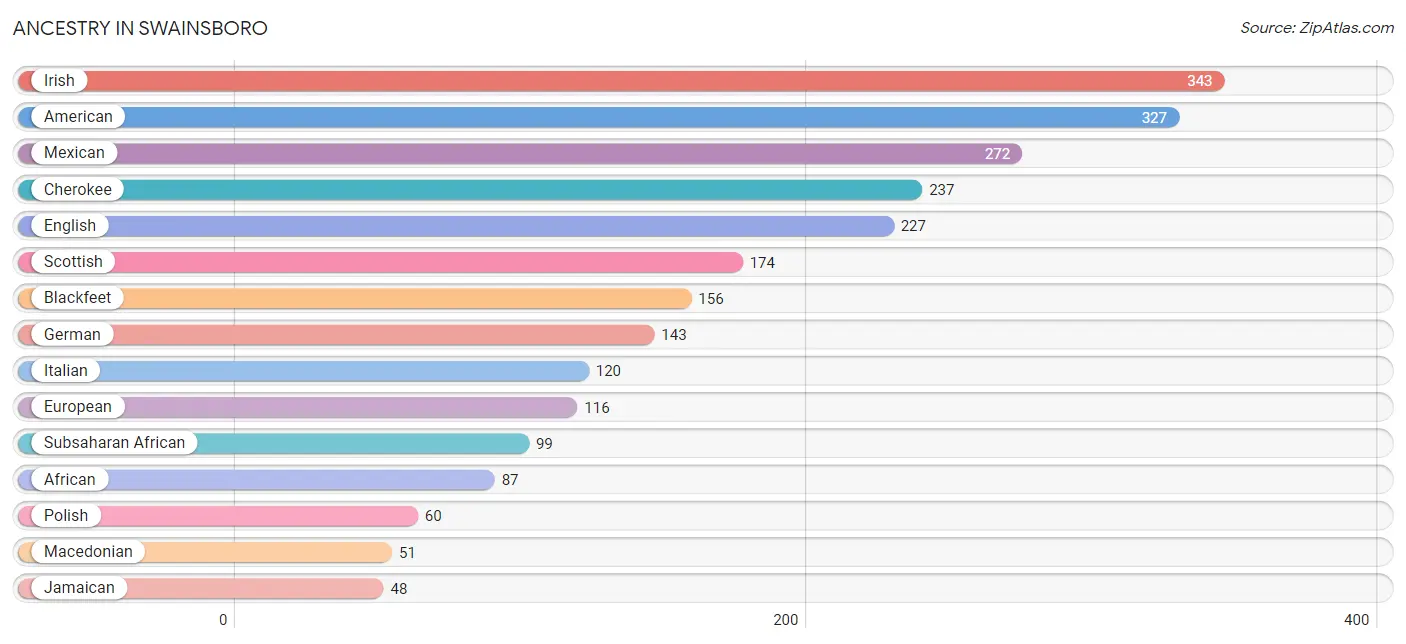
| Ancestry | # Population | % Population |
| African | 87 | 1.1% |
| American | 327 | 4.3% |
| Arab | 23 | 0.3% |
| Austrian | 6 | 0.1% |
| Blackfeet | 156 | 2.1% |
| British | 19 | 0.3% |
| Cape Verdean | 12 | 0.2% |
| Cherokee | 237 | 3.1% |
| Czech | 30 | 0.4% |
| Dutch | 39 | 0.5% |
| Egyptian | 15 | 0.2% |
| English | 227 | 3.0% |
| European | 116 | 1.5% |
| Finnish | 8 | 0.1% |
| German | 143 | 1.9% |
| Hungarian | 15 | 0.2% |
| Irish | 343 | 4.5% |
| Italian | 120 | 1.6% |
| Jamaican | 48 | 0.6% |
| Macedonian | 51 | 0.7% |
| Mexican | 272 | 3.6% |
| Moroccan | 8 | 0.1% |
| Polish | 60 | 0.8% |
| Puerto Rican | 42 | 0.6% |
| Scotch-Irish | 34 | 0.4% |
| Scottish | 174 | 2.3% |
| Subsaharan African | 99 | 1.3% | View All 27 Rows |
Immigrants in Swainsboro
The most numerous immigrant groups reported in Swainsboro came from Central America (97 | 1.3%), Latin America (97 | 1.3%), Mexico (81 | 1.1%), Honduras (16 | 0.2%), and Africa (15 | 0.2%), together accounting for 4.1% of all Swainsboro residents.
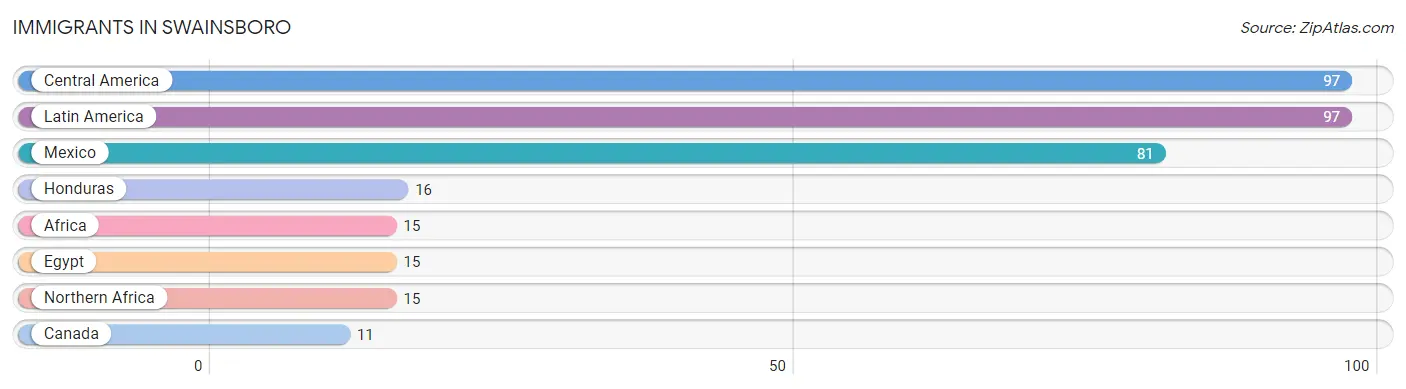
| Immigration Origin | # Population | % Population |
| Africa | 15 | 0.2% |
| Canada | 11 | 0.2% |
| Central America | 97 | 1.3% |
| Egypt | 15 | 0.2% |
| Honduras | 16 | 0.2% |
| Latin America | 97 | 1.3% |
| Mexico | 81 | 1.1% |
| Northern Africa | 15 | 0.2% | View All 8 Rows |
Sex and Age in Swainsboro
Sex and Age in Swainsboro
The most populous age groups in Swainsboro are 10 to 14 Years (397 | 11.2%) for men and 10 to 14 Years (474 | 11.8%) for women.
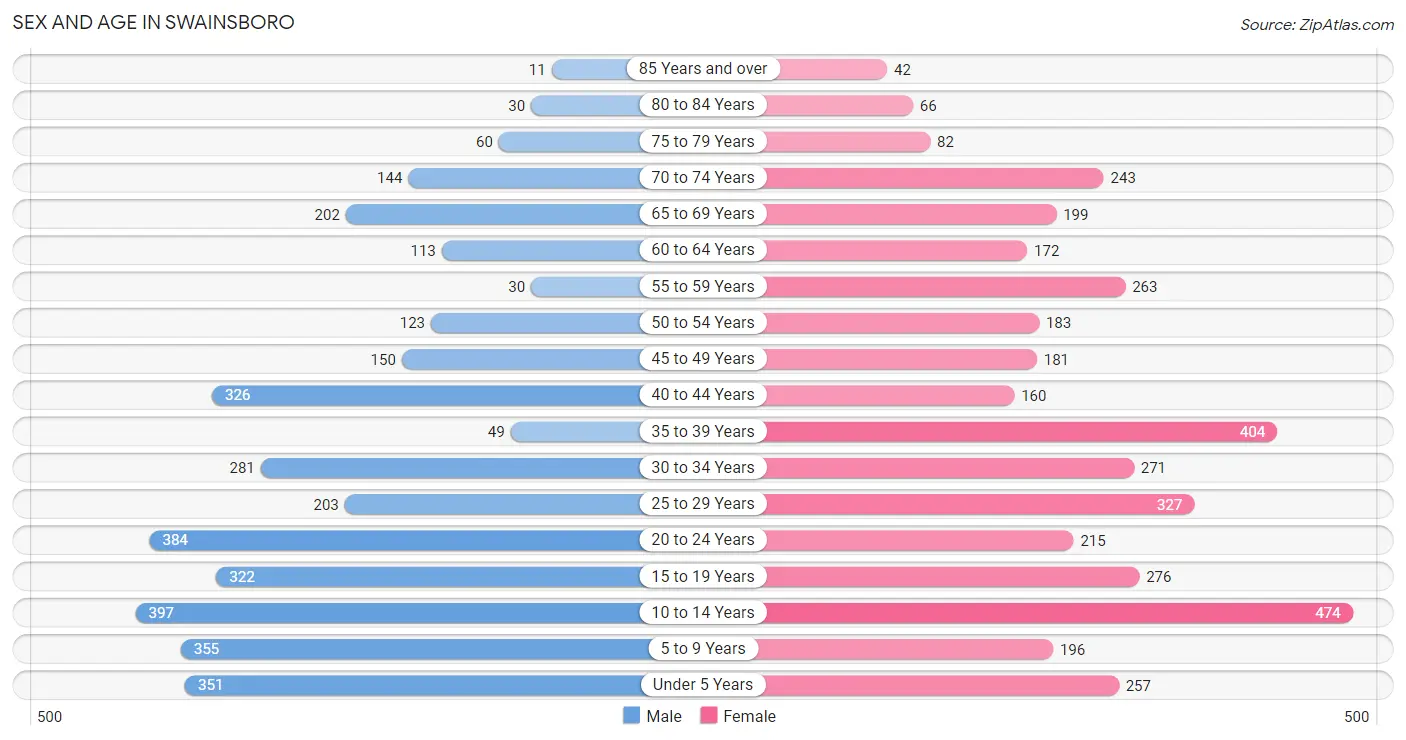
| Age Bracket | Male | Female |
| Under 5 Years | 351 (9.9%) | 257 (6.4%) |
| 5 to 9 Years | 355 (10.1%) | 196 (4.9%) |
| 10 to 14 Years | 397 (11.2%) | 474 (11.8%) |
| 15 to 19 Years | 322 (9.1%) | 276 (6.9%) |
| 20 to 24 Years | 384 (10.9%) | 215 (5.4%) |
| 25 to 29 Years | 203 (5.8%) | 327 (8.2%) |
| 30 to 34 Years | 281 (8.0%) | 271 (6.8%) |
| 35 to 39 Years | 49 (1.4%) | 404 (10.1%) |
| 40 to 44 Years | 326 (9.2%) | 160 (4.0%) |
| 45 to 49 Years | 150 (4.3%) | 181 (4.5%) |
| 50 to 54 Years | 123 (3.5%) | 183 (4.6%) |
| 55 to 59 Years | 30 (0.9%) | 263 (6.6%) |
| 60 to 64 Years | 113 (3.2%) | 172 (4.3%) |
| 65 to 69 Years | 202 (5.7%) | 199 (5.0%) |
| 70 to 74 Years | 144 (4.1%) | 243 (6.1%) |
| 75 to 79 Years | 60 (1.7%) | 82 (2.0%) |
| 80 to 84 Years | 30 (0.9%) | 66 (1.7%) |
| 85 Years and over | 11 (0.3%) | 42 (1.1%) |
| Total | 3,531 (100.0%) | 4,011 (100.0%) |
Families and Households in Swainsboro
Median Family Size in Swainsboro
The median family size in Swainsboro is 3.07 persons per family, with married-couple families (906 | 48.3%) accounting for the largest median family size of 3.23 persons per family. On the other hand, single male/father families (48 | 2.6%) represent the smallest median family size with 2.79 persons per family.
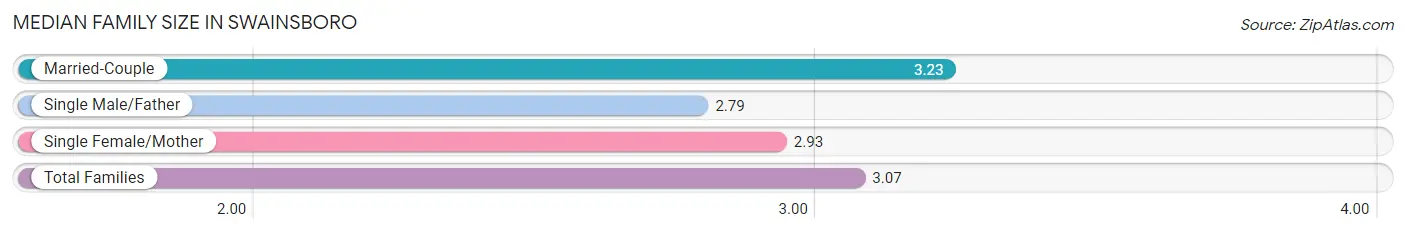
| Family Type | # Families | Family Size |
| Married-Couple | 906 (48.3%) | 3.23 |
| Single Male/Father | 48 (2.6%) | 2.79 |
| Single Female/Mother | 921 (49.1%) | 2.93 |
| Total Families | 1,875 (100.0%) | 3.07 |
Median Household Size in Swainsboro
The median household size in Swainsboro is 2.57 persons per household, with single male/father households (48 | 1.7%) accounting for the largest median household size of 3.48 persons per household. non-family households (889 | 32.2%) represent the smallest median household size with 1.06 persons per household.
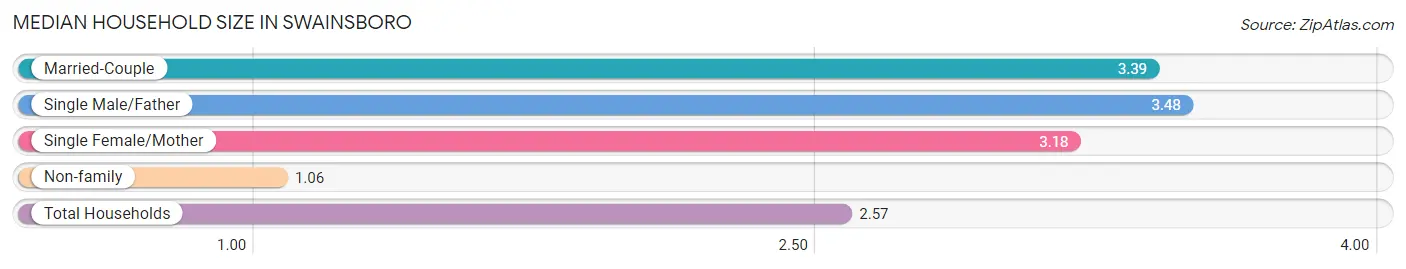
| Household Type | # Households | Household Size |
| Married-Couple | 906 (32.8%) | 3.39 |
| Single Male/Father | 48 (1.7%) | 3.48 |
| Single Female/Mother | 921 (33.3%) | 3.18 |
| Non-family | 889 (32.2%) | 1.06 |
| Total Households | 2,764 (100.0%) | 2.57 |
Household Size by Marriage Status in Swainsboro
Out of a total of 2,764 households in Swainsboro, 1,875 (67.8%) are family households, while 889 (32.2%) are nonfamily households. The most numerous type of family households are 2-person households, comprising 776, and the most common type of nonfamily households are 1-person households, comprising 835.
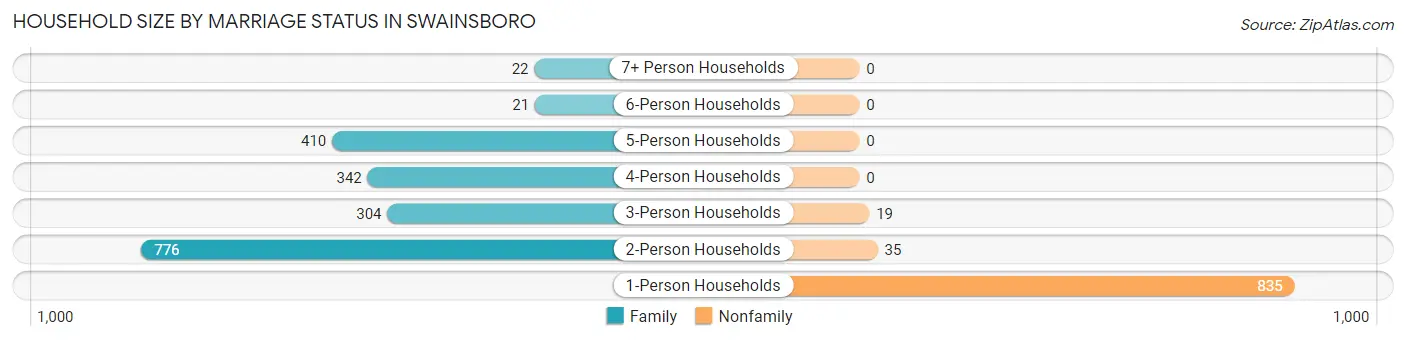
| Household Size | Family Households | Nonfamily Households |
| 1-Person Households | - | 835 (30.2%) |
| 2-Person Households | 776 (28.1%) | 35 (1.3%) |
| 3-Person Households | 304 (11.0%) | 19 (0.7%) |
| 4-Person Households | 342 (12.4%) | 0 (0.0%) |
| 5-Person Households | 410 (14.8%) | 0 (0.0%) |
| 6-Person Households | 21 (0.8%) | 0 (0.0%) |
| 7+ Person Households | 22 (0.8%) | 0 (0.0%) |
| Total | 1,875 (67.8%) | 889 (32.2%) |
Female Fertility in Swainsboro
Fertility by Age in Swainsboro
Average fertility rate in Swainsboro is 118.0 births per 1,000 women. Women in the age bracket of 20 to 34 years have the highest fertility rate with 268.0 births per 1,000 women. Women in the age bracket of 20 to 34 years acount for 100.0% of all women with births.
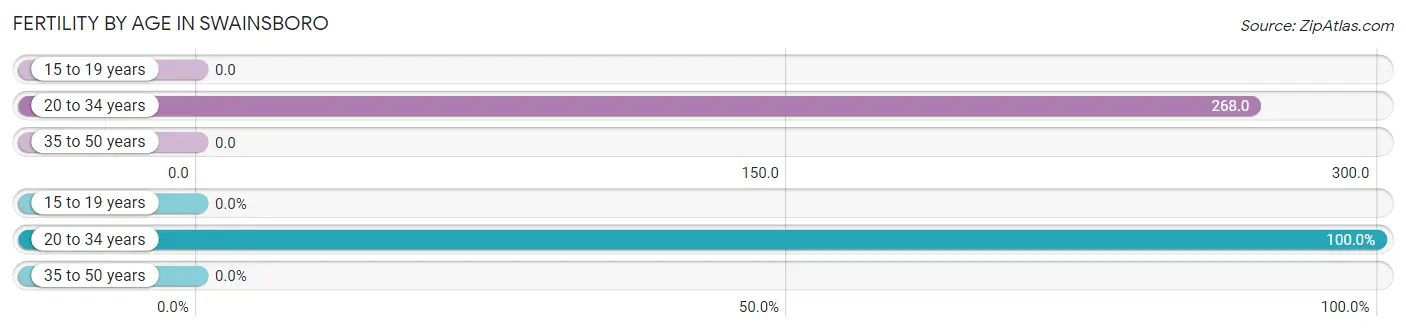
| Age Bracket | Women with Births | Births / 1,000 Women |
| 15 to 19 years | 0 (0.0%) | 0.0 |
| 20 to 34 years | 218 (100.0%) | 268.0 |
| 35 to 50 years | 0 (0.0%) | 0.0 |
| Total | 218 (100.0%) | 118.0 |
Fertility by Age by Marriage Status in Swainsboro
50.5% of women with births (218) in Swainsboro are married. The highest percentage of unmarried women with births falls into 20 to 34 years age bracket with 49.5% of them unmarried at the time of birth, while the lowest percentage of unmarried women with births belong to 20 to 34 years age bracket with 49.5% of them unmarried.
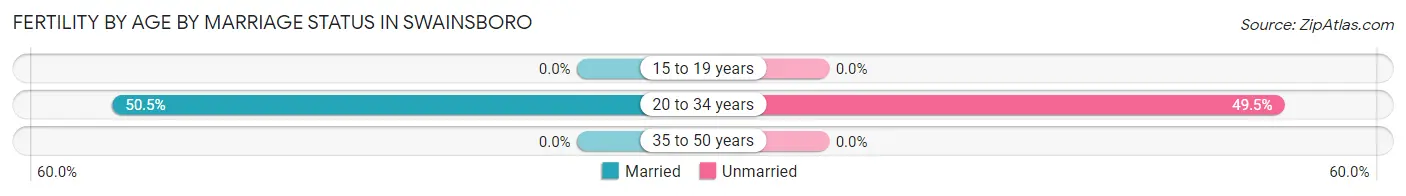
| Age Bracket | Married | Unmarried |
| 15 to 19 years | 0 (0.0%) | 0 (0.0%) |
| 20 to 34 years | 110 (50.5%) | 108 (49.5%) |
| 35 to 50 years | 0 (0.0%) | 0 (0.0%) |
| Total | 110 (50.5%) | 108 (49.5%) |
Fertility by Education in Swainsboro
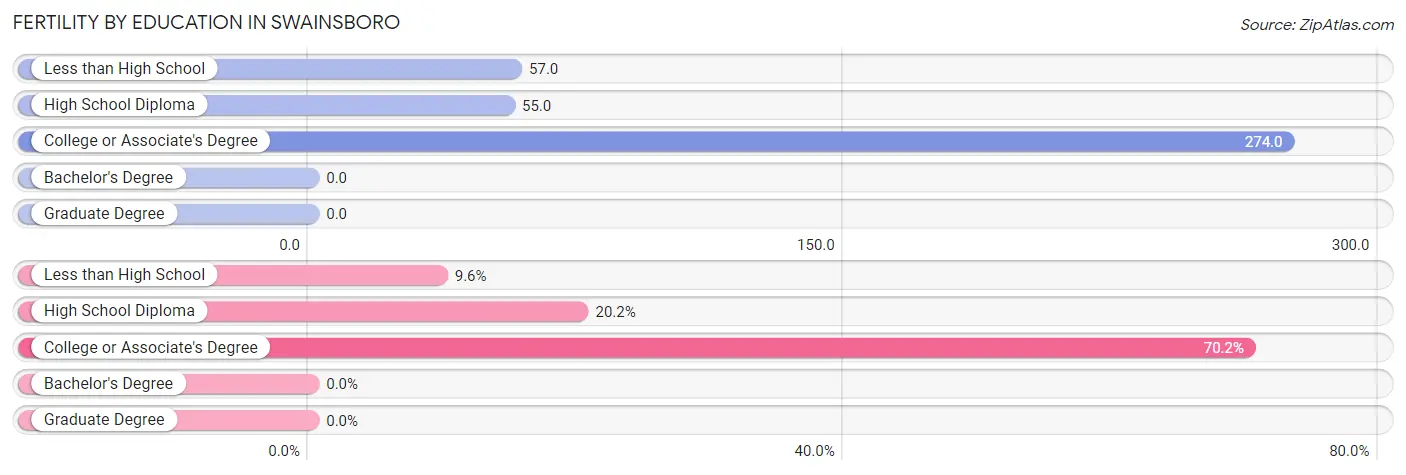
| Educational Attainment | Women with Births | Births / 1,000 Women |
| Less than High School | 21 (9.6%) | 57.0 |
| High School Diploma | 44 (20.2%) | 55.0 |
| College or Associate's Degree | 153 (70.2%) | 274.0 |
| Bachelor's Degree | 0 (0.0%) | 0.0 |
| Graduate Degree | 0 (0.0%) | 0.0 |
| Total | 218 (100.0%) | 118.0 |
Fertility by Education by Marriage Status in Swainsboro
49.5% of women with births in Swainsboro are unmarried. Women with the educational attainment of less than high school are most likely to be married with 100.0% of them married at childbirth, while women with the educational attainment of high school diploma are least likely to be married with 100.0% of them unmarried at childbirth.
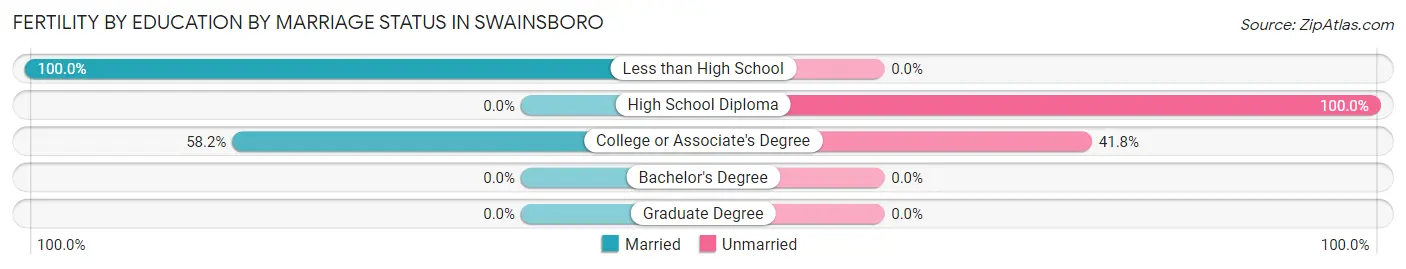
| Educational Attainment | Married | Unmarried |
| Less than High School | 21 (100.0%) | 0 (0.0%) |
| High School Diploma | 0 (0.0%) | 44 (100.0%) |
| College or Associate's Degree | 89 (58.2%) | 64 (41.8%) |
| Bachelor's Degree | 0 (0.0%) | 0 (0.0%) |
| Graduate Degree | 0 (0.0%) | 0 (0.0%) |
| Total | 110 (50.5%) | 108 (49.5%) |
Employment Characteristics in Swainsboro
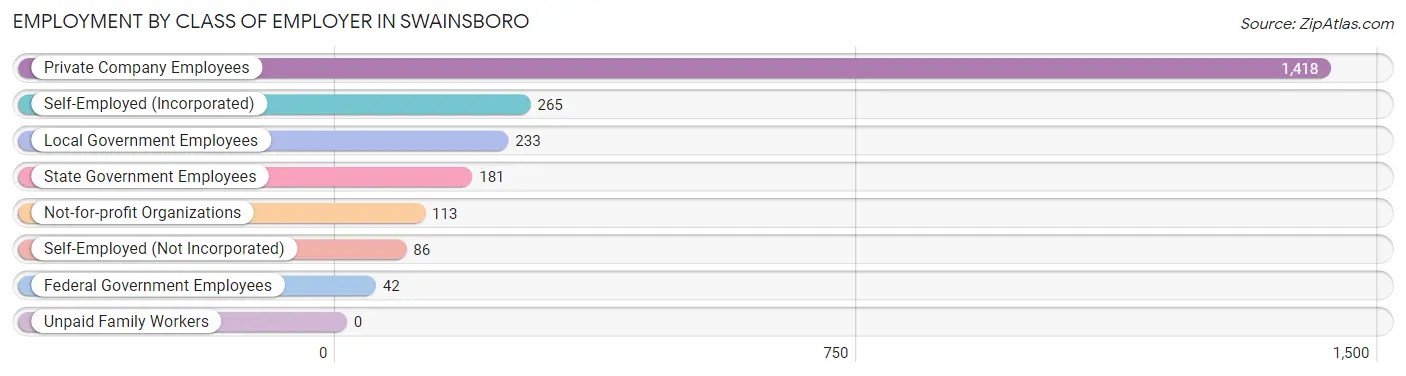
Employment by Class of Employer in Swainsboro
Among the 2,338 employed individuals in Swainsboro, private company employees (1,418 | 60.7%), self-employed (incorporated) (265 | 11.3%), and local government employees (233 | 10.0%) make up the most common classes of employment.
| Employer Class | # Employees | % Employees |
| Private Company Employees | 1,418 | 60.7% |
| Self-Employed (Incorporated) | 265 | 11.3% |
| Self-Employed (Not Incorporated) | 86 | 3.7% |
| Not-for-profit Organizations | 113 | 4.8% |
| Local Government Employees | 233 | 10.0% |
| State Government Employees | 181 | 7.7% |
| Federal Government Employees | 42 | 1.8% |
| Unpaid Family Workers | 0 | 0.0% |
| Total | 2,338 | 100.0% |
Employment Status by Age in Swainsboro
According to the labor force statistics for Swainsboro, out of the total population over 16 years of age (5,334), 51.9% or 2,768 individuals are in the labor force, with 13.2% or 365 of them unemployed. The age group with the highest labor force participation rate is 20 to 24 years, with 77.8% or 466 individuals in the labor force. Within the labor force, the 35 to 44 years age range has the highest percentage of unemployed individuals, with 21.7% or 150 of them being unemployed.
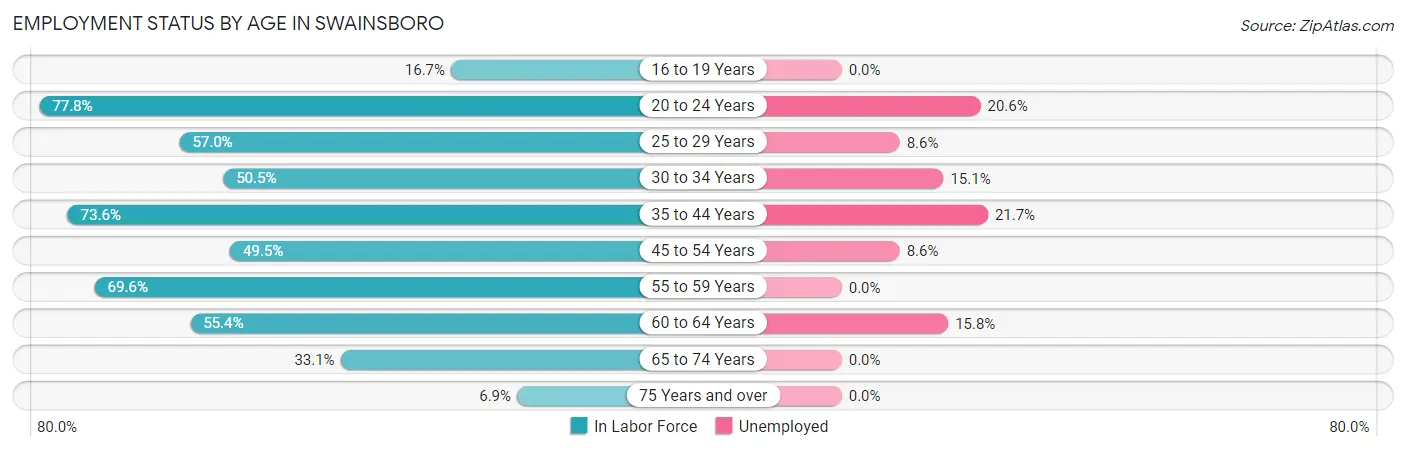
| Age Bracket | In Labor Force | Unemployed |
| 16 to 19 Years | 70 (16.7%) | 0 (0.0%) |
| 20 to 24 Years | 466 (77.8%) | 96 (20.6%) |
| 25 to 29 Years | 302 (57.0%) | 26 (8.6%) |
| 30 to 34 Years | 279 (50.5%) | 42 (15.1%) |
| 35 to 44 Years | 691 (73.6%) | 150 (21.7%) |
| 45 to 54 Years | 315 (49.5%) | 27 (8.6%) |
| 55 to 59 Years | 204 (69.6%) | 0 (0.0%) |
| 60 to 64 Years | 158 (55.4%) | 25 (15.8%) |
| 65 to 74 Years | 261 (33.1%) | 0 (0.0%) |
| 75 Years and over | 20 (6.9%) | 0 (0.0%) |
| Total | 2,768 (51.9%) | 365 (13.2%) |
Employment Status by Educational Attainment in Swainsboro
According to labor force statistics for Swainsboro, 60.2% of individuals (1,948) out of the total population between 25 and 64 years of age (3,236) are in the labor force, with 13.9% or 271 of them being unemployed. The group with the highest labor force participation rate are those with the educational attainment of bachelor's degree or higher, with 94.6% or 192 individuals in the labor force. Within the labor force, individuals with less than high school education have the highest percentage of unemployment, with 30.7% or 69 of them being unemployed.
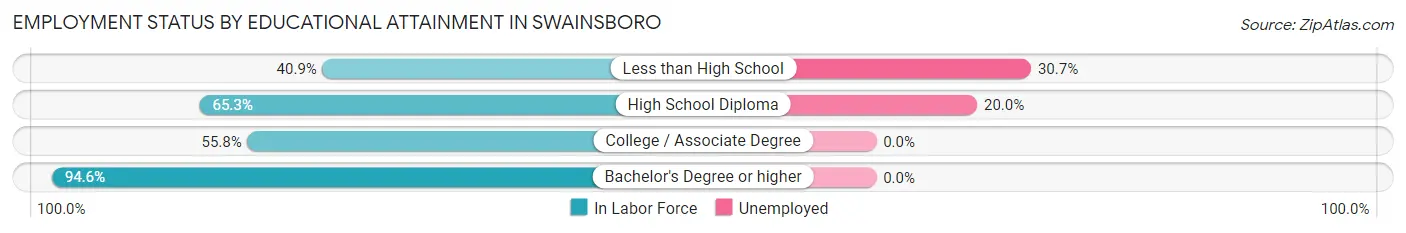
| Educational Attainment | In Labor Force | Unemployed |
| Less than High School | 225 (40.9%) | 169 (30.7%) |
| High School Diploma | 1,004 (65.3%) | 307 (20.0%) |
| College / Associate Degree | 528 (55.8%) | 0 (0.0%) |
| Bachelor's Degree or higher | 192 (94.6%) | 0 (0.0%) |
| Total | 1,948 (60.2%) | 450 (13.9%) |
Employment Occupations by Sex in Swainsboro
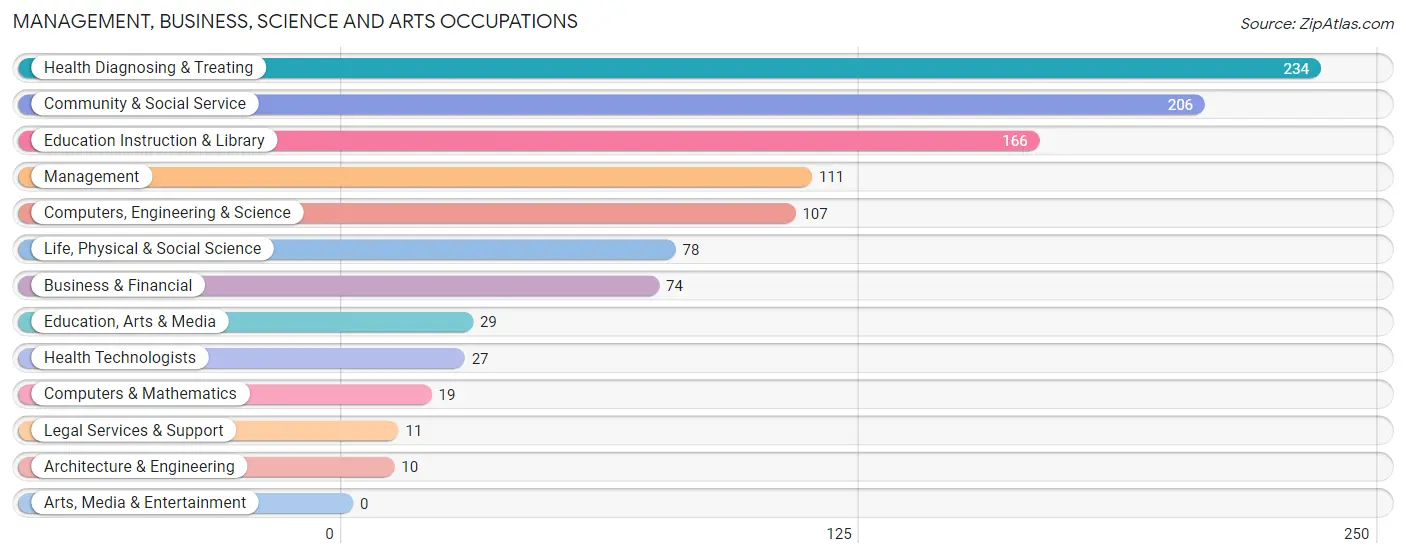
Management, Business, Science and Arts Occupations
The most common Management, Business, Science and Arts occupations in Swainsboro are Health Diagnosing & Treating (234 | 9.8%), Community & Social Service (206 | 8.6%), Education Instruction & Library (166 | 6.9%), Management (111 | 4.6%), and Computers, Engineering & Science (107 | 4.5%).
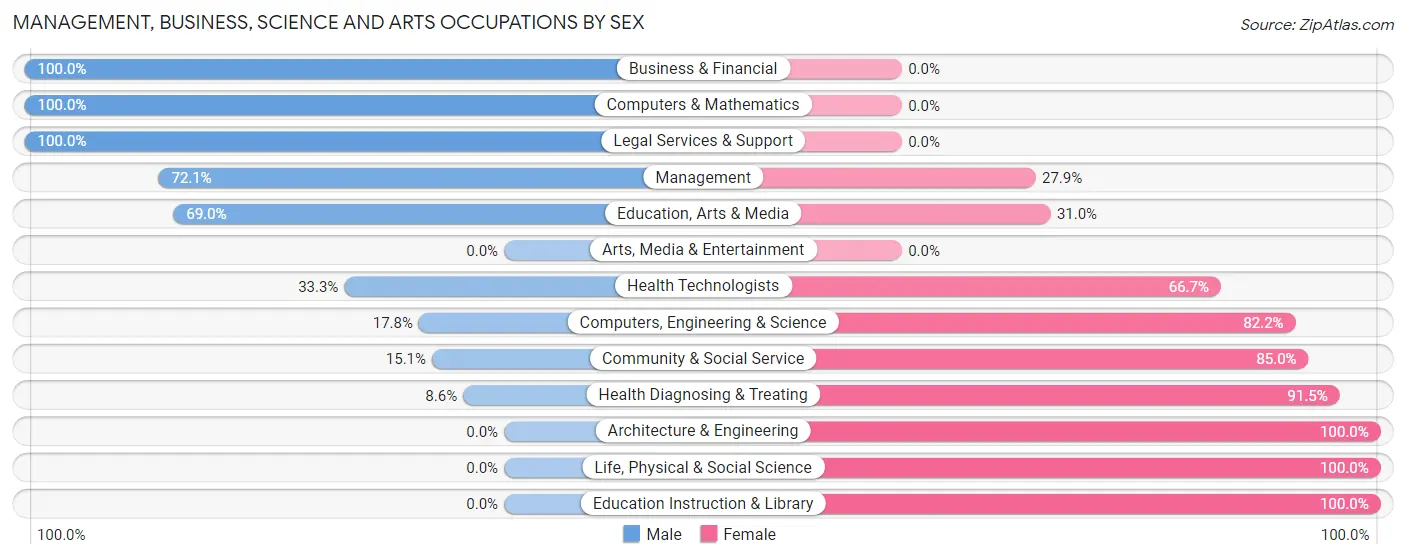
Management, Business, Science and Arts Occupations by Sex
Within the Management, Business, Science and Arts occupations in Swainsboro, the most male-oriented occupations are Business & Financial (100.0%), Computers & Mathematics (100.0%), and Legal Services & Support (100.0%), while the most female-oriented occupations are Architecture & Engineering (100.0%), Life, Physical & Social Science (100.0%), and Education Instruction & Library (100.0%).
| Occupation | Male | Female |
| Management | 80 (72.1%) | 31 (27.9%) |
| Business & Financial | 74 (100.0%) | 0 (0.0%) |
| Computers, Engineering & Science | 19 (17.8%) | 88 (82.2%) |
| Computers & Mathematics | 19 (100.0%) | 0 (0.0%) |
| Architecture & Engineering | 0 (0.0%) | 10 (100.0%) |
| Life, Physical & Social Science | 0 (0.0%) | 78 (100.0%) |
| Community & Social Service | 31 (15.0%) | 175 (85.0%) |
| Education, Arts & Media | 20 (69.0%) | 9 (31.0%) |
| Legal Services & Support | 11 (100.0%) | 0 (0.0%) |
| Education Instruction & Library | 0 (0.0%) | 166 (100.0%) |
| Arts, Media & Entertainment | 0 (0.0%) | 0 (0.0%) |
| Health Diagnosing & Treating | 20 (8.6%) | 214 (91.4%) |
| Health Technologists | 9 (33.3%) | 18 (66.7%) |
| Total (Category) | 224 (30.6%) | 508 (69.4%) |
| Total (Overall) | 1,194 (49.7%) | 1,206 (50.2%) |
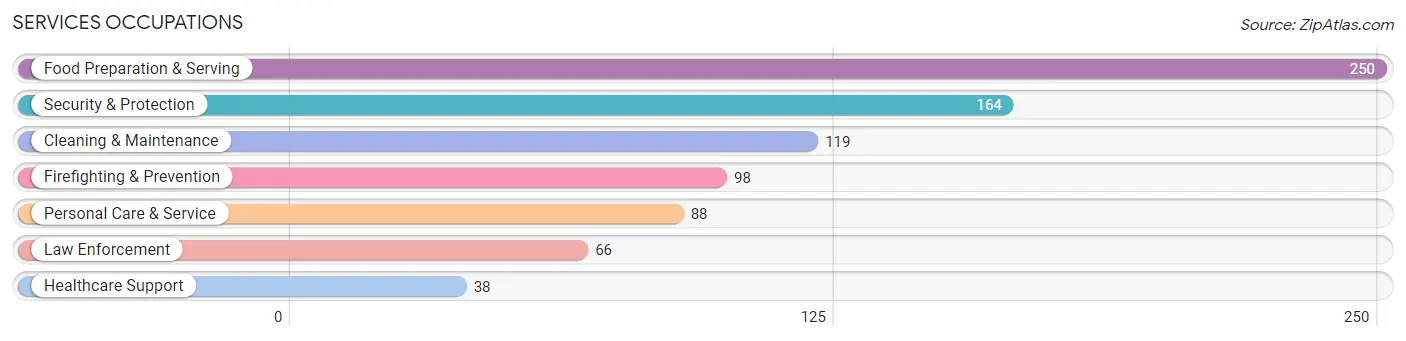
Services Occupations
The most common Services occupations in Swainsboro are Food Preparation & Serving (250 | 10.4%), Security & Protection (164 | 6.8%), Cleaning & Maintenance (119 | 5.0%), Firefighting & Prevention (98 | 4.1%), and Personal Care & Service (88 | 3.7%).
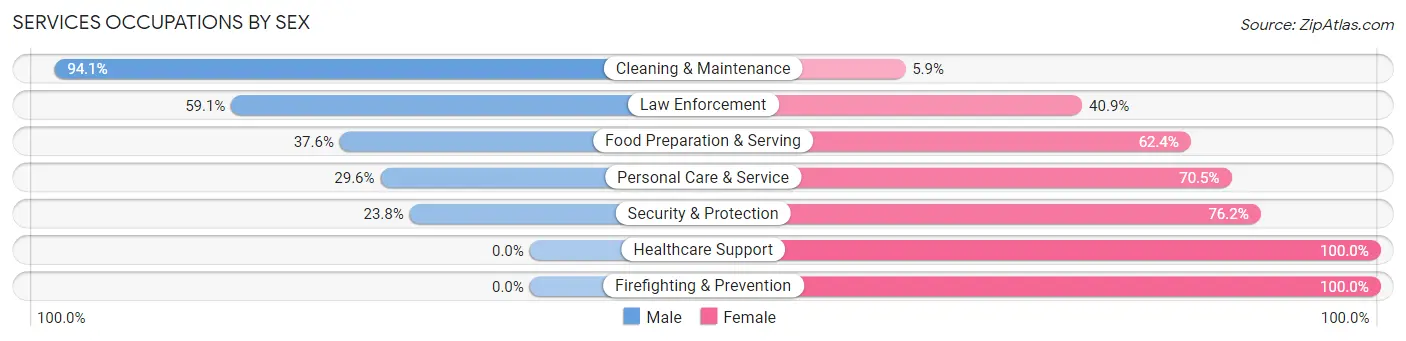
Services Occupations by Sex
Within the Services occupations in Swainsboro, the most male-oriented occupations are Cleaning & Maintenance (94.1%), Law Enforcement (59.1%), and Food Preparation & Serving (37.6%), while the most female-oriented occupations are Healthcare Support (100.0%), Firefighting & Prevention (100.0%), and Security & Protection (76.2%).
| Occupation | Male | Female |
| Healthcare Support | 0 (0.0%) | 38 (100.0%) |
| Security & Protection | 39 (23.8%) | 125 (76.2%) |
| Firefighting & Prevention | 0 (0.0%) | 98 (100.0%) |
| Law Enforcement | 39 (59.1%) | 27 (40.9%) |
| Food Preparation & Serving | 94 (37.6%) | 156 (62.4%) |
| Cleaning & Maintenance | 112 (94.1%) | 7 (5.9%) |
| Personal Care & Service | 26 (29.5%) | 62 (70.5%) |
| Total (Category) | 271 (41.1%) | 388 (58.9%) |
| Total (Overall) | 1,194 (49.7%) | 1,206 (50.2%) |
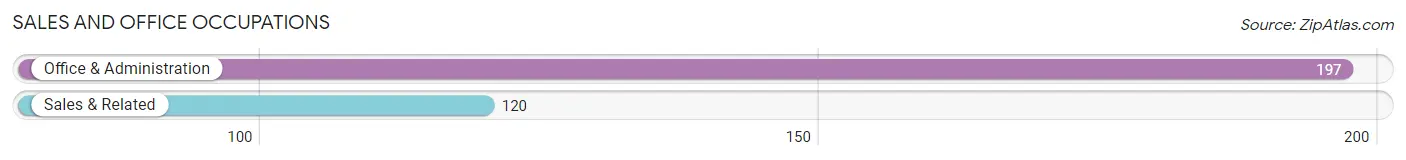
Sales and Office Occupations
The most common Sales and Office occupations in Swainsboro are Office & Administration (197 | 8.2%), and Sales & Related (120 | 5.0%).
Sales and Office Occupations by Sex
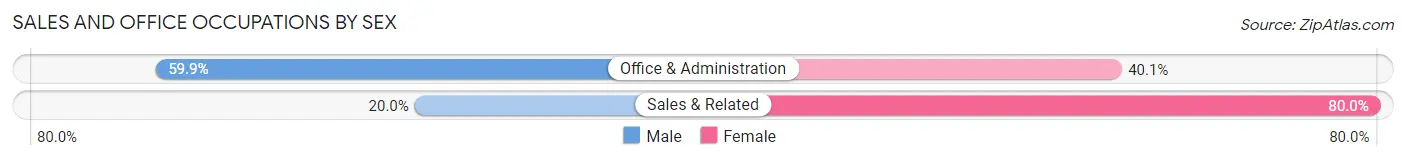
| Occupation | Male | Female |
| Sales & Related | 24 (20.0%) | 96 (80.0%) |
| Office & Administration | 118 (59.9%) | 79 (40.1%) |
| Total (Category) | 142 (44.8%) | 175 (55.2%) |
| Total (Overall) | 1,194 (49.7%) | 1,206 (50.2%) |
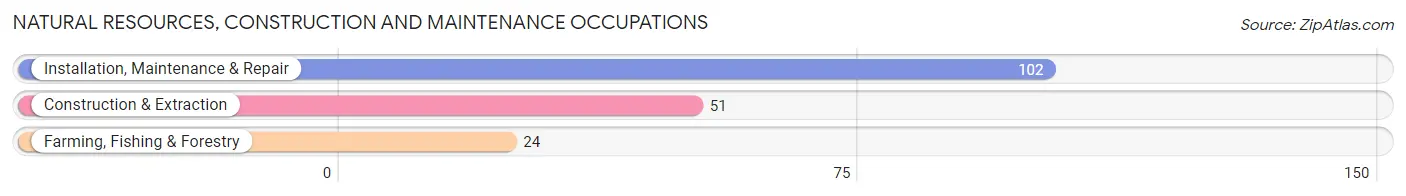
Natural Resources, Construction and Maintenance Occupations
The most common Natural Resources, Construction and Maintenance occupations in Swainsboro are Installation, Maintenance & Repair (102 | 4.3%), Construction & Extraction (51 | 2.1%), and Farming, Fishing & Forestry (24 | 1.0%).
Natural Resources, Construction and Maintenance Occupations by Sex
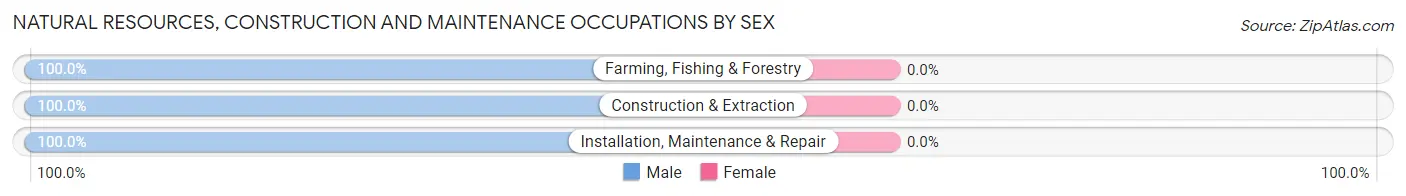
| Occupation | Male | Female |
| Farming, Fishing & Forestry | 24 (100.0%) | 0 (0.0%) |
| Construction & Extraction | 51 (100.0%) | 0 (0.0%) |
| Installation, Maintenance & Repair | 102 (100.0%) | 0 (0.0%) |
| Total (Category) | 177 (100.0%) | 0 (0.0%) |
| Total (Overall) | 1,194 (49.7%) | 1,206 (50.2%) |
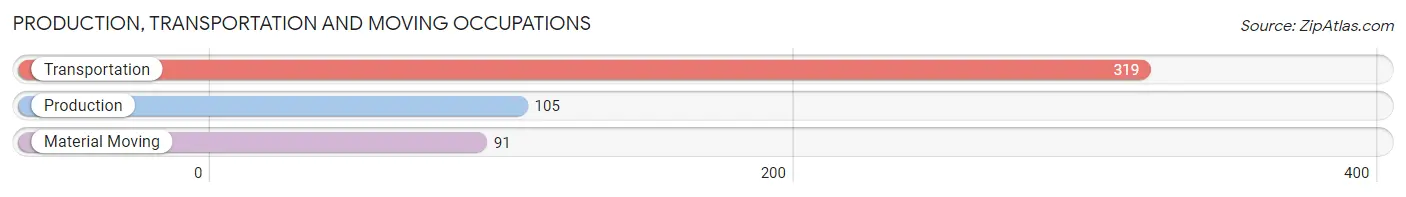
Production, Transportation and Moving Occupations
The most common Production, Transportation and Moving occupations in Swainsboro are Transportation (319 | 13.3%), Production (105 | 4.4%), and Material Moving (91 | 3.8%).
Production, Transportation and Moving Occupations by Sex
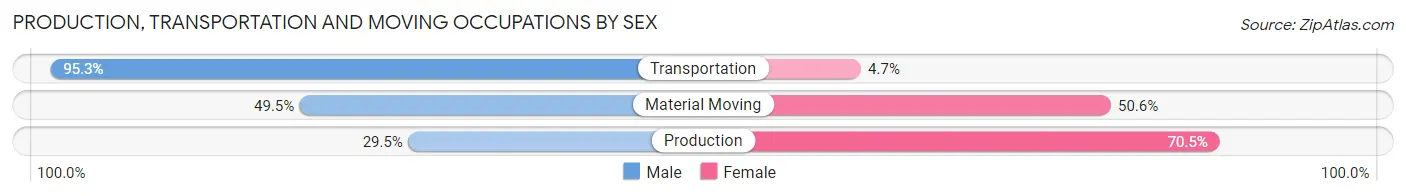
| Occupation | Male | Female |
| Production | 31 (29.5%) | 74 (70.5%) |
| Transportation | 304 (95.3%) | 15 (4.7%) |
| Material Moving | 45 (49.4%) | 46 (50.5%) |
| Total (Category) | 380 (73.8%) | 135 (26.2%) |
| Total (Overall) | 1,194 (49.7%) | 1,206 (50.2%) |
Employment Industries by Sex in Swainsboro
Employment Industries in Swainsboro
The major employment industries in Swainsboro include Health Care & Social Assistance (442 | 18.4%), Transportation & Warehousing (339 | 14.1%), Educational Services (278 | 11.6%), Manufacturing (254 | 10.6%), and Retail Trade (211 | 8.8%).

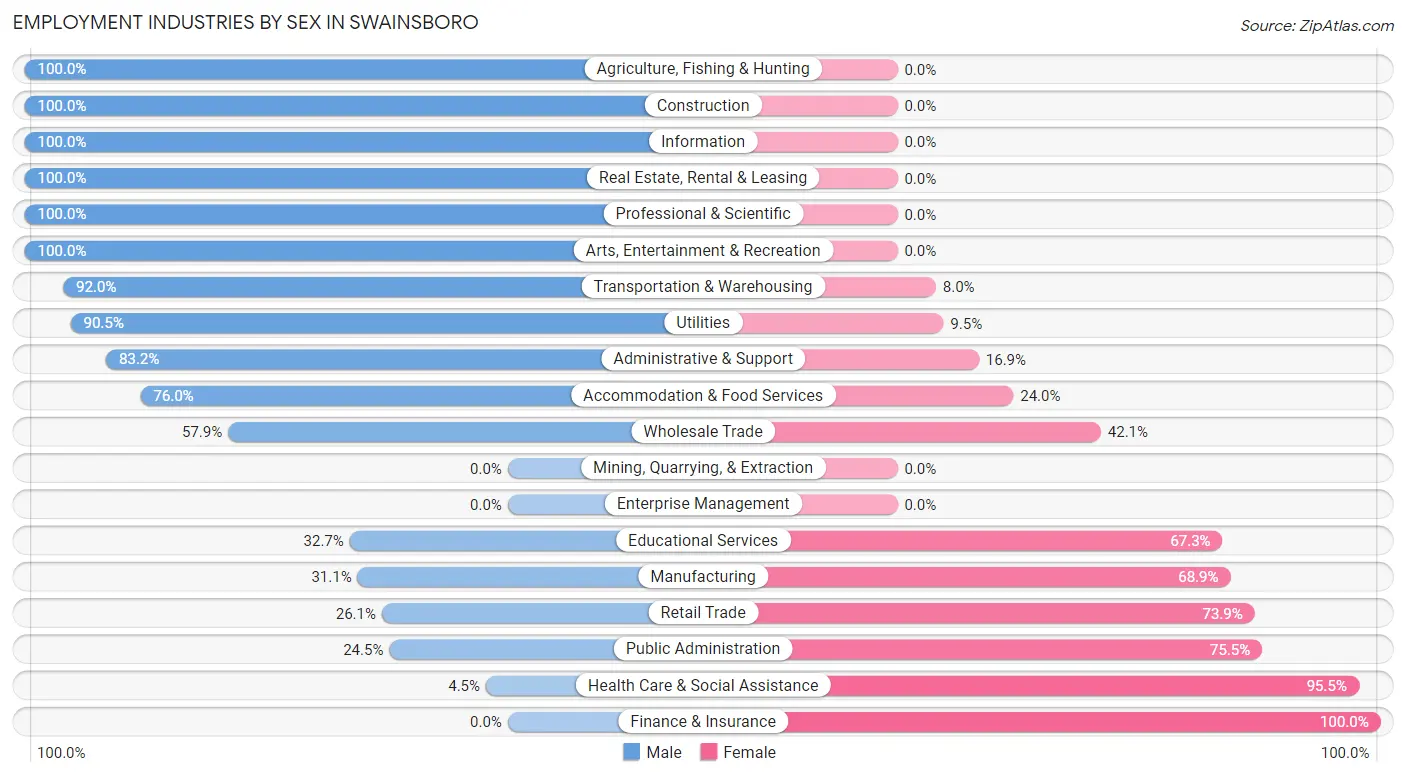
Employment Industries by Sex in Swainsboro
The Swainsboro industries that see more men than women are Agriculture, Fishing & Hunting (100.0%), Construction (100.0%), and Information (100.0%), whereas the industries that tend to have a higher number of women are Finance & Insurance (100.0%), Health Care & Social Assistance (95.5%), and Public Administration (75.5%).
| Industry | Male | Female |
| Agriculture, Fishing & Hunting | 24 (100.0%) | 0 (0.0%) |
| Mining, Quarrying, & Extraction | 0 (0.0%) | 0 (0.0%) |
| Construction | 75 (100.0%) | 0 (0.0%) |
| Manufacturing | 79 (31.1%) | 175 (68.9%) |
| Wholesale Trade | 11 (57.9%) | 8 (42.1%) |
| Retail Trade | 55 (26.1%) | 156 (73.9%) |
| Transportation & Warehousing | 312 (92.0%) | 27 (8.0%) |
| Utilities | 57 (90.5%) | 6 (9.5%) |
| Information | 19 (100.0%) | 0 (0.0%) |
| Finance & Insurance | 0 (0.0%) | 8 (100.0%) |
| Real Estate, Rental & Leasing | 28 (100.0%) | 0 (0.0%) |
| Professional & Scientific | 85 (100.0%) | 0 (0.0%) |
| Enterprise Management | 0 (0.0%) | 0 (0.0%) |
| Administrative & Support | 74 (83.2%) | 15 (16.9%) |
| Educational Services | 91 (32.7%) | 187 (67.3%) |
| Health Care & Social Assistance | 20 (4.5%) | 422 (95.5%) |
| Arts, Entertainment & Recreation | 62 (100.0%) | 0 (0.0%) |
| Accommodation & Food Services | 149 (76.0%) | 47 (24.0%) |
| Public Administration | 39 (24.5%) | 120 (75.5%) |
| Total | 1,194 (49.7%) | 1,206 (50.2%) |
Education in Swainsboro
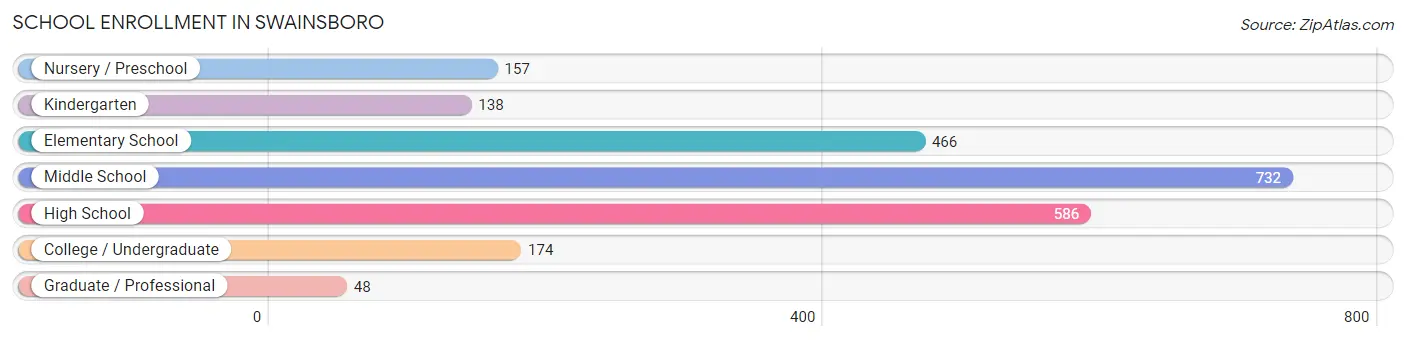
School Enrollment in Swainsboro
The most common levels of schooling among the 2,301 students in Swainsboro are middle school (732 | 31.8%), high school (586 | 25.5%), and elementary school (466 | 20.3%).
| School Level | # Students | % Students |
| Nursery / Preschool | 157 | 6.8% |
| Kindergarten | 138 | 6.0% |
| Elementary School | 466 | 20.3% |
| Middle School | 732 | 31.8% |
| High School | 586 | 25.5% |
| College / Undergraduate | 174 | 7.6% |
| Graduate / Professional | 48 | 2.1% |
| Total | 2,301 | 100.0% |
School Enrollment by Age by Funding Source in Swainsboro
Out of a total of 2,301 students who are enrolled in schools in Swainsboro, 267 (11.6%) attend a private institution, while the remaining 2,034 (88.4%) are enrolled in public schools. The age group of 20 to 24 year olds has the highest likelihood of being enrolled in private schools, with 62 (92.5% in the age bracket) enrolled. Conversely, the age group of 15 to 17 year olds has the lowest likelihood of being enrolled in a private school, with 387 (100.0% in the age bracket) attending a public institution.
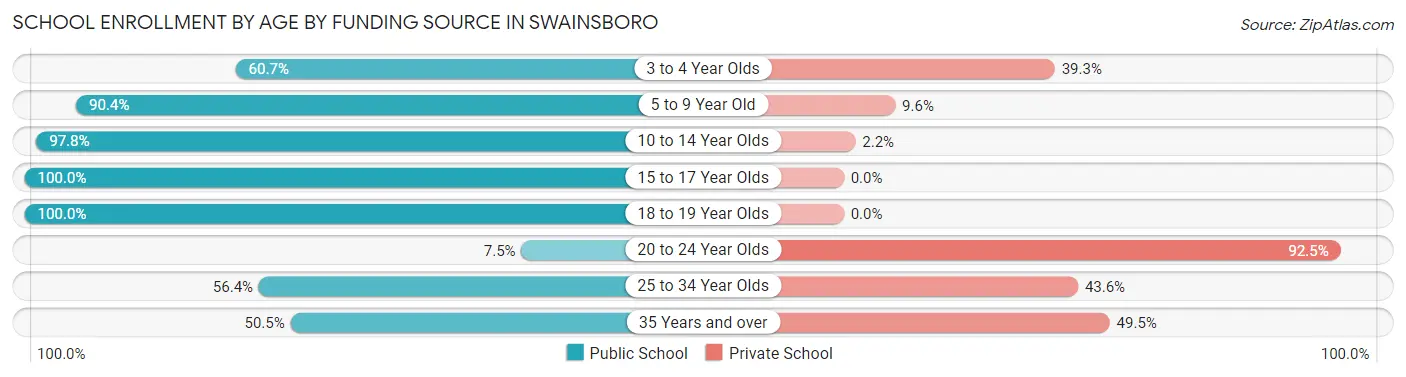
| Age Bracket | Public School | Private School |
| 3 to 4 Year Olds | 88 (60.7%) | 57 (39.3%) |
| 5 to 9 Year Old | 481 (90.4%) | 51 (9.6%) |
| 10 to 14 Year Olds | 852 (97.8%) | 19 (2.2%) |
| 15 to 17 Year Olds | 387 (100.0%) | 0 (0.0%) |
| 18 to 19 Year Olds | 135 (100.0%) | 0 (0.0%) |
| 20 to 24 Year Olds | 5 (7.5%) | 62 (92.5%) |
| 25 to 34 Year Olds | 31 (56.4%) | 24 (43.6%) |
| 35 Years and over | 55 (50.5%) | 54 (49.5%) |
| Total | 2,034 (88.4%) | 267 (11.6%) |
Educational Attainment by Field of Study in Swainsboro
Education (222 | 41.2%), business (90 | 16.7%), liberal arts & history (61 | 11.3%), science & technology (43 | 8.0%), and arts & humanities (39 | 7.2%) are the most common fields of study among 539 individuals in Swainsboro who have obtained a bachelor's degree or higher.
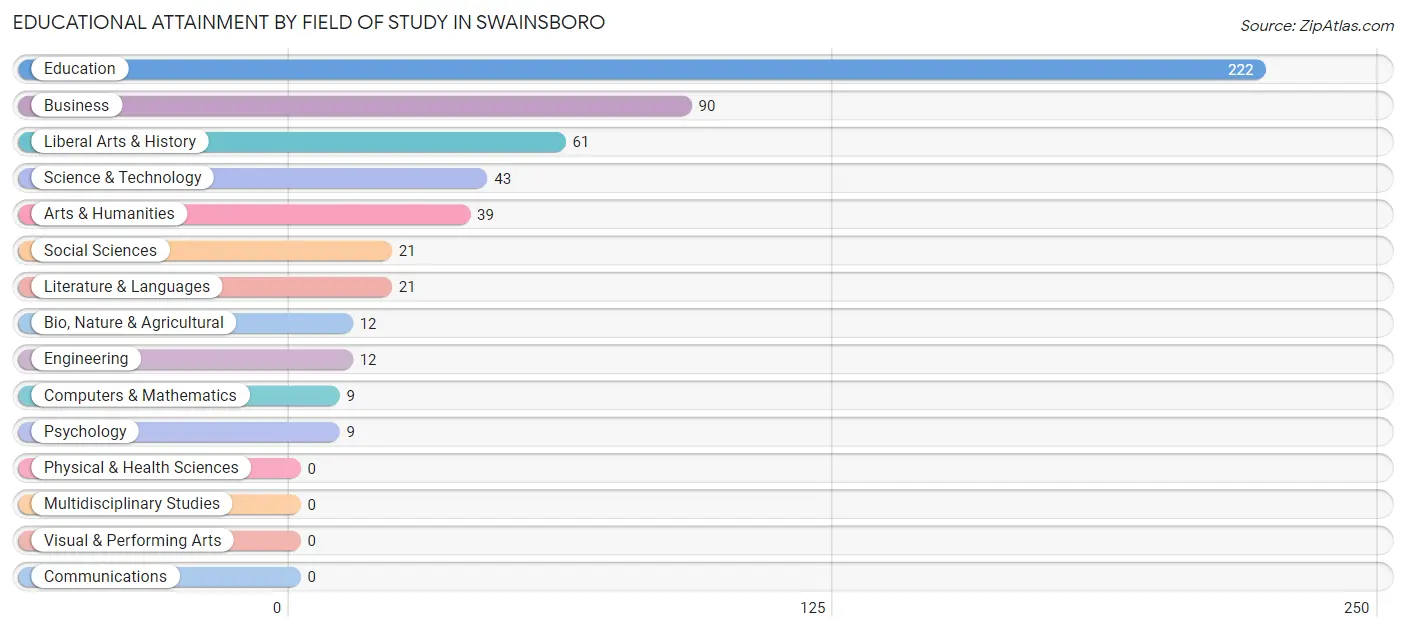
| Field of Study | # Graduates | % Graduates |
| Computers & Mathematics | 9 | 1.7% |
| Bio, Nature & Agricultural | 12 | 2.2% |
| Physical & Health Sciences | 0 | 0.0% |
| Psychology | 9 | 1.7% |
| Social Sciences | 21 | 3.9% |
| Engineering | 12 | 2.2% |
| Multidisciplinary Studies | 0 | 0.0% |
| Science & Technology | 43 | 8.0% |
| Business | 90 | 16.7% |
| Education | 222 | 41.2% |
| Literature & Languages | 21 | 3.9% |
| Liberal Arts & History | 61 | 11.3% |
| Visual & Performing Arts | 0 | 0.0% |
| Communications | 0 | 0.0% |
| Arts & Humanities | 39 | 7.2% |
| Total | 539 | 100.0% |
Transportation & Commute in Swainsboro
Vehicle Availability by Sex in Swainsboro
The most prevalent vehicle ownership categories in Swainsboro are males with 2 vehicles (480, accounting for 40.6%) and females with 2 vehicles (523, making up 42.2%).
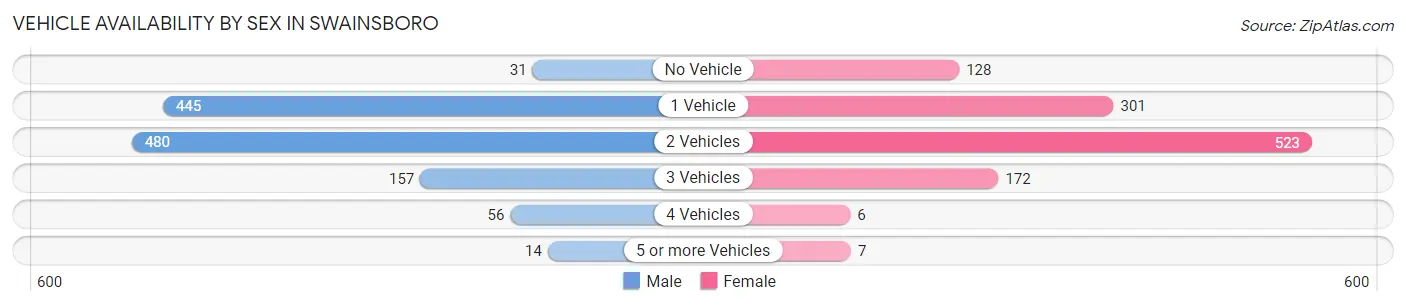
| Vehicles Available | Male | Female |
| No Vehicle | 31 (2.6%) | 128 (11.3%) |
| 1 Vehicle | 445 (37.6%) | 301 (26.5%) |
| 2 Vehicles | 480 (40.6%) | 523 (46.0%) |
| 3 Vehicles | 157 (13.3%) | 172 (15.1%) |
| 4 Vehicles | 56 (4.7%) | 6 (0.5%) |
| 5 or more Vehicles | 14 (1.2%) | 7 (0.6%) |
| Total | 1,183 (100.0%) | 1,137 (100.0%) |
Commute Time in Swainsboro
The most frequently occuring commute durations in Swainsboro are 60 to 89 minutes (438 commuters, 20.0%), 5 to 9 minutes (434 commuters, 19.9%), and 10 to 14 minutes (295 commuters, 13.5%).
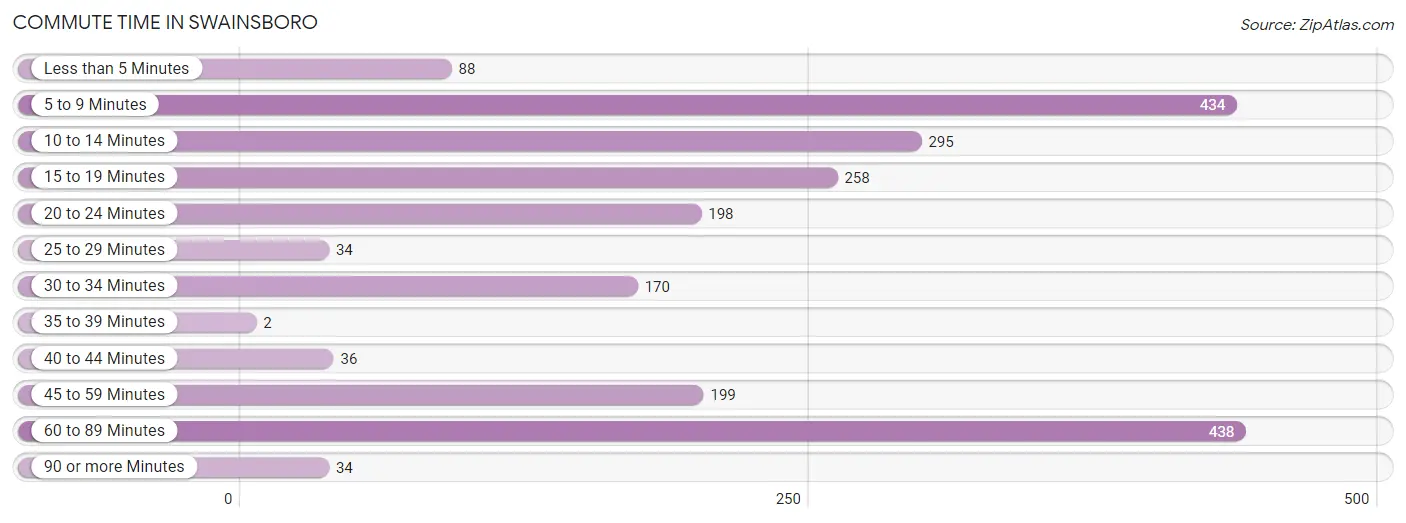
| Commute Time | # Commuters | % Commuters |
| Less than 5 Minutes | 88 | 4.0% |
| 5 to 9 Minutes | 434 | 19.9% |
| 10 to 14 Minutes | 295 | 13.5% |
| 15 to 19 Minutes | 258 | 11.8% |
| 20 to 24 Minutes | 198 | 9.1% |
| 25 to 29 Minutes | 34 | 1.6% |
| 30 to 34 Minutes | 170 | 7.8% |
| 35 to 39 Minutes | 2 | 0.1% |
| 40 to 44 Minutes | 36 | 1.7% |
| 45 to 59 Minutes | 199 | 9.1% |
| 60 to 89 Minutes | 438 | 20.0% |
| 90 or more Minutes | 34 | 1.6% |
Commute Time by Sex in Swainsboro
The most common commute times in Swainsboro are 60 to 89 minutes (425 commuters, 36.3%) for males and 5 to 9 minutes (288 commuters, 28.3%) for females.
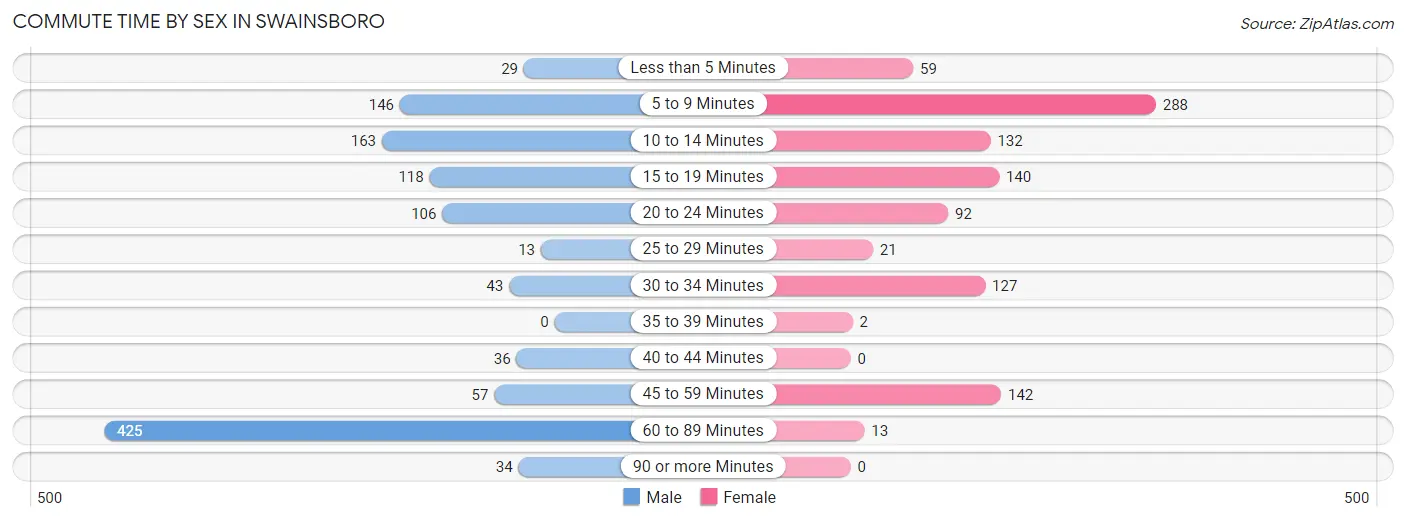
| Commute Time | Male | Female |
| Less than 5 Minutes | 29 (2.5%) | 59 (5.8%) |
| 5 to 9 Minutes | 146 (12.5%) | 288 (28.3%) |
| 10 to 14 Minutes | 163 (13.9%) | 132 (13.0%) |
| 15 to 19 Minutes | 118 (10.1%) | 140 (13.8%) |
| 20 to 24 Minutes | 106 (9.1%) | 92 (9.1%) |
| 25 to 29 Minutes | 13 (1.1%) | 21 (2.1%) |
| 30 to 34 Minutes | 43 (3.7%) | 127 (12.5%) |
| 35 to 39 Minutes | 0 (0.0%) | 2 (0.2%) |
| 40 to 44 Minutes | 36 (3.1%) | 0 (0.0%) |
| 45 to 59 Minutes | 57 (4.9%) | 142 (14.0%) |
| 60 to 89 Minutes | 425 (36.3%) | 13 (1.3%) |
| 90 or more Minutes | 34 (2.9%) | 0 (0.0%) |
Time of Departure to Work by Sex in Swainsboro
The most frequent times of departure to work in Swainsboro are 12:00 AM to 4:59 AM (380, 32.5%) for males and 12:00 AM to 4:59 AM (253, 24.9%) for females.
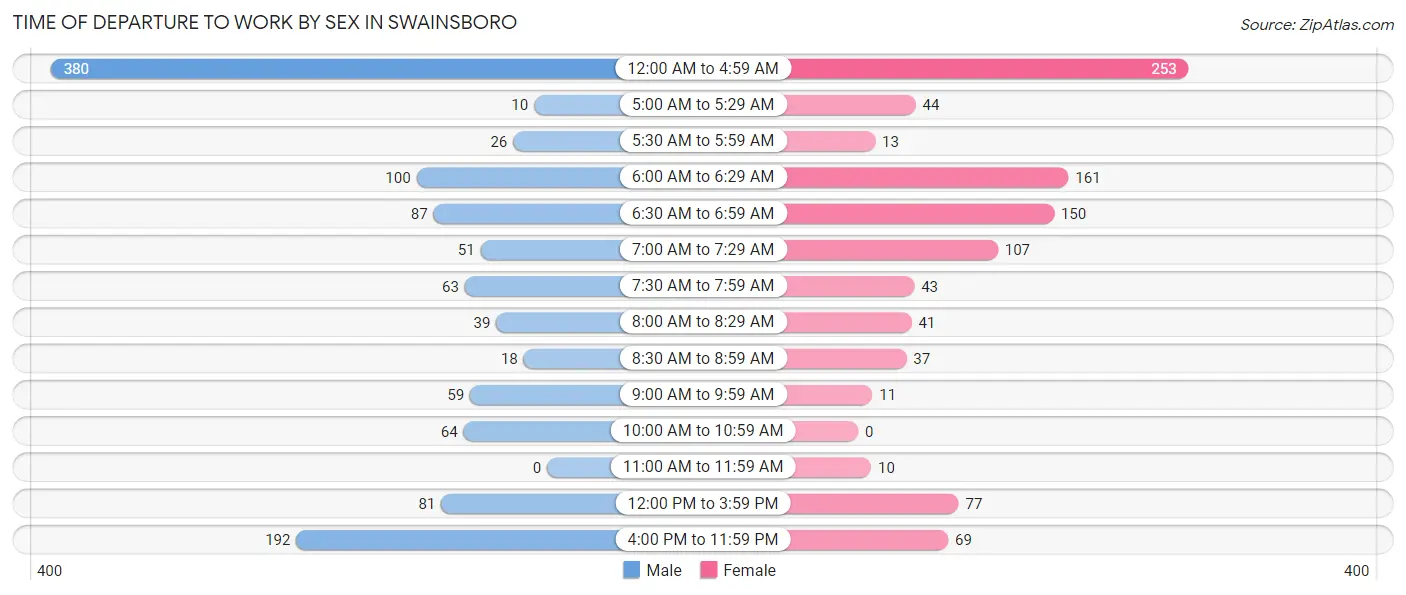
| Time of Departure | Male | Female |
| 12:00 AM to 4:59 AM | 380 (32.5%) | 253 (24.9%) |
| 5:00 AM to 5:29 AM | 10 (0.9%) | 44 (4.3%) |
| 5:30 AM to 5:59 AM | 26 (2.2%) | 13 (1.3%) |
| 6:00 AM to 6:29 AM | 100 (8.6%) | 161 (15.9%) |
| 6:30 AM to 6:59 AM | 87 (7.4%) | 150 (14.8%) |
| 7:00 AM to 7:29 AM | 51 (4.4%) | 107 (10.5%) |
| 7:30 AM to 7:59 AM | 63 (5.4%) | 43 (4.2%) |
| 8:00 AM to 8:29 AM | 39 (3.3%) | 41 (4.0%) |
| 8:30 AM to 8:59 AM | 18 (1.5%) | 37 (3.6%) |
| 9:00 AM to 9:59 AM | 59 (5.0%) | 11 (1.1%) |
| 10:00 AM to 10:59 AM | 64 (5.5%) | 0 (0.0%) |
| 11:00 AM to 11:59 AM | 0 (0.0%) | 10 (1.0%) |
| 12:00 PM to 3:59 PM | 81 (6.9%) | 77 (7.6%) |
| 4:00 PM to 11:59 PM | 192 (16.4%) | 69 (6.8%) |
| Total | 1,170 (100.0%) | 1,016 (100.0%) |
Housing Occupancy in Swainsboro
Occupancy by Ownership in Swainsboro
Of the total 2,764 dwellings in Swainsboro, owner-occupied units account for 955 (34.5%), while renter-occupied units make up 1,809 (65.4%).
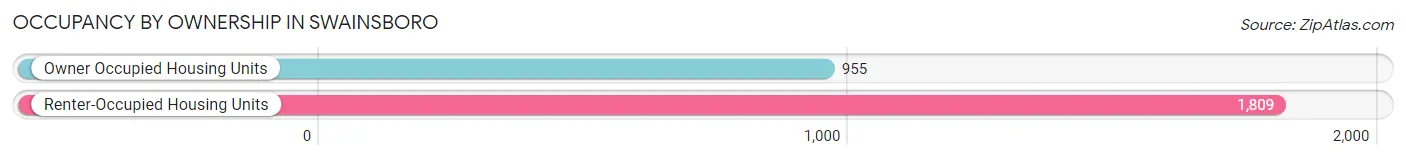
| Occupancy | # Housing Units | % Housing Units |
| Owner Occupied Housing Units | 955 | 34.5% |
| Renter-Occupied Housing Units | 1,809 | 65.4% |
| Total Occupied Housing Units | 2,764 | 100.0% |
Occupancy by Household Size in Swainsboro
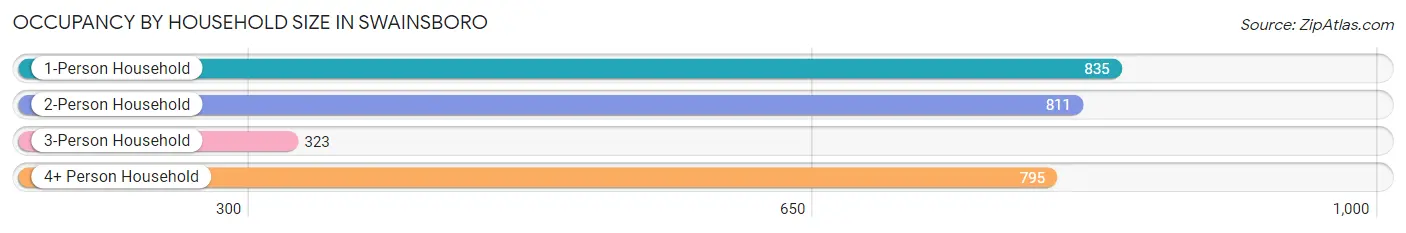
| Household Size | # Housing Units | % Housing Units |
| 1-Person Household | 835 | 30.2% |
| 2-Person Household | 811 | 29.3% |
| 3-Person Household | 323 | 11.7% |
| 4+ Person Household | 795 | 28.8% |
| Total Housing Units | 2,764 | 100.0% |
Occupancy by Ownership by Household Size in Swainsboro
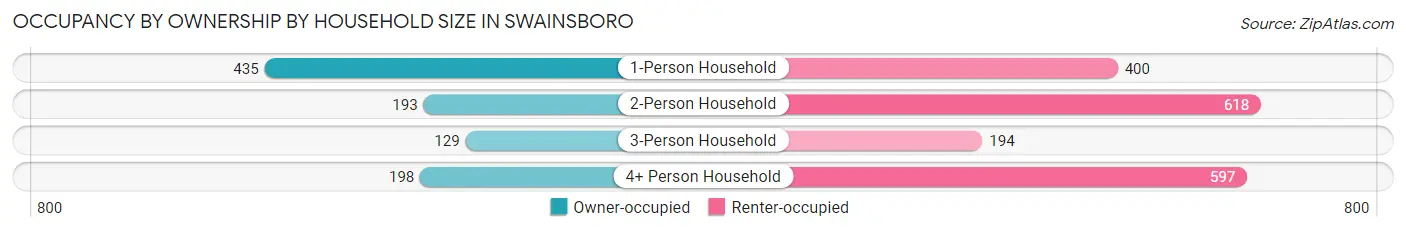
| Household Size | Owner-occupied | Renter-occupied |
| 1-Person Household | 435 (52.1%) | 400 (47.9%) |
| 2-Person Household | 193 (23.8%) | 618 (76.2%) |
| 3-Person Household | 129 (39.9%) | 194 (60.1%) |
| 4+ Person Household | 198 (24.9%) | 597 (75.1%) |
| Total Housing Units | 955 (34.5%) | 1,809 (65.4%) |
Occupancy by Educational Attainment in Swainsboro
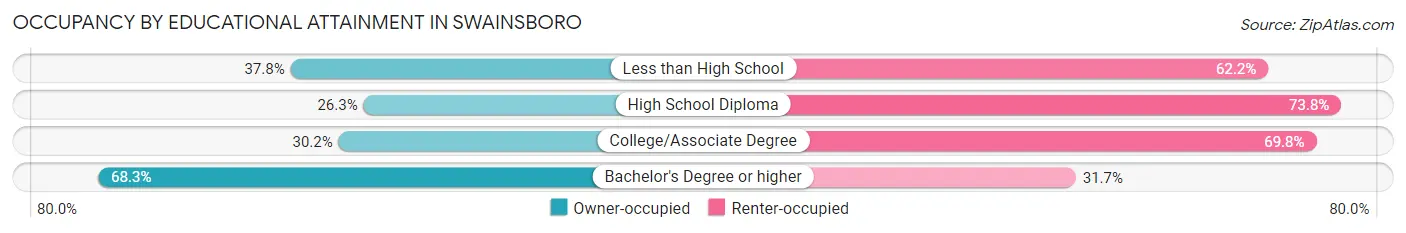
| Household Size | Owner-occupied | Renter-occupied |
| Less than High School | 160 (37.8%) | 263 (62.2%) |
| High School Diploma | 272 (26.3%) | 764 (73.8%) |
| College/Associate Degree | 292 (30.2%) | 675 (69.8%) |
| Bachelor's Degree or higher | 231 (68.3%) | 107 (31.7%) |
Occupancy by Age of Householder in Swainsboro
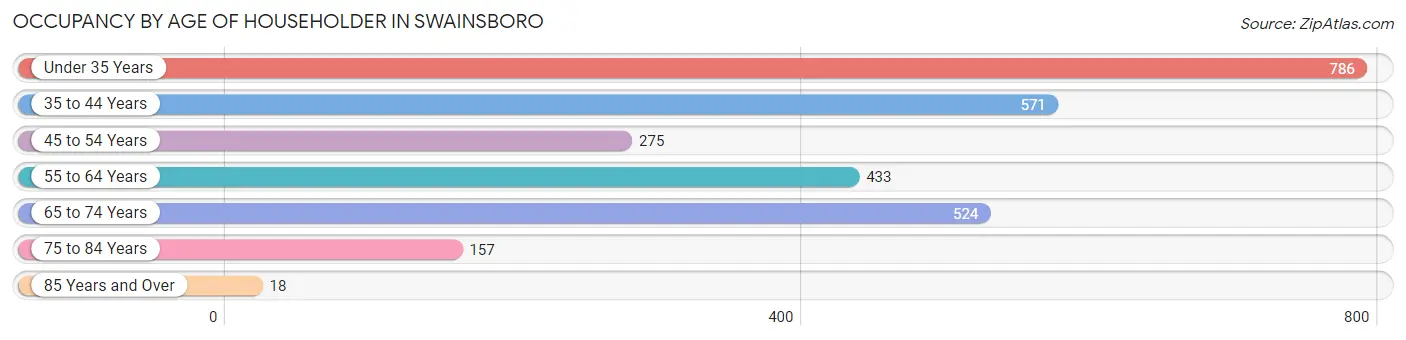
| Age Bracket | # Households | % Households |
| Under 35 Years | 786 | 28.4% |
| 35 to 44 Years | 571 | 20.7% |
| 45 to 54 Years | 275 | 10.0% |
| 55 to 64 Years | 433 | 15.7% |
| 65 to 74 Years | 524 | 19.0% |
| 75 to 84 Years | 157 | 5.7% |
| 85 Years and Over | 18 | 0.6% |
| Total | 2,764 | 100.0% |
Housing Finances in Swainsboro
Median Income by Occupancy in Swainsboro
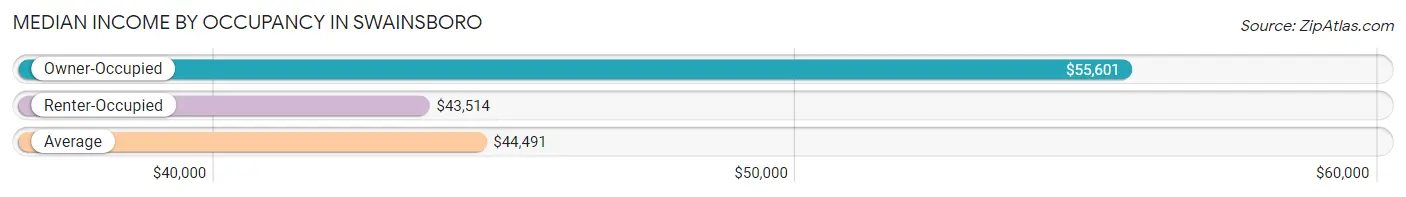
| Occupancy Type | # Households | Median Income |
| Owner-Occupied | 955 (34.5%) | $55,601 |
| Renter-Occupied | 1,809 (65.4%) | $43,514 |
| Average | 2,764 (100.0%) | $44,491 |
Occupancy by Householder Income Bracket in Swainsboro
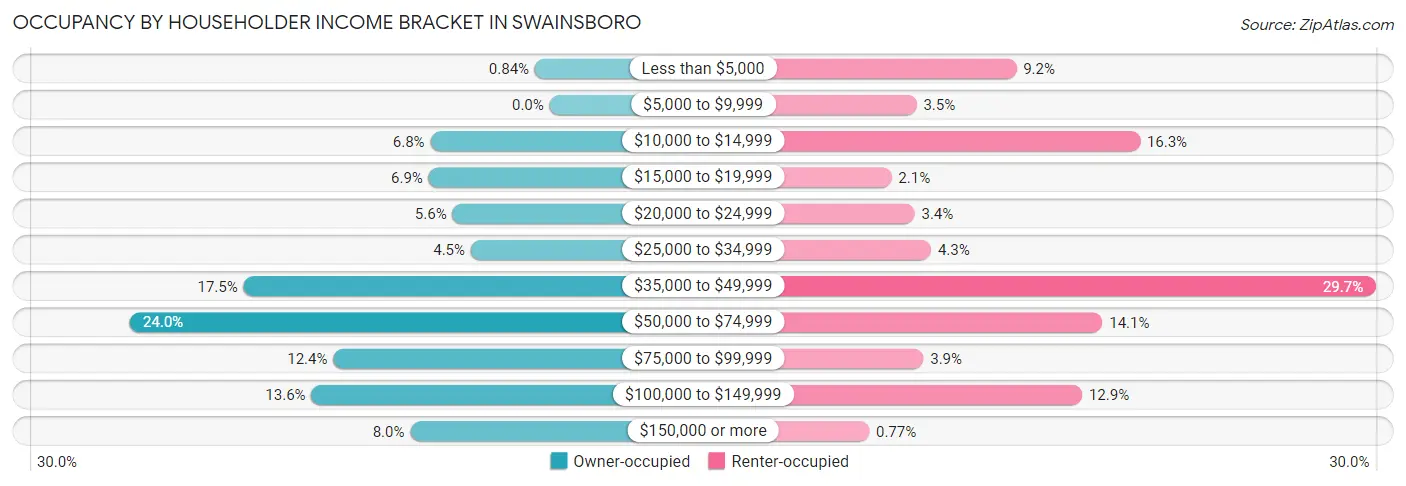
| Income Bracket | Owner-occupied | Renter-occupied |
| Less than $5,000 | 8 (0.8%) | 166 (9.2%) |
| $5,000 to $9,999 | 0 (0.0%) | 63 (3.5%) |
| $10,000 to $14,999 | 65 (6.8%) | 294 (16.3%) |
| $15,000 to $19,999 | 66 (6.9%) | 37 (2.1%) |
| $20,000 to $24,999 | 53 (5.6%) | 61 (3.4%) |
| $25,000 to $34,999 | 43 (4.5%) | 78 (4.3%) |
| $35,000 to $49,999 | 167 (17.5%) | 537 (29.7%) |
| $50,000 to $74,999 | 229 (24.0%) | 255 (14.1%) |
| $75,000 to $99,999 | 118 (12.4%) | 70 (3.9%) |
| $100,000 to $149,999 | 130 (13.6%) | 234 (12.9%) |
| $150,000 or more | 76 (8.0%) | 14 (0.8%) |
| Total | 955 (100.0%) | 1,809 (100.0%) |
Monthly Housing Cost Tiers in Swainsboro
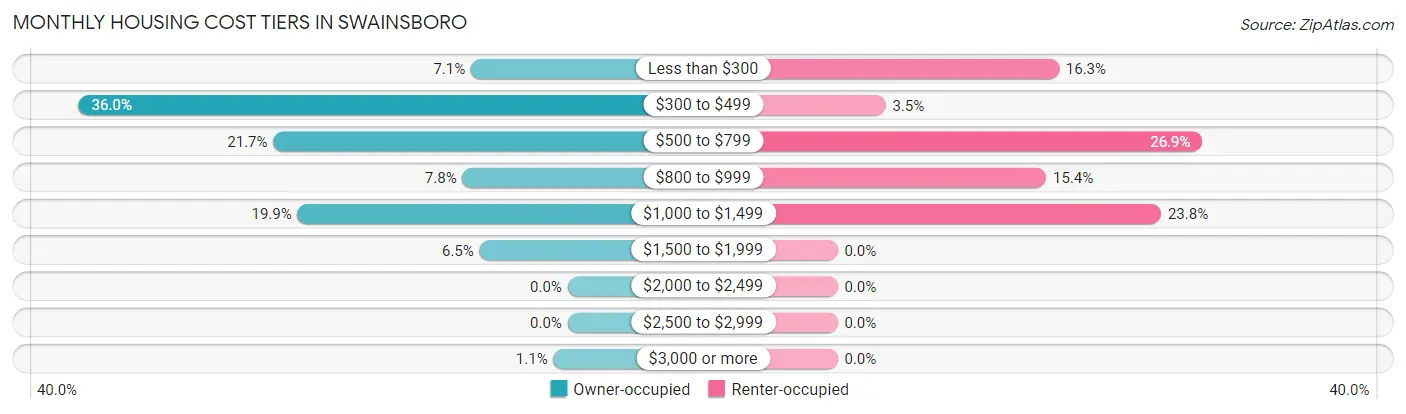
| Monthly Cost | Owner-occupied | Renter-occupied |
| Less than $300 | 68 (7.1%) | 295 (16.3%) |
| $300 to $499 | 344 (36.0%) | 64 (3.5%) |
| $500 to $799 | 207 (21.7%) | 486 (26.9%) |
| $800 to $999 | 74 (7.7%) | 278 (15.4%) |
| $1,000 to $1,499 | 190 (19.9%) | 431 (23.8%) |
| $1,500 to $1,999 | 62 (6.5%) | 0 (0.0%) |
| $2,000 to $2,499 | 0 (0.0%) | 0 (0.0%) |
| $2,500 to $2,999 | 0 (0.0%) | 0 (0.0%) |
| $3,000 or more | 10 (1.1%) | 0 (0.0%) |
| Total | 955 (100.0%) | 1,809 (100.0%) |
Physical Housing Characteristics in Swainsboro
Housing Structures in Swainsboro
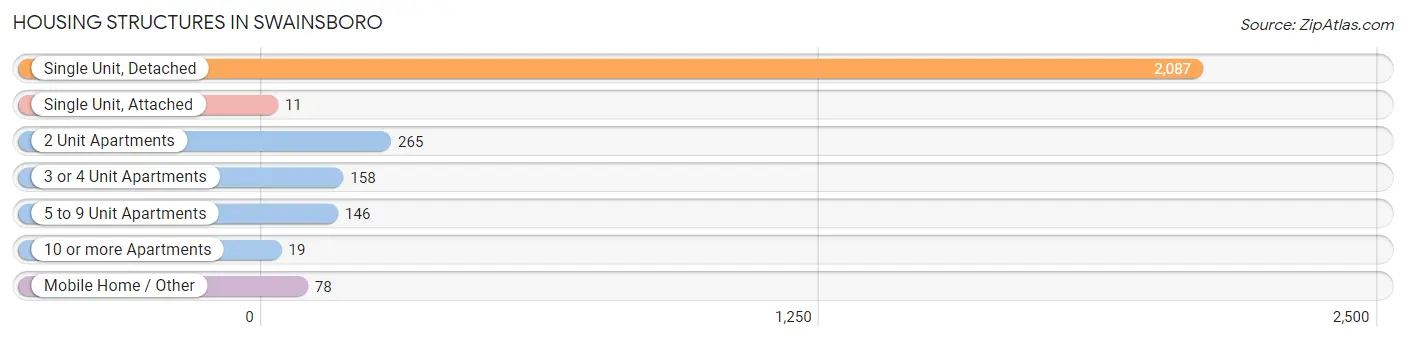
| Structure Type | # Housing Units | % Housing Units |
| Single Unit, Detached | 2,087 | 75.5% |
| Single Unit, Attached | 11 | 0.4% |
| 2 Unit Apartments | 265 | 9.6% |
| 3 or 4 Unit Apartments | 158 | 5.7% |
| 5 to 9 Unit Apartments | 146 | 5.3% |
| 10 or more Apartments | 19 | 0.7% |
| Mobile Home / Other | 78 | 2.8% |
| Total | 2,764 | 100.0% |
Housing Structures by Occupancy in Swainsboro
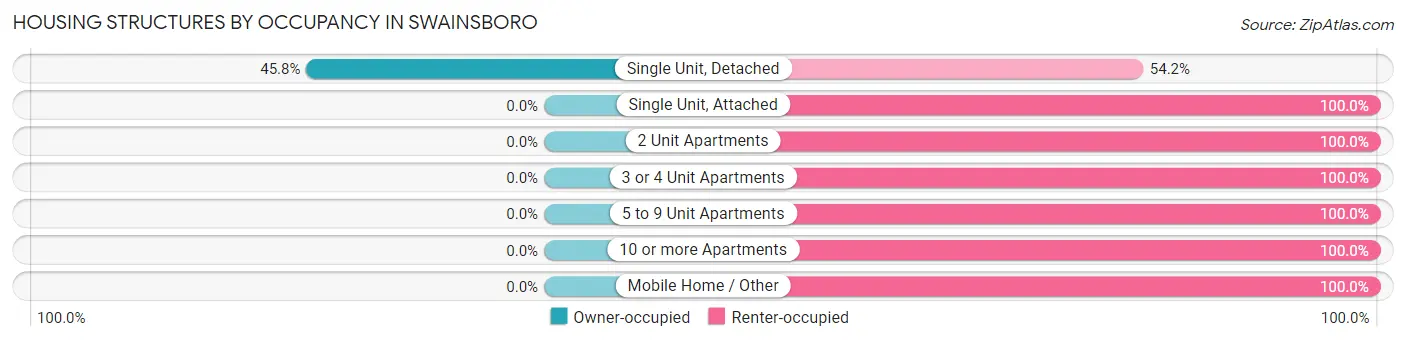
| Structure Type | Owner-occupied | Renter-occupied |
| Single Unit, Detached | 955 (45.8%) | 1,132 (54.2%) |
| Single Unit, Attached | 0 (0.0%) | 11 (100.0%) |
| 2 Unit Apartments | 0 (0.0%) | 265 (100.0%) |
| 3 or 4 Unit Apartments | 0 (0.0%) | 158 (100.0%) |
| 5 to 9 Unit Apartments | 0 (0.0%) | 146 (100.0%) |
| 10 or more Apartments | 0 (0.0%) | 19 (100.0%) |
| Mobile Home / Other | 0 (0.0%) | 78 (100.0%) |
| Total | 955 (34.5%) | 1,809 (65.4%) |
Housing Structures by Number of Rooms in Swainsboro
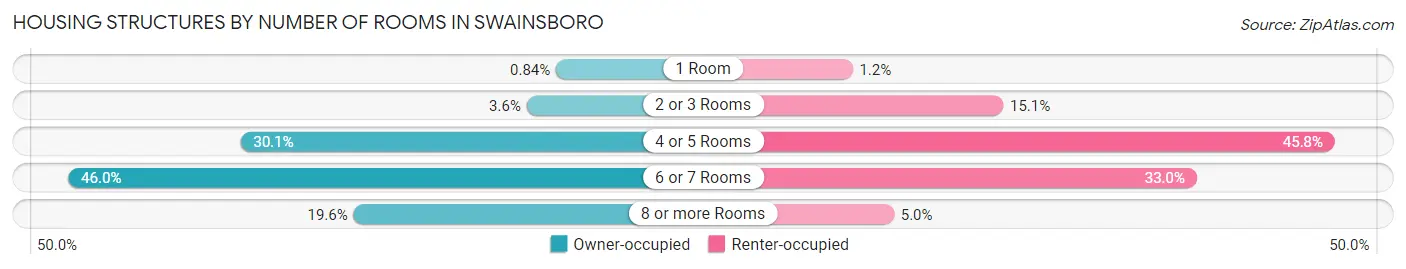
| Number of Rooms | Owner-occupied | Renter-occupied |
| 1 Room | 8 (0.8%) | 21 (1.2%) |
| 2 or 3 Rooms | 34 (3.6%) | 273 (15.1%) |
| 4 or 5 Rooms | 287 (30.0%) | 828 (45.8%) |
| 6 or 7 Rooms | 439 (46.0%) | 597 (33.0%) |
| 8 or more Rooms | 187 (19.6%) | 90 (5.0%) |
| Total | 955 (100.0%) | 1,809 (100.0%) |
Housing Structure by Heating Type in Swainsboro
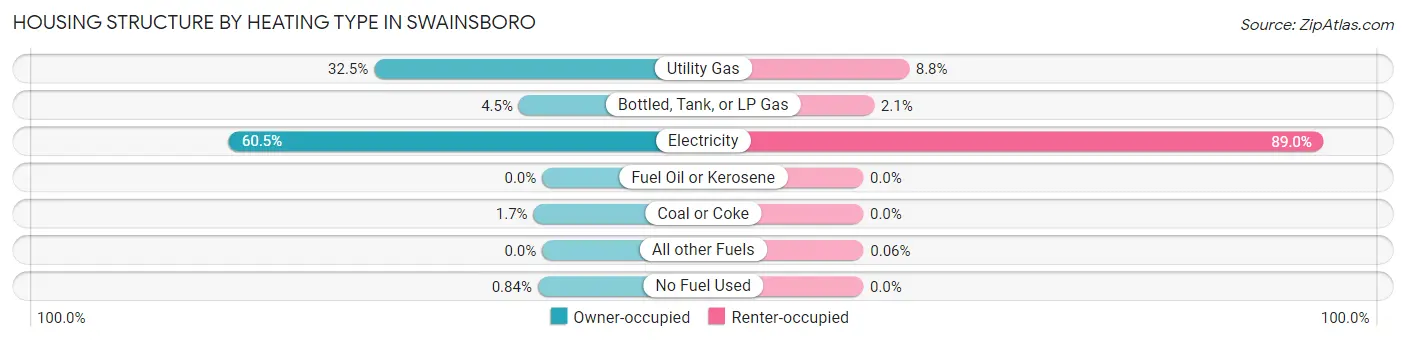
| Heating Type | Owner-occupied | Renter-occupied |
| Utility Gas | 310 (32.5%) | 160 (8.8%) |
| Bottled, Tank, or LP Gas | 43 (4.5%) | 38 (2.1%) |
| Electricity | 578 (60.5%) | 1,610 (89.0%) |
| Fuel Oil or Kerosene | 0 (0.0%) | 0 (0.0%) |
| Coal or Coke | 16 (1.7%) | 0 (0.0%) |
| All other Fuels | 0 (0.0%) | 1 (0.1%) |
| No Fuel Used | 8 (0.8%) | 0 (0.0%) |
| Total | 955 (100.0%) | 1,809 (100.0%) |
Household Vehicle Usage in Swainsboro
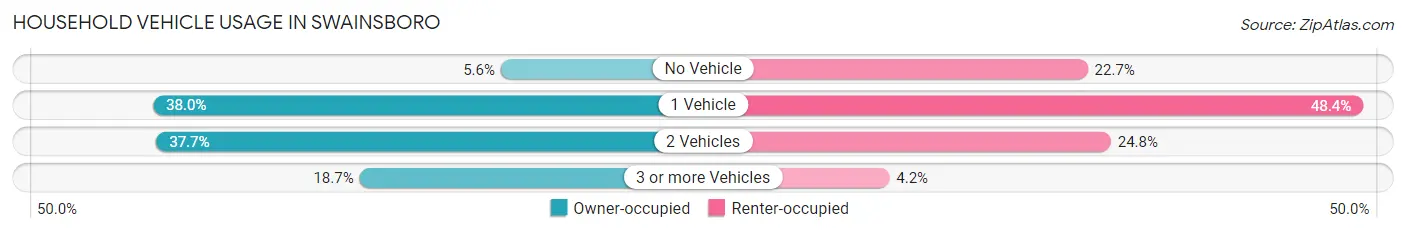
| Vehicles per Household | Owner-occupied | Renter-occupied |
| No Vehicle | 53 (5.6%) | 410 (22.7%) |
| 1 Vehicle | 363 (38.0%) | 875 (48.4%) |
| 2 Vehicles | 360 (37.7%) | 449 (24.8%) |
| 3 or more Vehicles | 179 (18.7%) | 75 (4.2%) |
| Total | 955 (100.0%) | 1,809 (100.0%) |
Real Estate & Mortgages in Swainsboro
Real Estate and Mortgage Overview in Swainsboro
| Characteristic | Without Mortgage | With Mortgage |
| Housing Units | 495 | 460 |
| Median Property Value | $116,200 | $95,200 |
| Median Household Income | $52,009 | $15 |
| Monthly Housing Costs | $400 | $10 |
| Real Estate Taxes | $1,011 | $30 |
Property Value by Mortgage Status in Swainsboro
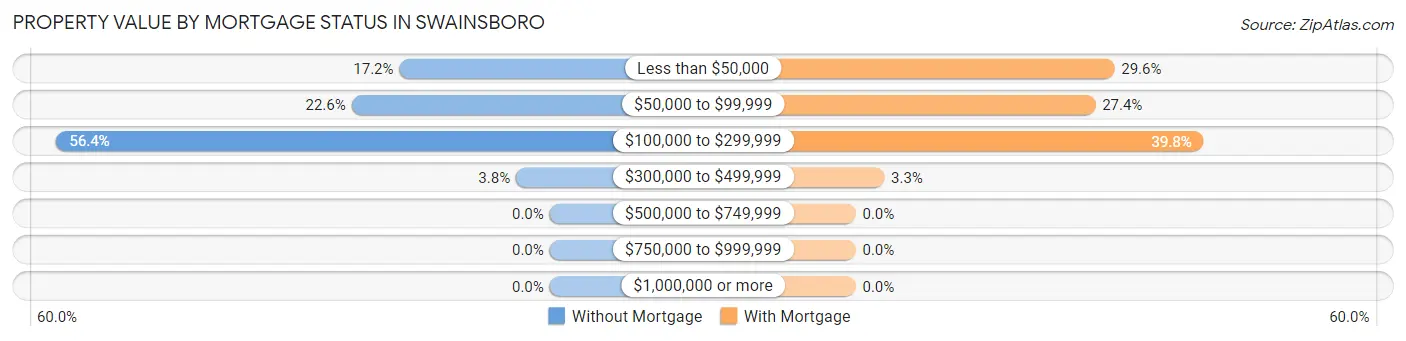
| Property Value | Without Mortgage | With Mortgage |
| Less than $50,000 | 85 (17.2%) | 136 (29.6%) |
| $50,000 to $99,999 | 112 (22.6%) | 126 (27.4%) |
| $100,000 to $299,999 | 279 (56.4%) | 183 (39.8%) |
| $300,000 to $499,999 | 19 (3.8%) | 15 (3.3%) |
| $500,000 to $749,999 | 0 (0.0%) | 0 (0.0%) |
| $750,000 to $999,999 | 0 (0.0%) | 0 (0.0%) |
| $1,000,000 or more | 0 (0.0%) | 0 (0.0%) |
| Total | 495 (100.0%) | 460 (100.0%) |
Household Income by Mortgage Status in Swainsboro
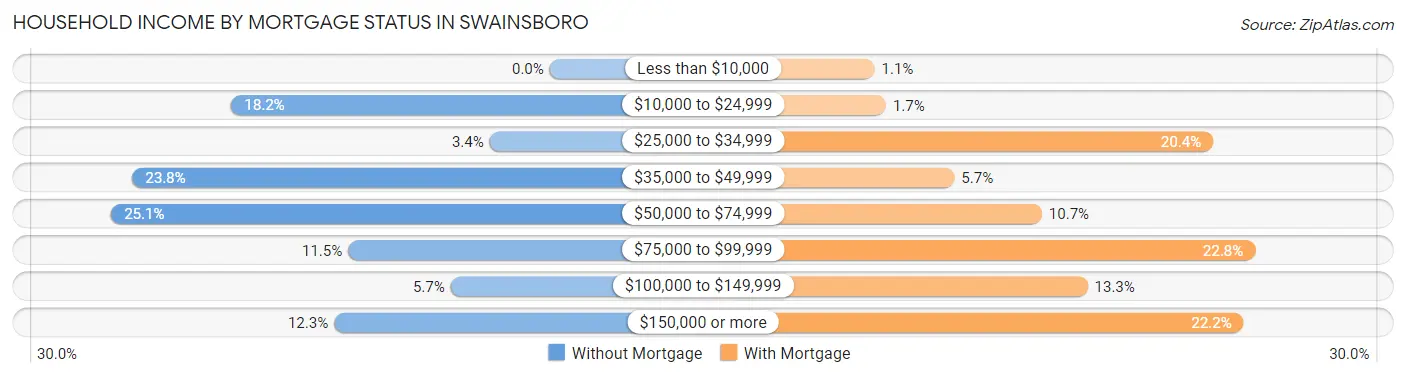
| Household Income | Without Mortgage | With Mortgage |
| Less than $10,000 | 0 (0.0%) | 5 (1.1%) |
| $10,000 to $24,999 | 90 (18.2%) | 8 (1.7%) |
| $25,000 to $34,999 | 17 (3.4%) | 94 (20.4%) |
| $35,000 to $49,999 | 118 (23.8%) | 26 (5.7%) |
| $50,000 to $74,999 | 124 (25.1%) | 49 (10.6%) |
| $75,000 to $99,999 | 57 (11.5%) | 105 (22.8%) |
| $100,000 to $149,999 | 28 (5.7%) | 61 (13.3%) |
| $150,000 or more | 61 (12.3%) | 102 (22.2%) |
| Total | 495 (100.0%) | 460 (100.0%) |
Property Value to Household Income Ratio in Swainsboro
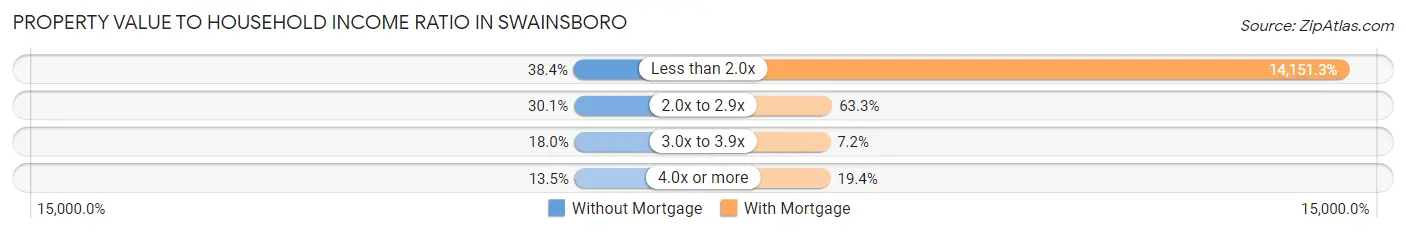
| Value-to-Income Ratio | Without Mortgage | With Mortgage |
| Less than 2.0x | 190 (38.4%) | 65,096 (14,151.3%) |
| 2.0x to 2.9x | 149 (30.1%) | 291 (63.3%) |
| 3.0x to 3.9x | 89 (18.0%) | 33 (7.2%) |
| 4.0x or more | 67 (13.5%) | 89 (19.4%) |
| Total | 495 (100.0%) | 460 (100.0%) |
Real Estate Taxes by Mortgage Status in Swainsboro
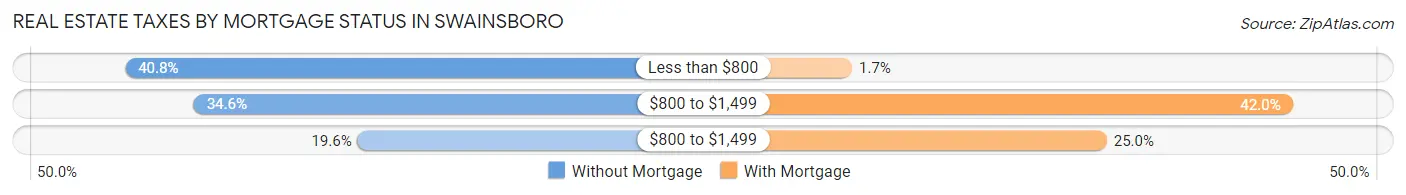
| Property Taxes | Without Mortgage | With Mortgage |
| Less than $800 | 202 (40.8%) | 8 (1.7%) |
| $800 to $1,499 | 171 (34.5%) | 193 (42.0%) |
| $800 to $1,499 | 97 (19.6%) | 115 (25.0%) |
| Total | 495 (100.0%) | 460 (100.0%) |
Health & Disability in Swainsboro
Health Insurance Coverage by Age in Swainsboro
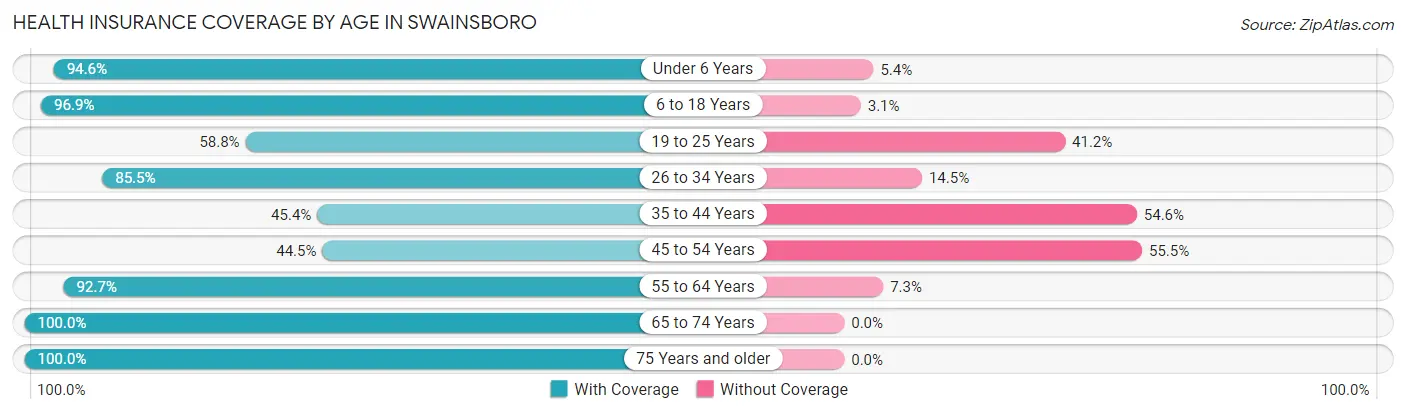
| Age Bracket | With Coverage | Without Coverage |
| Under 6 Years | 626 (94.6%) | 36 (5.4%) |
| 6 to 18 Years | 1,857 (96.9%) | 59 (3.1%) |
| 19 to 25 Years | 407 (58.8%) | 285 (41.2%) |
| 26 to 34 Years | 785 (85.5%) | 133 (14.5%) |
| 35 to 44 Years | 354 (45.4%) | 425 (54.6%) |
| 45 to 54 Years | 266 (44.5%) | 332 (55.5%) |
| 55 to 64 Years | 511 (92.7%) | 40 (7.3%) |
| 65 to 74 Years | 778 (100.0%) | 0 (0.0%) |
| 75 Years and older | 250 (100.0%) | 0 (0.0%) |
| Total | 5,834 (81.7%) | 1,310 (18.3%) |
Health Insurance Coverage by Citizenship Status in Swainsboro
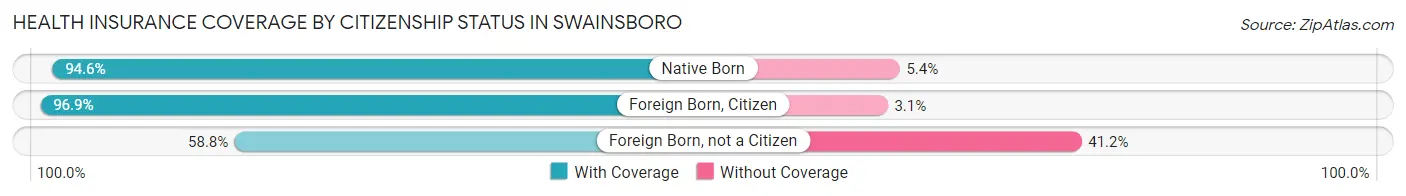
| Citizenship Status | With Coverage | Without Coverage |
| Native Born | 626 (94.6%) | 36 (5.4%) |
| Foreign Born, Citizen | 1,857 (96.9%) | 59 (3.1%) |
| Foreign Born, not a Citizen | 407 (58.8%) | 285 (41.2%) |
Health Insurance Coverage by Household Income in Swainsboro
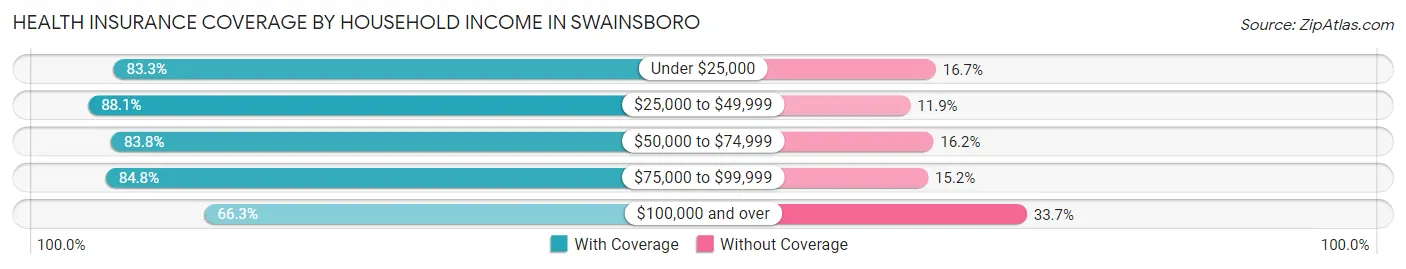
| Household Income | With Coverage | Without Coverage |
| Under $25,000 | 1,280 (83.3%) | 256 (16.7%) |
| $25,000 to $49,999 | 1,611 (88.1%) | 218 (11.9%) |
| $50,000 to $74,999 | 1,345 (83.8%) | 260 (16.2%) |
| $75,000 to $99,999 | 735 (84.8%) | 132 (15.2%) |
| $100,000 and over | 843 (66.3%) | 429 (33.7%) |
Public vs Private Health Insurance Coverage by Age in Swainsboro
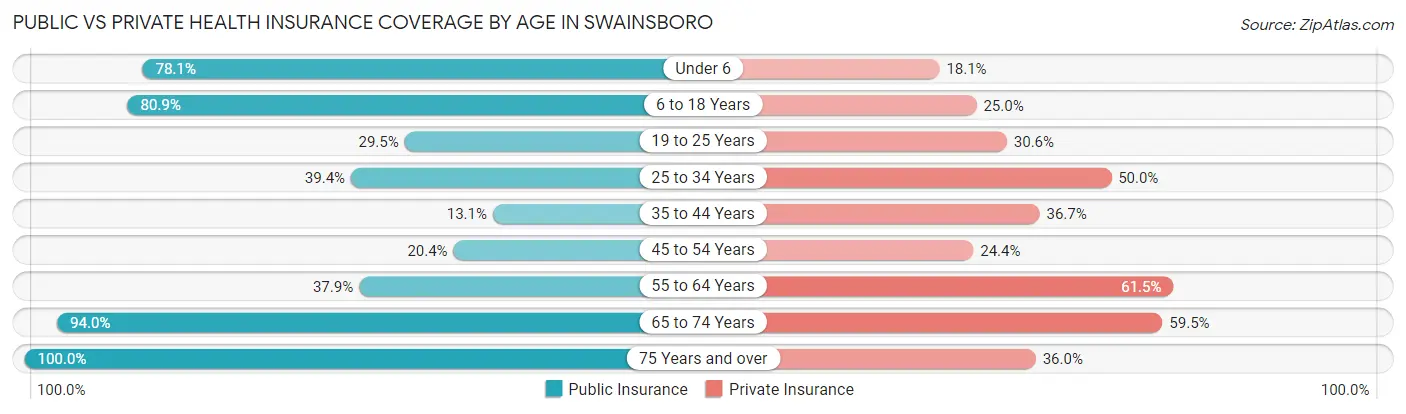
| Age Bracket | Public Insurance | Private Insurance |
| Under 6 | 517 (78.1%) | 120 (18.1%) |
| 6 to 18 Years | 1,550 (80.9%) | 479 (25.0%) |
| 19 to 25 Years | 204 (29.5%) | 212 (30.6%) |
| 25 to 34 Years | 362 (39.4%) | 459 (50.0%) |
| 35 to 44 Years | 102 (13.1%) | 286 (36.7%) |
| 45 to 54 Years | 122 (20.4%) | 146 (24.4%) |
| 55 to 64 Years | 209 (37.9%) | 339 (61.5%) |
| 65 to 74 Years | 731 (94.0%) | 463 (59.5%) |
| 75 Years and over | 250 (100.0%) | 90 (36.0%) |
| Total | 4,047 (56.7%) | 2,594 (36.3%) |
Disability Status by Sex by Age in Swainsboro
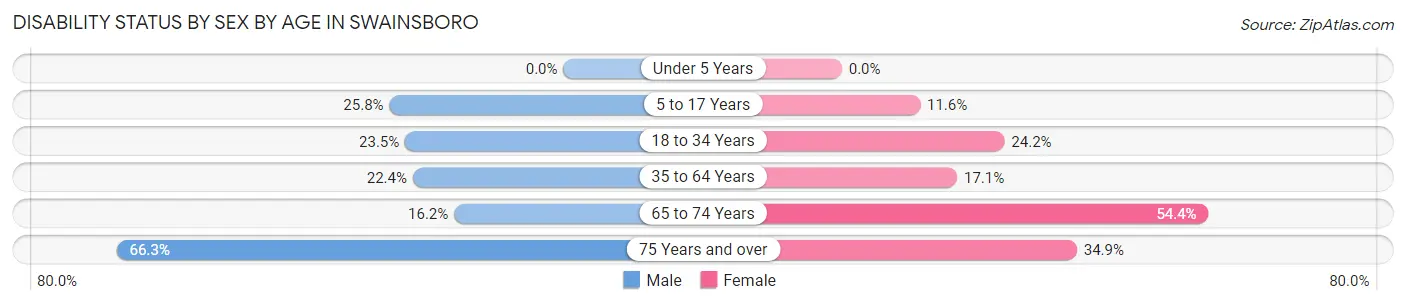
| Age Bracket | Male | Female |
| Under 5 Years | 0 (0.0%) | 0 (0.0%) |
| 5 to 17 Years | 258 (25.8%) | 97 (11.6%) |
| 18 to 34 Years | 204 (23.5%) | 212 (24.1%) |
| 35 to 64 Years | 158 (22.4%) | 209 (17.1%) |
| 65 to 74 Years | 55 (16.2%) | 239 (54.4%) |
| 75 Years and over | 67 (66.3%) | 52 (34.9%) |
Disability Class by Sex by Age in Swainsboro
Disability Class: Hearing Difficulty
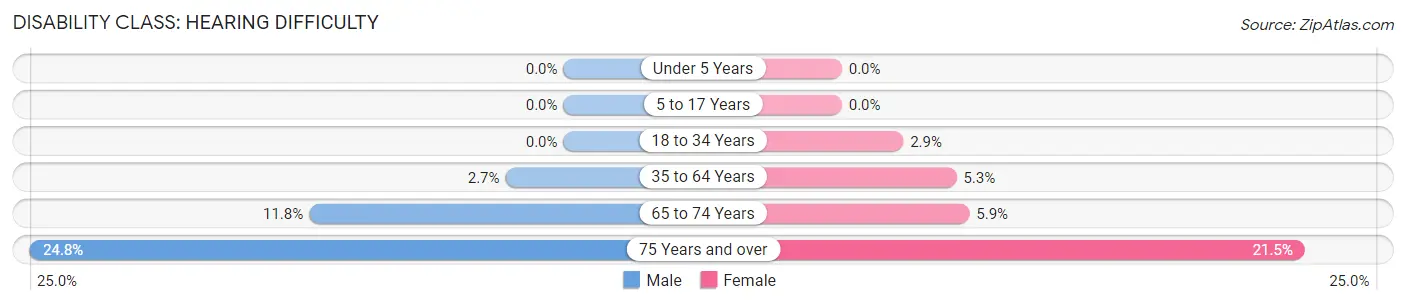
| Age Bracket | Male | Female |
| Under 5 Years | 0 (0.0%) | 0 (0.0%) |
| 5 to 17 Years | 0 (0.0%) | 0 (0.0%) |
| 18 to 34 Years | 0 (0.0%) | 25 (2.9%) |
| 35 to 64 Years | 19 (2.7%) | 65 (5.3%) |
| 65 to 74 Years | 40 (11.8%) | 26 (5.9%) |
| 75 Years and over | 25 (24.7%) | 32 (21.5%) |
Disability Class: Vision Difficulty
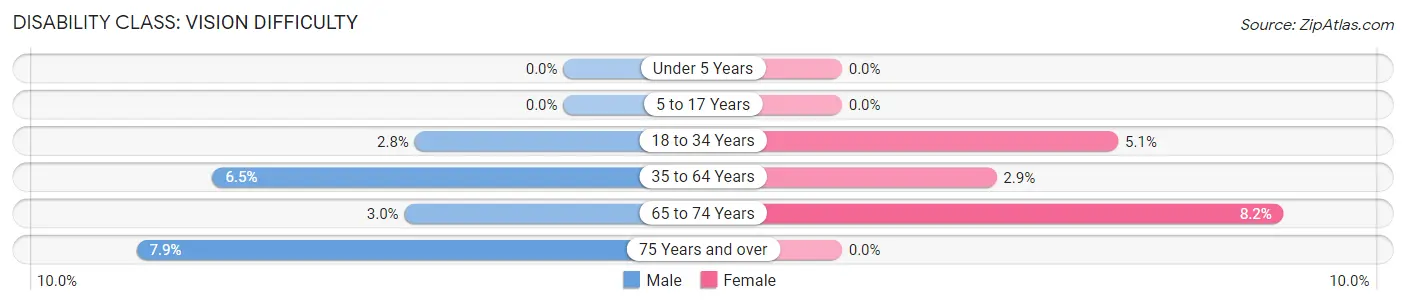
| Age Bracket | Male | Female |
| Under 5 Years | 0 (0.0%) | 0 (0.0%) |
| 5 to 17 Years | 0 (0.0%) | 0 (0.0%) |
| 18 to 34 Years | 24 (2.8%) | 45 (5.1%) |
| 35 to 64 Years | 46 (6.5%) | 35 (2.9%) |
| 65 to 74 Years | 10 (2.9%) | 36 (8.2%) |
| 75 Years and over | 8 (7.9%) | 0 (0.0%) |
Disability Class: Cognitive Difficulty
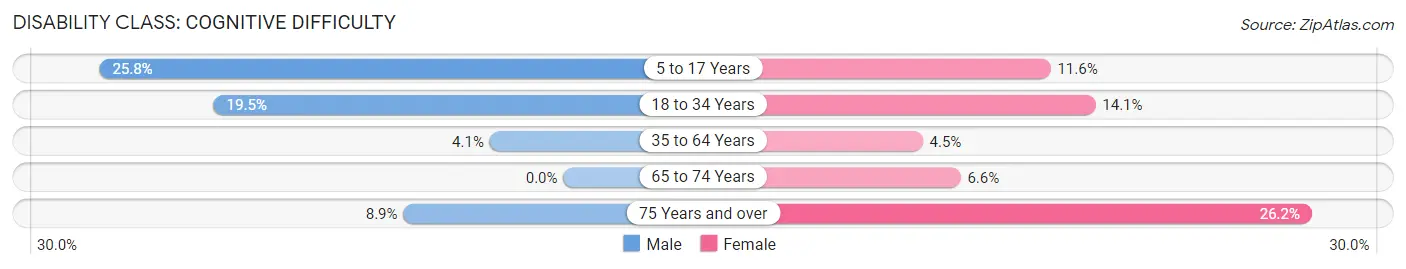
| Age Bracket | Male | Female |
| 5 to 17 Years | 258 (25.8%) | 97 (11.6%) |
| 18 to 34 Years | 169 (19.5%) | 124 (14.1%) |
| 35 to 64 Years | 29 (4.1%) | 55 (4.5%) |
| 65 to 74 Years | 0 (0.0%) | 29 (6.6%) |
| 75 Years and over | 9 (8.9%) | 39 (26.2%) |
Disability Class: Ambulatory Difficulty
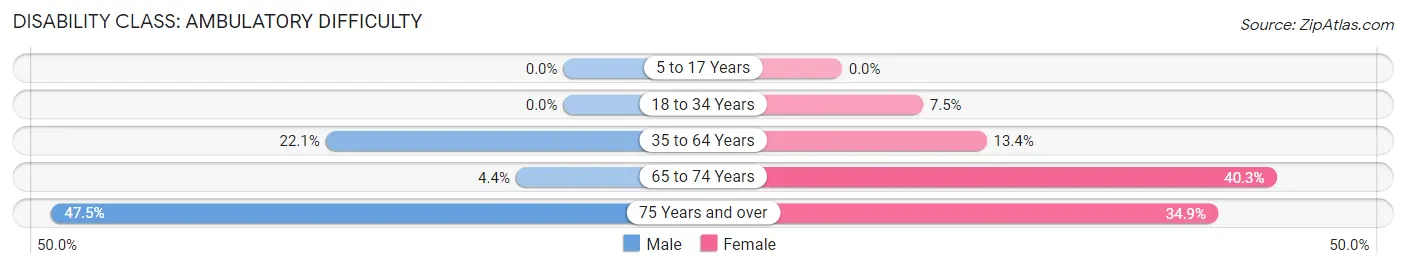
| Age Bracket | Male | Female |
| 5 to 17 Years | 0 (0.0%) | 0 (0.0%) |
| 18 to 34 Years | 0 (0.0%) | 66 (7.5%) |
| 35 to 64 Years | 156 (22.1%) | 164 (13.4%) |
| 65 to 74 Years | 15 (4.4%) | 177 (40.3%) |
| 75 Years and over | 48 (47.5%) | 52 (34.9%) |
Disability Class: Self-Care Difficulty
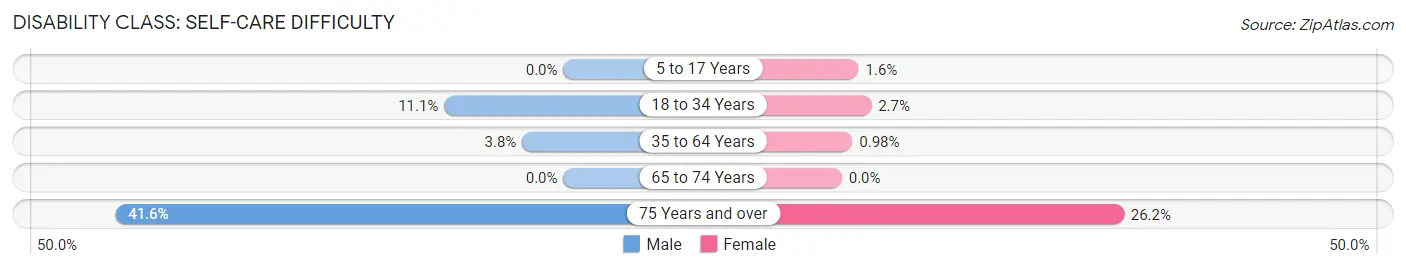
| Age Bracket | Male | Female |
| 5 to 17 Years | 0 (0.0%) | 13 (1.6%) |
| 18 to 34 Years | 96 (11.1%) | 24 (2.7%) |
| 35 to 64 Years | 27 (3.8%) | 12 (1.0%) |
| 65 to 74 Years | 0 (0.0%) | 0 (0.0%) |
| 75 Years and over | 42 (41.6%) | 39 (26.2%) |
Technology Access in Swainsboro
Computing Device Access in Swainsboro
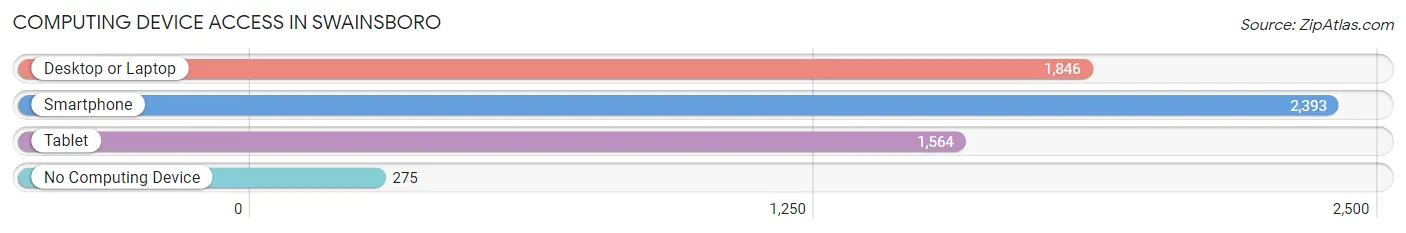
| Device Type | # Households | % Households |
| Desktop or Laptop | 1,846 | 66.8% |
| Smartphone | 2,393 | 86.6% |
| Tablet | 1,564 | 56.6% |
| No Computing Device | 275 | 10.0% |
| Total | 2,764 | 100.0% |
Internet Access in Swainsboro
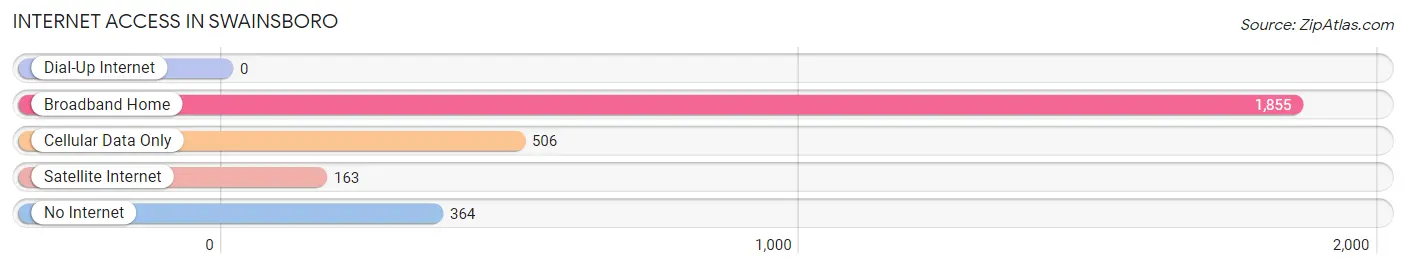
| Internet Type | # Households | % Households |
| Dial-Up Internet | 0 | 0.0% |
| Broadband Home | 1,855 | 67.1% |
| Cellular Data Only | 506 | 18.3% |
| Satellite Internet | 163 | 5.9% |
| No Internet | 364 | 13.2% |
| Total | 2,764 | 100.0% |
Swainsboro Summary
Swainsboro, Georgia is a small city located in Emanuel County in the east-central part of the state. It is the county seat and the largest city in the county. The city is located at the intersection of U.S. Highway 1 and State Route 56, about halfway between Savannah and Augusta. The population of Swainsboro was 5,912 at the 2010 census, up from 4,902 at the 2000 census.
History
Swainsboro was founded in 1832 by William Swain, a planter from South Carolina. He purchased land in the area and laid out the town, naming it after himself. The town was incorporated in 1837 and became the county seat of Emanuel County in 1858.
The town was a center of commerce and industry in the 19th century, with several cotton mills, a sawmill, and a gristmill. The town was also home to a number of churches, including the First Baptist Church, which was founded in 1837.
In the early 20th century, Swainsboro was a major stop on the Seaboard Air Line Railroad. The railroad brought new industry to the town, including a cotton mill, a lumber mill, and a brick factory.
Geography
Swainsboro is located in east-central Georgia at 32°37'N 82°14'W (32.619, -82.233). It is about halfway between Savannah and Augusta, about 70 miles (110 km) from each.
The city is located in the Piedmont region of Georgia, with rolling hills and pine forests. The city is located on the Ogeechee River, which flows south to the Atlantic Ocean.
The city has a total area of 8.2 square miles (21.2 km2), of which 8.1 square miles (21.0 km2) is land and 0.1 square miles (0.2 km2) is water.
Economy
Swainsboro is a small city with a diverse economy. The city is home to a number of manufacturing and industrial businesses, including a lumber mill, a brick factory, and a cotton mill. The city is also home to a number of retail businesses, including a grocery store, a hardware store, and a number of restaurants.
The city is also home to a number of healthcare facilities, including a hospital, a nursing home, and a number of medical offices.
Demographics
As of the 2010 census, there were 5,912 people, 2,310 households, and 1,541 families living in the city. The population density was 730.2 people per square mile (282.2/km2). There were 2,619 housing units at an average density of 323.2 per square mile (124.7/km2). The racial makeup of the city was 57.2% White, 37.3% African American, 0.3% Native American, 0.7% Asian, 0.1% Pacific Islander, 2.7% from other races, and 1.9% from two or more races. Hispanic or Latino of any race were 5.2% of the population.
There were 2,310 households, out of which 28.3% had children under the age of 18 living with them, 41.2% were married couples living together, 19.2% had a female householder with no husband present, and 35.2% were non-families. 30.2% of all households were made up of individuals, and 13.2% had someone living alone who was 65 years of age or older. The average household size was 2.48 and the average family size was 3.09.
In the city, the population was spread out, with 25.2% under the age of 18, 8.7% from 18 to 24, 25.7% from 25 to 44, 22.7% from 45 to 64, and 17.7% who were 65 years of age or older. The median age was 38 years. For every 100 females, there were 86.2 males. For every 100 females age 18 and over, there were 81.2 males.
The median income for a household in the city was $25,938, and the median income for a family was $31,964. Males had a median income of $27,917 versus $20,938 for females. The per capita income for the city was $14,945. About 19.2% of families and 22.7% of the population were below the poverty line, including 33.2% of those under age 18 and 16.2% of those age 65 or over.
Common Questions
What is Per Capita Income in Swainsboro?
Per Capita income in Swainsboro is $24,617.
What is the Median Family Income in Swainsboro?
Median Family Income in Swainsboro is $45,905.
What is the Median Household income in Swainsboro?
Median Household Income in Swainsboro is $44,491.
What is Income or Wage Gap in Swainsboro?
Income or Wage Gap in Swainsboro is 12.6%.
Women in Swainsboro earn 87.4 cents for every dollar earned by a man.
What is Inequality or Gini Index in Swainsboro?
Inequality or Gini Index in Swainsboro is 0.54.
What is the Total Population of Swainsboro?
Total Population of Swainsboro is 7,542.
What is the Total Male Population of Swainsboro?
Total Male Population of Swainsboro is 3,531.
What is the Total Female Population of Swainsboro?
Total Female Population of Swainsboro is 4,011.
What is the Ratio of Males per 100 Females in Swainsboro?
There are 88.03 Males per 100 Females in Swainsboro.
What is the Ratio of Females per 100 Males in Swainsboro?
There are 113.59 Females per 100 Males in Swainsboro.
What is the Median Population Age in Swainsboro?
Median Population Age in Swainsboro is 30.1 Years.
What is the Average Family Size in Swainsboro
Average Family Size in Swainsboro is 3.1 People.
What is the Average Household Size in Swainsboro
Average Household Size in Swainsboro is 2.6 People.
How Large is the Labor Force in Swainsboro?
There are 2,768 People in the Labor Forcein in Swainsboro.
What is the Percentage of People in the Labor Force in Swainsboro?
51.9% of People are in the Labor Force in Swainsboro.
What is the Unemployment Rate in Swainsboro?
Unemployment Rate in Swainsboro is 13.2%.