Zip Codes with the Highest Percentage of Population Employed in Food Preparation & Serving in Warner Robins, GA
RELATED REPORTS & OPTIONS
Food Preparation & Serving
Warner Robins
Compare Zip Codes
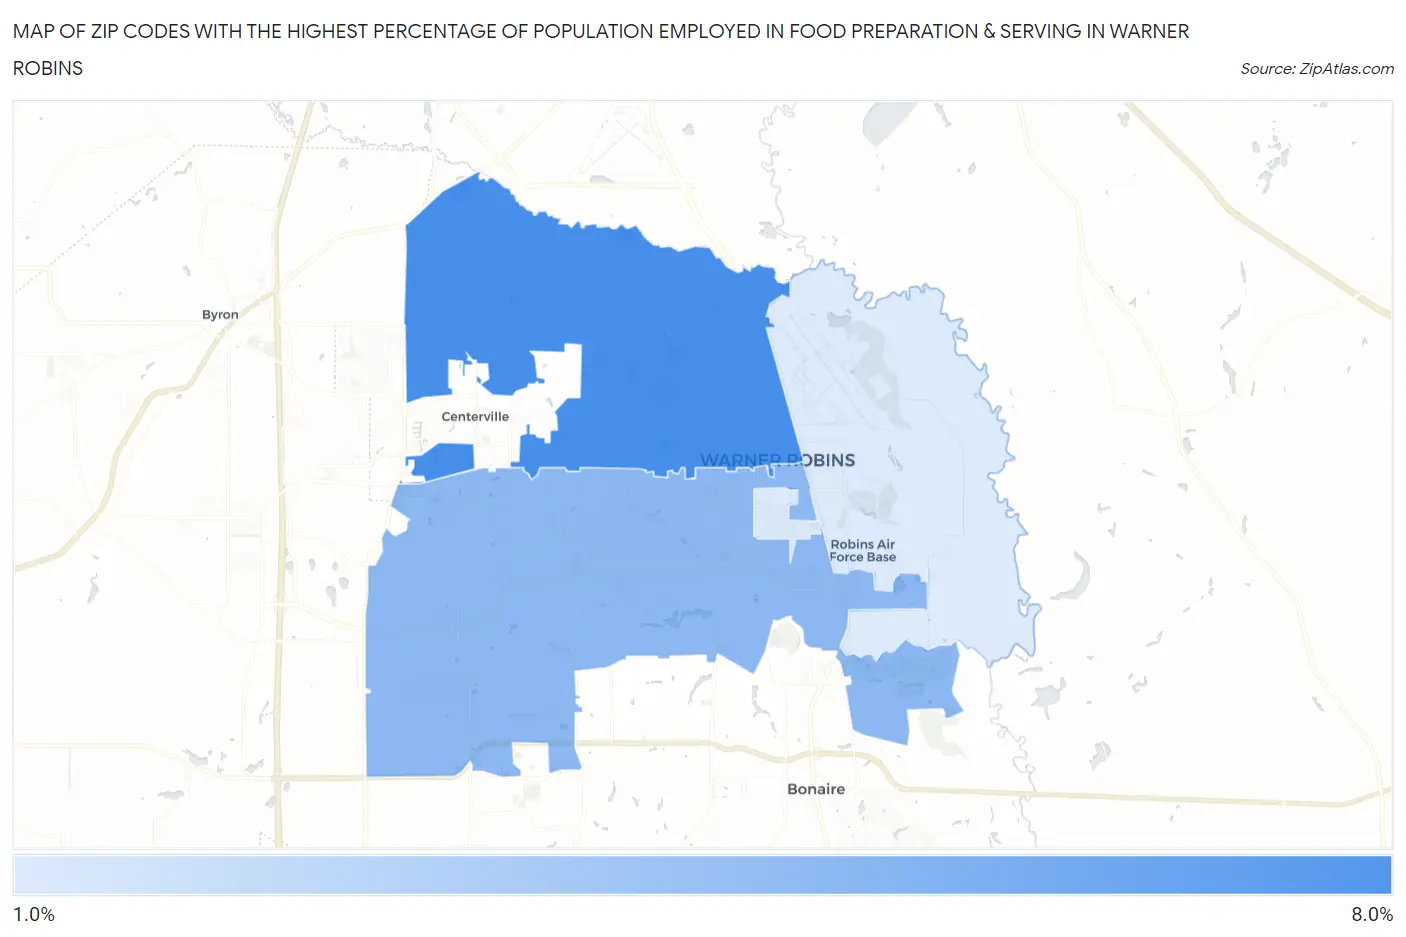
Map of Zip Codes with the Highest Percentage of Population Employed in Food Preparation & Serving in Warner Robins
1.9%
7.8%
Zip Codes with the Highest Percentage of Population Employed in Food Preparation & Serving in Warner Robins, GA
| Zip Code | % Employed | vs State | vs National | |
| 1. | 31093 | 7.8% | 5.1%(+2.66)#97 | 5.3%(+2.52)#5,048 |
| 2. | 31088 | 5.1% | 5.1%(-0.071)#289 | 5.3%(-0.212)#12,638 |
| 3. | 31098 | 1.9% | 5.1%(-3.26)#577 | 5.3%(-3.40)#25,041 |
1
Common Questions
What are the Top Zip Codes with the Highest Percentage of Population Employed in Food Preparation & Serving in Warner Robins, GA?
Top Zip Codes with the Highest Percentage of Population Employed in Food Preparation & Serving in Warner Robins, GA are:
What zip code has the Highest Percentage of Population Employed in Food Preparation & Serving in Warner Robins, GA?
31093 has the Highest Percentage of Population Employed in Food Preparation & Serving in Warner Robins, GA with 7.8%.
What is the Percentage of Population Employed in Food Preparation & Serving in Warner Robins, GA?
Percentage of Population Employed in Food Preparation & Serving in Warner Robins is 6.7%.
What is the Percentage of Population Employed in Food Preparation & Serving in Georgia?
Percentage of Population Employed in Food Preparation & Serving in Georgia is 5.1%.
What is the Percentage of Population Employed in Food Preparation & Serving in the United States?
Percentage of Population Employed in Food Preparation & Serving in the United States is 5.3%.