Zip Codes with the Highest Percentage of Population Employed in Food Preparation & Serving in Tifton, GA
RELATED REPORTS & OPTIONS
Food Preparation & Serving
Tifton
Compare Zip Codes
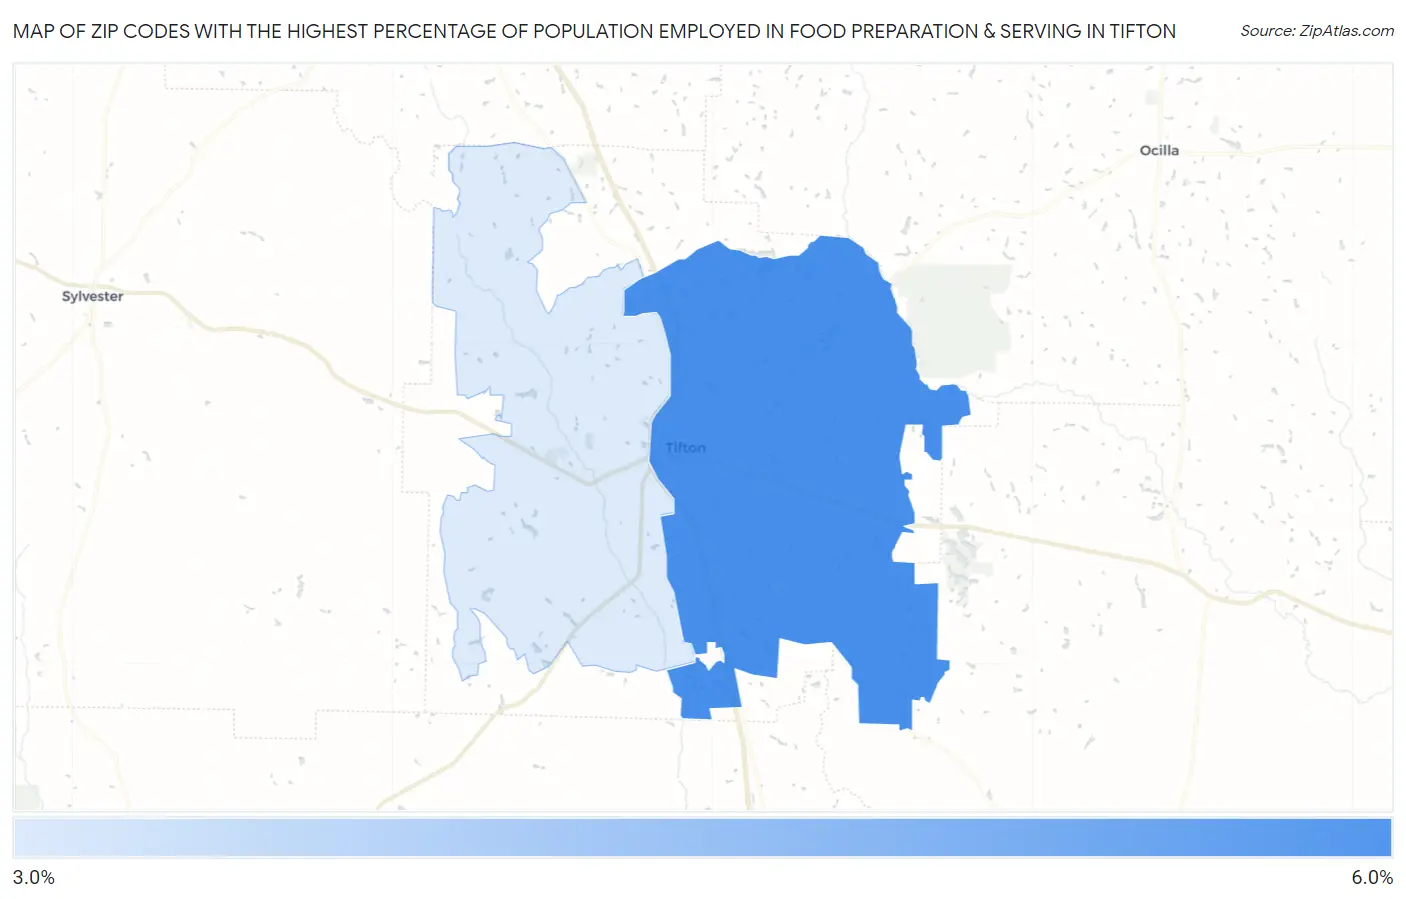
Map of Zip Codes with the Highest Percentage of Population Employed in Food Preparation & Serving in Tifton
3.9%
5.8%
Zip Codes with the Highest Percentage of Population Employed in Food Preparation & Serving in Tifton, GA
| Zip Code | % Employed | vs State | vs National | |
| 1. | 31794 | 5.8% | 5.1%(+0.635)#230 | 5.3%(+0.494)#10,093 |
| 2. | 31793 | 3.9% | 5.1%(-1.25)#409 | 5.3%(-1.40)#17,580 |
1
Common Questions
What are the Top Zip Codes with the Highest Percentage of Population Employed in Food Preparation & Serving in Tifton, GA?
Top Zip Codes with the Highest Percentage of Population Employed in Food Preparation & Serving in Tifton, GA are:
What zip code has the Highest Percentage of Population Employed in Food Preparation & Serving in Tifton, GA?
31794 has the Highest Percentage of Population Employed in Food Preparation & Serving in Tifton, GA with 5.8%.
What is the Percentage of Population Employed in Food Preparation & Serving in Tifton, GA?
Percentage of Population Employed in Food Preparation & Serving in Tifton is 7.0%.
What is the Percentage of Population Employed in Food Preparation & Serving in Georgia?
Percentage of Population Employed in Food Preparation & Serving in Georgia is 5.1%.
What is the Percentage of Population Employed in Food Preparation & Serving in the United States?
Percentage of Population Employed in Food Preparation & Serving in the United States is 5.3%.