Zip Codes with the Highest Percentage of Population Employed in Food Preparation & Serving in Gainesville, GA
RELATED REPORTS & OPTIONS
Food Preparation & Serving
Gainesville
Compare Zip Codes
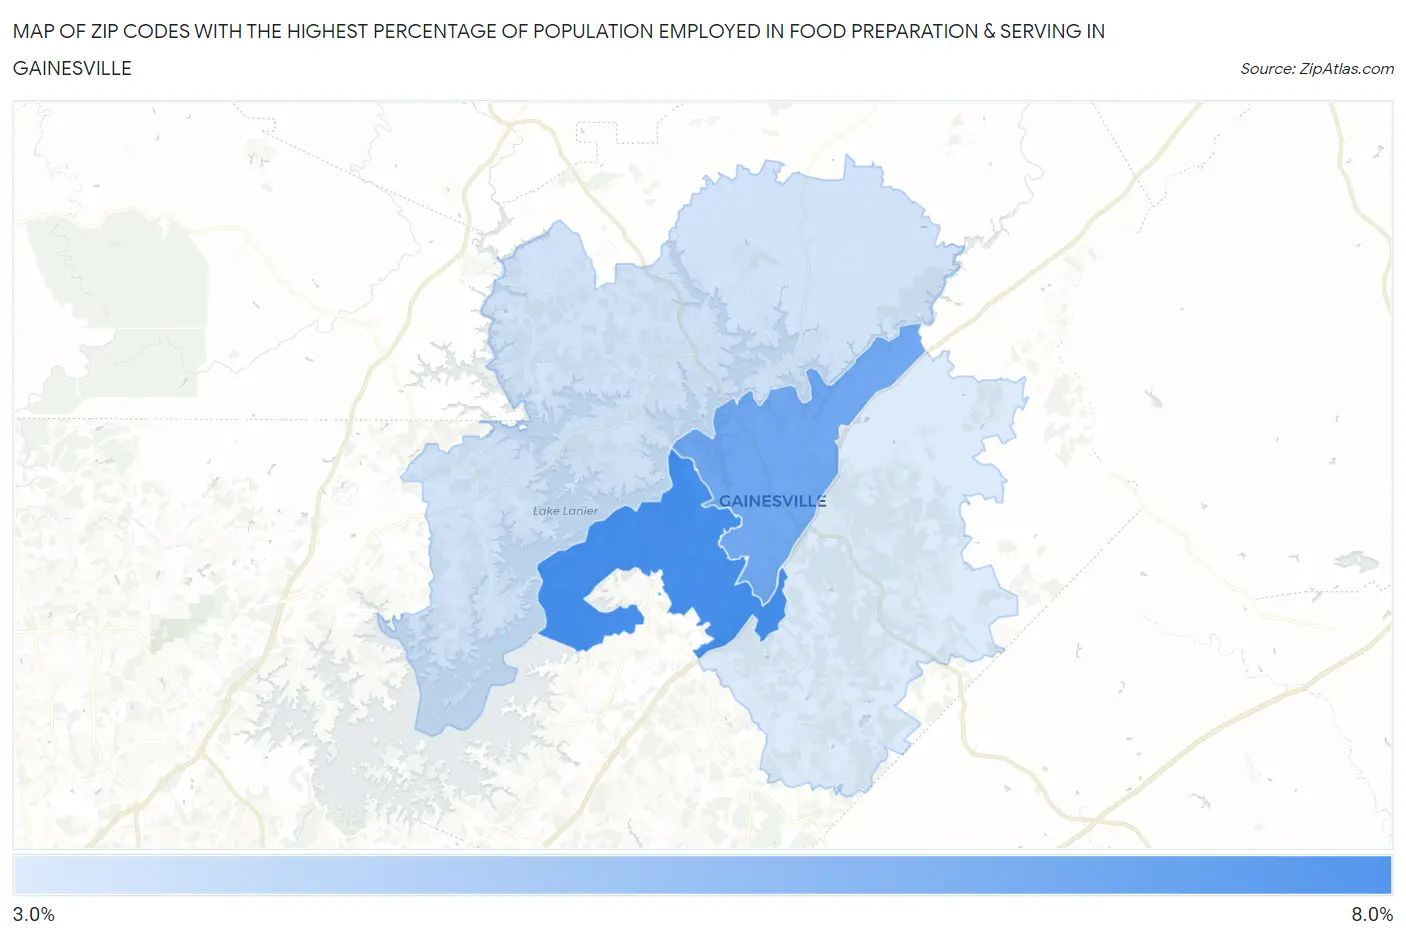
Map of Zip Codes with the Highest Percentage of Population Employed in Food Preparation & Serving in Gainesville
3.7%
6.5%
Zip Codes with the Highest Percentage of Population Employed in Food Preparation & Serving in Gainesville, GA
| Zip Code | % Employed | vs State | vs National | |
| 1. | 30504 | 6.5% | 5.1%(+1.32)#159 | 5.3%(+1.18)#7,966 |
| 2. | 30501 | 5.7% | 5.1%(+0.535)#239 | 5.3%(+0.393)#10,425 |
| 3. | 30506 | 4.0% | 5.1%(-1.18)#401 | 5.3%(-1.32)#17,272 |
| 4. | 30507 | 3.7% | 5.1%(-1.41)#431 | 5.3%(-1.55)#18,185 |
1
Common Questions
What are the Top 3 Zip Codes with the Highest Percentage of Population Employed in Food Preparation & Serving in Gainesville, GA?
Top 3 Zip Codes with the Highest Percentage of Population Employed in Food Preparation & Serving in Gainesville, GA are:
What zip code has the Highest Percentage of Population Employed in Food Preparation & Serving in Gainesville, GA?
30504 has the Highest Percentage of Population Employed in Food Preparation & Serving in Gainesville, GA with 6.5%.
What is the Percentage of Population Employed in Food Preparation & Serving in Gainesville, GA?
Percentage of Population Employed in Food Preparation & Serving in Gainesville is 6.6%.
What is the Percentage of Population Employed in Food Preparation & Serving in Georgia?
Percentage of Population Employed in Food Preparation & Serving in Georgia is 5.1%.
What is the Percentage of Population Employed in Food Preparation & Serving in the United States?
Percentage of Population Employed in Food Preparation & Serving in the United States is 5.3%.