Brunswick, GA Map & Demographics
Brunswick Map
Brunswick Overview
$25,365
PER CAPITA INCOME
$45,316
AVG FAMILY INCOME
$29,781
AVG HOUSEHOLD INCOME
17.4%
WAGE / INCOME GAP [ % ]
82.6¢/ $1
WAGE / INCOME GAP [ $ ]
0.57
INEQUALITY / GINI INDEX
15,243
TOTAL POPULATION
6,799
MALE POPULATION
8,444
FEMALE POPULATION
80.52
MALES / 100 FEMALES
124.19
FEMALES / 100 MALES
37.2
MEDIAN AGE
3.1
AVG FAMILY SIZE
2.3
AVG HOUSEHOLD SIZE
6,587
LABOR FORCE [ PEOPLE ]
54.2%
PERCENT IN LABOR FORCE
9.1%
UNEMPLOYMENT RATE
Brunswick Area Codes
Income in Brunswick
Income Overview in Brunswick
Per Capita Income in Brunswick is $25,365, while median incomes of families and households are $45,316 and $29,781 respectively.
| Characteristic | Number | Measure |
| Per Capita Income | 15,243 | $25,365 |
| Median Family Income | 3,520 | $45,316 |
| Mean Family Income | 3,520 | $71,265 |
| Median Household Income | 6,317 | $29,781 |
| Mean Household Income | 6,317 | $57,081 |
| Income Deficit | 3,520 | $0 |
| Wage / Income Gap (%) | 15,243 | 17.37% |
| Wage / Income Gap ($) | 15,243 | 82.63¢ per $1 |
| Gini / Inequality Index | 15,243 | 0.57 |
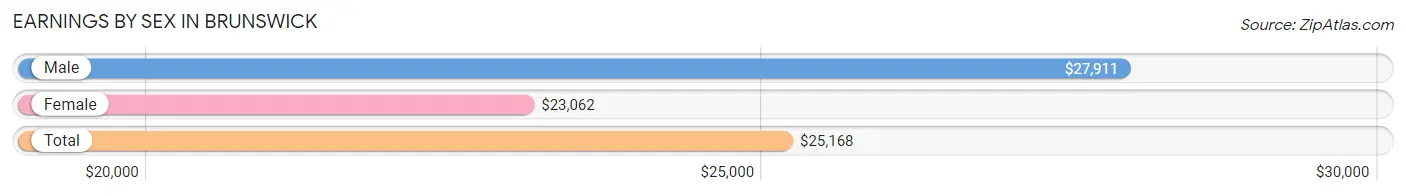
Earnings by Sex in Brunswick
Average Earnings in Brunswick are $25,168, $27,911 for men and $23,062 for women, a difference of 17.4%.
| Sex | Number | Average Earnings |
| Male | 3,081 (45.9%) | $27,911 |
| Female | 3,639 (54.1%) | $23,062 |
| Total | 6,720 (100.0%) | $25,168 |
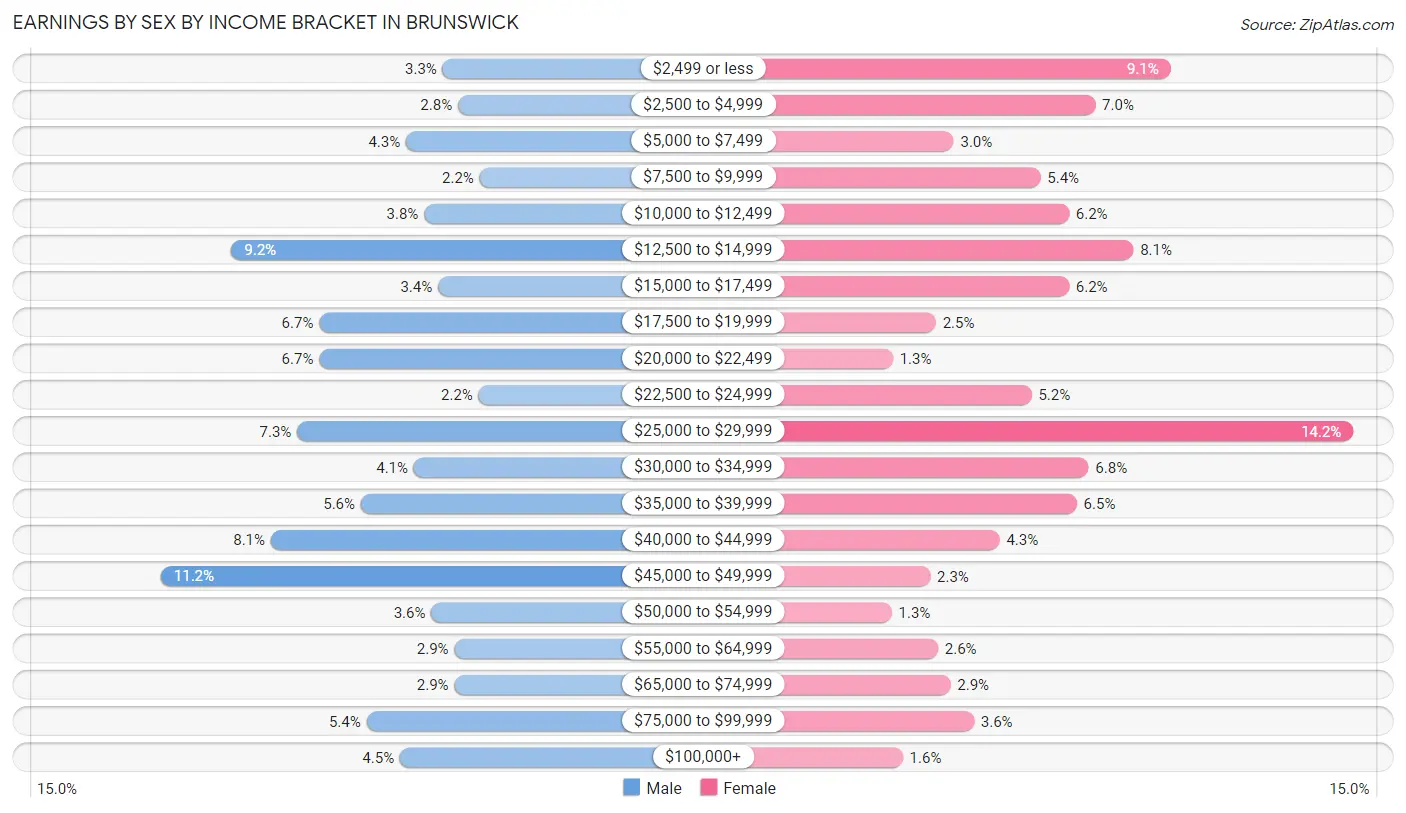
Earnings by Sex by Income Bracket in Brunswick
The most common earnings brackets in Brunswick are $45,000 to $49,999 for men (344 | 11.2%) and $25,000 to $29,999 for women (518 | 14.2%).
| Income | Male | Female |
| $2,499 or less | 100 (3.3%) | 331 (9.1%) |
| $2,500 to $4,999 | 87 (2.8%) | 254 (7.0%) |
| $5,000 to $7,499 | 132 (4.3%) | 109 (3.0%) |
| $7,500 to $9,999 | 68 (2.2%) | 198 (5.4%) |
| $10,000 to $12,499 | 116 (3.8%) | 227 (6.2%) |
| $12,500 to $14,999 | 283 (9.2%) | 293 (8.1%) |
| $15,000 to $17,499 | 104 (3.4%) | 227 (6.2%) |
| $17,500 to $19,999 | 207 (6.7%) | 91 (2.5%) |
| $20,000 to $22,499 | 207 (6.7%) | 47 (1.3%) |
| $22,500 to $24,999 | 69 (2.2%) | 189 (5.2%) |
| $25,000 to $29,999 | 226 (7.3%) | 518 (14.2%) |
| $30,000 to $34,999 | 125 (4.1%) | 247 (6.8%) |
| $35,000 to $39,999 | 171 (5.6%) | 235 (6.5%) |
| $40,000 to $44,999 | 249 (8.1%) | 156 (4.3%) |
| $45,000 to $49,999 | 344 (11.2%) | 85 (2.3%) |
| $50,000 to $54,999 | 110 (3.6%) | 46 (1.3%) |
| $55,000 to $64,999 | 90 (2.9%) | 93 (2.6%) |
| $65,000 to $74,999 | 90 (2.9%) | 106 (2.9%) |
| $75,000 to $99,999 | 166 (5.4%) | 130 (3.6%) |
| $100,000+ | 137 (4.4%) | 57 (1.6%) |
| Total | 3,081 (100.0%) | 3,639 (100.0%) |
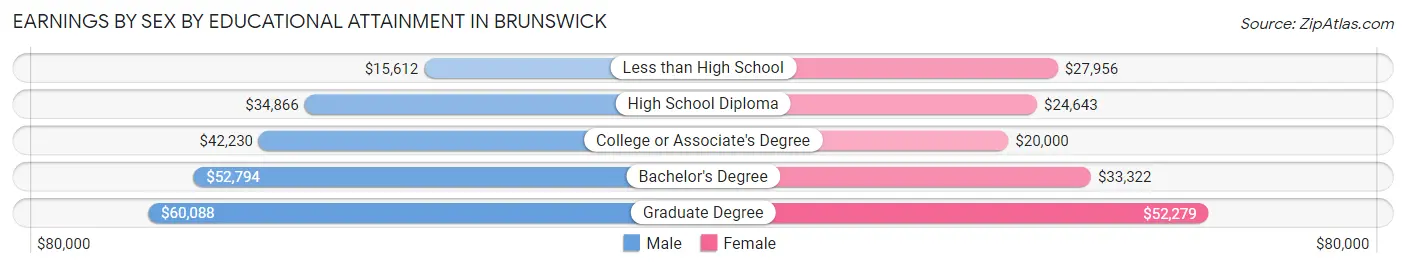
Earnings by Sex by Educational Attainment in Brunswick
Average earnings in Brunswick are $35,337 for men and $26,194 for women, a difference of 25.9%. Men with an educational attainment of graduate degree enjoy the highest average annual earnings of $60,088, while those with less than high school education earn the least with $15,612. Women with an educational attainment of graduate degree earn the most with the average annual earnings of $52,279, while those with college or associate's degree education have the smallest earnings of $20,000.
| Educational Attainment | Male Income | Female Income |
| Less than High School | $15,612 | $27,956 |
| High School Diploma | $34,866 | $24,643 |
| College or Associate's Degree | $42,230 | $20,000 |
| Bachelor's Degree | $52,794 | $33,322 |
| Graduate Degree | $60,088 | $52,279 |
| Total | $35,337 | $26,194 |
Family Income in Brunswick
Family Income Brackets in Brunswick
According to the Brunswick family income data, there are 595 families falling into the $25,000 to $34,999 income range, which is the most common income bracket and makes up 16.9% of all families. Conversely, the $150,000 to $199,999 income bracket is the least frequent group with only 81 families (2.3%) belonging to this category.
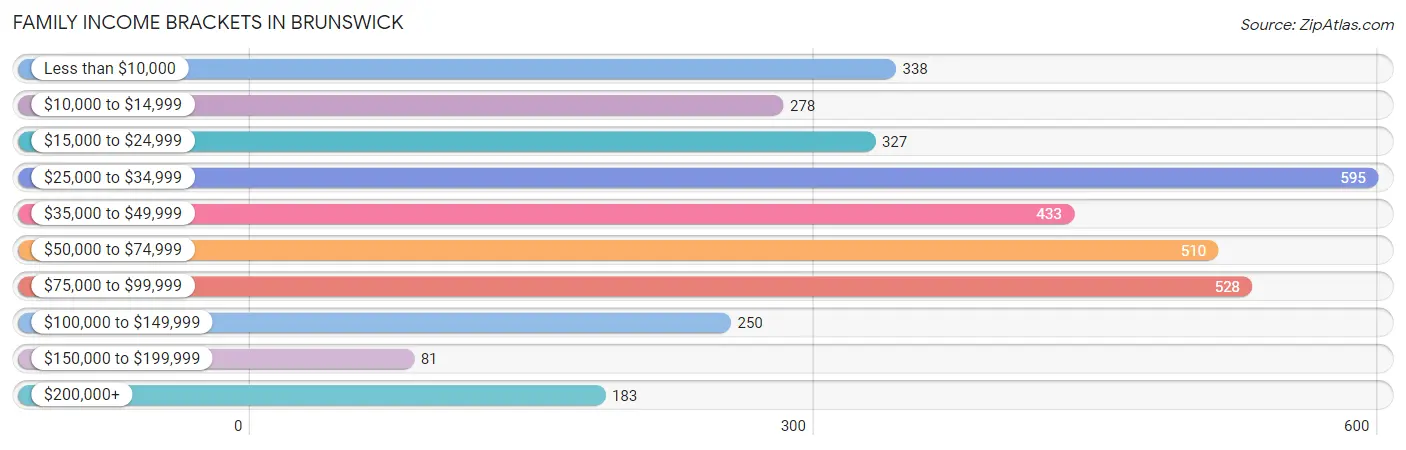
| Income Bracket | # Families | % Families |
| Less than $10,000 | 338 | 9.6% |
| $10,000 to $14,999 | 278 | 7.9% |
| $15,000 to $24,999 | 327 | 9.3% |
| $25,000 to $34,999 | 595 | 16.9% |
| $35,000 to $49,999 | 433 | 12.3% |
| $50,000 to $74,999 | 510 | 14.5% |
| $75,000 to $99,999 | 528 | 15.0% |
| $100,000 to $149,999 | 250 | 7.1% |
| $150,000 to $199,999 | 81 | 2.3% |
| $200,000+ | 183 | 5.2% |
Family Income by Famaliy Size in Brunswick
2-person families (1,856 | 52.7%) account for the highest median family income in Brunswick with $49,292 per family, while 2-person families (1,856 | 52.7%) have the highest median income of $24,646 per family member.
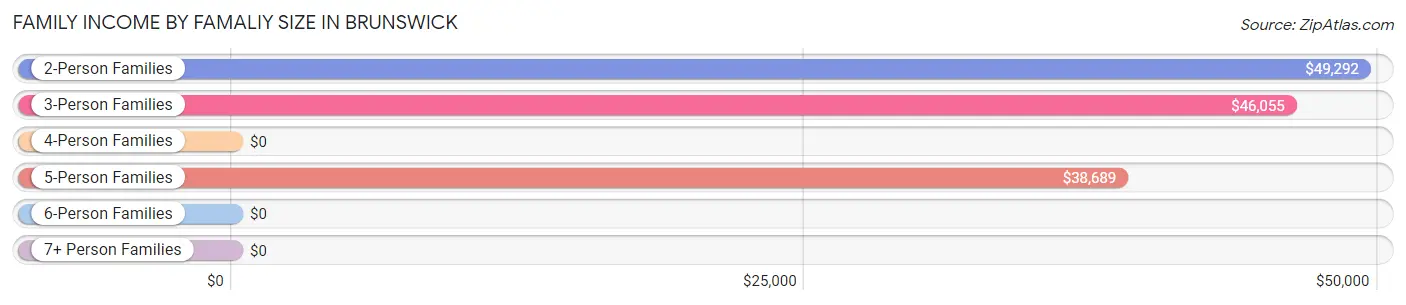
| Income Bracket | # Families | Median Income |
| 2-Person Families | 1,856 (52.7%) | $49,292 |
| 3-Person Families | 940 (26.7%) | $46,055 |
| 4-Person Families | 467 (13.3%) | $0 |
| 5-Person Families | 129 (3.7%) | $38,689 |
| 6-Person Families | 107 (3.0%) | $0 |
| 7+ Person Families | 21 (0.6%) | $0 |
| Total | 3,520 (100.0%) | $45,316 |
Family Income by Number of Earners in Brunswick
The median family income in Brunswick is $45,316, with families comprising 2 earners (1,225) having the highest median family income of $75,768, while families with 1 earner (1,453) have the lowest median family income of $30,855, accounting for 34.8% and 41.3% of families, respectively.
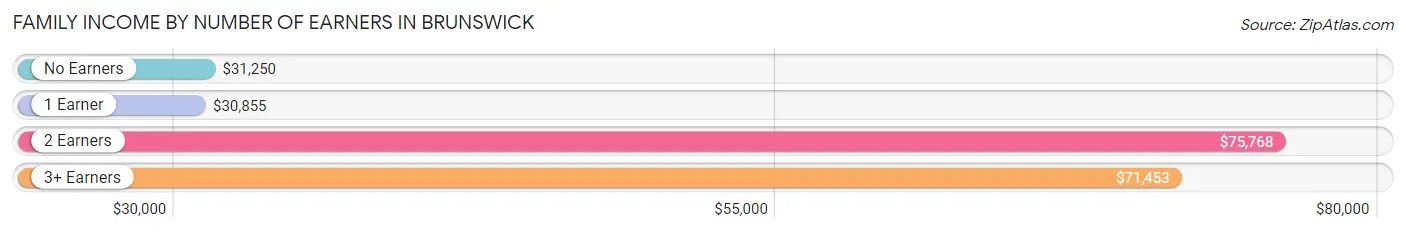
| Number of Earners | # Families | Median Income |
| No Earners | 678 (19.3%) | $31,250 |
| 1 Earner | 1,453 (41.3%) | $30,855 |
| 2 Earners | 1,225 (34.8%) | $75,768 |
| 3+ Earners | 164 (4.7%) | $71,453 |
| Total | 3,520 (100.0%) | $45,316 |
Household Income in Brunswick
Household Income Brackets in Brunswick
With 1,251 households falling in the category, the $15,000 to $24,999 income range is the most frequent in Brunswick, accounting for 19.8% of all households. In contrast, only 82 households (1.3%) fall into the $150,000 to $199,999 income bracket, making it the least populous group.
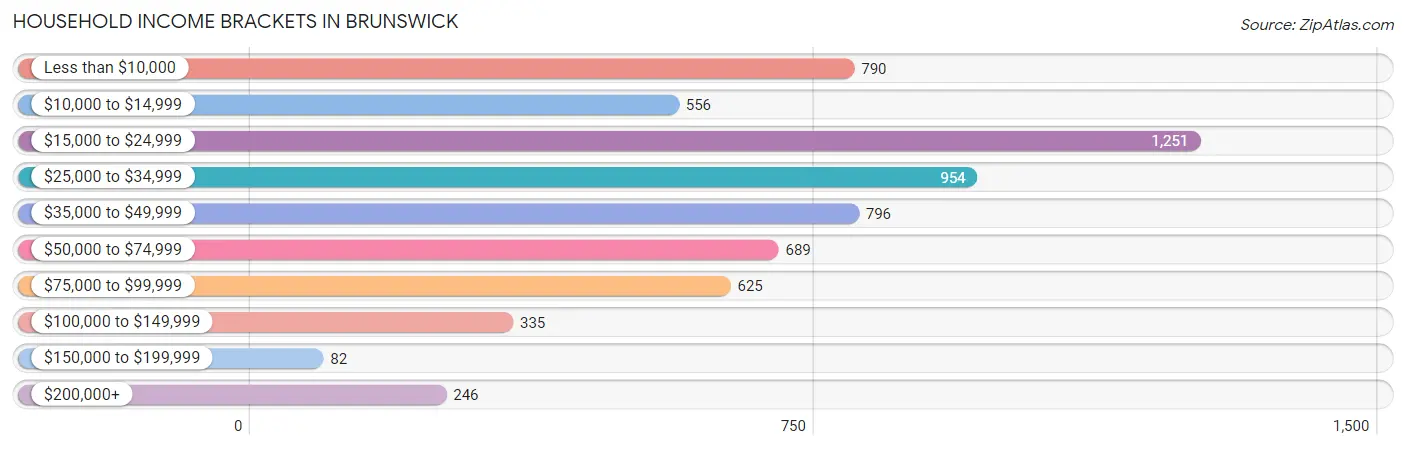
| Income Bracket | # Households | % Households |
| Less than $10,000 | 790 | 12.5% |
| $10,000 to $14,999 | 556 | 8.8% |
| $15,000 to $24,999 | 1,251 | 19.8% |
| $25,000 to $34,999 | 954 | 15.1% |
| $35,000 to $49,999 | 796 | 12.6% |
| $50,000 to $74,999 | 689 | 10.9% |
| $75,000 to $99,999 | 625 | 9.9% |
| $100,000 to $149,999 | 335 | 5.3% |
| $150,000 to $199,999 | 82 | 1.3% |
| $200,000+ | 246 | 3.9% |
Household Income by Householder Age in Brunswick
The median household income in Brunswick is $29,781, with the highest median household income of $31,060 found in the 25 to 44 years age bracket for the primary householder. A total of 1,869 households (29.6%) fall into this category. Meanwhile, the 15 to 24 years age bracket for the primary householder has the lowest median household income of $27,564, with 210 households (3.3%) in this group.
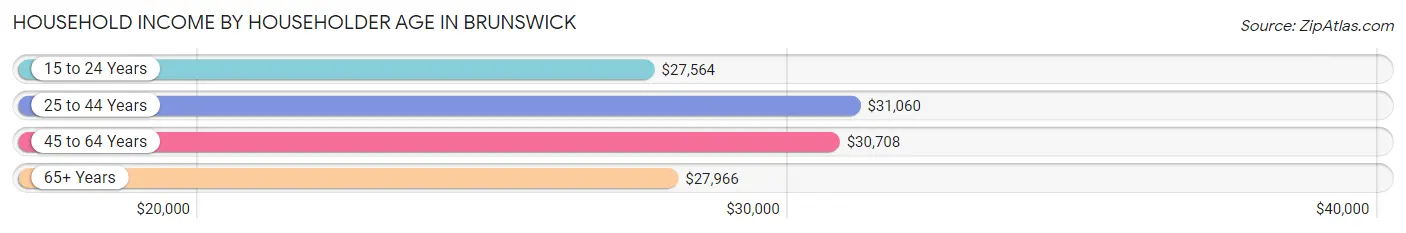
| Income Bracket | # Households | Median Income |
| 15 to 24 Years | 210 (3.3%) | $27,564 |
| 25 to 44 Years | 1,869 (29.6%) | $31,060 |
| 45 to 64 Years | 2,347 (37.1%) | $30,708 |
| 65+ Years | 1,891 (29.9%) | $27,966 |
| Total | 6,317 (100.0%) | $29,781 |
Poverty in Brunswick
Income Below Poverty by Sex and Age in Brunswick
With 24.6% poverty level for males and 35.8% for females among the residents of Brunswick, 5 year old males and 15 year old females are the most vulnerable to poverty, with 30 males (100.0%) and 62 females (81.6%) in their respective age groups living below the poverty level.
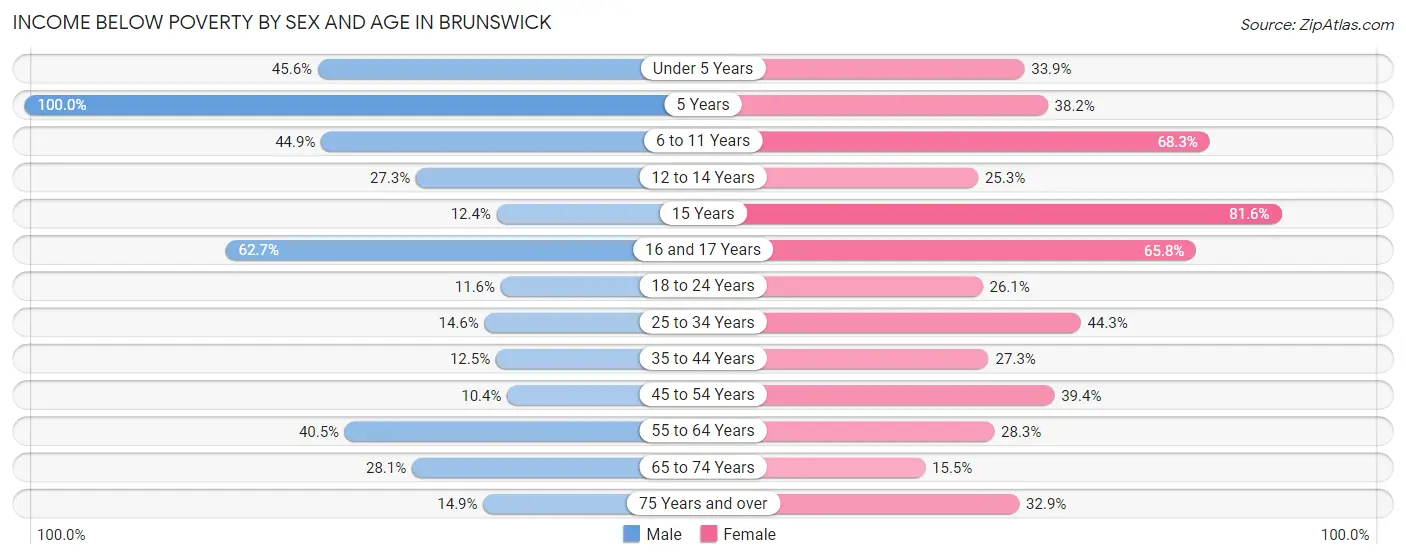
| Age Bracket | Male | Female |
| Under 5 Years | 226 (45.6%) | 189 (33.9%) |
| 5 Years | 30 (100.0%) | 34 (38.2%) |
| 6 to 11 Years | 191 (44.9%) | 409 (68.3%) |
| 12 to 14 Years | 70 (27.3%) | 90 (25.3%) |
| 15 Years | 23 (12.4%) | 62 (81.6%) |
| 16 and 17 Years | 79 (62.7%) | 171 (65.8%) |
| 18 to 24 Years | 109 (11.6%) | 104 (26.1%) |
| 25 to 34 Years | 128 (14.6%) | 563 (44.3%) |
| 35 to 44 Years | 104 (12.5%) | 304 (27.3%) |
| 45 to 54 Years | 43 (10.4%) | 360 (39.4%) |
| 55 to 64 Years | 388 (40.5%) | 311 (28.3%) |
| 65 to 74 Years | 146 (28.1%) | 126 (15.5%) |
| 75 Years and over | 72 (14.8%) | 210 (32.9%) |
| Total | 1,609 (24.6%) | 2,933 (35.8%) |
Income Above Poverty by Sex and Age in Brunswick
According to the poverty statistics in Brunswick, males aged 45 to 54 years and females aged 65 to 74 years are the age groups that are most secure financially, with 89.6% of males and 84.5% of females in these age groups living above the poverty line.
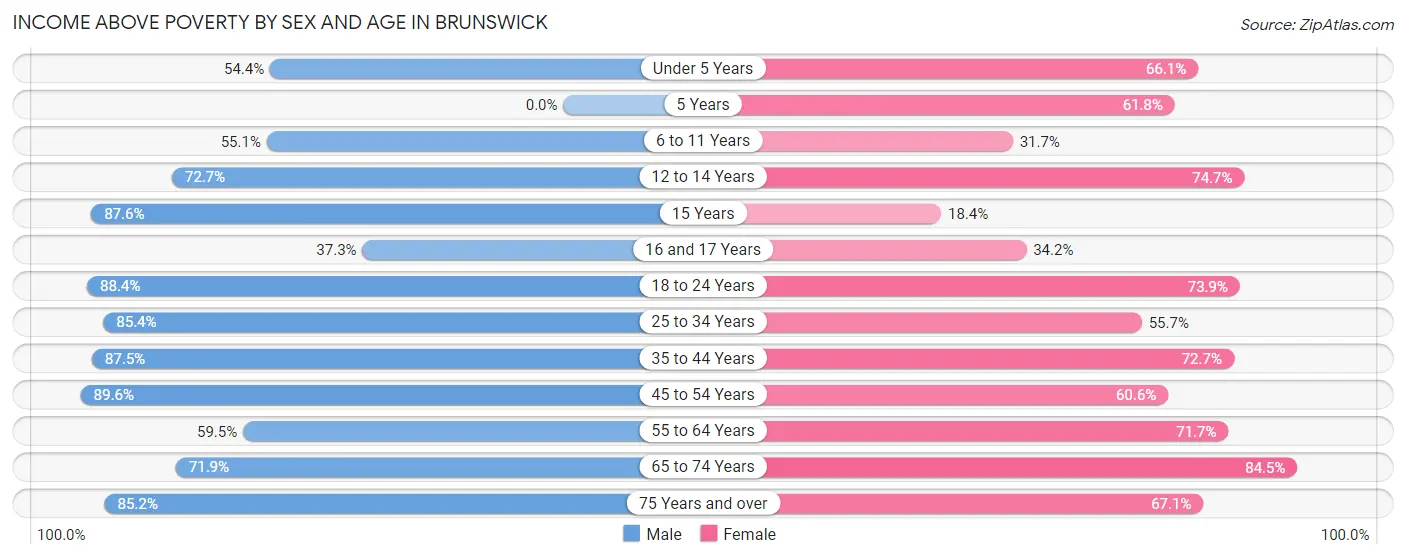
| Age Bracket | Male | Female |
| Under 5 Years | 270 (54.4%) | 369 (66.1%) |
| 5 Years | 0 (0.0%) | 55 (61.8%) |
| 6 to 11 Years | 234 (55.1%) | 190 (31.7%) |
| 12 to 14 Years | 186 (72.7%) | 266 (74.7%) |
| 15 Years | 163 (87.6%) | 14 (18.4%) |
| 16 and 17 Years | 47 (37.3%) | 89 (34.2%) |
| 18 to 24 Years | 831 (88.4%) | 294 (73.9%) |
| 25 to 34 Years | 747 (85.4%) | 707 (55.7%) |
| 35 to 44 Years | 728 (87.5%) | 811 (72.7%) |
| 45 to 54 Years | 370 (89.6%) | 553 (60.6%) |
| 55 to 64 Years | 569 (59.5%) | 789 (71.7%) |
| 65 to 74 Years | 374 (71.9%) | 689 (84.5%) |
| 75 Years and over | 413 (85.2%) | 428 (67.1%) |
| Total | 4,932 (75.4%) | 5,254 (64.2%) |
Income Below Poverty Among Married-Couple Families in Brunswick
The poverty statistics for married-couple families in Brunswick show that 12.4% or 173 of the total 1,395 families live below the poverty line. Families with 3 or 4 children have the highest poverty rate of 29.1%, comprising of 16 families. On the other hand, families with 1 or 2 children have the lowest poverty rate of 11.7%, which includes 40 families.
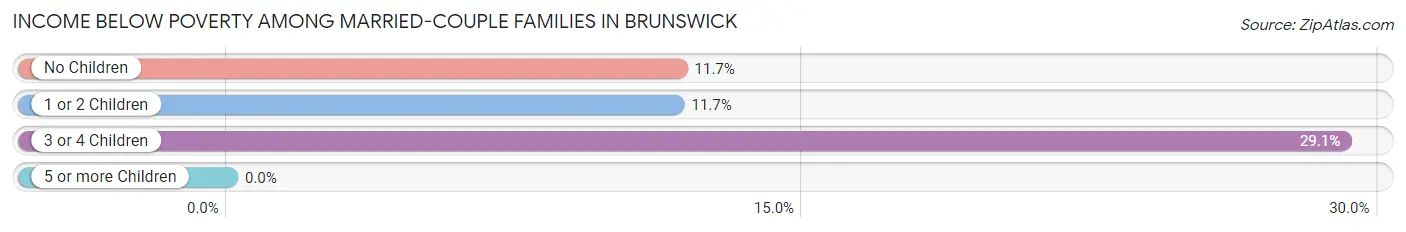
| Children | Above Poverty | Below Poverty |
| No Children | 880 (88.3%) | 117 (11.7%) |
| 1 or 2 Children | 303 (88.3%) | 40 (11.7%) |
| 3 or 4 Children | 39 (70.9%) | 16 (29.1%) |
| 5 or more Children | 0 (0.0%) | 0 (0.0%) |
| Total | 1,222 (87.6%) | 173 (12.4%) |
Income Below Poverty Among Single-Parent Households in Brunswick
According to the poverty data in Brunswick, 2.9% or 13 single-father households and 47.0% or 787 single-mother households are living below the poverty line. Among single-father households, those with 1 or 2 children have the highest poverty rate, with 13 households (10.8%) experiencing poverty. Likewise, among single-mother households, those with 5 or more children have the highest poverty rate, with 56 households (100.0%) falling below the poverty line.
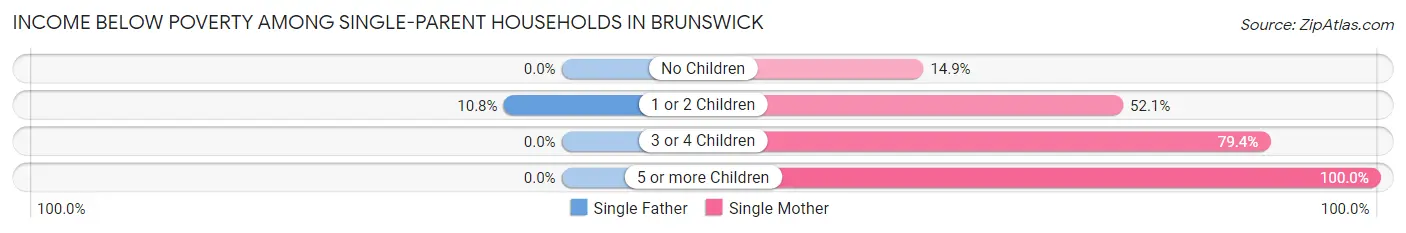
| Children | Single Father | Single Mother |
| No Children | 0 (0.0%) | 63 (14.9%) |
| 1 or 2 Children | 13 (10.8%) | 533 (52.0%) |
| 3 or 4 Children | 0 (0.0%) | 135 (79.4%) |
| 5 or more Children | 0 (0.0%) | 56 (100.0%) |
| Total | 13 (2.9%) | 787 (47.0%) |
Income Below Poverty Among Married-Couple vs Single-Parent Households in Brunswick
The poverty data for Brunswick shows that 173 of the married-couple family households (12.4%) and 800 of the single-parent households (37.7%) are living below the poverty level. Within the married-couple family households, those with 3 or 4 children have the highest poverty rate, with 16 households (29.1%) falling below the poverty line. Among the single-parent households, those with 5 or more children have the highest poverty rate, with 56 household (100.0%) living below poverty.
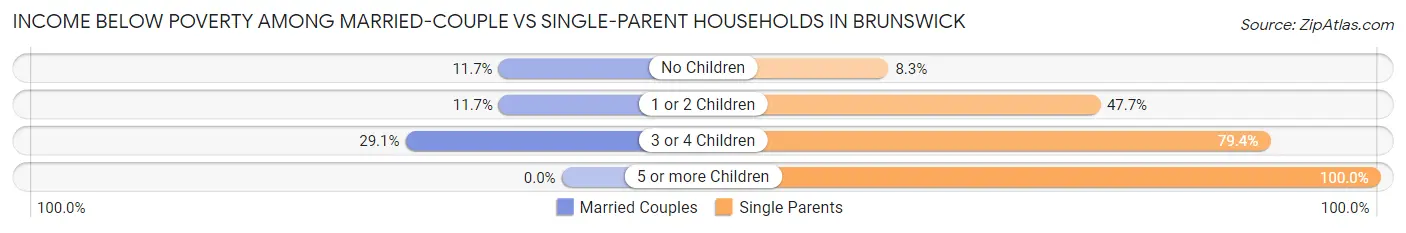
| Children | Married-Couple Families | Single-Parent Households |
| No Children | 117 (11.7%) | 63 (8.3%) |
| 1 or 2 Children | 40 (11.7%) | 546 (47.7%) |
| 3 or 4 Children | 16 (29.1%) | 135 (79.4%) |
| 5 or more Children | 0 (0.0%) | 56 (100.0%) |
| Total | 173 (12.4%) | 800 (37.7%) |
Race in Brunswick
The most populous races in Brunswick are Black / African American (9,375 | 61.5%), White / Caucasian (4,922 | 32.3%), and Hispanic or Latino (1,119 | 7.3%).
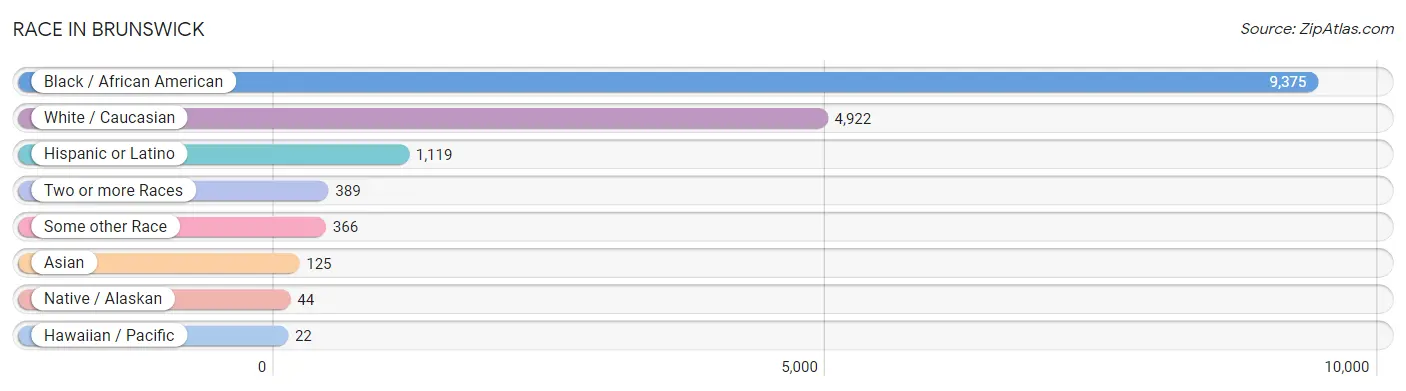
| Race | # Population | % Population |
| Asian | 125 | 0.8% |
| Black / African American | 9,375 | 61.5% |
| Hawaiian / Pacific | 22 | 0.1% |
| Hispanic or Latino | 1,119 | 7.3% |
| Native / Alaskan | 44 | 0.3% |
| White / Caucasian | 4,922 | 32.3% |
| Two or more Races | 389 | 2.5% |
| Some other Race | 366 | 2.4% |
| Total | 15,243 | 100.0% |
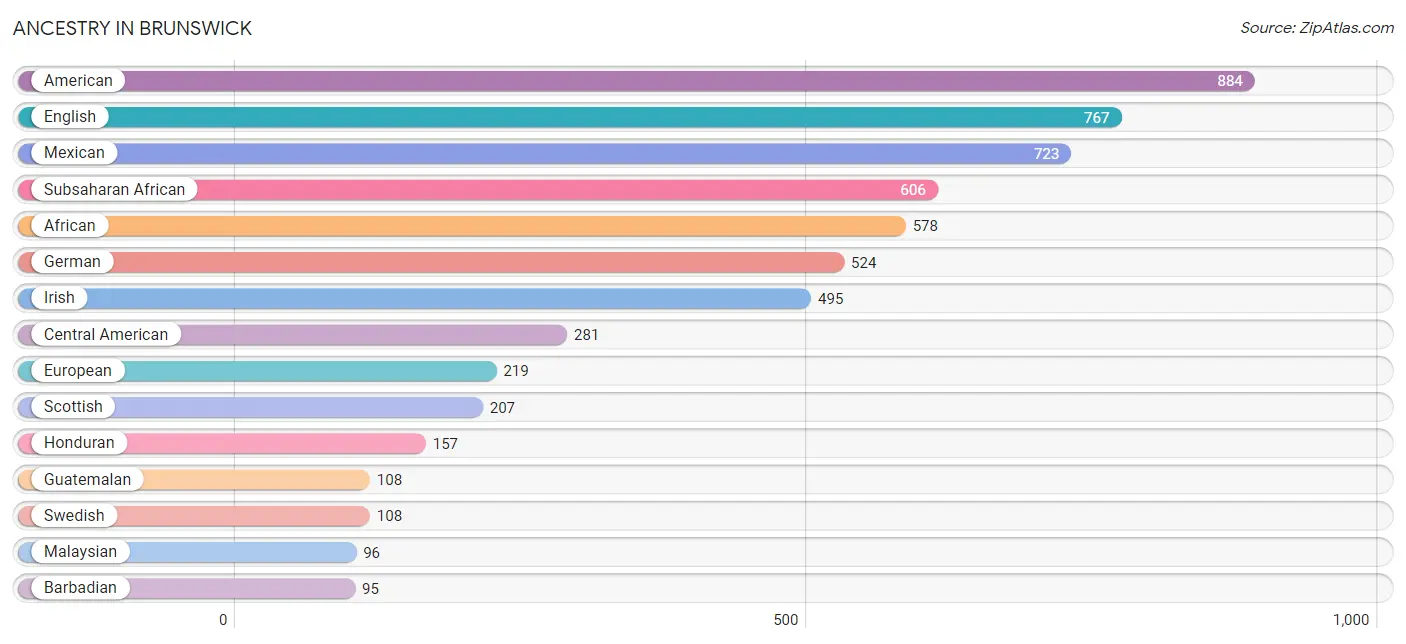
Ancestry in Brunswick
The most populous ancestries reported in Brunswick are American (884 | 5.8%), English (767 | 5.0%), Mexican (723 | 4.7%), Subsaharan African (606 | 4.0%), and African (578 | 3.8%), together accounting for 23.3% of all Brunswick residents.
| Ancestry | # Population | % Population |
| African | 578 | 3.8% |
| American | 884 | 5.8% |
| Bahamian | 26 | 0.2% |
| Barbadian | 95 | 0.6% |
| Belgian | 11 | 0.1% |
| British | 55 | 0.4% |
| Burmese | 23 | 0.2% |
| Canadian | 11 | 0.1% |
| Central American | 281 | 1.8% |
| Costa Rican | 16 | 0.1% |
| Croatian | 27 | 0.2% |
| Czechoslovakian | 14 | 0.1% |
| Danish | 19 | 0.1% |
| Dominican | 12 | 0.1% |
| Dutch | 62 | 0.4% |
| English | 767 | 5.0% |
| European | 219 | 1.4% |
| French | 89 | 0.6% |
| German | 524 | 3.4% |
| Greek | 36 | 0.2% |
| Guatemalan | 108 | 0.7% |
| Haitian | 32 | 0.2% |
| Honduran | 157 | 1.0% |
| Hungarian | 48 | 0.3% |
| Indian (Asian) | 8 | 0.1% |
| Irish | 495 | 3.3% |
| Italian | 95 | 0.6% |
| Jamaican | 19 | 0.1% |
| Malaysian | 96 | 0.6% |
| Mexican | 723 | 4.7% |
| Nigerian | 28 | 0.2% |
| Northern European | 17 | 0.1% |
| Norwegian | 11 | 0.1% |
| Polish | 50 | 0.3% |
| Portuguese | 76 | 0.5% |
| Puerto Rican | 51 | 0.3% |
| Russian | 21 | 0.1% |
| Scandinavian | 19 | 0.1% |
| Scotch-Irish | 54 | 0.4% |
| Scottish | 207 | 1.4% |
| Sioux | 4 | 0.0% |
| Sri Lankan | 29 | 0.2% |
| Subsaharan African | 606 | 4.0% |
| Swedish | 108 | 0.7% |
| Ukrainian | 36 | 0.2% | View All 45 Rows |
Immigrants in Brunswick
The most numerous immigrant groups reported in Brunswick came from Latin America (551 | 3.6%), Central America (499 | 3.3%), Mexico (268 | 1.8%), Europe (129 | 0.9%), and Honduras (118 | 0.8%), together accounting for 10.3% of all Brunswick residents.
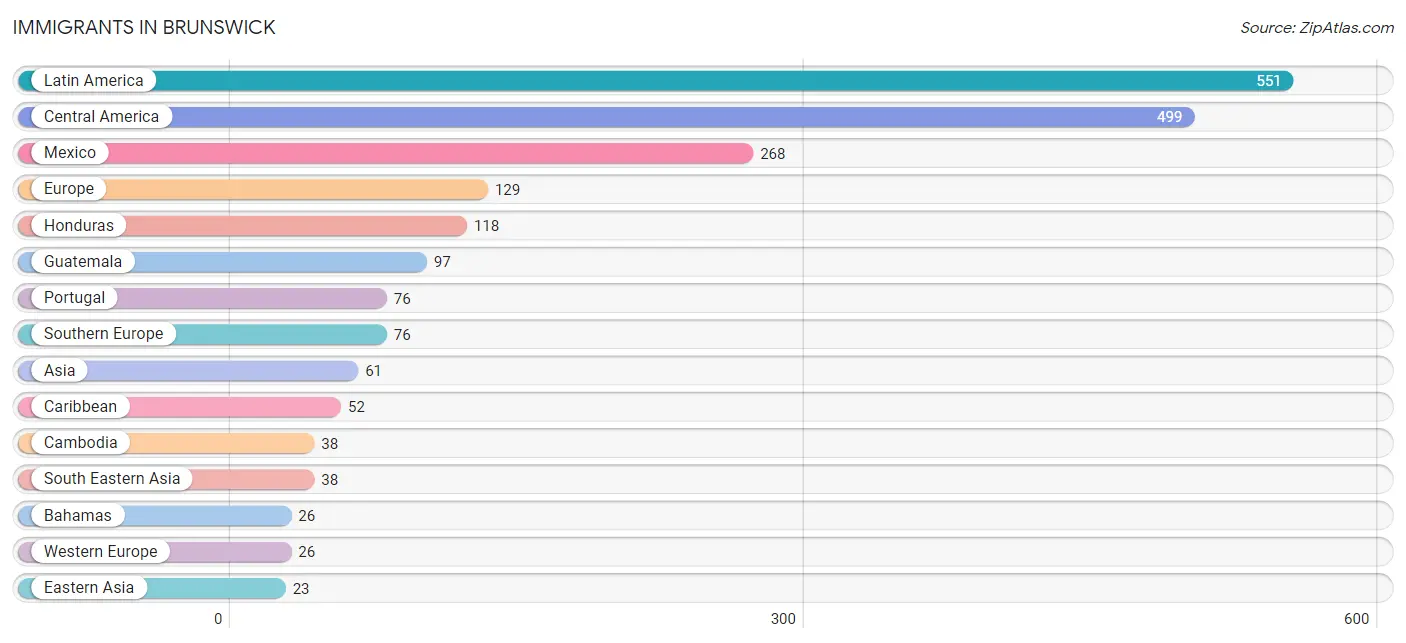
| Immigration Origin | # Population | % Population |
| Asia | 61 | 0.4% |
| Bahamas | 26 | 0.2% |
| Cambodia | 38 | 0.3% |
| Caribbean | 52 | 0.3% |
| Central America | 499 | 3.3% |
| Costa Rica | 16 | 0.1% |
| Eastern Asia | 23 | 0.2% |
| Eastern Europe | 8 | 0.1% |
| England | 19 | 0.1% |
| Europe | 129 | 0.9% |
| France | 13 | 0.1% |
| Germany | 13 | 0.1% |
| Guatemala | 97 | 0.6% |
| Haiti | 16 | 0.1% |
| Honduras | 118 | 0.8% |
| Hungary | 8 | 0.1% |
| Jamaica | 10 | 0.1% |
| Korea | 23 | 0.2% |
| Latin America | 551 | 3.6% |
| Mexico | 268 | 1.8% |
| Northern Europe | 19 | 0.1% |
| Portugal | 76 | 0.5% |
| South Eastern Asia | 38 | 0.3% |
| Southern Europe | 76 | 0.5% |
| Western Europe | 26 | 0.2% | View All 25 Rows |
Sex and Age in Brunswick
Sex and Age in Brunswick
The most populous age groups in Brunswick are 15 to 19 Years (747 | 11.0%) for men and 30 to 34 Years (696 | 8.2%) for women.
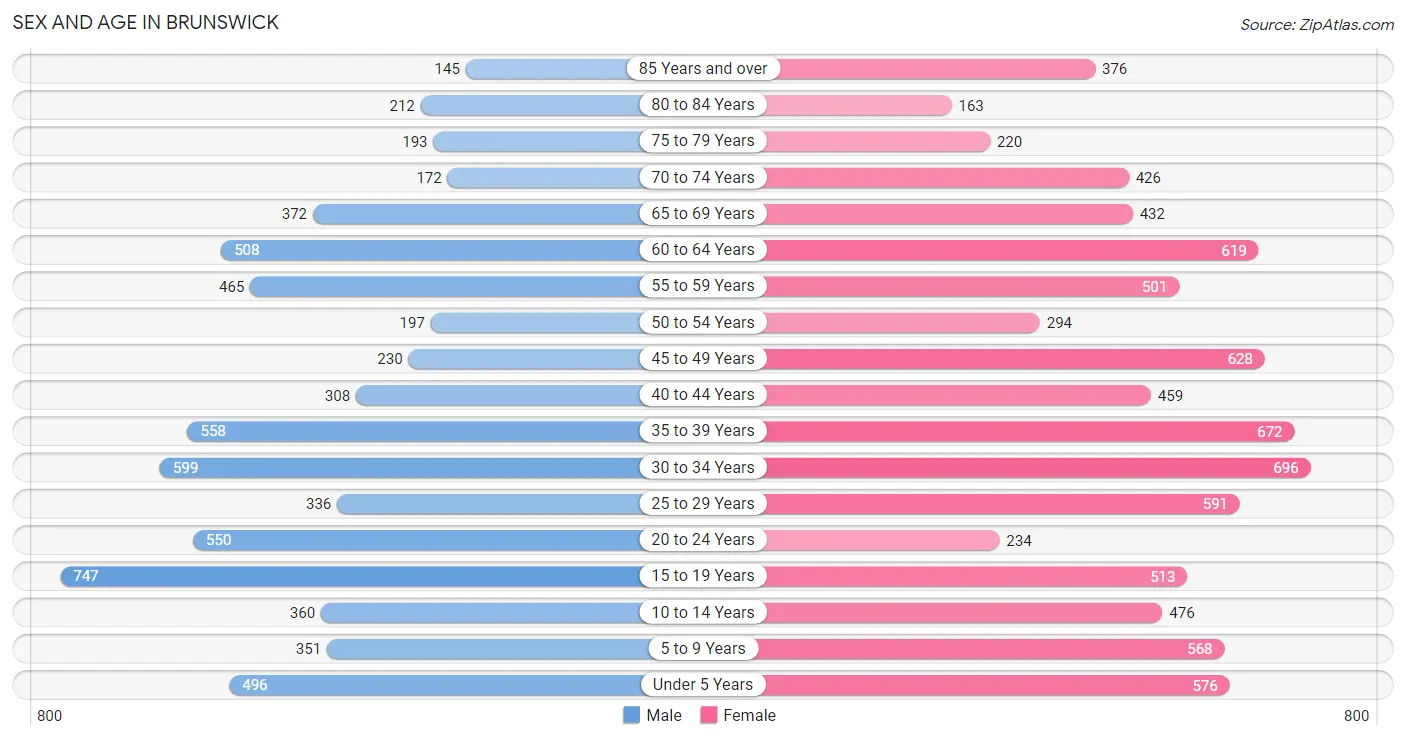
| Age Bracket | Male | Female |
| Under 5 Years | 496 (7.3%) | 576 (6.8%) |
| 5 to 9 Years | 351 (5.2%) | 568 (6.7%) |
| 10 to 14 Years | 360 (5.3%) | 476 (5.6%) |
| 15 to 19 Years | 747 (11.0%) | 513 (6.1%) |
| 20 to 24 Years | 550 (8.1%) | 234 (2.8%) |
| 25 to 29 Years | 336 (4.9%) | 591 (7.0%) |
| 30 to 34 Years | 599 (8.8%) | 696 (8.2%) |
| 35 to 39 Years | 558 (8.2%) | 672 (8.0%) |
| 40 to 44 Years | 308 (4.5%) | 459 (5.4%) |
| 45 to 49 Years | 230 (3.4%) | 628 (7.4%) |
| 50 to 54 Years | 197 (2.9%) | 294 (3.5%) |
| 55 to 59 Years | 465 (6.8%) | 501 (5.9%) |
| 60 to 64 Years | 508 (7.5%) | 619 (7.3%) |
| 65 to 69 Years | 372 (5.5%) | 432 (5.1%) |
| 70 to 74 Years | 172 (2.5%) | 426 (5.1%) |
| 75 to 79 Years | 193 (2.8%) | 220 (2.6%) |
| 80 to 84 Years | 212 (3.1%) | 163 (1.9%) |
| 85 Years and over | 145 (2.1%) | 376 (4.4%) |
| Total | 6,799 (100.0%) | 8,444 (100.0%) |
Families and Households in Brunswick
Median Family Size in Brunswick
The median family size in Brunswick is 3.11 persons per family, with single female/mother families (1,674 | 47.6%) accounting for the largest median family size of 3.28 persons per family. On the other hand, single male/father families (451 | 12.8%) represent the smallest median family size with 2.64 persons per family.
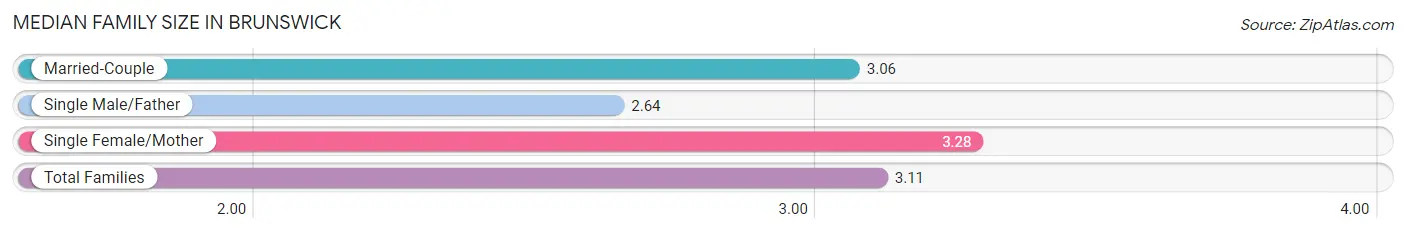
| Family Type | # Families | Family Size |
| Married-Couple | 1,395 (39.6%) | 3.06 |
| Single Male/Father | 451 (12.8%) | 2.64 |
| Single Female/Mother | 1,674 (47.6%) | 3.28 |
| Total Families | 3,520 (100.0%) | 3.11 |
Median Household Size in Brunswick
The median household size in Brunswick is 2.32 persons per household, with single female/mother households (1,674 | 26.5%) accounting for the largest median household size of 3.45 persons per household. non-family households (2,797 | 44.3%) represent the smallest median household size with 1.20 persons per household.
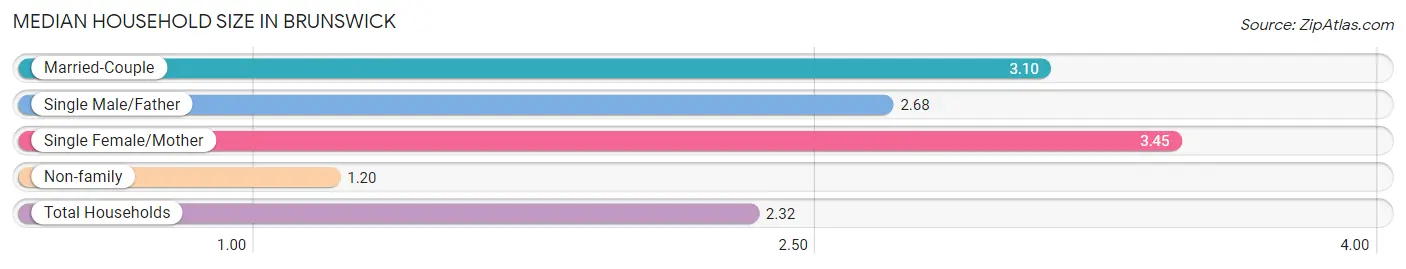
| Household Type | # Households | Household Size |
| Married-Couple | 1,395 (22.1%) | 3.10 |
| Single Male/Father | 451 (7.1%) | 2.68 |
| Single Female/Mother | 1,674 (26.5%) | 3.45 |
| Non-family | 2,797 (44.3%) | 1.20 |
| Total Households | 6,317 (100.0%) | 2.32 |
Household Size by Marriage Status in Brunswick
Out of a total of 6,317 households in Brunswick, 3,520 (55.7%) are family households, while 2,797 (44.3%) are nonfamily households. The most numerous type of family households are 2-person households, comprising 1,602, and the most common type of nonfamily households are 1-person households, comprising 2,491.
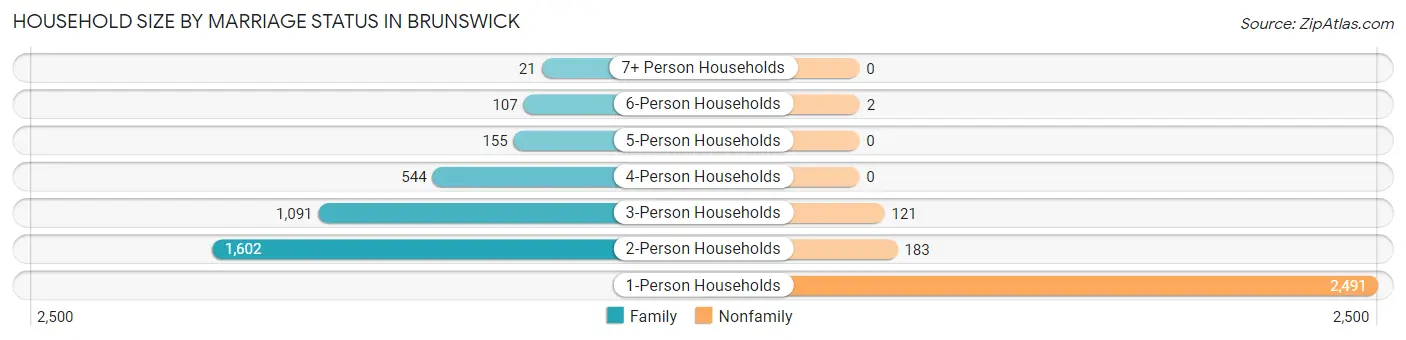
| Household Size | Family Households | Nonfamily Households |
| 1-Person Households | - | 2,491 (39.4%) |
| 2-Person Households | 1,602 (25.4%) | 183 (2.9%) |
| 3-Person Households | 1,091 (17.3%) | 121 (1.9%) |
| 4-Person Households | 544 (8.6%) | 0 (0.0%) |
| 5-Person Households | 155 (2.5%) | 0 (0.0%) |
| 6-Person Households | 107 (1.7%) | 2 (0.0%) |
| 7+ Person Households | 21 (0.3%) | 0 (0.0%) |
| Total | 3,520 (55.7%) | 2,797 (44.3%) |
Female Fertility in Brunswick
Fertility by Age in Brunswick
Average fertility rate in Brunswick is 49.0 births per 1,000 women. Women in the age bracket of 20 to 34 years have the highest fertility rate with 101.0 births per 1,000 women. Women in the age bracket of 20 to 34 years acount for 81.4% of all women with births.
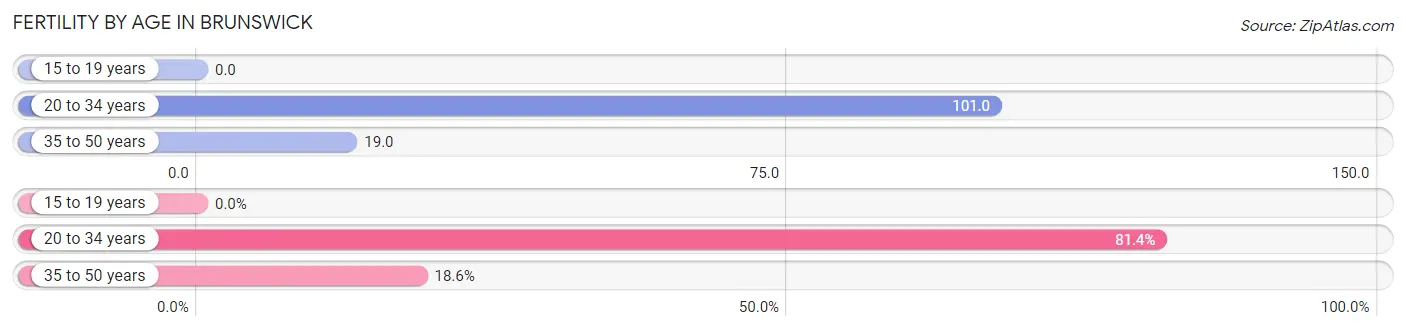
| Age Bracket | Women with Births | Births / 1,000 Women |
| 15 to 19 years | 0 (0.0%) | 0.0 |
| 20 to 34 years | 153 (81.4%) | 101.0 |
| 35 to 50 years | 35 (18.6%) | 19.0 |
| Total | 188 (100.0%) | 49.0 |
Fertility by Age by Marriage Status in Brunswick
23.9% of women with births (188) in Brunswick are married. The highest percentage of unmarried women with births falls into 35 to 50 years age bracket with 100.0% of them unmarried at the time of birth, while the lowest percentage of unmarried women with births belong to 20 to 34 years age bracket with 70.6% of them unmarried.
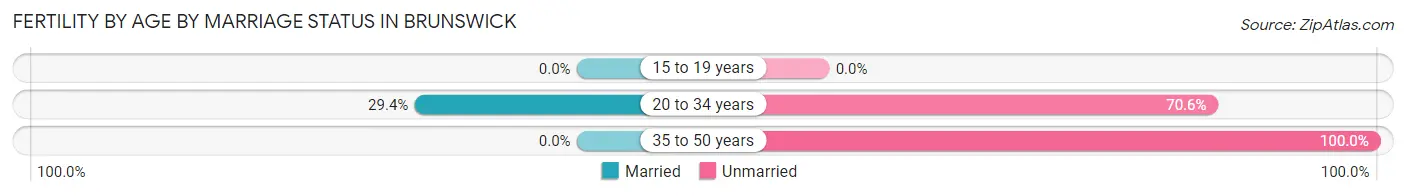
| Age Bracket | Married | Unmarried |
| 15 to 19 years | 0 (0.0%) | 0 (0.0%) |
| 20 to 34 years | 45 (29.4%) | 108 (70.6%) |
| 35 to 50 years | 0 (0.0%) | 35 (100.0%) |
| Total | 45 (23.9%) | 143 (76.1%) |
Fertility by Education in Brunswick
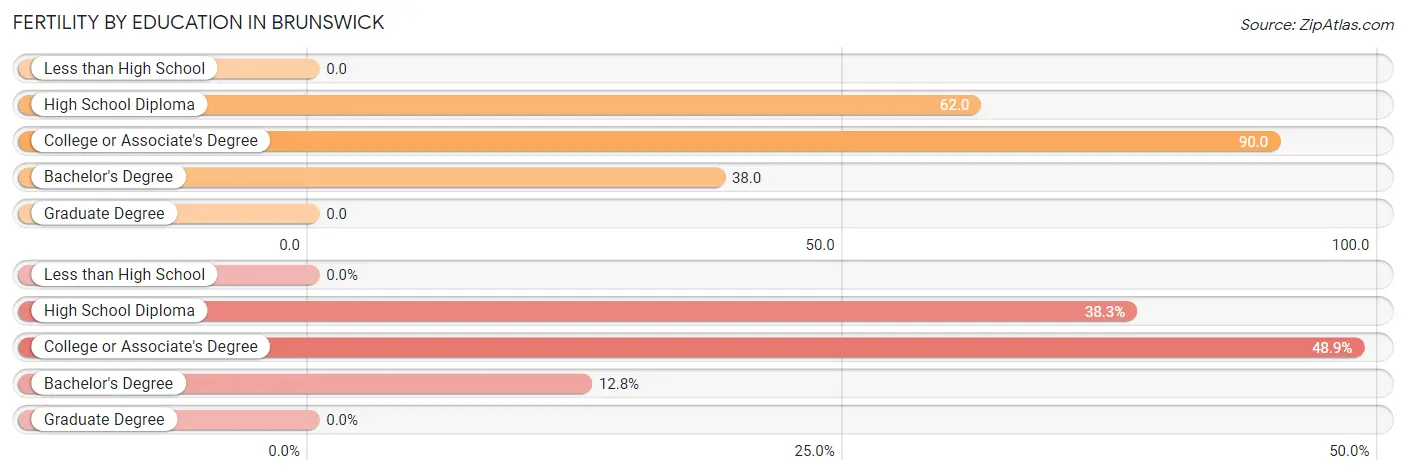
| Educational Attainment | Women with Births | Births / 1,000 Women |
| Less than High School | 0 (0.0%) | 0.0 |
| High School Diploma | 72 (38.3%) | 62.0 |
| College or Associate's Degree | 92 (48.9%) | 90.0 |
| Bachelor's Degree | 24 (12.8%) | 38.0 |
| Graduate Degree | 0 (0.0%) | 0.0 |
| Total | 188 (100.0%) | 49.0 |
Fertility by Education by Marriage Status in Brunswick
76.1% of women with births in Brunswick are unmarried. Women with the educational attainment of bachelor's degree are most likely to be married with 100.0% of them married at childbirth, while women with the educational attainment of college or associate's degree are least likely to be married with 100.0% of them unmarried at childbirth.
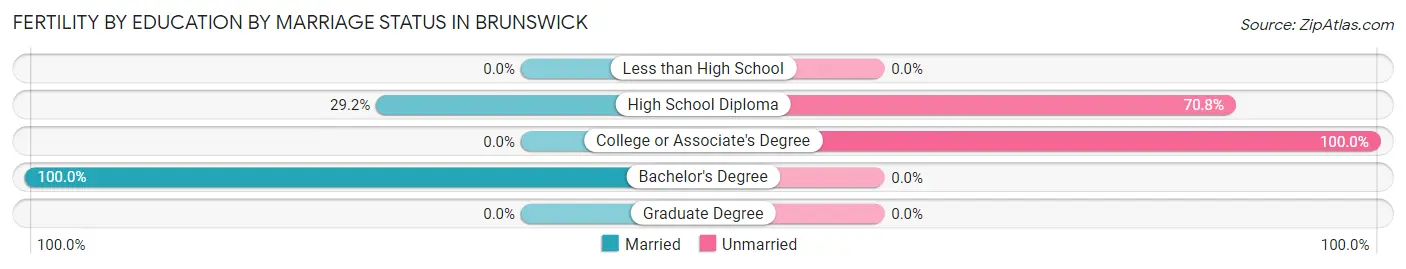
| Educational Attainment | Married | Unmarried |
| Less than High School | 0 (0.0%) | 0 (0.0%) |
| High School Diploma | 21 (29.2%) | 51 (70.8%) |
| College or Associate's Degree | 0 (0.0%) | 92 (100.0%) |
| Bachelor's Degree | 24 (100.0%) | 0 (0.0%) |
| Graduate Degree | 0 (0.0%) | 0 (0.0%) |
| Total | 45 (23.9%) | 143 (76.1%) |
Employment Characteristics in Brunswick
Employment by Class of Employer in Brunswick
Among the 5,881 employed individuals in Brunswick, private company employees (4,162 | 70.8%), not-for-profit organizations (497 | 8.5%), and state government employees (339 | 5.8%) make up the most common classes of employment.
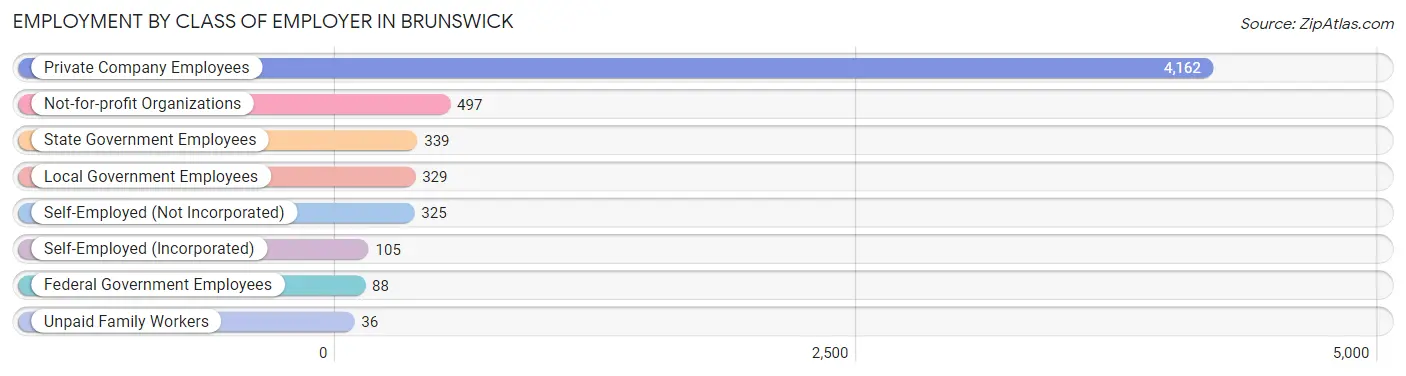
| Employer Class | # Employees | % Employees |
| Private Company Employees | 4,162 | 70.8% |
| Self-Employed (Incorporated) | 105 | 1.8% |
| Self-Employed (Not Incorporated) | 325 | 5.5% |
| Not-for-profit Organizations | 497 | 8.5% |
| Local Government Employees | 329 | 5.6% |
| State Government Employees | 339 | 5.8% |
| Federal Government Employees | 88 | 1.5% |
| Unpaid Family Workers | 36 | 0.6% |
| Total | 5,881 | 100.0% |
Employment Status by Age in Brunswick
According to the labor force statistics for Brunswick, out of the total population over 16 years of age (12,154), 54.2% or 6,587 individuals are in the labor force, with 9.1% or 599 of them unemployed. The age group with the highest labor force participation rate is 25 to 29 years, with 90.9% or 843 individuals in the labor force. Within the labor force, the 55 to 59 years age range has the highest percentage of unemployed individuals, with 25.0% or 141 of them being unemployed.
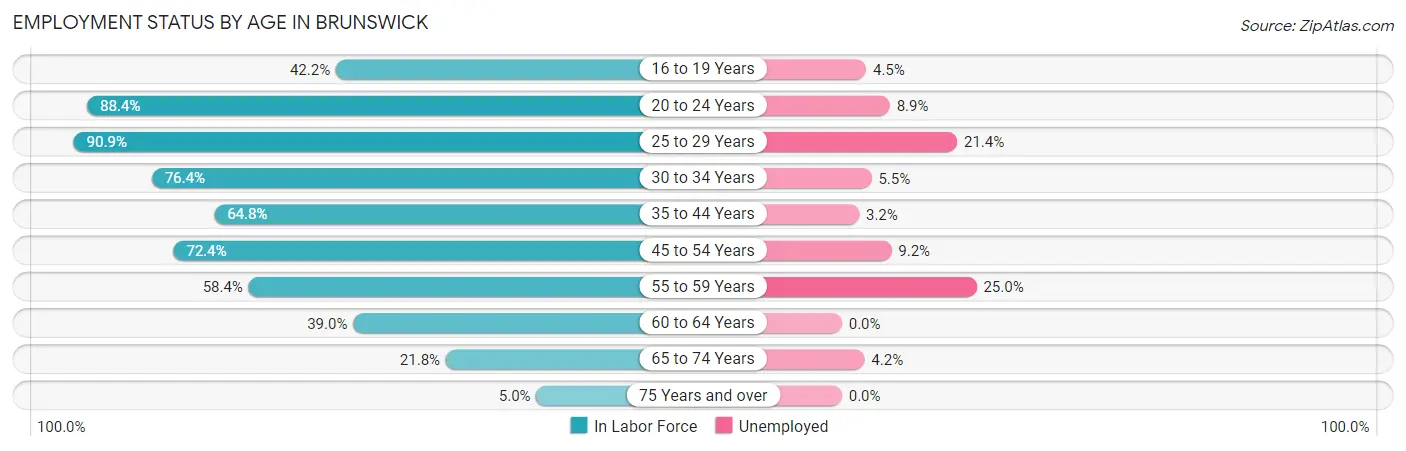
| Age Bracket | In Labor Force | Unemployed |
| 16 to 19 Years | 421 (42.2%) | 19 (4.5%) |
| 20 to 24 Years | 693 (88.4%) | 62 (8.9%) |
| 25 to 29 Years | 843 (90.9%) | 180 (21.4%) |
| 30 to 34 Years | 989 (76.4%) | 54 (5.5%) |
| 35 to 44 Years | 1,294 (64.8%) | 41 (3.2%) |
| 45 to 54 Years | 977 (72.4%) | 90 (9.2%) |
| 55 to 59 Years | 564 (58.4%) | 141 (25.0%) |
| 60 to 64 Years | 440 (39.0%) | 0 (0.0%) |
| 65 to 74 Years | 306 (21.8%) | 13 (4.2%) |
| 75 Years and over | 65 (5.0%) | 0 (0.0%) |
| Total | 6,587 (54.2%) | 599 (9.1%) |
Employment Status by Educational Attainment in Brunswick
According to labor force statistics for Brunswick, 66.6% of individuals (5,102) out of the total population between 25 and 64 years of age (7,661) are in the labor force, with 9.9% or 505 of them being unemployed. The group with the highest labor force participation rate are those with the educational attainment of bachelor's degree or higher, with 81.5% or 1,253 individuals in the labor force. Within the labor force, individuals with college / associate degree education have the highest percentage of unemployment, with 14.6% or 227 of them being unemployed.
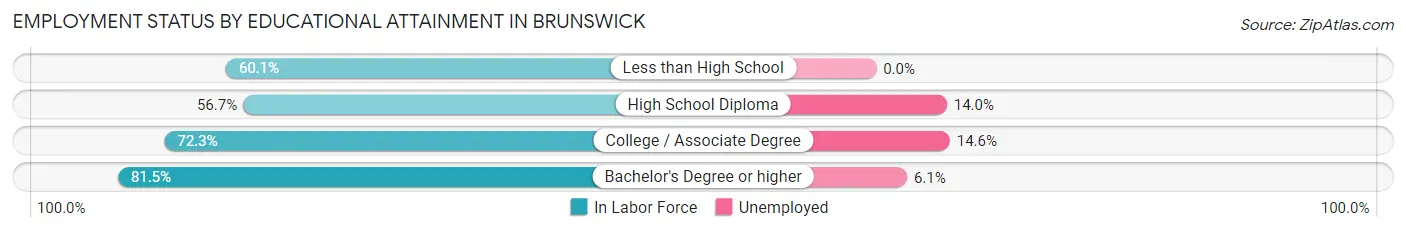
| Educational Attainment | In Labor Force | Unemployed |
| Less than High School | 847 (60.1%) | 0 (0.0%) |
| High School Diploma | 1,455 (56.7%) | 359 (14.0%) |
| College / Associate Degree | 1,552 (72.3%) | 313 (14.6%) |
| Bachelor's Degree or higher | 1,253 (81.5%) | 94 (6.1%) |
| Total | 5,102 (66.6%) | 758 (9.9%) |
Employment Occupations by Sex in Brunswick
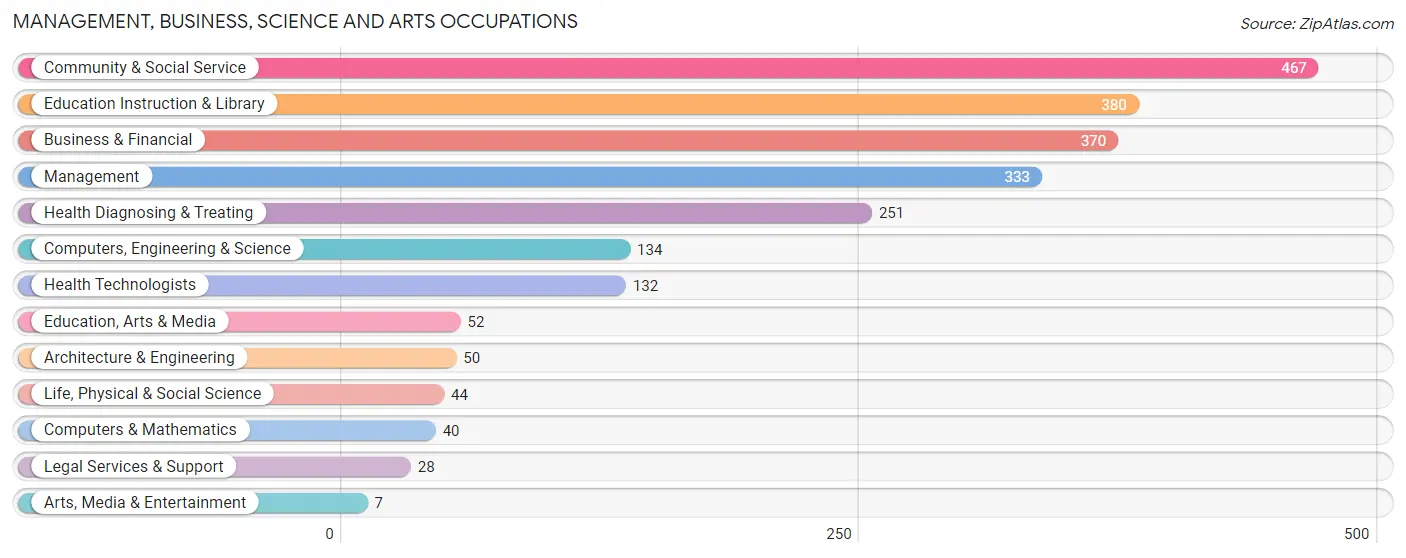
Management, Business, Science and Arts Occupations
The most common Management, Business, Science and Arts occupations in Brunswick are Community & Social Service (467 | 7.8%), Education Instruction & Library (380 | 6.3%), Business & Financial (370 | 6.2%), Management (333 | 5.6%), and Health Diagnosing & Treating (251 | 4.2%).
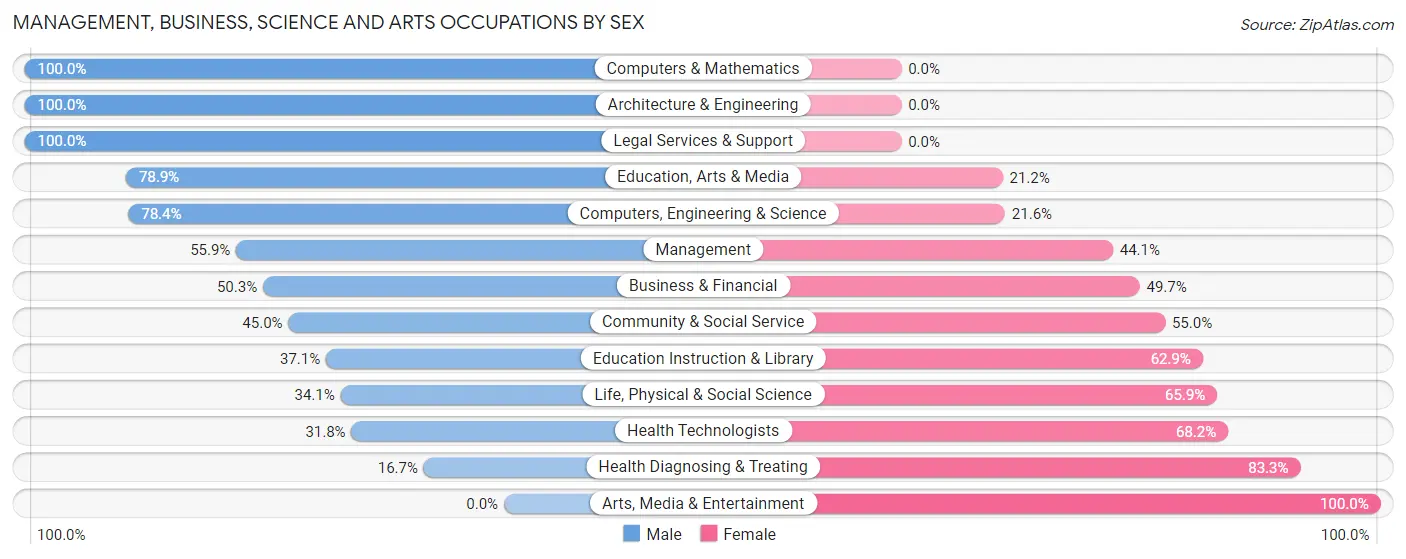
Management, Business, Science and Arts Occupations by Sex
Within the Management, Business, Science and Arts occupations in Brunswick, the most male-oriented occupations are Computers & Mathematics (100.0%), Architecture & Engineering (100.0%), and Legal Services & Support (100.0%), while the most female-oriented occupations are Arts, Media & Entertainment (100.0%), Health Diagnosing & Treating (83.3%), and Health Technologists (68.2%).
| Occupation | Male | Female |
| Management | 186 (55.9%) | 147 (44.1%) |
| Business & Financial | 186 (50.3%) | 184 (49.7%) |
| Computers, Engineering & Science | 105 (78.4%) | 29 (21.6%) |
| Computers & Mathematics | 40 (100.0%) | 0 (0.0%) |
| Architecture & Engineering | 50 (100.0%) | 0 (0.0%) |
| Life, Physical & Social Science | 15 (34.1%) | 29 (65.9%) |
| Community & Social Service | 210 (45.0%) | 257 (55.0%) |
| Education, Arts & Media | 41 (78.8%) | 11 (21.1%) |
| Legal Services & Support | 28 (100.0%) | 0 (0.0%) |
| Education Instruction & Library | 141 (37.1%) | 239 (62.9%) |
| Arts, Media & Entertainment | 0 (0.0%) | 7 (100.0%) |
| Health Diagnosing & Treating | 42 (16.7%) | 209 (83.3%) |
| Health Technologists | 42 (31.8%) | 90 (68.2%) |
| Total (Category) | 729 (46.9%) | 826 (53.1%) |
| Total (Overall) | 2,907 (48.5%) | 3,084 (51.5%) |
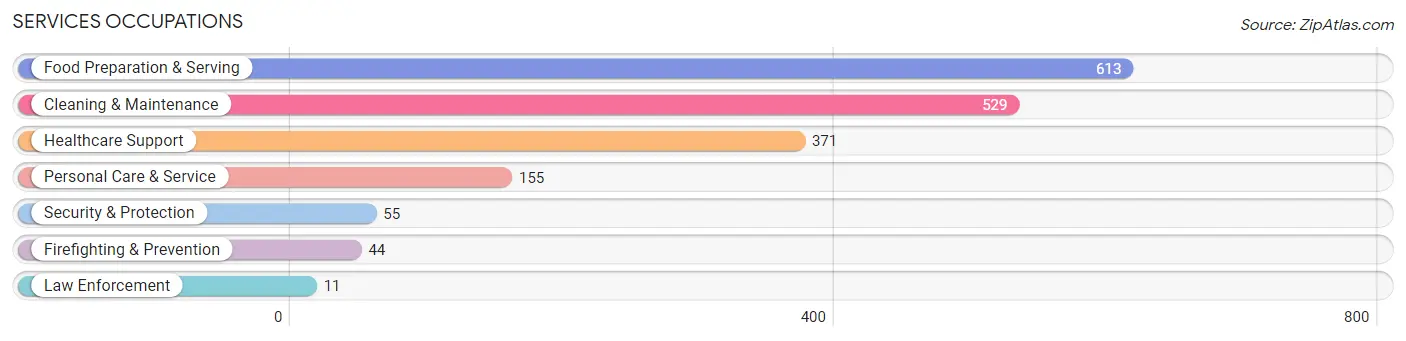
Services Occupations
The most common Services occupations in Brunswick are Food Preparation & Serving (613 | 10.2%), Cleaning & Maintenance (529 | 8.8%), Healthcare Support (371 | 6.2%), Personal Care & Service (155 | 2.6%), and Security & Protection (55 | 0.9%).
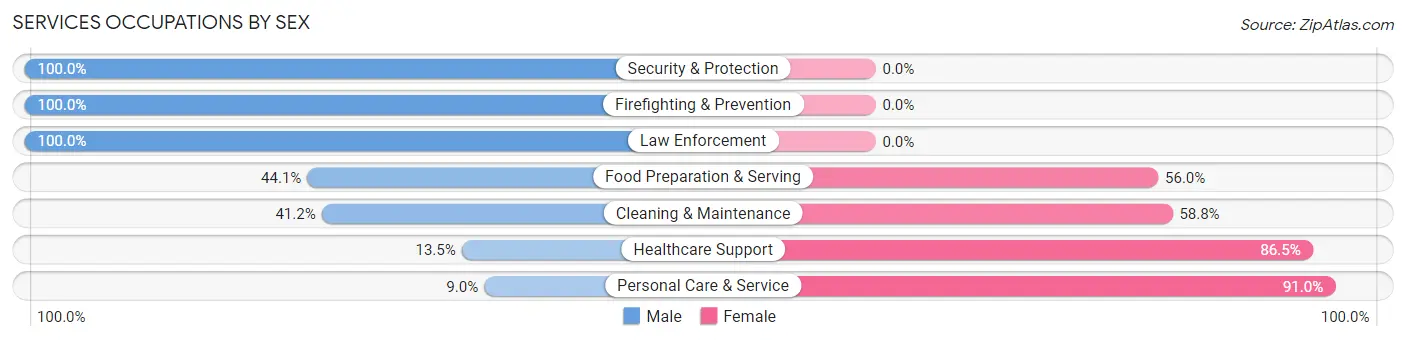
Services Occupations by Sex
Within the Services occupations in Brunswick, the most male-oriented occupations are Security & Protection (100.0%), Firefighting & Prevention (100.0%), and Law Enforcement (100.0%), while the most female-oriented occupations are Personal Care & Service (91.0%), Healthcare Support (86.5%), and Cleaning & Maintenance (58.8%).
| Occupation | Male | Female |
| Healthcare Support | 50 (13.5%) | 321 (86.5%) |
| Security & Protection | 55 (100.0%) | 0 (0.0%) |
| Firefighting & Prevention | 44 (100.0%) | 0 (0.0%) |
| Law Enforcement | 11 (100.0%) | 0 (0.0%) |
| Food Preparation & Serving | 270 (44.1%) | 343 (55.9%) |
| Cleaning & Maintenance | 218 (41.2%) | 311 (58.8%) |
| Personal Care & Service | 14 (9.0%) | 141 (91.0%) |
| Total (Category) | 607 (35.2%) | 1,116 (64.8%) |
| Total (Overall) | 2,907 (48.5%) | 3,084 (51.5%) |
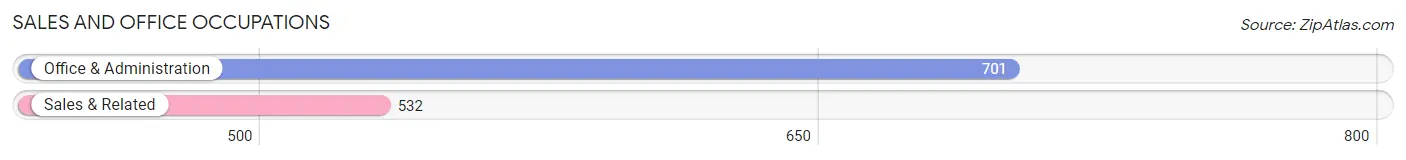
Sales and Office Occupations
The most common Sales and Office occupations in Brunswick are Office & Administration (701 | 11.7%), and Sales & Related (532 | 8.9%).
Sales and Office Occupations by Sex
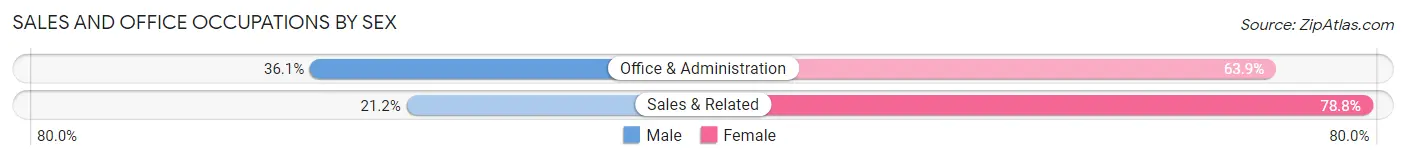
| Occupation | Male | Female |
| Sales & Related | 113 (21.2%) | 419 (78.8%) |
| Office & Administration | 253 (36.1%) | 448 (63.9%) |
| Total (Category) | 366 (29.7%) | 867 (70.3%) |
| Total (Overall) | 2,907 (48.5%) | 3,084 (51.5%) |
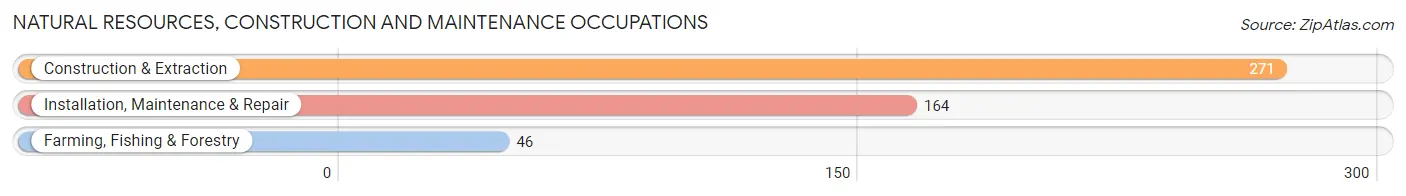
Natural Resources, Construction and Maintenance Occupations
The most common Natural Resources, Construction and Maintenance occupations in Brunswick are Construction & Extraction (271 | 4.5%), Installation, Maintenance & Repair (164 | 2.7%), and Farming, Fishing & Forestry (46 | 0.8%).
Natural Resources, Construction and Maintenance Occupations by Sex
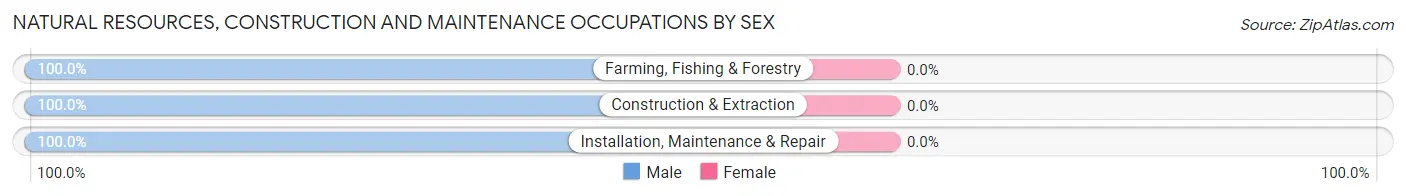
| Occupation | Male | Female |
| Farming, Fishing & Forestry | 46 (100.0%) | 0 (0.0%) |
| Construction & Extraction | 271 (100.0%) | 0 (0.0%) |
| Installation, Maintenance & Repair | 164 (100.0%) | 0 (0.0%) |
| Total (Category) | 481 (100.0%) | 0 (0.0%) |
| Total (Overall) | 2,907 (48.5%) | 3,084 (51.5%) |
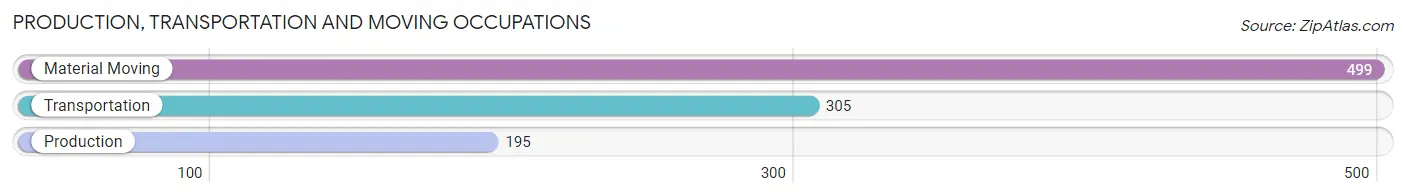
Production, Transportation and Moving Occupations
The most common Production, Transportation and Moving occupations in Brunswick are Material Moving (499 | 8.3%), Transportation (305 | 5.1%), and Production (195 | 3.3%).
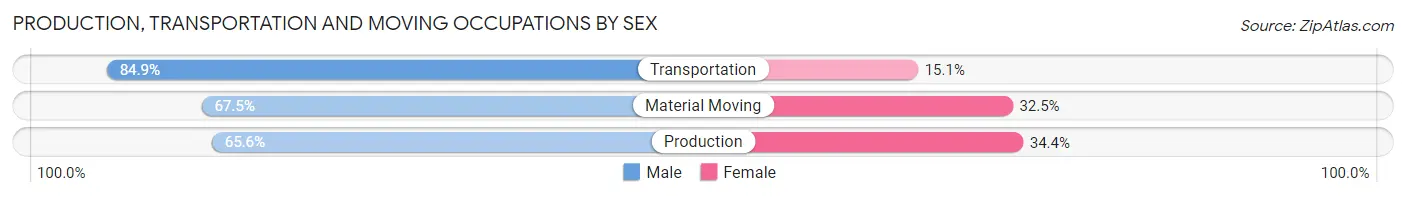
Production, Transportation and Moving Occupations by Sex
| Occupation | Male | Female |
| Production | 128 (65.6%) | 67 (34.4%) |
| Transportation | 259 (84.9%) | 46 (15.1%) |
| Material Moving | 337 (67.5%) | 162 (32.5%) |
| Total (Category) | 724 (72.5%) | 275 (27.5%) |
| Total (Overall) | 2,907 (48.5%) | 3,084 (51.5%) |
Employment Industries by Sex in Brunswick
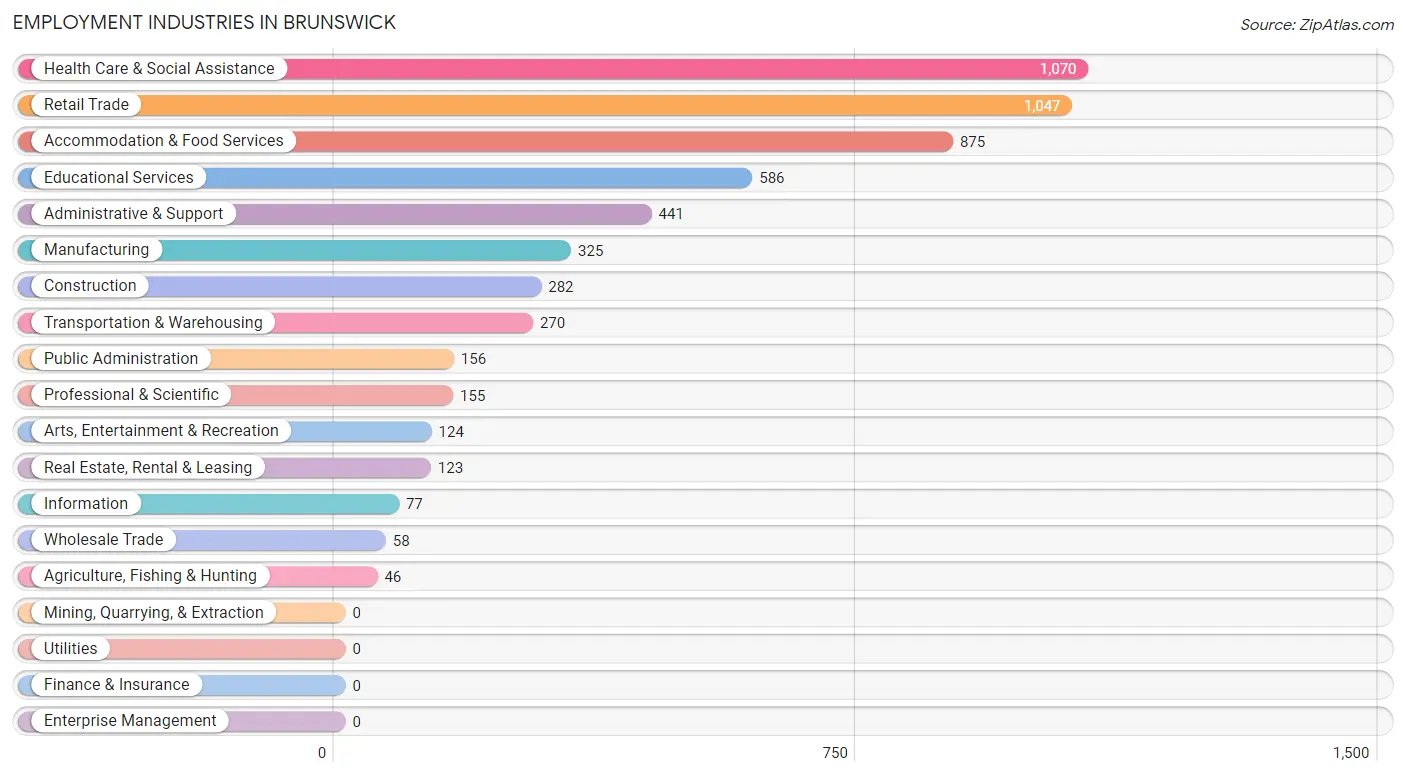
Employment Industries in Brunswick
The major employment industries in Brunswick include Health Care & Social Assistance (1,070 | 17.9%), Retail Trade (1,047 | 17.5%), Accommodation & Food Services (875 | 14.6%), Educational Services (586 | 9.8%), and Administrative & Support (441 | 7.4%).
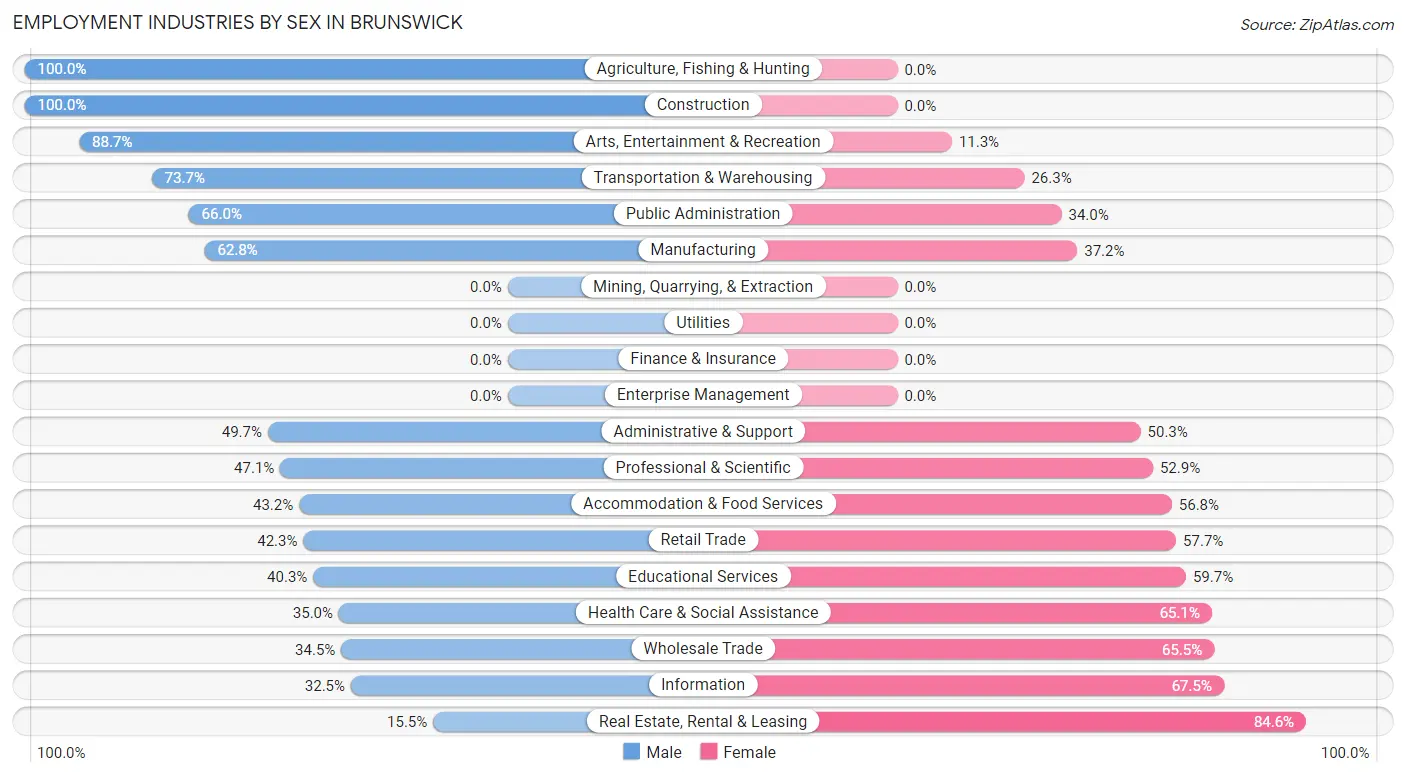
Employment Industries by Sex in Brunswick
The Brunswick industries that see more men than women are Agriculture, Fishing & Hunting (100.0%), Construction (100.0%), and Arts, Entertainment & Recreation (88.7%), whereas the industries that tend to have a higher number of women are Real Estate, Rental & Leasing (84.6%), Information (67.5%), and Wholesale Trade (65.5%).
| Industry | Male | Female |
| Agriculture, Fishing & Hunting | 46 (100.0%) | 0 (0.0%) |
| Mining, Quarrying, & Extraction | 0 (0.0%) | 0 (0.0%) |
| Construction | 282 (100.0%) | 0 (0.0%) |
| Manufacturing | 204 (62.8%) | 121 (37.2%) |
| Wholesale Trade | 20 (34.5%) | 38 (65.5%) |
| Retail Trade | 443 (42.3%) | 604 (57.7%) |
| Transportation & Warehousing | 199 (73.7%) | 71 (26.3%) |
| Utilities | 0 (0.0%) | 0 (0.0%) |
| Information | 25 (32.5%) | 52 (67.5%) |
| Finance & Insurance | 0 (0.0%) | 0 (0.0%) |
| Real Estate, Rental & Leasing | 19 (15.4%) | 104 (84.6%) |
| Professional & Scientific | 73 (47.1%) | 82 (52.9%) |
| Enterprise Management | 0 (0.0%) | 0 (0.0%) |
| Administrative & Support | 219 (49.7%) | 222 (50.3%) |
| Educational Services | 236 (40.3%) | 350 (59.7%) |
| Health Care & Social Assistance | 374 (34.9%) | 696 (65.0%) |
| Arts, Entertainment & Recreation | 110 (88.7%) | 14 (11.3%) |
| Accommodation & Food Services | 378 (43.2%) | 497 (56.8%) |
| Public Administration | 103 (66.0%) | 53 (34.0%) |
| Total | 2,907 (48.5%) | 3,084 (51.5%) |
Education in Brunswick
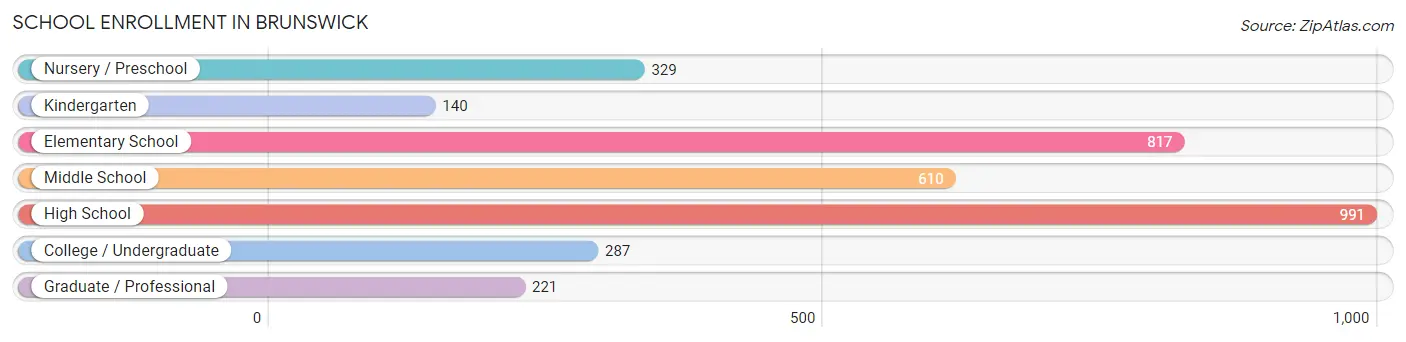
School Enrollment in Brunswick
The most common levels of schooling among the 3,395 students in Brunswick are high school (991 | 29.2%), elementary school (817 | 24.1%), and middle school (610 | 18.0%).
| School Level | # Students | % Students |
| Nursery / Preschool | 329 | 9.7% |
| Kindergarten | 140 | 4.1% |
| Elementary School | 817 | 24.1% |
| Middle School | 610 | 18.0% |
| High School | 991 | 29.2% |
| College / Undergraduate | 287 | 8.5% |
| Graduate / Professional | 221 | 6.5% |
| Total | 3,395 | 100.0% |
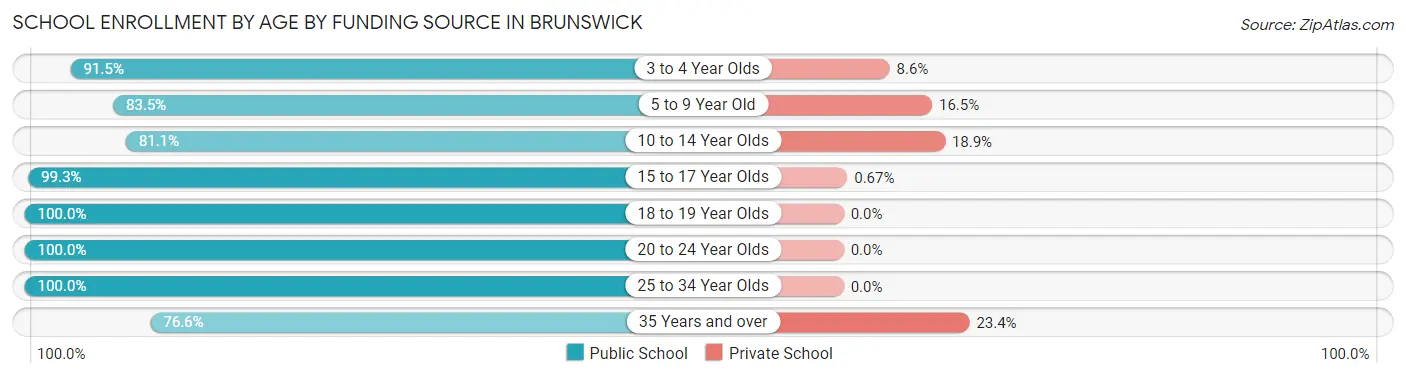
School Enrollment by Age by Funding Source in Brunswick
Out of a total of 3,395 students who are enrolled in schools in Brunswick, 373 (11.0%) attend a private institution, while the remaining 3,022 (89.0%) are enrolled in public schools. The age group of 35 years and over has the highest likelihood of being enrolled in private schools, with 41 (23.4% in the age bracket) enrolled. Conversely, the age group of 18 to 19 year olds has the lowest likelihood of being enrolled in a private school, with 278 (100.0% in the age bracket) attending a public institution.
| Age Bracket | Public School | Private School |
| 3 to 4 Year Olds | 278 (91.4%) | 26 (8.6%) |
| 5 to 9 Year Old | 756 (83.5%) | 149 (16.5%) |
| 10 to 14 Year Olds | 667 (81.1%) | 155 (18.9%) |
| 15 to 17 Year Olds | 597 (99.3%) | 4 (0.7%) |
| 18 to 19 Year Olds | 278 (100.0%) | 0 (0.0%) |
| 20 to 24 Year Olds | 106 (100.0%) | 0 (0.0%) |
| 25 to 34 Year Olds | 204 (100.0%) | 0 (0.0%) |
| 35 Years and over | 134 (76.6%) | 41 (23.4%) |
| Total | 3,022 (89.0%) | 373 (11.0%) |
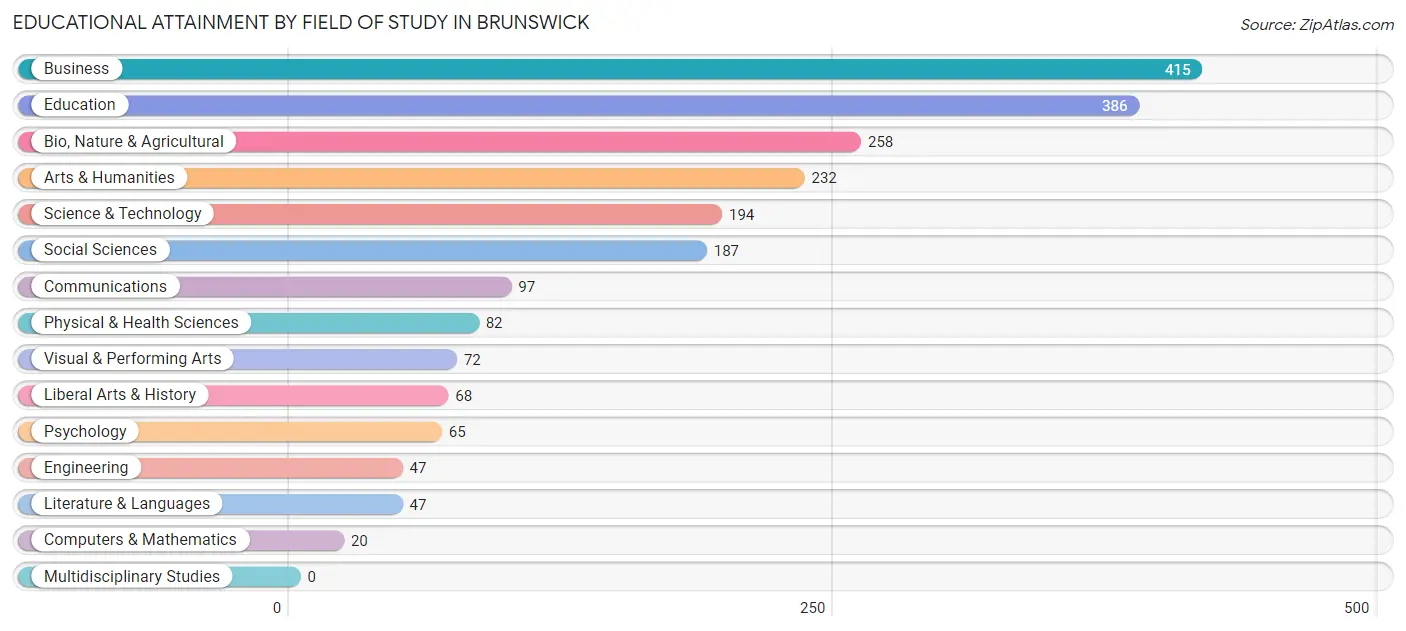
Educational Attainment by Field of Study in Brunswick
Business (415 | 19.1%), education (386 | 17.8%), bio, nature & agricultural (258 | 11.9%), arts & humanities (232 | 10.7%), and science & technology (194 | 8.9%) are the most common fields of study among 2,170 individuals in Brunswick who have obtained a bachelor's degree or higher.
| Field of Study | # Graduates | % Graduates |
| Computers & Mathematics | 20 | 0.9% |
| Bio, Nature & Agricultural | 258 | 11.9% |
| Physical & Health Sciences | 82 | 3.8% |
| Psychology | 65 | 3.0% |
| Social Sciences | 187 | 8.6% |
| Engineering | 47 | 2.2% |
| Multidisciplinary Studies | 0 | 0.0% |
| Science & Technology | 194 | 8.9% |
| Business | 415 | 19.1% |
| Education | 386 | 17.8% |
| Literature & Languages | 47 | 2.2% |
| Liberal Arts & History | 68 | 3.1% |
| Visual & Performing Arts | 72 | 3.3% |
| Communications | 97 | 4.5% |
| Arts & Humanities | 232 | 10.7% |
| Total | 2,170 | 100.0% |
Transportation & Commute in Brunswick
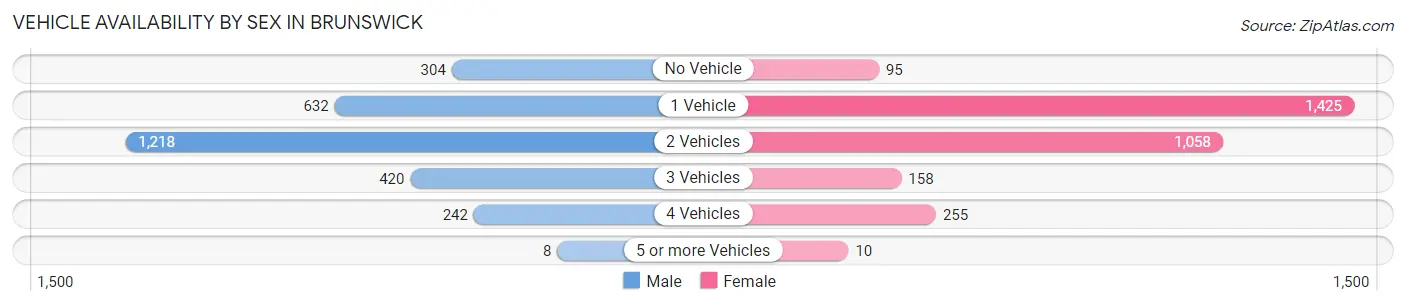
Vehicle Availability by Sex in Brunswick
The most prevalent vehicle ownership categories in Brunswick are males with 2 vehicles (1,218, accounting for 43.1%) and females with 2 vehicles (1,058, making up 40.6%).
| Vehicles Available | Male | Female |
| No Vehicle | 304 (10.8%) | 95 (3.2%) |
| 1 Vehicle | 632 (22.4%) | 1,425 (47.5%) |
| 2 Vehicles | 1,218 (43.1%) | 1,058 (35.2%) |
| 3 Vehicles | 420 (14.9%) | 158 (5.3%) |
| 4 Vehicles | 242 (8.6%) | 255 (8.5%) |
| 5 or more Vehicles | 8 (0.3%) | 10 (0.3%) |
| Total | 2,824 (100.0%) | 3,001 (100.0%) |
Commute Time in Brunswick
The most frequently occuring commute durations in Brunswick are 15 to 19 minutes (1,144 commuters, 20.0%), 10 to 14 minutes (1,137 commuters, 19.9%), and 5 to 9 minutes (990 commuters, 17.3%).
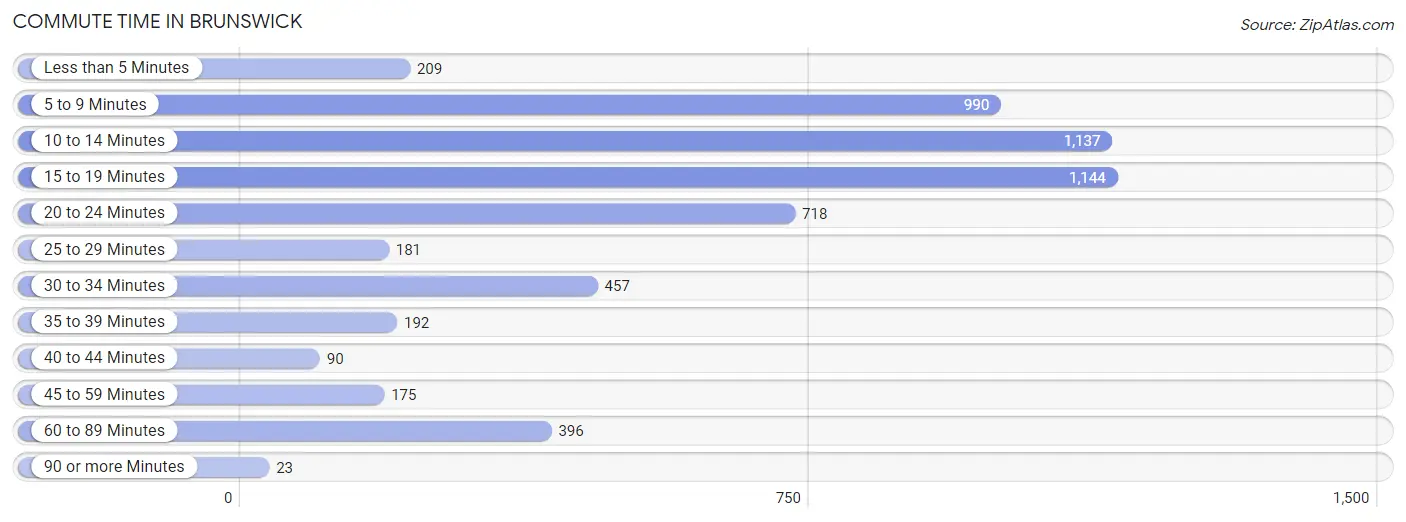
| Commute Time | # Commuters | % Commuters |
| Less than 5 Minutes | 209 | 3.7% |
| 5 to 9 Minutes | 990 | 17.3% |
| 10 to 14 Minutes | 1,137 | 19.9% |
| 15 to 19 Minutes | 1,144 | 20.0% |
| 20 to 24 Minutes | 718 | 12.6% |
| 25 to 29 Minutes | 181 | 3.2% |
| 30 to 34 Minutes | 457 | 8.0% |
| 35 to 39 Minutes | 192 | 3.4% |
| 40 to 44 Minutes | 90 | 1.6% |
| 45 to 59 Minutes | 175 | 3.1% |
| 60 to 89 Minutes | 396 | 6.9% |
| 90 or more Minutes | 23 | 0.4% |
Commute Time by Sex in Brunswick
The most common commute times in Brunswick are 15 to 19 minutes (585 commuters, 20.7%) for males and 10 to 14 minutes (561 commuters, 19.4%) for females.
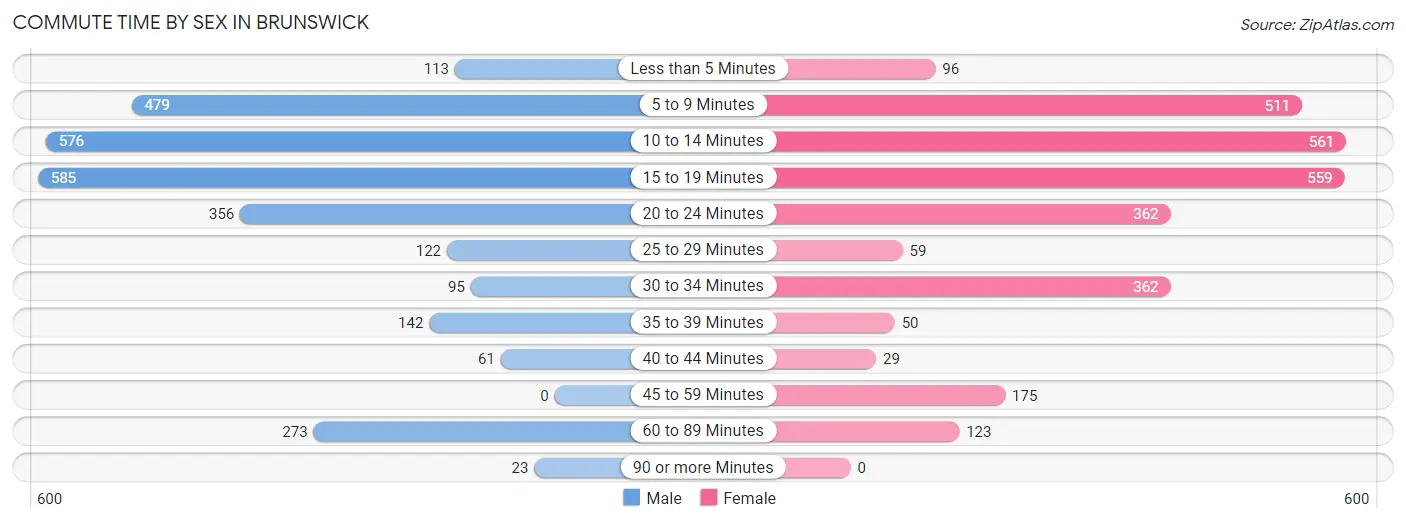
| Commute Time | Male | Female |
| Less than 5 Minutes | 113 (4.0%) | 96 (3.3%) |
| 5 to 9 Minutes | 479 (17.0%) | 511 (17.7%) |
| 10 to 14 Minutes | 576 (20.4%) | 561 (19.4%) |
| 15 to 19 Minutes | 585 (20.7%) | 559 (19.4%) |
| 20 to 24 Minutes | 356 (12.6%) | 362 (12.5%) |
| 25 to 29 Minutes | 122 (4.3%) | 59 (2.0%) |
| 30 to 34 Minutes | 95 (3.4%) | 362 (12.5%) |
| 35 to 39 Minutes | 142 (5.0%) | 50 (1.7%) |
| 40 to 44 Minutes | 61 (2.2%) | 29 (1.0%) |
| 45 to 59 Minutes | 0 (0.0%) | 175 (6.1%) |
| 60 to 89 Minutes | 273 (9.7%) | 123 (4.3%) |
| 90 or more Minutes | 23 (0.8%) | 0 (0.0%) |
Time of Departure to Work by Sex in Brunswick
The most frequent times of departure to work in Brunswick are 7:30 AM to 7:59 AM (384, 13.6%) for males and 6:30 AM to 6:59 AM (480, 16.6%) for females.
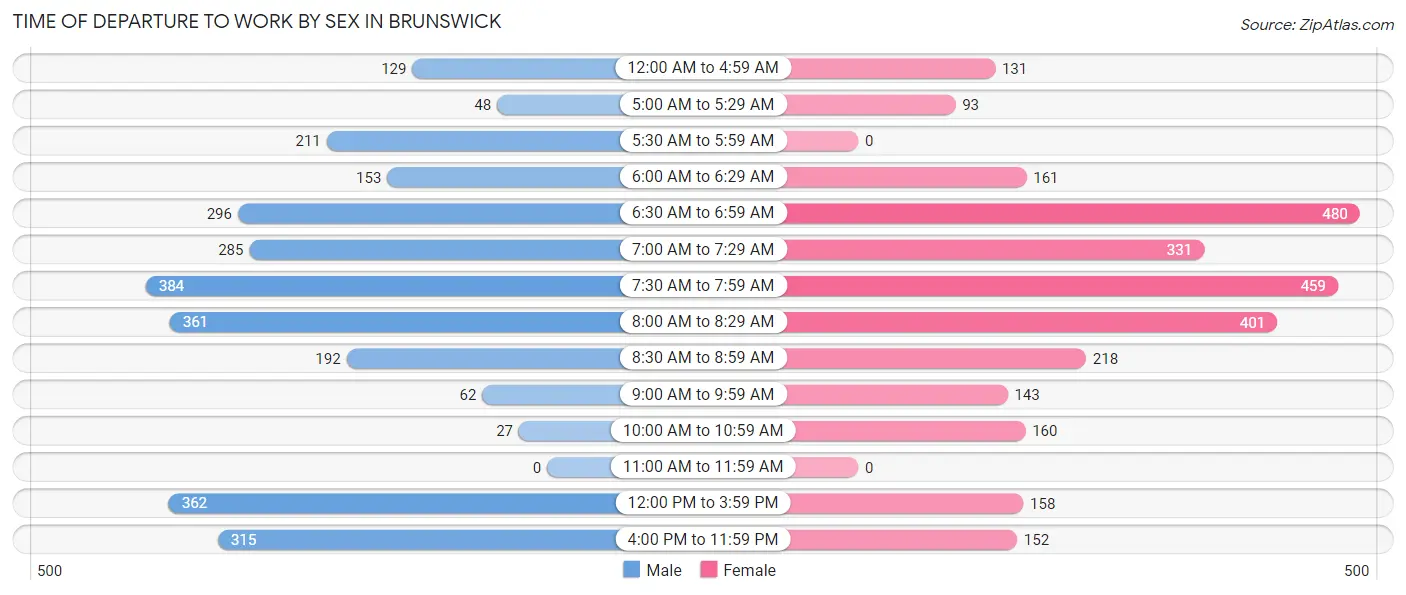
| Time of Departure | Male | Female |
| 12:00 AM to 4:59 AM | 129 (4.6%) | 131 (4.5%) |
| 5:00 AM to 5:29 AM | 48 (1.7%) | 93 (3.2%) |
| 5:30 AM to 5:59 AM | 211 (7.5%) | 0 (0.0%) |
| 6:00 AM to 6:29 AM | 153 (5.4%) | 161 (5.6%) |
| 6:30 AM to 6:59 AM | 296 (10.5%) | 480 (16.6%) |
| 7:00 AM to 7:29 AM | 285 (10.1%) | 331 (11.5%) |
| 7:30 AM to 7:59 AM | 384 (13.6%) | 459 (15.9%) |
| 8:00 AM to 8:29 AM | 361 (12.8%) | 401 (13.9%) |
| 8:30 AM to 8:59 AM | 192 (6.8%) | 218 (7.5%) |
| 9:00 AM to 9:59 AM | 62 (2.2%) | 143 (5.0%) |
| 10:00 AM to 10:59 AM | 27 (1.0%) | 160 (5.5%) |
| 11:00 AM to 11:59 AM | 0 (0.0%) | 0 (0.0%) |
| 12:00 PM to 3:59 PM | 362 (12.8%) | 158 (5.5%) |
| 4:00 PM to 11:59 PM | 315 (11.2%) | 152 (5.3%) |
| Total | 2,825 (100.0%) | 2,887 (100.0%) |
Housing Occupancy in Brunswick
Occupancy by Ownership in Brunswick
Of the total 6,317 dwellings in Brunswick, owner-occupied units account for 2,555 (40.5%), while renter-occupied units make up 3,762 (59.6%).
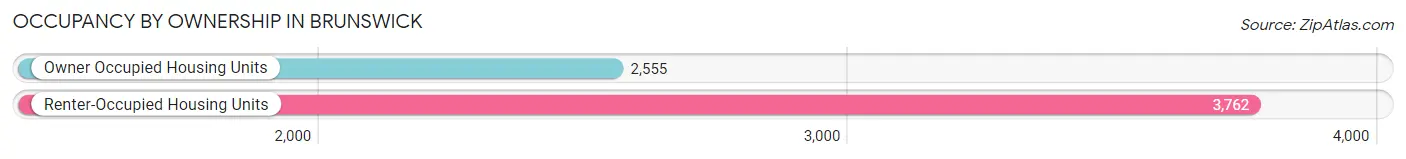
| Occupancy | # Housing Units | % Housing Units |
| Owner Occupied Housing Units | 2,555 | 40.5% |
| Renter-Occupied Housing Units | 3,762 | 59.6% |
| Total Occupied Housing Units | 6,317 | 100.0% |
Occupancy by Household Size in Brunswick
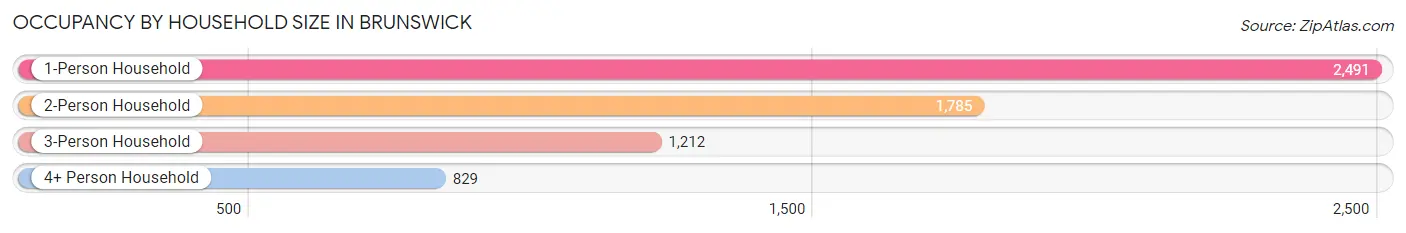
| Household Size | # Housing Units | % Housing Units |
| 1-Person Household | 2,491 | 39.4% |
| 2-Person Household | 1,785 | 28.3% |
| 3-Person Household | 1,212 | 19.2% |
| 4+ Person Household | 829 | 13.1% |
| Total Housing Units | 6,317 | 100.0% |
Occupancy by Ownership by Household Size in Brunswick
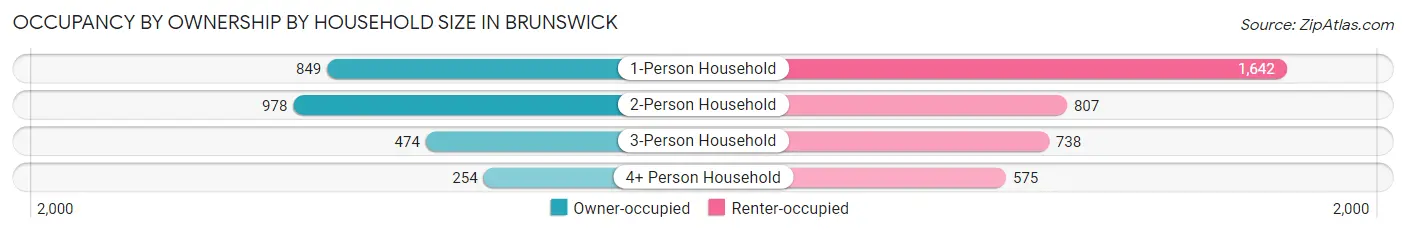
| Household Size | Owner-occupied | Renter-occupied |
| 1-Person Household | 849 (34.1%) | 1,642 (65.9%) |
| 2-Person Household | 978 (54.8%) | 807 (45.2%) |
| 3-Person Household | 474 (39.1%) | 738 (60.9%) |
| 4+ Person Household | 254 (30.6%) | 575 (69.4%) |
| Total Housing Units | 2,555 (40.5%) | 3,762 (59.6%) |
Occupancy by Educational Attainment in Brunswick
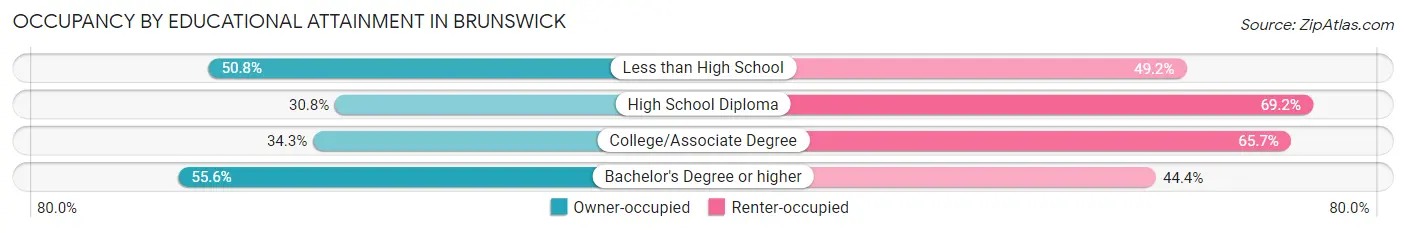
| Household Size | Owner-occupied | Renter-occupied |
| Less than High School | 626 (50.8%) | 606 (49.2%) |
| High School Diploma | 618 (30.8%) | 1,391 (69.2%) |
| College/Associate Degree | 641 (34.3%) | 1,230 (65.7%) |
| Bachelor's Degree or higher | 670 (55.6%) | 535 (44.4%) |
Occupancy by Age of Householder in Brunswick
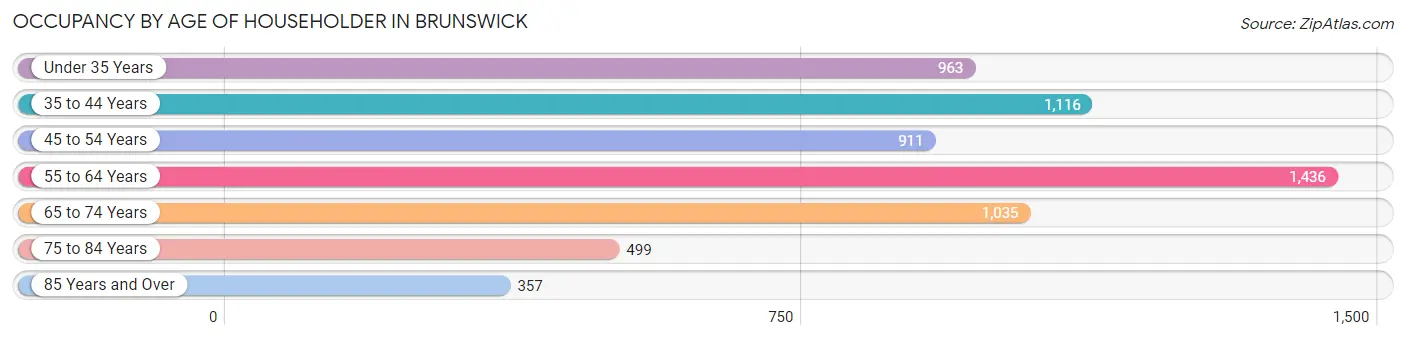
| Age Bracket | # Households | % Households |
| Under 35 Years | 963 | 15.2% |
| 35 to 44 Years | 1,116 | 17.7% |
| 45 to 54 Years | 911 | 14.4% |
| 55 to 64 Years | 1,436 | 22.7% |
| 65 to 74 Years | 1,035 | 16.4% |
| 75 to 84 Years | 499 | 7.9% |
| 85 Years and Over | 357 | 5.7% |
| Total | 6,317 | 100.0% |
Housing Finances in Brunswick
Median Income by Occupancy in Brunswick
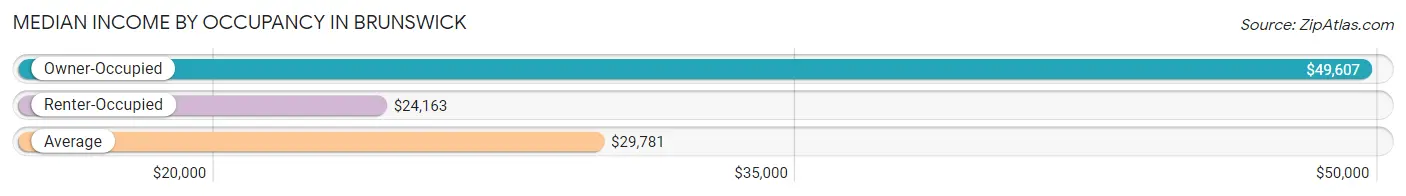
| Occupancy Type | # Households | Median Income |
| Owner-Occupied | 2,555 (40.5%) | $49,607 |
| Renter-Occupied | 3,762 (59.6%) | $24,163 |
| Average | 6,317 (100.0%) | $29,781 |
Occupancy by Householder Income Bracket in Brunswick
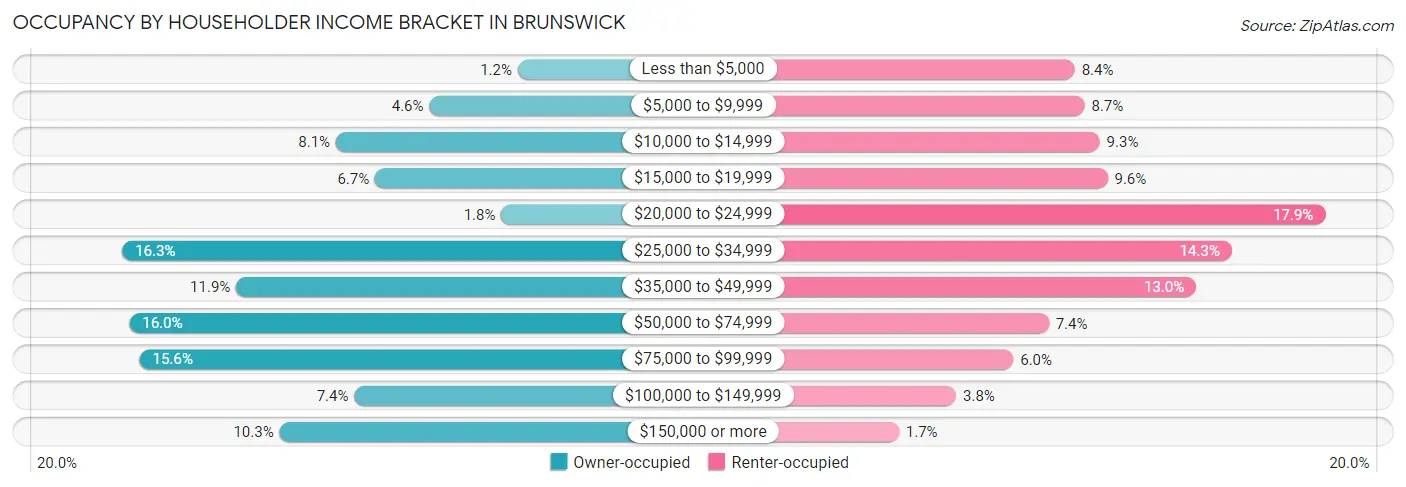
| Income Bracket | Owner-occupied | Renter-occupied |
| Less than $5,000 | 31 (1.2%) | 314 (8.4%) |
| $5,000 to $9,999 | 117 (4.6%) | 328 (8.7%) |
| $10,000 to $14,999 | 208 (8.1%) | 350 (9.3%) |
| $15,000 to $19,999 | 170 (6.7%) | 361 (9.6%) |
| $20,000 to $24,999 | 47 (1.8%) | 673 (17.9%) |
| $25,000 to $34,999 | 416 (16.3%) | 539 (14.3%) |
| $35,000 to $49,999 | 305 (11.9%) | 488 (13.0%) |
| $50,000 to $74,999 | 409 (16.0%) | 277 (7.4%) |
| $75,000 to $99,999 | 399 (15.6%) | 226 (6.0%) |
| $100,000 to $149,999 | 190 (7.4%) | 144 (3.8%) |
| $150,000 or more | 263 (10.3%) | 62 (1.7%) |
| Total | 2,555 (100.0%) | 3,762 (100.0%) |
Monthly Housing Cost Tiers in Brunswick
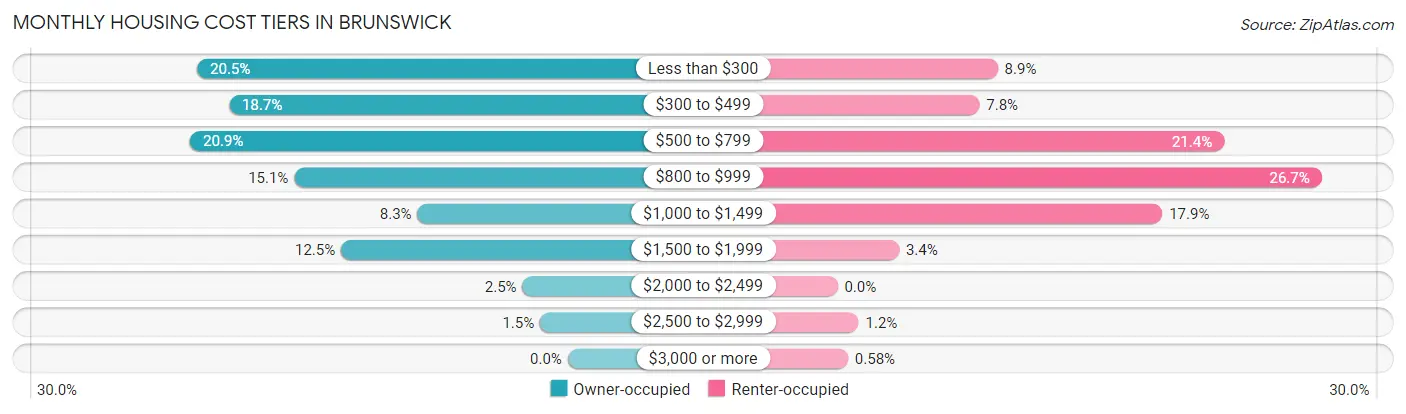
| Monthly Cost | Owner-occupied | Renter-occupied |
| Less than $300 | 523 (20.5%) | 333 (8.8%) |
| $300 to $499 | 478 (18.7%) | 295 (7.8%) |
| $500 to $799 | 533 (20.9%) | 803 (21.3%) |
| $800 to $999 | 386 (15.1%) | 1,006 (26.7%) |
| $1,000 to $1,499 | 212 (8.3%) | 675 (17.9%) |
| $1,500 to $1,999 | 320 (12.5%) | 128 (3.4%) |
| $2,000 to $2,499 | 64 (2.5%) | 0 (0.0%) |
| $2,500 to $2,999 | 39 (1.5%) | 44 (1.2%) |
| $3,000 or more | 0 (0.0%) | 22 (0.6%) |
| Total | 2,555 (100.0%) | 3,762 (100.0%) |
Physical Housing Characteristics in Brunswick
Housing Structures in Brunswick
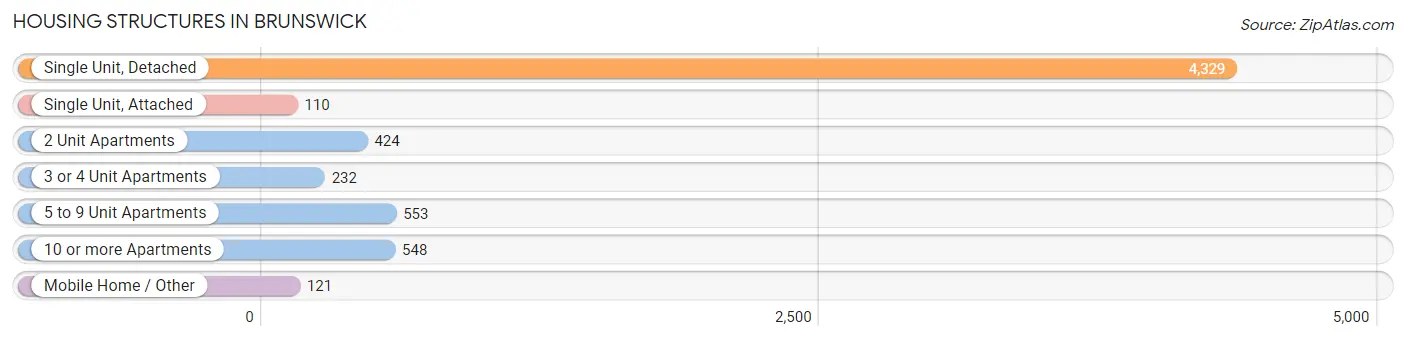
| Structure Type | # Housing Units | % Housing Units |
| Single Unit, Detached | 4,329 | 68.5% |
| Single Unit, Attached | 110 | 1.7% |
| 2 Unit Apartments | 424 | 6.7% |
| 3 or 4 Unit Apartments | 232 | 3.7% |
| 5 to 9 Unit Apartments | 553 | 8.7% |
| 10 or more Apartments | 548 | 8.7% |
| Mobile Home / Other | 121 | 1.9% |
| Total | 6,317 | 100.0% |
Housing Structures by Occupancy in Brunswick
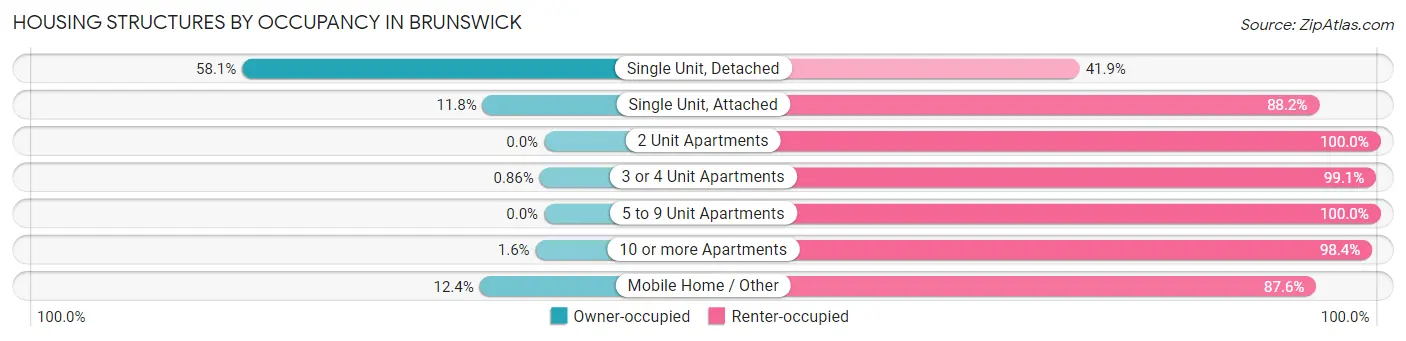
| Structure Type | Owner-occupied | Renter-occupied |
| Single Unit, Detached | 2,516 (58.1%) | 1,813 (41.9%) |
| Single Unit, Attached | 13 (11.8%) | 97 (88.2%) |
| 2 Unit Apartments | 0 (0.0%) | 424 (100.0%) |
| 3 or 4 Unit Apartments | 2 (0.9%) | 230 (99.1%) |
| 5 to 9 Unit Apartments | 0 (0.0%) | 553 (100.0%) |
| 10 or more Apartments | 9 (1.6%) | 539 (98.4%) |
| Mobile Home / Other | 15 (12.4%) | 106 (87.6%) |
| Total | 2,555 (40.5%) | 3,762 (59.6%) |
Housing Structures by Number of Rooms in Brunswick
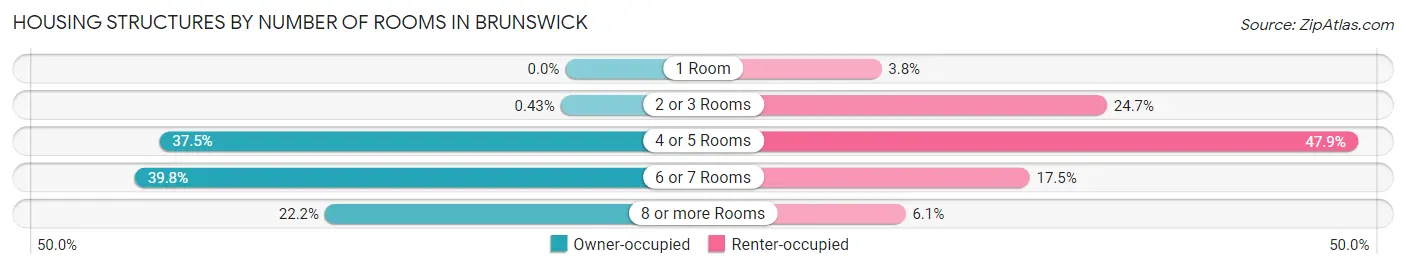
| Number of Rooms | Owner-occupied | Renter-occupied |
| 1 Room | 0 (0.0%) | 144 (3.8%) |
| 2 or 3 Rooms | 11 (0.4%) | 929 (24.7%) |
| 4 or 5 Rooms | 959 (37.5%) | 1,801 (47.9%) |
| 6 or 7 Rooms | 1,017 (39.8%) | 660 (17.5%) |
| 8 or more Rooms | 568 (22.2%) | 228 (6.1%) |
| Total | 2,555 (100.0%) | 3,762 (100.0%) |
Housing Structure by Heating Type in Brunswick

| Heating Type | Owner-occupied | Renter-occupied |
| Utility Gas | 494 (19.3%) | 396 (10.5%) |
| Bottled, Tank, or LP Gas | 128 (5.0%) | 14 (0.4%) |
| Electricity | 1,880 (73.6%) | 3,220 (85.6%) |
| Fuel Oil or Kerosene | 0 (0.0%) | 0 (0.0%) |
| Coal or Coke | 0 (0.0%) | 0 (0.0%) |
| All other Fuels | 15 (0.6%) | 0 (0.0%) |
| No Fuel Used | 38 (1.5%) | 132 (3.5%) |
| Total | 2,555 (100.0%) | 3,762 (100.0%) |
Household Vehicle Usage in Brunswick
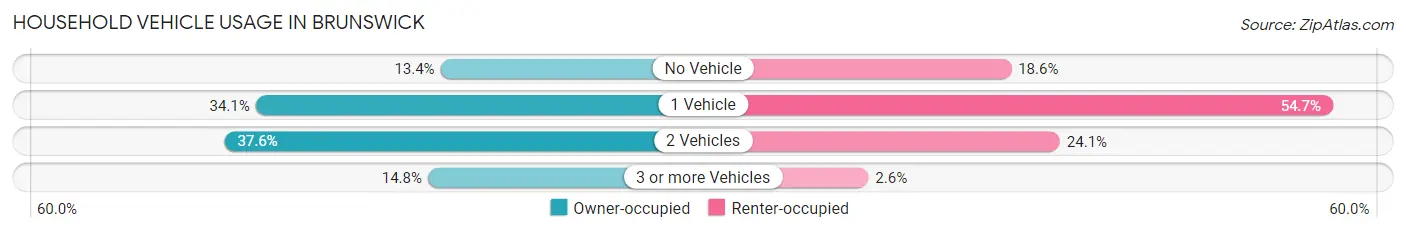
| Vehicles per Household | Owner-occupied | Renter-occupied |
| No Vehicle | 343 (13.4%) | 701 (18.6%) |
| 1 Vehicle | 872 (34.1%) | 2,056 (54.6%) |
| 2 Vehicles | 961 (37.6%) | 906 (24.1%) |
| 3 or more Vehicles | 379 (14.8%) | 99 (2.6%) |
| Total | 2,555 (100.0%) | 3,762 (100.0%) |
Real Estate & Mortgages in Brunswick
Real Estate and Mortgage Overview in Brunswick
| Characteristic | Without Mortgage | With Mortgage |
| Housing Units | 1,529 | 1,026 |
| Median Property Value | $98,200 | $125,600 |
| Median Household Income | $48,789 | $39 |
| Monthly Housing Costs | $383 | $0 |
| Real Estate Taxes | $838 | $74 |
Property Value by Mortgage Status in Brunswick
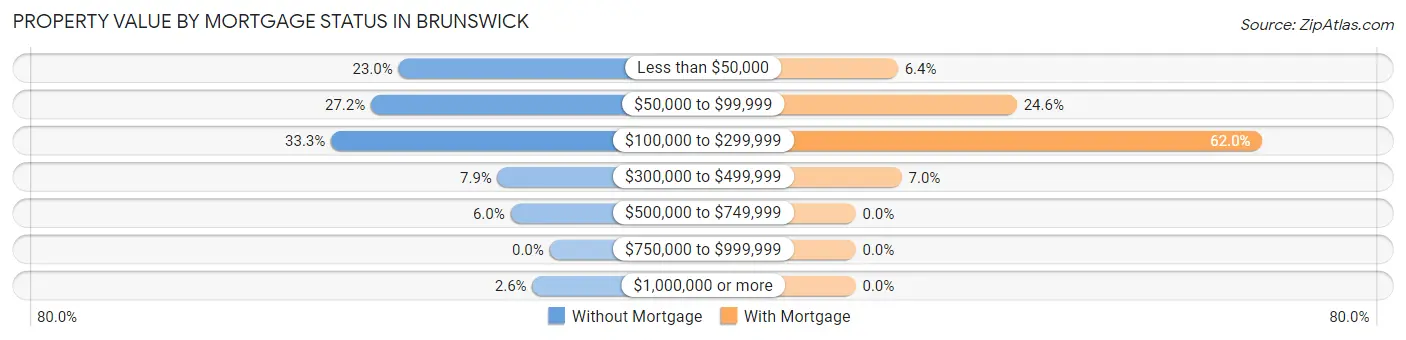
| Property Value | Without Mortgage | With Mortgage |
| Less than $50,000 | 352 (23.0%) | 66 (6.4%) |
| $50,000 to $99,999 | 416 (27.2%) | 252 (24.6%) |
| $100,000 to $299,999 | 509 (33.3%) | 636 (62.0%) |
| $300,000 to $499,999 | 121 (7.9%) | 72 (7.0%) |
| $500,000 to $749,999 | 91 (5.9%) | 0 (0.0%) |
| $750,000 to $999,999 | 0 (0.0%) | 0 (0.0%) |
| $1,000,000 or more | 40 (2.6%) | 0 (0.0%) |
| Total | 1,529 (100.0%) | 1,026 (100.0%) |
Household Income by Mortgage Status in Brunswick
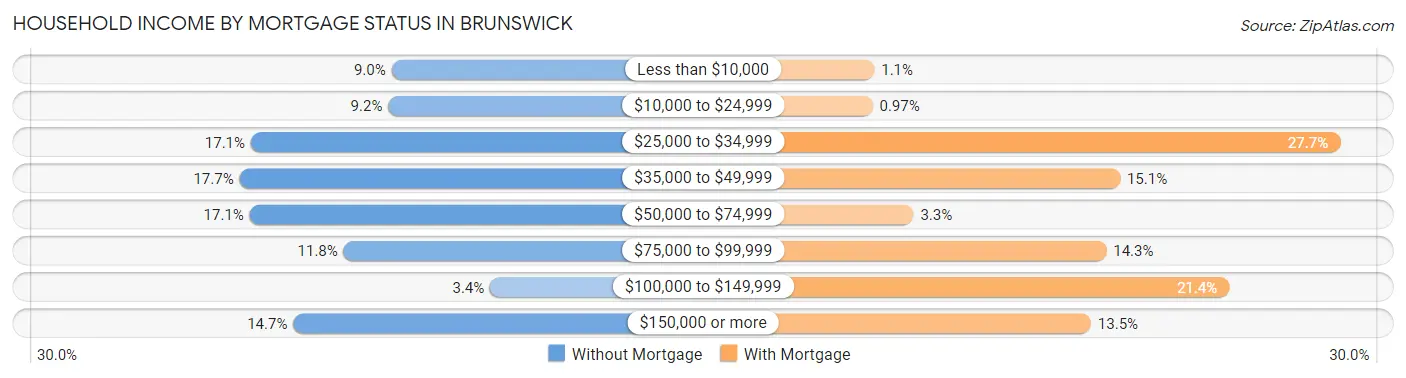
| Household Income | Without Mortgage | With Mortgage |
| Less than $10,000 | 138 (9.0%) | 11 (1.1%) |
| $10,000 to $24,999 | 141 (9.2%) | 10 (1.0%) |
| $25,000 to $34,999 | 261 (17.1%) | 284 (27.7%) |
| $35,000 to $49,999 | 271 (17.7%) | 155 (15.1%) |
| $50,000 to $74,999 | 262 (17.1%) | 34 (3.3%) |
| $75,000 to $99,999 | 180 (11.8%) | 147 (14.3%) |
| $100,000 to $149,999 | 52 (3.4%) | 219 (21.3%) |
| $150,000 or more | 224 (14.6%) | 138 (13.5%) |
| Total | 1,529 (100.0%) | 1,026 (100.0%) |
Property Value to Household Income Ratio in Brunswick
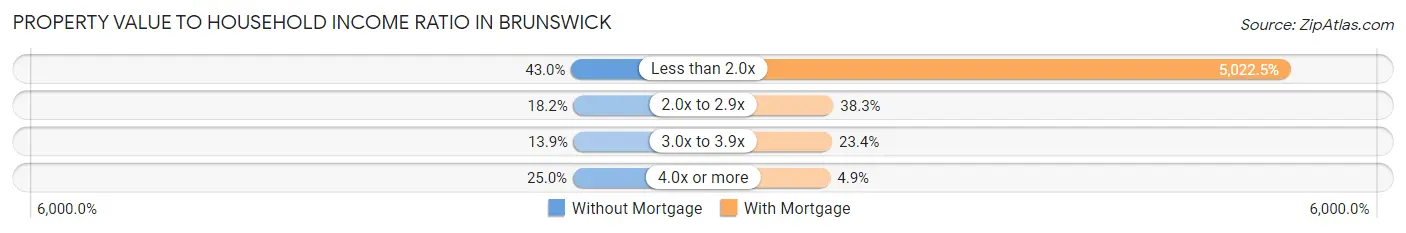
| Value-to-Income Ratio | Without Mortgage | With Mortgage |
| Less than 2.0x | 657 (43.0%) | 51,531 (5,022.5%) |
| 2.0x to 2.9x | 278 (18.2%) | 393 (38.3%) |
| 3.0x to 3.9x | 212 (13.9%) | 240 (23.4%) |
| 4.0x or more | 382 (25.0%) | 50 (4.9%) |
| Total | 1,529 (100.0%) | 1,026 (100.0%) |
Real Estate Taxes by Mortgage Status in Brunswick
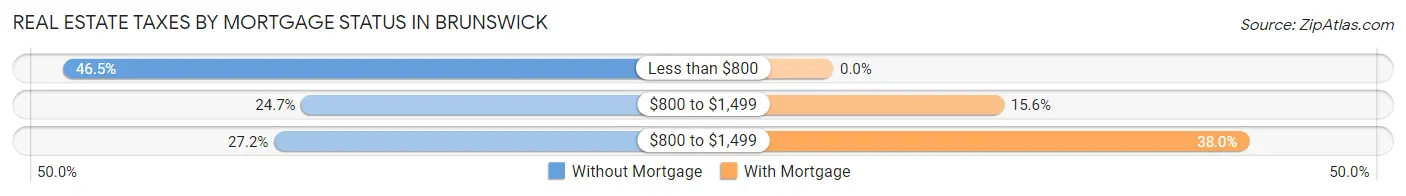
| Property Taxes | Without Mortgage | With Mortgage |
| Less than $800 | 711 (46.5%) | 0 (0.0%) |
| $800 to $1,499 | 378 (24.7%) | 160 (15.6%) |
| $800 to $1,499 | 416 (27.2%) | 390 (38.0%) |
| Total | 1,529 (100.0%) | 1,026 (100.0%) |
Health & Disability in Brunswick
Health Insurance Coverage by Age in Brunswick
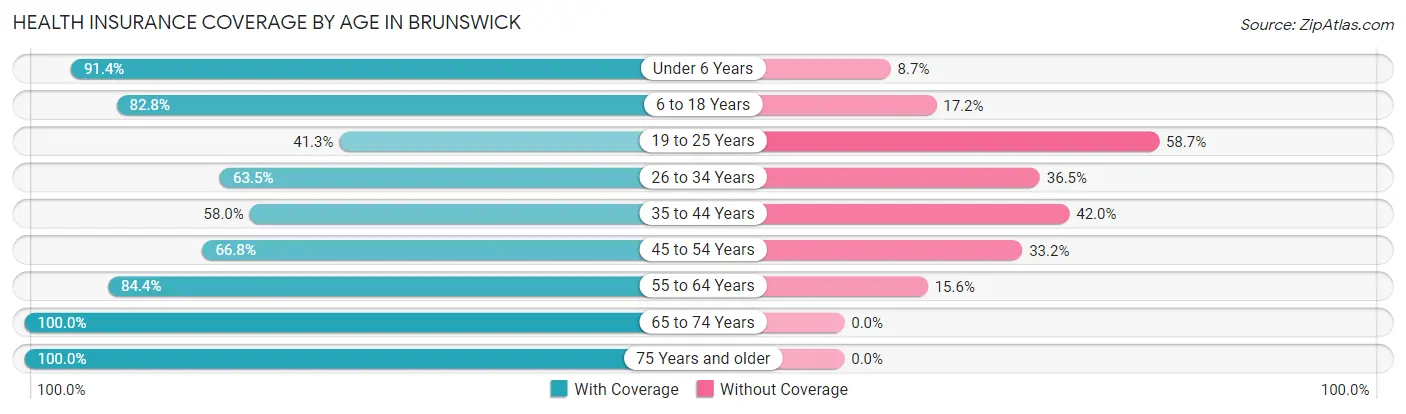
| Age Bracket | With Coverage | Without Coverage |
| Under 6 Years | 1,088 (91.3%) | 103 (8.6%) |
| 6 to 18 Years | 2,129 (82.8%) | 441 (17.2%) |
| 19 to 25 Years | 512 (41.3%) | 727 (58.7%) |
| 26 to 34 Years | 1,249 (63.5%) | 717 (36.5%) |
| 35 to 44 Years | 1,130 (58.0%) | 817 (42.0%) |
| 45 to 54 Years | 886 (66.8%) | 440 (33.2%) |
| 55 to 64 Years | 1,737 (84.4%) | 320 (15.6%) |
| 65 to 74 Years | 1,335 (100.0%) | 0 (0.0%) |
| 75 Years and older | 1,123 (100.0%) | 0 (0.0%) |
| Total | 11,189 (75.8%) | 3,565 (24.2%) |
Health Insurance Coverage by Citizenship Status in Brunswick
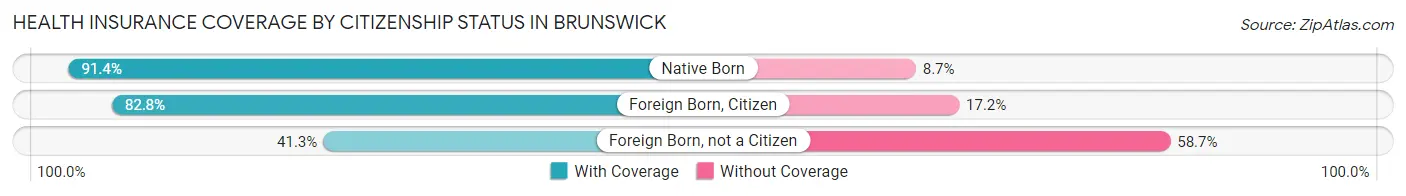
| Citizenship Status | With Coverage | Without Coverage |
| Native Born | 1,088 (91.3%) | 103 (8.6%) |
| Foreign Born, Citizen | 2,129 (82.8%) | 441 (17.2%) |
| Foreign Born, not a Citizen | 512 (41.3%) | 727 (58.7%) |
Health Insurance Coverage by Household Income in Brunswick
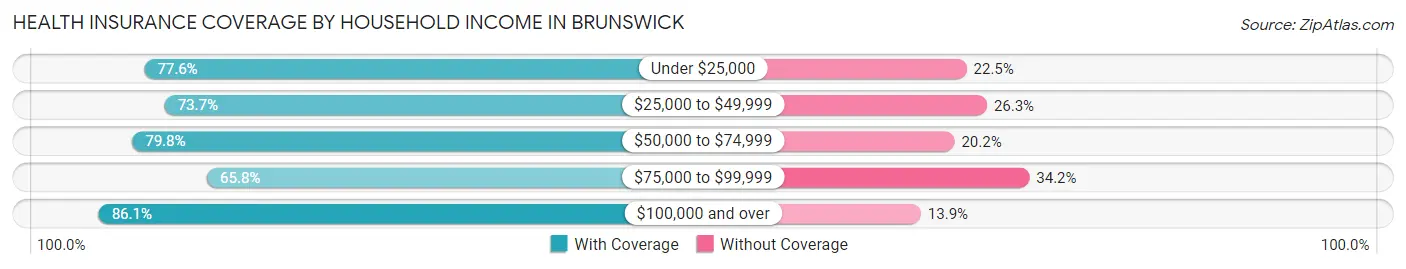
| Household Income | With Coverage | Without Coverage |
| Under $25,000 | 3,627 (77.5%) | 1,050 (22.5%) |
| $25,000 to $49,999 | 3,162 (73.7%) | 1,126 (26.3%) |
| $50,000 to $74,999 | 1,558 (79.8%) | 394 (20.2%) |
| $75,000 to $99,999 | 1,325 (65.8%) | 689 (34.2%) |
| $100,000 and over | 1,500 (86.1%) | 242 (13.9%) |
Public vs Private Health Insurance Coverage by Age in Brunswick
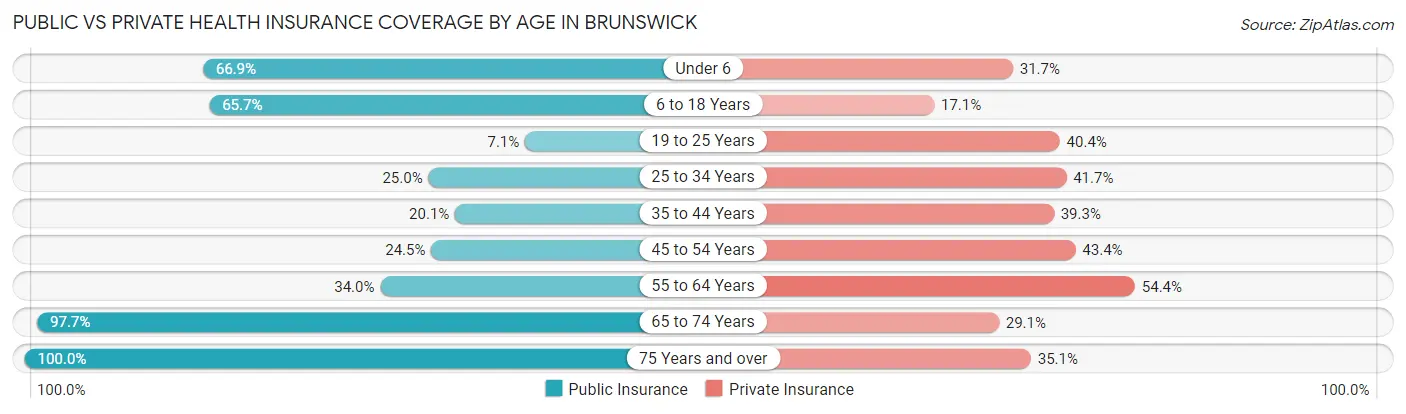
| Age Bracket | Public Insurance | Private Insurance |
| Under 6 | 797 (66.9%) | 378 (31.7%) |
| 6 to 18 Years | 1,689 (65.7%) | 440 (17.1%) |
| 19 to 25 Years | 88 (7.1%) | 501 (40.4%) |
| 25 to 34 Years | 492 (25.0%) | 819 (41.7%) |
| 35 to 44 Years | 391 (20.1%) | 766 (39.3%) |
| 45 to 54 Years | 325 (24.5%) | 575 (43.4%) |
| 55 to 64 Years | 699 (34.0%) | 1,119 (54.4%) |
| 65 to 74 Years | 1,304 (97.7%) | 389 (29.1%) |
| 75 Years and over | 1,123 (100.0%) | 394 (35.1%) |
| Total | 6,908 (46.8%) | 5,381 (36.5%) |
Disability Status by Sex by Age in Brunswick
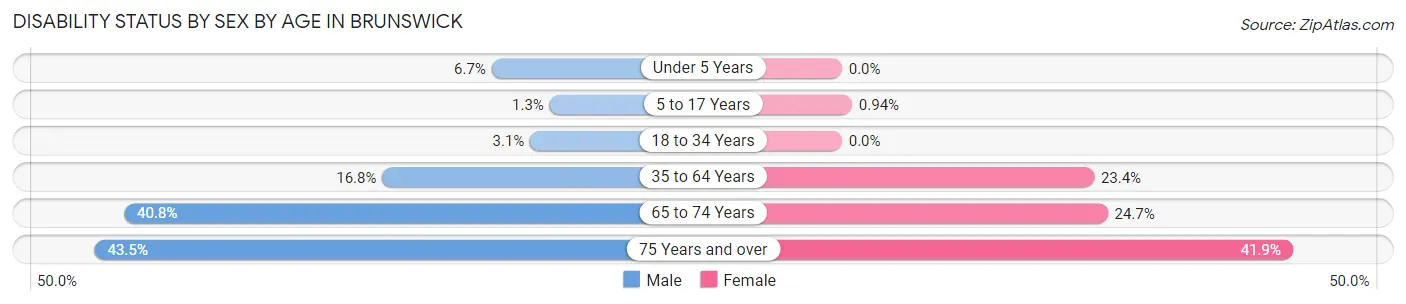
| Age Bracket | Male | Female |
| Under 5 Years | 33 (6.7%) | 0 (0.0%) |
| 5 to 17 Years | 13 (1.3%) | 13 (0.9%) |
| 18 to 34 Years | 56 (3.1%) | 0 (0.0%) |
| 35 to 64 Years | 370 (16.8%) | 732 (23.4%) |
| 65 to 74 Years | 212 (40.8%) | 201 (24.7%) |
| 75 Years and over | 211 (43.5%) | 267 (41.8%) |
Disability Class by Sex by Age in Brunswick
Disability Class: Hearing Difficulty
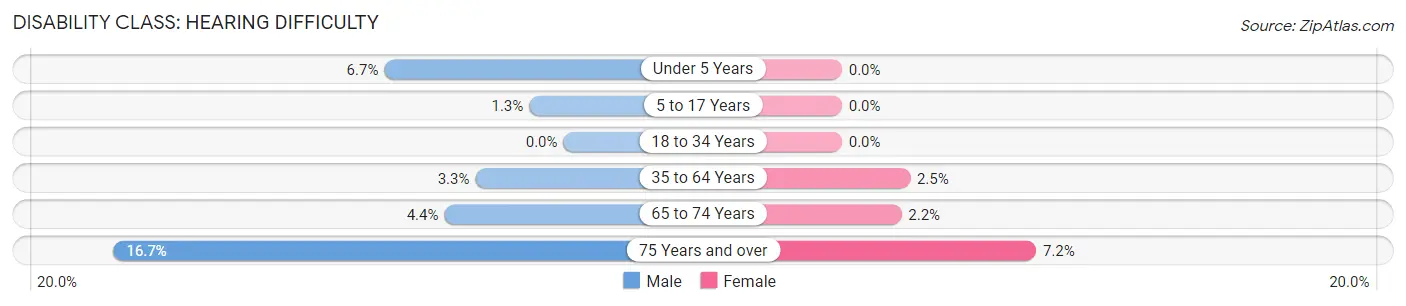
| Age Bracket | Male | Female |
| Under 5 Years | 33 (6.7%) | 0 (0.0%) |
| 5 to 17 Years | 13 (1.3%) | 0 (0.0%) |
| 18 to 34 Years | 0 (0.0%) | 0 (0.0%) |
| 35 to 64 Years | 72 (3.3%) | 79 (2.5%) |
| 65 to 74 Years | 23 (4.4%) | 18 (2.2%) |
| 75 Years and over | 81 (16.7%) | 46 (7.2%) |
Disability Class: Vision Difficulty
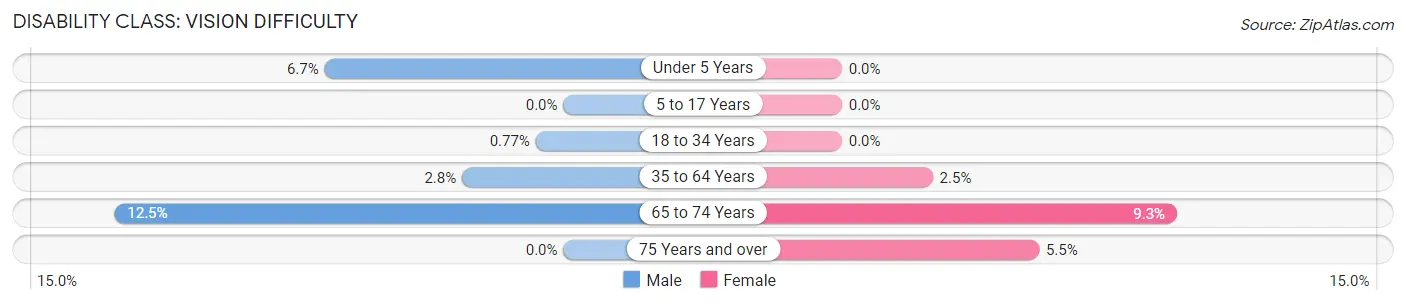
| Age Bracket | Male | Female |
| Under 5 Years | 33 (6.7%) | 0 (0.0%) |
| 5 to 17 Years | 0 (0.0%) | 0 (0.0%) |
| 18 to 34 Years | 14 (0.8%) | 0 (0.0%) |
| 35 to 64 Years | 62 (2.8%) | 79 (2.5%) |
| 65 to 74 Years | 65 (12.5%) | 76 (9.3%) |
| 75 Years and over | 0 (0.0%) | 35 (5.5%) |
Disability Class: Cognitive Difficulty
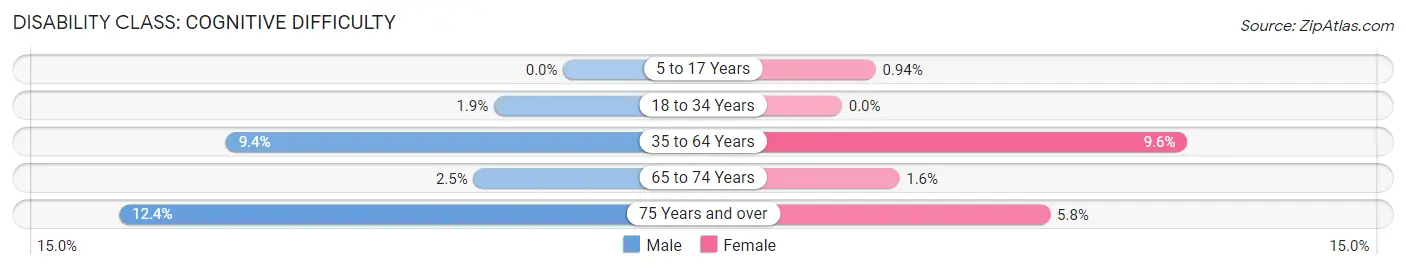
| Age Bracket | Male | Female |
| 5 to 17 Years | 0 (0.0%) | 13 (0.9%) |
| 18 to 34 Years | 35 (1.9%) | 0 (0.0%) |
| 35 to 64 Years | 207 (9.4%) | 301 (9.6%) |
| 65 to 74 Years | 13 (2.5%) | 13 (1.6%) |
| 75 Years and over | 60 (12.4%) | 37 (5.8%) |
Disability Class: Ambulatory Difficulty
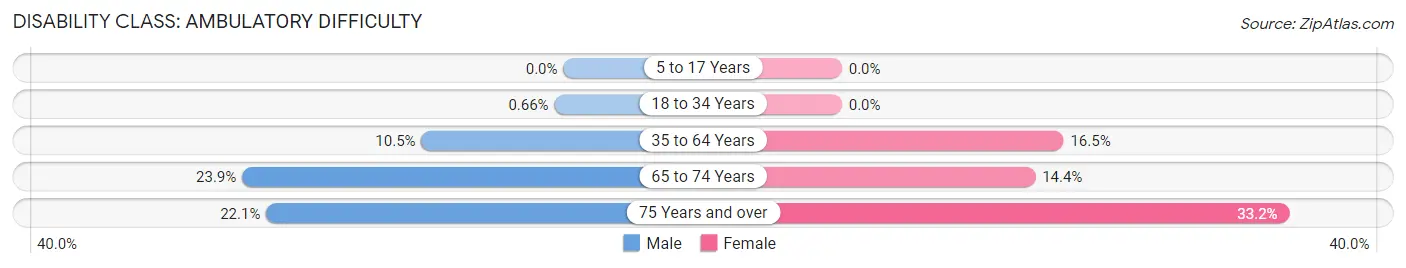
| Age Bracket | Male | Female |
| 5 to 17 Years | 0 (0.0%) | 0 (0.0%) |
| 18 to 34 Years | 12 (0.7%) | 0 (0.0%) |
| 35 to 64 Years | 232 (10.5%) | 515 (16.5%) |
| 65 to 74 Years | 124 (23.8%) | 117 (14.4%) |
| 75 Years and over | 107 (22.1%) | 212 (33.2%) |
Disability Class: Self-Care Difficulty
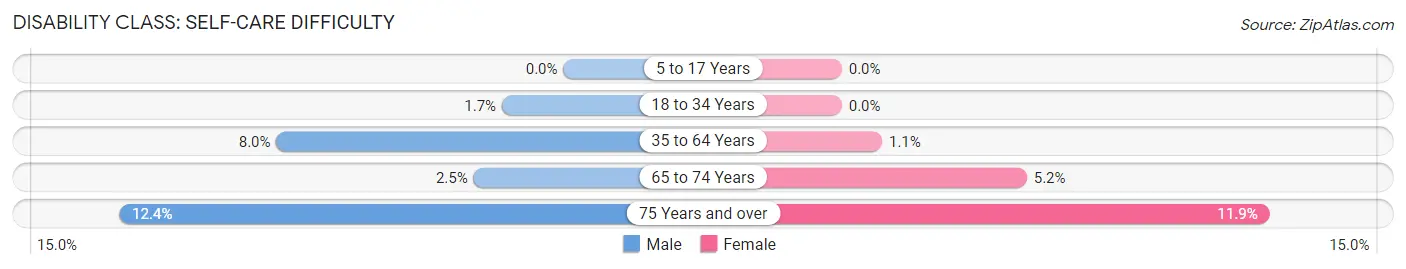
| Age Bracket | Male | Female |
| 5 to 17 Years | 0 (0.0%) | 0 (0.0%) |
| 18 to 34 Years | 31 (1.7%) | 0 (0.0%) |
| 35 to 64 Years | 176 (8.0%) | 35 (1.1%) |
| 65 to 74 Years | 13 (2.5%) | 42 (5.1%) |
| 75 Years and over | 60 (12.4%) | 76 (11.9%) |
Technology Access in Brunswick
Computing Device Access in Brunswick
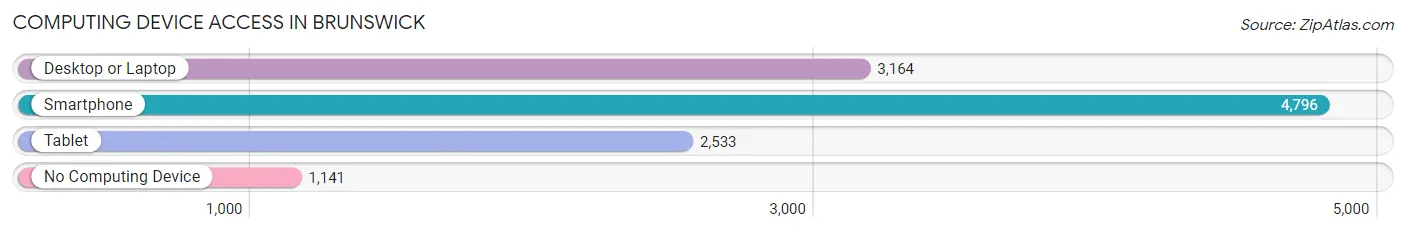
| Device Type | # Households | % Households |
| Desktop or Laptop | 3,164 | 50.1% |
| Smartphone | 4,796 | 75.9% |
| Tablet | 2,533 | 40.1% |
| No Computing Device | 1,141 | 18.1% |
| Total | 6,317 | 100.0% |
Internet Access in Brunswick
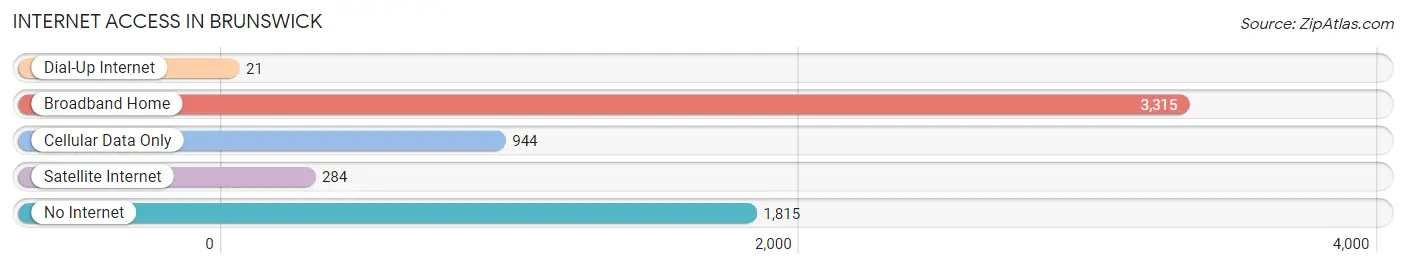
| Internet Type | # Households | % Households |
| Dial-Up Internet | 21 | 0.3% |
| Broadband Home | 3,315 | 52.5% |
| Cellular Data Only | 944 | 14.9% |
| Satellite Internet | 284 | 4.5% |
| No Internet | 1,815 | 28.7% |
| Total | 6,317 | 100.0% |
Brunswick Summary
Brunswick is a city located in Glynn County, Georgia, United States. It is the county seat of Glynn County and is located on the southeastern coast of the state. The population of Brunswick was 15,383 at the 2010 census, making it the second-largest city in the state after Savannah.
History
Brunswick was founded in 1771 by the British as a military outpost and trading post. It was named after the German city of Braunschweig, which was the ancestral home of the House of Hanover. The city was incorporated in 1856 and became a major port for the export of cotton and other goods. During the American Civil War, the city was occupied by Union forces and served as a major supply depot. After the war, the city experienced a period of growth and prosperity, becoming a major center for the production of naval stores and lumber.
In the late 19th century, Brunswick was a popular tourist destination, with many visitors coming to enjoy the city's beaches and resorts. The city was also home to a thriving African-American community, which included a number of prominent African-American businesses and churches.
In the early 20th century, the city experienced a period of decline, as the lumber industry declined and the city's population decreased. In the 1950s, the city began to experience a period of revitalization, as new industries and businesses moved into the area. Today, Brunswick is a vibrant city with a diverse economy and a growing population.
Geography
Brunswick is located on the southeastern coast of Georgia, at the mouth of the Altamaha River. The city is situated on a peninsula between the Atlantic Ocean and the Altamaha River. The city is bordered to the north by the city of St. Simons Island, to the east by the Atlantic Ocean, to the south by the city of Jekyll Island, and to the west by the city of Darien.
The city has a total area of 24.3 square miles, of which 22.2 square miles is land and 2.1 square miles is water. The city is located in the humid subtropical climate zone, with hot, humid summers and mild winters.
Economy
Brunswick is a major port city and is home to a number of industries, including shipbuilding, seafood processing, and tourism. The city is also home to a number of corporate headquarters, including the Georgia-Pacific Corporation, the Georgia Ports Authority, and the Brunswick Corporation.
The city is also home to a number of educational institutions, including the College of Coastal Georgia, the Brunswick Campus of the University of Georgia, and the Brunswick Technical College.
Demographics
As of the 2010 census, the population of Brunswick was 15,383. The racial makeup of the city was 57.3% White, 34.2% African American, 0.5% Native American, 1.3% Asian, 0.1% Pacific Islander, 4.2% from other races, and 2.4% from two or more races. Hispanic or Latino of any race were 8.2% of the population.
The median income for a household in the city was $37,845, and the median income for a family was $45,945. The per capita income for the city was $20,945. About 17.2% of families and 20.7% of the population were below the poverty line, including 28.2% of those under age 18 and 11.2% of those age 65 or over.
Common Questions
What is Per Capita Income in Brunswick?
Per Capita income in Brunswick is $25,365.
What is the Median Family Income in Brunswick?
Median Family Income in Brunswick is $45,316.
What is the Median Household income in Brunswick?
Median Household Income in Brunswick is $29,781.
What is Income or Wage Gap in Brunswick?
Income or Wage Gap in Brunswick is 17.4%.
Women in Brunswick earn 82.6 cents for every dollar earned by a man.
What is Inequality or Gini Index in Brunswick?
Inequality or Gini Index in Brunswick is 0.57.
What is the Total Population of Brunswick?
Total Population of Brunswick is 15,243.
What is the Total Male Population of Brunswick?
Total Male Population of Brunswick is 6,799.
What is the Total Female Population of Brunswick?
Total Female Population of Brunswick is 8,444.
What is the Ratio of Males per 100 Females in Brunswick?
There are 80.52 Males per 100 Females in Brunswick.
What is the Ratio of Females per 100 Males in Brunswick?
There are 124.19 Females per 100 Males in Brunswick.
What is the Median Population Age in Brunswick?
Median Population Age in Brunswick is 37.2 Years.
What is the Average Family Size in Brunswick
Average Family Size in Brunswick is 3.1 People.
What is the Average Household Size in Brunswick
Average Household Size in Brunswick is 2.3 People.
How Large is the Labor Force in Brunswick?
There are 6,587 People in the Labor Forcein in Brunswick.
What is the Percentage of People in the Labor Force in Brunswick?
54.2% of People are in the Labor Force in Brunswick.
What is the Unemployment Rate in Brunswick?
Unemployment Rate in Brunswick is 9.1%.