Summertown, GA Map & Demographics
Summertown Map
Summertown Overview
$19,870
PER CAPITA INCOME
$94,063
AVG FAMILY INCOME
0.33
INEQUALITY / GINI INDEX
260
TOTAL POPULATION
164
MALE POPULATION
96
FEMALE POPULATION
170.83
MALES / 100 FEMALES
58.54
FEMALES / 100 MALES
39.0
MEDIAN AGE
4.2
AVG FAMILY SIZE
3.6
AVG HOUSEHOLD SIZE
86
LABOR FORCE [ PEOPLE ]
54.8%
PERCENT IN LABOR FORCE
19.8%
UNEMPLOYMENT RATE
Income in Summertown
Income Overview in Summertown
| Characteristic | Number | Measure |
| Per Capita Income | 260 | $19,870 |
| Median Family Income | 57 | $94,063 |
| Mean Family Income | 57 | $75,798 |
| Median Household Income | 72 | $0 |
| Mean Household Income | 72 | $68,843 |
| Income Deficit | 57 | $0 |
| Wage / Income Gap (%) | 260 | 0.00% |
| Wage / Income Gap ($) | 260 | 100.00¢ per $1 |
| Gini / Inequality Index | 260 | 0.33 |
Earnings by Sex in Summertown
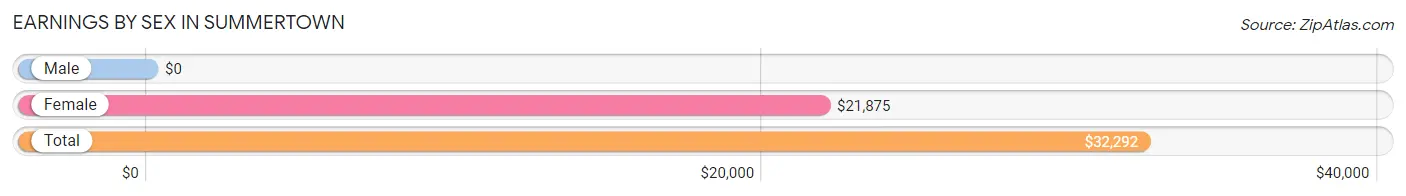
| Sex | Number | Average Earnings |
| Male | 63 (70.8%) | $0 |
| Female | 26 (29.2%) | $21,875 |
| Total | 89 (100.0%) | $32,292 |
Earnings by Sex by Income Bracket in Summertown
The most common earnings brackets in Summertown are $65,000 to $74,999 for men (23 | 36.5%) and $30,000 to $34,999 for women (6 | 23.1%).
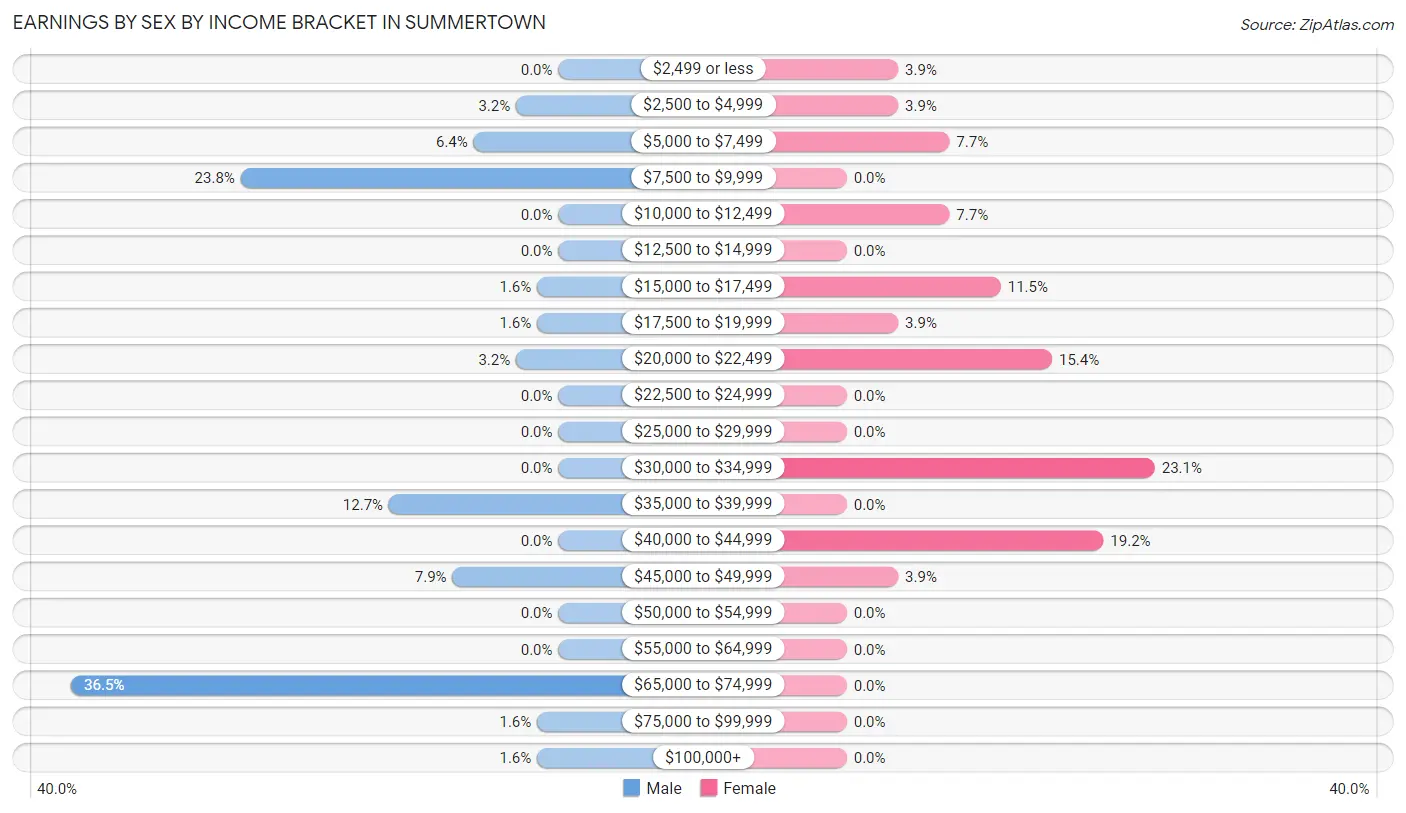
| Income | Male | Female |
| $2,499 or less | 0 (0.0%) | 1 (3.8%) |
| $2,500 to $4,999 | 2 (3.2%) | 1 (3.8%) |
| $5,000 to $7,499 | 4 (6.4%) | 2 (7.7%) |
| $7,500 to $9,999 | 15 (23.8%) | 0 (0.0%) |
| $10,000 to $12,499 | 0 (0.0%) | 2 (7.7%) |
| $12,500 to $14,999 | 0 (0.0%) | 0 (0.0%) |
| $15,000 to $17,499 | 1 (1.6%) | 3 (11.5%) |
| $17,500 to $19,999 | 1 (1.6%) | 1 (3.8%) |
| $20,000 to $22,499 | 2 (3.2%) | 4 (15.4%) |
| $22,500 to $24,999 | 0 (0.0%) | 0 (0.0%) |
| $25,000 to $29,999 | 0 (0.0%) | 0 (0.0%) |
| $30,000 to $34,999 | 0 (0.0%) | 6 (23.1%) |
| $35,000 to $39,999 | 8 (12.7%) | 0 (0.0%) |
| $40,000 to $44,999 | 0 (0.0%) | 5 (19.2%) |
| $45,000 to $49,999 | 5 (7.9%) | 1 (3.8%) |
| $50,000 to $54,999 | 0 (0.0%) | 0 (0.0%) |
| $55,000 to $64,999 | 0 (0.0%) | 0 (0.0%) |
| $65,000 to $74,999 | 23 (36.5%) | 0 (0.0%) |
| $75,000 to $99,999 | 1 (1.6%) | 0 (0.0%) |
| $100,000+ | 1 (1.6%) | 0 (0.0%) |
| Total | 63 (100.0%) | 26 (100.0%) |
Earnings by Sex by Educational Attainment in Summertown
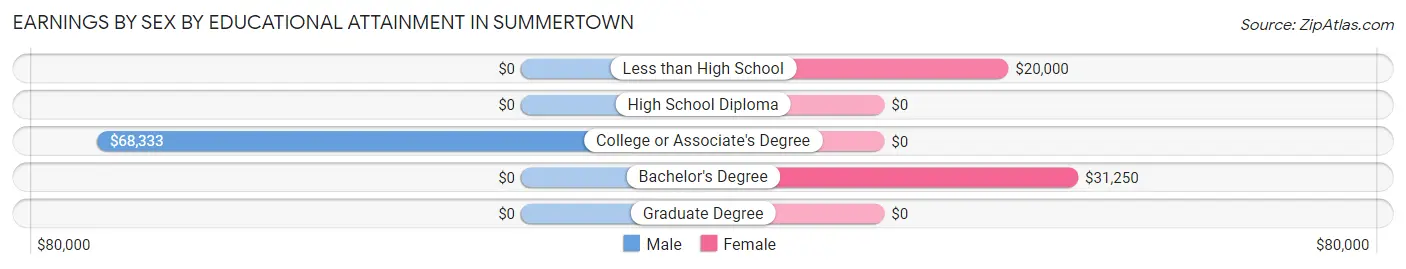
| Educational Attainment | Male Income | Female Income |
| Less than High School | - | - |
| High School Diploma | - | - |
| College or Associate's Degree | $68,333 | $0 |
| Bachelor's Degree | - | - |
| Graduate Degree | - | - |
| Total | - | - |
Family Income in Summertown
Family Income Brackets in Summertown
According to the Summertown family income data, there are 20 families falling into the $100,000 to $149,999 income range, which is the most common income bracket and makes up 35.1% of all families.
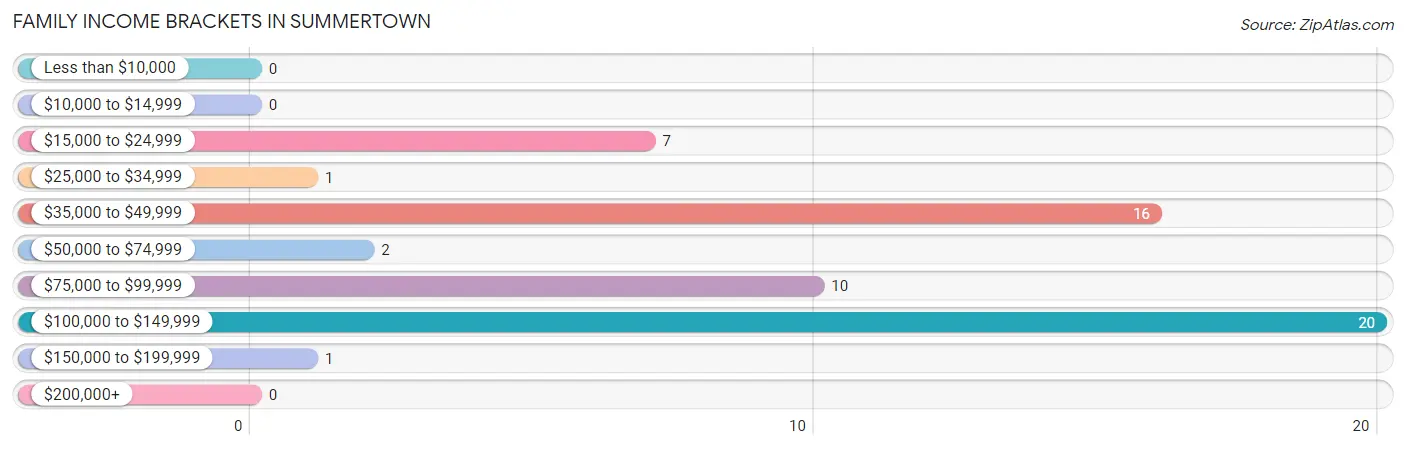
| Income Bracket | # Families | % Families |
| Less than $10,000 | 0 | 0.0% |
| $10,000 to $14,999 | 0 | 0.0% |
| $15,000 to $24,999 | 7 | 12.3% |
| $25,000 to $34,999 | 1 | 1.8% |
| $35,000 to $49,999 | 16 | 28.1% |
| $50,000 to $74,999 | 2 | 3.5% |
| $75,000 to $99,999 | 10 | 17.5% |
| $100,000 to $149,999 | 20 | 35.1% |
| $150,000 to $199,999 | 1 | 1.8% |
| $200,000+ | 0 | 0.0% |
Family Income by Famaliy Size in Summertown
2-person families (21 | 36.8%) account for the highest median family income in Summertown with $46,875 per family, while 2-person families (21 | 36.8%) have the highest median income of $23,438 per family member.
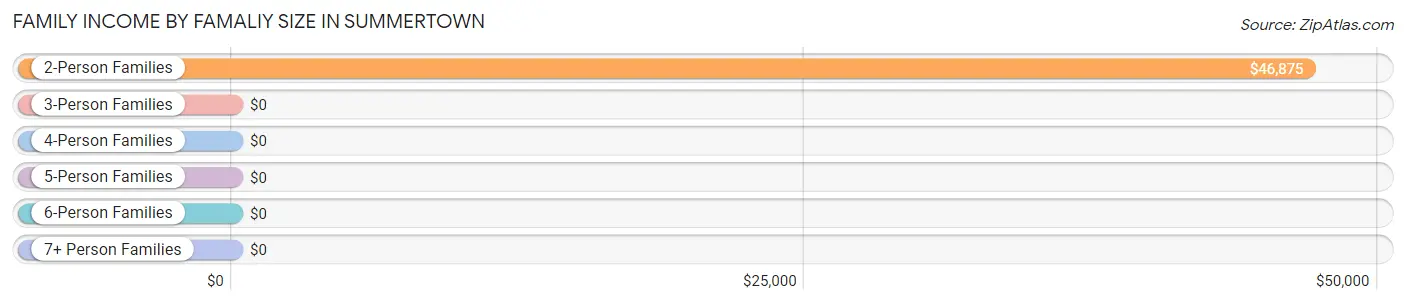
| Income Bracket | # Families | Median Income |
| 2-Person Families | 21 (36.8%) | $46,875 |
| 3-Person Families | 24 (42.1%) | $0 |
| 4-Person Families | 1 (1.8%) | $0 |
| 5-Person Families | 2 (3.5%) | $0 |
| 6-Person Families | 1 (1.8%) | $0 |
| 7+ Person Families | 8 (14.0%) | $0 |
| Total | 57 (100.0%) | $94,063 |
Family Income by Number of Earners in Summertown
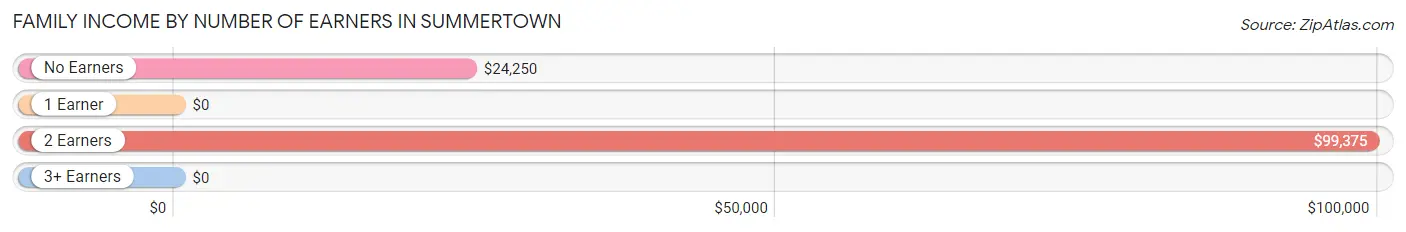
| Number of Earners | # Families | Median Income |
| No Earners | 11 (19.3%) | $24,250 |
| 1 Earner | 23 (40.4%) | $0 |
| 2 Earners | 21 (36.8%) | $99,375 |
| 3+ Earners | 2 (3.5%) | $0 |
| Total | 57 (100.0%) | $94,063 |
Household Income in Summertown
Household Income Brackets in Summertown
With 23 households falling in the category, the $100,000 to $149,999 income range is the most frequent in Summertown, accounting for 31.9% of all households.
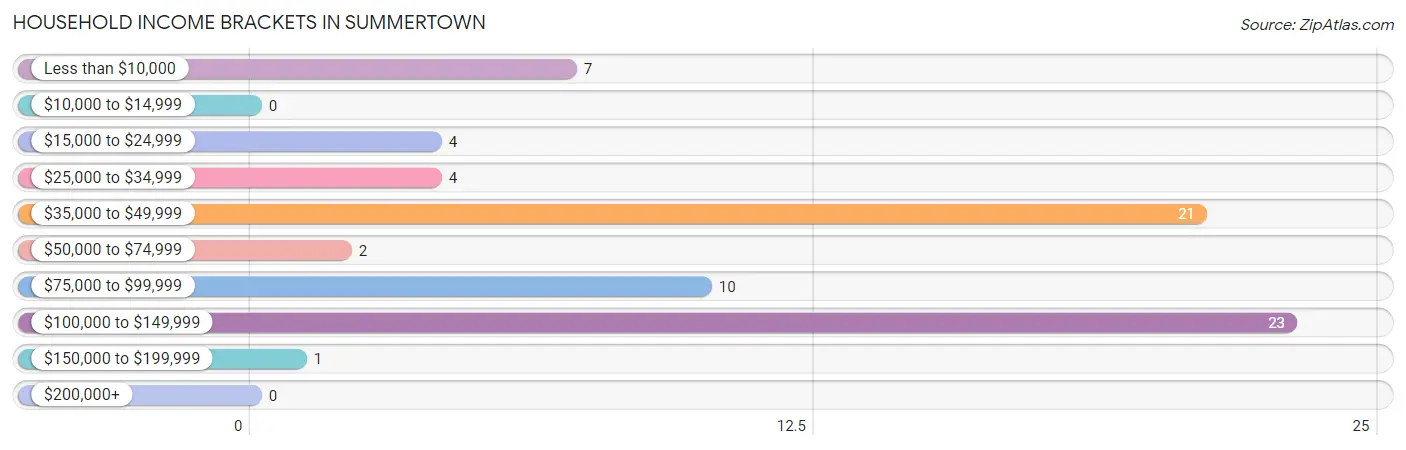
| Income Bracket | # Households | % Households |
| Less than $10,000 | 7 | 9.7% |
| $10,000 to $14,999 | 0 | 0.0% |
| $15,000 to $24,999 | 4 | 5.6% |
| $25,000 to $34,999 | 4 | 5.6% |
| $35,000 to $49,999 | 21 | 29.2% |
| $50,000 to $74,999 | 2 | 2.8% |
| $75,000 to $99,999 | 10 | 13.9% |
| $100,000 to $149,999 | 23 | 31.9% |
| $150,000 to $199,999 | 1 | 1.4% |
| $200,000+ | 0 | 0.0% |
Household Income by Householder Age in Summertown
The median household income in Summertown is $0, with the highest median household income of $94,583 found in the 45 to 64 years age bracket for the primary householder. A total of 19 households (26.4%) fall into this category.
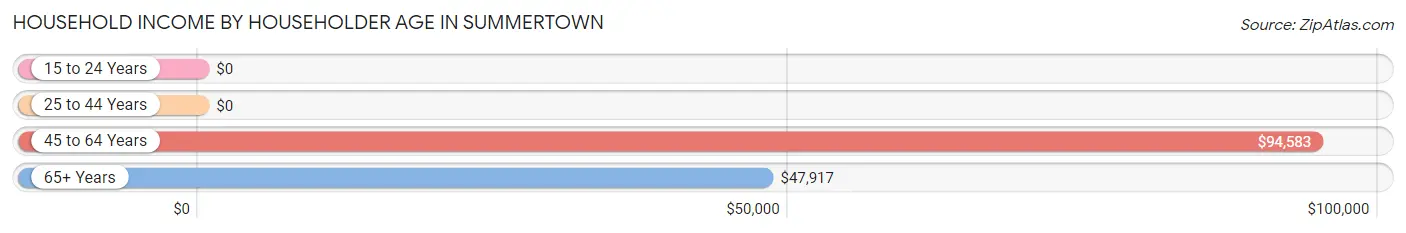
| Income Bracket | # Households | Median Income |
| 15 to 24 Years | 0 (0.0%) | $0 |
| 25 to 44 Years | 20 (27.8%) | $0 |
| 45 to 64 Years | 19 (26.4%) | $94,583 |
| 65+ Years | 33 (45.8%) | $47,917 |
| Total | 72 (100.0%) | $0 |
Poverty in Summertown
Income Below Poverty by Sex and Age in Summertown
With 35.4% poverty level for males and 1.0% for females among the residents of Summertown, 12 to 14 year old males and 65 to 74 year old females are the most vulnerable to poverty, with 31 males (81.6%) and 1 females (5.9%) in their respective age groups living below the poverty level.
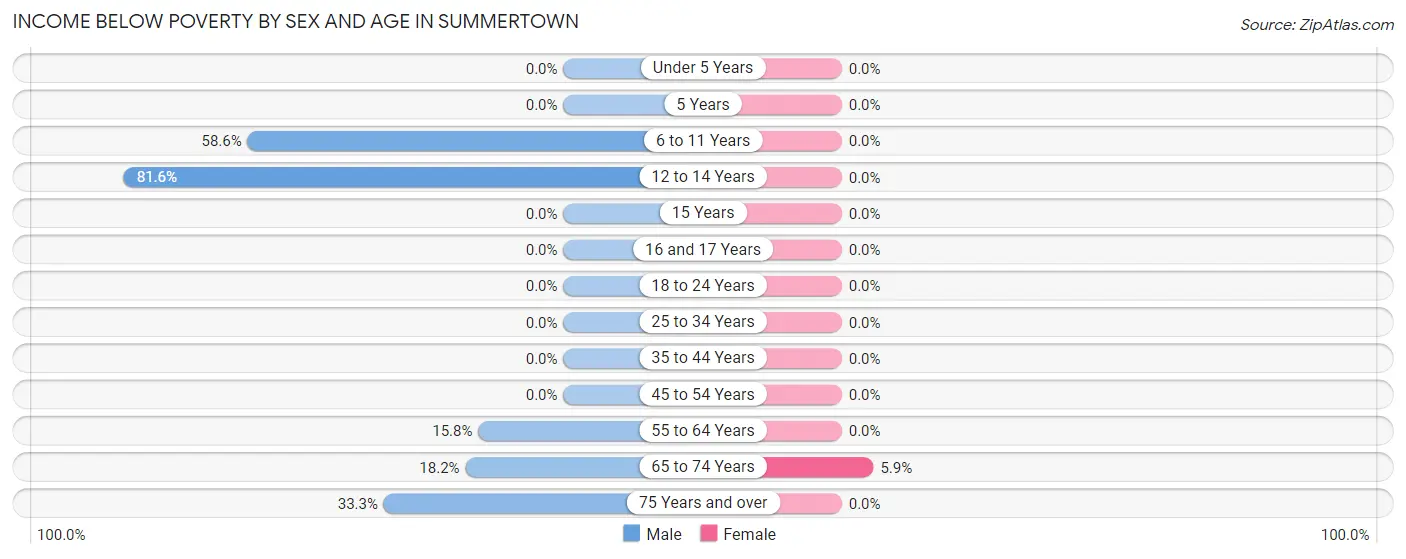
| Age Bracket | Male | Female |
| Under 5 Years | 0 (0.0%) | 0 (0.0%) |
| 5 Years | 0 (0.0%) | 0 (0.0%) |
| 6 to 11 Years | 17 (58.6%) | 0 (0.0%) |
| 12 to 14 Years | 31 (81.6%) | 0 (0.0%) |
| 15 Years | 0 (0.0%) | 0 (0.0%) |
| 16 and 17 Years | 0 (0.0%) | 0 (0.0%) |
| 18 to 24 Years | 0 (0.0%) | 0 (0.0%) |
| 25 to 34 Years | 0 (0.0%) | 0 (0.0%) |
| 35 to 44 Years | 0 (0.0%) | 0 (0.0%) |
| 45 to 54 Years | 0 (0.0%) | 0 (0.0%) |
| 55 to 64 Years | 3 (15.8%) | 0 (0.0%) |
| 65 to 74 Years | 4 (18.2%) | 1 (5.9%) |
| 75 Years and over | 3 (33.3%) | 0 (0.0%) |
| Total | 58 (35.4%) | 1 (1.0%) |
Income Above Poverty by Sex and Age in Summertown
According to the poverty statistics in Summertown, males aged under 5 years and females aged under 5 years are the age groups that are most secure financially, with 100.0% of males and 100.0% of females in these age groups living above the poverty line.
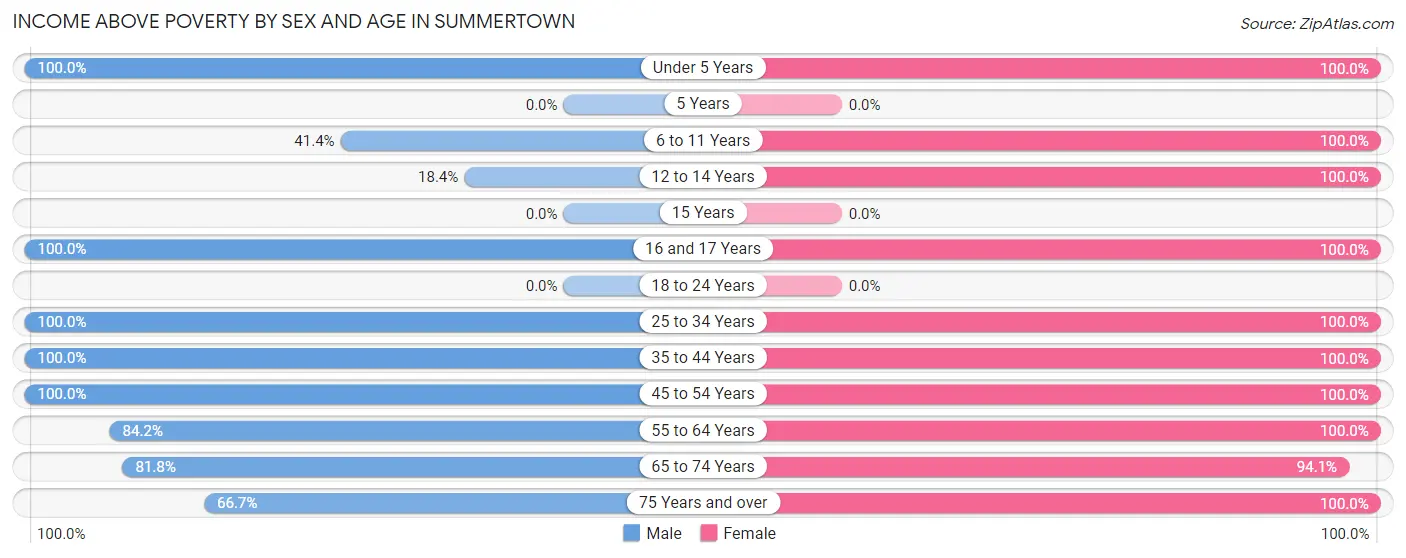
| Age Bracket | Male | Female |
| Under 5 Years | 6 (100.0%) | 12 (100.0%) |
| 5 Years | 0 (0.0%) | 0 (0.0%) |
| 6 to 11 Years | 12 (41.4%) | 6 (100.0%) |
| 12 to 14 Years | 7 (18.4%) | 12 (100.0%) |
| 15 Years | 0 (0.0%) | 0 (0.0%) |
| 16 and 17 Years | 2 (100.0%) | 1 (100.0%) |
| 18 to 24 Years | 0 (0.0%) | 0 (0.0%) |
| 25 to 34 Years | 9 (100.0%) | 8 (100.0%) |
| 35 to 44 Years | 14 (100.0%) | 10 (100.0%) |
| 45 to 54 Years | 16 (100.0%) | 2 (100.0%) |
| 55 to 64 Years | 16 (84.2%) | 20 (100.0%) |
| 65 to 74 Years | 18 (81.8%) | 16 (94.1%) |
| 75 Years and over | 6 (66.7%) | 8 (100.0%) |
| Total | 106 (64.6%) | 95 (99.0%) |
Income Below Poverty Among Married-Couple Families in Summertown
The poverty statistics for married-couple families in Summertown show that 3.8% or 1 of the total 26 families live below the poverty line. Families with 3 or 4 children have the highest poverty rate of 50.0%, comprising of 1 families. On the other hand, families with no children have the lowest poverty rate of 0.0%, which includes 0 families.
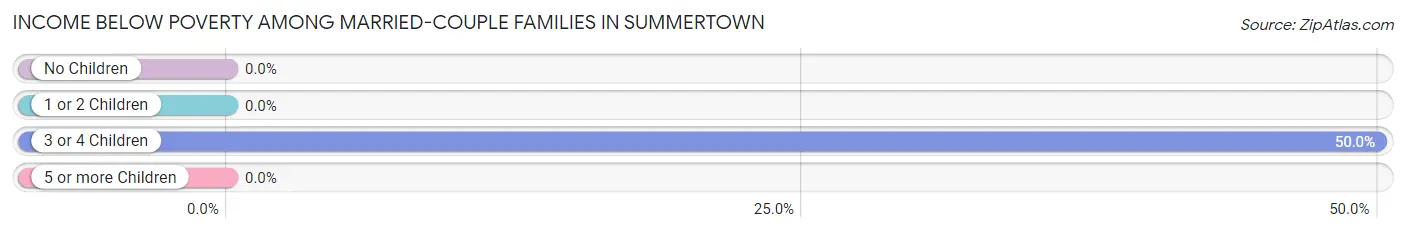
| Children | Above Poverty | Below Poverty |
| No Children | 9 (100.0%) | 0 (0.0%) |
| 1 or 2 Children | 7 (100.0%) | 0 (0.0%) |
| 3 or 4 Children | 1 (50.0%) | 1 (50.0%) |
| 5 or more Children | 8 (100.0%) | 0 (0.0%) |
| Total | 25 (96.2%) | 1 (3.8%) |
Income Below Poverty Among Single-Parent Households in Summertown
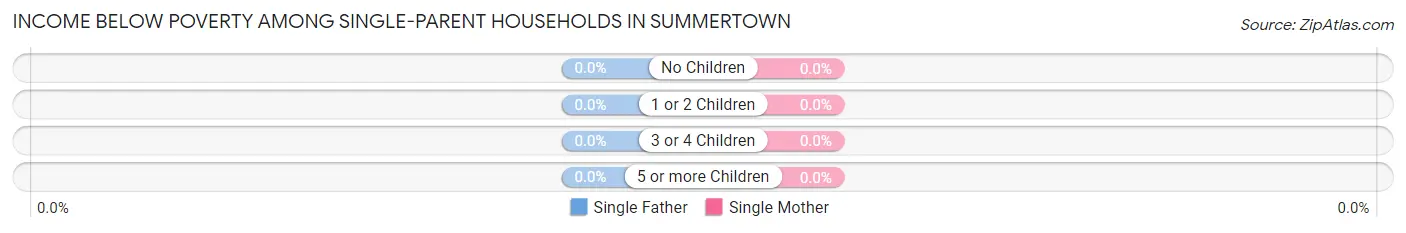
| Children | Single Father | Single Mother |
| No Children | 0 (0.0%) | 0 (0.0%) |
| 1 or 2 Children | 0 (0.0%) | 0 (0.0%) |
| 3 or 4 Children | 0 (0.0%) | 0 (0.0%) |
| 5 or more Children | 0 (0.0%) | 0 (0.0%) |
| Total | 0 (0.0%) | 0 (0.0%) |
Income Below Poverty Among Married-Couple vs Single-Parent Households in Summertown
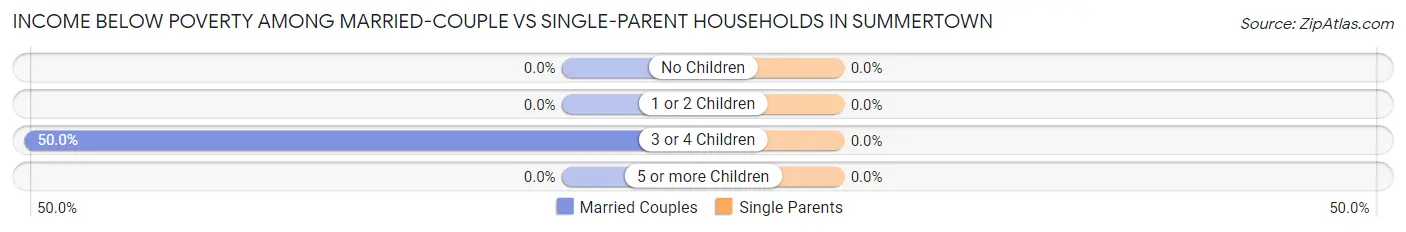
| Children | Married-Couple Families | Single-Parent Households |
| No Children | 0 (0.0%) | 0 (0.0%) |
| 1 or 2 Children | 0 (0.0%) | 0 (0.0%) |
| 3 or 4 Children | 1 (50.0%) | 0 (0.0%) |
| 5 or more Children | 0 (0.0%) | 0 (0.0%) |
| Total | 1 (3.8%) | 0 (0.0%) |
Race in Summertown
The most populous races in Summertown are Black / African American (131 | 50.4%), White / Caucasian (113 | 43.5%), and Two or more Races (16 | 6.1%).
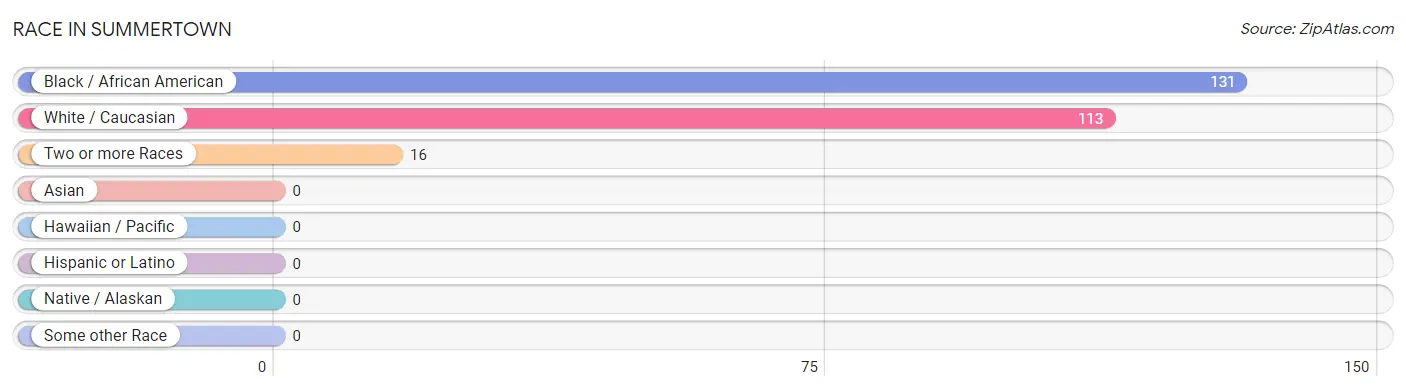
| Race | # Population | % Population |
| Asian | 0 | 0.0% |
| Black / African American | 131 | 50.4% |
| Hawaiian / Pacific | 0 | 0.0% |
| Hispanic or Latino | 0 | 0.0% |
| Native / Alaskan | 0 | 0.0% |
| White / Caucasian | 113 | 43.5% |
| Two or more Races | 16 | 6.1% |
| Some other Race | 0 | 0.0% |
| Total | 260 | 100.0% |
Ancestry in Summertown
The most populous ancestries reported in Summertown are American (32 | 12.3%), Scotch-Irish (17 | 6.5%), Brazilian (13 | 5.0%), Irish (13 | 5.0%), and British (2 | 0.8%), together accounting for 29.6% of all Summertown residents.
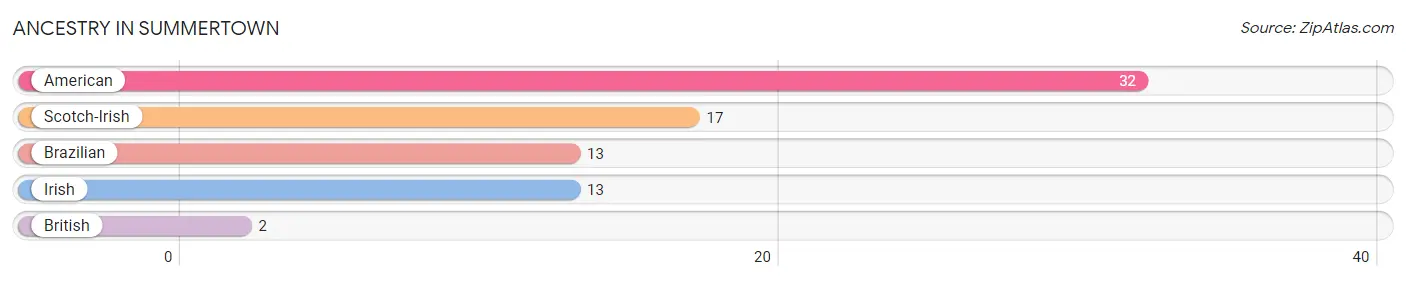
| Ancestry | # Population | % Population |
| American | 32 | 12.3% |
| Brazilian | 13 | 5.0% |
| British | 2 | 0.8% |
| Irish | 13 | 5.0% |
| Scotch-Irish | 17 | 6.5% | View All 5 Rows |
Immigrants in Summertown
The most numerous immigrant groups reported in Summertown came from Brazil (6 | 2.3%), Latin America (6 | 2.3%), and South America (6 | 2.3%), together accounting for 6.9% of all Summertown residents.
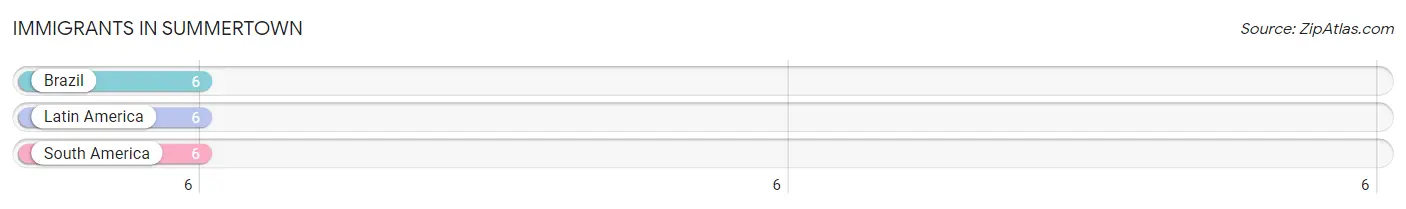
| Immigration Origin | # Population | % Population |
| Brazil | 6 | 2.3% |
| Latin America | 6 | 2.3% |
| South America | 6 | 2.3% | View All 3 Rows |
Sex and Age in Summertown
Sex and Age in Summertown
The most populous age groups in Summertown are 10 to 14 Years (56 | 34.2%) for men and 10 to 14 Years (16 | 16.7%) for women.
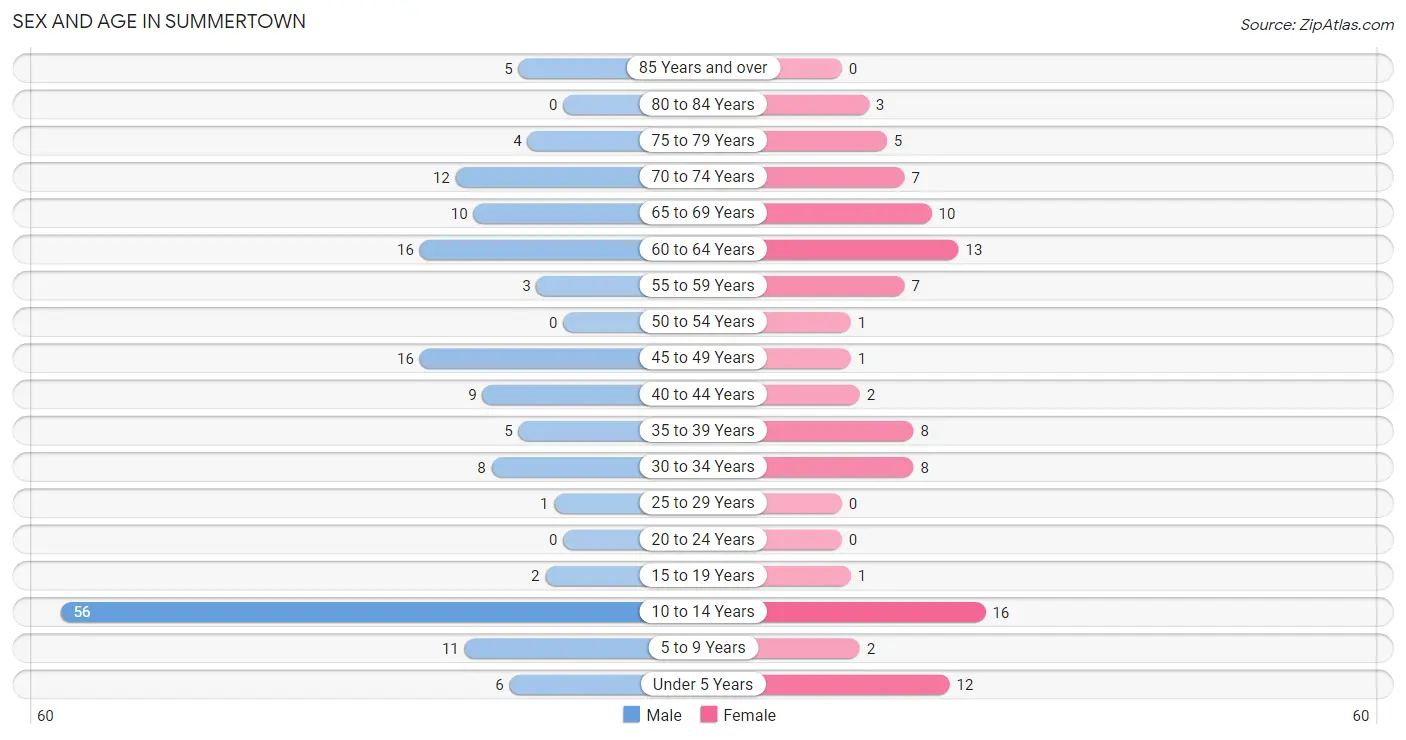
| Age Bracket | Male | Female |
| Under 5 Years | 6 (3.7%) | 12 (12.5%) |
| 5 to 9 Years | 11 (6.7%) | 2 (2.1%) |
| 10 to 14 Years | 56 (34.2%) | 16 (16.7%) |
| 15 to 19 Years | 2 (1.2%) | 1 (1.0%) |
| 20 to 24 Years | 0 (0.0%) | 0 (0.0%) |
| 25 to 29 Years | 1 (0.6%) | 0 (0.0%) |
| 30 to 34 Years | 8 (4.9%) | 8 (8.3%) |
| 35 to 39 Years | 5 (3.0%) | 8 (8.3%) |
| 40 to 44 Years | 9 (5.5%) | 2 (2.1%) |
| 45 to 49 Years | 16 (9.8%) | 1 (1.0%) |
| 50 to 54 Years | 0 (0.0%) | 1 (1.0%) |
| 55 to 59 Years | 3 (1.8%) | 7 (7.3%) |
| 60 to 64 Years | 16 (9.8%) | 13 (13.5%) |
| 65 to 69 Years | 10 (6.1%) | 10 (10.4%) |
| 70 to 74 Years | 12 (7.3%) | 7 (7.3%) |
| 75 to 79 Years | 4 (2.4%) | 5 (5.2%) |
| 80 to 84 Years | 0 (0.0%) | 3 (3.1%) |
| 85 Years and over | 5 (3.0%) | 0 (0.0%) |
| Total | 164 (100.0%) | 96 (100.0%) |
Families and Households in Summertown
Median Family Size in Summertown
The median family size in Summertown is 4.18 persons per family, with married-couple families (26 | 45.6%) accounting for the largest median family size of 5.88 persons per family. On the other hand, single male/father families (11 | 19.3%) represent the smallest median family size with 2.09 persons per family.
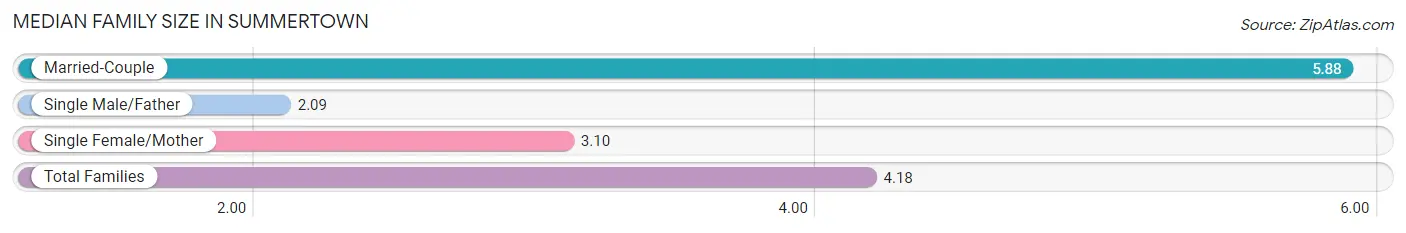
| Family Type | # Families | Family Size |
| Married-Couple | 26 (45.6%) | 5.88 |
| Single Male/Father | 11 (19.3%) | 2.09 |
| Single Female/Mother | 20 (35.1%) | 3.10 |
| Total Families | 57 (100.0%) | 4.18 |
Median Household Size in Summertown
The median household size in Summertown is 3.61 persons per household, with married-couple households (26 | 36.1%) accounting for the largest median household size of 5.88 persons per household. non-family households (15 | 20.8%) represent the smallest median household size with 1.20 persons per household.
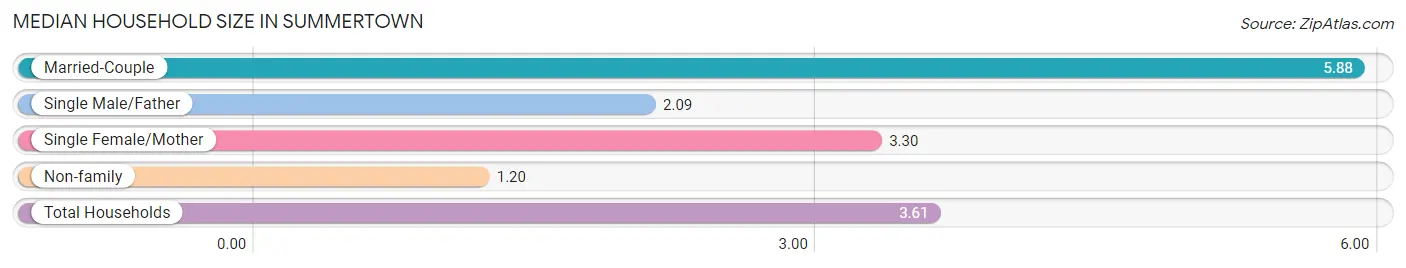
| Household Type | # Households | Household Size |
| Married-Couple | 26 (36.1%) | 5.88 |
| Single Male/Father | 11 (15.3%) | 2.09 |
| Single Female/Mother | 20 (27.8%) | 3.30 |
| Non-family | 15 (20.8%) | 1.20 |
| Total Households | 72 (100.0%) | 3.61 |
Household Size by Marriage Status in Summertown
Out of a total of 72 households in Summertown, 57 (79.2%) are family households, while 15 (20.8%) are nonfamily households. The most numerous type of family households are 3-person households, comprising 29, and the most common type of nonfamily households are 1-person households, comprising 12.
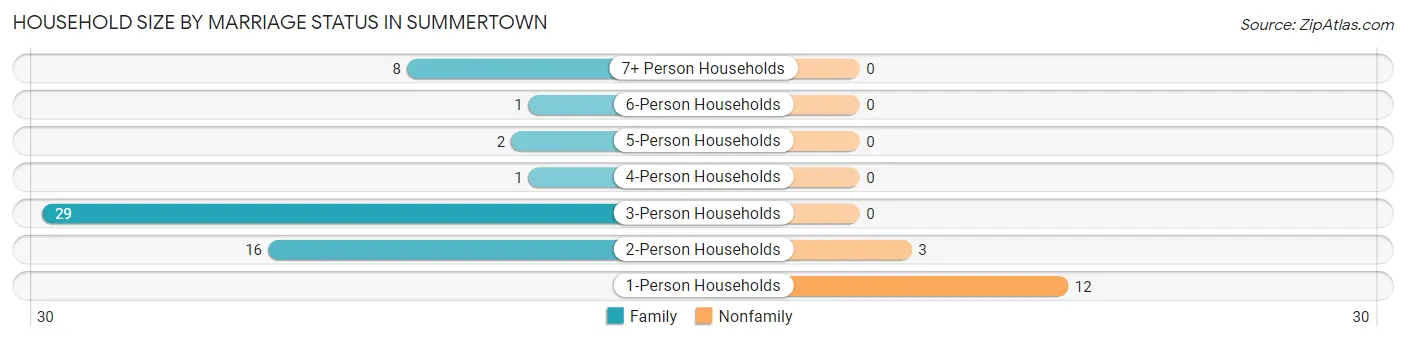
| Household Size | Family Households | Nonfamily Households |
| 1-Person Households | - | 12 (16.7%) |
| 2-Person Households | 16 (22.2%) | 3 (4.2%) |
| 3-Person Households | 29 (40.3%) | 0 (0.0%) |
| 4-Person Households | 1 (1.4%) | 0 (0.0%) |
| 5-Person Households | 2 (2.8%) | 0 (0.0%) |
| 6-Person Households | 1 (1.4%) | 0 (0.0%) |
| 7+ Person Households | 8 (11.1%) | 0 (0.0%) |
| Total | 57 (79.2%) | 15 (20.8%) |
Female Fertility in Summertown
Fertility by Age in Summertown
Average fertility rate in Summertown is 200.0 births per 1,000 women. Women in the age bracket of 20 to 34 years have the highest fertility rate with 500.0 births per 1,000 women. Women in the age bracket of 20 to 34 years acount for 100.0% of all women with births.
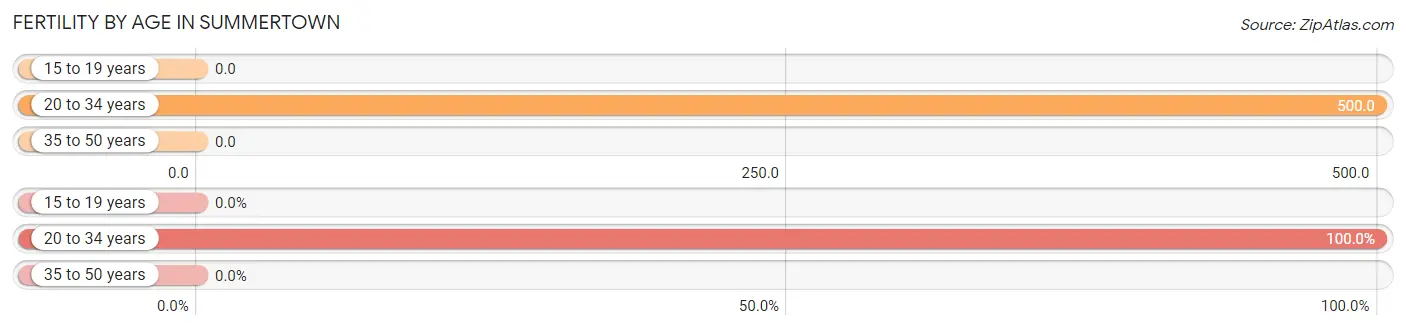
| Age Bracket | Women with Births | Births / 1,000 Women |
| 15 to 19 years | 0 (0.0%) | 0.0 |
| 20 to 34 years | 4 (100.0%) | 500.0 |
| 35 to 50 years | 0 (0.0%) | 0.0 |
| Total | 4 (100.0%) | 200.0 |
Fertility by Age by Marriage Status in Summertown
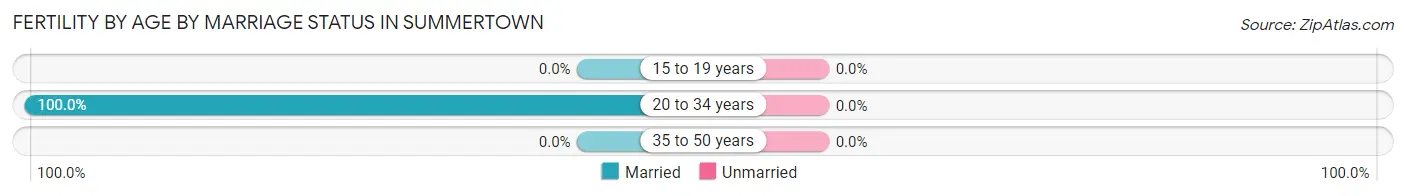
| Age Bracket | Married | Unmarried |
| 15 to 19 years | 0 (0.0%) | 0 (0.0%) |
| 20 to 34 years | 4 (100.0%) | 0 (0.0%) |
| 35 to 50 years | 0 (0.0%) | 0 (0.0%) |
| Total | 4 (100.0%) | 0 (0.0%) |
Fertility by Education in Summertown
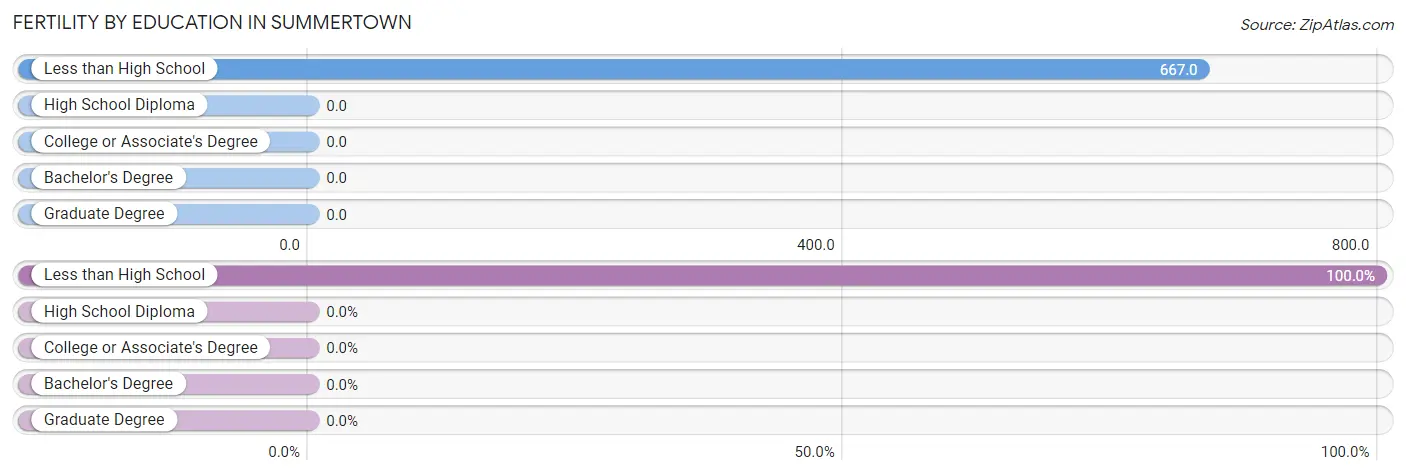
| Educational Attainment | Women with Births | Births / 1,000 Women |
| Less than High School | 4 (100.0%) | 667.0 |
| High School Diploma | 0 (0.0%) | 0.0 |
| College or Associate's Degree | 0 (0.0%) | 0.0 |
| Bachelor's Degree | 0 (0.0%) | 0.0 |
| Graduate Degree | 0 (0.0%) | 0.0 |
| Total | 4 (100.0%) | 200.0 |
Fertility by Education by Marriage Status in Summertown
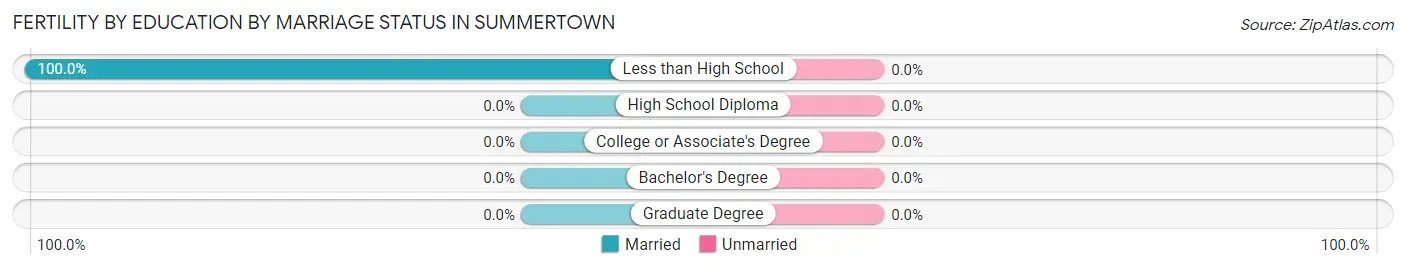
| Educational Attainment | Married | Unmarried |
| Less than High School | 4 (100.0%) | 0 (0.0%) |
| High School Diploma | 0 (0.0%) | 0 (0.0%) |
| College or Associate's Degree | 0 (0.0%) | 0 (0.0%) |
| Bachelor's Degree | 0 (0.0%) | 0 (0.0%) |
| Graduate Degree | 0 (0.0%) | 0 (0.0%) |
| Total | 4 (100.0%) | 0 (0.0%) |
Employment Characteristics in Summertown
Employment by Class of Employer in Summertown
Among the 69 employed individuals in Summertown, private company employees (34 | 49.3%), local government employees (22 | 31.9%), and not-for-profit organizations (8 | 11.6%) make up the most common classes of employment.
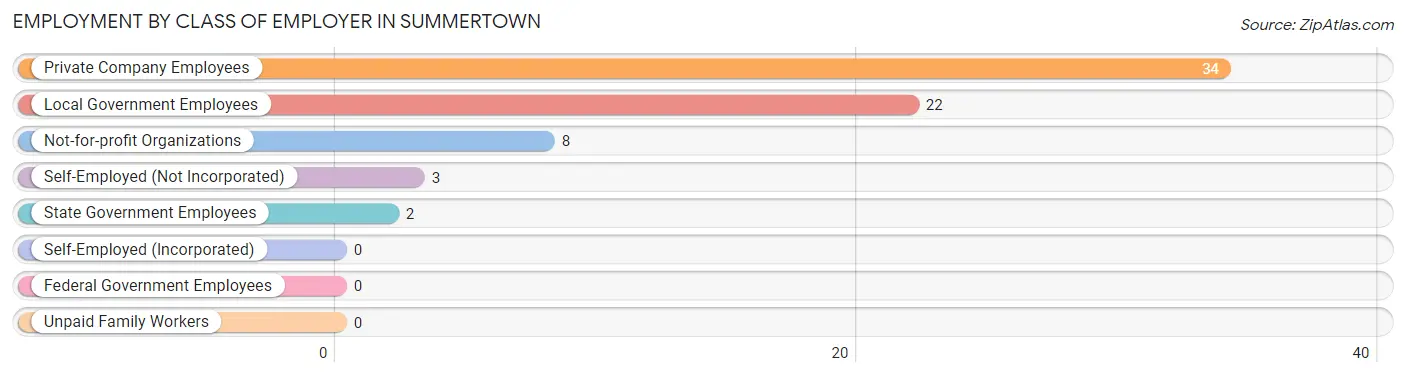
| Employer Class | # Employees | % Employees |
| Private Company Employees | 34 | 49.3% |
| Self-Employed (Incorporated) | 0 | 0.0% |
| Self-Employed (Not Incorporated) | 3 | 4.3% |
| Not-for-profit Organizations | 8 | 11.6% |
| Local Government Employees | 22 | 31.9% |
| State Government Employees | 2 | 2.9% |
| Federal Government Employees | 0 | 0.0% |
| Unpaid Family Workers | 0 | 0.0% |
| Total | 69 | 100.0% |
Employment Status by Age in Summertown
According to the labor force statistics for Summertown, out of the total population over 16 years of age (157), 54.8% or 86 individuals are in the labor force, with 19.8% or 17 of them unemployed. The age group with the highest labor force participation rate is 25 to 29 years, with 100.0% or 1 individuals in the labor force. Within the labor force, the 25 to 29 years age range has the highest percentage of unemployed individuals, with 100.0% or 1 of them being unemployed.
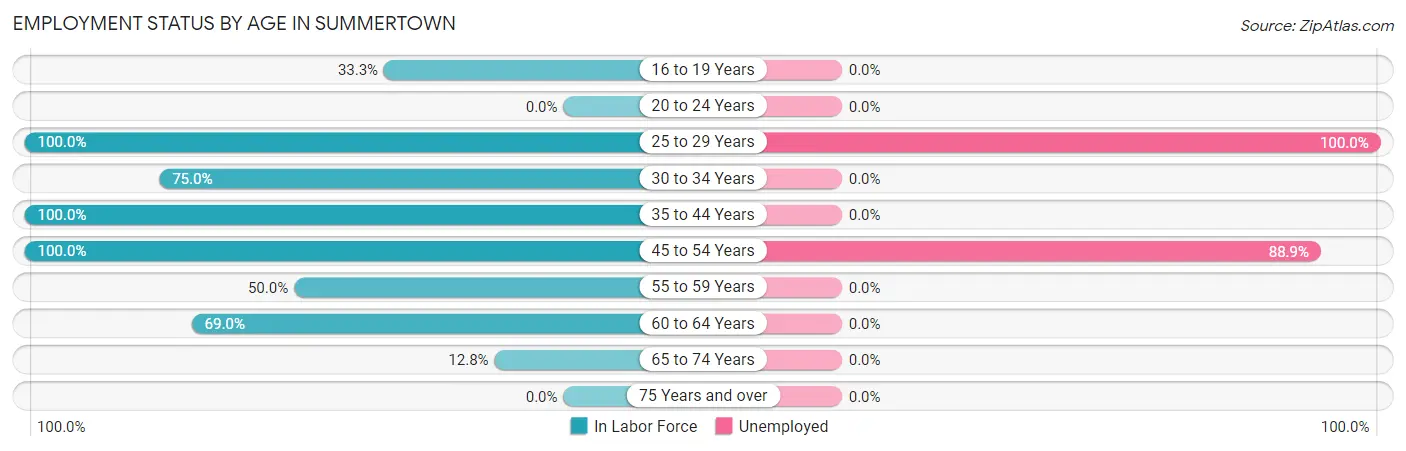
| Age Bracket | In Labor Force | Unemployed |
| 16 to 19 Years | 1 (33.3%) | 0 (0.0%) |
| 20 to 24 Years | 0 (0.0%) | 0 (0.0%) |
| 25 to 29 Years | 1 (100.0%) | 1 (100.0%) |
| 30 to 34 Years | 12 (75.0%) | 0 (0.0%) |
| 35 to 44 Years | 24 (100.0%) | 0 (0.0%) |
| 45 to 54 Years | 18 (100.0%) | 16 (88.9%) |
| 55 to 59 Years | 5 (50.0%) | 0 (0.0%) |
| 60 to 64 Years | 20 (69.0%) | 0 (0.0%) |
| 65 to 74 Years | 5 (12.8%) | 0 (0.0%) |
| 75 Years and over | 0 (0.0%) | 0 (0.0%) |
| Total | 86 (54.8%) | 17 (19.8%) |
Employment Status by Educational Attainment in Summertown
According to labor force statistics for Summertown, 81.6% of individuals (80) out of the total population between 25 and 64 years of age (98) are in the labor force, with 21.3% or 17 of them being unemployed. The group with the highest labor force participation rate are those with the educational attainment of college / associate degree, with 100.0% or 11 individuals in the labor force. Within the labor force, individuals with high school diploma education have the highest percentage of unemployment, with 51.6% or 16 of them being unemployed.
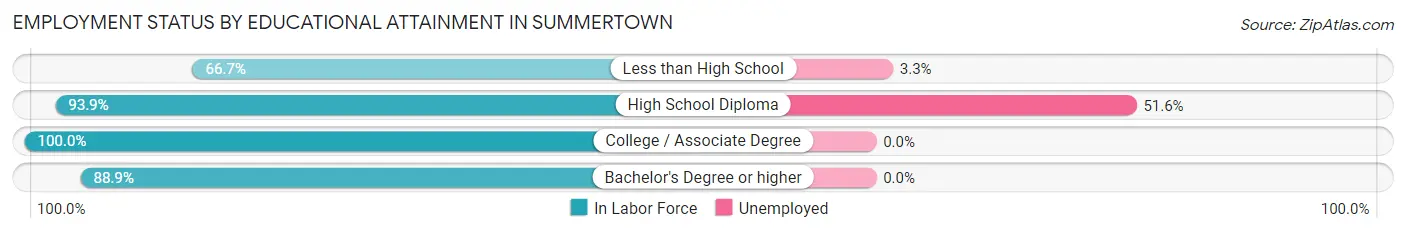
| Educational Attainment | In Labor Force | Unemployed |
| Less than High School | 30 (66.7%) | 1 (3.3%) |
| High School Diploma | 31 (93.9%) | 17 (51.6%) |
| College / Associate Degree | 11 (100.0%) | 0 (0.0%) |
| Bachelor's Degree or higher | 8 (88.9%) | 0 (0.0%) |
| Total | 80 (81.6%) | 21 (21.3%) |
Employment Occupations by Sex in Summertown
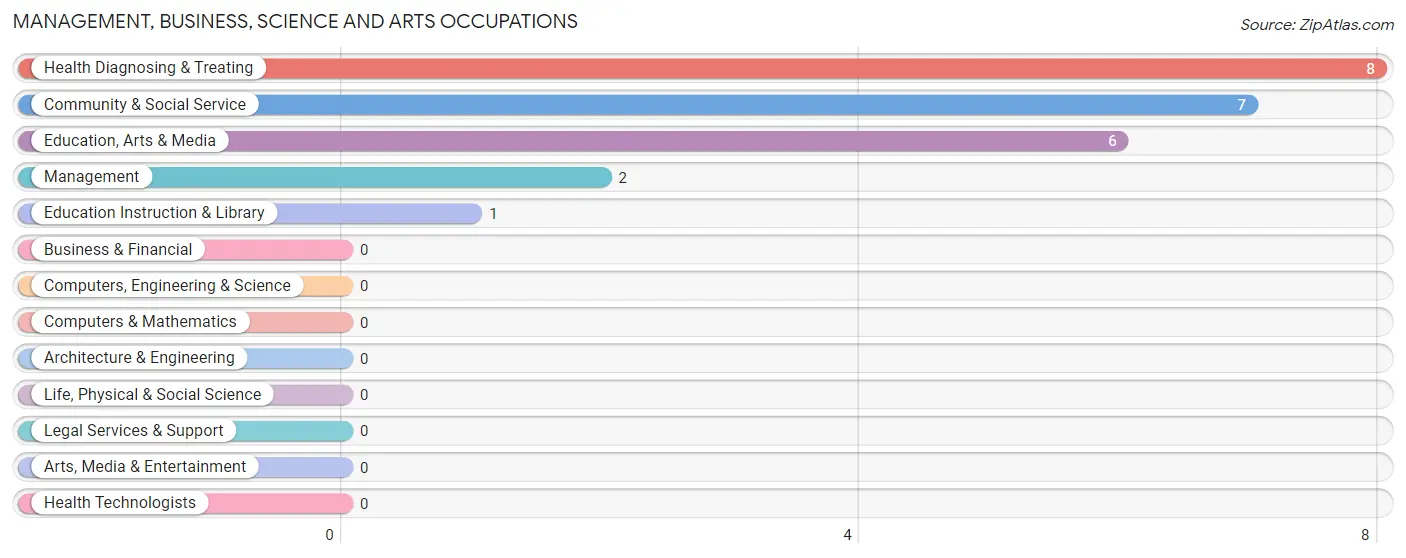
Management, Business, Science and Arts Occupations
The most common Management, Business, Science and Arts occupations in Summertown are Health Diagnosing & Treating (8 | 11.6%), Community & Social Service (7 | 10.1%), Education, Arts & Media (6 | 8.7%), Management (2 | 2.9%), and Education Instruction & Library (1 | 1.5%).
Management, Business, Science and Arts Occupations by Sex
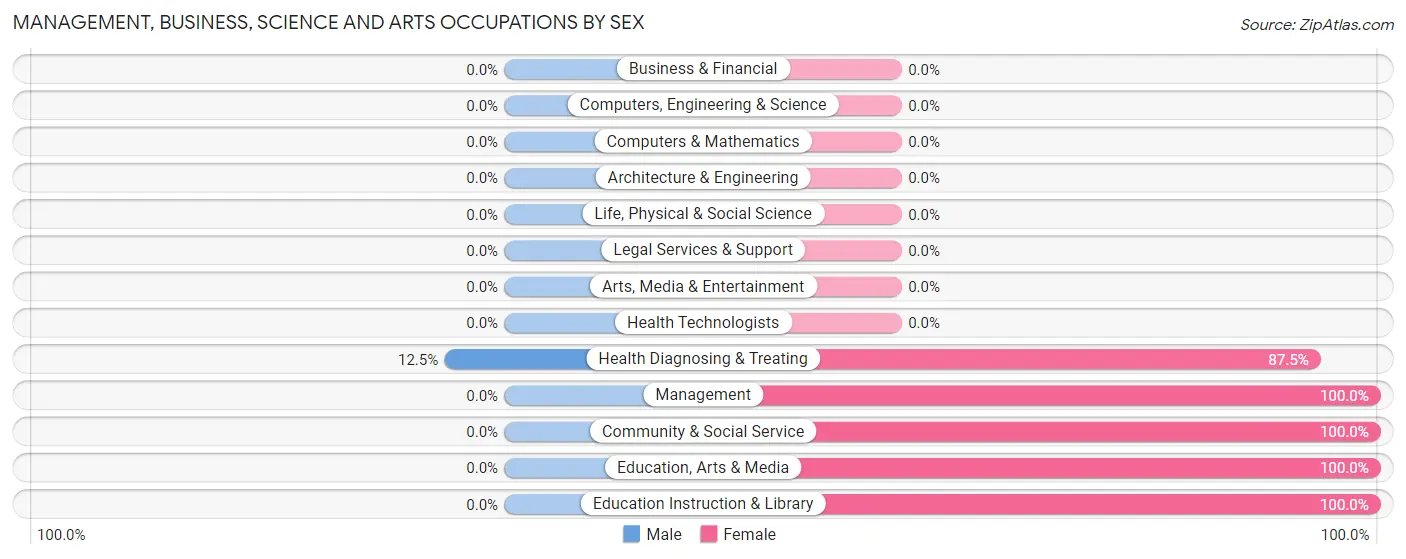
| Occupation | Male | Female |
| Management | 0 (0.0%) | 2 (100.0%) |
| Business & Financial | 0 (0.0%) | 0 (0.0%) |
| Computers, Engineering & Science | 0 (0.0%) | 0 (0.0%) |
| Computers & Mathematics | 0 (0.0%) | 0 (0.0%) |
| Architecture & Engineering | 0 (0.0%) | 0 (0.0%) |
| Life, Physical & Social Science | 0 (0.0%) | 0 (0.0%) |
| Community & Social Service | 0 (0.0%) | 7 (100.0%) |
| Education, Arts & Media | 0 (0.0%) | 6 (100.0%) |
| Legal Services & Support | 0 (0.0%) | 0 (0.0%) |
| Education Instruction & Library | 0 (0.0%) | 1 (100.0%) |
| Arts, Media & Entertainment | 0 (0.0%) | 0 (0.0%) |
| Health Diagnosing & Treating | 1 (12.5%) | 7 (87.5%) |
| Health Technologists | 0 (0.0%) | 0 (0.0%) |
| Total (Category) | 1 (5.9%) | 16 (94.1%) |
| Total (Overall) | 44 (63.8%) | 25 (36.2%) |
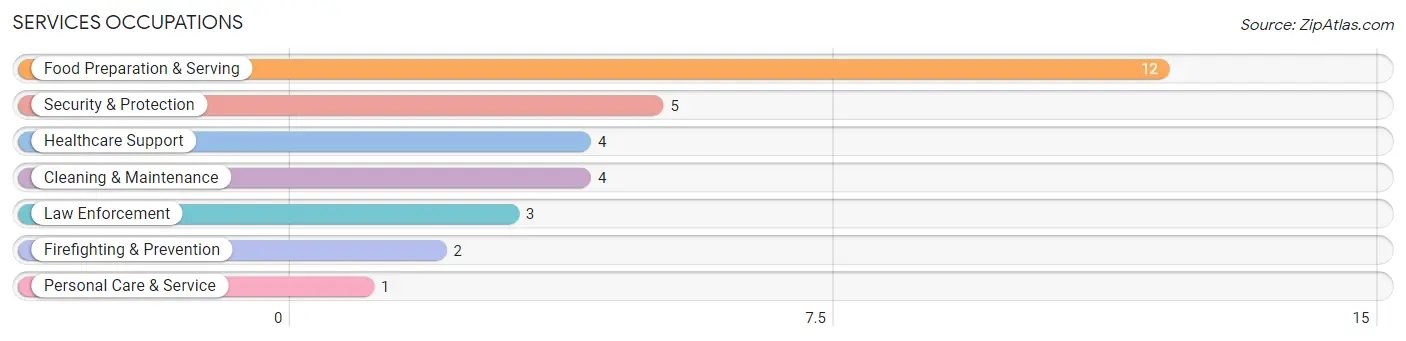
Services Occupations
The most common Services occupations in Summertown are Food Preparation & Serving (12 | 17.4%), Security & Protection (5 | 7.2%), Healthcare Support (4 | 5.8%), Cleaning & Maintenance (4 | 5.8%), and Law Enforcement (3 | 4.3%).
Services Occupations by Sex
Within the Services occupations in Summertown, the most male-oriented occupations are Security & Protection (100.0%), Firefighting & Prevention (100.0%), and Law Enforcement (100.0%), while the most female-oriented occupations are Healthcare Support (100.0%), Personal Care & Service (100.0%), and Cleaning & Maintenance (25.0%).
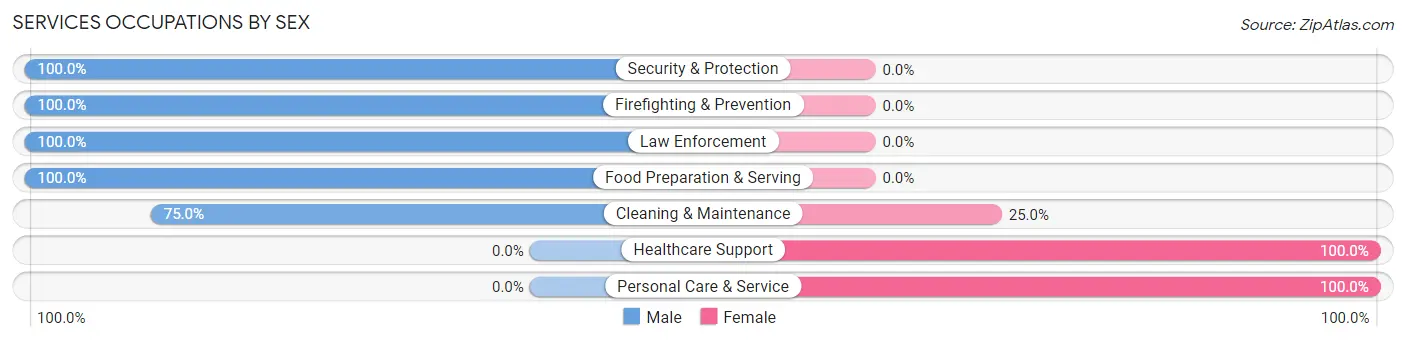
| Occupation | Male | Female |
| Healthcare Support | 0 (0.0%) | 4 (100.0%) |
| Security & Protection | 5 (100.0%) | 0 (0.0%) |
| Firefighting & Prevention | 2 (100.0%) | 0 (0.0%) |
| Law Enforcement | 3 (100.0%) | 0 (0.0%) |
| Food Preparation & Serving | 12 (100.0%) | 0 (0.0%) |
| Cleaning & Maintenance | 3 (75.0%) | 1 (25.0%) |
| Personal Care & Service | 0 (0.0%) | 1 (100.0%) |
| Total (Category) | 20 (76.9%) | 6 (23.1%) |
| Total (Overall) | 44 (63.8%) | 25 (36.2%) |
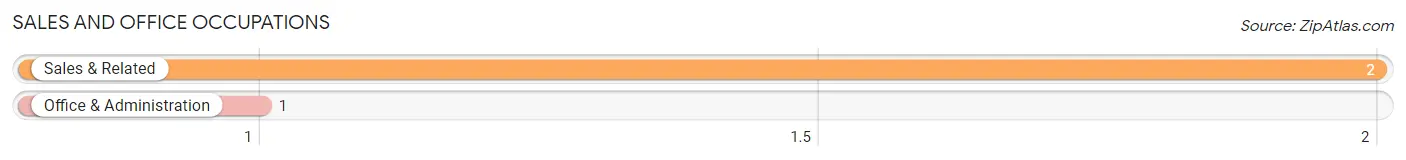
Sales and Office Occupations
The most common Sales and Office occupations in Summertown are Sales & Related (2 | 2.9%), and Office & Administration (1 | 1.5%).
Sales and Office Occupations by Sex
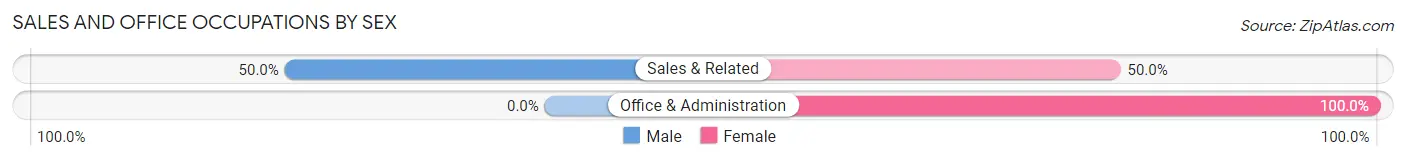
| Occupation | Male | Female |
| Sales & Related | 1 (50.0%) | 1 (50.0%) |
| Office & Administration | 0 (0.0%) | 1 (100.0%) |
| Total (Category) | 1 (33.3%) | 2 (66.7%) |
| Total (Overall) | 44 (63.8%) | 25 (36.2%) |
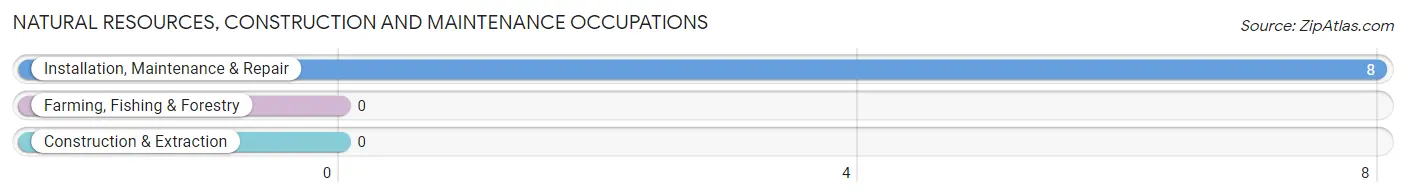
Natural Resources, Construction and Maintenance Occupations
The most common Natural Resources, Construction and Maintenance occupations in Summertown are , and Installation, Maintenance & Repair (8 | 11.6%).
Natural Resources, Construction and Maintenance Occupations by Sex
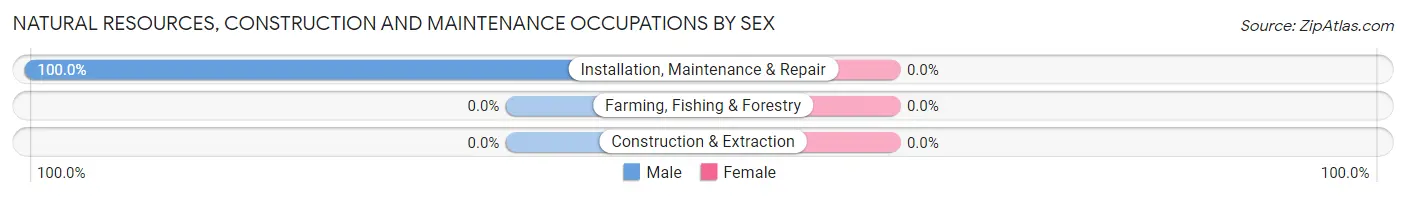
| Occupation | Male | Female |
| Farming, Fishing & Forestry | 0 (0.0%) | 0 (0.0%) |
| Construction & Extraction | 0 (0.0%) | 0 (0.0%) |
| Installation, Maintenance & Repair | 8 (100.0%) | 0 (0.0%) |
| Total (Category) | 8 (100.0%) | 0 (0.0%) |
| Total (Overall) | 44 (63.8%) | 25 (36.2%) |
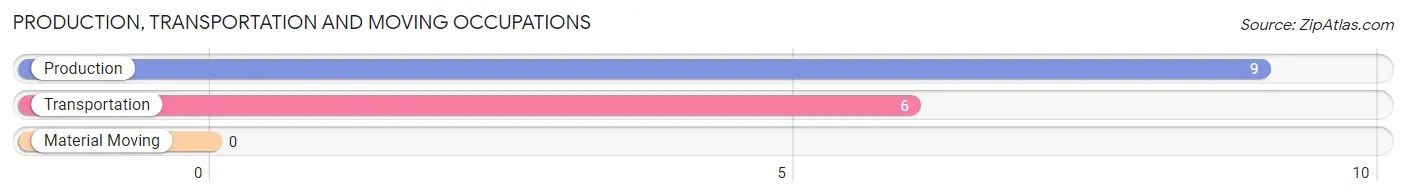
Production, Transportation and Moving Occupations
The most common Production, Transportation and Moving occupations in Summertown are Production (9 | 13.0%), and Transportation (6 | 8.7%).
Production, Transportation and Moving Occupations by Sex
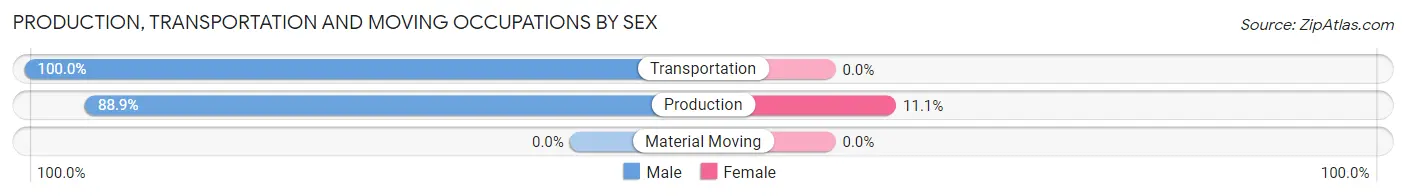
| Occupation | Male | Female |
| Production | 8 (88.9%) | 1 (11.1%) |
| Transportation | 6 (100.0%) | 0 (0.0%) |
| Material Moving | 0 (0.0%) | 0 (0.0%) |
| Total (Category) | 14 (93.3%) | 1 (6.7%) |
| Total (Overall) | 44 (63.8%) | 25 (36.2%) |
Employment Industries by Sex in Summertown
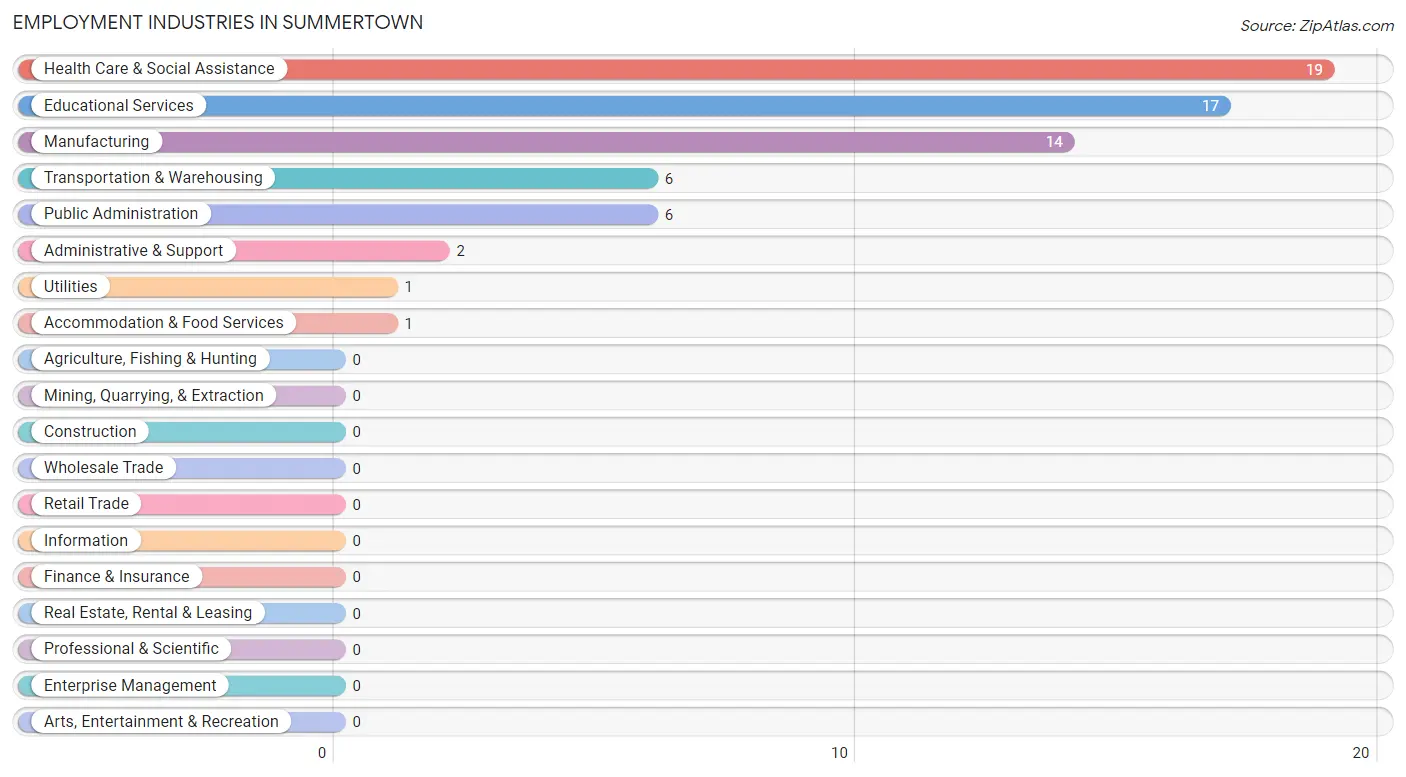
Employment Industries in Summertown
The major employment industries in Summertown include Health Care & Social Assistance (19 | 27.5%), Educational Services (17 | 24.6%), Manufacturing (14 | 20.3%), Transportation & Warehousing (6 | 8.7%), and Public Administration (6 | 8.7%).
Employment Industries by Sex in Summertown
The Summertown industries that see more men than women are Transportation & Warehousing (100.0%), Utilities (100.0%), and Administrative & Support (100.0%), whereas the industries that tend to have a higher number of women are Accommodation & Food Services (100.0%), Health Care & Social Assistance (94.7%), and Public Administration (50.0%).
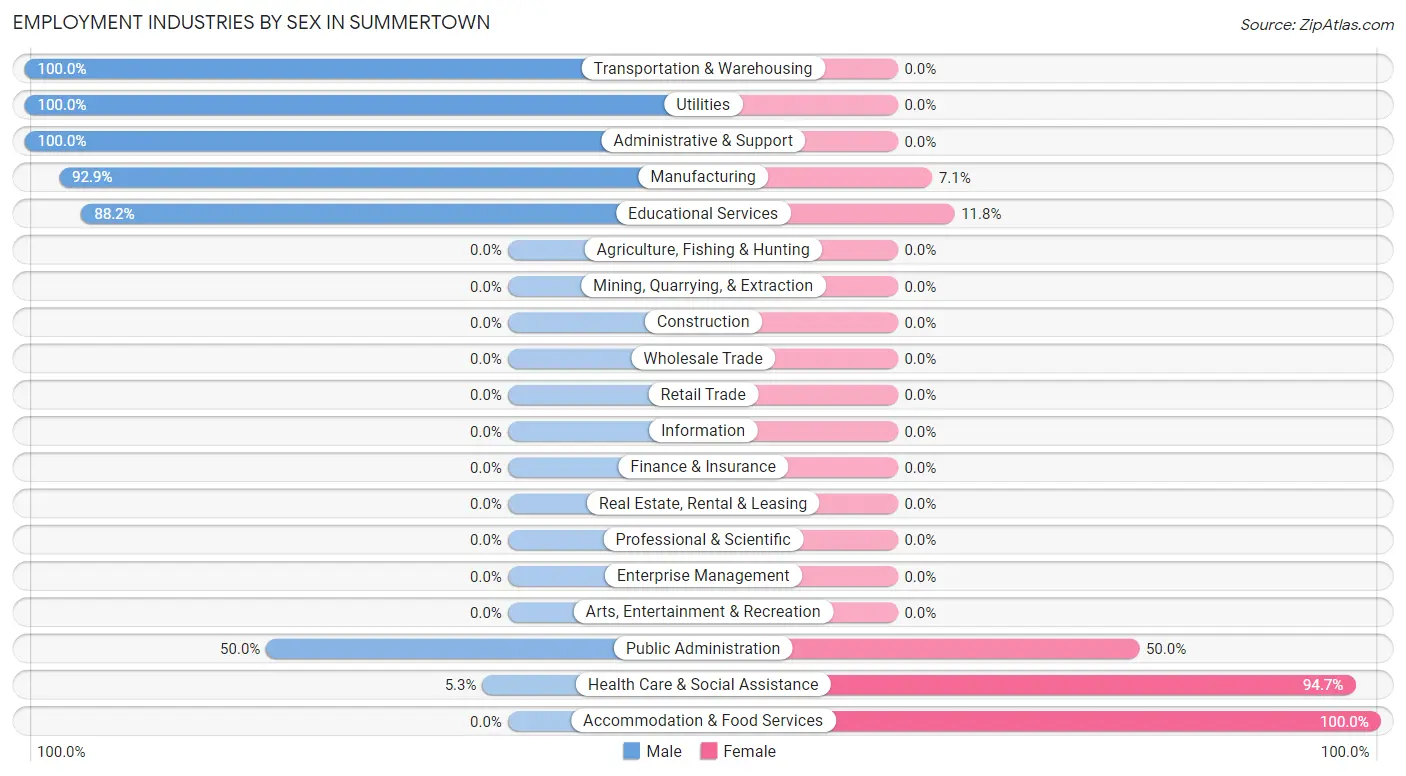
| Industry | Male | Female |
| Agriculture, Fishing & Hunting | 0 (0.0%) | 0 (0.0%) |
| Mining, Quarrying, & Extraction | 0 (0.0%) | 0 (0.0%) |
| Construction | 0 (0.0%) | 0 (0.0%) |
| Manufacturing | 13 (92.9%) | 1 (7.1%) |
| Wholesale Trade | 0 (0.0%) | 0 (0.0%) |
| Retail Trade | 0 (0.0%) | 0 (0.0%) |
| Transportation & Warehousing | 6 (100.0%) | 0 (0.0%) |
| Utilities | 1 (100.0%) | 0 (0.0%) |
| Information | 0 (0.0%) | 0 (0.0%) |
| Finance & Insurance | 0 (0.0%) | 0 (0.0%) |
| Real Estate, Rental & Leasing | 0 (0.0%) | 0 (0.0%) |
| Professional & Scientific | 0 (0.0%) | 0 (0.0%) |
| Enterprise Management | 0 (0.0%) | 0 (0.0%) |
| Administrative & Support | 2 (100.0%) | 0 (0.0%) |
| Educational Services | 15 (88.2%) | 2 (11.8%) |
| Health Care & Social Assistance | 1 (5.3%) | 18 (94.7%) |
| Arts, Entertainment & Recreation | 0 (0.0%) | 0 (0.0%) |
| Accommodation & Food Services | 0 (0.0%) | 1 (100.0%) |
| Public Administration | 3 (50.0%) | 3 (50.0%) |
| Total | 44 (63.8%) | 25 (36.2%) |
Education in Summertown
School Enrollment in Summertown
The most common levels of schooling among the 90 students in Summertown are middle school (68 | 75.6%), elementary school (17 | 18.9%), and high school (3 | 3.3%).
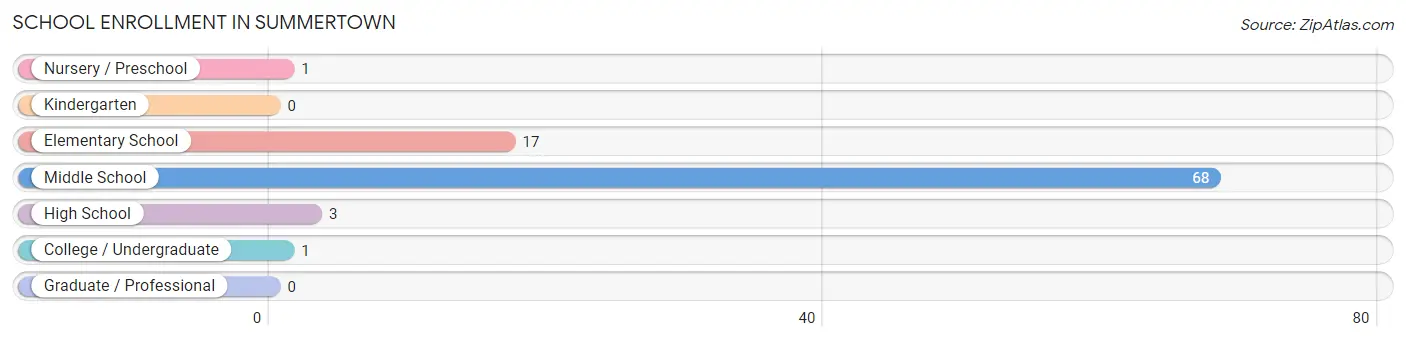
| School Level | # Students | % Students |
| Nursery / Preschool | 1 | 1.1% |
| Kindergarten | 0 | 0.0% |
| Elementary School | 17 | 18.9% |
| Middle School | 68 | 75.6% |
| High School | 3 | 3.3% |
| College / Undergraduate | 1 | 1.1% |
| Graduate / Professional | 0 | 0.0% |
| Total | 90 | 100.0% |
School Enrollment by Age by Funding Source in Summertown
Out of a total of 90 students who are enrolled in schools in Summertown, 4 (4.4%) attend a private institution, while the remaining 86 (95.6%) are enrolled in public schools. The age group of 3 to 4 year olds has the highest likelihood of being enrolled in private schools, with 1 (100.0% in the age bracket) enrolled. Conversely, the age group of 5 to 9 year old has the lowest likelihood of being enrolled in a private school, with 13 (100.0% in the age bracket) attending a public institution.
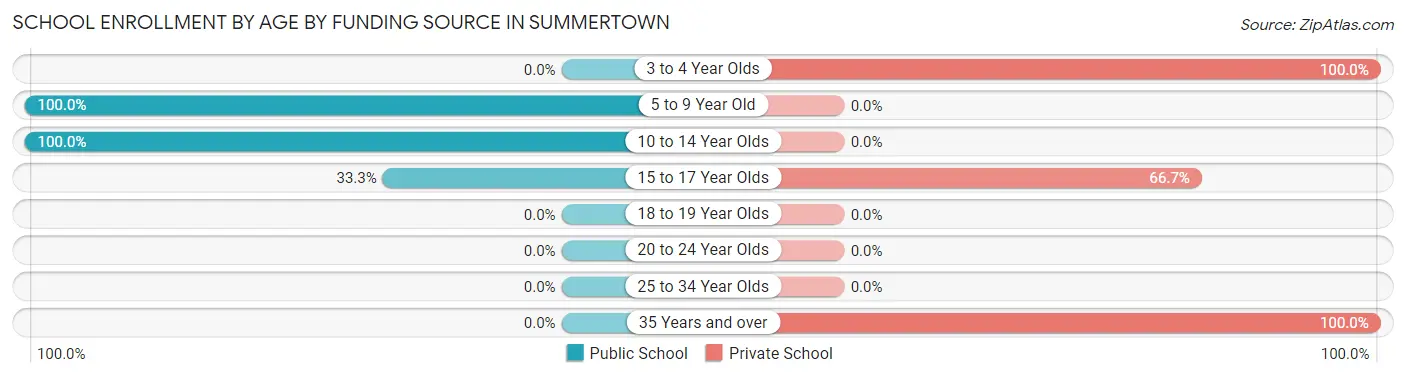
| Age Bracket | Public School | Private School |
| 3 to 4 Year Olds | 0 (0.0%) | 1 (100.0%) |
| 5 to 9 Year Old | 13 (100.0%) | 0 (0.0%) |
| 10 to 14 Year Olds | 72 (100.0%) | 0 (0.0%) |
| 15 to 17 Year Olds | 1 (33.3%) | 2 (66.7%) |
| 18 to 19 Year Olds | 0 (0.0%) | 0 (0.0%) |
| 20 to 24 Year Olds | 0 (0.0%) | 0 (0.0%) |
| 25 to 34 Year Olds | 0 (0.0%) | 0 (0.0%) |
| 35 Years and over | 0 (0.0%) | 1 (100.0%) |
| Total | 86 (95.6%) | 4 (4.4%) |
Educational Attainment by Field of Study in Summertown
Education (9 | 50.0%), business (8 | 44.4%), and psychology (1 | 5.6%) are the most common fields of study among 18 individuals in Summertown who have obtained a bachelor's degree or higher.
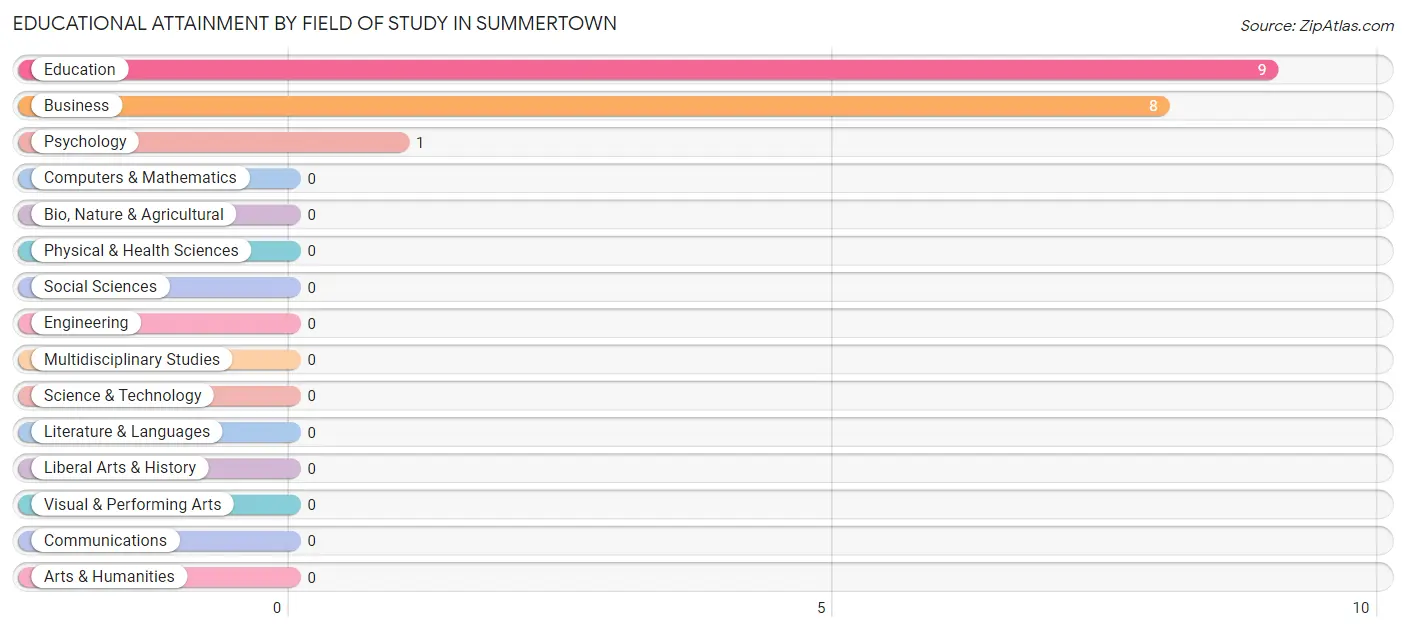
| Field of Study | # Graduates | % Graduates |
| Computers & Mathematics | 0 | 0.0% |
| Bio, Nature & Agricultural | 0 | 0.0% |
| Physical & Health Sciences | 0 | 0.0% |
| Psychology | 1 | 5.6% |
| Social Sciences | 0 | 0.0% |
| Engineering | 0 | 0.0% |
| Multidisciplinary Studies | 0 | 0.0% |
| Science & Technology | 0 | 0.0% |
| Business | 8 | 44.4% |
| Education | 9 | 50.0% |
| Literature & Languages | 0 | 0.0% |
| Liberal Arts & History | 0 | 0.0% |
| Visual & Performing Arts | 0 | 0.0% |
| Communications | 0 | 0.0% |
| Arts & Humanities | 0 | 0.0% |
| Total | 18 | 100.0% |
Transportation & Commute in Summertown
Vehicle Availability by Sex in Summertown
The most prevalent vehicle ownership categories in Summertown are males with 3 vehicles (20, accounting for 45.5%) and females with 3 vehicles (9, making up 80.0%).
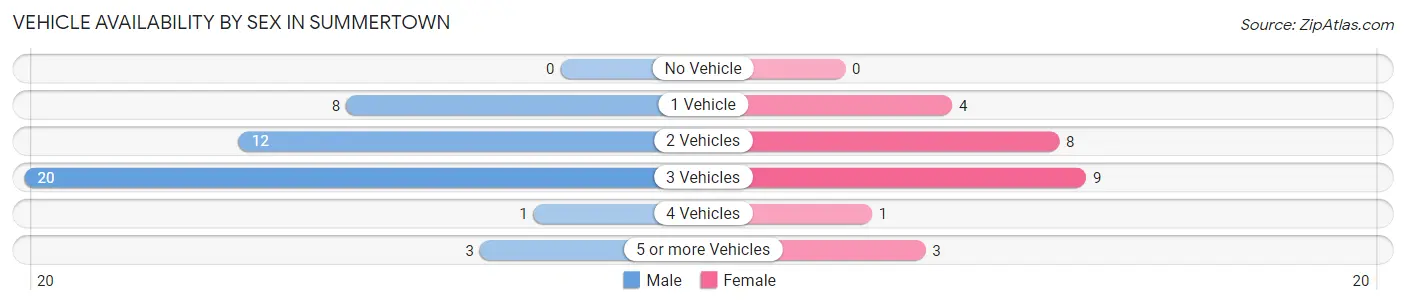
| Vehicles Available | Male | Female |
| No Vehicle | 0 (0.0%) | 0 (0.0%) |
| 1 Vehicle | 8 (18.2%) | 4 (16.0%) |
| 2 Vehicles | 12 (27.3%) | 8 (32.0%) |
| 3 Vehicles | 20 (45.5%) | 9 (36.0%) |
| 4 Vehicles | 1 (2.3%) | 1 (4.0%) |
| 5 or more Vehicles | 3 (6.8%) | 3 (12.0%) |
| Total | 44 (100.0%) | 25 (100.0%) |
Commute Time in Summertown
The most frequently occuring commute durations in Summertown are 45 to 59 minutes (17 commuters, 25.4%), 30 to 34 minutes (13 commuters, 19.4%), and 90 or more minutes (10 commuters, 14.9%).
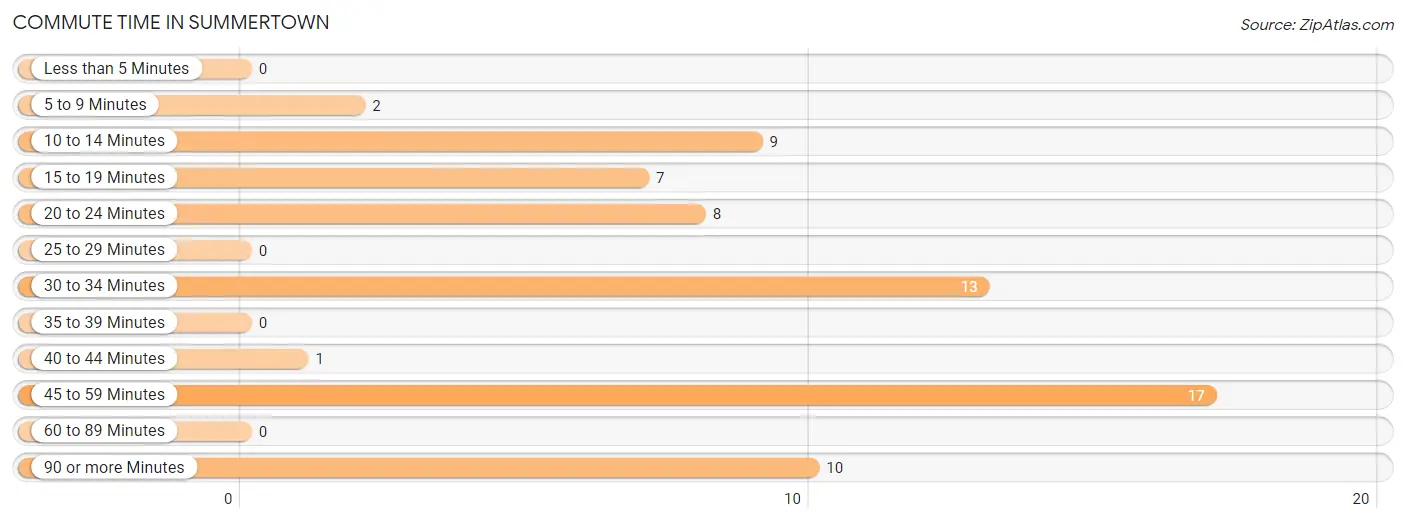
| Commute Time | # Commuters | % Commuters |
| Less than 5 Minutes | 0 | 0.0% |
| 5 to 9 Minutes | 2 | 3.0% |
| 10 to 14 Minutes | 9 | 13.4% |
| 15 to 19 Minutes | 7 | 10.4% |
| 20 to 24 Minutes | 8 | 11.9% |
| 25 to 29 Minutes | 0 | 0.0% |
| 30 to 34 Minutes | 13 | 19.4% |
| 35 to 39 Minutes | 0 | 0.0% |
| 40 to 44 Minutes | 1 | 1.5% |
| 45 to 59 Minutes | 17 | 25.4% |
| 60 to 89 Minutes | 0 | 0.0% |
| 90 or more Minutes | 10 | 14.9% |
Commute Time by Sex in Summertown
The most common commute times in Summertown are 45 to 59 minutes (16 commuters, 36.4%) for males and 20 to 24 minutes (7 commuters, 30.4%) for females.
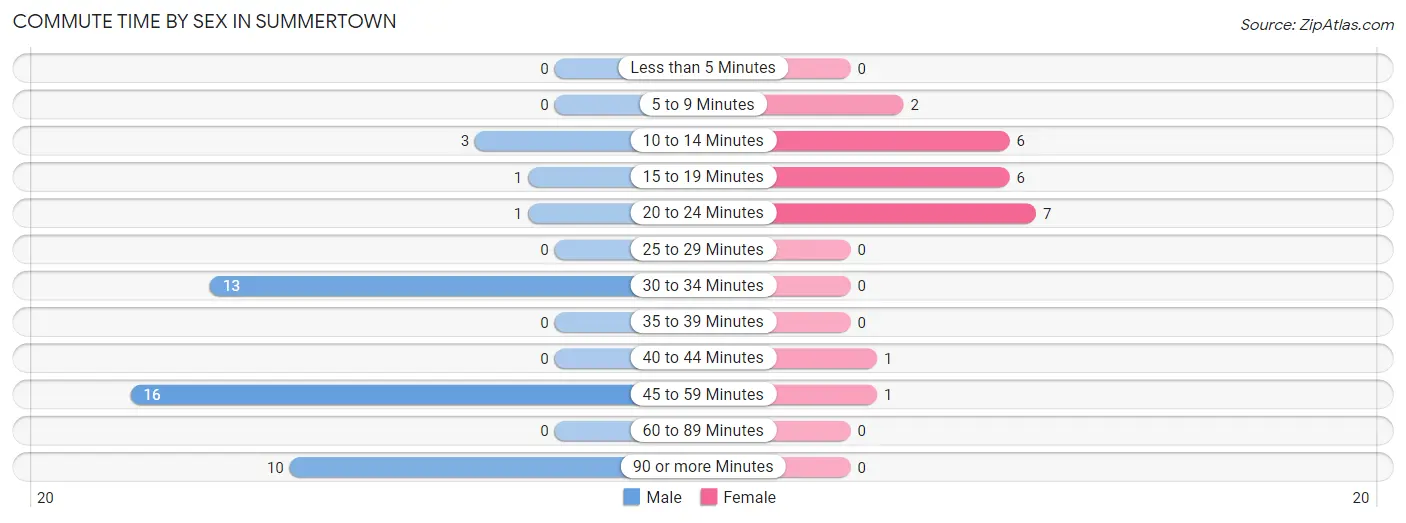
| Commute Time | Male | Female |
| Less than 5 Minutes | 0 (0.0%) | 0 (0.0%) |
| 5 to 9 Minutes | 0 (0.0%) | 2 (8.7%) |
| 10 to 14 Minutes | 3 (6.8%) | 6 (26.1%) |
| 15 to 19 Minutes | 1 (2.3%) | 6 (26.1%) |
| 20 to 24 Minutes | 1 (2.3%) | 7 (30.4%) |
| 25 to 29 Minutes | 0 (0.0%) | 0 (0.0%) |
| 30 to 34 Minutes | 13 (29.5%) | 0 (0.0%) |
| 35 to 39 Minutes | 0 (0.0%) | 0 (0.0%) |
| 40 to 44 Minutes | 0 (0.0%) | 1 (4.3%) |
| 45 to 59 Minutes | 16 (36.4%) | 1 (4.3%) |
| 60 to 89 Minutes | 0 (0.0%) | 0 (0.0%) |
| 90 or more Minutes | 10 (22.7%) | 0 (0.0%) |
Time of Departure to Work by Sex in Summertown
The most frequent times of departure to work in Summertown are 7:00 AM to 7:29 AM (16, 36.4%) for males and 7:30 AM to 7:59 AM (6, 26.1%) for females.
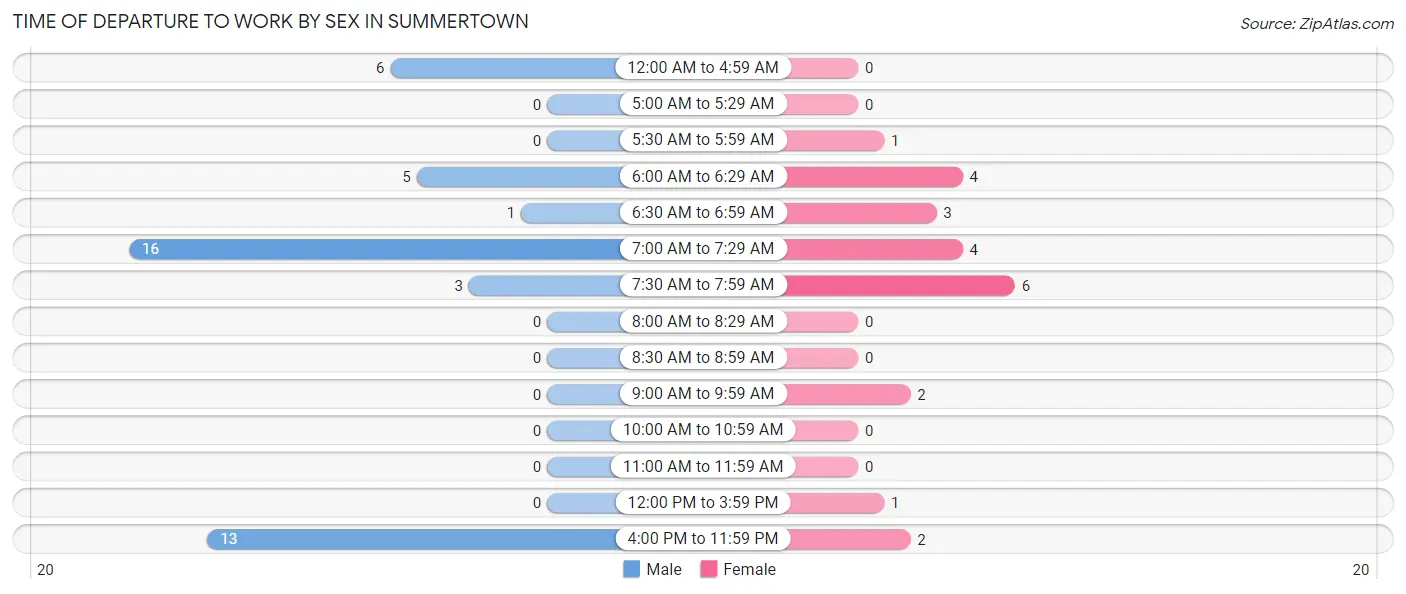
| Time of Departure | Male | Female |
| 12:00 AM to 4:59 AM | 6 (13.6%) | 0 (0.0%) |
| 5:00 AM to 5:29 AM | 0 (0.0%) | 0 (0.0%) |
| 5:30 AM to 5:59 AM | 0 (0.0%) | 1 (4.3%) |
| 6:00 AM to 6:29 AM | 5 (11.4%) | 4 (17.4%) |
| 6:30 AM to 6:59 AM | 1 (2.3%) | 3 (13.0%) |
| 7:00 AM to 7:29 AM | 16 (36.4%) | 4 (17.4%) |
| 7:30 AM to 7:59 AM | 3 (6.8%) | 6 (26.1%) |
| 8:00 AM to 8:29 AM | 0 (0.0%) | 0 (0.0%) |
| 8:30 AM to 8:59 AM | 0 (0.0%) | 0 (0.0%) |
| 9:00 AM to 9:59 AM | 0 (0.0%) | 2 (8.7%) |
| 10:00 AM to 10:59 AM | 0 (0.0%) | 0 (0.0%) |
| 11:00 AM to 11:59 AM | 0 (0.0%) | 0 (0.0%) |
| 12:00 PM to 3:59 PM | 0 (0.0%) | 1 (4.3%) |
| 4:00 PM to 11:59 PM | 13 (29.5%) | 2 (8.7%) |
| Total | 44 (100.0%) | 23 (100.0%) |
Housing Occupancy in Summertown
Occupancy by Ownership in Summertown
Of the total 72 dwellings in Summertown, owner-occupied units account for 50 (69.4%), while renter-occupied units make up 22 (30.6%).
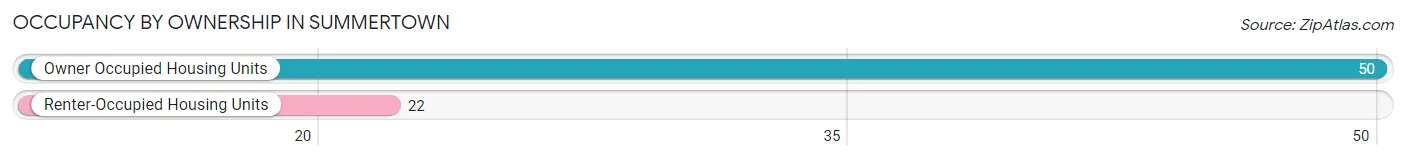
| Occupancy | # Housing Units | % Housing Units |
| Owner Occupied Housing Units | 50 | 69.4% |
| Renter-Occupied Housing Units | 22 | 30.6% |
| Total Occupied Housing Units | 72 | 100.0% |
Occupancy by Household Size in Summertown
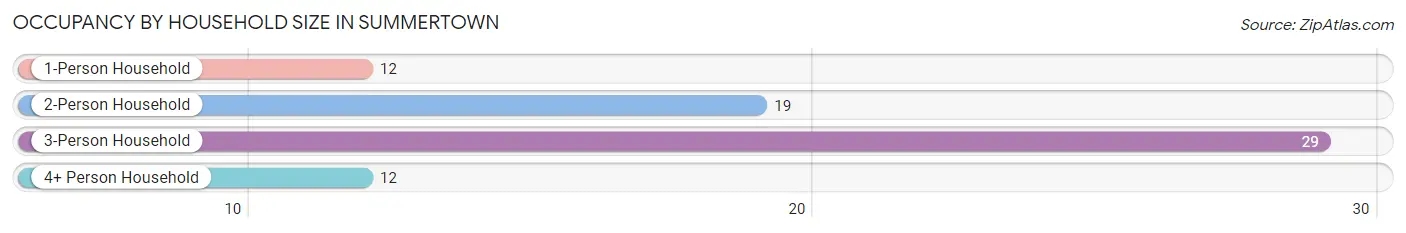
| Household Size | # Housing Units | % Housing Units |
| 1-Person Household | 12 | 16.7% |
| 2-Person Household | 19 | 26.4% |
| 3-Person Household | 29 | 40.3% |
| 4+ Person Household | 12 | 16.7% |
| Total Housing Units | 72 | 100.0% |
Occupancy by Ownership by Household Size in Summertown
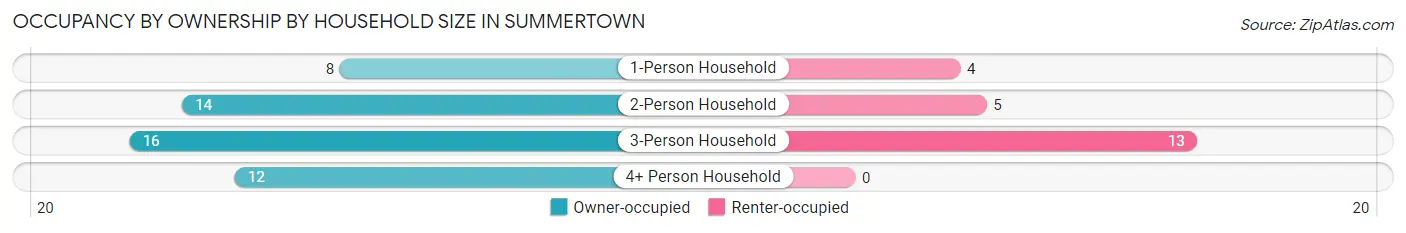
| Household Size | Owner-occupied | Renter-occupied |
| 1-Person Household | 8 (66.7%) | 4 (33.3%) |
| 2-Person Household | 14 (73.7%) | 5 (26.3%) |
| 3-Person Household | 16 (55.2%) | 13 (44.8%) |
| 4+ Person Household | 12 (100.0%) | 0 (0.0%) |
| Total Housing Units | 50 (69.4%) | 22 (30.6%) |
Occupancy by Educational Attainment in Summertown
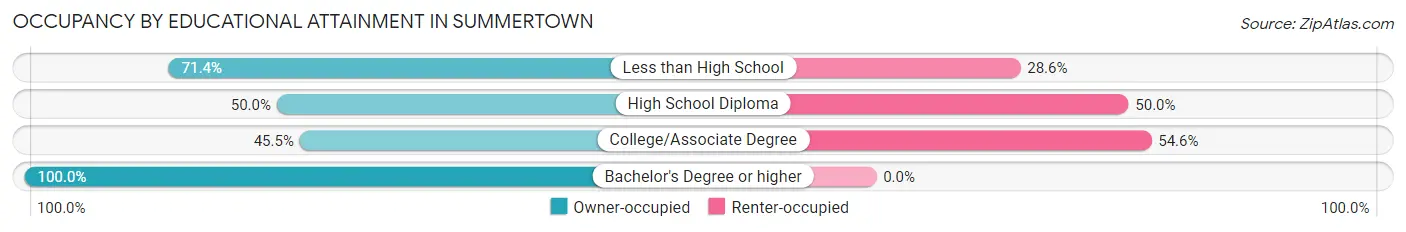
| Household Size | Owner-occupied | Renter-occupied |
| Less than High School | 20 (71.4%) | 8 (28.6%) |
| High School Diploma | 8 (50.0%) | 8 (50.0%) |
| College/Associate Degree | 5 (45.5%) | 6 (54.5%) |
| Bachelor's Degree or higher | 17 (100.0%) | 0 (0.0%) |
Occupancy by Age of Householder in Summertown
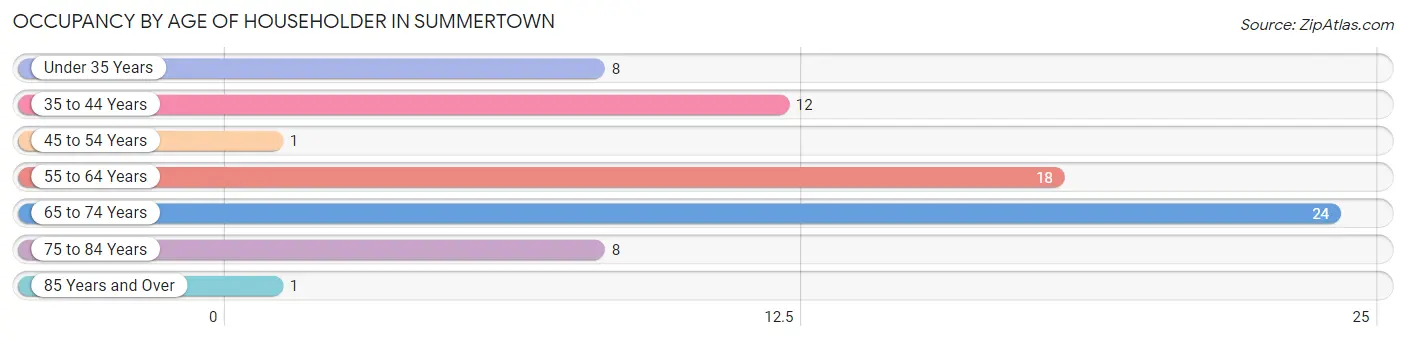
| Age Bracket | # Households | % Households |
| Under 35 Years | 8 | 11.1% |
| 35 to 44 Years | 12 | 16.7% |
| 45 to 54 Years | 1 | 1.4% |
| 55 to 64 Years | 18 | 25.0% |
| 65 to 74 Years | 24 | 33.3% |
| 75 to 84 Years | 8 | 11.1% |
| 85 Years and Over | 1 | 1.4% |
| Total | 72 | 100.0% |
Housing Finances in Summertown
Median Income by Occupancy in Summertown
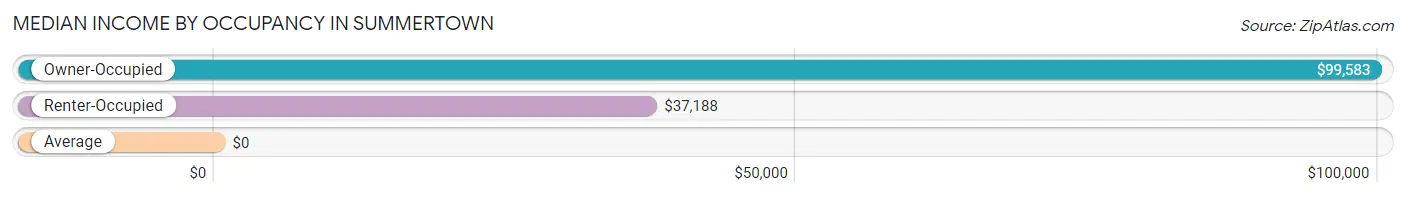
| Occupancy Type | # Households | Median Income |
| Owner-Occupied | 50 (69.4%) | $99,583 |
| Renter-Occupied | 22 (30.6%) | $37,188 |
| Average | 72 (100.0%) | $0 |
Occupancy by Householder Income Bracket in Summertown
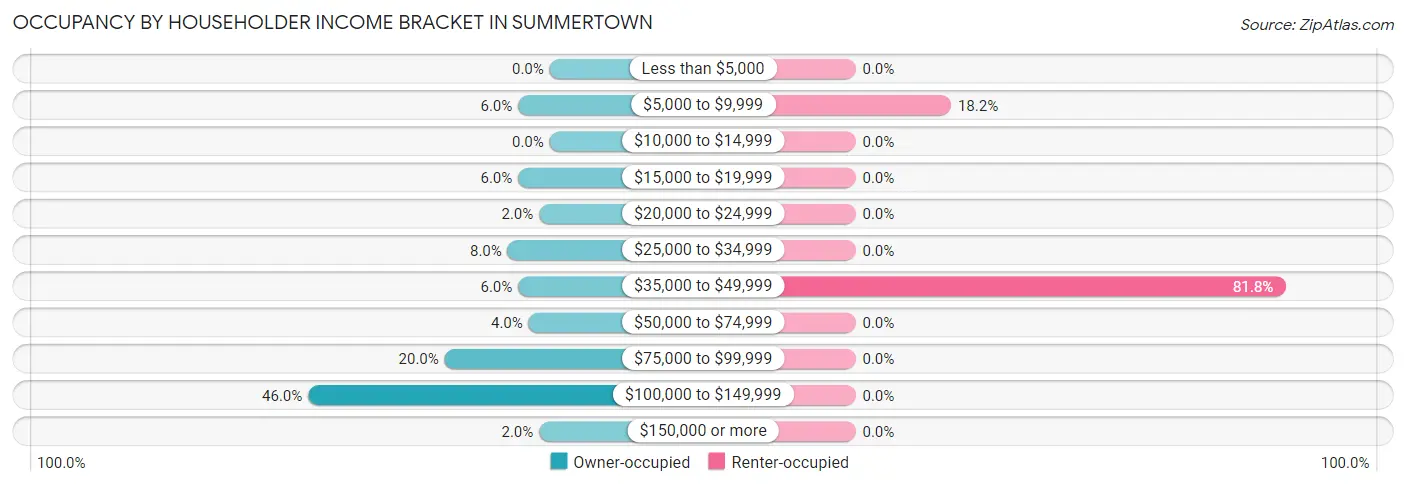
| Income Bracket | Owner-occupied | Renter-occupied |
| Less than $5,000 | 0 (0.0%) | 0 (0.0%) |
| $5,000 to $9,999 | 3 (6.0%) | 4 (18.2%) |
| $10,000 to $14,999 | 0 (0.0%) | 0 (0.0%) |
| $15,000 to $19,999 | 3 (6.0%) | 0 (0.0%) |
| $20,000 to $24,999 | 1 (2.0%) | 0 (0.0%) |
| $25,000 to $34,999 | 4 (8.0%) | 0 (0.0%) |
| $35,000 to $49,999 | 3 (6.0%) | 18 (81.8%) |
| $50,000 to $74,999 | 2 (4.0%) | 0 (0.0%) |
| $75,000 to $99,999 | 10 (20.0%) | 0 (0.0%) |
| $100,000 to $149,999 | 23 (46.0%) | 0 (0.0%) |
| $150,000 or more | 1 (2.0%) | 0 (0.0%) |
| Total | 50 (100.0%) | 22 (100.0%) |
Monthly Housing Cost Tiers in Summertown
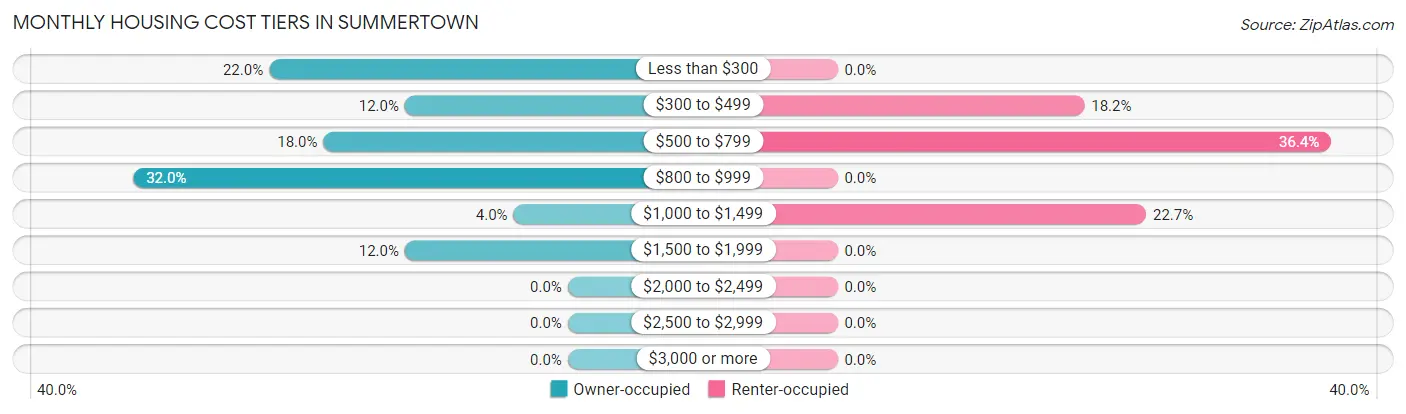
| Monthly Cost | Owner-occupied | Renter-occupied |
| Less than $300 | 11 (22.0%) | 0 (0.0%) |
| $300 to $499 | 6 (12.0%) | 4 (18.2%) |
| $500 to $799 | 9 (18.0%) | 8 (36.4%) |
| $800 to $999 | 16 (32.0%) | 0 (0.0%) |
| $1,000 to $1,499 | 2 (4.0%) | 5 (22.7%) |
| $1,500 to $1,999 | 6 (12.0%) | 0 (0.0%) |
| $2,000 to $2,499 | 0 (0.0%) | 0 (0.0%) |
| $2,500 to $2,999 | 0 (0.0%) | 0 (0.0%) |
| $3,000 or more | 0 (0.0%) | 0 (0.0%) |
| Total | 50 (100.0%) | 22 (100.0%) |
Physical Housing Characteristics in Summertown
Housing Structures in Summertown
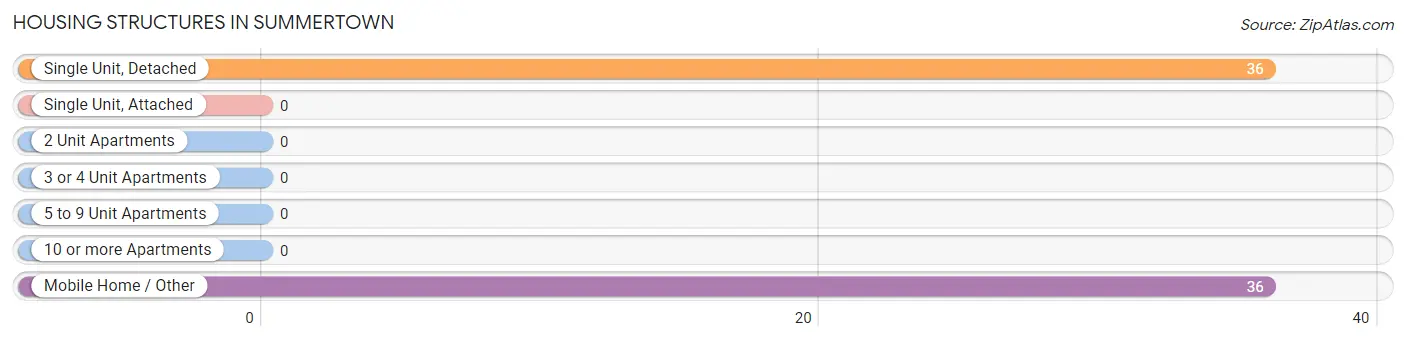
| Structure Type | # Housing Units | % Housing Units |
| Single Unit, Detached | 36 | 50.0% |
| Single Unit, Attached | 0 | 0.0% |
| 2 Unit Apartments | 0 | 0.0% |
| 3 or 4 Unit Apartments | 0 | 0.0% |
| 5 to 9 Unit Apartments | 0 | 0.0% |
| 10 or more Apartments | 0 | 0.0% |
| Mobile Home / Other | 36 | 50.0% |
| Total | 72 | 100.0% |
Housing Structures by Occupancy in Summertown
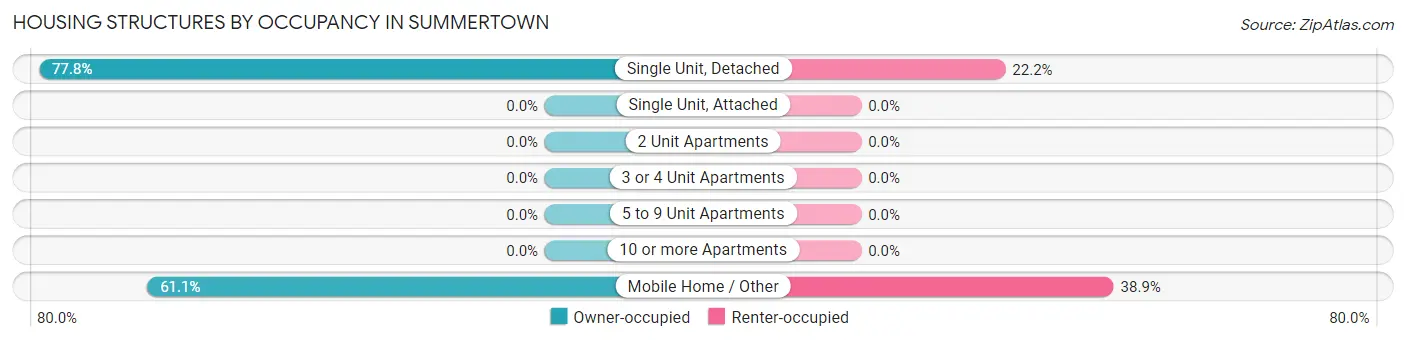
| Structure Type | Owner-occupied | Renter-occupied |
| Single Unit, Detached | 28 (77.8%) | 8 (22.2%) |
| Single Unit, Attached | 0 (0.0%) | 0 (0.0%) |
| 2 Unit Apartments | 0 (0.0%) | 0 (0.0%) |
| 3 or 4 Unit Apartments | 0 (0.0%) | 0 (0.0%) |
| 5 to 9 Unit Apartments | 0 (0.0%) | 0 (0.0%) |
| 10 or more Apartments | 0 (0.0%) | 0 (0.0%) |
| Mobile Home / Other | 22 (61.1%) | 14 (38.9%) |
| Total | 50 (69.4%) | 22 (30.6%) |
Housing Structures by Number of Rooms in Summertown
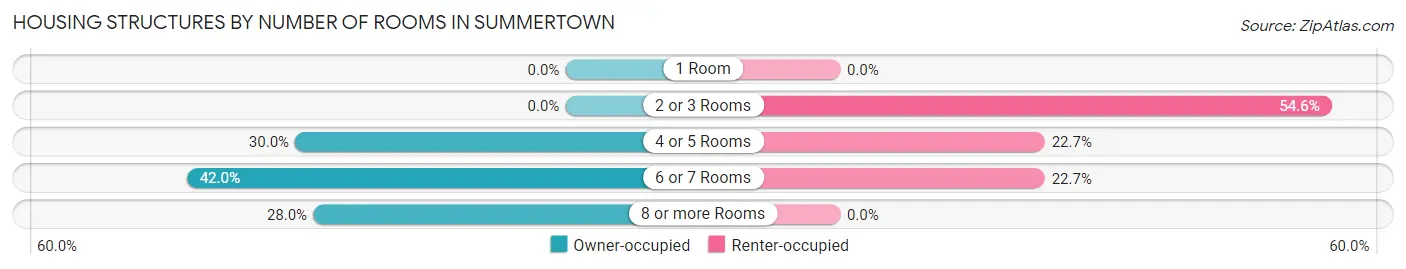
| Number of Rooms | Owner-occupied | Renter-occupied |
| 1 Room | 0 (0.0%) | 0 (0.0%) |
| 2 or 3 Rooms | 0 (0.0%) | 12 (54.5%) |
| 4 or 5 Rooms | 15 (30.0%) | 5 (22.7%) |
| 6 or 7 Rooms | 21 (42.0%) | 5 (22.7%) |
| 8 or more Rooms | 14 (28.0%) | 0 (0.0%) |
| Total | 50 (100.0%) | 22 (100.0%) |
Housing Structure by Heating Type in Summertown
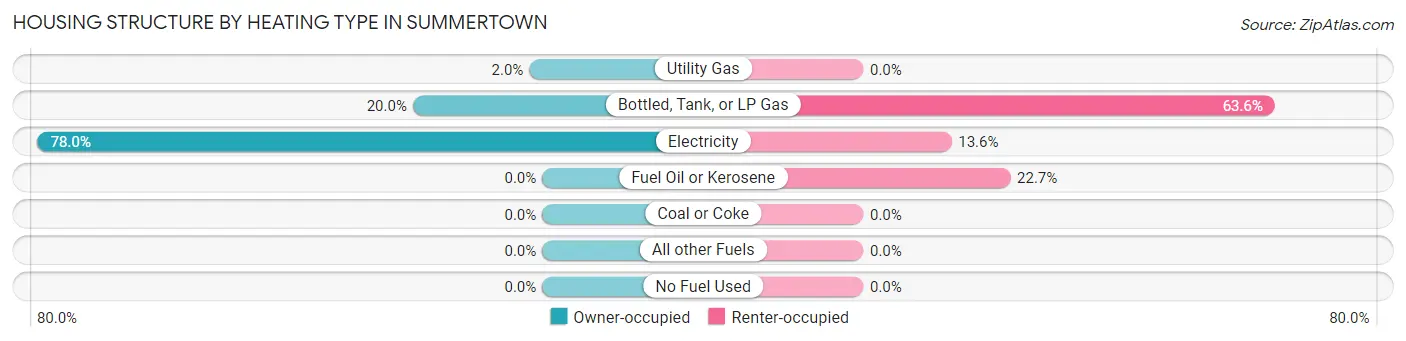
| Heating Type | Owner-occupied | Renter-occupied |
| Utility Gas | 1 (2.0%) | 0 (0.0%) |
| Bottled, Tank, or LP Gas | 10 (20.0%) | 14 (63.6%) |
| Electricity | 39 (78.0%) | 3 (13.6%) |
| Fuel Oil or Kerosene | 0 (0.0%) | 5 (22.7%) |
| Coal or Coke | 0 (0.0%) | 0 (0.0%) |
| All other Fuels | 0 (0.0%) | 0 (0.0%) |
| No Fuel Used | 0 (0.0%) | 0 (0.0%) |
| Total | 50 (100.0%) | 22 (100.0%) |
Household Vehicle Usage in Summertown
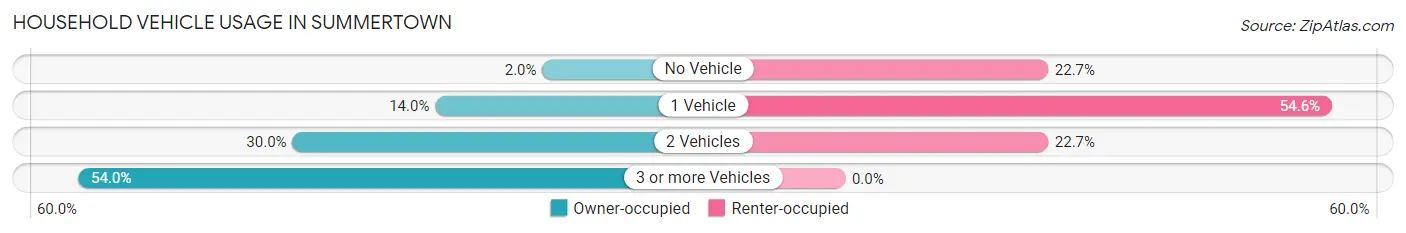
| Vehicles per Household | Owner-occupied | Renter-occupied |
| No Vehicle | 1 (2.0%) | 5 (22.7%) |
| 1 Vehicle | 7 (14.0%) | 12 (54.5%) |
| 2 Vehicles | 15 (30.0%) | 5 (22.7%) |
| 3 or more Vehicles | 27 (54.0%) | 0 (0.0%) |
| Total | 50 (100.0%) | 22 (100.0%) |
Real Estate & Mortgages in Summertown
Real Estate and Mortgage Overview in Summertown
| Characteristic | Without Mortgage | With Mortgage |
| Housing Units | 27 | 23 |
| Median Property Value | - | - |
| Median Household Income | - | - |
| Monthly Housing Costs | $375 | $0 |
| Real Estate Taxes | - | - |
Property Value by Mortgage Status in Summertown
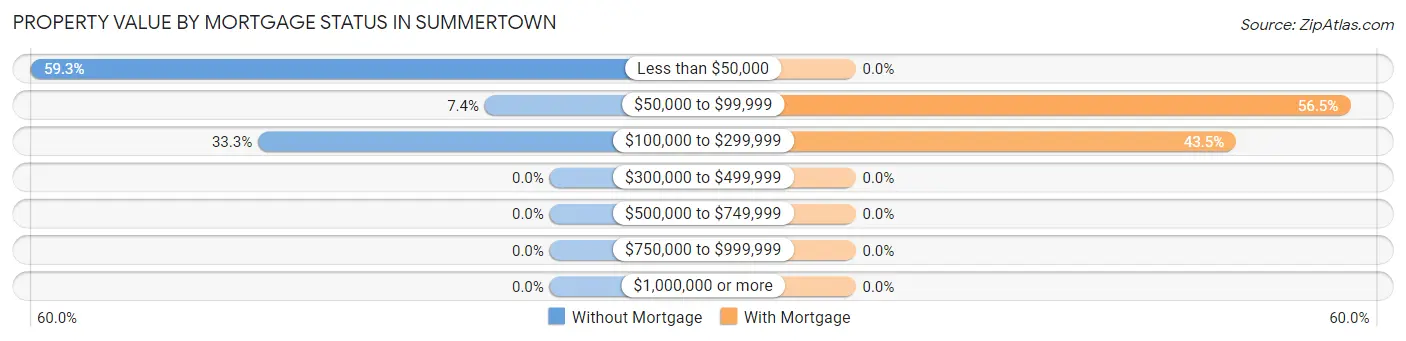
| Property Value | Without Mortgage | With Mortgage |
| Less than $50,000 | 16 (59.3%) | 0 (0.0%) |
| $50,000 to $99,999 | 2 (7.4%) | 13 (56.5%) |
| $100,000 to $299,999 | 9 (33.3%) | 10 (43.5%) |
| $300,000 to $499,999 | 0 (0.0%) | 0 (0.0%) |
| $500,000 to $749,999 | 0 (0.0%) | 0 (0.0%) |
| $750,000 to $999,999 | 0 (0.0%) | 0 (0.0%) |
| $1,000,000 or more | 0 (0.0%) | 0 (0.0%) |
| Total | 27 (100.0%) | 23 (100.0%) |
Household Income by Mortgage Status in Summertown
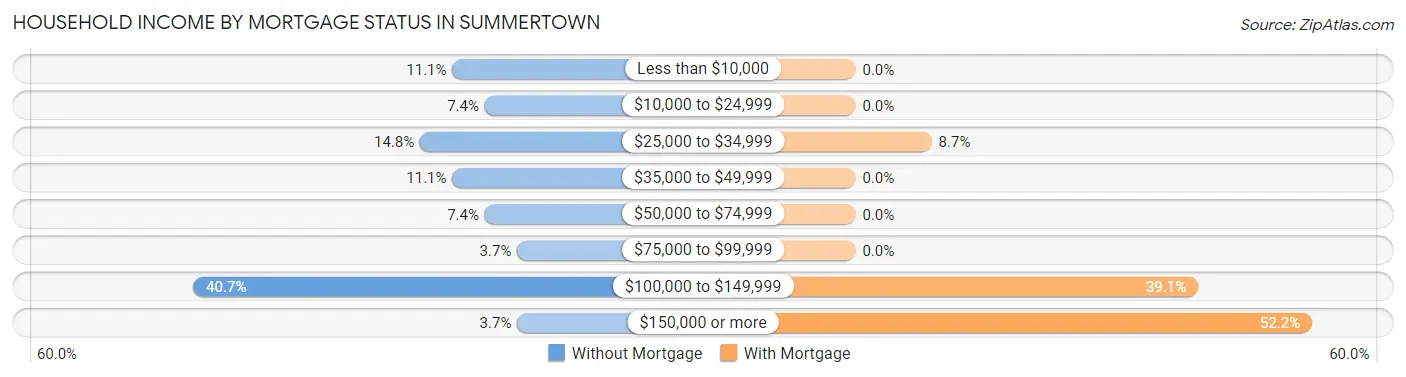
| Household Income | Without Mortgage | With Mortgage |
| Less than $10,000 | 3 (11.1%) | 0 (0.0%) |
| $10,000 to $24,999 | 2 (7.4%) | 0 (0.0%) |
| $25,000 to $34,999 | 4 (14.8%) | 2 (8.7%) |
| $35,000 to $49,999 | 3 (11.1%) | 0 (0.0%) |
| $50,000 to $74,999 | 2 (7.4%) | 0 (0.0%) |
| $75,000 to $99,999 | 1 (3.7%) | 0 (0.0%) |
| $100,000 to $149,999 | 11 (40.7%) | 9 (39.1%) |
| $150,000 or more | 1 (3.7%) | 12 (52.2%) |
| Total | 27 (100.0%) | 23 (100.0%) |
Property Value to Household Income Ratio in Summertown
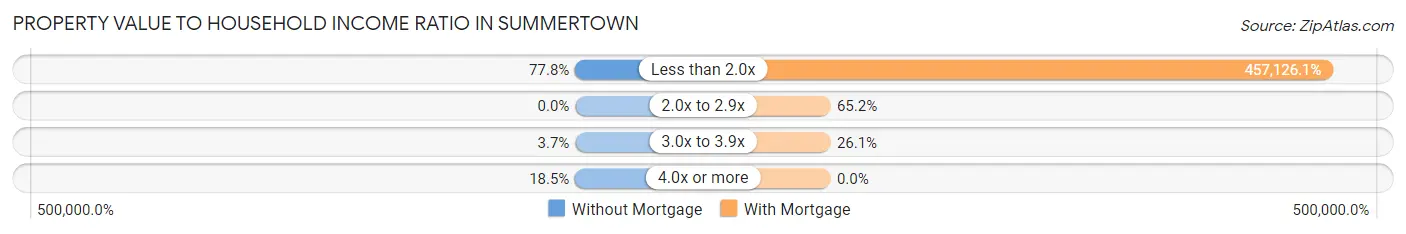
| Value-to-Income Ratio | Without Mortgage | With Mortgage |
| Less than 2.0x | 21 (77.8%) | 105,139 (457,126.1%) |
| 2.0x to 2.9x | 0 (0.0%) | 15 (65.2%) |
| 3.0x to 3.9x | 1 (3.7%) | 6 (26.1%) |
| 4.0x or more | 5 (18.5%) | 0 (0.0%) |
| Total | 27 (100.0%) | 23 (100.0%) |
Real Estate Taxes by Mortgage Status in Summertown
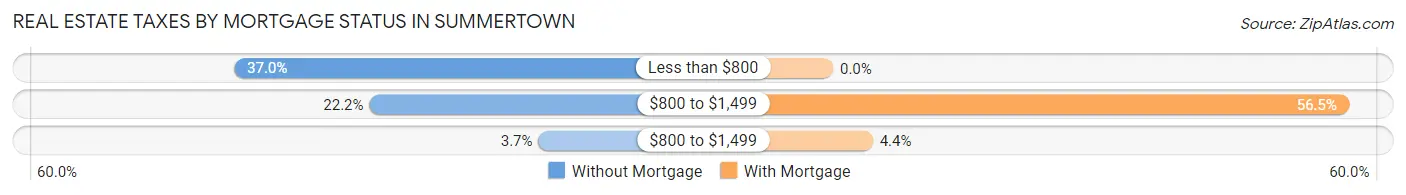
| Property Taxes | Without Mortgage | With Mortgage |
| Less than $800 | 10 (37.0%) | 0 (0.0%) |
| $800 to $1,499 | 6 (22.2%) | 13 (56.5%) |
| $800 to $1,499 | 1 (3.7%) | 1 (4.3%) |
| Total | 27 (100.0%) | 23 (100.0%) |
Health & Disability in Summertown
Health Insurance Coverage by Age in Summertown
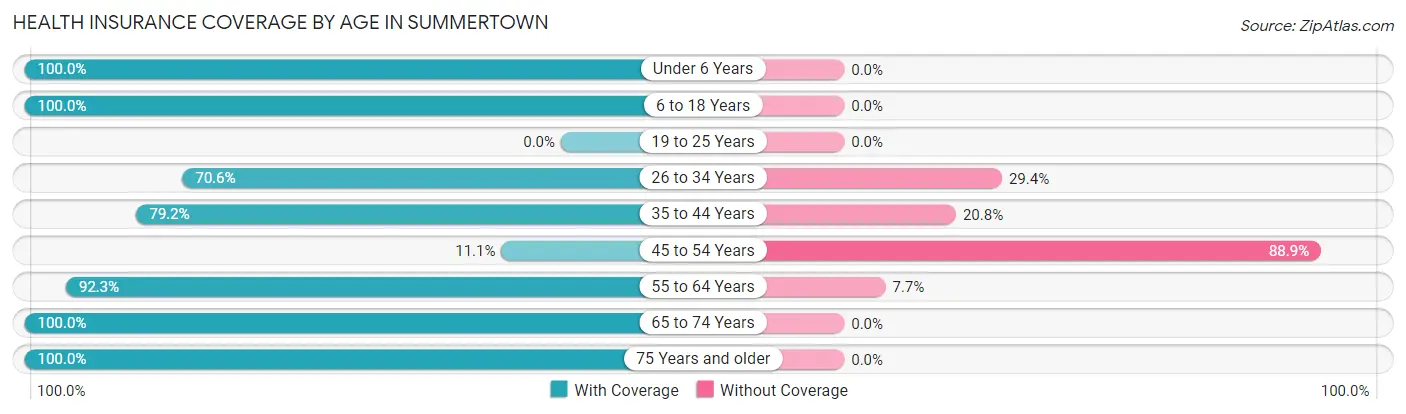
| Age Bracket | With Coverage | Without Coverage |
| Under 6 Years | 18 (100.0%) | 0 (0.0%) |
| 6 to 18 Years | 88 (100.0%) | 0 (0.0%) |
| 19 to 25 Years | 0 (0.0%) | 0 (0.0%) |
| 26 to 34 Years | 12 (70.6%) | 5 (29.4%) |
| 35 to 44 Years | 19 (79.2%) | 5 (20.8%) |
| 45 to 54 Years | 2 (11.1%) | 16 (88.9%) |
| 55 to 64 Years | 36 (92.3%) | 3 (7.7%) |
| 65 to 74 Years | 39 (100.0%) | 0 (0.0%) |
| 75 Years and older | 17 (100.0%) | 0 (0.0%) |
| Total | 231 (88.8%) | 29 (11.2%) |
Health Insurance Coverage by Citizenship Status in Summertown
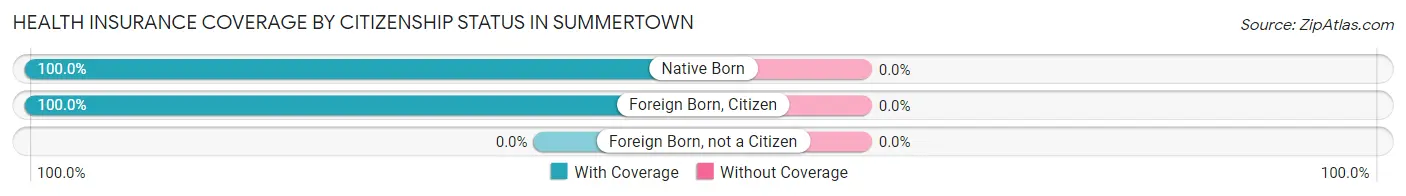
| Citizenship Status | With Coverage | Without Coverage |
| Native Born | 18 (100.0%) | 0 (0.0%) |
| Foreign Born, Citizen | 88 (100.0%) | 0 (0.0%) |
| Foreign Born, not a Citizen | 0 (0.0%) | 0 (0.0%) |
Health Insurance Coverage by Household Income in Summertown
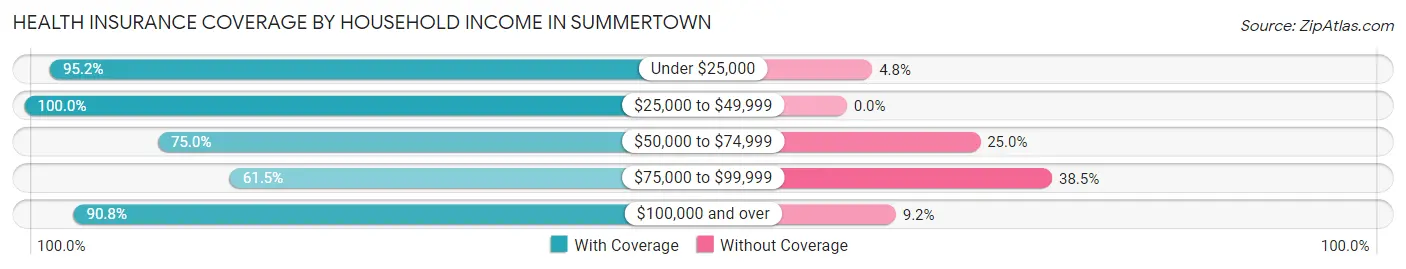
| Household Income | With Coverage | Without Coverage |
| Under $25,000 | 60 (95.2%) | 3 (4.8%) |
| $25,000 to $49,999 | 52 (100.0%) | 0 (0.0%) |
| $50,000 to $74,999 | 6 (75.0%) | 2 (25.0%) |
| $75,000 to $99,999 | 24 (61.5%) | 15 (38.5%) |
| $100,000 and over | 89 (90.8%) | 9 (9.2%) |
Public vs Private Health Insurance Coverage by Age in Summertown
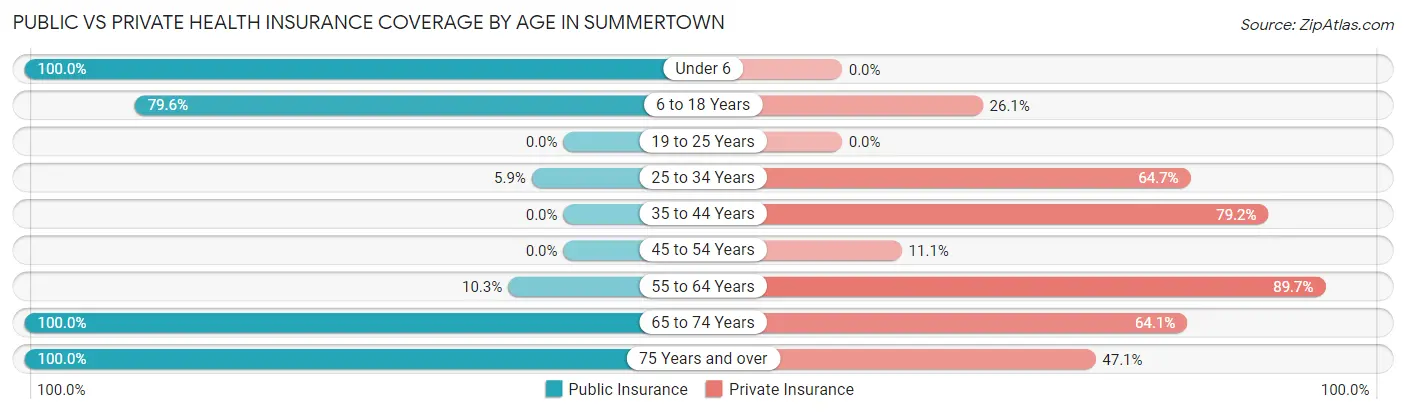
| Age Bracket | Public Insurance | Private Insurance |
| Under 6 | 18 (100.0%) | 0 (0.0%) |
| 6 to 18 Years | 70 (79.5%) | 23 (26.1%) |
| 19 to 25 Years | 0 (0.0%) | 0 (0.0%) |
| 25 to 34 Years | 1 (5.9%) | 11 (64.7%) |
| 35 to 44 Years | 0 (0.0%) | 19 (79.2%) |
| 45 to 54 Years | 0 (0.0%) | 2 (11.1%) |
| 55 to 64 Years | 4 (10.3%) | 35 (89.7%) |
| 65 to 74 Years | 39 (100.0%) | 25 (64.1%) |
| 75 Years and over | 17 (100.0%) | 8 (47.1%) |
| Total | 149 (57.3%) | 123 (47.3%) |
Disability Status by Sex by Age in Summertown
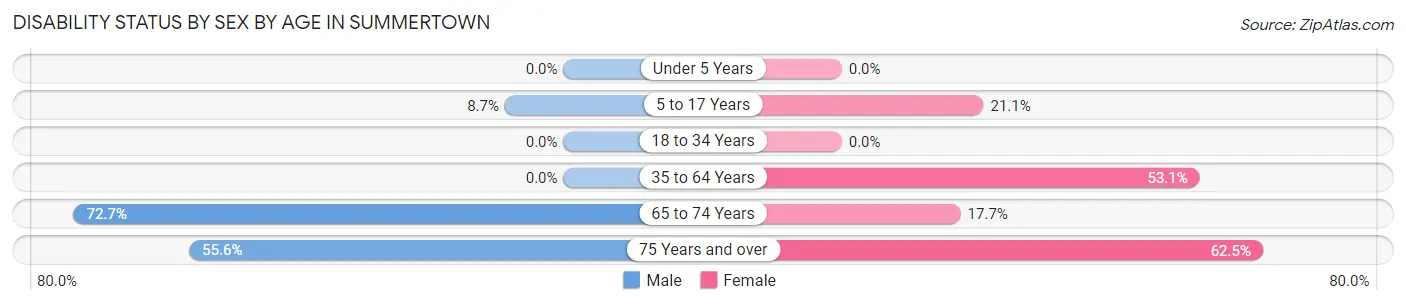
| Age Bracket | Male | Female |
| Under 5 Years | 0 (0.0%) | 0 (0.0%) |
| 5 to 17 Years | 6 (8.7%) | 4 (21.0%) |
| 18 to 34 Years | 0 (0.0%) | 0 (0.0%) |
| 35 to 64 Years | 0 (0.0%) | 17 (53.1%) |
| 65 to 74 Years | 16 (72.7%) | 3 (17.6%) |
| 75 Years and over | 5 (55.6%) | 5 (62.5%) |
Disability Class by Sex by Age in Summertown
Disability Class: Hearing Difficulty
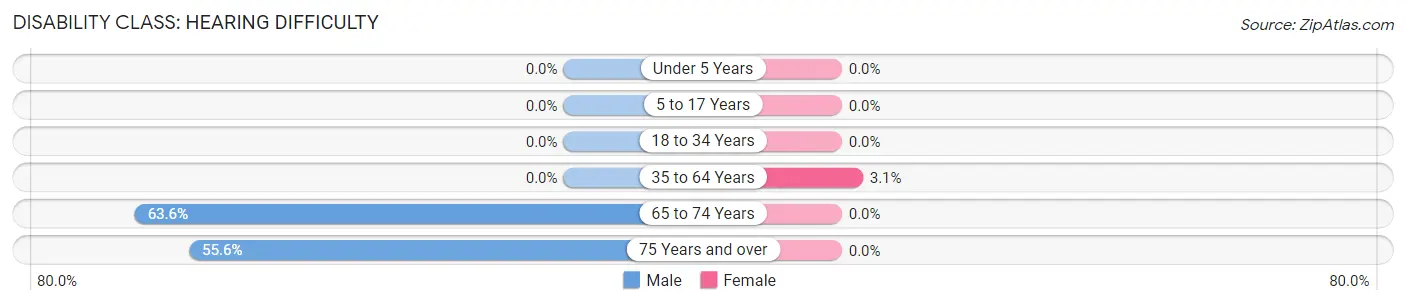
| Age Bracket | Male | Female |
| Under 5 Years | 0 (0.0%) | 0 (0.0%) |
| 5 to 17 Years | 0 (0.0%) | 0 (0.0%) |
| 18 to 34 Years | 0 (0.0%) | 0 (0.0%) |
| 35 to 64 Years | 0 (0.0%) | 1 (3.1%) |
| 65 to 74 Years | 14 (63.6%) | 0 (0.0%) |
| 75 Years and over | 5 (55.6%) | 0 (0.0%) |
Disability Class: Vision Difficulty
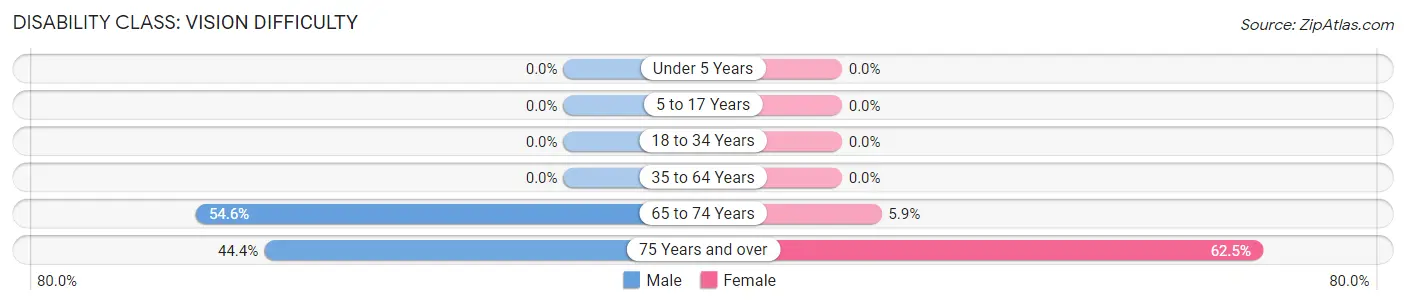
| Age Bracket | Male | Female |
| Under 5 Years | 0 (0.0%) | 0 (0.0%) |
| 5 to 17 Years | 0 (0.0%) | 0 (0.0%) |
| 18 to 34 Years | 0 (0.0%) | 0 (0.0%) |
| 35 to 64 Years | 0 (0.0%) | 0 (0.0%) |
| 65 to 74 Years | 12 (54.5%) | 1 (5.9%) |
| 75 Years and over | 4 (44.4%) | 5 (62.5%) |
Disability Class: Cognitive Difficulty
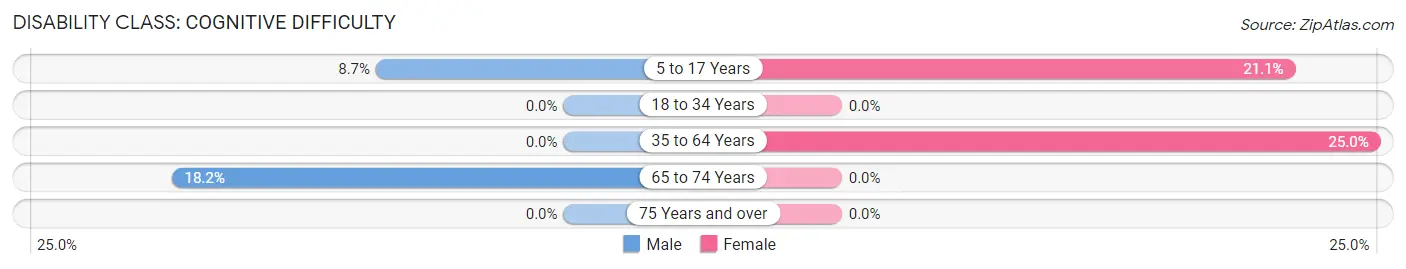
| Age Bracket | Male | Female |
| 5 to 17 Years | 6 (8.7%) | 4 (21.0%) |
| 18 to 34 Years | 0 (0.0%) | 0 (0.0%) |
| 35 to 64 Years | 0 (0.0%) | 8 (25.0%) |
| 65 to 74 Years | 4 (18.2%) | 0 (0.0%) |
| 75 Years and over | 0 (0.0%) | 0 (0.0%) |
Disability Class: Ambulatory Difficulty
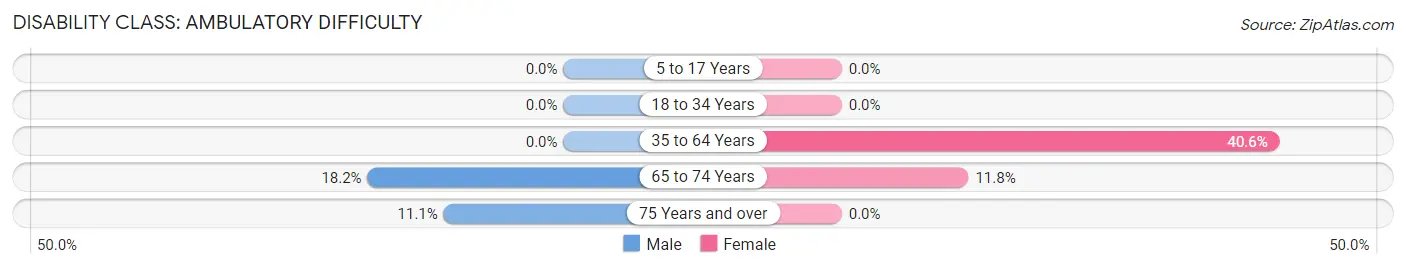
| Age Bracket | Male | Female |
| 5 to 17 Years | 0 (0.0%) | 0 (0.0%) |
| 18 to 34 Years | 0 (0.0%) | 0 (0.0%) |
| 35 to 64 Years | 0 (0.0%) | 13 (40.6%) |
| 65 to 74 Years | 4 (18.2%) | 2 (11.8%) |
| 75 Years and over | 1 (11.1%) | 0 (0.0%) |
Disability Class: Self-Care Difficulty
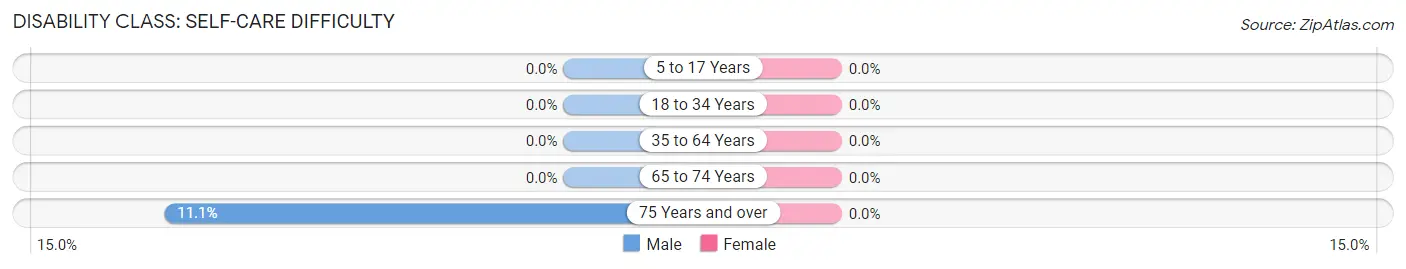
| Age Bracket | Male | Female |
| 5 to 17 Years | 0 (0.0%) | 0 (0.0%) |
| 18 to 34 Years | 0 (0.0%) | 0 (0.0%) |
| 35 to 64 Years | 0 (0.0%) | 0 (0.0%) |
| 65 to 74 Years | 0 (0.0%) | 0 (0.0%) |
| 75 Years and over | 1 (11.1%) | 0 (0.0%) |
Technology Access in Summertown
Computing Device Access in Summertown
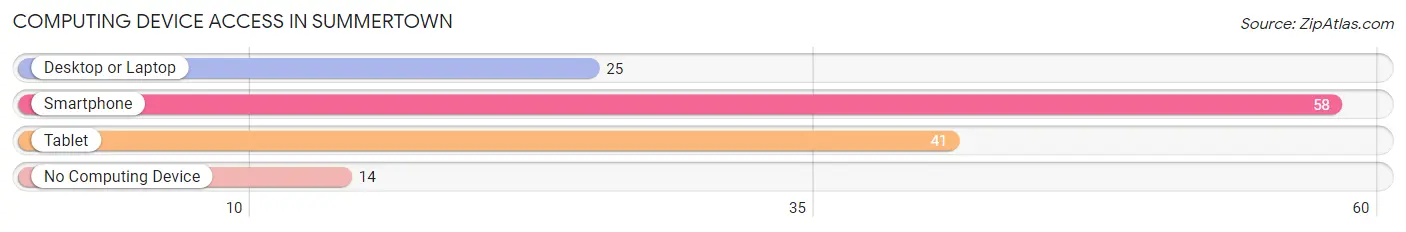
| Device Type | # Households | % Households |
| Desktop or Laptop | 25 | 34.7% |
| Smartphone | 58 | 80.6% |
| Tablet | 41 | 56.9% |
| No Computing Device | 14 | 19.4% |
| Total | 72 | 100.0% |
Internet Access in Summertown
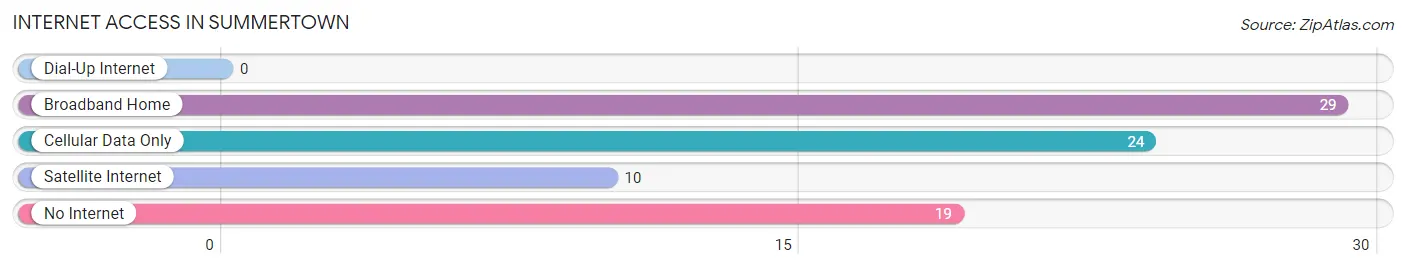
| Internet Type | # Households | % Households |
| Dial-Up Internet | 0 | 0.0% |
| Broadband Home | 29 | 40.3% |
| Cellular Data Only | 24 | 33.3% |
| Satellite Internet | 10 | 13.9% |
| No Internet | 19 | 26.4% |
| Total | 72 | 100.0% |
Summertown Summary
History
The small town of Summertown, Georgia is located in the southeastern corner of the state, just north of the Florida border. It is part of the larger metropolitan area of Valdosta, Georgia, and is located in Lowndes County. The town was founded in 1872 by a group of settlers from South Carolina who were looking for a place to settle and start a new life. The town was named after the summer season, as the settlers believed that the warm climate and abundant sunshine would make it an ideal place to live.
The town quickly grew and prospered, and by the early 1900s, it had become a thriving agricultural community. Cotton was the main crop grown in the area, and the town was home to several cotton gins and other businesses related to the industry. The town also had a number of stores, churches, and other businesses that served the local population.
In the 1950s, the town began to experience a decline in population as many of the younger residents moved away to larger cities in search of better job opportunities. This trend continued into the 1970s, and by the 1980s, the town had become a small, rural community with a population of just over 1,000 people.
Geography
Summertown is located in the southeastern corner of Georgia, just north of the Florida border. It is part of the larger metropolitan area of Valdosta, Georgia, and is located in Lowndes County. The town is situated on the banks of the Withlacoochee River, which flows through the area and provides a source of recreation for the local population.
The town is surrounded by a number of small towns and rural communities, including Quitman, Hahira, and Lake Park. The area is mostly flat, with some rolling hills in the surrounding countryside. The climate is generally mild, with hot summers and mild winters.
Economy
The economy of Summertown is largely based on agriculture, with cotton being the main crop grown in the area. The town is also home to several small businesses, including a few restaurants, a grocery store, and a few other retail stores.
The town is also home to a number of manufacturing companies, including a paper mill and a furniture factory. These companies provide employment opportunities for the local population, and help to keep the economy of the town stable.
Demographics
As of the 2010 census, the population of Summertown was 1,093. The racial makeup of the town was 79.3% White, 17.2% African American, 0.7% Native American, 0.3% Asian, 0.1% Pacific Islander, and 2.4% from other races. The median household income was $31,250, and the median family income was $37,500.
The town is home to a number of churches, including Baptist, Methodist, and Presbyterian. The town also has a public library, a post office, and a few other public services.
Conclusion
Summertown, Georgia is a small, rural town located in the southeastern corner of the state. It is part of the larger metropolitan area of Valdosta, Georgia, and is located in Lowndes County. The town was founded in 1872 by a group of settlers from South Carolina, and has since grown into a thriving agricultural community. The town is home to a number of small businesses, manufacturing companies, and churches, and provides employment opportunities for the local population. The town has a population of just over 1,000 people, and the median household income is $31,250.
Common Questions
What is Per Capita Income in Summertown?
Per Capita income in Summertown is $19,870.
What is the Median Family Income in Summertown?
Median Family Income in Summertown is $94,063.
What is Inequality or Gini Index in Summertown?
Inequality or Gini Index in Summertown is 0.33.
What is the Total Population of Summertown?
Total Population of Summertown is 260.
What is the Total Male Population of Summertown?
Total Male Population of Summertown is 164.
What is the Total Female Population of Summertown?
Total Female Population of Summertown is 96.
What is the Ratio of Males per 100 Females in Summertown?
There are 170.83 Males per 100 Females in Summertown.
What is the Ratio of Females per 100 Males in Summertown?
There are 58.54 Females per 100 Males in Summertown.
What is the Median Population Age in Summertown?
Median Population Age in Summertown is 39.0 Years.
What is the Average Family Size in Summertown
Average Family Size in Summertown is 4.2 People.
What is the Average Household Size in Summertown
Average Household Size in Summertown is 3.6 People.
How Large is the Labor Force in Summertown?
There are 86 People in the Labor Forcein in Summertown.
What is the Percentage of People in the Labor Force in Summertown?
54.8% of People are in the Labor Force in Summertown.
What is the Unemployment Rate in Summertown?
Unemployment Rate in Summertown is 19.8%.