Hiawassee, GA Map & Demographics
Hiawassee Map
Hiawassee Overview
$38,900
PER CAPITA INCOME
$71,250
AVG FAMILY INCOME
$40,917
AVG HOUSEHOLD INCOME
21.0%
WAGE / INCOME GAP [ % ]
79.0¢/ $1
WAGE / INCOME GAP [ $ ]
$3,911
FAMILY INCOME DEFICIT
0.59
INEQUALITY / GINI INDEX
1,140
TOTAL POPULATION
442
MALE POPULATION
698
FEMALE POPULATION
63.32
MALES / 100 FEMALES
157.92
FEMALES / 100 MALES
56.5
MEDIAN AGE
2.8
AVG FAMILY SIZE
1.9
AVG HOUSEHOLD SIZE
464
LABOR FORCE [ PEOPLE ]
46.3%
PERCENT IN LABOR FORCE
Hiawassee Zip Codes
Hiawassee Area Codes
Income in Hiawassee
Income Overview in Hiawassee
Per Capita Income in Hiawassee is $38,900, while median incomes of families and households are $71,250 and $40,917 respectively.
| Characteristic | Number | Measure |
| Per Capita Income | 1,140 | $38,900 |
| Median Family Income | 256 | $71,250 |
| Mean Family Income | 256 | $101,221 |
| Median Household Income | 515 | $40,917 |
| Mean Household Income | 515 | $81,110 |
| Income Deficit | 256 | $3,911 |
| Wage / Income Gap (%) | 1,140 | 20.96% |
| Wage / Income Gap ($) | 1,140 | 79.04¢ per $1 |
| Gini / Inequality Index | 1,140 | 0.59 |
Earnings by Sex in Hiawassee
Average Earnings in Hiawassee are $21,599, $25,500 for men and $20,156 for women, a difference of 21.0%.
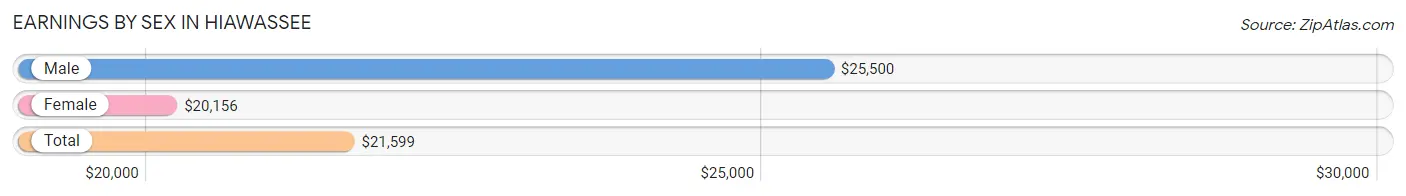
| Sex | Number | Average Earnings |
| Male | 216 (44.7%) | $25,500 |
| Female | 267 (55.3%) | $20,156 |
| Total | 483 (100.0%) | $21,599 |
Earnings by Sex by Income Bracket in Hiawassee
The most common earnings brackets in Hiawassee are $45,000 to $49,999 for men (46 | 21.3%) and $15,000 to $17,499 for women (54 | 20.2%).
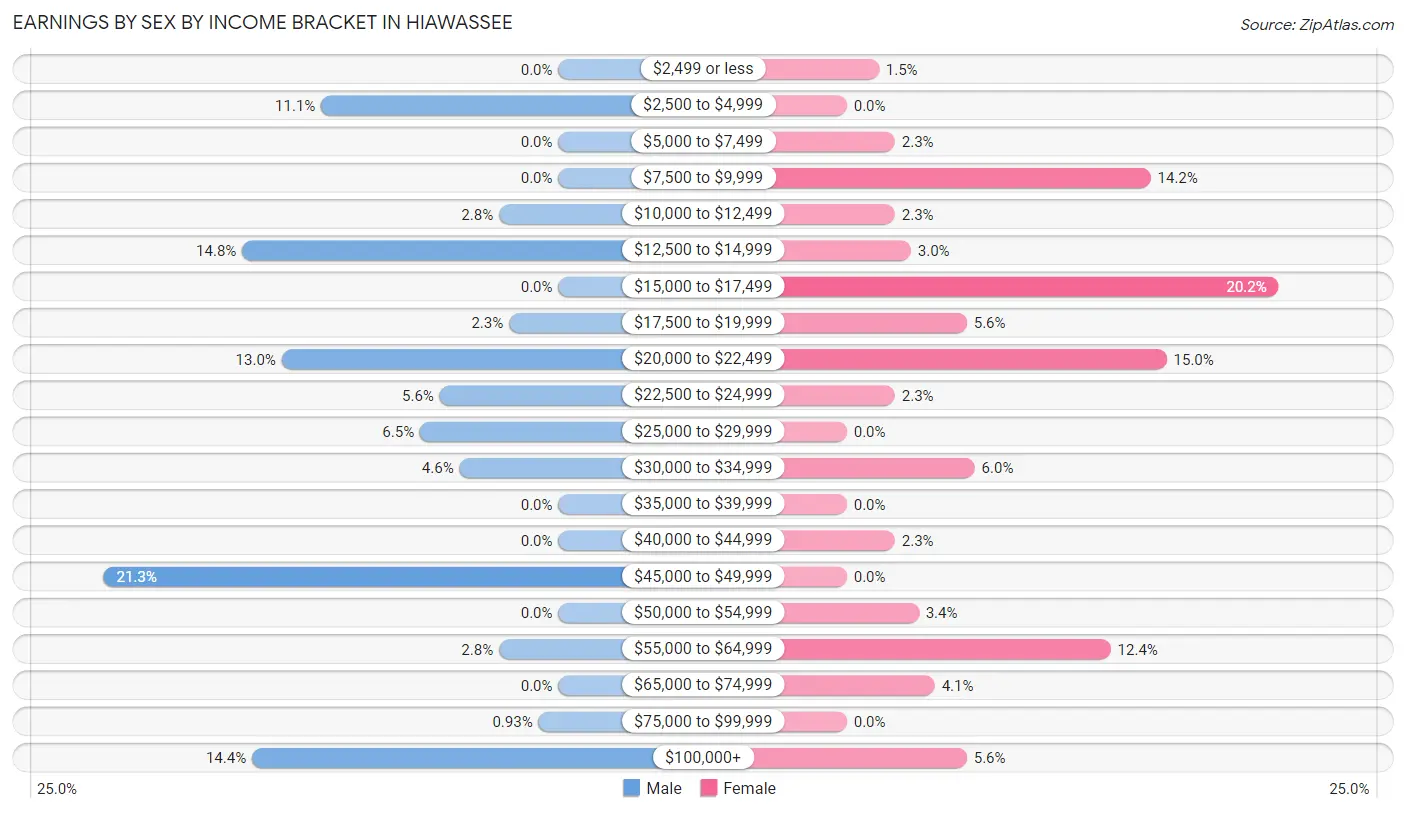
| Income | Male | Female |
| $2,499 or less | 0 (0.0%) | 4 (1.5%) |
| $2,500 to $4,999 | 24 (11.1%) | 0 (0.0%) |
| $5,000 to $7,499 | 0 (0.0%) | 6 (2.2%) |
| $7,500 to $9,999 | 0 (0.0%) | 38 (14.2%) |
| $10,000 to $12,499 | 6 (2.8%) | 6 (2.2%) |
| $12,500 to $14,999 | 32 (14.8%) | 8 (3.0%) |
| $15,000 to $17,499 | 0 (0.0%) | 54 (20.2%) |
| $17,500 to $19,999 | 5 (2.3%) | 15 (5.6%) |
| $20,000 to $22,499 | 28 (13.0%) | 40 (15.0%) |
| $22,500 to $24,999 | 12 (5.6%) | 6 (2.2%) |
| $25,000 to $29,999 | 14 (6.5%) | 0 (0.0%) |
| $30,000 to $34,999 | 10 (4.6%) | 16 (6.0%) |
| $35,000 to $39,999 | 0 (0.0%) | 0 (0.0%) |
| $40,000 to $44,999 | 0 (0.0%) | 6 (2.2%) |
| $45,000 to $49,999 | 46 (21.3%) | 0 (0.0%) |
| $50,000 to $54,999 | 0 (0.0%) | 9 (3.4%) |
| $55,000 to $64,999 | 6 (2.8%) | 33 (12.4%) |
| $65,000 to $74,999 | 0 (0.0%) | 11 (4.1%) |
| $75,000 to $99,999 | 2 (0.9%) | 0 (0.0%) |
| $100,000+ | 31 (14.3%) | 15 (5.6%) |
| Total | 216 (100.0%) | 267 (100.0%) |
Earnings by Sex by Educational Attainment in Hiawassee
Average earnings in Hiawassee are $23,646 for men and $21,532 for women, a difference of 8.9%. Men with an educational attainment of college or associate's degree enjoy the highest average annual earnings of $41,250, while those with college or associate's degree education earn the least with $41,250. Women with an educational attainment of less than high school earn the most with the average annual earnings of $15,847, while those with less than high school education have the smallest earnings of $15,847.
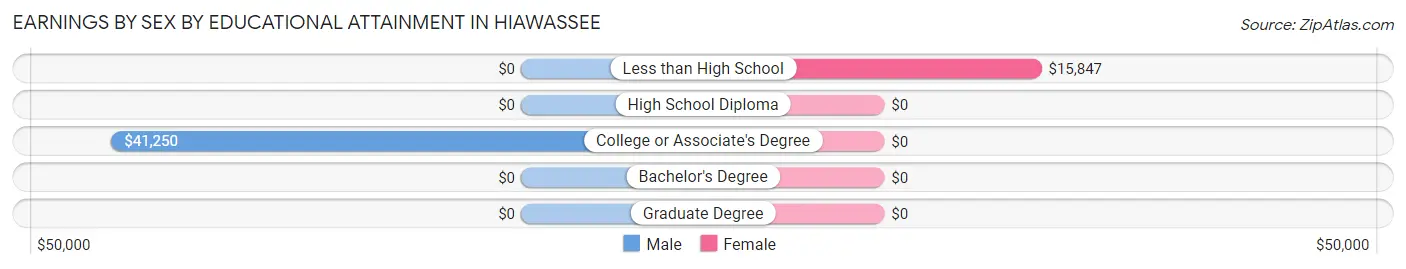
| Educational Attainment | Male Income | Female Income |
| Less than High School | - | - |
| High School Diploma | - | - |
| College or Associate's Degree | $41,250 | $0 |
| Bachelor's Degree | - | - |
| Graduate Degree | - | - |
| Total | $23,646 | $21,532 |
Family Income in Hiawassee
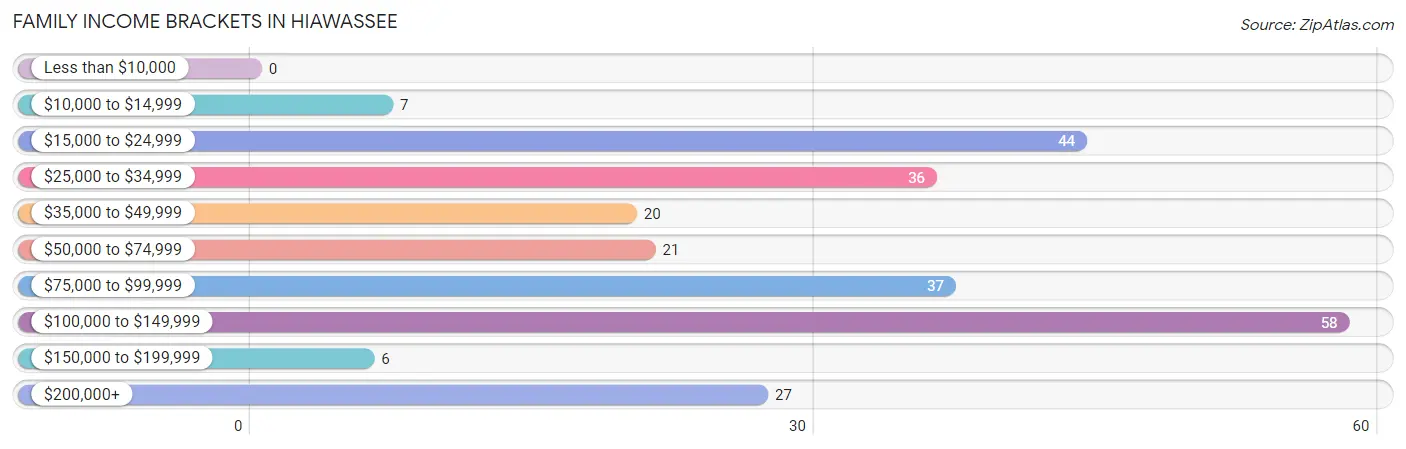
Family Income Brackets in Hiawassee
According to the Hiawassee family income data, there are 58 families falling into the $100,000 to $149,999 income range, which is the most common income bracket and makes up 22.7% of all families.
| Income Bracket | # Families | % Families |
| Less than $10,000 | 0 | 0.0% |
| $10,000 to $14,999 | 7 | 2.7% |
| $15,000 to $24,999 | 44 | 17.2% |
| $25,000 to $34,999 | 36 | 14.1% |
| $35,000 to $49,999 | 20 | 7.8% |
| $50,000 to $74,999 | 21 | 8.2% |
| $75,000 to $99,999 | 37 | 14.5% |
| $100,000 to $149,999 | 58 | 22.7% |
| $150,000 to $199,999 | 6 | 2.3% |
| $200,000+ | 27 | 10.5% |
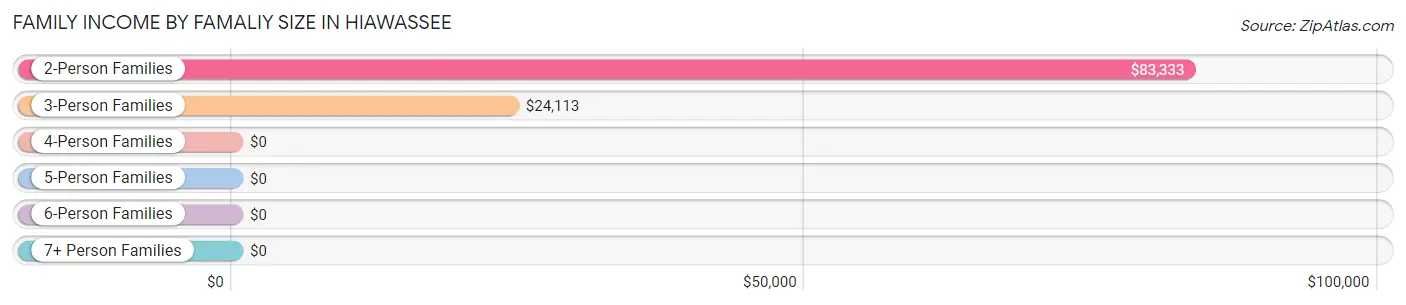
Family Income by Famaliy Size in Hiawassee
2-person families (136 | 53.1%) account for the highest median family income in Hiawassee with $83,333 per family, while 2-person families (136 | 53.1%) have the highest median income of $41,666 per family member.
| Income Bracket | # Families | Median Income |
| 2-Person Families | 136 (53.1%) | $83,333 |
| 3-Person Families | 40 (15.6%) | $24,113 |
| 4-Person Families | 60 (23.4%) | $0 |
| 5-Person Families | 20 (7.8%) | $0 |
| 6-Person Families | 0 (0.0%) | $0 |
| 7+ Person Families | 0 (0.0%) | $0 |
| Total | 256 (100.0%) | $71,250 |
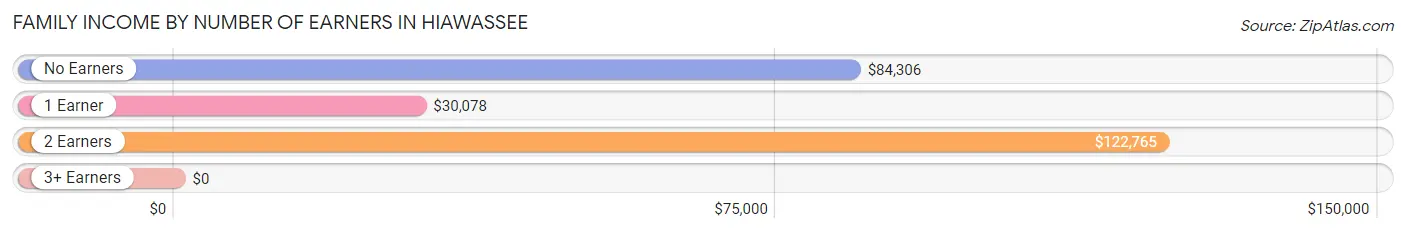
Family Income by Number of Earners in Hiawassee
| Number of Earners | # Families | Median Income |
| No Earners | 73 (28.5%) | $84,306 |
| 1 Earner | 73 (28.5%) | $30,078 |
| 2 Earners | 97 (37.9%) | $122,765 |
| 3+ Earners | 13 (5.1%) | $0 |
| Total | 256 (100.0%) | $71,250 |
Household Income in Hiawassee
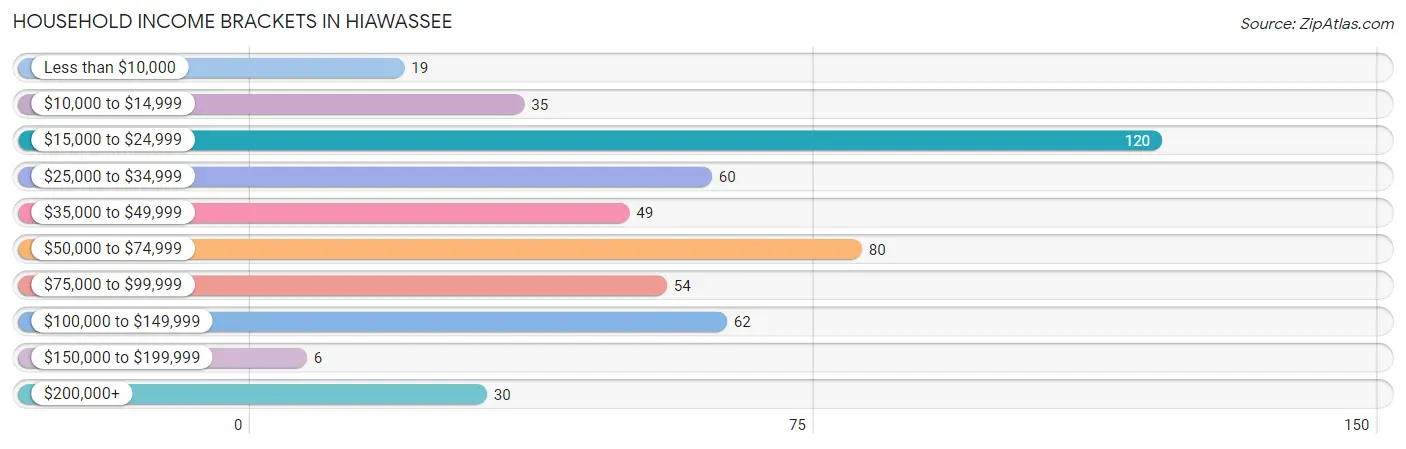
Household Income Brackets in Hiawassee
With 120 households falling in the category, the $15,000 to $24,999 income range is the most frequent in Hiawassee, accounting for 23.3% of all households. In contrast, only 6 households (1.2%) fall into the $150,000 to $199,999 income bracket, making it the least populous group.
| Income Bracket | # Households | % Households |
| Less than $10,000 | 19 | 3.7% |
| $10,000 to $14,999 | 35 | 6.8% |
| $15,000 to $24,999 | 120 | 23.3% |
| $25,000 to $34,999 | 60 | 11.7% |
| $35,000 to $49,999 | 49 | 9.5% |
| $50,000 to $74,999 | 80 | 15.5% |
| $75,000 to $99,999 | 54 | 10.5% |
| $100,000 to $149,999 | 62 | 12.0% |
| $150,000 to $199,999 | 6 | 1.2% |
| $200,000+ | 30 | 5.8% |
Household Income by Householder Age in Hiawassee
The median household income in Hiawassee is $40,917, with the highest median household income of $50,000 found in the 65+ years age bracket for the primary householder. A total of 238 households (46.2%) fall into this category. Meanwhile, the 15 to 24 years age bracket for the primary householder has the lowest median household income of $0, with 32 households (6.2%) in this group.
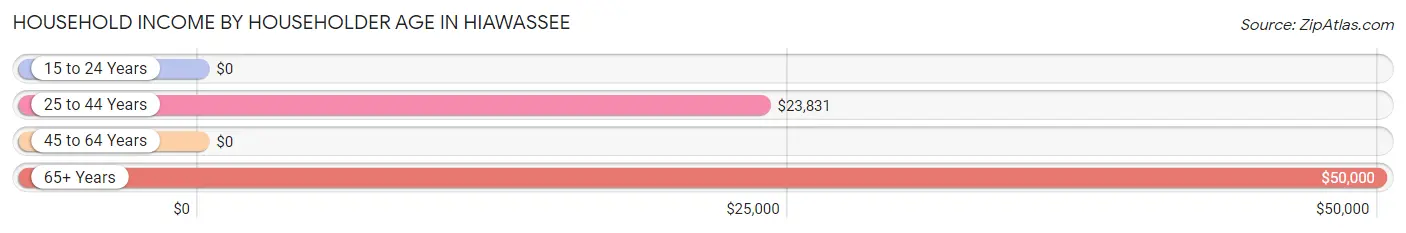
| Income Bracket | # Households | Median Income |
| 15 to 24 Years | 32 (6.2%) | $0 |
| 25 to 44 Years | 137 (26.6%) | $23,831 |
| 45 to 64 Years | 108 (21.0%) | $0 |
| 65+ Years | 238 (46.2%) | $50,000 |
| Total | 515 (100.0%) | $40,917 |
Poverty in Hiawassee
Income Below Poverty by Sex and Age in Hiawassee
With 22.2% poverty level for males and 9.1% for females among the residents of Hiawassee, 18 to 24 year old males and 55 to 64 year old females are the most vulnerable to poverty, with 18 males (54.5%) and 23 females (48.9%) in their respective age groups living below the poverty level.
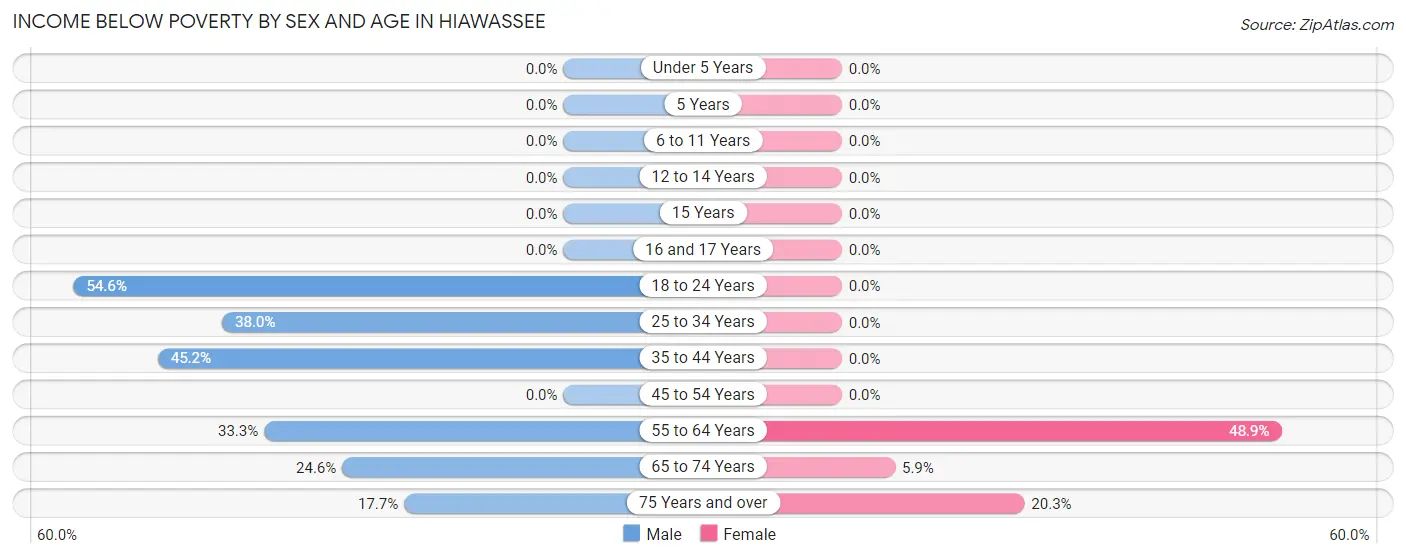
| Age Bracket | Male | Female |
| Under 5 Years | 0 (0.0%) | 0 (0.0%) |
| 5 Years | 0 (0.0%) | 0 (0.0%) |
| 6 to 11 Years | 0 (0.0%) | 0 (0.0%) |
| 12 to 14 Years | 0 (0.0%) | 0 (0.0%) |
| 15 Years | 0 (0.0%) | 0 (0.0%) |
| 16 and 17 Years | 0 (0.0%) | 0 (0.0%) |
| 18 to 24 Years | 18 (54.5%) | 0 (0.0%) |
| 25 to 34 Years | 19 (38.0%) | 0 (0.0%) |
| 35 to 44 Years | 14 (45.2%) | 0 (0.0%) |
| 45 to 54 Years | 0 (0.0%) | 0 (0.0%) |
| 55 to 64 Years | 15 (33.3%) | 23 (48.9%) |
| 65 to 74 Years | 17 (24.6%) | 7 (5.9%) |
| 75 Years and over | 11 (17.7%) | 24 (20.3%) |
| Total | 94 (22.2%) | 54 (9.1%) |
Income Above Poverty by Sex and Age in Hiawassee
According to the poverty statistics in Hiawassee, males aged under 5 years and females aged under 5 years are the age groups that are most secure financially, with 100.0% of males and 100.0% of females in these age groups living above the poverty line.
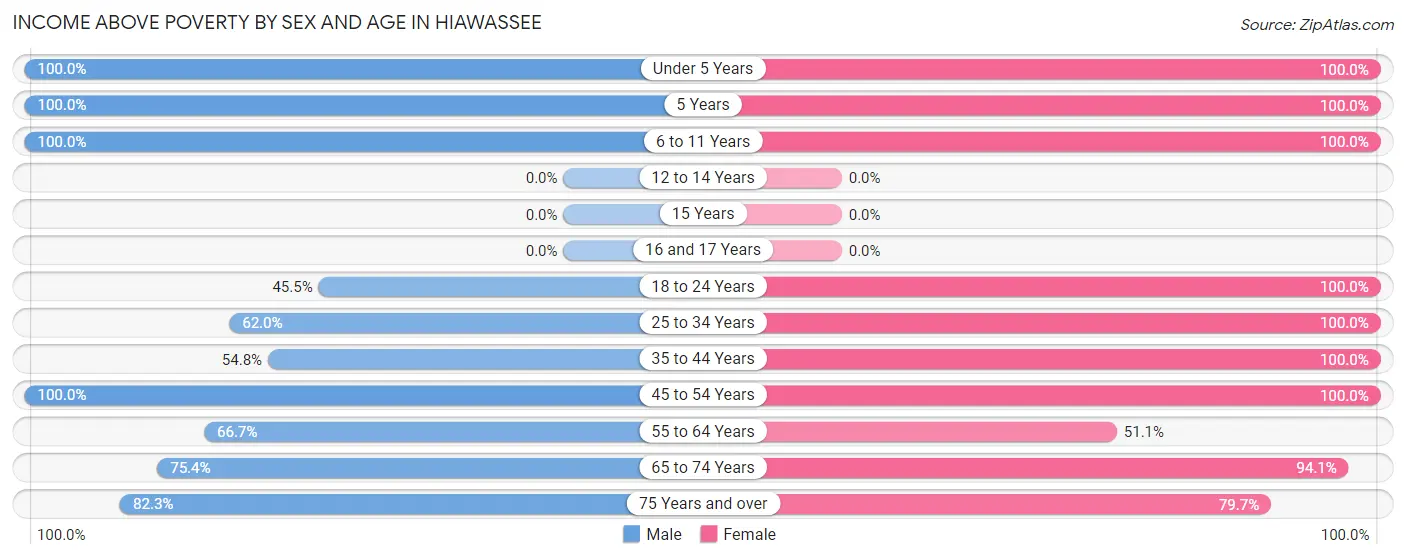
| Age Bracket | Male | Female |
| Under 5 Years | 41 (100.0%) | 8 (100.0%) |
| 5 Years | 1 (100.0%) | 10 (100.0%) |
| 6 to 11 Years | 37 (100.0%) | 41 (100.0%) |
| 12 to 14 Years | 0 (0.0%) | 0 (0.0%) |
| 15 Years | 0 (0.0%) | 0 (0.0%) |
| 16 and 17 Years | 0 (0.0%) | 0 (0.0%) |
| 18 to 24 Years | 15 (45.5%) | 51 (100.0%) |
| 25 to 34 Years | 31 (62.0%) | 57 (100.0%) |
| 35 to 44 Years | 17 (54.8%) | 78 (100.0%) |
| 45 to 54 Years | 54 (100.0%) | 63 (100.0%) |
| 55 to 64 Years | 30 (66.7%) | 24 (51.1%) |
| 65 to 74 Years | 52 (75.4%) | 111 (94.1%) |
| 75 Years and over | 51 (82.3%) | 94 (79.7%) |
| Total | 329 (77.8%) | 537 (90.9%) |
Income Below Poverty Among Married-Couple Families in Hiawassee
The poverty statistics for married-couple families in Hiawassee show that 9.4% or 18 of the total 192 families live below the poverty line. Families with no children have the highest poverty rate of 12.4%, comprising of 18 families. On the other hand, families with 1 or 2 children have the lowest poverty rate of 0.0%, which includes 0 families.
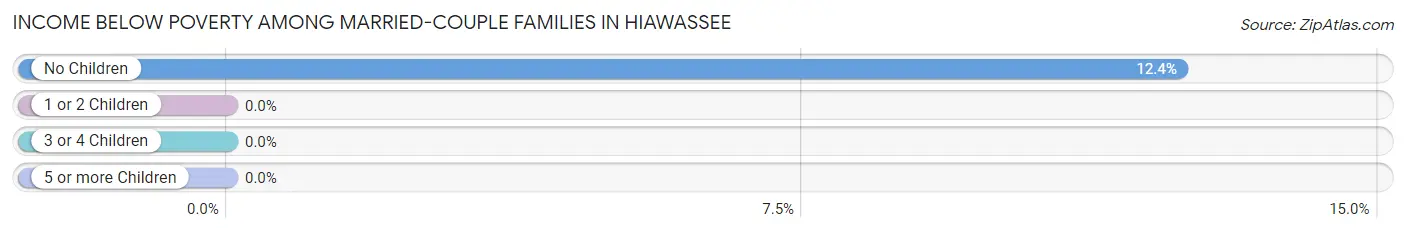
| Children | Above Poverty | Below Poverty |
| No Children | 127 (87.6%) | 18 (12.4%) |
| 1 or 2 Children | 47 (100.0%) | 0 (0.0%) |
| 3 or 4 Children | 0 (0.0%) | 0 (0.0%) |
| 5 or more Children | 0 (0.0%) | 0 (0.0%) |
| Total | 174 (90.6%) | 18 (9.4%) |
Income Below Poverty Among Single-Parent Households in Hiawassee
| Children | Single Father | Single Mother |
| No Children | 0 (0.0%) | 0 (0.0%) |
| 1 or 2 Children | 0 (0.0%) | 0 (0.0%) |
| 3 or 4 Children | 0 (0.0%) | 0 (0.0%) |
| 5 or more Children | 0 (0.0%) | 0 (0.0%) |
| Total | 0 (0.0%) | 0 (0.0%) |
Income Below Poverty Among Married-Couple vs Single-Parent Households in Hiawassee
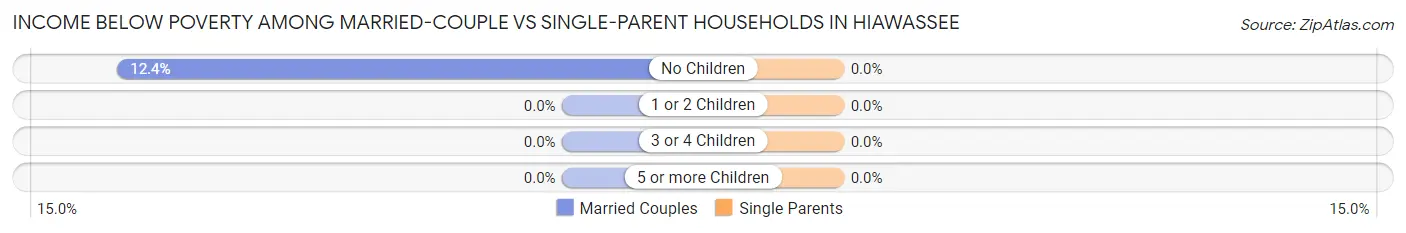
| Children | Married-Couple Families | Single-Parent Households |
| No Children | 18 (12.4%) | 0 (0.0%) |
| 1 or 2 Children | 0 (0.0%) | 0 (0.0%) |
| 3 or 4 Children | 0 (0.0%) | 0 (0.0%) |
| 5 or more Children | 0 (0.0%) | 0 (0.0%) |
| Total | 18 (9.4%) | 0 (0.0%) |
Race in Hiawassee
The most populous races in Hiawassee are White / Caucasian (1,052 | 92.3%), Two or more Races (86 | 7.5%), and Hispanic or Latino (82 | 7.2%).
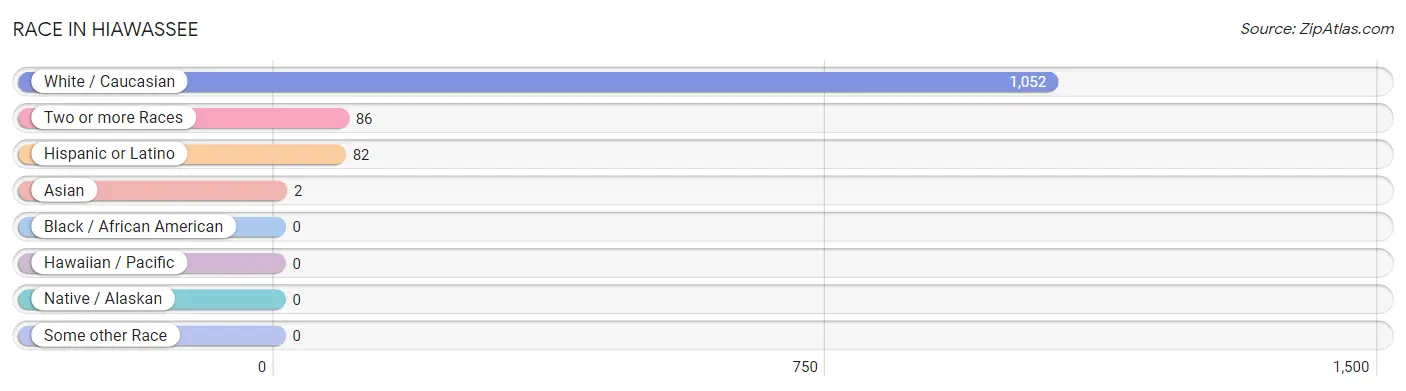
| Race | # Population | % Population |
| Asian | 2 | 0.2% |
| Black / African American | 0 | 0.0% |
| Hawaiian / Pacific | 0 | 0.0% |
| Hispanic or Latino | 82 | 7.2% |
| Native / Alaskan | 0 | 0.0% |
| White / Caucasian | 1,052 | 92.3% |
| Two or more Races | 86 | 7.5% |
| Some other Race | 0 | 0.0% |
| Total | 1,140 | 100.0% |
Ancestry in Hiawassee
The most populous ancestries reported in Hiawassee are American (223 | 19.6%), German (194 | 17.0%), English (179 | 15.7%), Irish (127 | 11.1%), and Scotch-Irish (92 | 8.1%), together accounting for 71.5% of all Hiawassee residents.
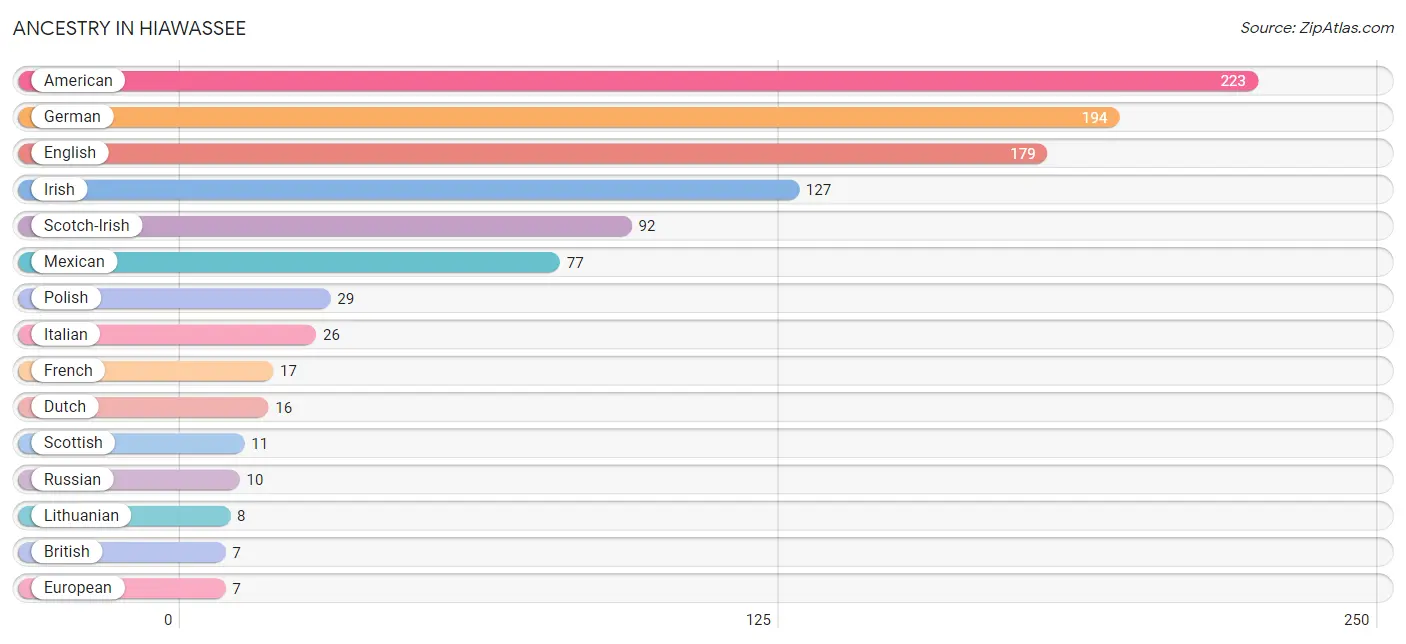
| Ancestry | # Population | % Population |
| American | 223 | 19.6% |
| British | 7 | 0.6% |
| Cherokee | 3 | 0.3% |
| Dutch | 16 | 1.4% |
| English | 179 | 15.7% |
| European | 7 | 0.6% |
| French | 17 | 1.5% |
| German | 194 | 17.0% |
| Hungarian | 4 | 0.4% |
| Indian (Asian) | 2 | 0.2% |
| Irish | 127 | 11.1% |
| Italian | 26 | 2.3% |
| Lithuanian | 8 | 0.7% |
| Mexican | 77 | 6.8% |
| Northern European | 7 | 0.6% |
| Norwegian | 4 | 0.4% |
| Polish | 29 | 2.5% |
| Russian | 10 | 0.9% |
| Scotch-Irish | 92 | 8.1% |
| Scottish | 11 | 1.0% |
| Slavic | 4 | 0.4% |
| Swedish | 5 | 0.4% |
| Swiss | 2 | 0.2% |
| Welsh | 3 | 0.3% | View All 24 Rows |
Immigrants in Hiawassee
The most numerous immigrant groups reported in Hiawassee came from Central America (31 | 2.7%), Latin America (31 | 2.7%), Mexico (31 | 2.7%), Europe (25 | 2.2%), and England (12 | 1.1%), together accounting for 11.4% of all Hiawassee residents.
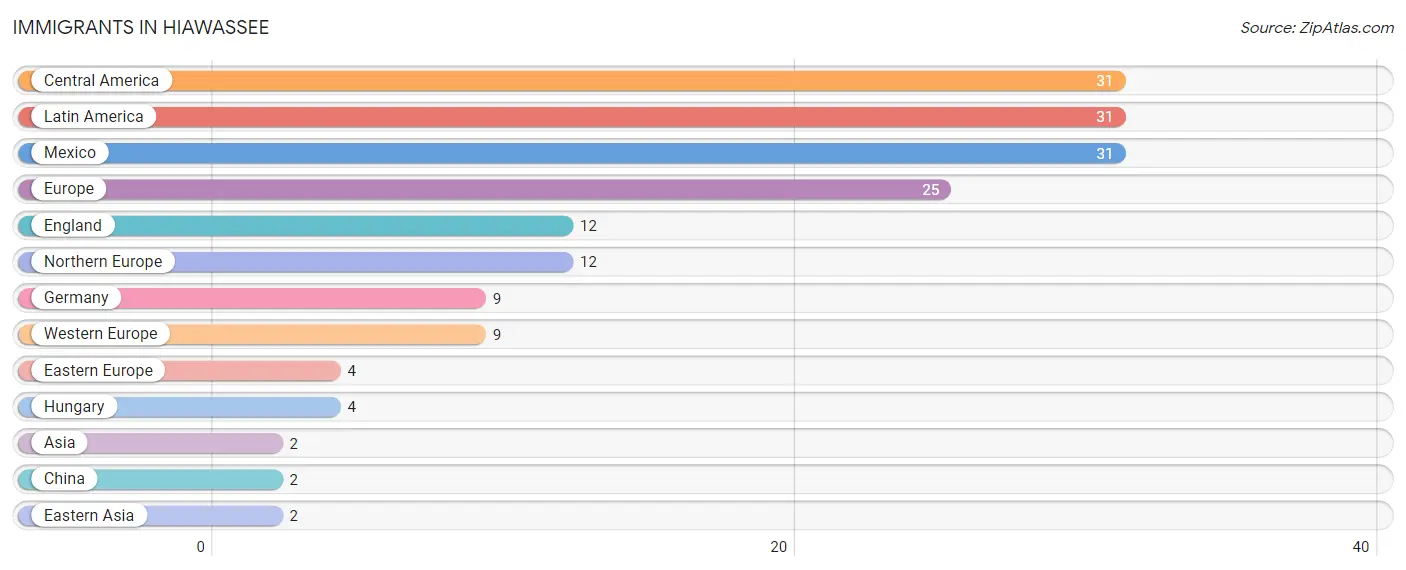
| Immigration Origin | # Population | % Population |
| Asia | 2 | 0.2% |
| Central America | 31 | 2.7% |
| China | 2 | 0.2% |
| Eastern Asia | 2 | 0.2% |
| Eastern Europe | 4 | 0.4% |
| England | 12 | 1.1% |
| Europe | 25 | 2.2% |
| Germany | 9 | 0.8% |
| Hungary | 4 | 0.4% |
| Latin America | 31 | 2.7% |
| Mexico | 31 | 2.7% |
| Northern Europe | 12 | 1.1% |
| Western Europe | 9 | 0.8% | View All 13 Rows |
Sex and Age in Hiawassee
Sex and Age in Hiawassee
The most populous age groups in Hiawassee are 50 to 54 Years (42 | 9.5%) for men and 85 Years and over (99 | 14.2%) for women.
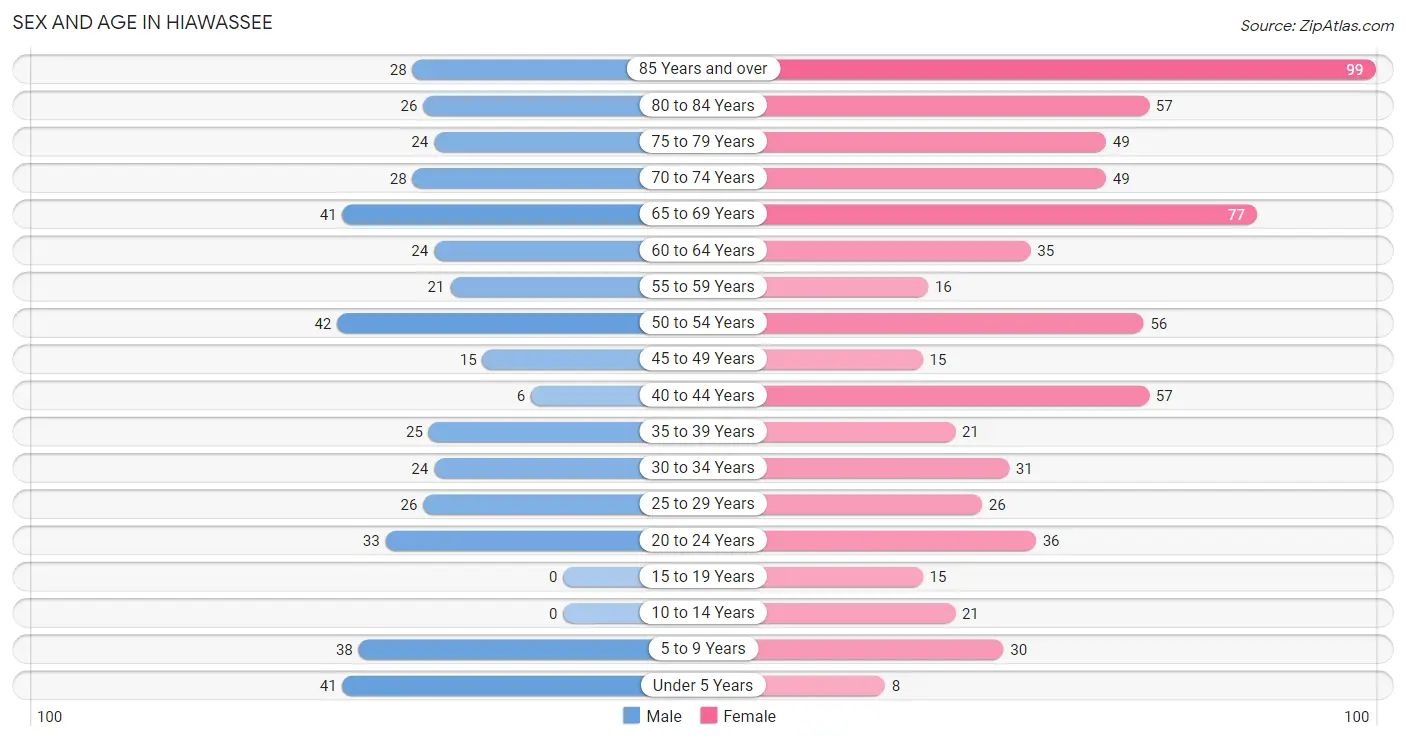
| Age Bracket | Male | Female |
| Under 5 Years | 41 (9.3%) | 8 (1.1%) |
| 5 to 9 Years | 38 (8.6%) | 30 (4.3%) |
| 10 to 14 Years | 0 (0.0%) | 21 (3.0%) |
| 15 to 19 Years | 0 (0.0%) | 15 (2.1%) |
| 20 to 24 Years | 33 (7.5%) | 36 (5.2%) |
| 25 to 29 Years | 26 (5.9%) | 26 (3.7%) |
| 30 to 34 Years | 24 (5.4%) | 31 (4.4%) |
| 35 to 39 Years | 25 (5.7%) | 21 (3.0%) |
| 40 to 44 Years | 6 (1.4%) | 57 (8.2%) |
| 45 to 49 Years | 15 (3.4%) | 15 (2.1%) |
| 50 to 54 Years | 42 (9.5%) | 56 (8.0%) |
| 55 to 59 Years | 21 (4.8%) | 16 (2.3%) |
| 60 to 64 Years | 24 (5.4%) | 35 (5.0%) |
| 65 to 69 Years | 41 (9.3%) | 77 (11.0%) |
| 70 to 74 Years | 28 (6.3%) | 49 (7.0%) |
| 75 to 79 Years | 24 (5.4%) | 49 (7.0%) |
| 80 to 84 Years | 26 (5.9%) | 57 (8.2%) |
| 85 Years and over | 28 (6.3%) | 99 (14.2%) |
| Total | 442 (100.0%) | 698 (100.0%) |
Families and Households in Hiawassee
Median Family Size in Hiawassee
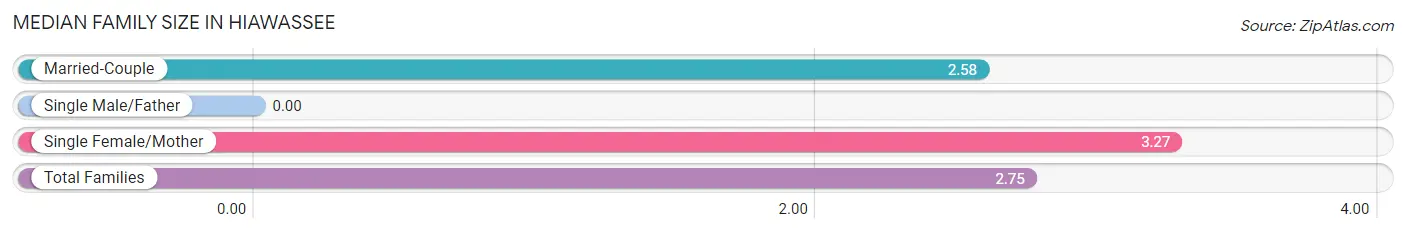
| Family Type | # Families | Family Size |
| Married-Couple | 192 (75.0%) | 2.58 |
| Single Male/Father | 0 (0.0%) | - |
| Single Female/Mother | 64 (25.0%) | 3.27 |
| Total Families | 256 (100.0%) | 2.75 |
Median Household Size in Hiawassee
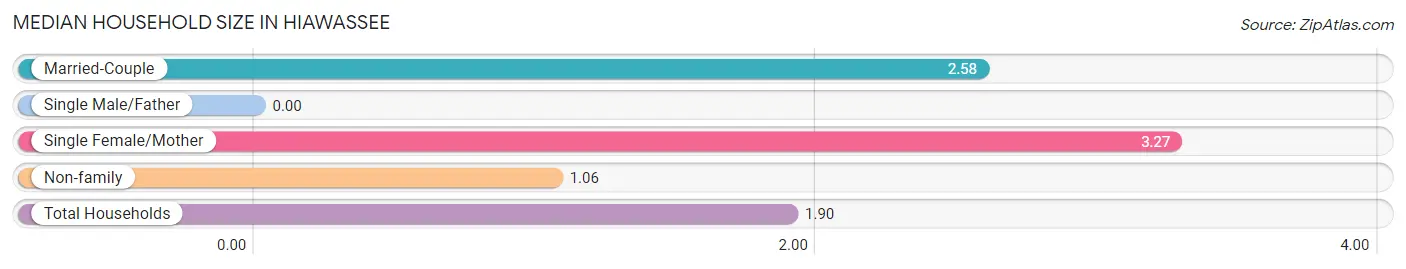
| Household Type | # Households | Household Size |
| Married-Couple | 192 (37.3%) | 2.58 |
| Single Male/Father | 0 (0.0%) | - |
| Single Female/Mother | 64 (12.4%) | 3.27 |
| Non-family | 259 (50.3%) | 1.06 |
| Total Households | 515 (100.0%) | 1.90 |
Household Size by Marriage Status in Hiawassee
Out of a total of 515 households in Hiawassee, 256 (49.7%) are family households, while 259 (50.3%) are nonfamily households. The most numerous type of family households are 2-person households, comprising 136, and the most common type of nonfamily households are 1-person households, comprising 236.
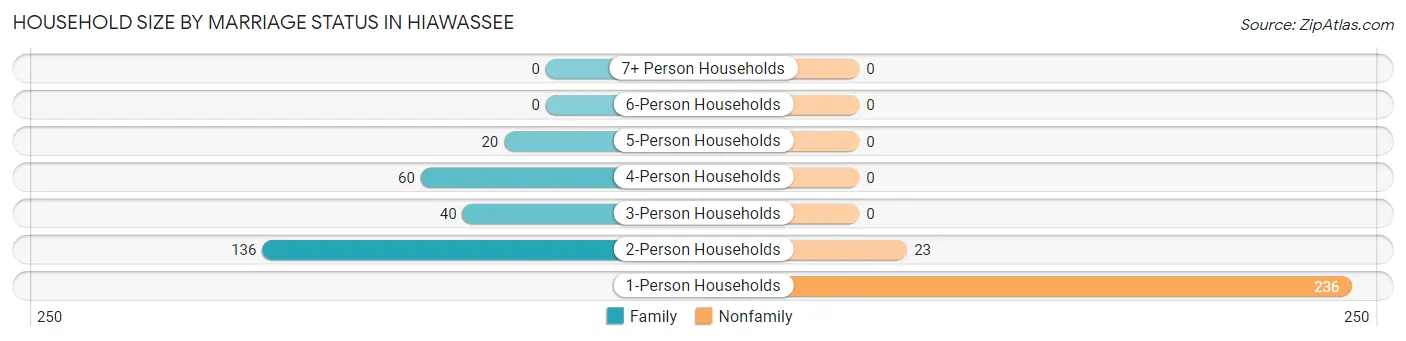
| Household Size | Family Households | Nonfamily Households |
| 1-Person Households | - | 236 (45.8%) |
| 2-Person Households | 136 (26.4%) | 23 (4.5%) |
| 3-Person Households | 40 (7.8%) | 0 (0.0%) |
| 4-Person Households | 60 (11.7%) | 0 (0.0%) |
| 5-Person Households | 20 (3.9%) | 0 (0.0%) |
| 6-Person Households | 0 (0.0%) | 0 (0.0%) |
| 7+ Person Households | 0 (0.0%) | 0 (0.0%) |
| Total | 256 (49.7%) | 259 (50.3%) |
Female Fertility in Hiawassee
Fertility by Age in Hiawassee
Average fertility rate in Hiawassee is 77.0 births per 1,000 women. Women in the age bracket of 35 to 50 years have the highest fertility rate with 162.0 births per 1,000 women. Women in the age bracket of 35 to 50 years acount for 100.0% of all women with births.
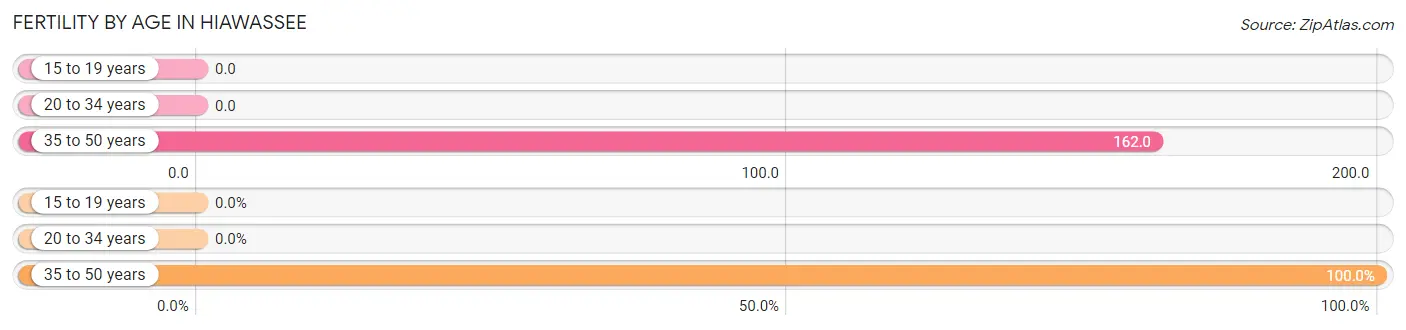
| Age Bracket | Women with Births | Births / 1,000 Women |
| 15 to 19 years | 0 (0.0%) | 0.0 |
| 20 to 34 years | 0 (0.0%) | 0.0 |
| 35 to 50 years | 16 (100.0%) | 162.0 |
| Total | 16 (100.0%) | 77.0 |
Fertility by Age by Marriage Status in Hiawassee
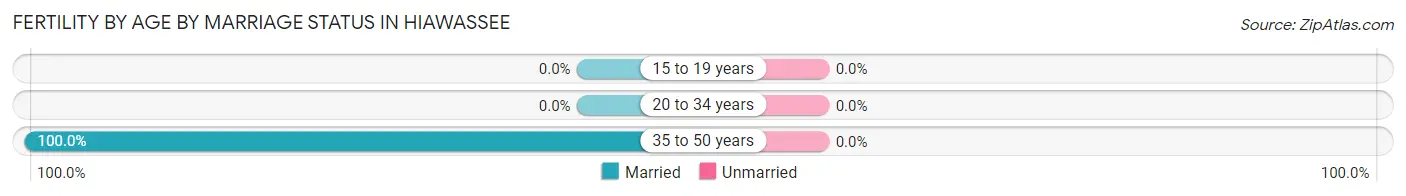
| Age Bracket | Married | Unmarried |
| 15 to 19 years | 0 (0.0%) | 0 (0.0%) |
| 20 to 34 years | 0 (0.0%) | 0 (0.0%) |
| 35 to 50 years | 16 (100.0%) | 0 (0.0%) |
| Total | 16 (100.0%) | 0 (0.0%) |
Fertility by Education in Hiawassee
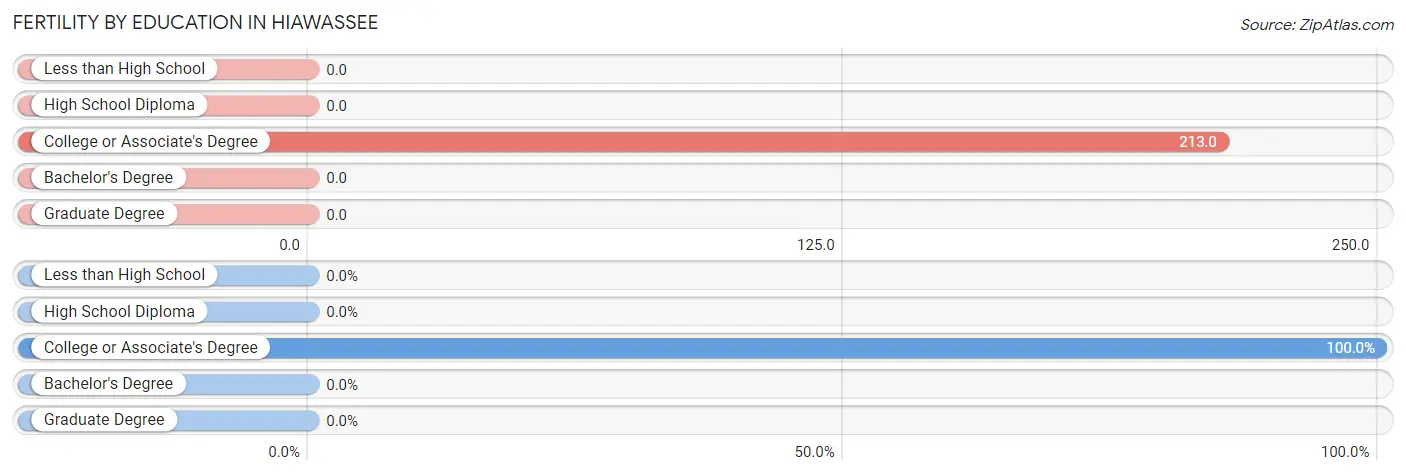
| Educational Attainment | Women with Births | Births / 1,000 Women |
| Less than High School | 0 (0.0%) | 0.0 |
| High School Diploma | 0 (0.0%) | 0.0 |
| College or Associate's Degree | 16 (100.0%) | 213.0 |
| Bachelor's Degree | 0 (0.0%) | 0.0 |
| Graduate Degree | 0 (0.0%) | 0.0 |
| Total | 16 (100.0%) | 77.0 |
Fertility by Education by Marriage Status in Hiawassee
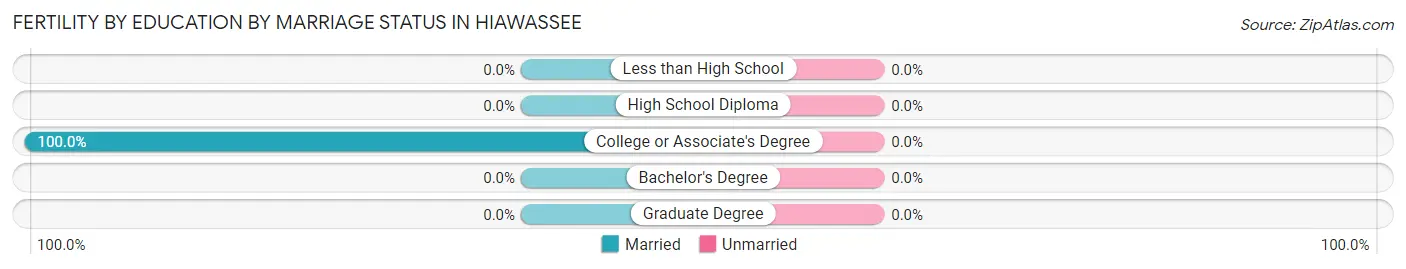
| Educational Attainment | Married | Unmarried |
| Less than High School | 0 (0.0%) | 0 (0.0%) |
| High School Diploma | 0 (0.0%) | 0 (0.0%) |
| College or Associate's Degree | 16 (100.0%) | 0 (0.0%) |
| Bachelor's Degree | 0 (0.0%) | 0 (0.0%) |
| Graduate Degree | 0 (0.0%) | 0 (0.0%) |
| Total | 16 (100.0%) | 0 (0.0%) |
Employment Characteristics in Hiawassee
Employment by Class of Employer in Hiawassee
Among the 445 employed individuals in Hiawassee, private company employees (325 | 73.0%), self-employed (not incorporated) (53 | 11.9%), and local government employees (25 | 5.6%) make up the most common classes of employment.
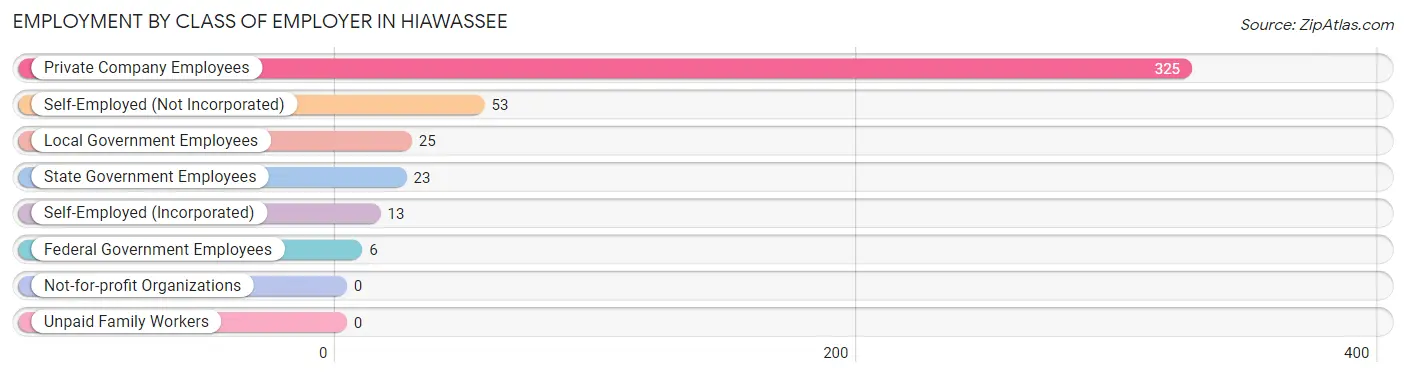
| Employer Class | # Employees | % Employees |
| Private Company Employees | 325 | 73.0% |
| Self-Employed (Incorporated) | 13 | 2.9% |
| Self-Employed (Not Incorporated) | 53 | 11.9% |
| Not-for-profit Organizations | 0 | 0.0% |
| Local Government Employees | 25 | 5.6% |
| State Government Employees | 23 | 5.2% |
| Federal Government Employees | 6 | 1.3% |
| Unpaid Family Workers | 0 | 0.0% |
| Total | 445 | 100.0% |
Employment Status by Age in Hiawassee
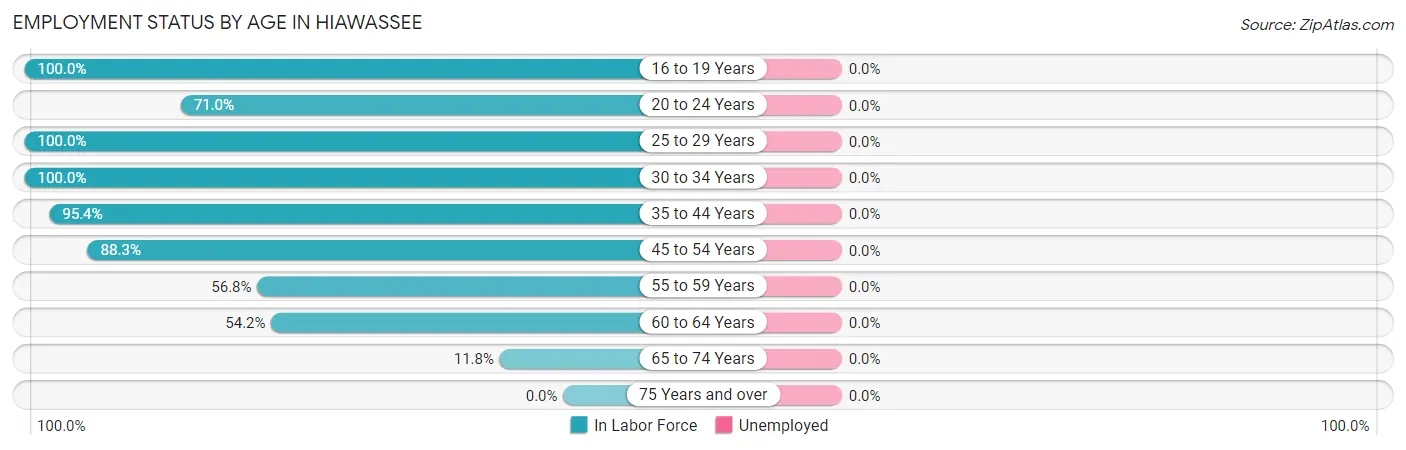
| Age Bracket | In Labor Force | Unemployed |
| 16 to 19 Years | 15 (100.0%) | 0 (0.0%) |
| 20 to 24 Years | 49 (71.0%) | 0 (0.0%) |
| 25 to 29 Years | 52 (100.0%) | 0 (0.0%) |
| 30 to 34 Years | 55 (100.0%) | 0 (0.0%) |
| 35 to 44 Years | 104 (95.4%) | 0 (0.0%) |
| 45 to 54 Years | 113 (88.3%) | 0 (0.0%) |
| 55 to 59 Years | 21 (56.8%) | 0 (0.0%) |
| 60 to 64 Years | 32 (54.2%) | 0 (0.0%) |
| 65 to 74 Years | 23 (11.8%) | 0 (0.0%) |
| 75 Years and over | 0 (0.0%) | 0 (0.0%) |
| Total | 464 (46.3%) | 0 (0.0%) |
Employment Status by Educational Attainment in Hiawassee
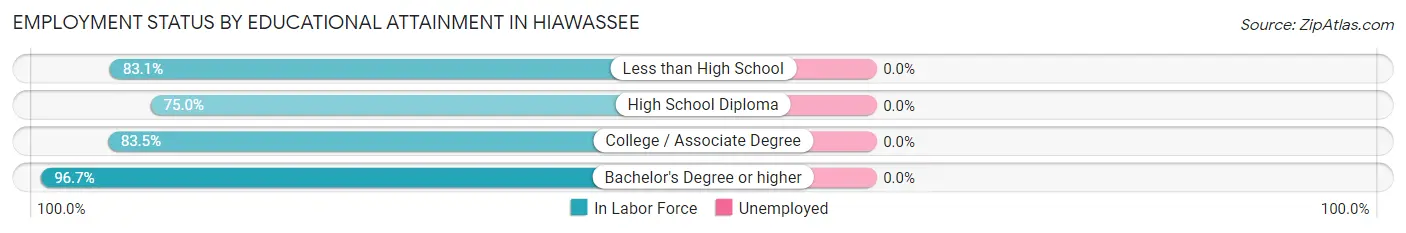
| Educational Attainment | In Labor Force | Unemployed |
| Less than High School | 64 (83.1%) | 0 (0.0%) |
| High School Diploma | 54 (75.0%) | 0 (0.0%) |
| College / Associate Degree | 142 (83.5%) | 0 (0.0%) |
| Bachelor's Degree or higher | 117 (96.7%) | 0 (0.0%) |
| Total | 377 (85.7%) | 0 (0.0%) |
Employment Occupations by Sex in Hiawassee
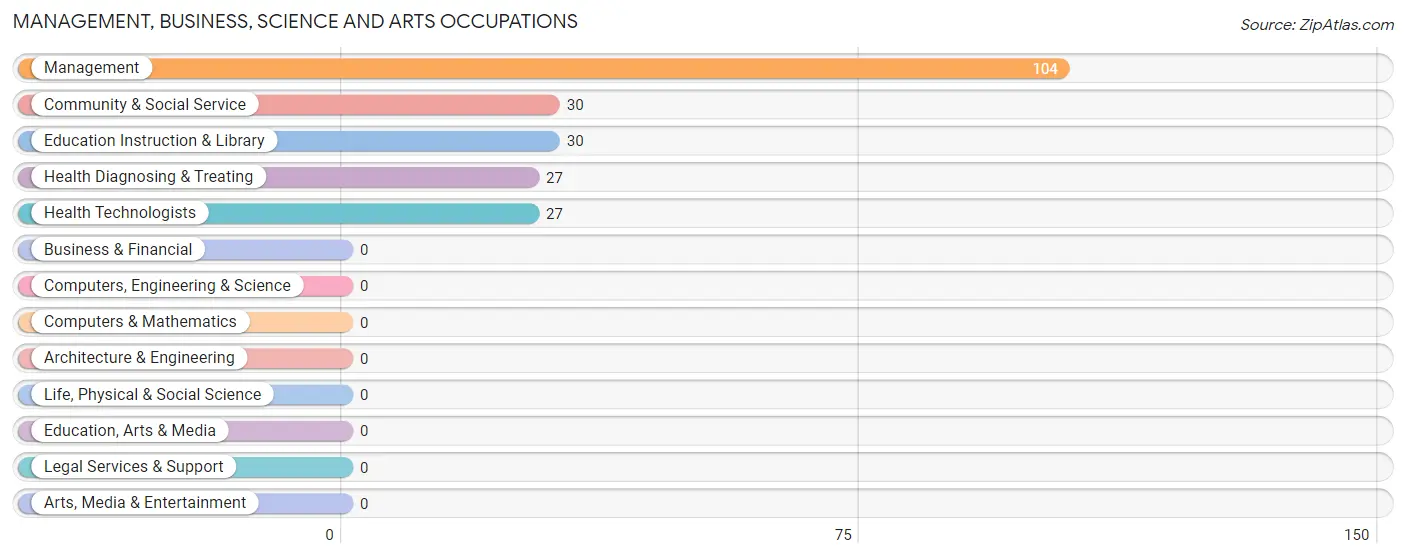
Management, Business, Science and Arts Occupations
The most common Management, Business, Science and Arts occupations in Hiawassee are Management (104 | 22.4%), Community & Social Service (30 | 6.5%), Education Instruction & Library (30 | 6.5%), Health Diagnosing & Treating (27 | 5.8%), and Health Technologists (27 | 5.8%).
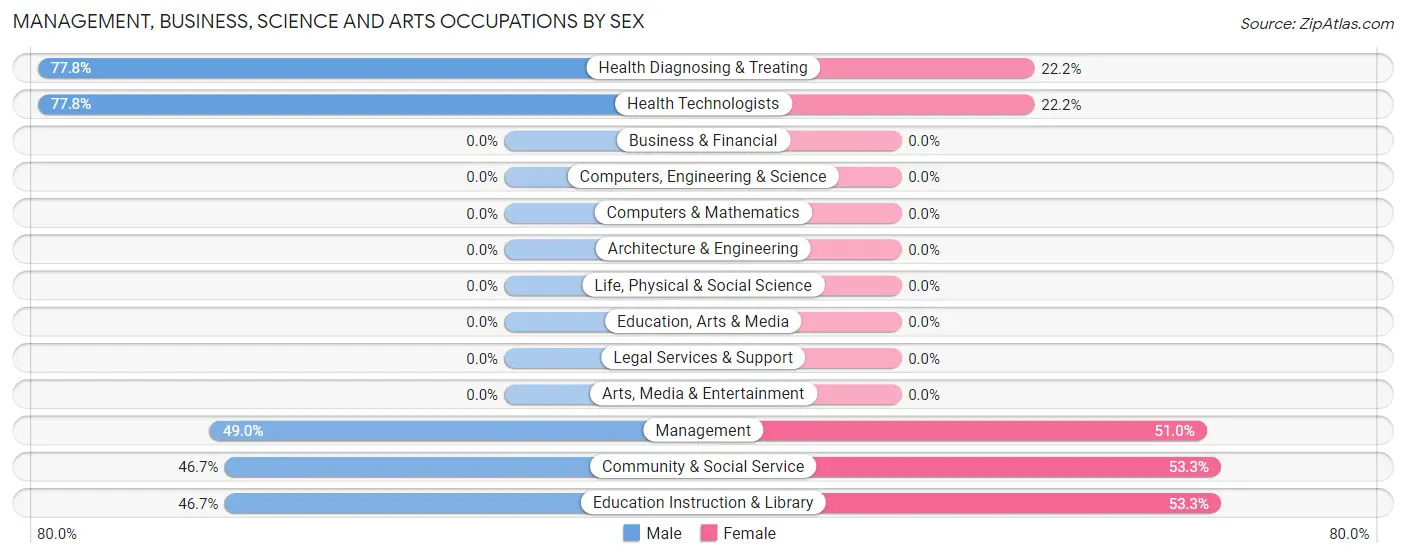
Management, Business, Science and Arts Occupations by Sex
Within the Management, Business, Science and Arts occupations in Hiawassee, the most male-oriented occupations are Health Diagnosing & Treating (77.8%), Health Technologists (77.8%), and Management (49.0%), while the most female-oriented occupations are Community & Social Service (53.3%), Education Instruction & Library (53.3%), and Management (51.0%).
| Occupation | Male | Female |
| Management | 51 (49.0%) | 53 (51.0%) |
| Business & Financial | 0 (0.0%) | 0 (0.0%) |
| Computers, Engineering & Science | 0 (0.0%) | 0 (0.0%) |
| Computers & Mathematics | 0 (0.0%) | 0 (0.0%) |
| Architecture & Engineering | 0 (0.0%) | 0 (0.0%) |
| Life, Physical & Social Science | 0 (0.0%) | 0 (0.0%) |
| Community & Social Service | 14 (46.7%) | 16 (53.3%) |
| Education, Arts & Media | 0 (0.0%) | 0 (0.0%) |
| Legal Services & Support | 0 (0.0%) | 0 (0.0%) |
| Education Instruction & Library | 14 (46.7%) | 16 (53.3%) |
| Arts, Media & Entertainment | 0 (0.0%) | 0 (0.0%) |
| Health Diagnosing & Treating | 21 (77.8%) | 6 (22.2%) |
| Health Technologists | 21 (77.8%) | 6 (22.2%) |
| Total (Category) | 86 (53.4%) | 75 (46.6%) |
| Total (Overall) | 208 (44.8%) | 256 (55.2%) |
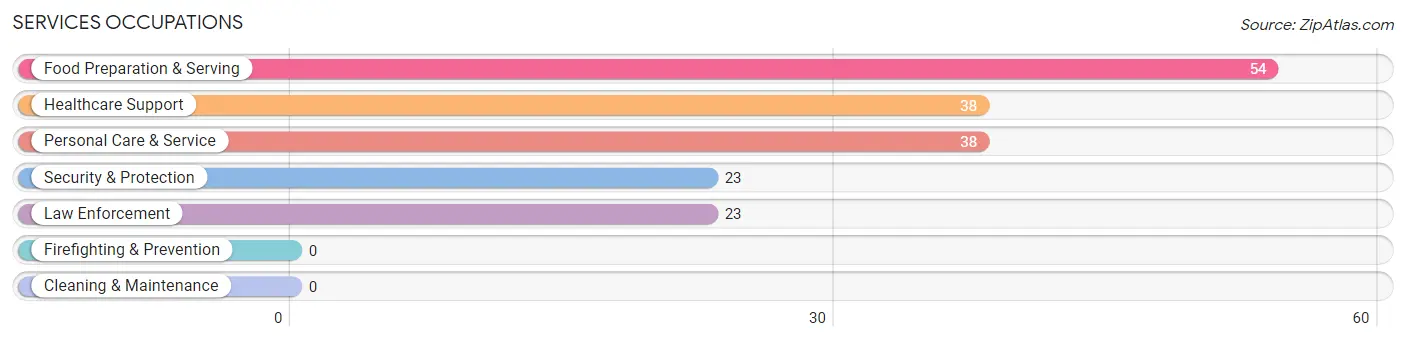
Services Occupations
The most common Services occupations in Hiawassee are Food Preparation & Serving (54 | 11.6%), Healthcare Support (38 | 8.2%), Personal Care & Service (38 | 8.2%), Security & Protection (23 | 5.0%), and Law Enforcement (23 | 5.0%).
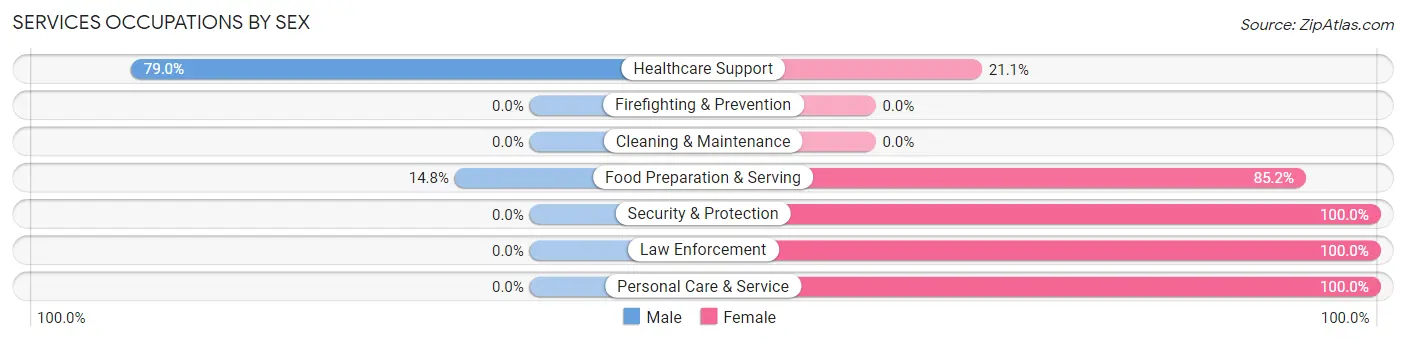
Services Occupations by Sex
Within the Services occupations in Hiawassee, the most male-oriented occupations are Healthcare Support (78.9%), and Food Preparation & Serving (14.8%), while the most female-oriented occupations are Security & Protection (100.0%), Law Enforcement (100.0%), and Personal Care & Service (100.0%).
| Occupation | Male | Female |
| Healthcare Support | 30 (78.9%) | 8 (21.0%) |
| Security & Protection | 0 (0.0%) | 23 (100.0%) |
| Firefighting & Prevention | 0 (0.0%) | 0 (0.0%) |
| Law Enforcement | 0 (0.0%) | 23 (100.0%) |
| Food Preparation & Serving | 8 (14.8%) | 46 (85.2%) |
| Cleaning & Maintenance | 0 (0.0%) | 0 (0.0%) |
| Personal Care & Service | 0 (0.0%) | 38 (100.0%) |
| Total (Category) | 38 (24.8%) | 115 (75.2%) |
| Total (Overall) | 208 (44.8%) | 256 (55.2%) |
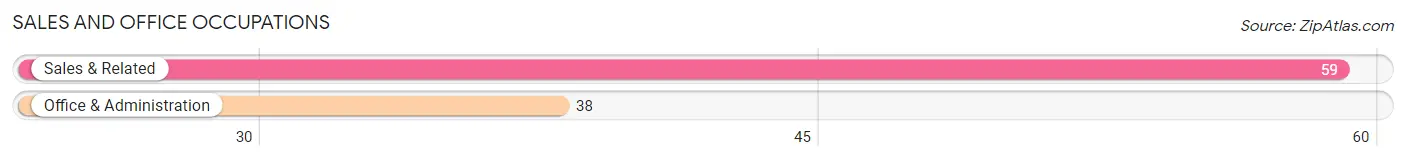
Sales and Office Occupations
The most common Sales and Office occupations in Hiawassee are Sales & Related (59 | 12.7%), and Office & Administration (38 | 8.2%).
Sales and Office Occupations by Sex
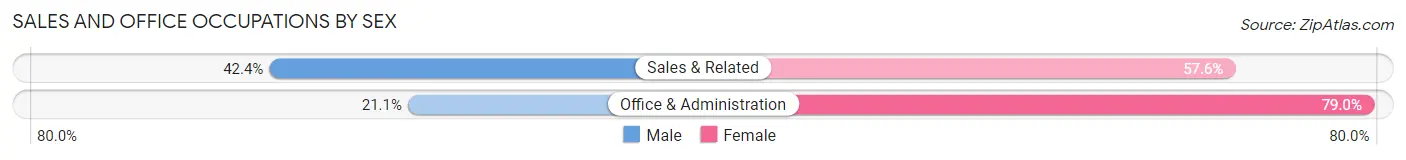
| Occupation | Male | Female |
| Sales & Related | 25 (42.4%) | 34 (57.6%) |
| Office & Administration | 8 (21.0%) | 30 (78.9%) |
| Total (Category) | 33 (34.0%) | 64 (66.0%) |
| Total (Overall) | 208 (44.8%) | 256 (55.2%) |
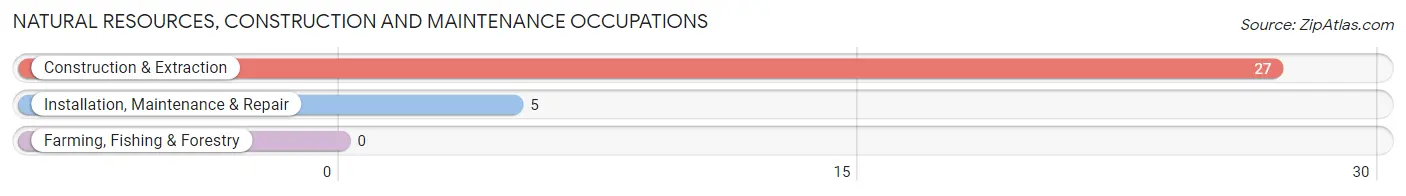
Natural Resources, Construction and Maintenance Occupations
The most common Natural Resources, Construction and Maintenance occupations in Hiawassee are Construction & Extraction (27 | 5.8%), and Installation, Maintenance & Repair (5 | 1.1%).
Natural Resources, Construction and Maintenance Occupations by Sex
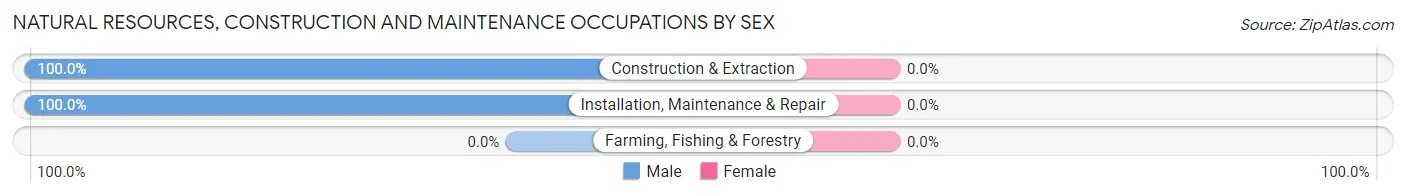
| Occupation | Male | Female |
| Farming, Fishing & Forestry | 0 (0.0%) | 0 (0.0%) |
| Construction & Extraction | 27 (100.0%) | 0 (0.0%) |
| Installation, Maintenance & Repair | 5 (100.0%) | 0 (0.0%) |
| Total (Category) | 32 (100.0%) | 0 (0.0%) |
| Total (Overall) | 208 (44.8%) | 256 (55.2%) |
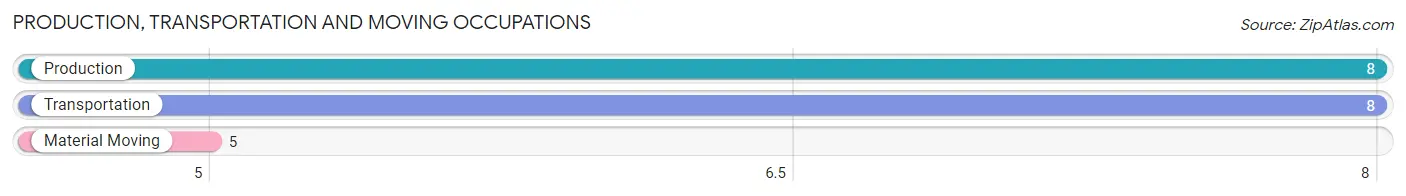
Production, Transportation and Moving Occupations
The most common Production, Transportation and Moving occupations in Hiawassee are Production (8 | 1.7%), Transportation (8 | 1.7%), and Material Moving (5 | 1.1%).
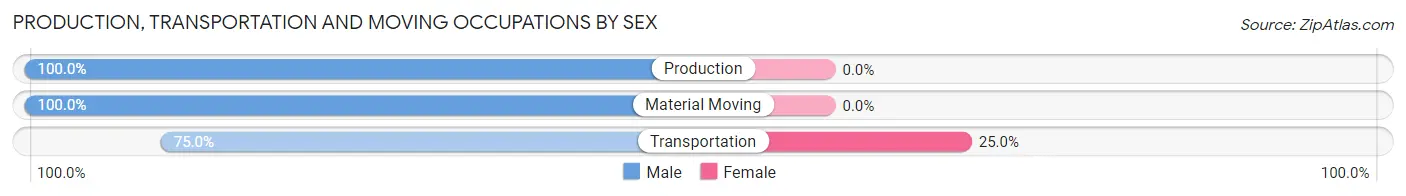
Production, Transportation and Moving Occupations by Sex
| Occupation | Male | Female |
| Production | 8 (100.0%) | 0 (0.0%) |
| Transportation | 6 (75.0%) | 2 (25.0%) |
| Material Moving | 5 (100.0%) | 0 (0.0%) |
| Total (Category) | 19 (90.5%) | 2 (9.5%) |
| Total (Overall) | 208 (44.8%) | 256 (55.2%) |
Employment Industries by Sex in Hiawassee
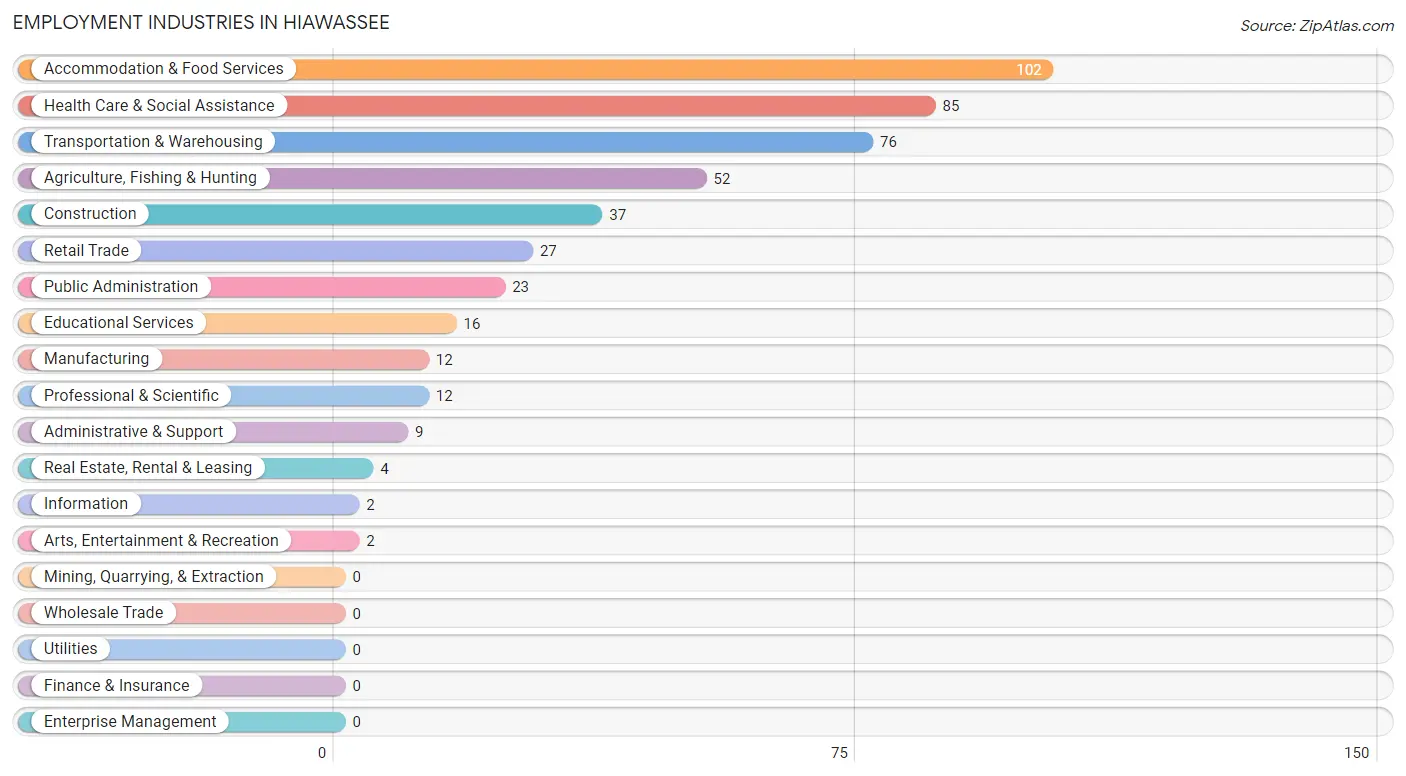
Employment Industries in Hiawassee
The major employment industries in Hiawassee include Accommodation & Food Services (102 | 22.0%), Health Care & Social Assistance (85 | 18.3%), Transportation & Warehousing (76 | 16.4%), Agriculture, Fishing & Hunting (52 | 11.2%), and Construction (37 | 8.0%).
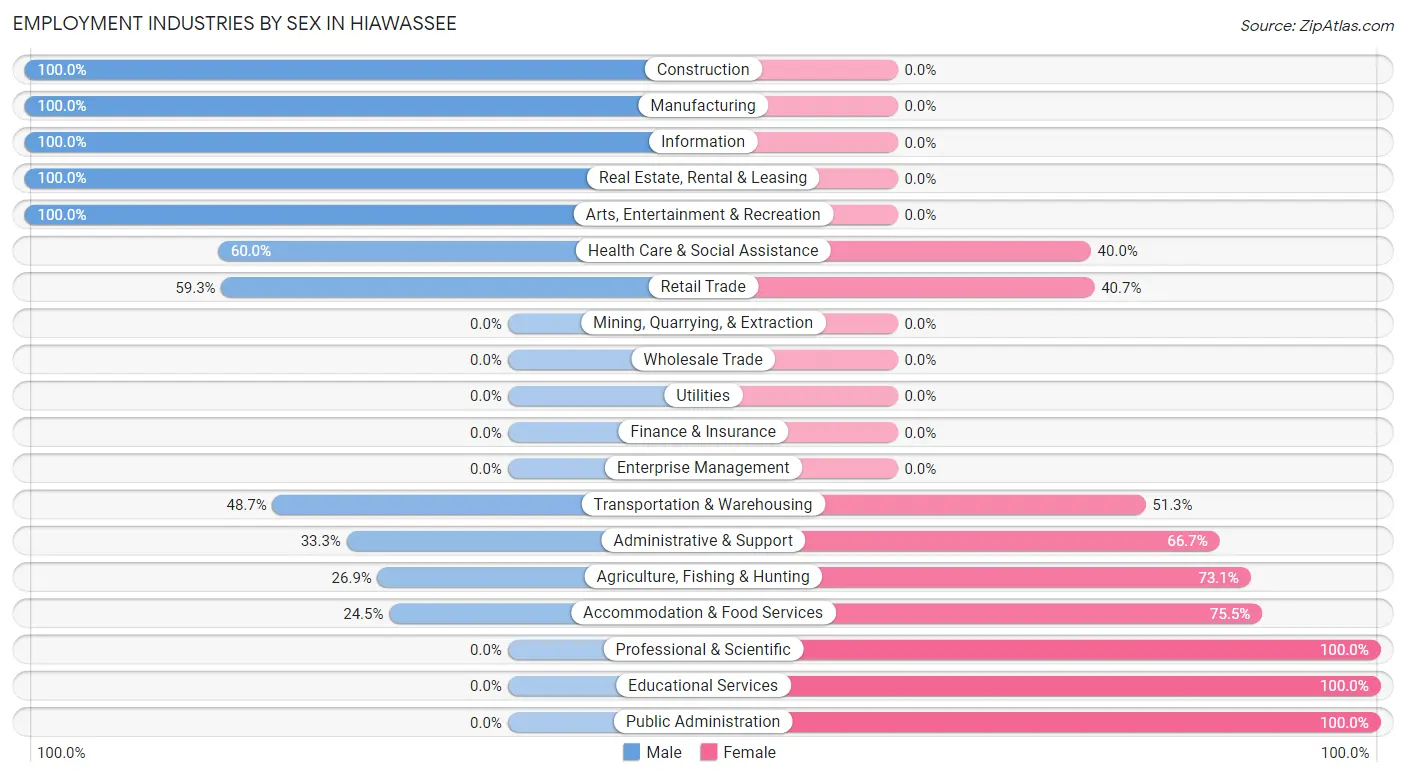
Employment Industries by Sex in Hiawassee
The Hiawassee industries that see more men than women are Construction (100.0%), Manufacturing (100.0%), and Information (100.0%), whereas the industries that tend to have a higher number of women are Professional & Scientific (100.0%), Educational Services (100.0%), and Public Administration (100.0%).
| Industry | Male | Female |
| Agriculture, Fishing & Hunting | 14 (26.9%) | 38 (73.1%) |
| Mining, Quarrying, & Extraction | 0 (0.0%) | 0 (0.0%) |
| Construction | 37 (100.0%) | 0 (0.0%) |
| Manufacturing | 12 (100.0%) | 0 (0.0%) |
| Wholesale Trade | 0 (0.0%) | 0 (0.0%) |
| Retail Trade | 16 (59.3%) | 11 (40.7%) |
| Transportation & Warehousing | 37 (48.7%) | 39 (51.3%) |
| Utilities | 0 (0.0%) | 0 (0.0%) |
| Information | 2 (100.0%) | 0 (0.0%) |
| Finance & Insurance | 0 (0.0%) | 0 (0.0%) |
| Real Estate, Rental & Leasing | 4 (100.0%) | 0 (0.0%) |
| Professional & Scientific | 0 (0.0%) | 12 (100.0%) |
| Enterprise Management | 0 (0.0%) | 0 (0.0%) |
| Administrative & Support | 3 (33.3%) | 6 (66.7%) |
| Educational Services | 0 (0.0%) | 16 (100.0%) |
| Health Care & Social Assistance | 51 (60.0%) | 34 (40.0%) |
| Arts, Entertainment & Recreation | 2 (100.0%) | 0 (0.0%) |
| Accommodation & Food Services | 25 (24.5%) | 77 (75.5%) |
| Public Administration | 0 (0.0%) | 23 (100.0%) |
| Total | 208 (44.8%) | 256 (55.2%) |
Education in Hiawassee
School Enrollment in Hiawassee
The most common levels of schooling among the 116 students in Hiawassee are elementary school (46 | 39.7%), middle school (21 | 18.1%), and nursery / preschool (18 | 15.5%).
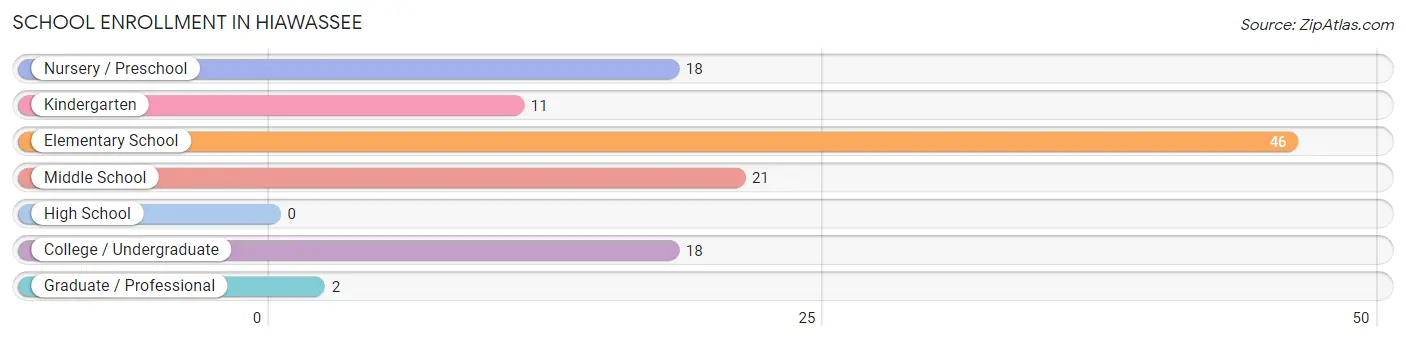
| School Level | # Students | % Students |
| Nursery / Preschool | 18 | 15.5% |
| Kindergarten | 11 | 9.5% |
| Elementary School | 46 | 39.7% |
| Middle School | 21 | 18.1% |
| High School | 0 | 0.0% |
| College / Undergraduate | 18 | 15.5% |
| Graduate / Professional | 2 | 1.7% |
| Total | 116 | 100.0% |
School Enrollment by Age by Funding Source in Hiawassee
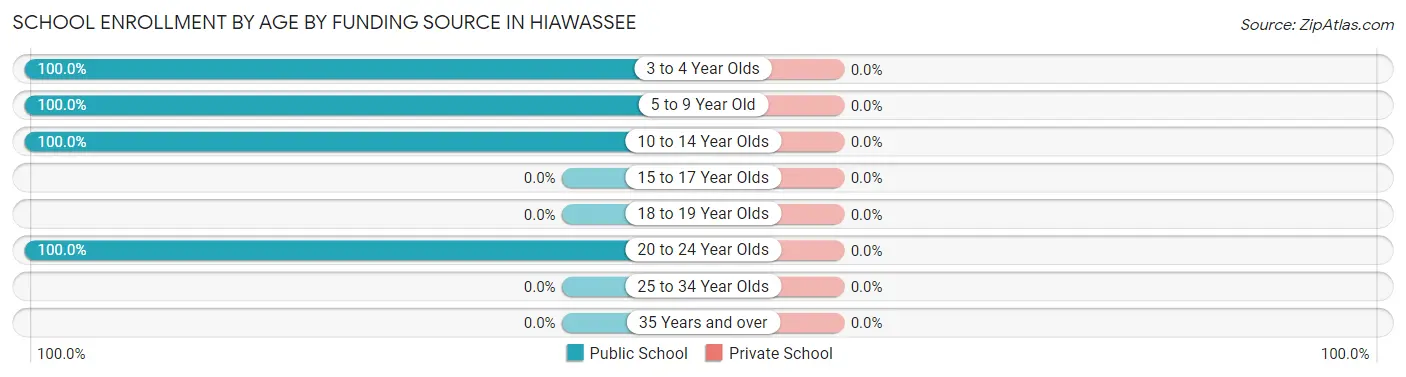
| Age Bracket | Public School | Private School |
| 3 to 4 Year Olds | 8 (100.0%) | 0 (0.0%) |
| 5 to 9 Year Old | 67 (100.0%) | 0 (0.0%) |
| 10 to 14 Year Olds | 21 (100.0%) | 0 (0.0%) |
| 15 to 17 Year Olds | 0 (0.0%) | 0 (0.0%) |
| 18 to 19 Year Olds | 0 (0.0%) | 0 (0.0%) |
| 20 to 24 Year Olds | 20 (100.0%) | 0 (0.0%) |
| 25 to 34 Year Olds | 0 (0.0%) | 0 (0.0%) |
| 35 Years and over | 0 (0.0%) | 0 (0.0%) |
| Total | 116 (100.0%) | 0 (0.0%) |
Educational Attainment by Field of Study in Hiawassee
Bio, nature & agricultural (72 | 26.1%), business (45 | 16.3%), psychology (23 | 8.3%), education (23 | 8.3%), and liberal arts & history (22 | 8.0%) are the most common fields of study among 276 individuals in Hiawassee who have obtained a bachelor's degree or higher.
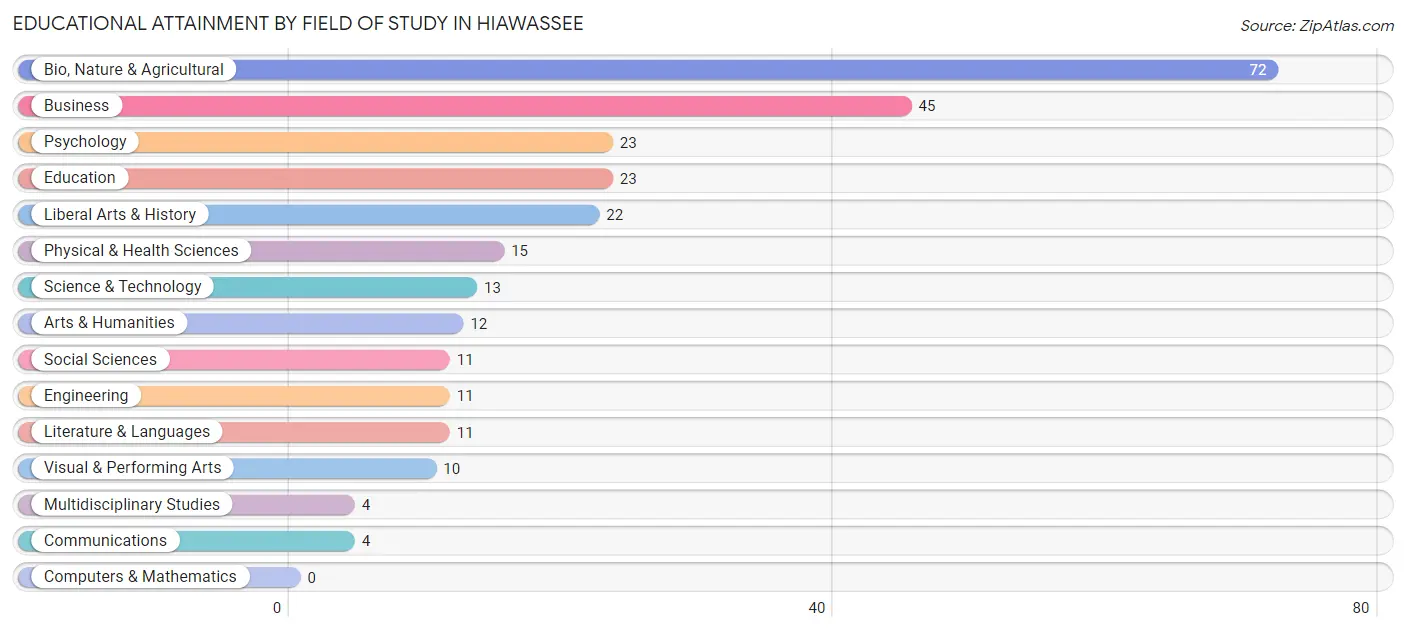
| Field of Study | # Graduates | % Graduates |
| Computers & Mathematics | 0 | 0.0% |
| Bio, Nature & Agricultural | 72 | 26.1% |
| Physical & Health Sciences | 15 | 5.4% |
| Psychology | 23 | 8.3% |
| Social Sciences | 11 | 4.0% |
| Engineering | 11 | 4.0% |
| Multidisciplinary Studies | 4 | 1.5% |
| Science & Technology | 13 | 4.7% |
| Business | 45 | 16.3% |
| Education | 23 | 8.3% |
| Literature & Languages | 11 | 4.0% |
| Liberal Arts & History | 22 | 8.0% |
| Visual & Performing Arts | 10 | 3.6% |
| Communications | 4 | 1.5% |
| Arts & Humanities | 12 | 4.3% |
| Total | 276 | 100.0% |
Transportation & Commute in Hiawassee
Vehicle Availability by Sex in Hiawassee
The most prevalent vehicle ownership categories in Hiawassee are males with 2 vehicles (61, accounting for 32.3%) and females with 2 vehicles (45, making up 23.8%).
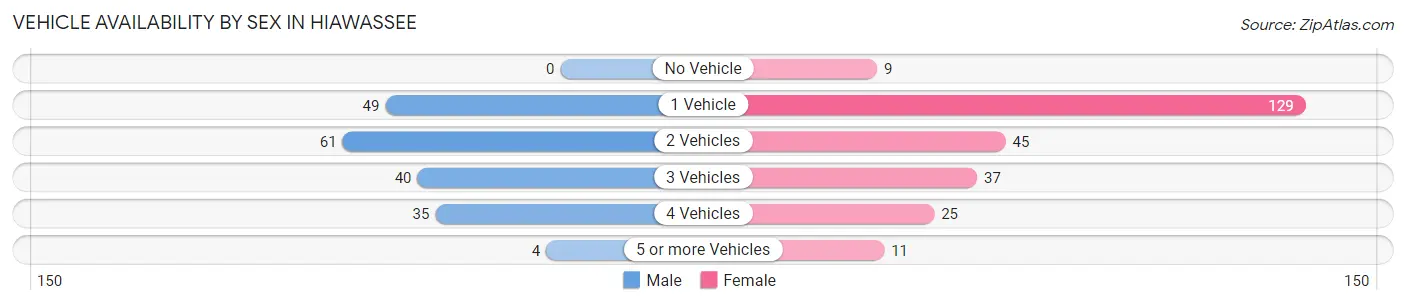
| Vehicles Available | Male | Female |
| No Vehicle | 0 (0.0%) | 9 (3.5%) |
| 1 Vehicle | 49 (25.9%) | 129 (50.4%) |
| 2 Vehicles | 61 (32.3%) | 45 (17.6%) |
| 3 Vehicles | 40 (21.2%) | 37 (14.4%) |
| 4 Vehicles | 35 (18.5%) | 25 (9.8%) |
| 5 or more Vehicles | 4 (2.1%) | 11 (4.3%) |
| Total | 189 (100.0%) | 256 (100.0%) |
Commute Time in Hiawassee
The most frequently occuring commute durations in Hiawassee are 5 to 9 minutes (118 commuters, 32.3%), less than 5 minutes (64 commuters, 17.5%), and 10 to 14 minutes (41 commuters, 11.2%).
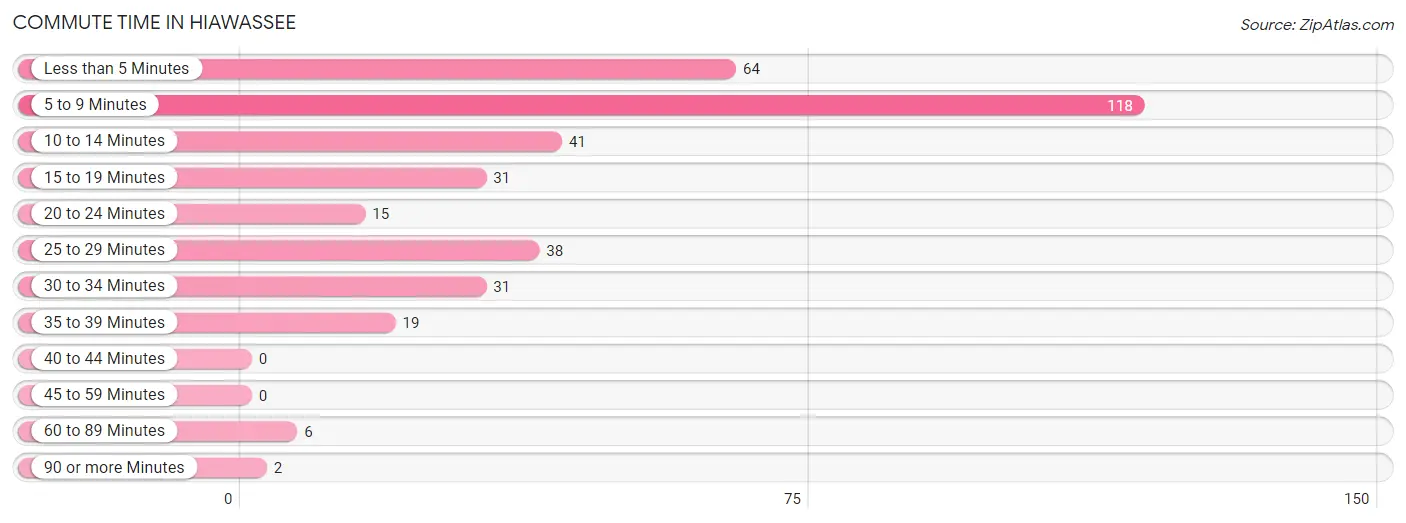
| Commute Time | # Commuters | % Commuters |
| Less than 5 Minutes | 64 | 17.5% |
| 5 to 9 Minutes | 118 | 32.3% |
| 10 to 14 Minutes | 41 | 11.2% |
| 15 to 19 Minutes | 31 | 8.5% |
| 20 to 24 Minutes | 15 | 4.1% |
| 25 to 29 Minutes | 38 | 10.4% |
| 30 to 34 Minutes | 31 | 8.5% |
| 35 to 39 Minutes | 19 | 5.2% |
| 40 to 44 Minutes | 0 | 0.0% |
| 45 to 59 Minutes | 0 | 0.0% |
| 60 to 89 Minutes | 6 | 1.6% |
| 90 or more Minutes | 2 | 0.5% |
Commute Time by Sex in Hiawassee
The most common commute times in Hiawassee are less than 5 minutes (31 commuters, 19.6%) for males and 5 to 9 minutes (91 commuters, 44.0%) for females.
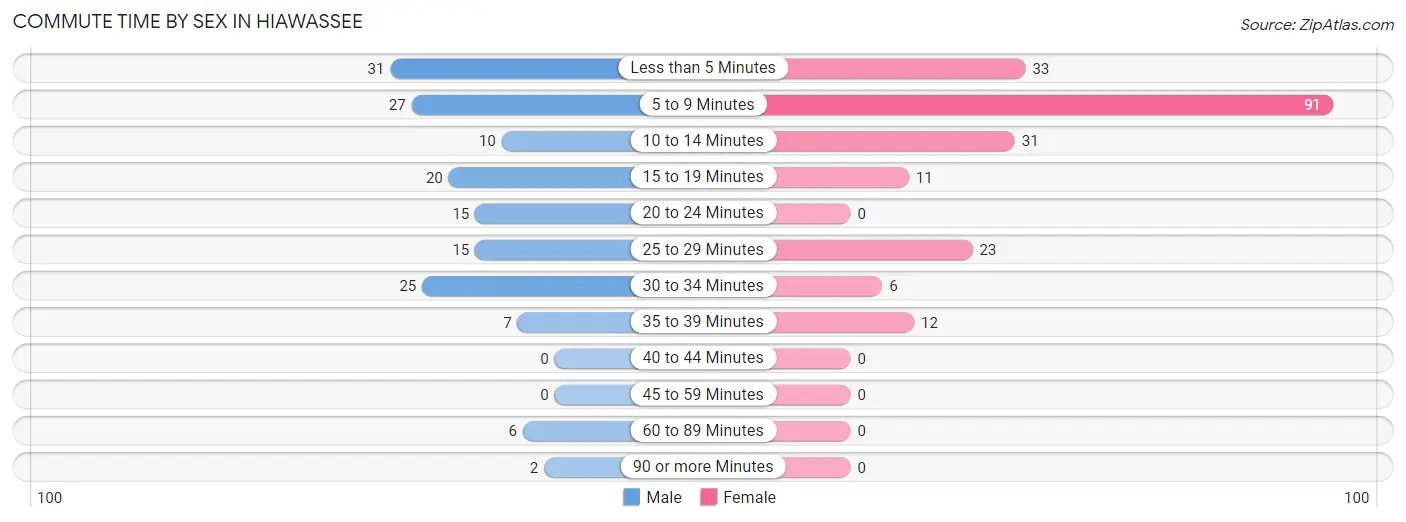
| Commute Time | Male | Female |
| Less than 5 Minutes | 31 (19.6%) | 33 (15.9%) |
| 5 to 9 Minutes | 27 (17.1%) | 91 (44.0%) |
| 10 to 14 Minutes | 10 (6.3%) | 31 (15.0%) |
| 15 to 19 Minutes | 20 (12.7%) | 11 (5.3%) |
| 20 to 24 Minutes | 15 (9.5%) | 0 (0.0%) |
| 25 to 29 Minutes | 15 (9.5%) | 23 (11.1%) |
| 30 to 34 Minutes | 25 (15.8%) | 6 (2.9%) |
| 35 to 39 Minutes | 7 (4.4%) | 12 (5.8%) |
| 40 to 44 Minutes | 0 (0.0%) | 0 (0.0%) |
| 45 to 59 Minutes | 0 (0.0%) | 0 (0.0%) |
| 60 to 89 Minutes | 6 (3.8%) | 0 (0.0%) |
| 90 or more Minutes | 2 (1.3%) | 0 (0.0%) |
Time of Departure to Work by Sex in Hiawassee
The most frequent times of departure to work in Hiawassee are 6:00 AM to 6:29 AM (54, 34.2%) for males and 7:30 AM to 7:59 AM (68, 32.9%) for females.
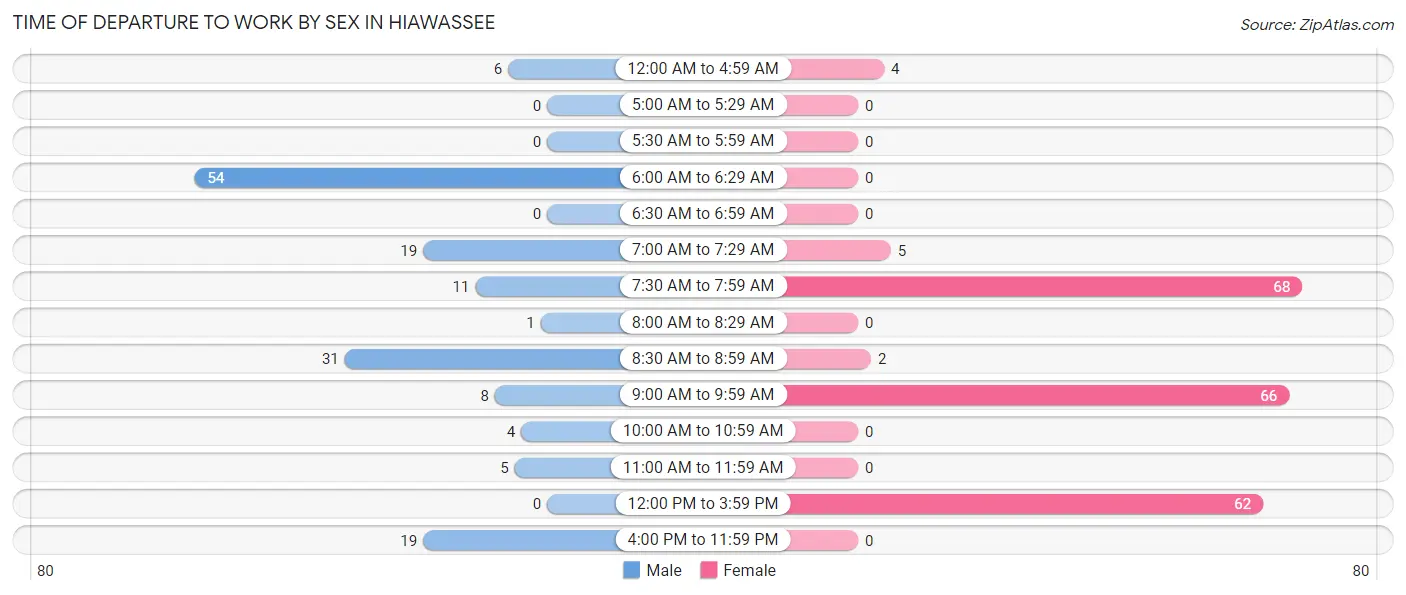
| Time of Departure | Male | Female |
| 12:00 AM to 4:59 AM | 6 (3.8%) | 4 (1.9%) |
| 5:00 AM to 5:29 AM | 0 (0.0%) | 0 (0.0%) |
| 5:30 AM to 5:59 AM | 0 (0.0%) | 0 (0.0%) |
| 6:00 AM to 6:29 AM | 54 (34.2%) | 0 (0.0%) |
| 6:30 AM to 6:59 AM | 0 (0.0%) | 0 (0.0%) |
| 7:00 AM to 7:29 AM | 19 (12.0%) | 5 (2.4%) |
| 7:30 AM to 7:59 AM | 11 (7.0%) | 68 (32.9%) |
| 8:00 AM to 8:29 AM | 1 (0.6%) | 0 (0.0%) |
| 8:30 AM to 8:59 AM | 31 (19.6%) | 2 (1.0%) |
| 9:00 AM to 9:59 AM | 8 (5.1%) | 66 (31.9%) |
| 10:00 AM to 10:59 AM | 4 (2.5%) | 0 (0.0%) |
| 11:00 AM to 11:59 AM | 5 (3.2%) | 0 (0.0%) |
| 12:00 PM to 3:59 PM | 0 (0.0%) | 62 (29.9%) |
| 4:00 PM to 11:59 PM | 19 (12.0%) | 0 (0.0%) |
| Total | 158 (100.0%) | 207 (100.0%) |
Housing Occupancy in Hiawassee
Occupancy by Ownership in Hiawassee
Of the total 515 dwellings in Hiawassee, owner-occupied units account for 239 (46.4%), while renter-occupied units make up 276 (53.6%).
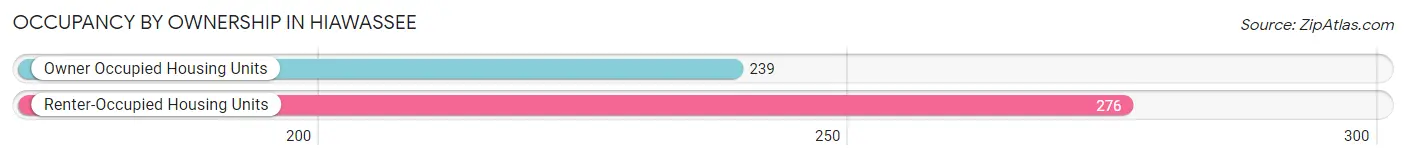
| Occupancy | # Housing Units | % Housing Units |
| Owner Occupied Housing Units | 239 | 46.4% |
| Renter-Occupied Housing Units | 276 | 53.6% |
| Total Occupied Housing Units | 515 | 100.0% |
Occupancy by Household Size in Hiawassee
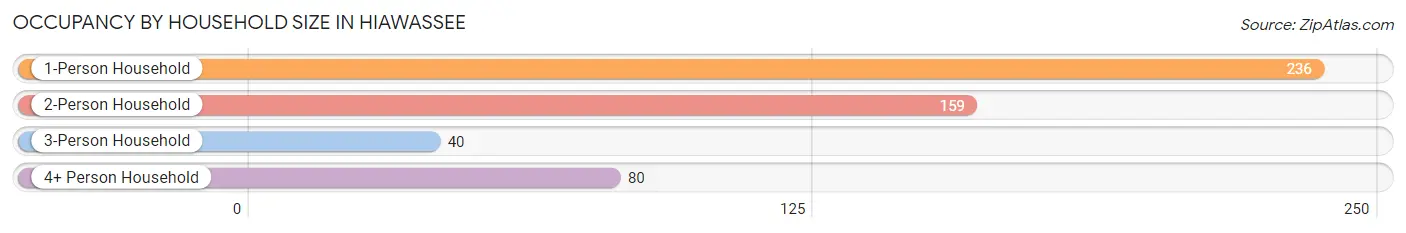
| Household Size | # Housing Units | % Housing Units |
| 1-Person Household | 236 | 45.8% |
| 2-Person Household | 159 | 30.9% |
| 3-Person Household | 40 | 7.8% |
| 4+ Person Household | 80 | 15.5% |
| Total Housing Units | 515 | 100.0% |
Occupancy by Ownership by Household Size in Hiawassee
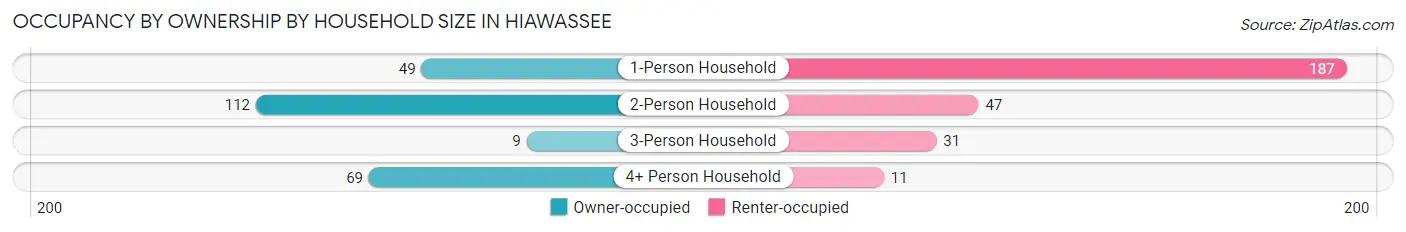
| Household Size | Owner-occupied | Renter-occupied |
| 1-Person Household | 49 (20.8%) | 187 (79.2%) |
| 2-Person Household | 112 (70.4%) | 47 (29.6%) |
| 3-Person Household | 9 (22.5%) | 31 (77.5%) |
| 4+ Person Household | 69 (86.3%) | 11 (13.8%) |
| Total Housing Units | 239 (46.4%) | 276 (53.6%) |
Occupancy by Educational Attainment in Hiawassee
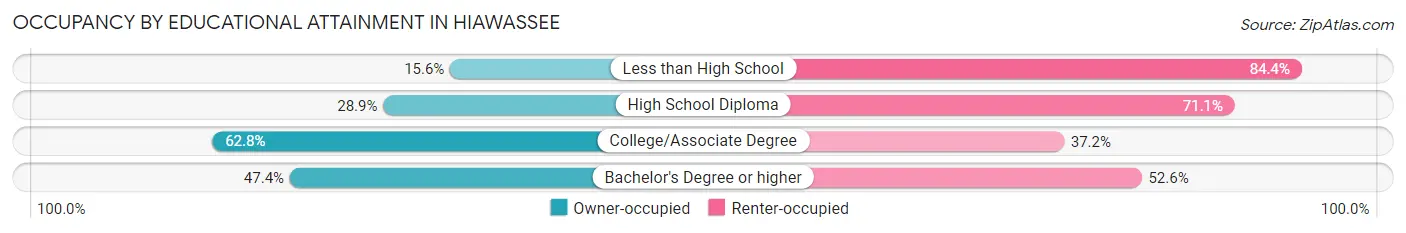
| Household Size | Owner-occupied | Renter-occupied |
| Less than High School | 10 (15.6%) | 54 (84.4%) |
| High School Diploma | 26 (28.9%) | 64 (71.1%) |
| College/Associate Degree | 130 (62.8%) | 77 (37.2%) |
| Bachelor's Degree or higher | 73 (47.4%) | 81 (52.6%) |
Occupancy by Age of Householder in Hiawassee
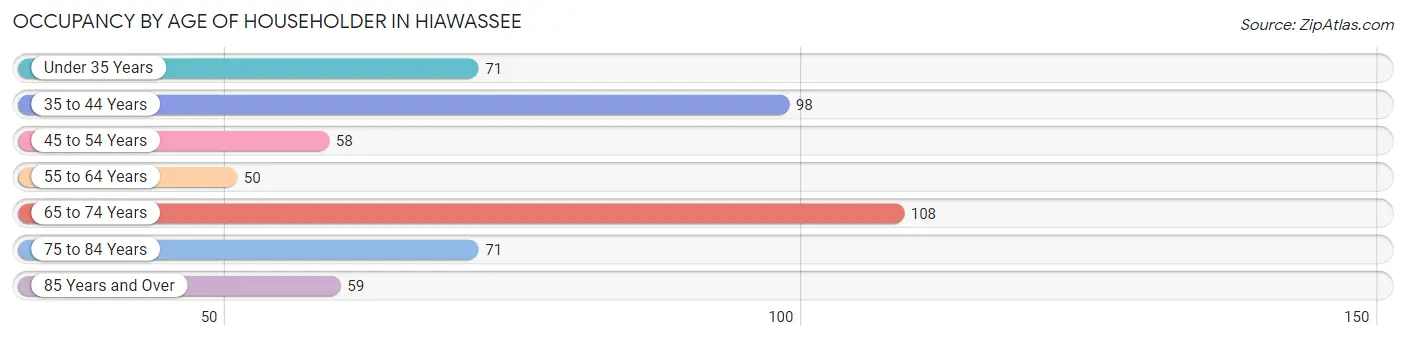
| Age Bracket | # Households | % Households |
| Under 35 Years | 71 | 13.8% |
| 35 to 44 Years | 98 | 19.0% |
| 45 to 54 Years | 58 | 11.3% |
| 55 to 64 Years | 50 | 9.7% |
| 65 to 74 Years | 108 | 21.0% |
| 75 to 84 Years | 71 | 13.8% |
| 85 Years and Over | 59 | 11.5% |
| Total | 515 | 100.0% |
Housing Finances in Hiawassee
Median Income by Occupancy in Hiawassee
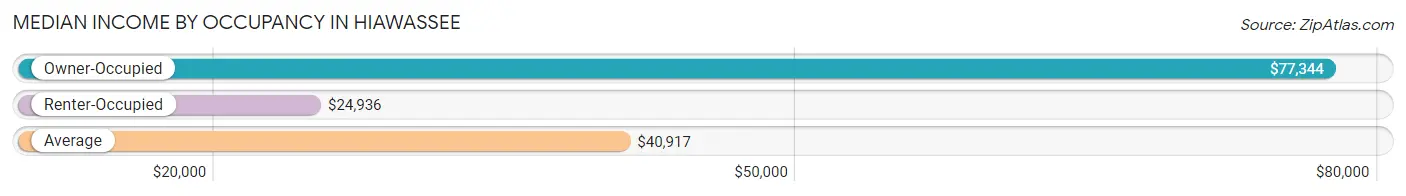
| Occupancy Type | # Households | Median Income |
| Owner-Occupied | 239 (46.4%) | $77,344 |
| Renter-Occupied | 276 (53.6%) | $24,936 |
| Average | 515 (100.0%) | $40,917 |
Occupancy by Householder Income Bracket in Hiawassee
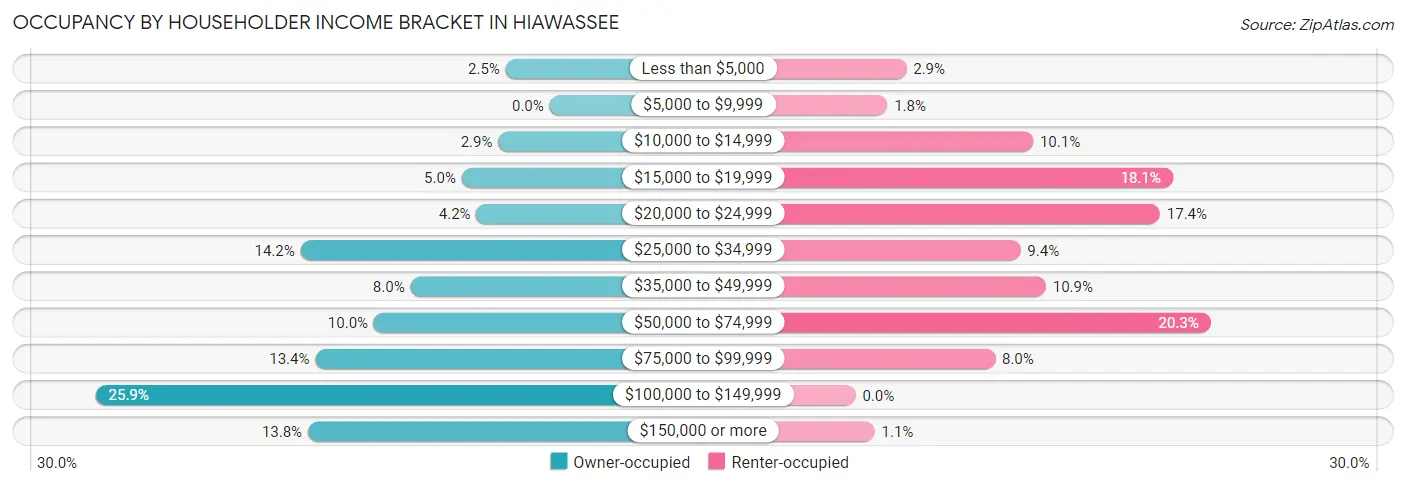
| Income Bracket | Owner-occupied | Renter-occupied |
| Less than $5,000 | 6 (2.5%) | 8 (2.9%) |
| $5,000 to $9,999 | 0 (0.0%) | 5 (1.8%) |
| $10,000 to $14,999 | 7 (2.9%) | 28 (10.1%) |
| $15,000 to $19,999 | 12 (5.0%) | 50 (18.1%) |
| $20,000 to $24,999 | 10 (4.2%) | 48 (17.4%) |
| $25,000 to $34,999 | 34 (14.2%) | 26 (9.4%) |
| $35,000 to $49,999 | 19 (8.0%) | 30 (10.9%) |
| $50,000 to $74,999 | 24 (10.0%) | 56 (20.3%) |
| $75,000 to $99,999 | 32 (13.4%) | 22 (8.0%) |
| $100,000 to $149,999 | 62 (25.9%) | 0 (0.0%) |
| $150,000 or more | 33 (13.8%) | 3 (1.1%) |
| Total | 239 (100.0%) | 276 (100.0%) |
Monthly Housing Cost Tiers in Hiawassee
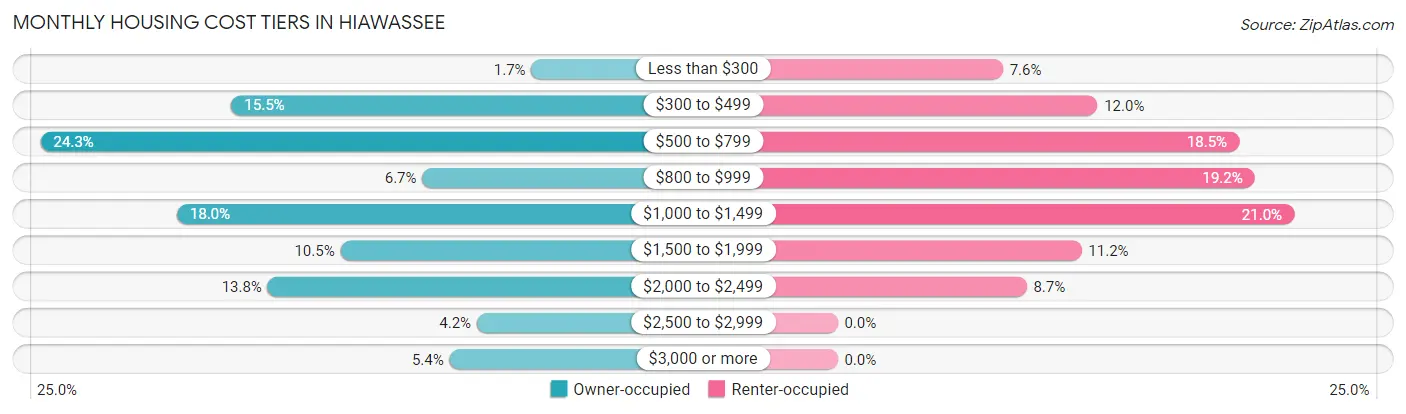
| Monthly Cost | Owner-occupied | Renter-occupied |
| Less than $300 | 4 (1.7%) | 21 (7.6%) |
| $300 to $499 | 37 (15.5%) | 33 (12.0%) |
| $500 to $799 | 58 (24.3%) | 51 (18.5%) |
| $800 to $999 | 16 (6.7%) | 53 (19.2%) |
| $1,000 to $1,499 | 43 (18.0%) | 58 (21.0%) |
| $1,500 to $1,999 | 25 (10.5%) | 31 (11.2%) |
| $2,000 to $2,499 | 33 (13.8%) | 24 (8.7%) |
| $2,500 to $2,999 | 10 (4.2%) | 0 (0.0%) |
| $3,000 or more | 13 (5.4%) | 0 (0.0%) |
| Total | 239 (100.0%) | 276 (100.0%) |
Physical Housing Characteristics in Hiawassee
Housing Structures in Hiawassee
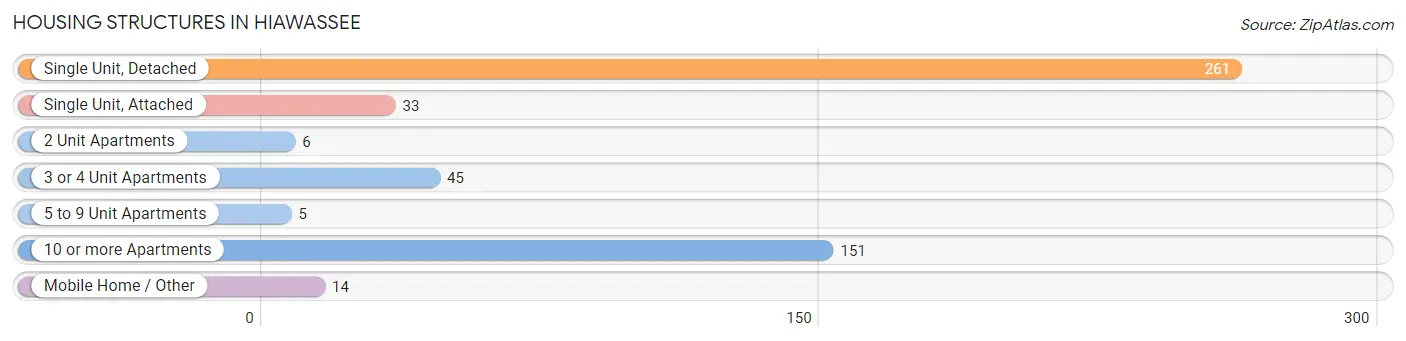
| Structure Type | # Housing Units | % Housing Units |
| Single Unit, Detached | 261 | 50.7% |
| Single Unit, Attached | 33 | 6.4% |
| 2 Unit Apartments | 6 | 1.2% |
| 3 or 4 Unit Apartments | 45 | 8.7% |
| 5 to 9 Unit Apartments | 5 | 1.0% |
| 10 or more Apartments | 151 | 29.3% |
| Mobile Home / Other | 14 | 2.7% |
| Total | 515 | 100.0% |
Housing Structures by Occupancy in Hiawassee
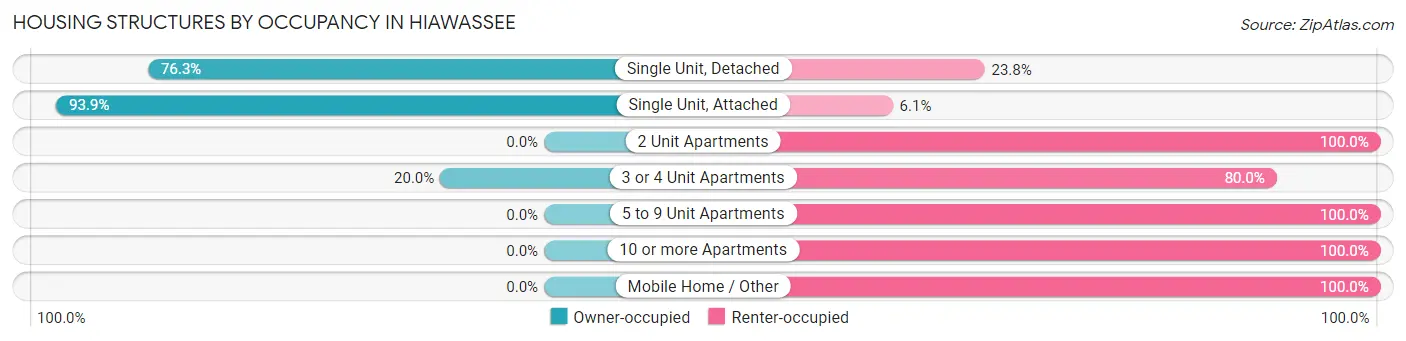
| Structure Type | Owner-occupied | Renter-occupied |
| Single Unit, Detached | 199 (76.2%) | 62 (23.7%) |
| Single Unit, Attached | 31 (93.9%) | 2 (6.1%) |
| 2 Unit Apartments | 0 (0.0%) | 6 (100.0%) |
| 3 or 4 Unit Apartments | 9 (20.0%) | 36 (80.0%) |
| 5 to 9 Unit Apartments | 0 (0.0%) | 5 (100.0%) |
| 10 or more Apartments | 0 (0.0%) | 151 (100.0%) |
| Mobile Home / Other | 0 (0.0%) | 14 (100.0%) |
| Total | 239 (46.4%) | 276 (53.6%) |
Housing Structures by Number of Rooms in Hiawassee
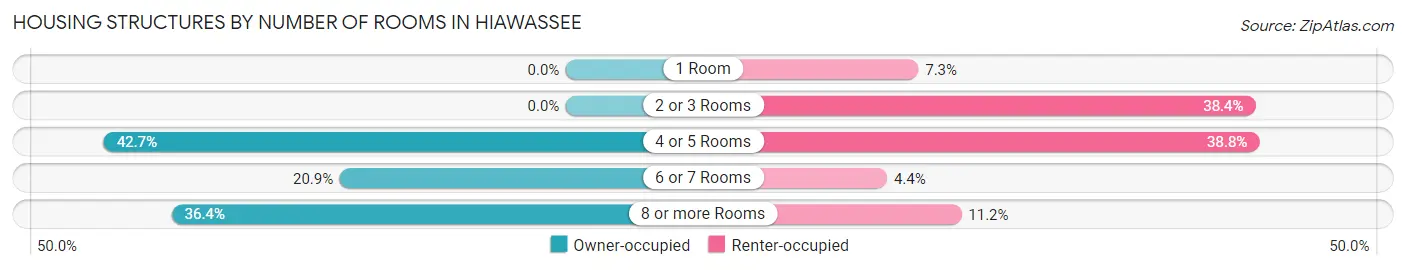
| Number of Rooms | Owner-occupied | Renter-occupied |
| 1 Room | 0 (0.0%) | 20 (7.2%) |
| 2 or 3 Rooms | 0 (0.0%) | 106 (38.4%) |
| 4 or 5 Rooms | 102 (42.7%) | 107 (38.8%) |
| 6 or 7 Rooms | 50 (20.9%) | 12 (4.3%) |
| 8 or more Rooms | 87 (36.4%) | 31 (11.2%) |
| Total | 239 (100.0%) | 276 (100.0%) |
Housing Structure by Heating Type in Hiawassee
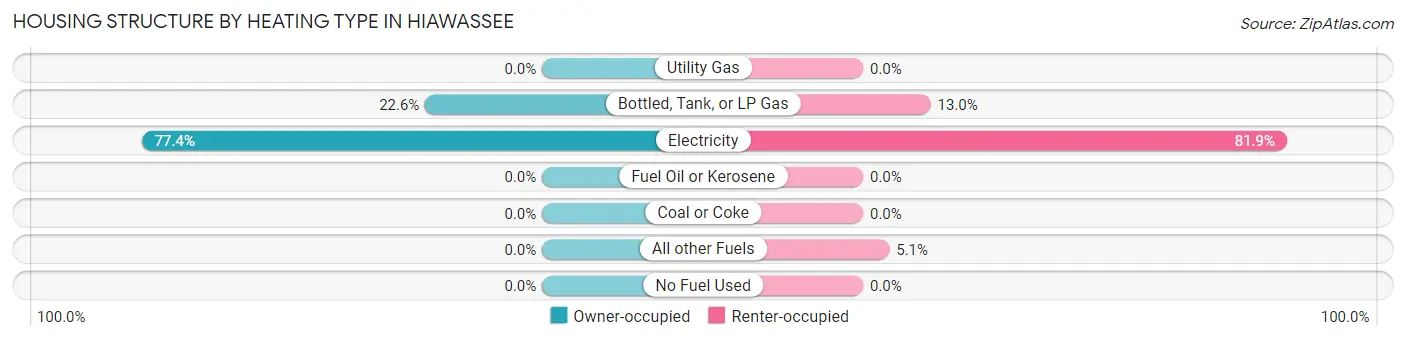
| Heating Type | Owner-occupied | Renter-occupied |
| Utility Gas | 0 (0.0%) | 0 (0.0%) |
| Bottled, Tank, or LP Gas | 54 (22.6%) | 36 (13.0%) |
| Electricity | 185 (77.4%) | 226 (81.9%) |
| Fuel Oil or Kerosene | 0 (0.0%) | 0 (0.0%) |
| Coal or Coke | 0 (0.0%) | 0 (0.0%) |
| All other Fuels | 0 (0.0%) | 14 (5.1%) |
| No Fuel Used | 0 (0.0%) | 0 (0.0%) |
| Total | 239 (100.0%) | 276 (100.0%) |
Household Vehicle Usage in Hiawassee
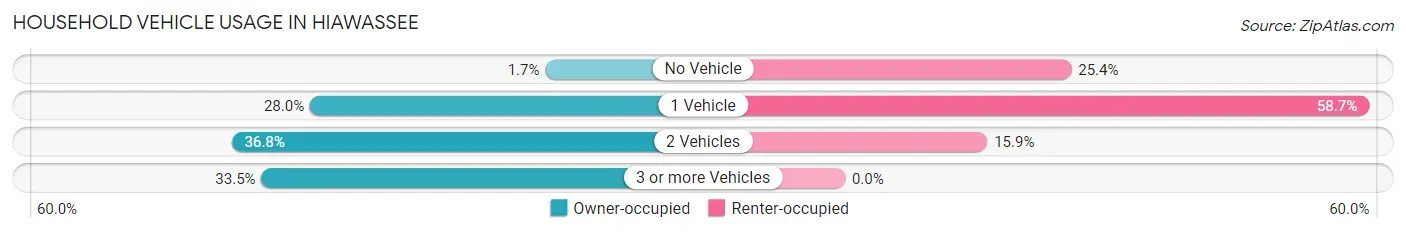
| Vehicles per Household | Owner-occupied | Renter-occupied |
| No Vehicle | 4 (1.7%) | 70 (25.4%) |
| 1 Vehicle | 67 (28.0%) | 162 (58.7%) |
| 2 Vehicles | 88 (36.8%) | 44 (15.9%) |
| 3 or more Vehicles | 80 (33.5%) | 0 (0.0%) |
| Total | 239 (100.0%) | 276 (100.0%) |
Real Estate & Mortgages in Hiawassee
Real Estate and Mortgage Overview in Hiawassee
| Characteristic | Without Mortgage | With Mortgage |
| Housing Units | 103 | 136 |
| Median Property Value | $333,900 | $313,200 |
| Median Household Income | $83,295 | $7 |
| Monthly Housing Costs | $550 | $13 |
| Real Estate Taxes | $1,524 | $0 |
Property Value by Mortgage Status in Hiawassee
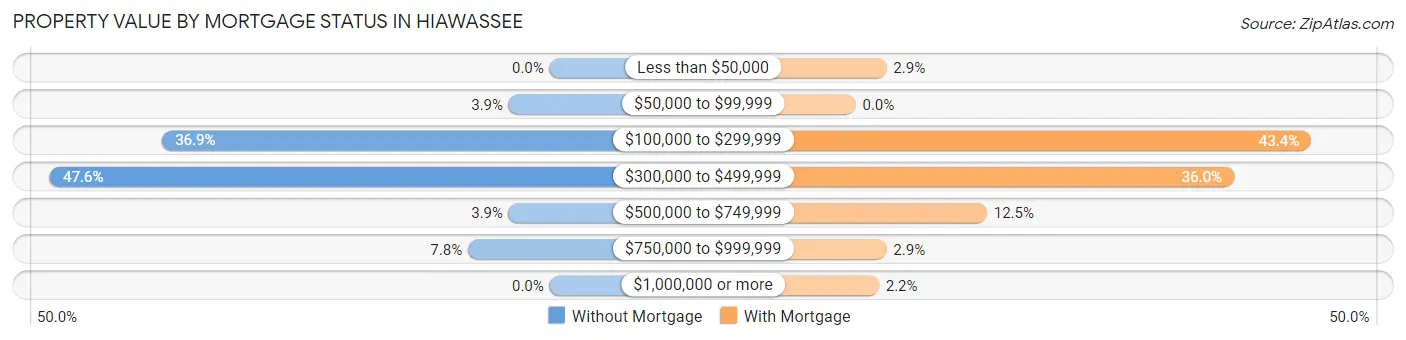
| Property Value | Without Mortgage | With Mortgage |
| Less than $50,000 | 0 (0.0%) | 4 (2.9%) |
| $50,000 to $99,999 | 4 (3.9%) | 0 (0.0%) |
| $100,000 to $299,999 | 38 (36.9%) | 59 (43.4%) |
| $300,000 to $499,999 | 49 (47.6%) | 49 (36.0%) |
| $500,000 to $749,999 | 4 (3.9%) | 17 (12.5%) |
| $750,000 to $999,999 | 8 (7.8%) | 4 (2.9%) |
| $1,000,000 or more | 0 (0.0%) | 3 (2.2%) |
| Total | 103 (100.0%) | 136 (100.0%) |
Household Income by Mortgage Status in Hiawassee
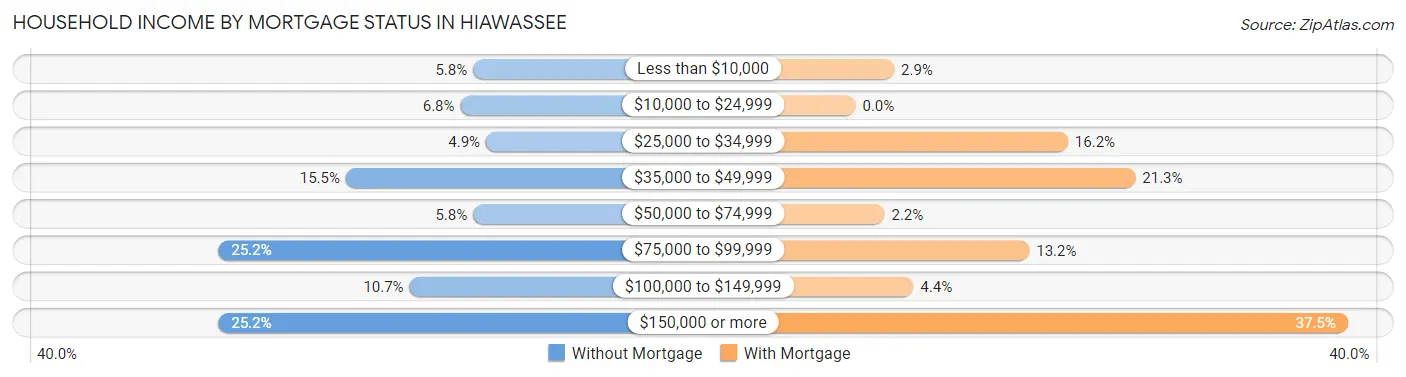
| Household Income | Without Mortgage | With Mortgage |
| Less than $10,000 | 6 (5.8%) | 4 (2.9%) |
| $10,000 to $24,999 | 7 (6.8%) | 0 (0.0%) |
| $25,000 to $34,999 | 5 (4.9%) | 22 (16.2%) |
| $35,000 to $49,999 | 16 (15.5%) | 29 (21.3%) |
| $50,000 to $74,999 | 6 (5.8%) | 3 (2.2%) |
| $75,000 to $99,999 | 26 (25.2%) | 18 (13.2%) |
| $100,000 to $149,999 | 11 (10.7%) | 6 (4.4%) |
| $150,000 or more | 26 (25.2%) | 51 (37.5%) |
| Total | 103 (100.0%) | 136 (100.0%) |
Property Value to Household Income Ratio in Hiawassee
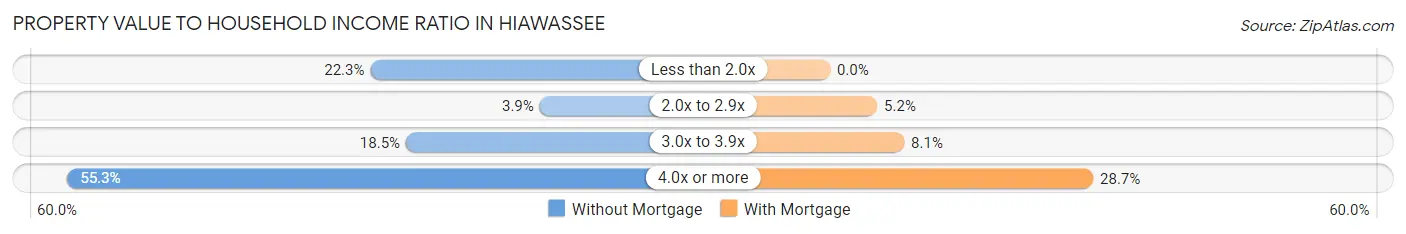
| Value-to-Income Ratio | Without Mortgage | With Mortgage |
| Less than 2.0x | 23 (22.3%) | 0 (0.0%) |
| 2.0x to 2.9x | 4 (3.9%) | 7 (5.1%) |
| 3.0x to 3.9x | 19 (18.4%) | 11 (8.1%) |
| 4.0x or more | 57 (55.3%) | 39 (28.7%) |
| Total | 103 (100.0%) | 136 (100.0%) |
Real Estate Taxes by Mortgage Status in Hiawassee
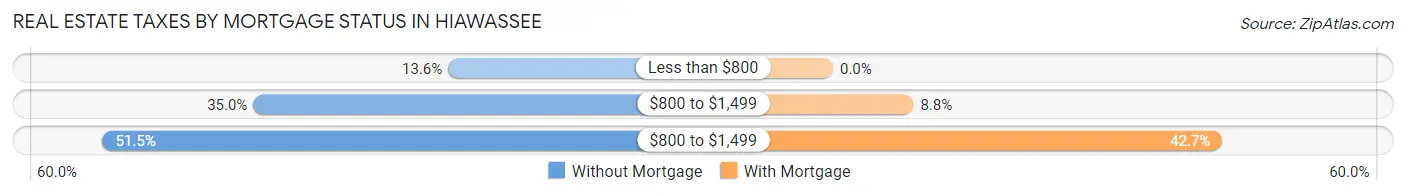
| Property Taxes | Without Mortgage | With Mortgage |
| Less than $800 | 14 (13.6%) | 0 (0.0%) |
| $800 to $1,499 | 36 (34.9%) | 12 (8.8%) |
| $800 to $1,499 | 53 (51.5%) | 58 (42.6%) |
| Total | 103 (100.0%) | 136 (100.0%) |
Health & Disability in Hiawassee
Health Insurance Coverage by Age in Hiawassee
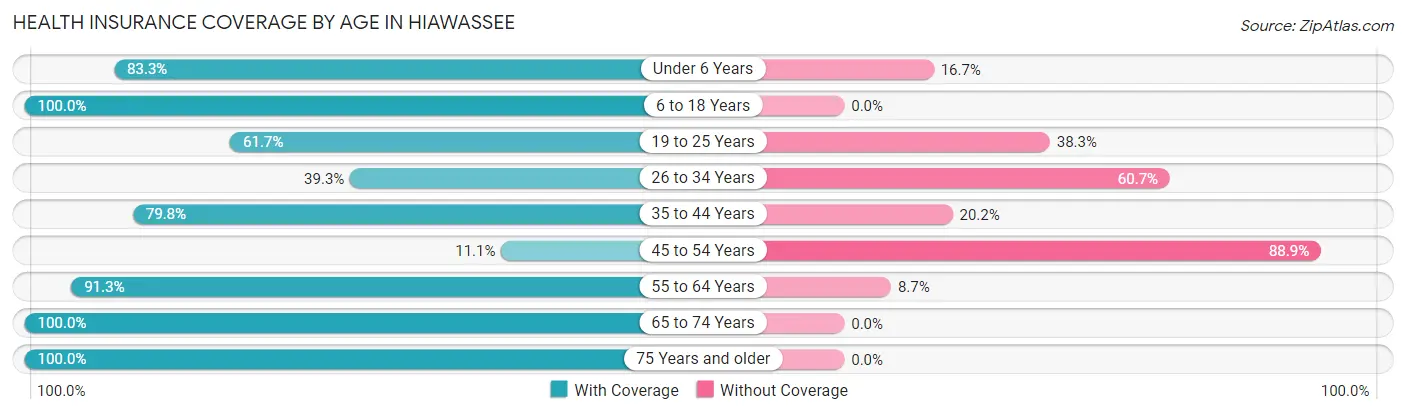
| Age Bracket | With Coverage | Without Coverage |
| Under 6 Years | 50 (83.3%) | 10 (16.7%) |
| 6 to 18 Years | 78 (100.0%) | 0 (0.0%) |
| 19 to 25 Years | 66 (61.7%) | 41 (38.3%) |
| 26 to 34 Years | 33 (39.3%) | 51 (60.7%) |
| 35 to 44 Years | 87 (79.8%) | 22 (20.2%) |
| 45 to 54 Years | 13 (11.1%) | 104 (88.9%) |
| 55 to 64 Years | 84 (91.3%) | 8 (8.7%) |
| 65 to 74 Years | 187 (100.0%) | 0 (0.0%) |
| 75 Years and older | 180 (100.0%) | 0 (0.0%) |
| Total | 778 (76.7%) | 236 (23.3%) |
Health Insurance Coverage by Citizenship Status in Hiawassee
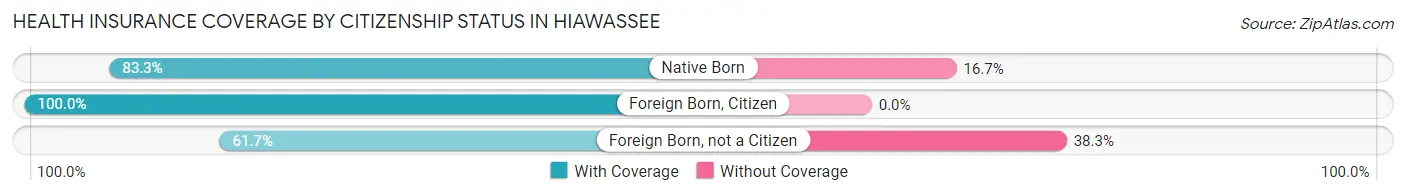
| Citizenship Status | With Coverage | Without Coverage |
| Native Born | 50 (83.3%) | 10 (16.7%) |
| Foreign Born, Citizen | 78 (100.0%) | 0 (0.0%) |
| Foreign Born, not a Citizen | 66 (61.7%) | 41 (38.3%) |
Health Insurance Coverage by Household Income in Hiawassee
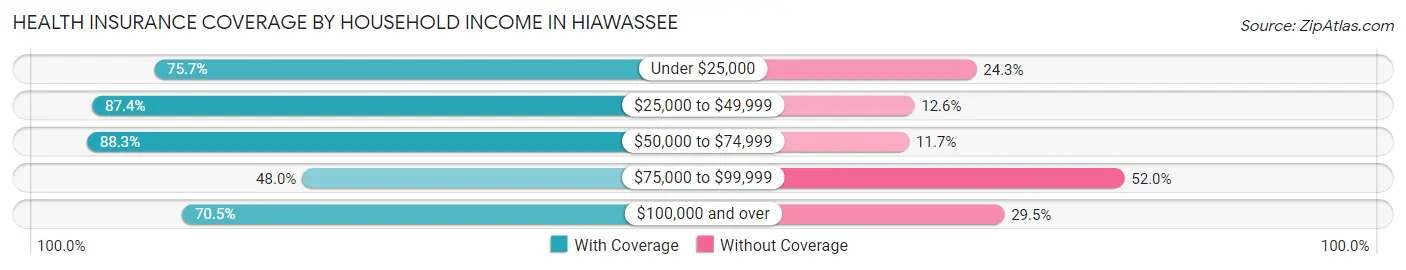
| Household Income | With Coverage | Without Coverage |
| Under $25,000 | 181 (75.7%) | 58 (24.3%) |
| $25,000 to $49,999 | 242 (87.4%) | 35 (12.6%) |
| $50,000 to $74,999 | 106 (88.3%) | 14 (11.7%) |
| $75,000 to $99,999 | 60 (48.0%) | 65 (52.0%) |
| $100,000 and over | 153 (70.5%) | 64 (29.5%) |
Public vs Private Health Insurance Coverage by Age in Hiawassee
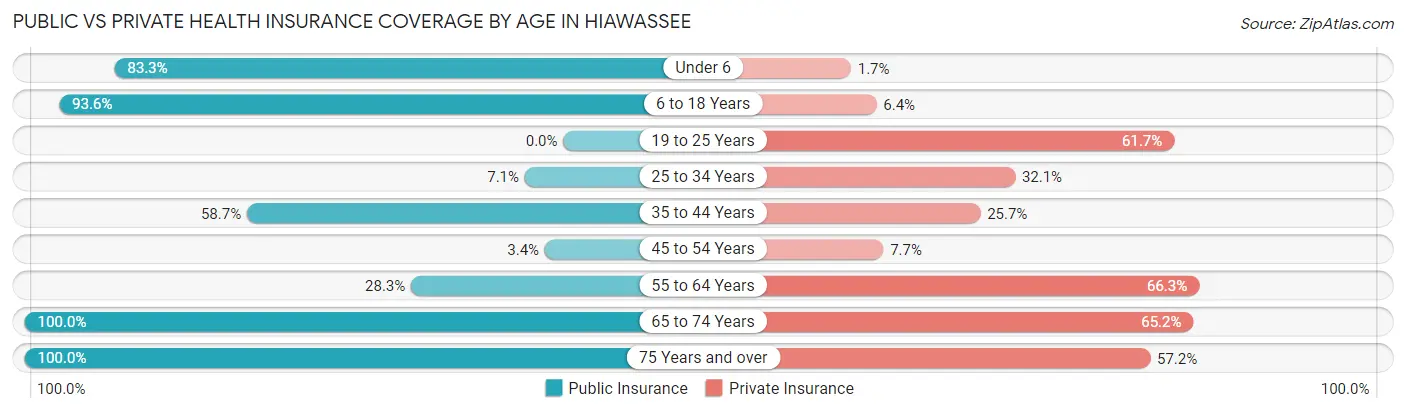
| Age Bracket | Public Insurance | Private Insurance |
| Under 6 | 50 (83.3%) | 1 (1.7%) |
| 6 to 18 Years | 73 (93.6%) | 5 (6.4%) |
| 19 to 25 Years | 0 (0.0%) | 66 (61.7%) |
| 25 to 34 Years | 6 (7.1%) | 27 (32.1%) |
| 35 to 44 Years | 64 (58.7%) | 28 (25.7%) |
| 45 to 54 Years | 4 (3.4%) | 9 (7.7%) |
| 55 to 64 Years | 26 (28.3%) | 61 (66.3%) |
| 65 to 74 Years | 187 (100.0%) | 122 (65.2%) |
| 75 Years and over | 180 (100.0%) | 103 (57.2%) |
| Total | 590 (58.2%) | 422 (41.6%) |
Disability Status by Sex by Age in Hiawassee
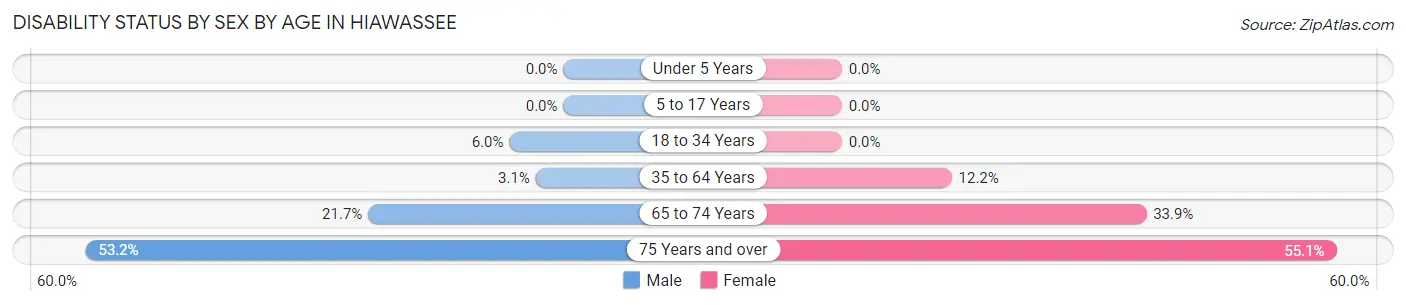
| Age Bracket | Male | Female |
| Under 5 Years | 0 (0.0%) | 0 (0.0%) |
| 5 to 17 Years | 0 (0.0%) | 0 (0.0%) |
| 18 to 34 Years | 5 (6.0%) | 0 (0.0%) |
| 35 to 64 Years | 4 (3.1%) | 23 (12.2%) |
| 65 to 74 Years | 15 (21.7%) | 40 (33.9%) |
| 75 Years and over | 33 (53.2%) | 65 (55.1%) |
Disability Class by Sex by Age in Hiawassee
Disability Class: Hearing Difficulty
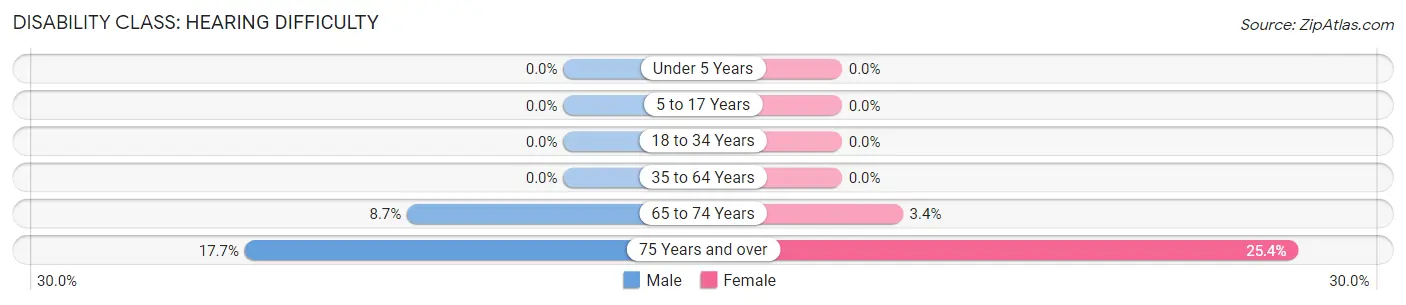
| Age Bracket | Male | Female |
| Under 5 Years | 0 (0.0%) | 0 (0.0%) |
| 5 to 17 Years | 0 (0.0%) | 0 (0.0%) |
| 18 to 34 Years | 0 (0.0%) | 0 (0.0%) |
| 35 to 64 Years | 0 (0.0%) | 0 (0.0%) |
| 65 to 74 Years | 6 (8.7%) | 4 (3.4%) |
| 75 Years and over | 11 (17.7%) | 30 (25.4%) |
Disability Class: Vision Difficulty
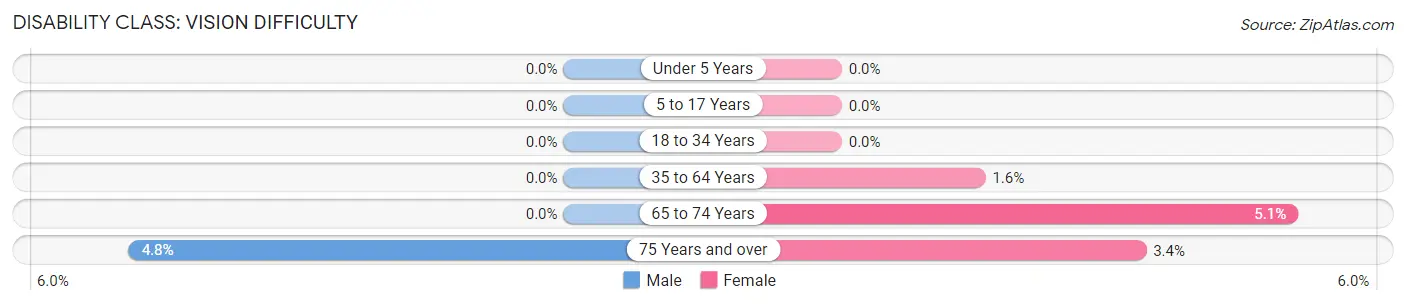
| Age Bracket | Male | Female |
| Under 5 Years | 0 (0.0%) | 0 (0.0%) |
| 5 to 17 Years | 0 (0.0%) | 0 (0.0%) |
| 18 to 34 Years | 0 (0.0%) | 0 (0.0%) |
| 35 to 64 Years | 0 (0.0%) | 3 (1.6%) |
| 65 to 74 Years | 0 (0.0%) | 6 (5.1%) |
| 75 Years and over | 3 (4.8%) | 4 (3.4%) |
Disability Class: Cognitive Difficulty
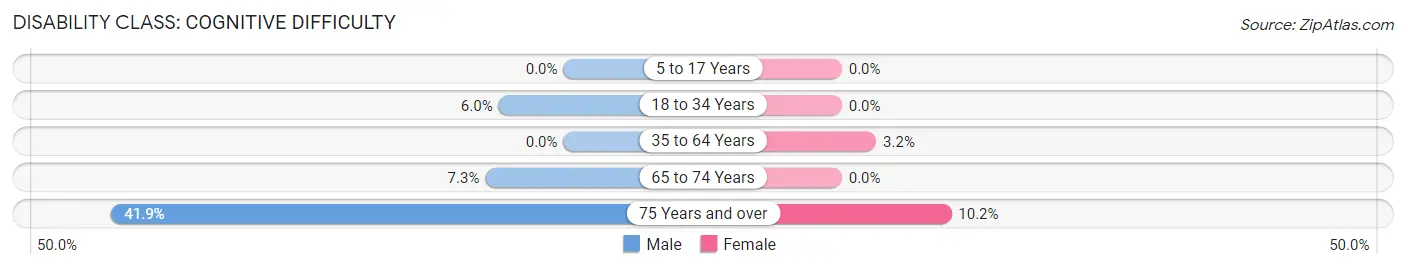
| Age Bracket | Male | Female |
| 5 to 17 Years | 0 (0.0%) | 0 (0.0%) |
| 18 to 34 Years | 5 (6.0%) | 0 (0.0%) |
| 35 to 64 Years | 0 (0.0%) | 6 (3.2%) |
| 65 to 74 Years | 5 (7.2%) | 0 (0.0%) |
| 75 Years and over | 26 (41.9%) | 12 (10.2%) |
Disability Class: Ambulatory Difficulty
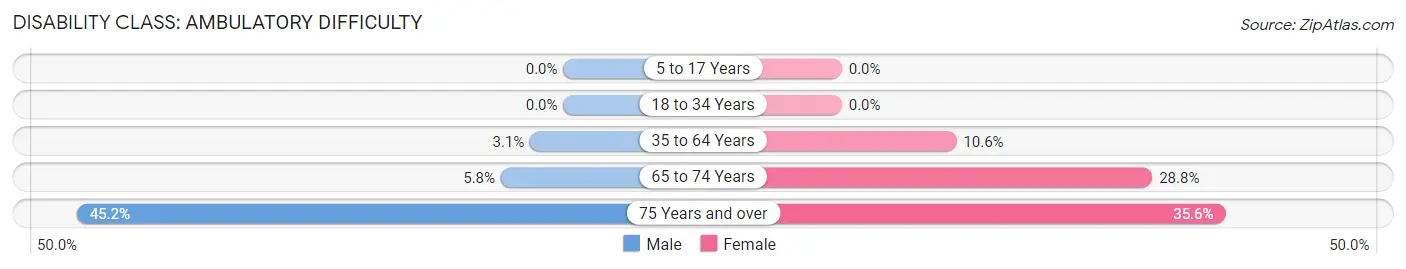
| Age Bracket | Male | Female |
| 5 to 17 Years | 0 (0.0%) | 0 (0.0%) |
| 18 to 34 Years | 0 (0.0%) | 0 (0.0%) |
| 35 to 64 Years | 4 (3.1%) | 20 (10.6%) |
| 65 to 74 Years | 4 (5.8%) | 34 (28.8%) |
| 75 Years and over | 28 (45.2%) | 42 (35.6%) |
Disability Class: Self-Care Difficulty
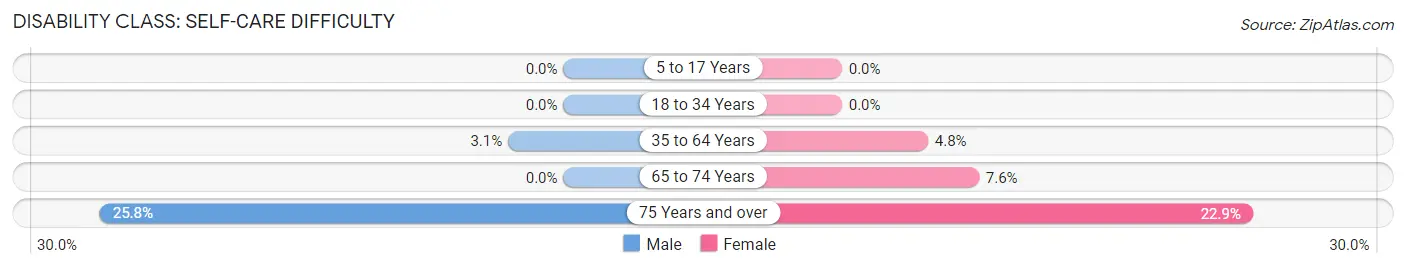
| Age Bracket | Male | Female |
| 5 to 17 Years | 0 (0.0%) | 0 (0.0%) |
| 18 to 34 Years | 0 (0.0%) | 0 (0.0%) |
| 35 to 64 Years | 4 (3.1%) | 9 (4.8%) |
| 65 to 74 Years | 0 (0.0%) | 9 (7.6%) |
| 75 Years and over | 16 (25.8%) | 27 (22.9%) |
Technology Access in Hiawassee
Computing Device Access in Hiawassee
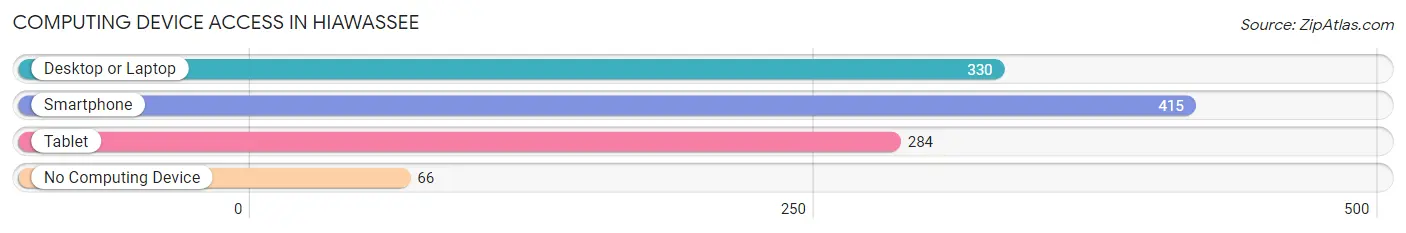
| Device Type | # Households | % Households |
| Desktop or Laptop | 330 | 64.1% |
| Smartphone | 415 | 80.6% |
| Tablet | 284 | 55.1% |
| No Computing Device | 66 | 12.8% |
| Total | 515 | 100.0% |
Internet Access in Hiawassee
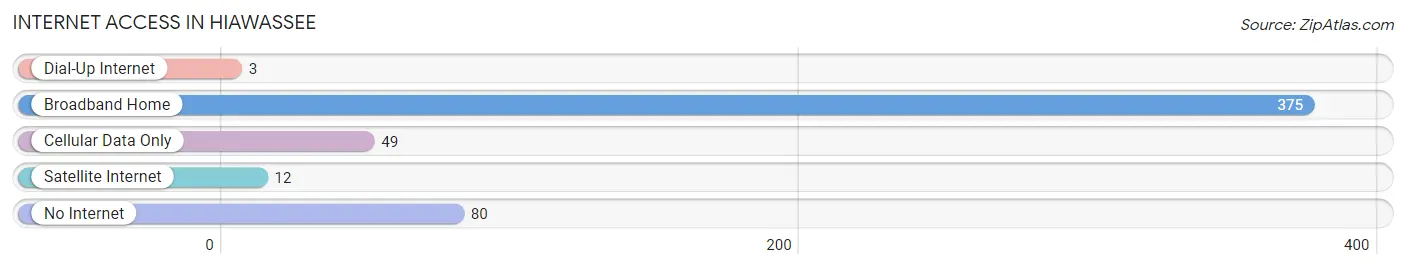
| Internet Type | # Households | % Households |
| Dial-Up Internet | 3 | 0.6% |
| Broadband Home | 375 | 72.8% |
| Cellular Data Only | 49 | 9.5% |
| Satellite Internet | 12 | 2.3% |
| No Internet | 80 | 15.5% |
| Total | 515 | 100.0% |
Hiawassee Summary
Hiawassee is a town located in Towns County, Georgia, United States. It is the county seat of Towns County. The population was 890 at the 2010 census.
History
Hiawassee was founded in 1856 and named after the Cherokee word for "meadow". The town was originally known as Hiawassee Courthouse, as it was the site of the Towns County Courthouse. The courthouse was moved to Young Harris in 1873, and the town was renamed Hiawassee.
The town was incorporated in 1873 and has been the county seat of Towns County since its founding. The town was a popular tourist destination in the late 19th and early 20th centuries, and was home to several resorts.
Geography
Hiawassee is located in the northeast corner of Georgia, in the foothills of the Blue Ridge Mountains. It is situated at the confluence of the Hiawassee and Nottely Rivers. The town is located at the intersection of U.S. Route 76 and Georgia State Route 17.
The town is located in the Chattahoochee National Forest, and is surrounded by the Nantahala National Forest to the north and the Chattahoochee-Oconee National Forest to the south.
Economy
Hiawassee is a popular tourist destination, and the town's economy is largely based on tourism. The town is home to several resorts, including the Ridges Resort and Marina, the Brasstown Valley Resort and Spa, and the Hiawassee Inn.
The town is also home to several wineries, including the Hiawassee River Winery and the Nottely River Winery.
Demographics
As of the 2010 census, there were 890 people, 393 households, and 241 families residing in the town. The population density was 545.3 people per square mile (210.9/km2). There were 463 housing units at an average density of 285.3 per square mile (110.3/km2). The racial makeup of the town was 97.1% White, 0.3% African American, 0.3% Native American, 0.3% Asian, 0.3% from other races, and 1.7% from two or more races. Hispanic or Latino of any race were 1.3% of the population.
There were 393 households, out of which 24.3% had children under the age of 18 living with them, 48.1% were married couples living together, 10.7% had a female householder with no husband present, and 37.2% were non-families. 32.2% of all households were made up of individuals, and 14.2% had someone living alone who was 65 years of age or older. The average household size was 2.25 and the average family size was 2.83.
In the town, the population was spread out, with 21.3% under the age of 18, 6.7% from 18 to 24, 24.3% from 25 to 44, 28.2% from 45 to 64, and 19.5% who were 65 years of age or older. The median age was 43 years. For every 100 females, there were 91.2 males. For every 100 females age 18 and over, there were 87.2 males.
The median income for a household in the town was $30,000, and the median income for a family was $36,250. Males had a median income of $27,500 versus $20,000 for females. The per capita income for the town was $17,845. About 10.2% of families and 14.2% of the population were below the poverty line, including 19.2% of those under age 18 and 10.3% of those age 65 or over.
Common Questions
What is Per Capita Income in Hiawassee?
Per Capita income in Hiawassee is $38,900.
What is the Median Family Income in Hiawassee?
Median Family Income in Hiawassee is $71,250.
What is the Median Household income in Hiawassee?
Median Household Income in Hiawassee is $40,917.
What is Income or Wage Gap in Hiawassee?
Income or Wage Gap in Hiawassee is 21.0%.
Women in Hiawassee earn 79.0 cents for every dollar earned by a man.
What is Family Income Deficit in Hiawassee?
Family Income Deficit in Hiawassee is $3,911.
Families that are below poverty line in Hiawassee earn $3,911 less on average than the poverty threshold level.
What is Inequality or Gini Index in Hiawassee?
Inequality or Gini Index in Hiawassee is 0.59.
What is the Total Population of Hiawassee?
Total Population of Hiawassee is 1,140.
What is the Total Male Population of Hiawassee?
Total Male Population of Hiawassee is 442.
What is the Total Female Population of Hiawassee?
Total Female Population of Hiawassee is 698.
What is the Ratio of Males per 100 Females in Hiawassee?
There are 63.32 Males per 100 Females in Hiawassee.
What is the Ratio of Females per 100 Males in Hiawassee?
There are 157.92 Females per 100 Males in Hiawassee.
What is the Median Population Age in Hiawassee?
Median Population Age in Hiawassee is 56.5 Years.
What is the Average Family Size in Hiawassee
Average Family Size in Hiawassee is 2.8 People.
What is the Average Household Size in Hiawassee
Average Household Size in Hiawassee is 1.9 People.
How Large is the Labor Force in Hiawassee?
There are 464 People in the Labor Forcein in Hiawassee.
What is the Percentage of People in the Labor Force in Hiawassee?
46.3% of People are in the Labor Force in Hiawassee.