Zip Codes with the Highest Percentage of Population Employed in Food Preparation & Serving in Savannah, GA
RELATED REPORTS & OPTIONS
Food Preparation & Serving
Savannah
Compare Zip Codes
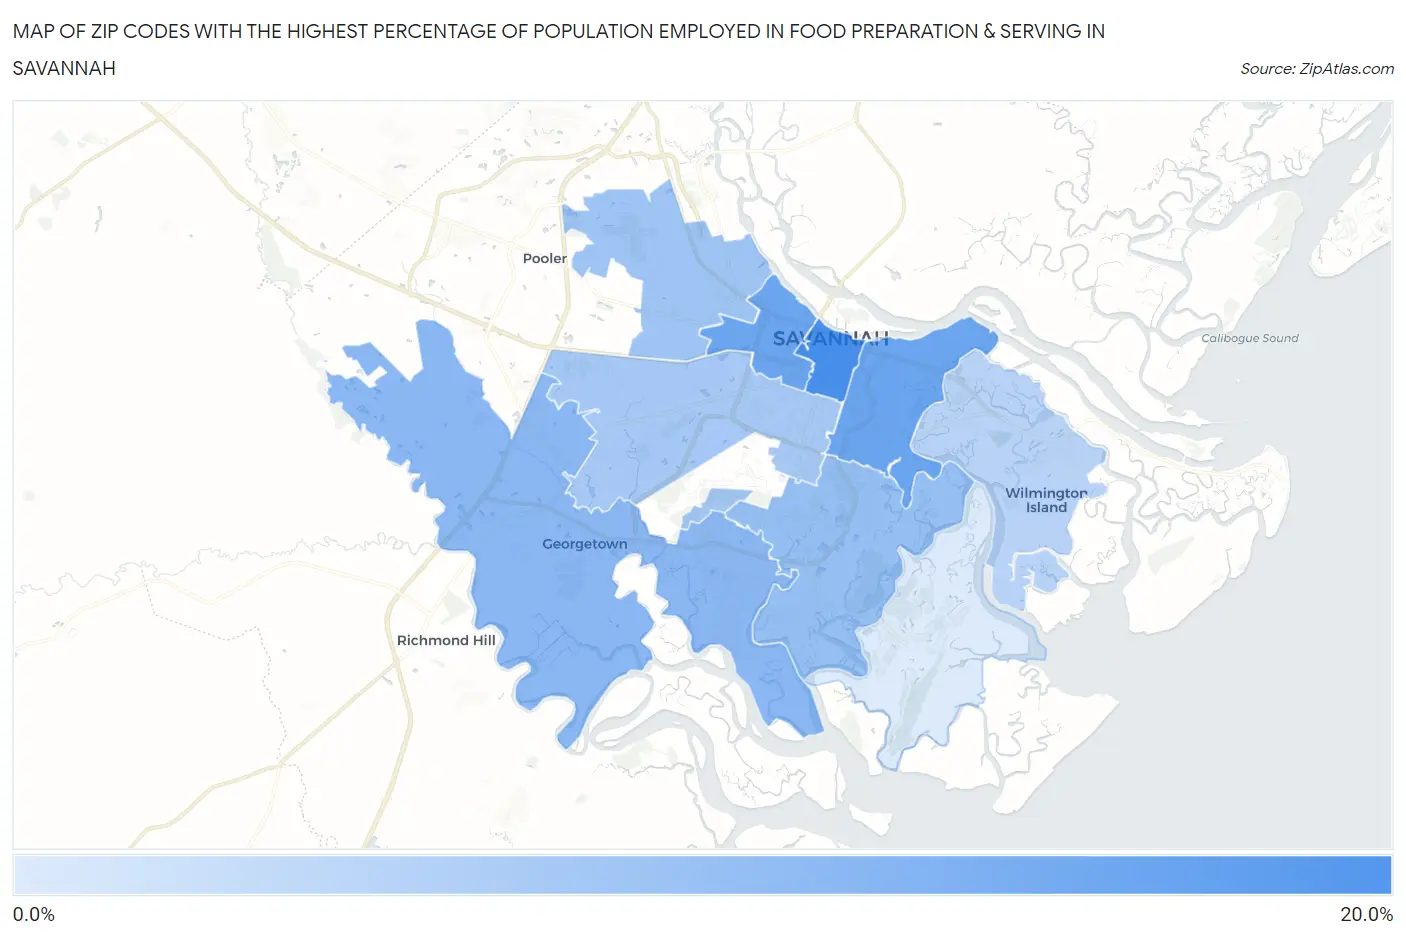
Map of Zip Codes with the Highest Percentage of Population Employed in Food Preparation & Serving in Savannah
0.43%
15.5%
Zip Codes with the Highest Percentage of Population Employed in Food Preparation & Serving in Savannah, GA
| Zip Code | % Employed | vs State | vs National | |
| 1. | 31401 | 15.5% | 5.1%(+10.3)#15 | 5.3%(+10.2)#918 |
| 2. | 31415 | 11.6% | 5.1%(+6.50)#30 | 5.3%(+6.36)#1,797 |
| 3. | 31404 | 11.6% | 5.1%(+6.47)#31 | 5.3%(+6.33)#1,813 |
| 4. | 31419 | 8.4% | 5.1%(+3.30)#77 | 5.3%(+3.16)#4,120 |
| 5. | 31406 | 7.3% | 5.1%(+2.16)#116 | 5.3%(+2.02)#5,915 |
| 6. | 31408 | 6.4% | 5.1%(+1.27)#164 | 5.3%(+1.13)#8,117 |
| 7. | 31405 | 5.7% | 5.1%(+0.587)#235 | 5.3%(+0.446)#10,239 |
| 8. | 31410 | 4.0% | 5.1%(-1.13)#395 | 5.3%(-1.27)#17,072 |
| 9. | 31411 | 0.43% | 5.1%(-4.71)#646 | 5.3%(-4.85)#27,761 |
1
Common Questions
What are the Top 5 Zip Codes with the Highest Percentage of Population Employed in Food Preparation & Serving in Savannah, GA?
Top 5 Zip Codes with the Highest Percentage of Population Employed in Food Preparation & Serving in Savannah, GA are:
What zip code has the Highest Percentage of Population Employed in Food Preparation & Serving in Savannah, GA?
31401 has the Highest Percentage of Population Employed in Food Preparation & Serving in Savannah, GA with 15.5%.
What is the Percentage of Population Employed in Food Preparation & Serving in Savannah, GA?
Percentage of Population Employed in Food Preparation & Serving in Savannah is 9.3%.
What is the Percentage of Population Employed in Food Preparation & Serving in Georgia?
Percentage of Population Employed in Food Preparation & Serving in Georgia is 5.1%.
What is the Percentage of Population Employed in Food Preparation & Serving in the United States?
Percentage of Population Employed in Food Preparation & Serving in the United States is 5.3%.