Zip Codes with the Highest Percentage of Population Employed in Food Preparation & Serving in Fayetteville, GA
RELATED REPORTS & OPTIONS
Food Preparation & Serving
Fayetteville
Compare Zip Codes
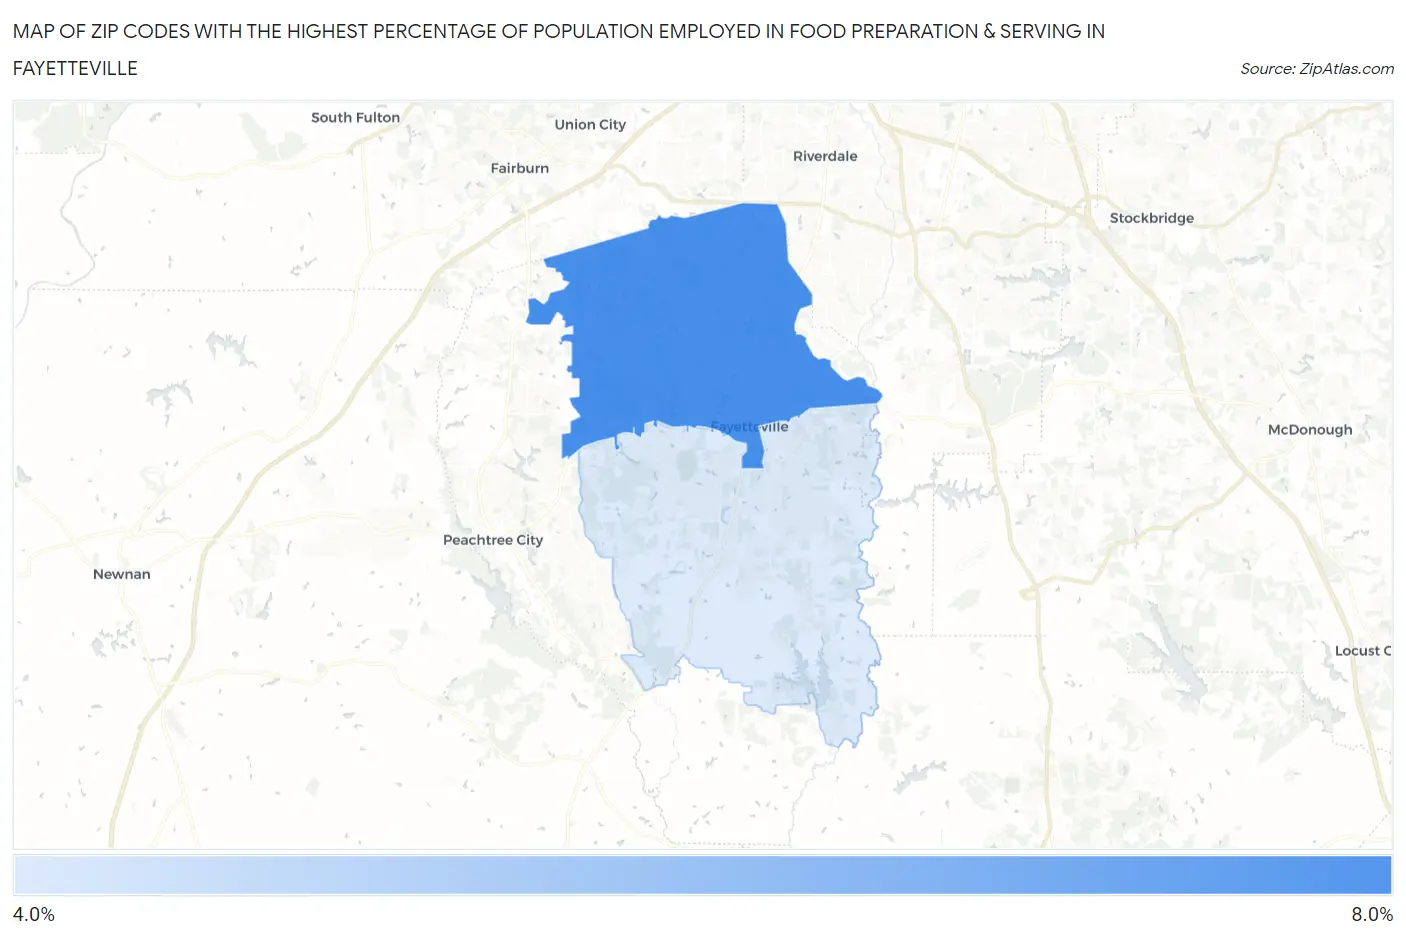
Map of Zip Codes with the Highest Percentage of Population Employed in Food Preparation & Serving in Fayetteville
4.8%
6.6%
Zip Codes with the Highest Percentage of Population Employed in Food Preparation & Serving in Fayetteville, GA
| Zip Code | % Employed | vs State | vs National | |
| 1. | 30214 | 6.6% | 5.1%(+1.46)#151 | 5.3%(+1.32)#7,581 |
| 2. | 30215 | 4.8% | 5.1%(-0.323)#314 | 5.3%(-0.465)#13,674 |
1
Common Questions
What are the Top Zip Codes with the Highest Percentage of Population Employed in Food Preparation & Serving in Fayetteville, GA?
Top Zip Codes with the Highest Percentage of Population Employed in Food Preparation & Serving in Fayetteville, GA are:
What zip code has the Highest Percentage of Population Employed in Food Preparation & Serving in Fayetteville, GA?
30214 has the Highest Percentage of Population Employed in Food Preparation & Serving in Fayetteville, GA with 6.6%.
What is the Percentage of Population Employed in Food Preparation & Serving in Fayetteville, GA?
Percentage of Population Employed in Food Preparation & Serving in Fayetteville is 6.7%.
What is the Percentage of Population Employed in Food Preparation & Serving in Georgia?
Percentage of Population Employed in Food Preparation & Serving in Georgia is 5.1%.
What is the Percentage of Population Employed in Food Preparation & Serving in the United States?
Percentage of Population Employed in Food Preparation & Serving in the United States is 5.3%.