Young Harris, GA Map & Demographics
Young Harris Map
Young Harris Overview
$13,666
PER CAPITA INCOME
$59,286
AVG FAMILY INCOME
$27,500
AVG HOUSEHOLD INCOME
33.8%
WAGE / INCOME GAP [ % ]
66.2¢/ $1
WAGE / INCOME GAP [ $ ]
0.58
INEQUALITY / GINI INDEX
1,066
TOTAL POPULATION
523
MALE POPULATION
543
FEMALE POPULATION
96.32
MALES / 100 FEMALES
103.82
FEMALES / 100 MALES
20.4
MEDIAN AGE
2.8
AVG FAMILY SIZE
2.1
AVG HOUSEHOLD SIZE
576
LABOR FORCE [ PEOPLE ]
57.1%
PERCENT IN LABOR FORCE
8.2%
UNEMPLOYMENT RATE
Young Harris Zip Codes
Income in Young Harris
Income Overview in Young Harris
Per Capita Income in Young Harris is $13,666, while median incomes of families and households are $59,286 and $27,500 respectively.
| Characteristic | Number | Measure |
| Per Capita Income | 1,066 | $13,666 |
| Median Family Income | 110 | $59,286 |
| Mean Family Income | 110 | $83,048 |
| Median Household Income | 192 | $27,500 |
| Mean Household Income | 192 | $58,263 |
| Income Deficit | 110 | $0 |
| Wage / Income Gap (%) | 1,066 | 33.80% |
| Wage / Income Gap ($) | 1,066 | 66.20¢ per $1 |
| Gini / Inequality Index | 1,066 | 0.58 |
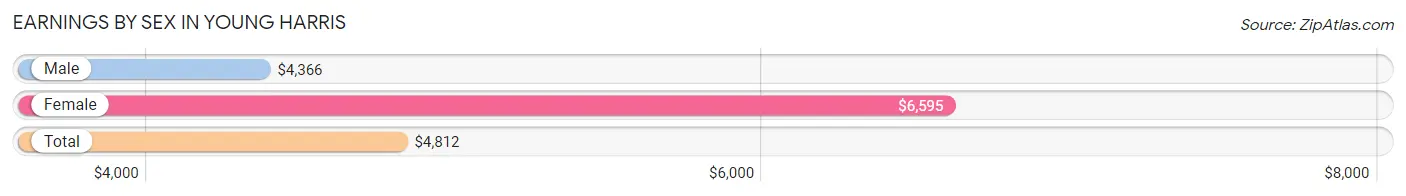
Earnings by Sex in Young Harris
Average Earnings in Young Harris are $4,812, $4,366 for men and $6,595 for women, a difference of 33.8%.
| Sex | Number | Average Earnings |
| Male | 409 (56.9%) | $4,366 |
| Female | 310 (43.1%) | $6,595 |
| Total | 719 (100.0%) | $4,812 |
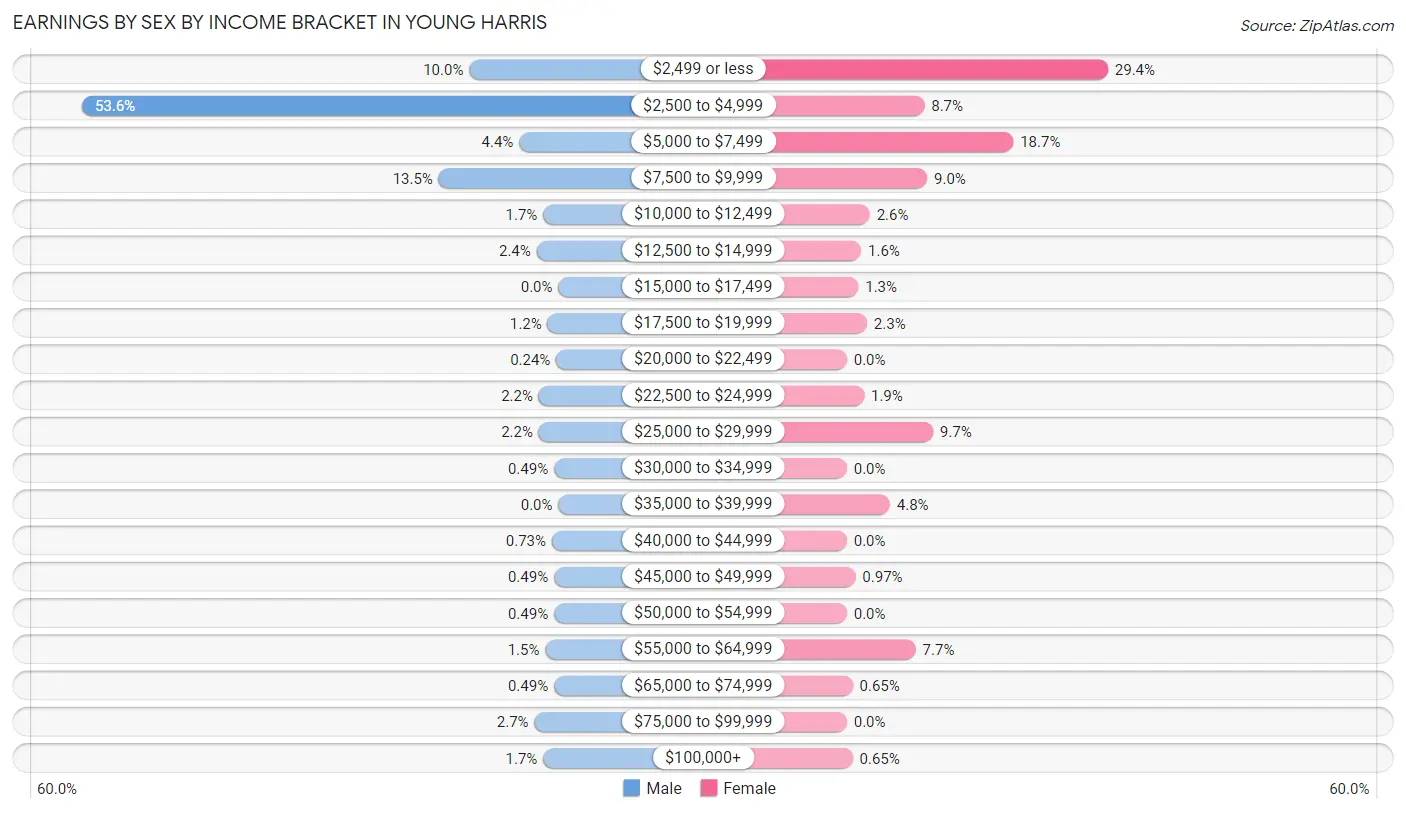
Earnings by Sex by Income Bracket in Young Harris
The most common earnings brackets in Young Harris are $2,500 to $4,999 for men (219 | 53.5%) and $2,499 or less for women (91 | 29.3%).
| Income | Male | Female |
| $2,499 or less | 41 (10.0%) | 91 (29.3%) |
| $2,500 to $4,999 | 219 (53.5%) | 27 (8.7%) |
| $5,000 to $7,499 | 18 (4.4%) | 58 (18.7%) |
| $7,500 to $9,999 | 55 (13.5%) | 28 (9.0%) |
| $10,000 to $12,499 | 7 (1.7%) | 8 (2.6%) |
| $12,500 to $14,999 | 10 (2.4%) | 5 (1.6%) |
| $15,000 to $17,499 | 0 (0.0%) | 4 (1.3%) |
| $17,500 to $19,999 | 5 (1.2%) | 7 (2.3%) |
| $20,000 to $22,499 | 1 (0.2%) | 0 (0.0%) |
| $22,500 to $24,999 | 9 (2.2%) | 6 (1.9%) |
| $25,000 to $29,999 | 9 (2.2%) | 30 (9.7%) |
| $30,000 to $34,999 | 2 (0.5%) | 0 (0.0%) |
| $35,000 to $39,999 | 0 (0.0%) | 15 (4.8%) |
| $40,000 to $44,999 | 3 (0.7%) | 0 (0.0%) |
| $45,000 to $49,999 | 2 (0.5%) | 3 (1.0%) |
| $50,000 to $54,999 | 2 (0.5%) | 0 (0.0%) |
| $55,000 to $64,999 | 6 (1.5%) | 24 (7.7%) |
| $65,000 to $74,999 | 2 (0.5%) | 2 (0.6%) |
| $75,000 to $99,999 | 11 (2.7%) | 0 (0.0%) |
| $100,000+ | 7 (1.7%) | 2 (0.6%) |
| Total | 409 (100.0%) | 310 (100.0%) |
Earnings by Sex by Educational Attainment in Young Harris
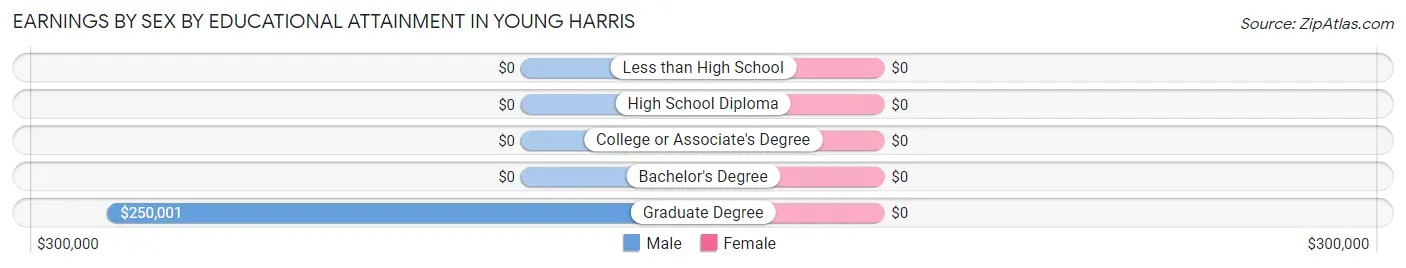
| Educational Attainment | Male Income | Female Income |
| Less than High School | - | - |
| High School Diploma | - | - |
| College or Associate's Degree | - | - |
| Bachelor's Degree | - | - |
| Graduate Degree | $250,001 | $0 |
| Total | - | - |
Family Income in Young Harris
Family Income Brackets in Young Harris
According to the Young Harris family income data, there are 30 families falling into the $75,000 to $99,999 income range, which is the most common income bracket and makes up 27.3% of all families.
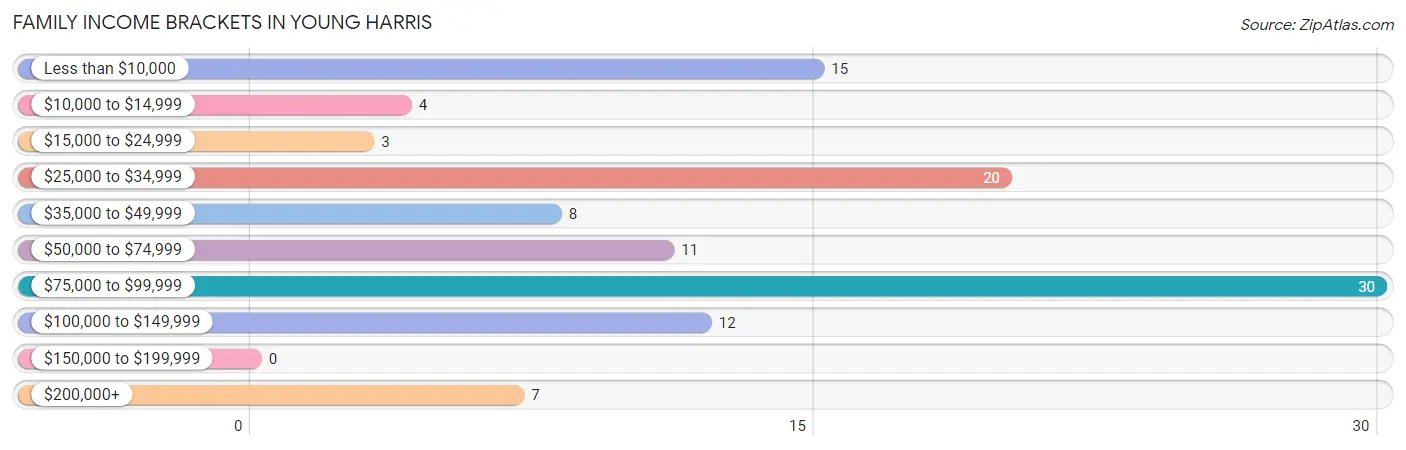
| Income Bracket | # Families | % Families |
| Less than $10,000 | 15 | 13.6% |
| $10,000 to $14,999 | 4 | 3.6% |
| $15,000 to $24,999 | 3 | 2.7% |
| $25,000 to $34,999 | 20 | 18.2% |
| $35,000 to $49,999 | 8 | 7.3% |
| $50,000 to $74,999 | 11 | 10.0% |
| $75,000 to $99,999 | 30 | 27.3% |
| $100,000 to $149,999 | 12 | 10.9% |
| $150,000 to $199,999 | 0 | 0.0% |
| $200,000+ | 7 | 6.4% |
Family Income by Famaliy Size in Young Harris
3-person families (45 | 40.9%) account for the highest median family income in Young Harris with $75,694 per family, while 2-person families (52 | 47.3%) have the highest median income of $33,125 per family member.
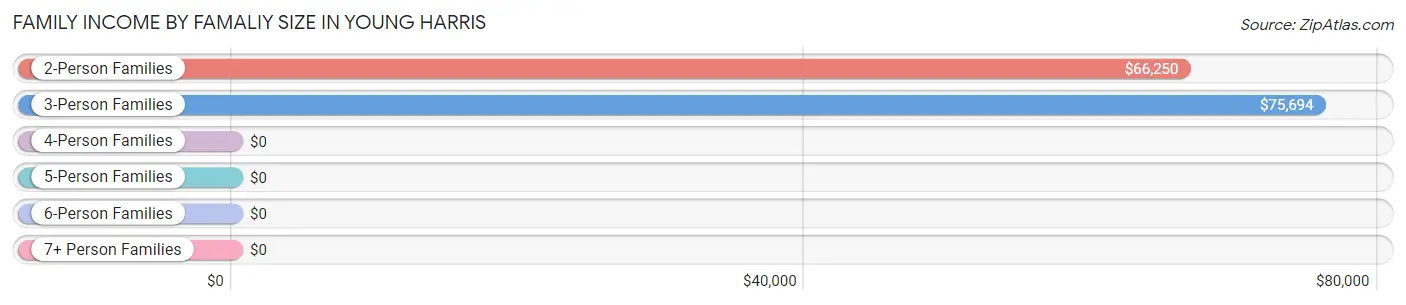
| Income Bracket | # Families | Median Income |
| 2-Person Families | 52 (47.3%) | $66,250 |
| 3-Person Families | 45 (40.9%) | $75,694 |
| 4-Person Families | 0 (0.0%) | $0 |
| 5-Person Families | 7 (6.4%) | $0 |
| 6-Person Families | 6 (5.4%) | $0 |
| 7+ Person Families | 0 (0.0%) | $0 |
| Total | 110 (100.0%) | $59,286 |
Family Income by Number of Earners in Young Harris
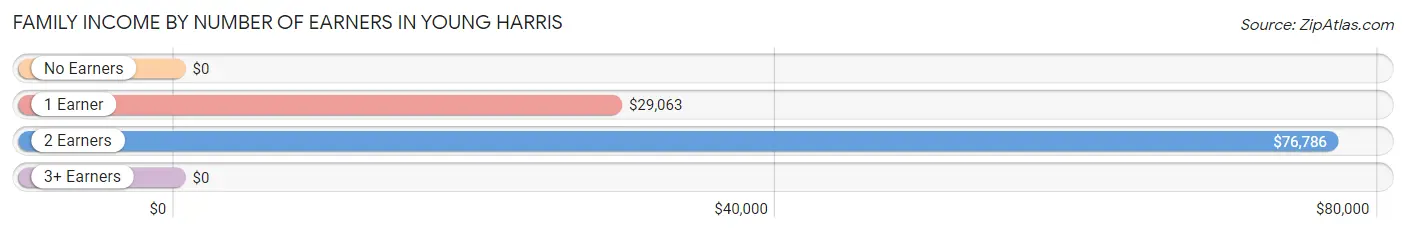
| Number of Earners | # Families | Median Income |
| No Earners | 3 (2.7%) | $0 |
| 1 Earner | 58 (52.7%) | $29,063 |
| 2 Earners | 40 (36.4%) | $76,786 |
| 3+ Earners | 9 (8.2%) | $0 |
| Total | 110 (100.0%) | $59,286 |
Household Income in Young Harris
Household Income Brackets in Young Harris
With 40 households falling in the category, the $75,000 to $99,999 income range is the most frequent in Young Harris, accounting for 20.8% of all households.
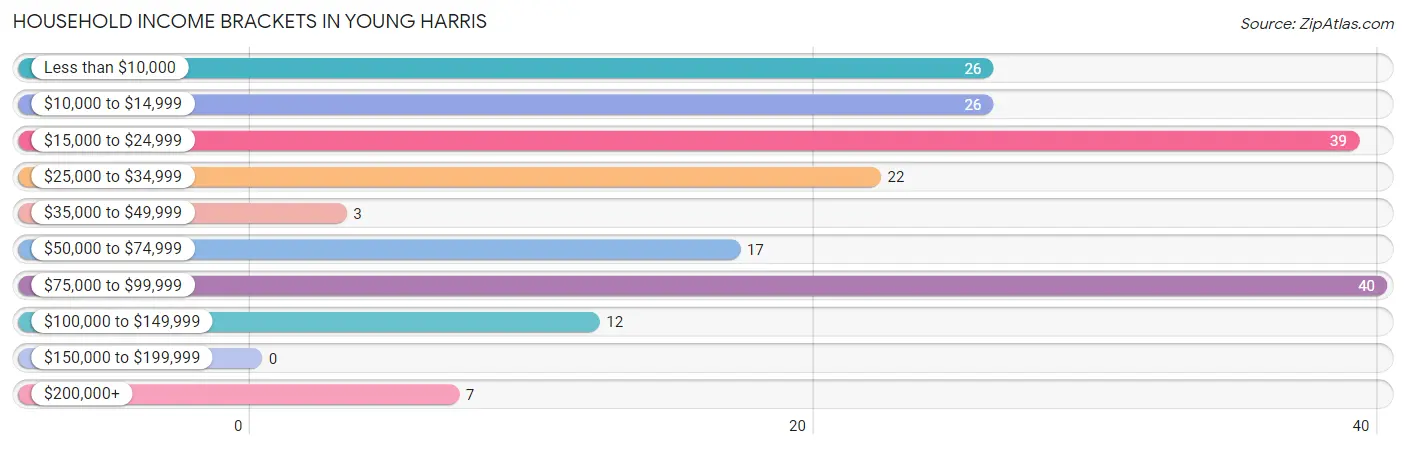
| Income Bracket | # Households | % Households |
| Less than $10,000 | 26 | 13.5% |
| $10,000 to $14,999 | 26 | 13.5% |
| $15,000 to $24,999 | 39 | 20.3% |
| $25,000 to $34,999 | 22 | 11.5% |
| $35,000 to $49,999 | 3 | 1.6% |
| $50,000 to $74,999 | 17 | 8.9% |
| $75,000 to $99,999 | 40 | 20.8% |
| $100,000 to $149,999 | 12 | 6.3% |
| $150,000 to $199,999 | 0 | 0.0% |
| $200,000+ | 7 | 3.6% |
Household Income by Householder Age in Young Harris
The median household income in Young Harris is $27,500, with the highest median household income of $76,786 found in the 45 to 64 years age bracket for the primary householder. A total of 60 households (31.2%) fall into this category. Meanwhile, the 25 to 44 years age bracket for the primary householder has the lowest median household income of $0, with 58 households (30.2%) in this group.
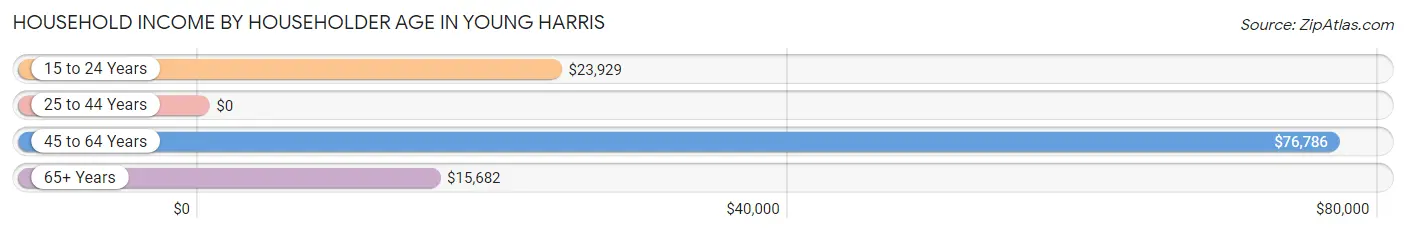
| Income Bracket | # Households | Median Income |
| 15 to 24 Years | 12 (6.2%) | $23,929 |
| 25 to 44 Years | 58 (30.2%) | $0 |
| 45 to 64 Years | 60 (31.2%) | $76,786 |
| 65+ Years | 62 (32.3%) | $15,682 |
| Total | 192 (100.0%) | $27,500 |
Poverty in Young Harris
Income Below Poverty by Sex and Age in Young Harris
With 43.6% poverty level for males and 26.9% for females among the residents of Young Harris, 6 to 11 year old males and 65 to 74 year old females are the most vulnerable to poverty, with 19 males (95.0%) and 22 females (59.5%) in their respective age groups living below the poverty level.
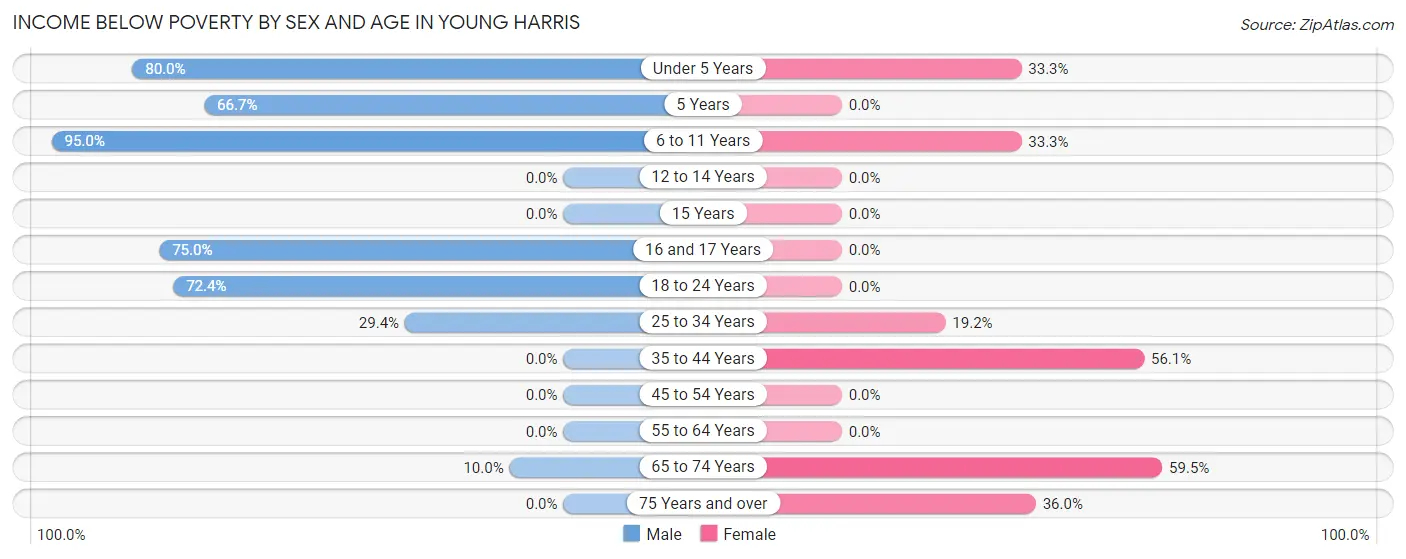
| Age Bracket | Male | Female |
| Under 5 Years | 12 (80.0%) | 2 (33.3%) |
| 5 Years | 2 (66.7%) | 0 (0.0%) |
| 6 to 11 Years | 19 (95.0%) | 2 (33.3%) |
| 12 to 14 Years | 0 (0.0%) | 0 (0.0%) |
| 15 Years | 0 (0.0%) | 0 (0.0%) |
| 16 and 17 Years | 6 (75.0%) | 0 (0.0%) |
| 18 to 24 Years | 21 (72.4%) | 0 (0.0%) |
| 25 to 34 Years | 10 (29.4%) | 5 (19.2%) |
| 35 to 44 Years | 0 (0.0%) | 23 (56.1%) |
| 45 to 54 Years | 0 (0.0%) | 0 (0.0%) |
| 55 to 64 Years | 0 (0.0%) | 0 (0.0%) |
| 65 to 74 Years | 2 (10.0%) | 22 (59.5%) |
| 75 Years and over | 0 (0.0%) | 9 (36.0%) |
| Total | 72 (43.6%) | 63 (26.9%) |
Income Above Poverty by Sex and Age in Young Harris
According to the poverty statistics in Young Harris, males aged 15 years and females aged 12 to 14 years are the age groups that are most secure financially, with 100.0% of males and 100.0% of females in these age groups living above the poverty line.
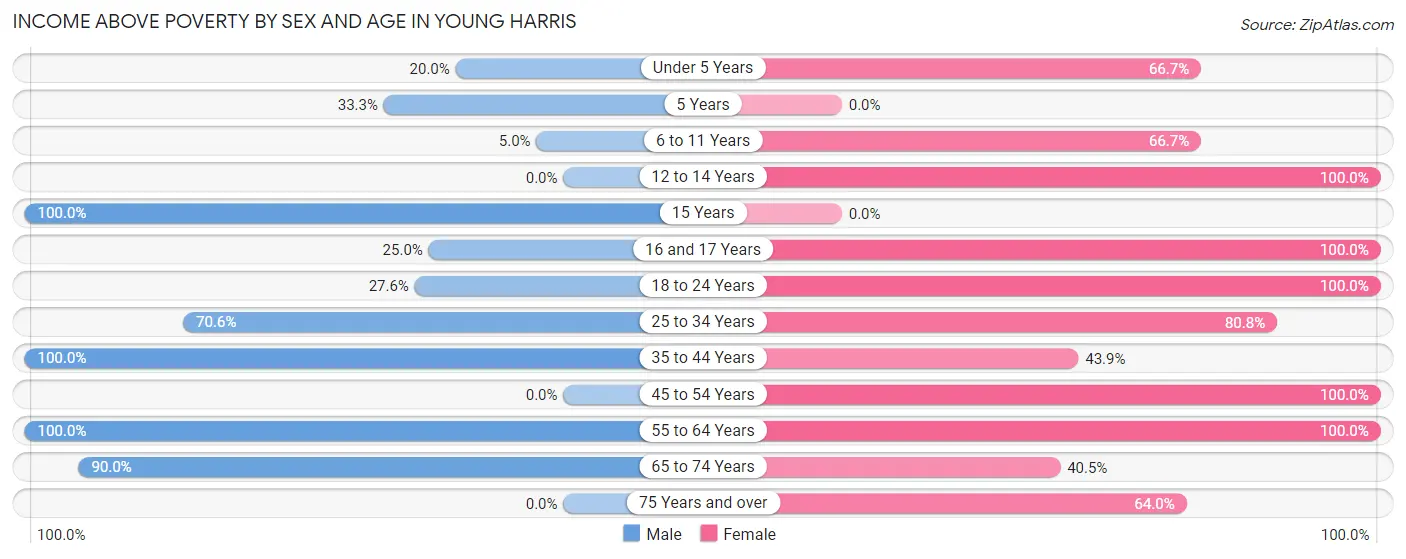
| Age Bracket | Male | Female |
| Under 5 Years | 3 (20.0%) | 4 (66.7%) |
| 5 Years | 1 (33.3%) | 0 (0.0%) |
| 6 to 11 Years | 1 (5.0%) | 4 (66.7%) |
| 12 to 14 Years | 0 (0.0%) | 5 (100.0%) |
| 15 Years | 2 (100.0%) | 0 (0.0%) |
| 16 and 17 Years | 2 (25.0%) | 2 (100.0%) |
| 18 to 24 Years | 8 (27.6%) | 22 (100.0%) |
| 25 to 34 Years | 24 (70.6%) | 21 (80.8%) |
| 35 to 44 Years | 16 (100.0%) | 18 (43.9%) |
| 45 to 54 Years | 0 (0.0%) | 15 (100.0%) |
| 55 to 64 Years | 18 (100.0%) | 49 (100.0%) |
| 65 to 74 Years | 18 (90.0%) | 15 (40.5%) |
| 75 Years and over | 0 (0.0%) | 16 (64.0%) |
| Total | 93 (56.4%) | 171 (73.1%) |
Income Below Poverty Among Married-Couple Families in Young Harris
The poverty statistics for married-couple families in Young Harris show that 8.5% or 6 of the total 71 families live below the poverty line. Families with 1 or 2 children have the highest poverty rate of 27.3%, comprising of 6 families. On the other hand, families with no children have the lowest poverty rate of 0.0%, which includes 0 families.
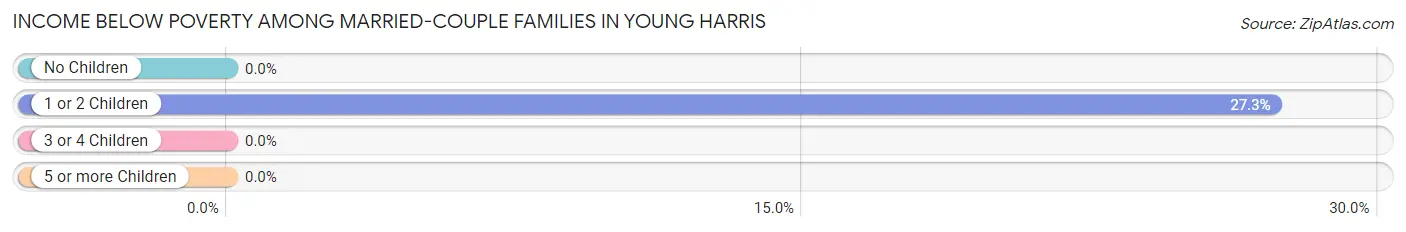
| Children | Above Poverty | Below Poverty |
| No Children | 45 (100.0%) | 0 (0.0%) |
| 1 or 2 Children | 16 (72.7%) | 6 (27.3%) |
| 3 or 4 Children | 4 (100.0%) | 0 (0.0%) |
| 5 or more Children | 0 (0.0%) | 0 (0.0%) |
| Total | 65 (91.5%) | 6 (8.5%) |
Income Below Poverty Among Single-Parent Households in Young Harris
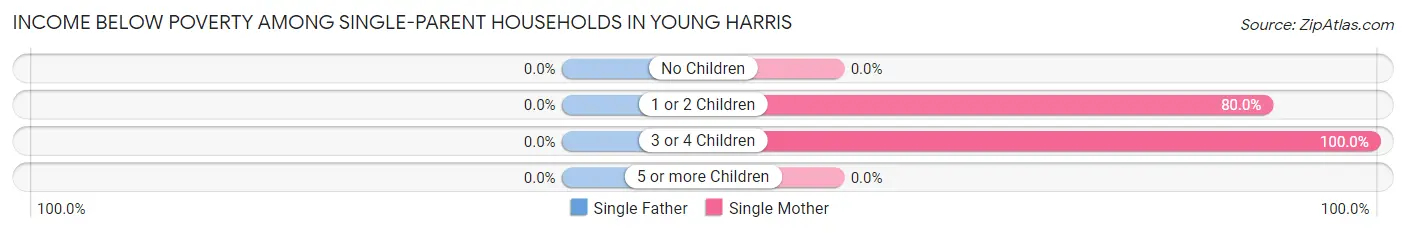
| Children | Single Father | Single Mother |
| No Children | 0 (0.0%) | 0 (0.0%) |
| 1 or 2 Children | 0 (0.0%) | 16 (80.0%) |
| 3 or 4 Children | 0 (0.0%) | 3 (100.0%) |
| 5 or more Children | 0 (0.0%) | 0 (0.0%) |
| Total | 0 (0.0%) | 19 (48.7%) |
Income Below Poverty Among Married-Couple vs Single-Parent Households in Young Harris
The poverty data for Young Harris shows that 6 of the married-couple family households (8.5%) and 19 of the single-parent households (48.7%) are living below the poverty level. Within the married-couple family households, those with 1 or 2 children have the highest poverty rate, with 6 households (27.3%) falling below the poverty line. Among the single-parent households, those with 3 or 4 children have the highest poverty rate, with 3 household (100.0%) living below poverty.
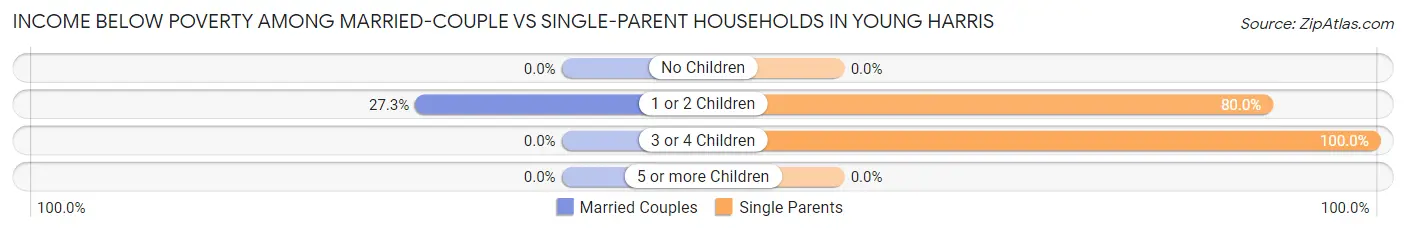
| Children | Married-Couple Families | Single-Parent Households |
| No Children | 0 (0.0%) | 0 (0.0%) |
| 1 or 2 Children | 6 (27.3%) | 16 (80.0%) |
| 3 or 4 Children | 0 (0.0%) | 3 (100.0%) |
| 5 or more Children | 0 (0.0%) | 0 (0.0%) |
| Total | 6 (8.5%) | 19 (48.7%) |
Race in Young Harris
The most populous races in Young Harris are White / Caucasian (852 | 79.9%), Black / African American (111 | 10.4%), and Hispanic or Latino (92 | 8.6%).
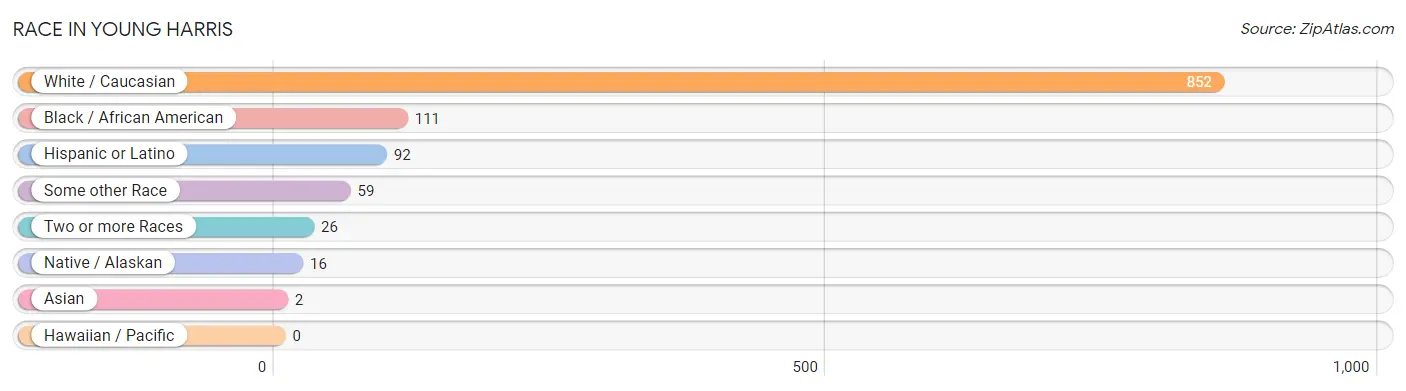
| Race | # Population | % Population |
| Asian | 2 | 0.2% |
| Black / African American | 111 | 10.4% |
| Hawaiian / Pacific | 0 | 0.0% |
| Hispanic or Latino | 92 | 8.6% |
| Native / Alaskan | 16 | 1.5% |
| White / Caucasian | 852 | 79.9% |
| Two or more Races | 26 | 2.4% |
| Some other Race | 59 | 5.5% |
| Total | 1,066 | 100.0% |
Ancestry in Young Harris
The most populous ancestries reported in Young Harris are American (194 | 18.2%), English (150 | 14.1%), German (103 | 9.7%), Irish (82 | 7.7%), and Scottish (52 | 4.9%), together accounting for 54.5% of all Young Harris residents.
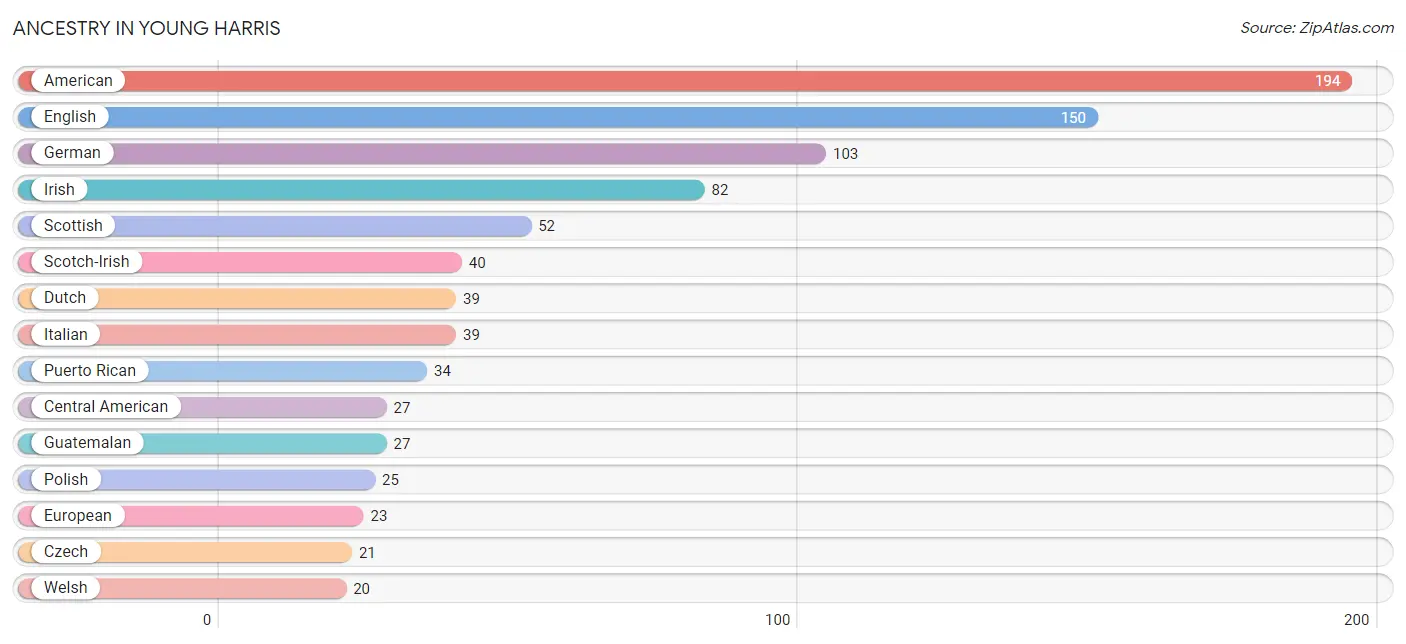
| Ancestry | # Population | % Population |
| American | 194 | 18.2% |
| Arab | 10 | 0.9% |
| British | 11 | 1.0% |
| British West Indian | 2 | 0.2% |
| Central American | 27 | 2.5% |
| Central American Indian | 11 | 1.0% |
| Cherokee | 10 | 0.9% |
| Creek | 5 | 0.5% |
| Cuban | 3 | 0.3% |
| Czech | 21 | 2.0% |
| Danish | 4 | 0.4% |
| Dutch | 39 | 3.7% |
| English | 150 | 14.1% |
| European | 23 | 2.2% |
| French | 8 | 0.7% |
| German | 103 | 9.7% |
| Guatemalan | 27 | 2.5% |
| Haitian | 1 | 0.1% |
| Hungarian | 1 | 0.1% |
| Irish | 82 | 7.7% |
| Italian | 39 | 3.7% |
| Jamaican | 12 | 1.1% |
| Lebanese | 10 | 0.9% |
| Mexican | 16 | 1.5% |
| Norwegian | 2 | 0.2% |
| Polish | 25 | 2.4% |
| Portuguese | 1 | 0.1% |
| Puerto Rican | 34 | 3.2% |
| Romanian | 6 | 0.6% |
| Scotch-Irish | 40 | 3.7% |
| Scottish | 52 | 4.9% |
| Spaniard | 10 | 0.9% |
| Thai | 2 | 0.2% |
| Welsh | 20 | 1.9% | View All 34 Rows |
Immigrants in Young Harris
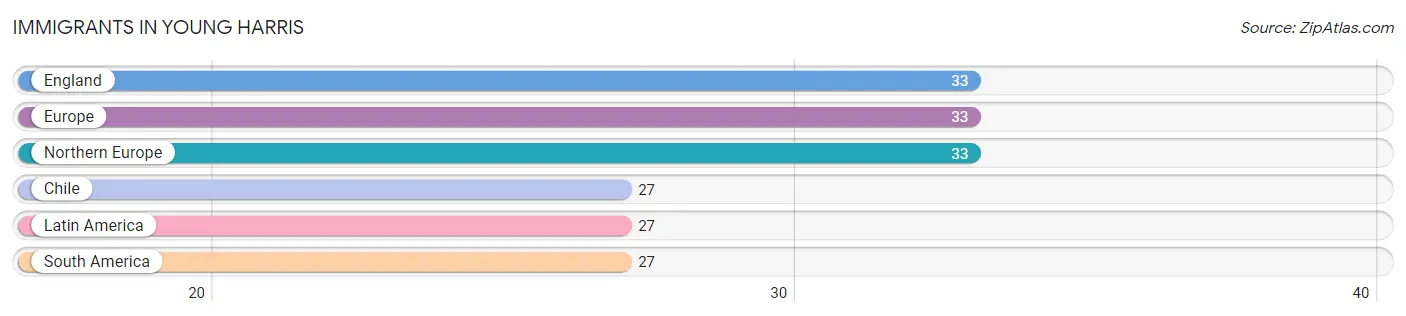
The most numerous immigrant groups reported in Young Harris came from England (33 | 3.1%), Europe (33 | 3.1%), Northern Europe (33 | 3.1%), Chile (27 | 2.5%), and Latin America (27 | 2.5%), together accounting for 14.4% of all Young Harris residents.
| Immigration Origin | # Population | % Population |
| Chile | 27 | 2.5% |
| England | 33 | 3.1% |
| Europe | 33 | 3.1% |
| Latin America | 27 | 2.5% |
| Northern Europe | 33 | 3.1% |
| South America | 27 | 2.5% | View All 6 Rows |
Sex and Age in Young Harris
Sex and Age in Young Harris
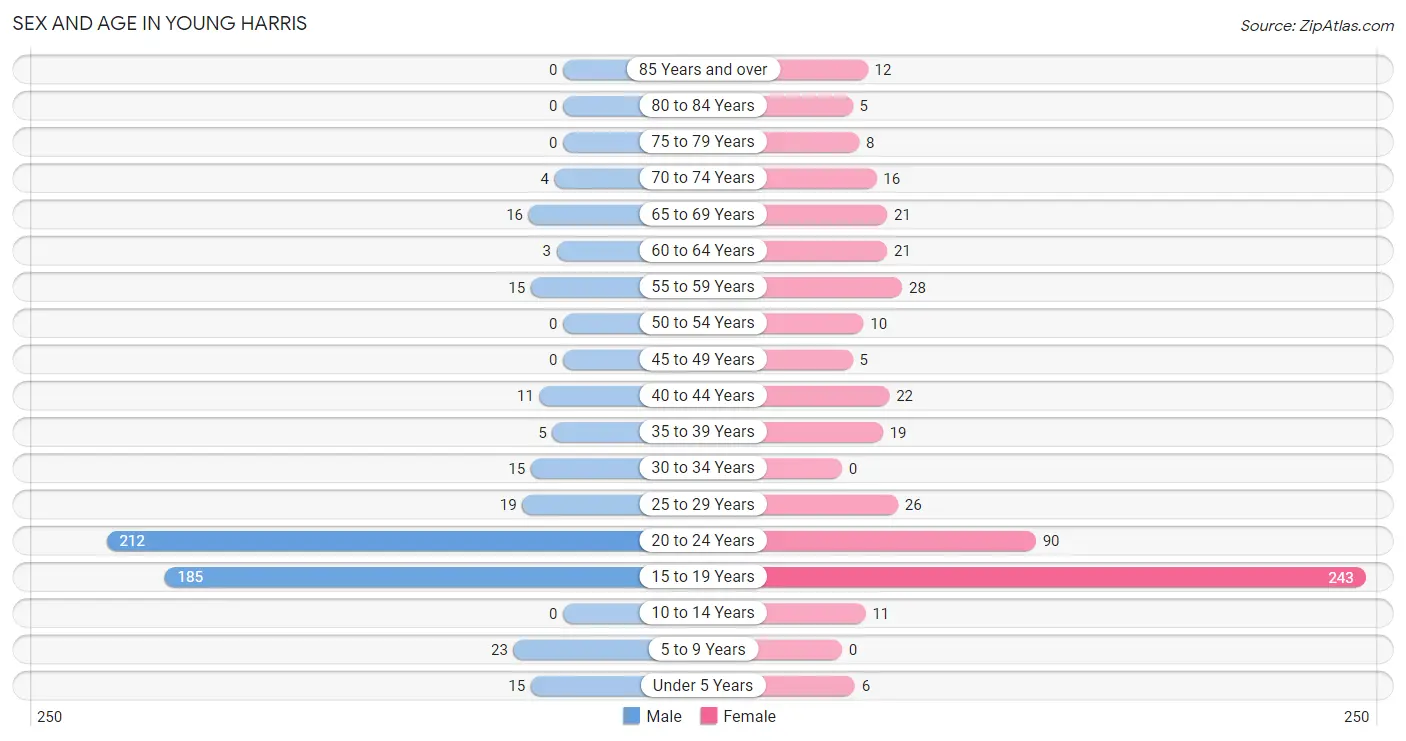
The most populous age groups in Young Harris are 20 to 24 Years (212 | 40.5%) for men and 15 to 19 Years (243 | 44.8%) for women.
| Age Bracket | Male | Female |
| Under 5 Years | 15 (2.9%) | 6 (1.1%) |
| 5 to 9 Years | 23 (4.4%) | 0 (0.0%) |
| 10 to 14 Years | 0 (0.0%) | 11 (2.0%) |
| 15 to 19 Years | 185 (35.4%) | 243 (44.8%) |
| 20 to 24 Years | 212 (40.5%) | 90 (16.6%) |
| 25 to 29 Years | 19 (3.6%) | 26 (4.8%) |
| 30 to 34 Years | 15 (2.9%) | 0 (0.0%) |
| 35 to 39 Years | 5 (1.0%) | 19 (3.5%) |
| 40 to 44 Years | 11 (2.1%) | 22 (4.1%) |
| 45 to 49 Years | 0 (0.0%) | 5 (0.9%) |
| 50 to 54 Years | 0 (0.0%) | 10 (1.8%) |
| 55 to 59 Years | 15 (2.9%) | 28 (5.2%) |
| 60 to 64 Years | 3 (0.6%) | 21 (3.9%) |
| 65 to 69 Years | 16 (3.1%) | 21 (3.9%) |
| 70 to 74 Years | 4 (0.8%) | 16 (2.9%) |
| 75 to 79 Years | 0 (0.0%) | 8 (1.5%) |
| 80 to 84 Years | 0 (0.0%) | 5 (0.9%) |
| 85 Years and over | 0 (0.0%) | 12 (2.2%) |
| Total | 523 (100.0%) | 543 (100.0%) |
Families and Households in Young Harris
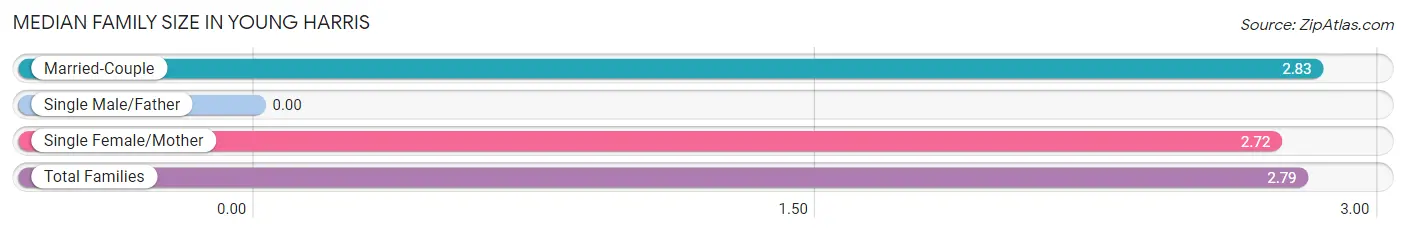
Median Family Size in Young Harris
| Family Type | # Families | Family Size |
| Married-Couple | 71 (64.5%) | 2.83 |
| Single Male/Father | 0 (0.0%) | - |
| Single Female/Mother | 39 (35.4%) | 2.72 |
| Total Families | 110 (100.0%) | 2.79 |
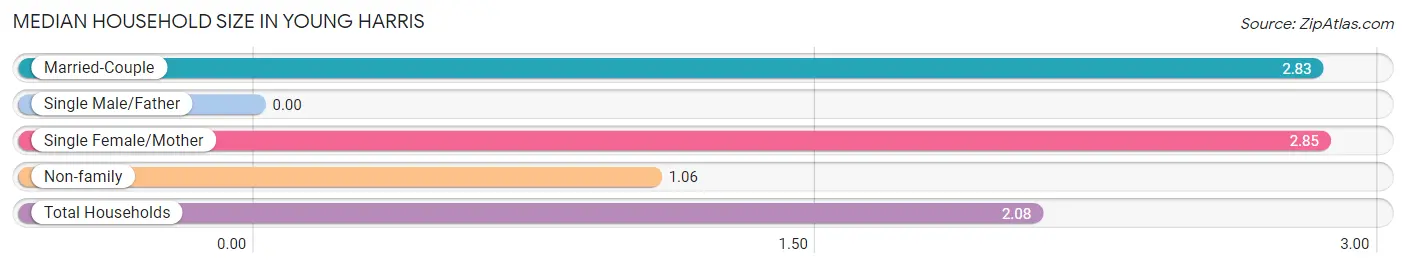
Median Household Size in Young Harris
| Household Type | # Households | Household Size |
| Married-Couple | 71 (37.0%) | 2.83 |
| Single Male/Father | 0 (0.0%) | - |
| Single Female/Mother | 39 (20.3%) | 2.85 |
| Non-family | 82 (42.7%) | 1.06 |
| Total Households | 192 (100.0%) | 2.08 |
Household Size by Marriage Status in Young Harris
Out of a total of 192 households in Young Harris, 110 (57.3%) are family households, while 82 (42.7%) are nonfamily households. The most numerous type of family households are 3-person households, comprising 53, and the most common type of nonfamily households are 1-person households, comprising 78.
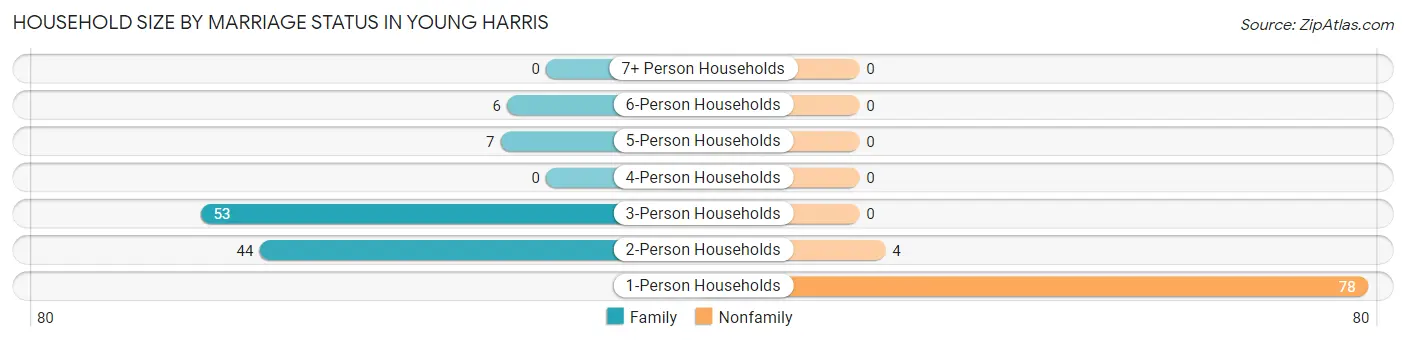
| Household Size | Family Households | Nonfamily Households |
| 1-Person Households | - | 78 (40.6%) |
| 2-Person Households | 44 (22.9%) | 4 (2.1%) |
| 3-Person Households | 53 (27.6%) | 0 (0.0%) |
| 4-Person Households | 0 (0.0%) | 0 (0.0%) |
| 5-Person Households | 7 (3.6%) | 0 (0.0%) |
| 6-Person Households | 6 (3.1%) | 0 (0.0%) |
| 7+ Person Households | 0 (0.0%) | 0 (0.0%) |
| Total | 110 (57.3%) | 82 (42.7%) |
Female Fertility in Young Harris
Fertility by Age in Young Harris
Average fertility rate in Young Harris is 52.0 births per 1,000 women. Women in the age bracket of 35 to 50 years have the highest fertility rate with 261.0 births per 1,000 women. Women in the age bracket of 35 to 50 years acount for 57.1% of all women with births.
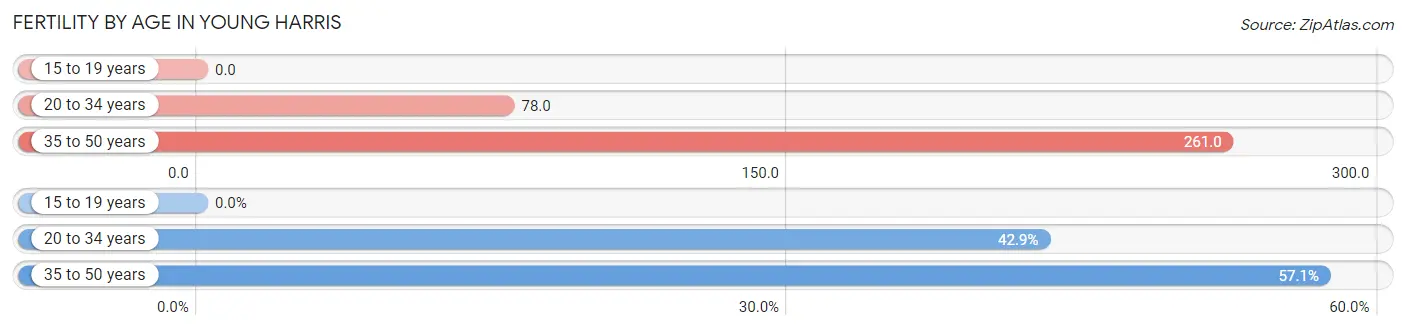
| Age Bracket | Women with Births | Births / 1,000 Women |
| 15 to 19 years | 0 (0.0%) | 0.0 |
| 20 to 34 years | 9 (42.9%) | 78.0 |
| 35 to 50 years | 12 (57.1%) | 261.0 |
| Total | 21 (100.0%) | 52.0 |
Fertility by Age by Marriage Status in Young Harris
42.9% of women with births (21) in Young Harris are married. The highest percentage of unmarried women with births falls into 35 to 50 years age bracket with 100.0% of them unmarried at the time of birth, while the lowest percentage of unmarried women with births belong to 20 to 34 years age bracket with 0.0% of them unmarried.
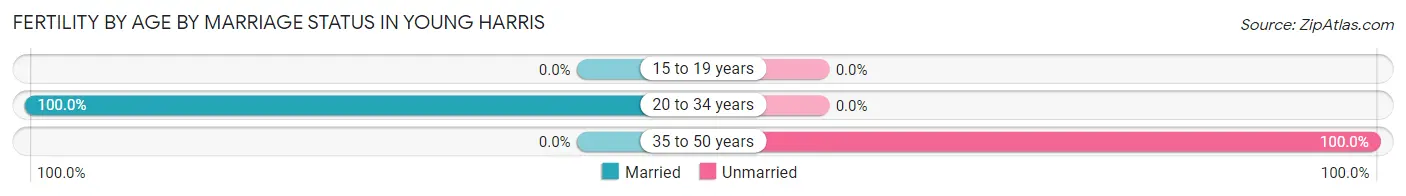
| Age Bracket | Married | Unmarried |
| 15 to 19 years | 0 (0.0%) | 0 (0.0%) |
| 20 to 34 years | 9 (100.0%) | 0 (0.0%) |
| 35 to 50 years | 0 (0.0%) | 12 (100.0%) |
| Total | 9 (42.9%) | 12 (57.1%) |
Fertility by Education in Young Harris
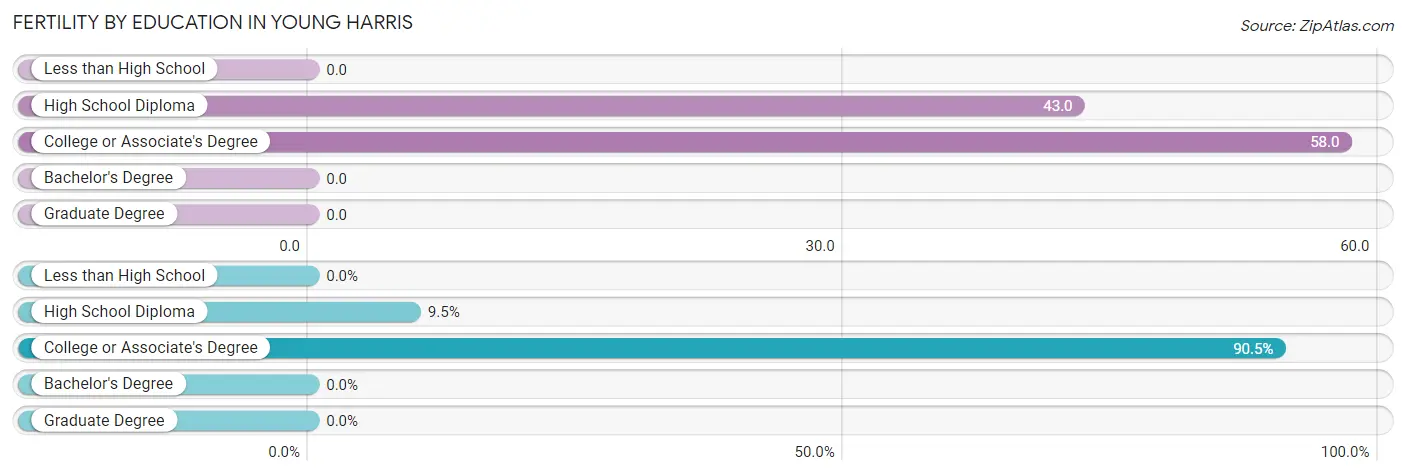
| Educational Attainment | Women with Births | Births / 1,000 Women |
| Less than High School | 0 (0.0%) | 0.0 |
| High School Diploma | 2 (9.5%) | 43.0 |
| College or Associate's Degree | 19 (90.5%) | 58.0 |
| Bachelor's Degree | 0 (0.0%) | 0.0 |
| Graduate Degree | 0 (0.0%) | 0.0 |
| Total | 21 (100.0%) | 52.0 |
Fertility by Education by Marriage Status in Young Harris
57.1% of women with births in Young Harris are unmarried. Women with the educational attainment of high school diploma are most likely to be married with 100.0% of them married at childbirth, while women with the educational attainment of college or associate's degree are least likely to be married with 63.2% of them unmarried at childbirth.
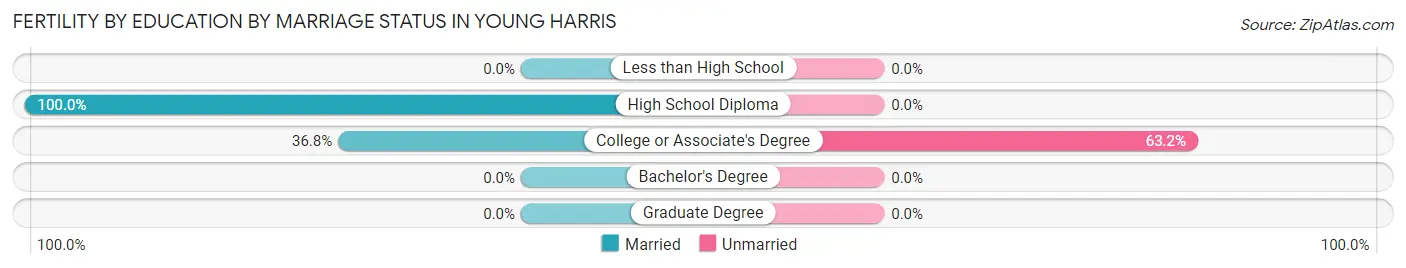
| Educational Attainment | Married | Unmarried |
| Less than High School | 0 (0.0%) | 0 (0.0%) |
| High School Diploma | 2 (100.0%) | 0 (0.0%) |
| College or Associate's Degree | 7 (36.8%) | 12 (63.2%) |
| Bachelor's Degree | 0 (0.0%) | 0 (0.0%) |
| Graduate Degree | 0 (0.0%) | 0 (0.0%) |
| Total | 9 (42.9%) | 12 (57.1%) |
Employment Characteristics in Young Harris
Employment by Class of Employer in Young Harris
Among the 495 employed individuals in Young Harris, private company employees (308 | 62.2%), self-employed (incorporated) (89 | 18.0%), and not-for-profit organizations (46 | 9.3%) make up the most common classes of employment.
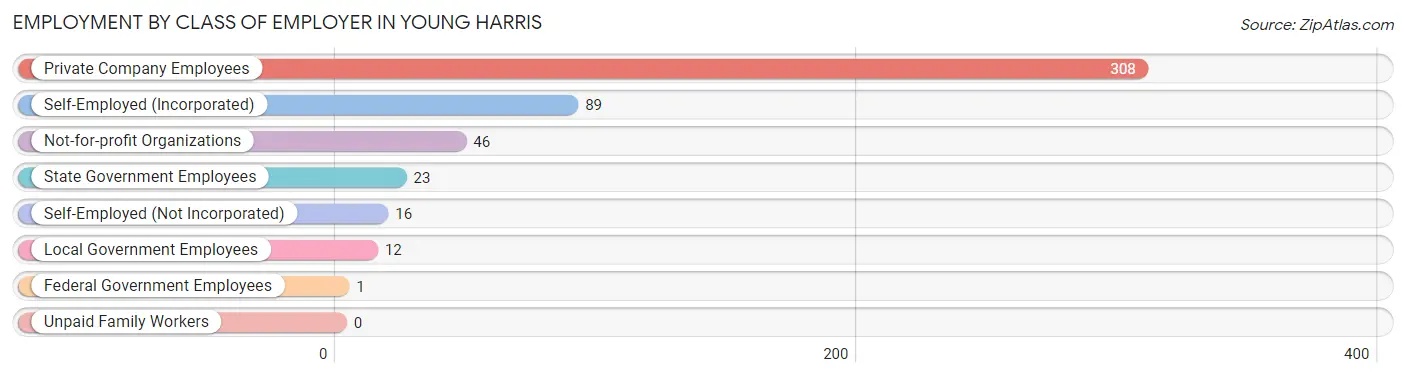
| Employer Class | # Employees | % Employees |
| Private Company Employees | 308 | 62.2% |
| Self-Employed (Incorporated) | 89 | 18.0% |
| Self-Employed (Not Incorporated) | 16 | 3.2% |
| Not-for-profit Organizations | 46 | 9.3% |
| Local Government Employees | 12 | 2.4% |
| State Government Employees | 23 | 4.6% |
| Federal Government Employees | 1 | 0.2% |
| Unpaid Family Workers | 0 | 0.0% |
| Total | 495 | 100.0% |
Employment Status by Age in Young Harris
According to the labor force statistics for Young Harris, out of the total population over 16 years of age (1,009), 57.1% or 576 individuals are in the labor force, with 8.2% or 47 of them unemployed. The age group with the highest labor force participation rate is 30 to 34 years, with 100.0% or 15 individuals in the labor force. Within the labor force, the 75 years and over age range has the highest percentage of unemployed individuals, with 80.0% or 4 of them being unemployed.
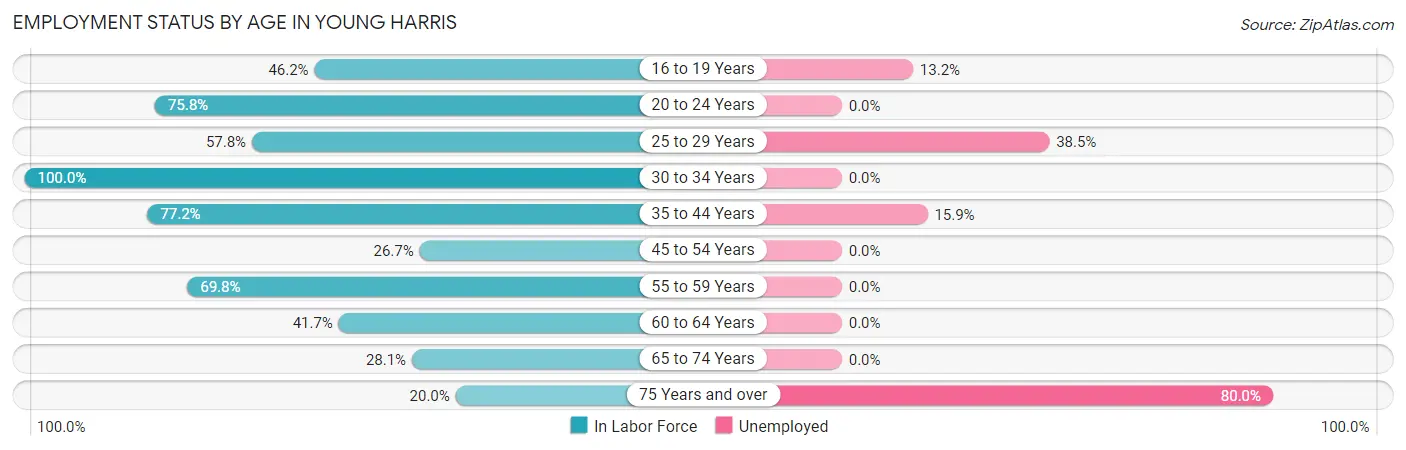
| Age Bracket | In Labor Force | Unemployed |
| 16 to 19 Years | 197 (46.2%) | 26 (13.2%) |
| 20 to 24 Years | 229 (75.8%) | 0 (0.0%) |
| 25 to 29 Years | 26 (57.8%) | 10 (38.5%) |
| 30 to 34 Years | 15 (100.0%) | 0 (0.0%) |
| 35 to 44 Years | 44 (77.2%) | 7 (15.9%) |
| 45 to 54 Years | 4 (26.7%) | 0 (0.0%) |
| 55 to 59 Years | 30 (69.8%) | 0 (0.0%) |
| 60 to 64 Years | 10 (41.7%) | 0 (0.0%) |
| 65 to 74 Years | 16 (28.1%) | 0 (0.0%) |
| 75 Years and over | 5 (20.0%) | 4 (80.0%) |
| Total | 576 (57.1%) | 47 (8.2%) |
Employment Status by Educational Attainment in Young Harris
According to labor force statistics for Young Harris, 64.8% of individuals (129) out of the total population between 25 and 64 years of age (199) are in the labor force, with 13.2% or 17 of them being unemployed. The group with the highest labor force participation rate are those with the educational attainment of college / associate degree, with 75.7% or 56 individuals in the labor force. Within the labor force, individuals with less than high school education have the highest percentage of unemployment, with 77.8% or 7 of them being unemployed.
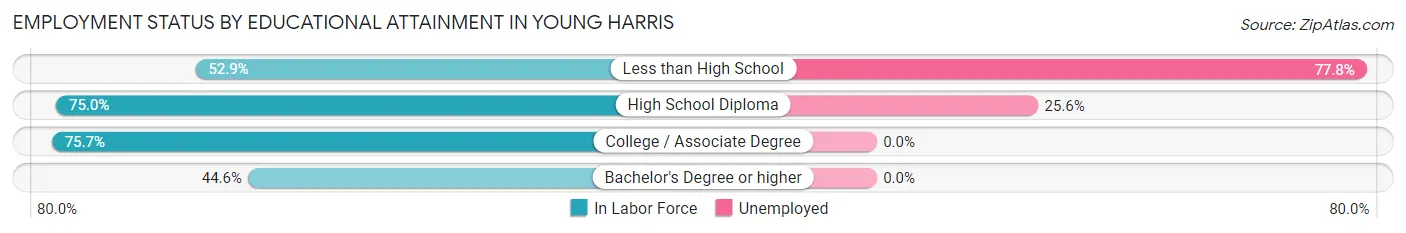
| Educational Attainment | In Labor Force | Unemployed |
| Less than High School | 9 (52.9%) | 13 (77.8%) |
| High School Diploma | 39 (75.0%) | 13 (25.6%) |
| College / Associate Degree | 56 (75.7%) | 0 (0.0%) |
| Bachelor's Degree or higher | 25 (44.6%) | 0 (0.0%) |
| Total | 129 (64.8%) | 26 (13.2%) |
Employment Occupations by Sex in Young Harris
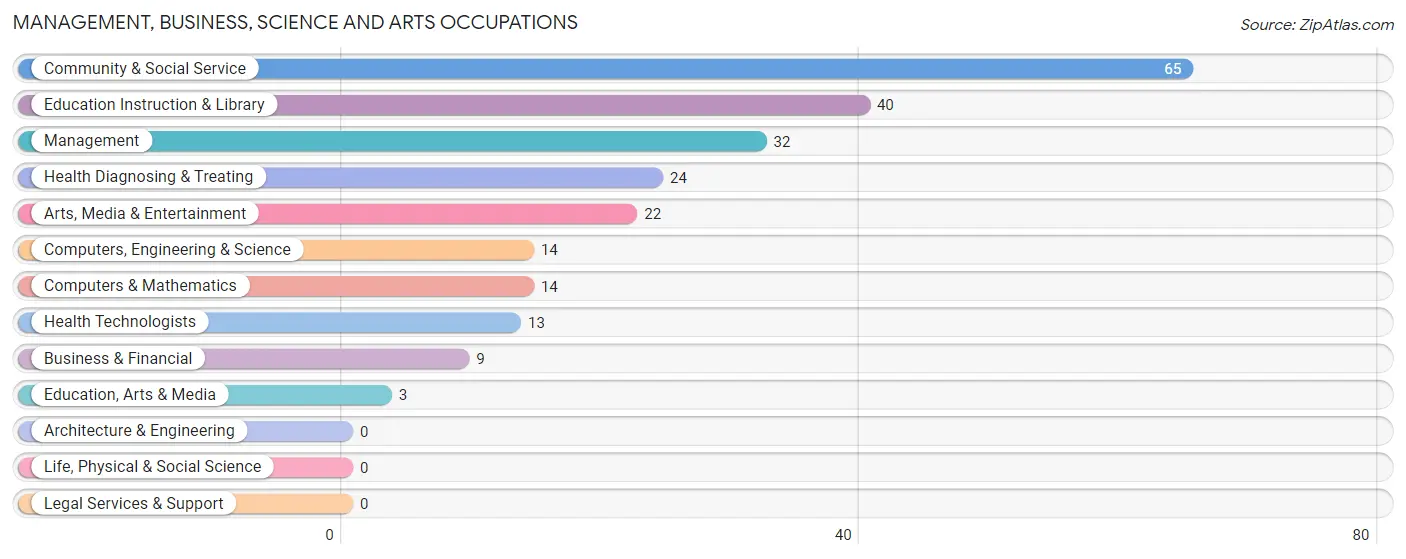
Management, Business, Science and Arts Occupations
The most common Management, Business, Science and Arts occupations in Young Harris are Community & Social Service (65 | 12.3%), Education Instruction & Library (40 | 7.6%), Management (32 | 6.0%), Health Diagnosing & Treating (24 | 4.5%), and Arts, Media & Entertainment (22 | 4.2%).
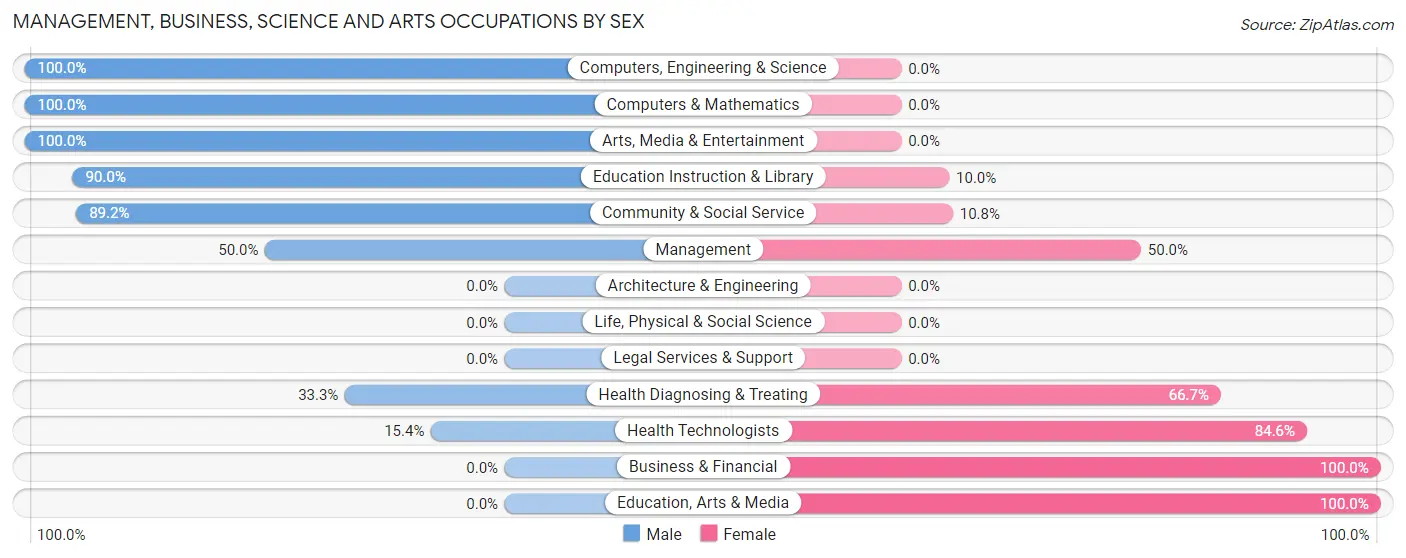
Management, Business, Science and Arts Occupations by Sex
Within the Management, Business, Science and Arts occupations in Young Harris, the most male-oriented occupations are Computers, Engineering & Science (100.0%), Computers & Mathematics (100.0%), and Arts, Media & Entertainment (100.0%), while the most female-oriented occupations are Business & Financial (100.0%), Education, Arts & Media (100.0%), and Health Technologists (84.6%).
| Occupation | Male | Female |
| Management | 16 (50.0%) | 16 (50.0%) |
| Business & Financial | 0 (0.0%) | 9 (100.0%) |
| Computers, Engineering & Science | 14 (100.0%) | 0 (0.0%) |
| Computers & Mathematics | 14 (100.0%) | 0 (0.0%) |
| Architecture & Engineering | 0 (0.0%) | 0 (0.0%) |
| Life, Physical & Social Science | 0 (0.0%) | 0 (0.0%) |
| Community & Social Service | 58 (89.2%) | 7 (10.8%) |
| Education, Arts & Media | 0 (0.0%) | 3 (100.0%) |
| Legal Services & Support | 0 (0.0%) | 0 (0.0%) |
| Education Instruction & Library | 36 (90.0%) | 4 (10.0%) |
| Arts, Media & Entertainment | 22 (100.0%) | 0 (0.0%) |
| Health Diagnosing & Treating | 8 (33.3%) | 16 (66.7%) |
| Health Technologists | 2 (15.4%) | 11 (84.6%) |
| Total (Category) | 96 (66.7%) | 48 (33.3%) |
| Total (Overall) | 342 (64.6%) | 187 (35.3%) |
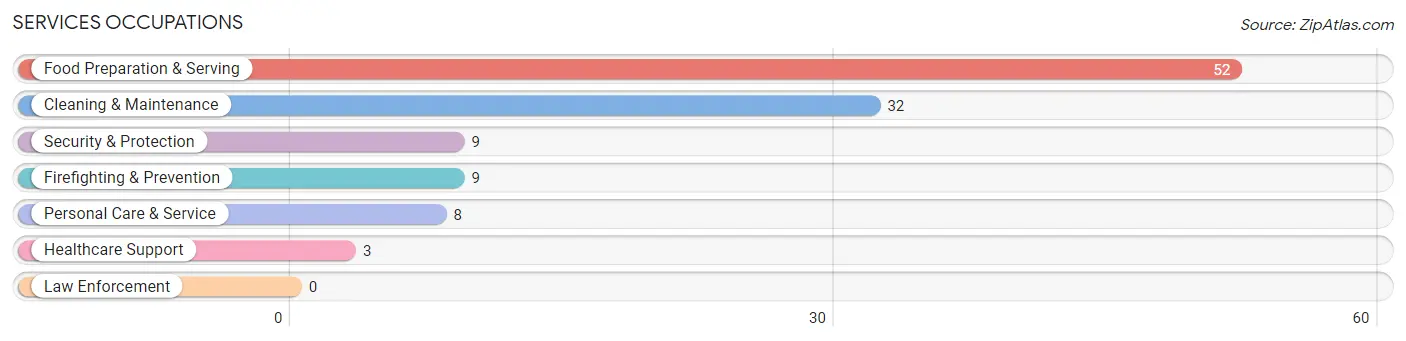
Services Occupations
The most common Services occupations in Young Harris are Food Preparation & Serving (52 | 9.8%), Cleaning & Maintenance (32 | 6.0%), Security & Protection (9 | 1.7%), Firefighting & Prevention (9 | 1.7%), and Personal Care & Service (8 | 1.5%).
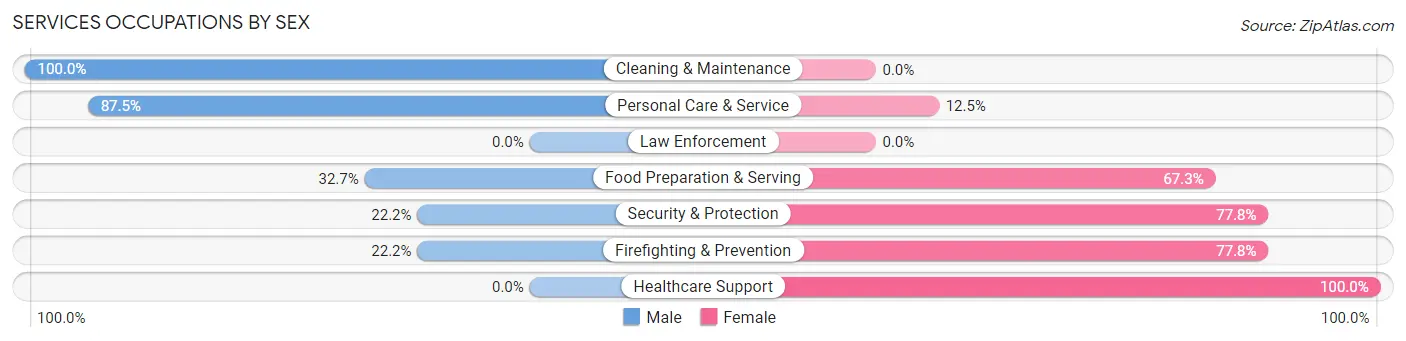
Services Occupations by Sex
Within the Services occupations in Young Harris, the most male-oriented occupations are Cleaning & Maintenance (100.0%), Personal Care & Service (87.5%), and Food Preparation & Serving (32.7%), while the most female-oriented occupations are Healthcare Support (100.0%), Security & Protection (77.8%), and Firefighting & Prevention (77.8%).
| Occupation | Male | Female |
| Healthcare Support | 0 (0.0%) | 3 (100.0%) |
| Security & Protection | 2 (22.2%) | 7 (77.8%) |
| Firefighting & Prevention | 2 (22.2%) | 7 (77.8%) |
| Law Enforcement | 0 (0.0%) | 0 (0.0%) |
| Food Preparation & Serving | 17 (32.7%) | 35 (67.3%) |
| Cleaning & Maintenance | 32 (100.0%) | 0 (0.0%) |
| Personal Care & Service | 7 (87.5%) | 1 (12.5%) |
| Total (Category) | 58 (55.8%) | 46 (44.2%) |
| Total (Overall) | 342 (64.6%) | 187 (35.3%) |
Sales and Office Occupations
The most common Sales and Office occupations in Young Harris are Office & Administration (55 | 10.4%), and Sales & Related (16 | 3.0%).
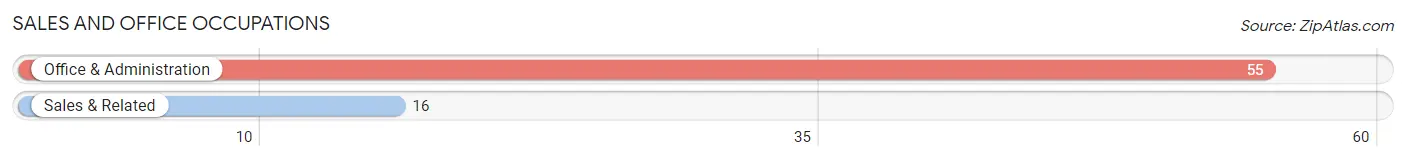
Sales and Office Occupations by Sex
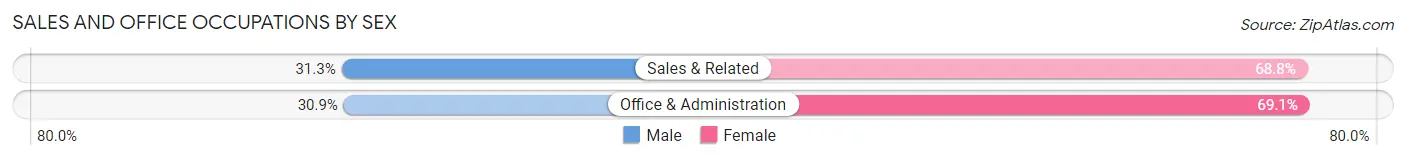
| Occupation | Male | Female |
| Sales & Related | 5 (31.2%) | 11 (68.8%) |
| Office & Administration | 17 (30.9%) | 38 (69.1%) |
| Total (Category) | 22 (31.0%) | 49 (69.0%) |
| Total (Overall) | 342 (64.6%) | 187 (35.3%) |
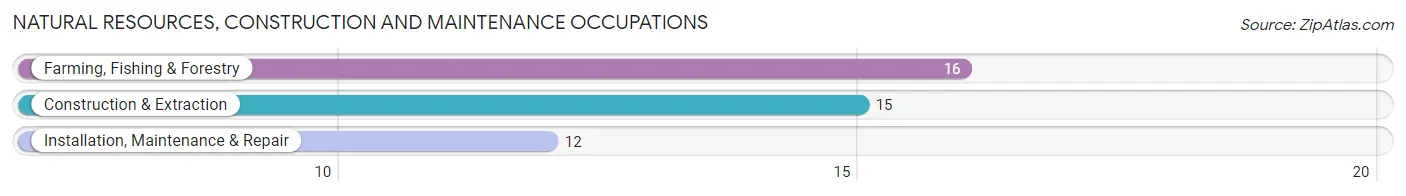
Natural Resources, Construction and Maintenance Occupations
The most common Natural Resources, Construction and Maintenance occupations in Young Harris are Farming, Fishing & Forestry (16 | 3.0%), Construction & Extraction (15 | 2.8%), and Installation, Maintenance & Repair (12 | 2.3%).
Natural Resources, Construction and Maintenance Occupations by Sex
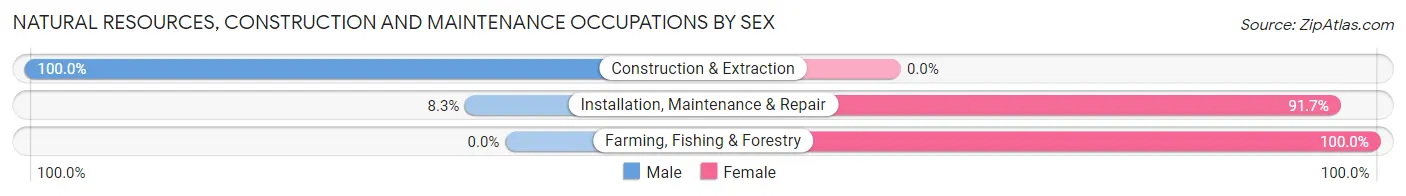
| Occupation | Male | Female |
| Farming, Fishing & Forestry | 0 (0.0%) | 16 (100.0%) |
| Construction & Extraction | 15 (100.0%) | 0 (0.0%) |
| Installation, Maintenance & Repair | 1 (8.3%) | 11 (91.7%) |
| Total (Category) | 16 (37.2%) | 27 (62.8%) |
| Total (Overall) | 342 (64.6%) | 187 (35.3%) |
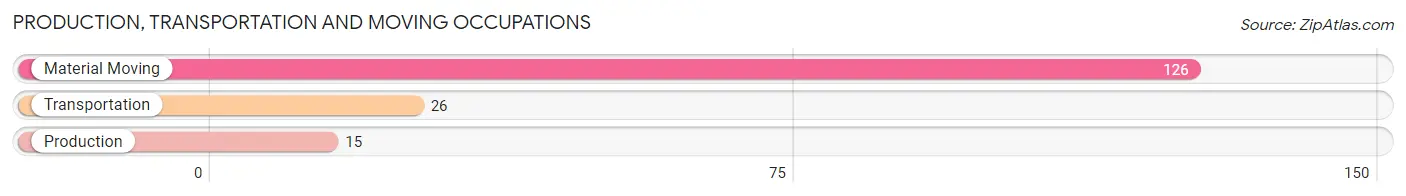
Production, Transportation and Moving Occupations
The most common Production, Transportation and Moving occupations in Young Harris are Material Moving (126 | 23.8%), Transportation (26 | 4.9%), and Production (15 | 2.8%).
Production, Transportation and Moving Occupations by Sex
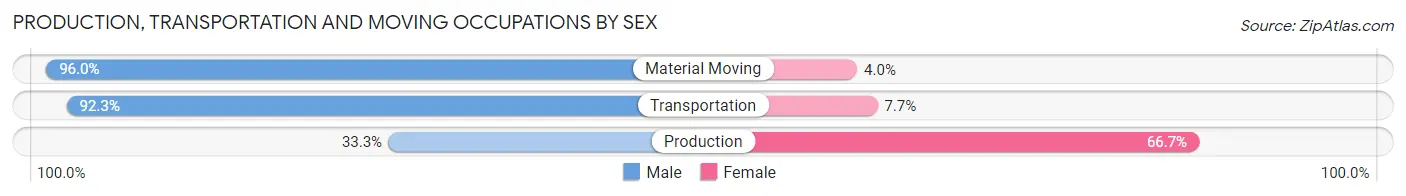
| Occupation | Male | Female |
| Production | 5 (33.3%) | 10 (66.7%) |
| Transportation | 24 (92.3%) | 2 (7.7%) |
| Material Moving | 121 (96.0%) | 5 (4.0%) |
| Total (Category) | 150 (89.8%) | 17 (10.2%) |
| Total (Overall) | 342 (64.6%) | 187 (35.3%) |
Employment Industries by Sex in Young Harris
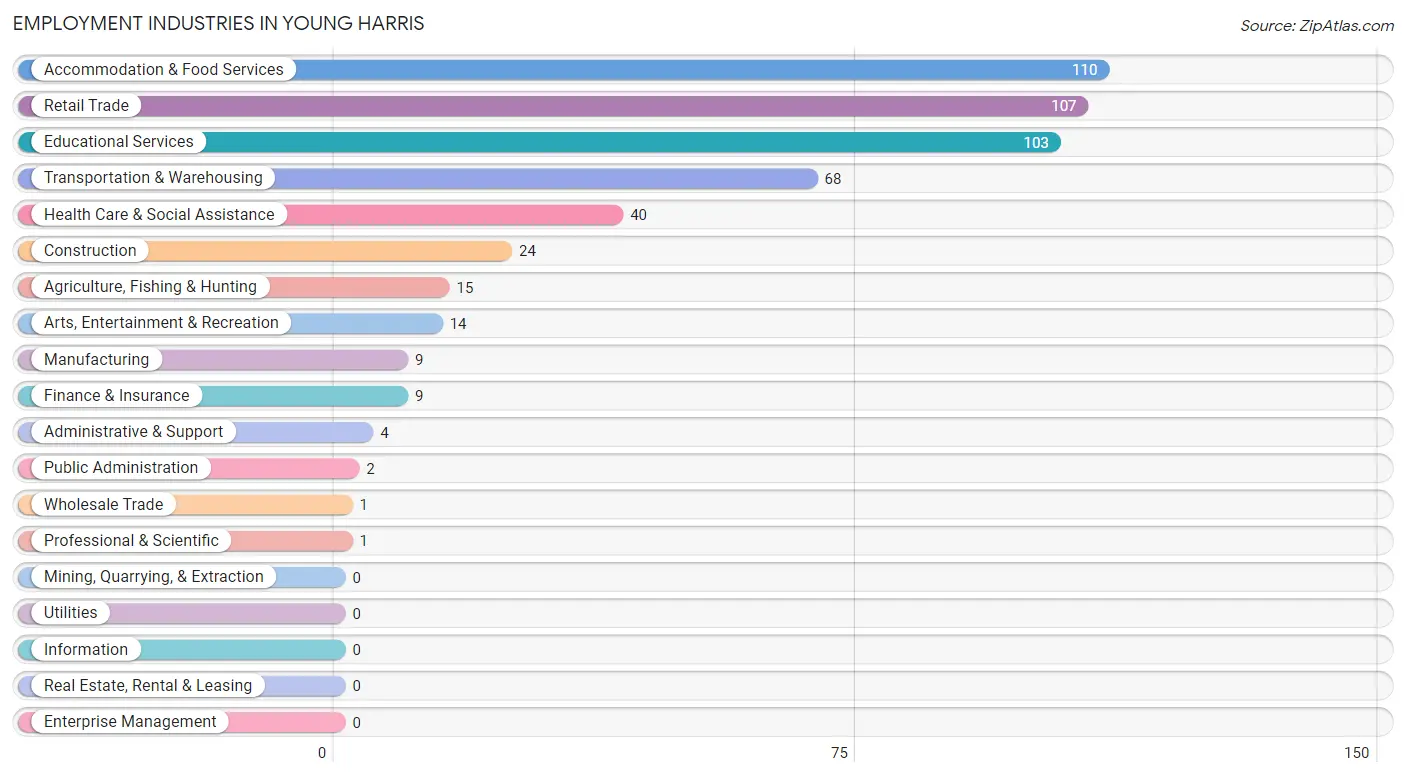
Employment Industries in Young Harris
The major employment industries in Young Harris include Accommodation & Food Services (110 | 20.8%), Retail Trade (107 | 20.2%), Educational Services (103 | 19.5%), Transportation & Warehousing (68 | 12.9%), and Health Care & Social Assistance (40 | 7.6%).
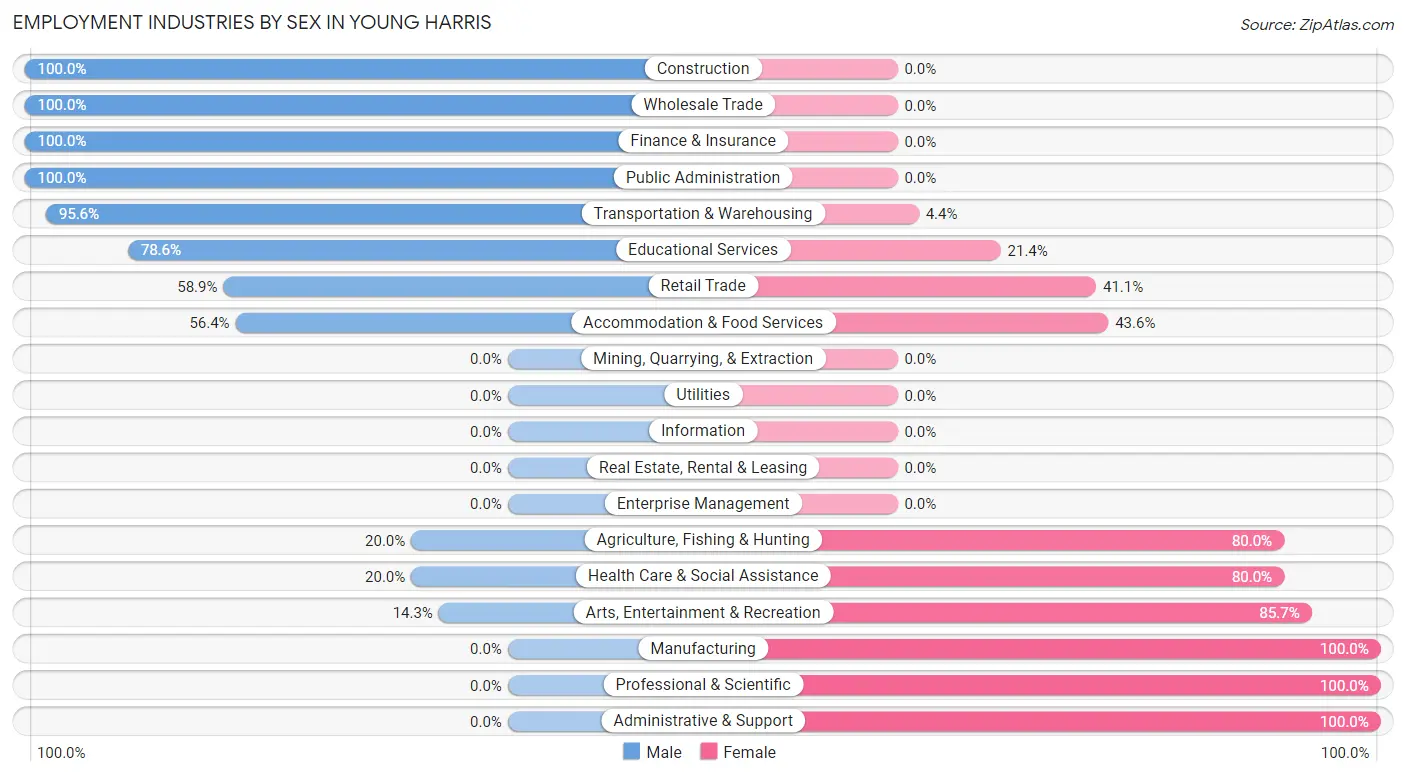
Employment Industries by Sex in Young Harris
The Young Harris industries that see more men than women are Construction (100.0%), Wholesale Trade (100.0%), and Finance & Insurance (100.0%), whereas the industries that tend to have a higher number of women are Manufacturing (100.0%), Professional & Scientific (100.0%), and Administrative & Support (100.0%).
| Industry | Male | Female |
| Agriculture, Fishing & Hunting | 3 (20.0%) | 12 (80.0%) |
| Mining, Quarrying, & Extraction | 0 (0.0%) | 0 (0.0%) |
| Construction | 24 (100.0%) | 0 (0.0%) |
| Manufacturing | 0 (0.0%) | 9 (100.0%) |
| Wholesale Trade | 1 (100.0%) | 0 (0.0%) |
| Retail Trade | 63 (58.9%) | 44 (41.1%) |
| Transportation & Warehousing | 65 (95.6%) | 3 (4.4%) |
| Utilities | 0 (0.0%) | 0 (0.0%) |
| Information | 0 (0.0%) | 0 (0.0%) |
| Finance & Insurance | 9 (100.0%) | 0 (0.0%) |
| Real Estate, Rental & Leasing | 0 (0.0%) | 0 (0.0%) |
| Professional & Scientific | 0 (0.0%) | 1 (100.0%) |
| Enterprise Management | 0 (0.0%) | 0 (0.0%) |
| Administrative & Support | 0 (0.0%) | 4 (100.0%) |
| Educational Services | 81 (78.6%) | 22 (21.4%) |
| Health Care & Social Assistance | 8 (20.0%) | 32 (80.0%) |
| Arts, Entertainment & Recreation | 2 (14.3%) | 12 (85.7%) |
| Accommodation & Food Services | 62 (56.4%) | 48 (43.6%) |
| Public Administration | 2 (100.0%) | 0 (0.0%) |
| Total | 342 (64.6%) | 187 (35.3%) |
Education in Young Harris
School Enrollment in Young Harris
The most common levels of schooling among the 760 students in Young Harris are college / undergraduate (687 | 90.4%), high school (30 | 4.0%), and elementary school (26 | 3.4%).
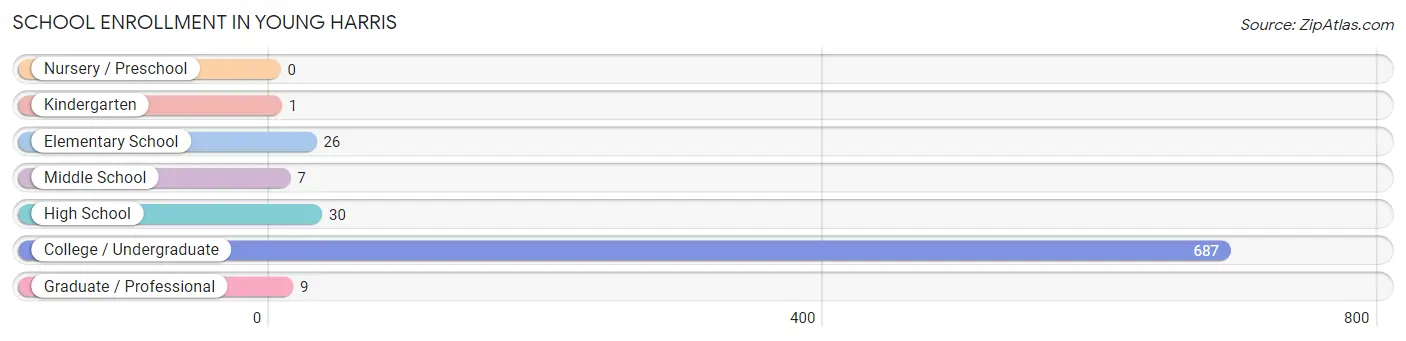
| School Level | # Students | % Students |
| Nursery / Preschool | 0 | 0.0% |
| Kindergarten | 1 | 0.1% |
| Elementary School | 26 | 3.4% |
| Middle School | 7 | 0.9% |
| High School | 30 | 4.0% |
| College / Undergraduate | 687 | 90.4% |
| Graduate / Professional | 9 | 1.2% |
| Total | 760 | 100.0% |
School Enrollment by Age by Funding Source in Young Harris
Out of a total of 760 students who are enrolled in schools in Young Harris, 624 (82.1%) attend a private institution, while the remaining 136 (17.9%) are enrolled in public schools. The age group of 20 to 24 year olds has the highest likelihood of being enrolled in private schools, with 273 (96.8% in the age bracket) enrolled. Conversely, the age group of 10 to 14 year olds has the lowest likelihood of being enrolled in a private school, with 11 (100.0% in the age bracket) attending a public institution.
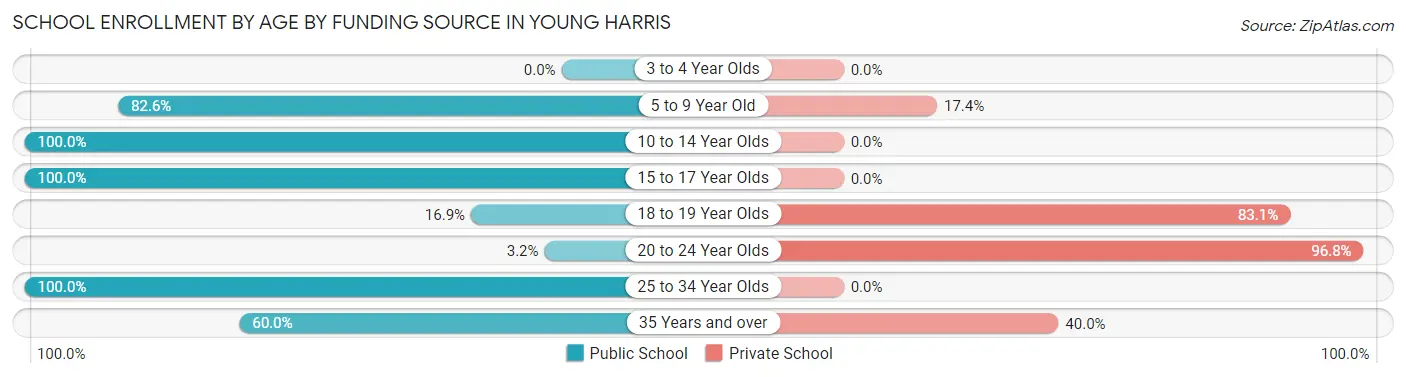
| Age Bracket | Public School | Private School |
| 3 to 4 Year Olds | 0 (0.0%) | 0 (0.0%) |
| 5 to 9 Year Old | 19 (82.6%) | 4 (17.4%) |
| 10 to 14 Year Olds | 11 (100.0%) | 0 (0.0%) |
| 15 to 17 Year Olds | 12 (100.0%) | 0 (0.0%) |
| 18 to 19 Year Olds | 70 (16.9%) | 345 (83.1%) |
| 20 to 24 Year Olds | 9 (3.2%) | 273 (96.8%) |
| 25 to 34 Year Olds | 12 (100.0%) | 0 (0.0%) |
| 35 Years and over | 3 (60.0%) | 2 (40.0%) |
| Total | 136 (17.9%) | 624 (82.1%) |
Educational Attainment by Field of Study in Young Harris
Education (21 | 27.3%), arts & humanities (12 | 15.6%), business (11 | 14.3%), bio, nature & agricultural (9 | 11.7%), and science & technology (7 | 9.1%) are the most common fields of study among 77 individuals in Young Harris who have obtained a bachelor's degree or higher.
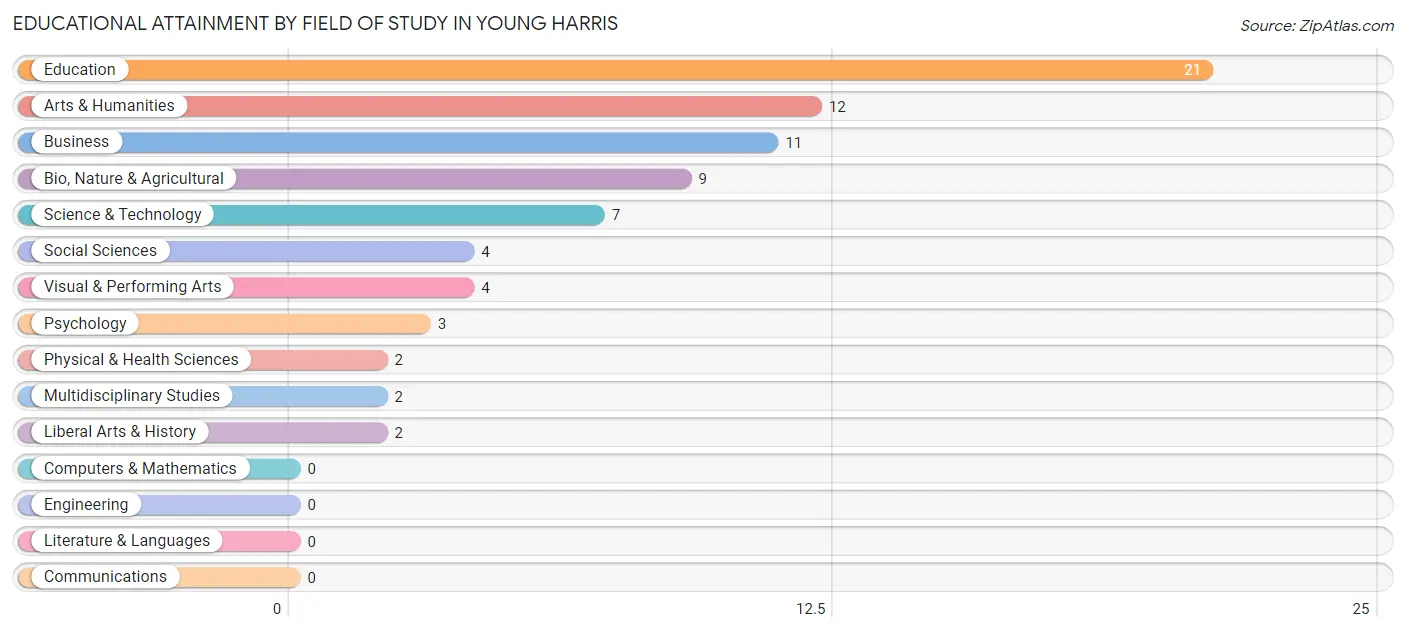
| Field of Study | # Graduates | % Graduates |
| Computers & Mathematics | 0 | 0.0% |
| Bio, Nature & Agricultural | 9 | 11.7% |
| Physical & Health Sciences | 2 | 2.6% |
| Psychology | 3 | 3.9% |
| Social Sciences | 4 | 5.2% |
| Engineering | 0 | 0.0% |
| Multidisciplinary Studies | 2 | 2.6% |
| Science & Technology | 7 | 9.1% |
| Business | 11 | 14.3% |
| Education | 21 | 27.3% |
| Literature & Languages | 0 | 0.0% |
| Liberal Arts & History | 2 | 2.6% |
| Visual & Performing Arts | 4 | 5.2% |
| Communications | 0 | 0.0% |
| Arts & Humanities | 12 | 15.6% |
| Total | 77 | 100.0% |
Transportation & Commute in Young Harris
Vehicle Availability by Sex in Young Harris
The most prevalent vehicle ownership categories in Young Harris are males with 2 vehicles (35, accounting for 40.7%) and females with 2 vehicles (20, making up 36.8%).
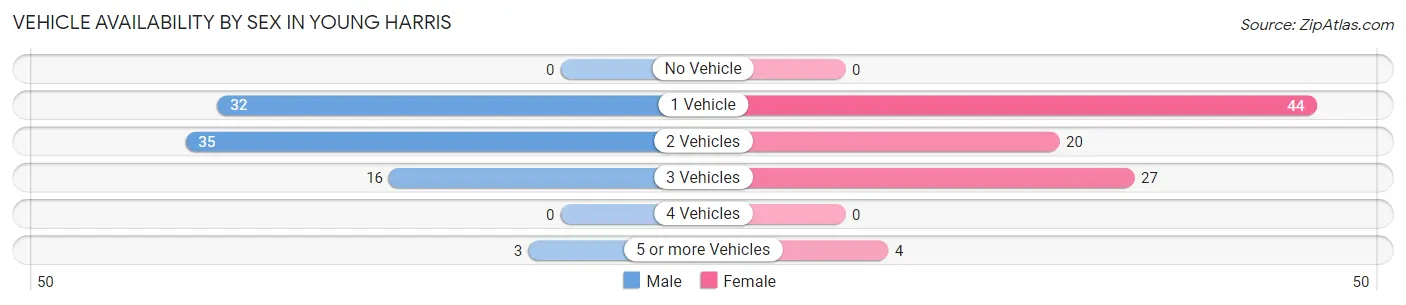
| Vehicles Available | Male | Female |
| No Vehicle | 0 (0.0%) | 0 (0.0%) |
| 1 Vehicle | 32 (37.2%) | 44 (46.3%) |
| 2 Vehicles | 35 (40.7%) | 20 (21.0%) |
| 3 Vehicles | 16 (18.6%) | 27 (28.4%) |
| 4 Vehicles | 0 (0.0%) | 0 (0.0%) |
| 5 or more Vehicles | 3 (3.5%) | 4 (4.2%) |
| Total | 86 (100.0%) | 95 (100.0%) |
Commute Time in Young Harris
The most frequently occuring commute durations in Young Harris are 15 to 19 minutes (107 commuters, 22.9%), 5 to 9 minutes (100 commuters, 21.4%), and 10 to 14 minutes (98 commuters, 20.9%).
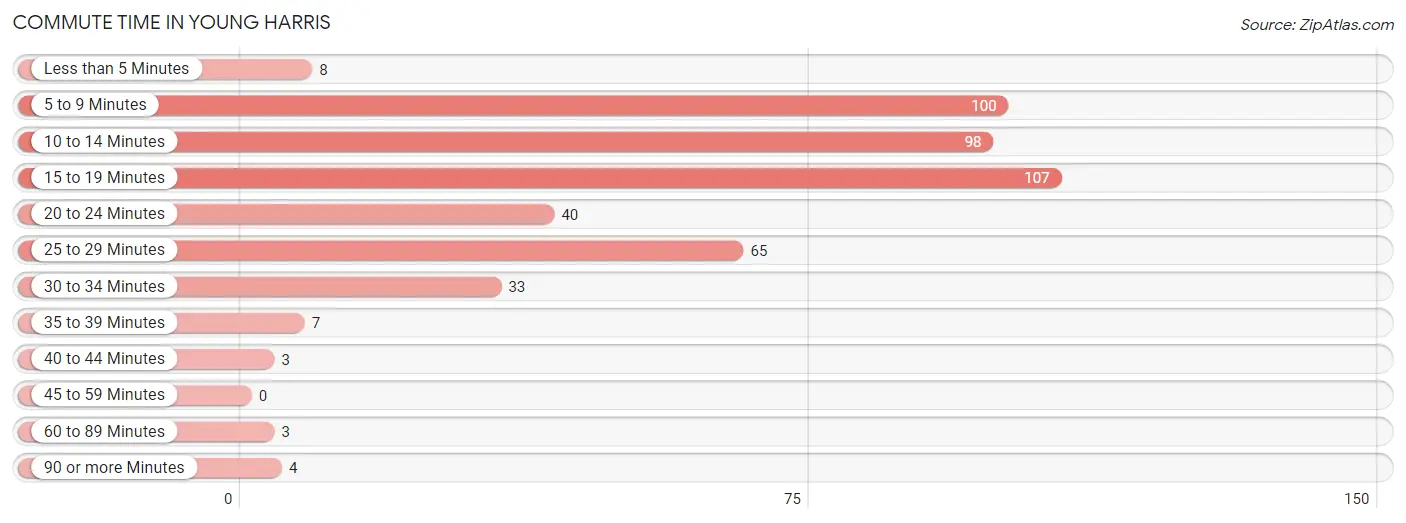
| Commute Time | # Commuters | % Commuters |
| Less than 5 Minutes | 8 | 1.7% |
| 5 to 9 Minutes | 100 | 21.4% |
| 10 to 14 Minutes | 98 | 20.9% |
| 15 to 19 Minutes | 107 | 22.9% |
| 20 to 24 Minutes | 40 | 8.6% |
| 25 to 29 Minutes | 65 | 13.9% |
| 30 to 34 Minutes | 33 | 7.0% |
| 35 to 39 Minutes | 7 | 1.5% |
| 40 to 44 Minutes | 3 | 0.6% |
| 45 to 59 Minutes | 0 | 0.0% |
| 60 to 89 Minutes | 3 | 0.6% |
| 90 or more Minutes | 4 | 0.9% |
Commute Time by Sex in Young Harris
The most common commute times in Young Harris are 15 to 19 minutes (85 commuters, 28.9%) for males and 10 to 14 minutes (56 commuters, 32.2%) for females.
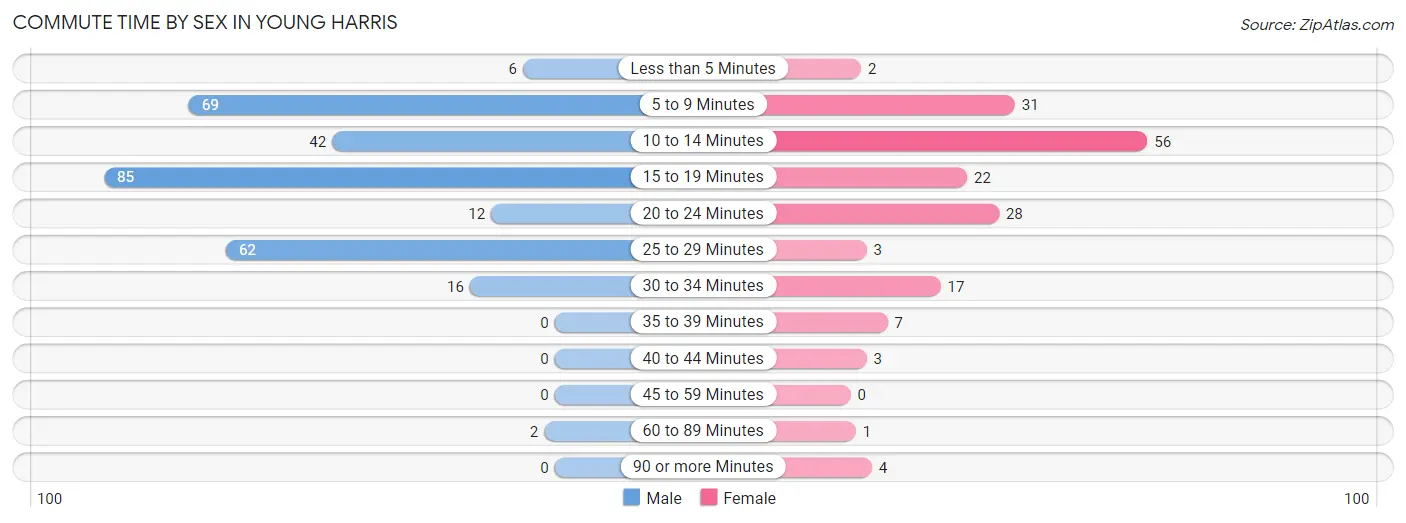
| Commute Time | Male | Female |
| Less than 5 Minutes | 6 (2.0%) | 2 (1.1%) |
| 5 to 9 Minutes | 69 (23.5%) | 31 (17.8%) |
| 10 to 14 Minutes | 42 (14.3%) | 56 (32.2%) |
| 15 to 19 Minutes | 85 (28.9%) | 22 (12.6%) |
| 20 to 24 Minutes | 12 (4.1%) | 28 (16.1%) |
| 25 to 29 Minutes | 62 (21.1%) | 3 (1.7%) |
| 30 to 34 Minutes | 16 (5.4%) | 17 (9.8%) |
| 35 to 39 Minutes | 0 (0.0%) | 7 (4.0%) |
| 40 to 44 Minutes | 0 (0.0%) | 3 (1.7%) |
| 45 to 59 Minutes | 0 (0.0%) | 0 (0.0%) |
| 60 to 89 Minutes | 2 (0.7%) | 1 (0.6%) |
| 90 or more Minutes | 0 (0.0%) | 4 (2.3%) |
Time of Departure to Work by Sex in Young Harris
The most frequent times of departure to work in Young Harris are 4:00 PM to 11:59 PM (79, 26.9%) for males and 4:00 PM to 11:59 PM (57, 32.8%) for females.
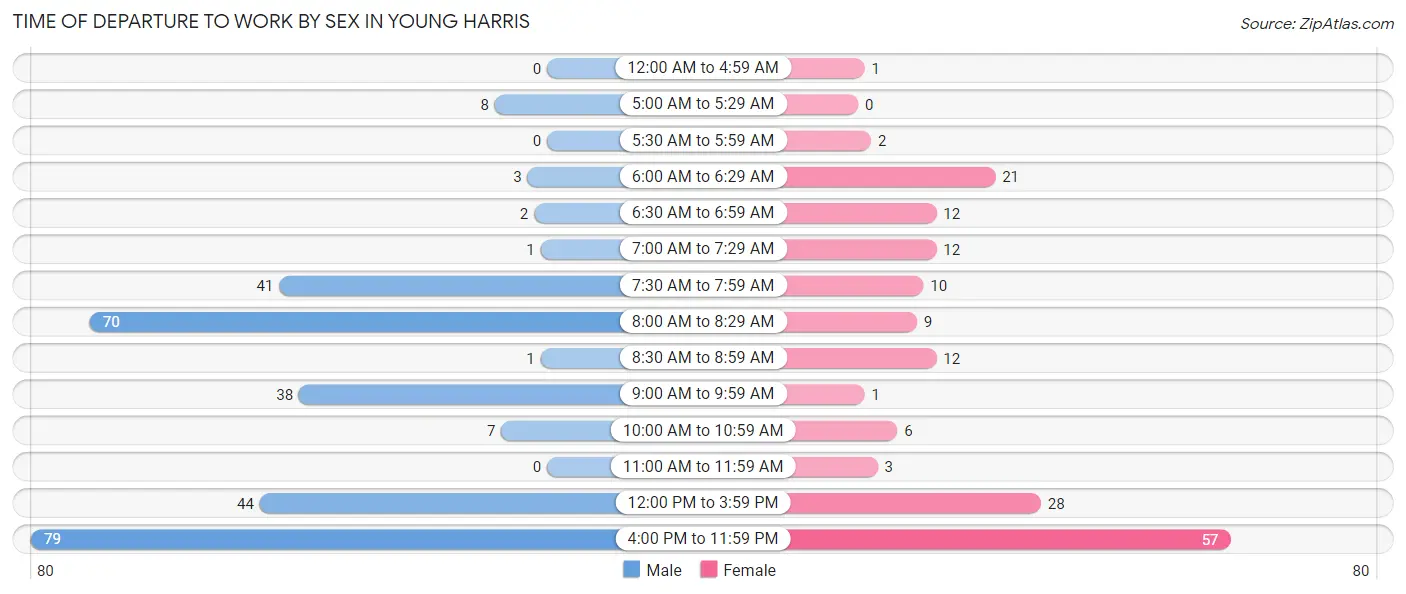
| Time of Departure | Male | Female |
| 12:00 AM to 4:59 AM | 0 (0.0%) | 1 (0.6%) |
| 5:00 AM to 5:29 AM | 8 (2.7%) | 0 (0.0%) |
| 5:30 AM to 5:59 AM | 0 (0.0%) | 2 (1.1%) |
| 6:00 AM to 6:29 AM | 3 (1.0%) | 21 (12.1%) |
| 6:30 AM to 6:59 AM | 2 (0.7%) | 12 (6.9%) |
| 7:00 AM to 7:29 AM | 1 (0.3%) | 12 (6.9%) |
| 7:30 AM to 7:59 AM | 41 (14.0%) | 10 (5.8%) |
| 8:00 AM to 8:29 AM | 70 (23.8%) | 9 (5.2%) |
| 8:30 AM to 8:59 AM | 1 (0.3%) | 12 (6.9%) |
| 9:00 AM to 9:59 AM | 38 (12.9%) | 1 (0.6%) |
| 10:00 AM to 10:59 AM | 7 (2.4%) | 6 (3.5%) |
| 11:00 AM to 11:59 AM | 0 (0.0%) | 3 (1.7%) |
| 12:00 PM to 3:59 PM | 44 (15.0%) | 28 (16.1%) |
| 4:00 PM to 11:59 PM | 79 (26.9%) | 57 (32.8%) |
| Total | 294 (100.0%) | 174 (100.0%) |
Housing Occupancy in Young Harris
Occupancy by Ownership in Young Harris
Of the total 192 dwellings in Young Harris, owner-occupied units account for 46 (24.0%), while renter-occupied units make up 146 (76.0%).
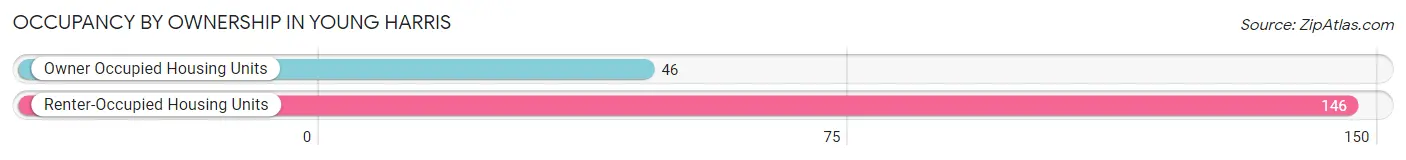
| Occupancy | # Housing Units | % Housing Units |
| Owner Occupied Housing Units | 46 | 24.0% |
| Renter-Occupied Housing Units | 146 | 76.0% |
| Total Occupied Housing Units | 192 | 100.0% |
Occupancy by Household Size in Young Harris
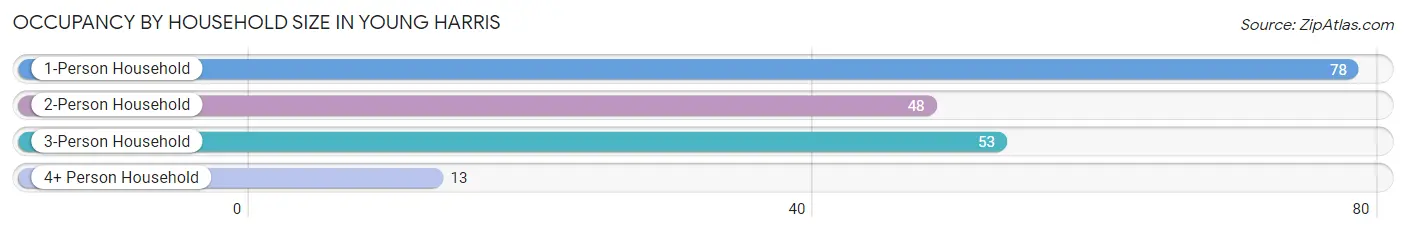
| Household Size | # Housing Units | % Housing Units |
| 1-Person Household | 78 | 40.6% |
| 2-Person Household | 48 | 25.0% |
| 3-Person Household | 53 | 27.6% |
| 4+ Person Household | 13 | 6.8% |
| Total Housing Units | 192 | 100.0% |
Occupancy by Ownership by Household Size in Young Harris
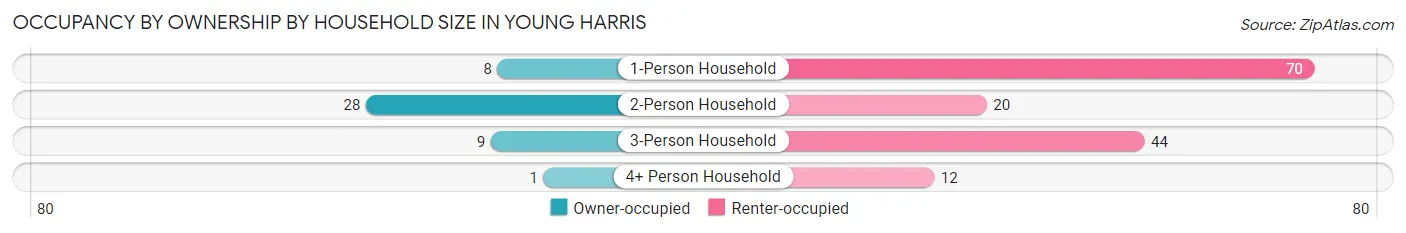
| Household Size | Owner-occupied | Renter-occupied |
| 1-Person Household | 8 (10.3%) | 70 (89.7%) |
| 2-Person Household | 28 (58.3%) | 20 (41.7%) |
| 3-Person Household | 9 (17.0%) | 44 (83.0%) |
| 4+ Person Household | 1 (7.7%) | 12 (92.3%) |
| Total Housing Units | 46 (24.0%) | 146 (76.0%) |
Occupancy by Educational Attainment in Young Harris
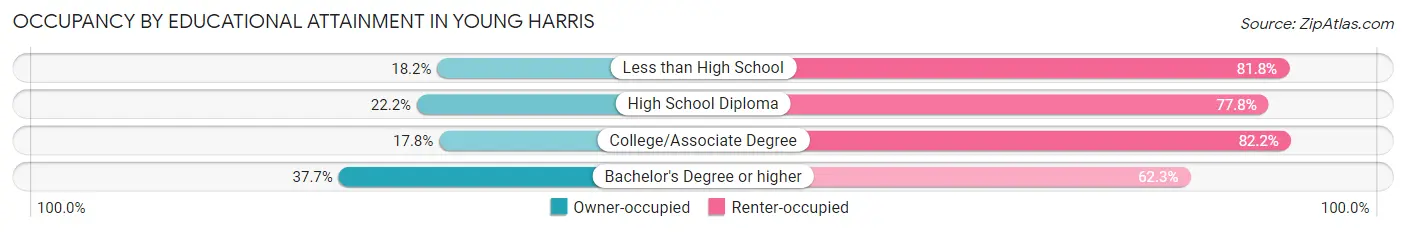
| Household Size | Owner-occupied | Renter-occupied |
| Less than High School | 2 (18.2%) | 9 (81.8%) |
| High School Diploma | 6 (22.2%) | 21 (77.8%) |
| College/Associate Degree | 18 (17.8%) | 83 (82.2%) |
| Bachelor's Degree or higher | 20 (37.7%) | 33 (62.3%) |
Occupancy by Age of Householder in Young Harris
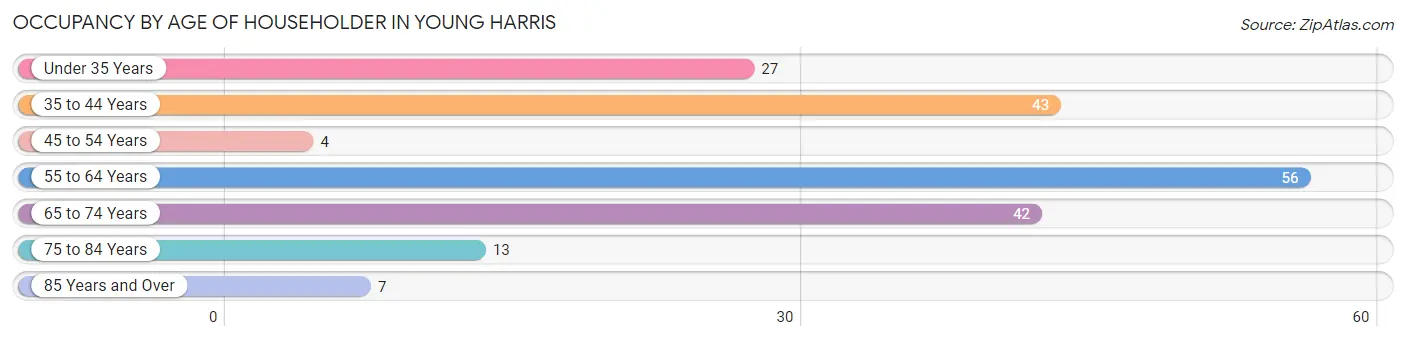
| Age Bracket | # Households | % Households |
| Under 35 Years | 27 | 14.1% |
| 35 to 44 Years | 43 | 22.4% |
| 45 to 54 Years | 4 | 2.1% |
| 55 to 64 Years | 56 | 29.2% |
| 65 to 74 Years | 42 | 21.9% |
| 75 to 84 Years | 13 | 6.8% |
| 85 Years and Over | 7 | 3.6% |
| Total | 192 | 100.0% |
Housing Finances in Young Harris
Median Income by Occupancy in Young Harris
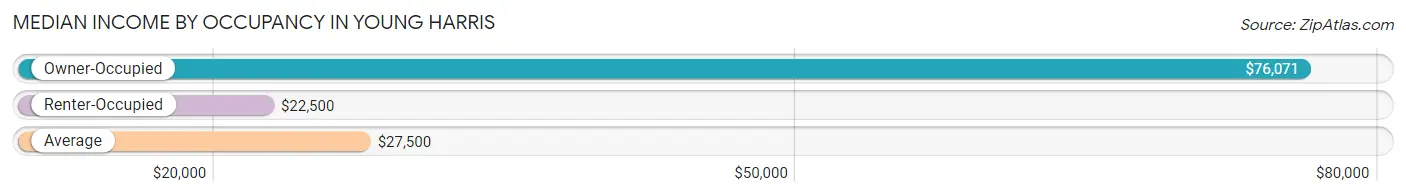
| Occupancy Type | # Households | Median Income |
| Owner-Occupied | 46 (24.0%) | $76,071 |
| Renter-Occupied | 146 (76.0%) | $22,500 |
| Average | 192 (100.0%) | $27,500 |
Occupancy by Householder Income Bracket in Young Harris
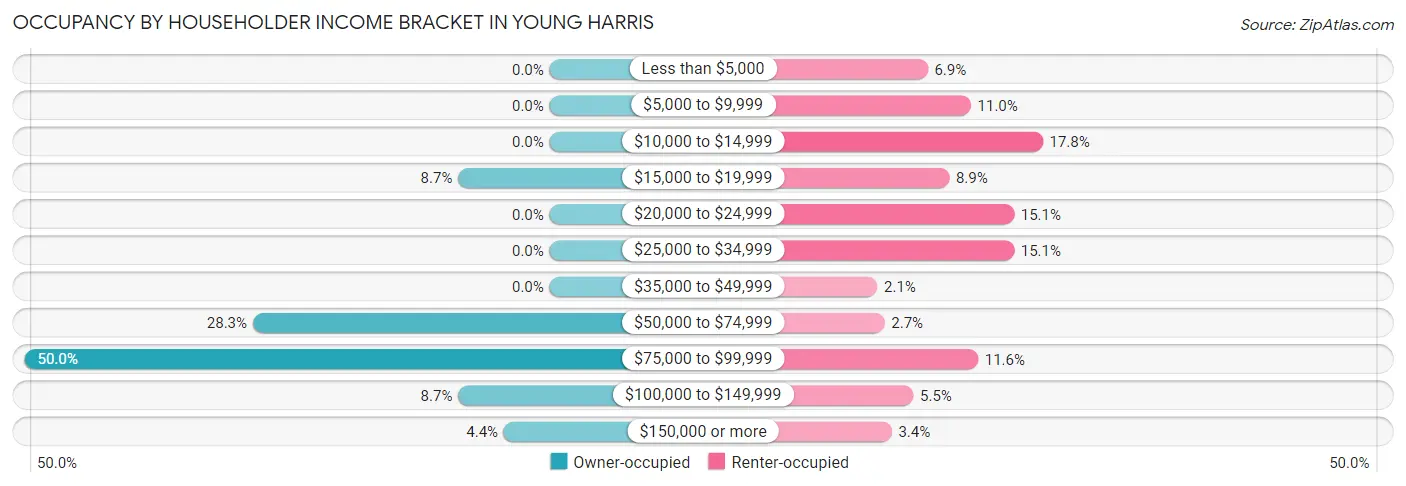
| Income Bracket | Owner-occupied | Renter-occupied |
| Less than $5,000 | 0 (0.0%) | 10 (6.9%) |
| $5,000 to $9,999 | 0 (0.0%) | 16 (11.0%) |
| $10,000 to $14,999 | 0 (0.0%) | 26 (17.8%) |
| $15,000 to $19,999 | 4 (8.7%) | 13 (8.9%) |
| $20,000 to $24,999 | 0 (0.0%) | 22 (15.1%) |
| $25,000 to $34,999 | 0 (0.0%) | 22 (15.1%) |
| $35,000 to $49,999 | 0 (0.0%) | 3 (2.1%) |
| $50,000 to $74,999 | 13 (28.3%) | 4 (2.7%) |
| $75,000 to $99,999 | 23 (50.0%) | 17 (11.6%) |
| $100,000 to $149,999 | 4 (8.7%) | 8 (5.5%) |
| $150,000 or more | 2 (4.3%) | 5 (3.4%) |
| Total | 46 (100.0%) | 146 (100.0%) |
Monthly Housing Cost Tiers in Young Harris
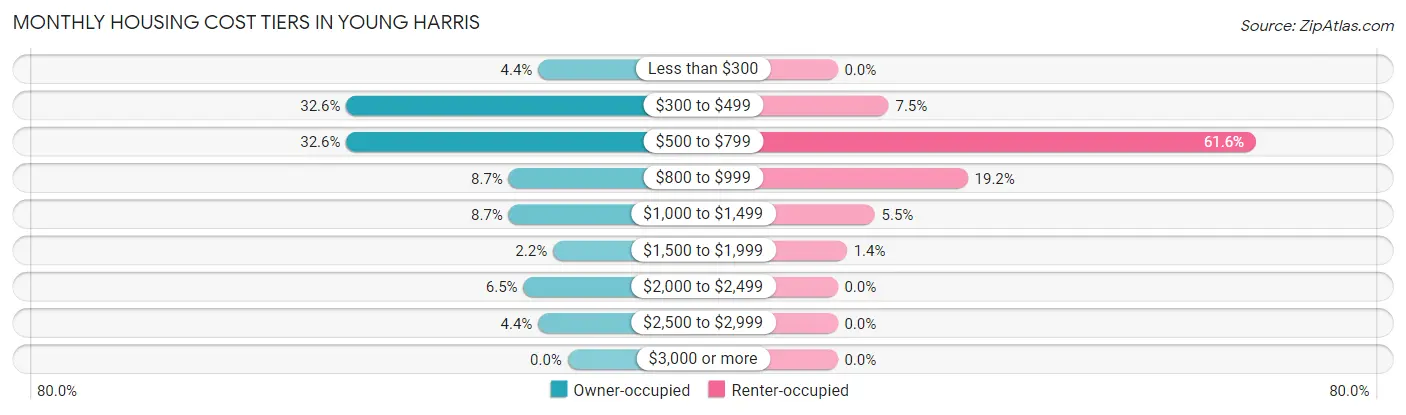
| Monthly Cost | Owner-occupied | Renter-occupied |
| Less than $300 | 2 (4.3%) | 0 (0.0%) |
| $300 to $499 | 15 (32.6%) | 11 (7.5%) |
| $500 to $799 | 15 (32.6%) | 90 (61.6%) |
| $800 to $999 | 4 (8.7%) | 28 (19.2%) |
| $1,000 to $1,499 | 4 (8.7%) | 8 (5.5%) |
| $1,500 to $1,999 | 1 (2.2%) | 2 (1.4%) |
| $2,000 to $2,499 | 3 (6.5%) | 0 (0.0%) |
| $2,500 to $2,999 | 2 (4.3%) | 0 (0.0%) |
| $3,000 or more | 0 (0.0%) | 0 (0.0%) |
| Total | 46 (100.0%) | 146 (100.0%) |
Physical Housing Characteristics in Young Harris
Housing Structures in Young Harris
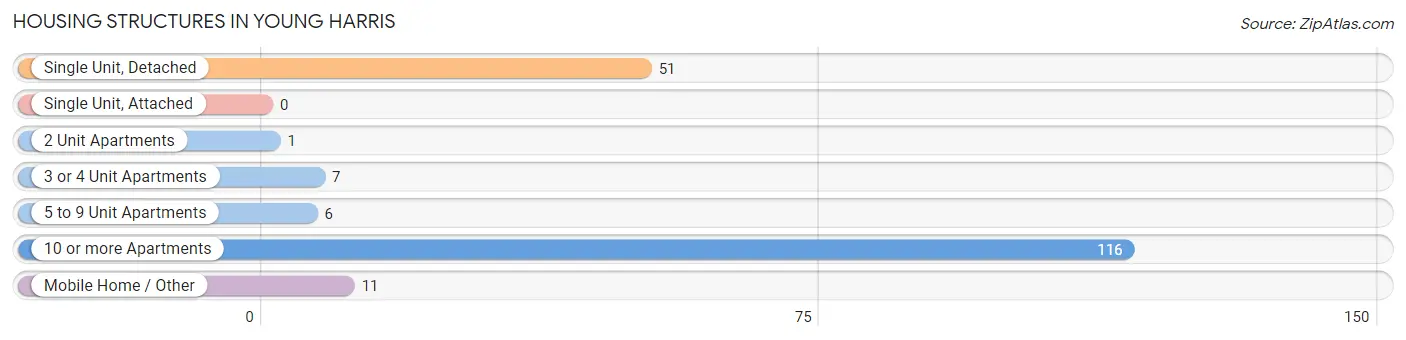
| Structure Type | # Housing Units | % Housing Units |
| Single Unit, Detached | 51 | 26.6% |
| Single Unit, Attached | 0 | 0.0% |
| 2 Unit Apartments | 1 | 0.5% |
| 3 or 4 Unit Apartments | 7 | 3.6% |
| 5 to 9 Unit Apartments | 6 | 3.1% |
| 10 or more Apartments | 116 | 60.4% |
| Mobile Home / Other | 11 | 5.7% |
| Total | 192 | 100.0% |
Housing Structures by Occupancy in Young Harris
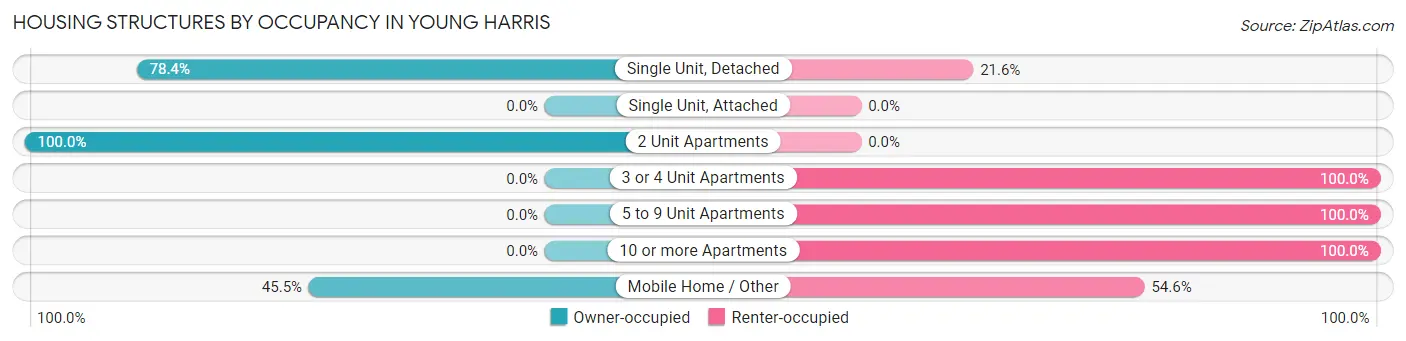
| Structure Type | Owner-occupied | Renter-occupied |
| Single Unit, Detached | 40 (78.4%) | 11 (21.6%) |
| Single Unit, Attached | 0 (0.0%) | 0 (0.0%) |
| 2 Unit Apartments | 1 (100.0%) | 0 (0.0%) |
| 3 or 4 Unit Apartments | 0 (0.0%) | 7 (100.0%) |
| 5 to 9 Unit Apartments | 0 (0.0%) | 6 (100.0%) |
| 10 or more Apartments | 0 (0.0%) | 116 (100.0%) |
| Mobile Home / Other | 5 (45.5%) | 6 (54.5%) |
| Total | 46 (24.0%) | 146 (76.0%) |
Housing Structures by Number of Rooms in Young Harris
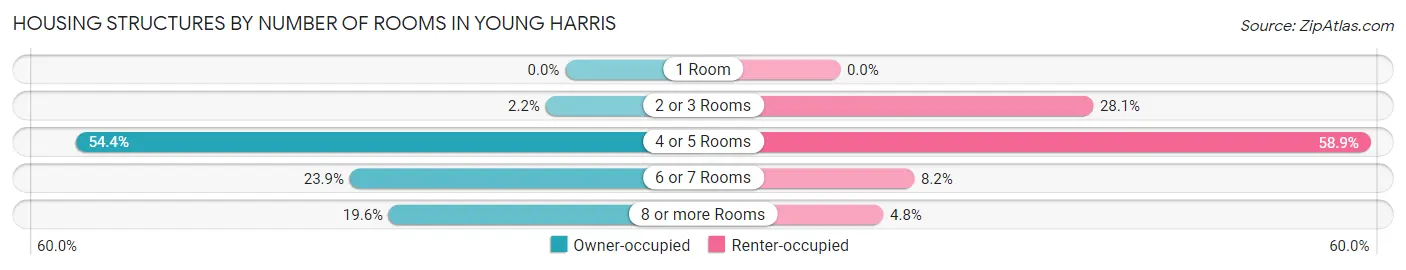
| Number of Rooms | Owner-occupied | Renter-occupied |
| 1 Room | 0 (0.0%) | 0 (0.0%) |
| 2 or 3 Rooms | 1 (2.2%) | 41 (28.1%) |
| 4 or 5 Rooms | 25 (54.3%) | 86 (58.9%) |
| 6 or 7 Rooms | 11 (23.9%) | 12 (8.2%) |
| 8 or more Rooms | 9 (19.6%) | 7 (4.8%) |
| Total | 46 (100.0%) | 146 (100.0%) |
Housing Structure by Heating Type in Young Harris
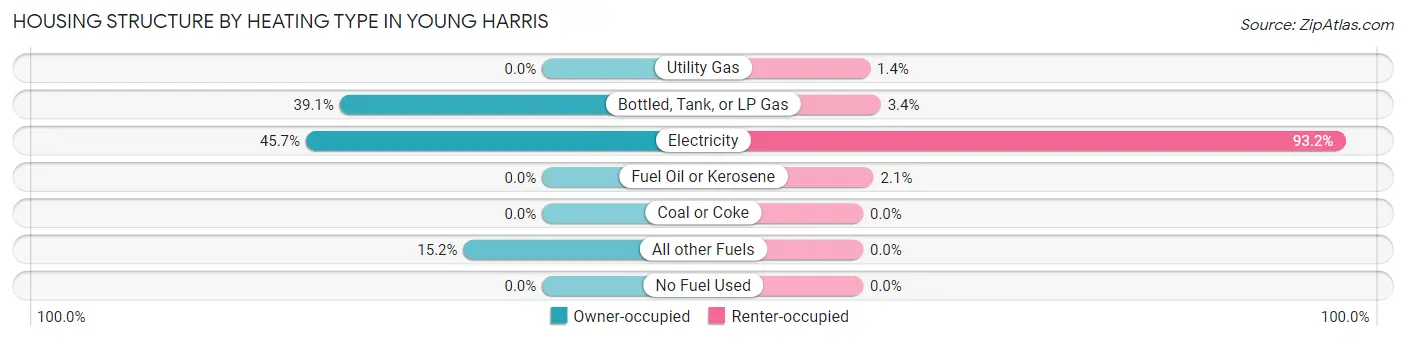
| Heating Type | Owner-occupied | Renter-occupied |
| Utility Gas | 0 (0.0%) | 2 (1.4%) |
| Bottled, Tank, or LP Gas | 18 (39.1%) | 5 (3.4%) |
| Electricity | 21 (45.7%) | 136 (93.1%) |
| Fuel Oil or Kerosene | 0 (0.0%) | 3 (2.1%) |
| Coal or Coke | 0 (0.0%) | 0 (0.0%) |
| All other Fuels | 7 (15.2%) | 0 (0.0%) |
| No Fuel Used | 0 (0.0%) | 0 (0.0%) |
| Total | 46 (100.0%) | 146 (100.0%) |
Household Vehicle Usage in Young Harris
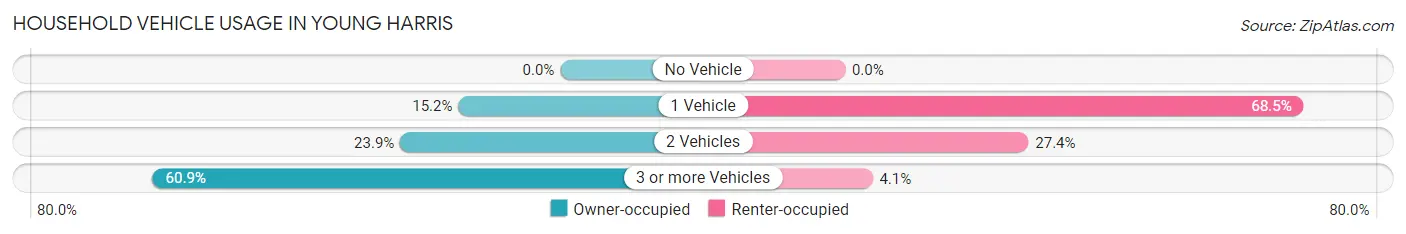
| Vehicles per Household | Owner-occupied | Renter-occupied |
| No Vehicle | 0 (0.0%) | 0 (0.0%) |
| 1 Vehicle | 7 (15.2%) | 100 (68.5%) |
| 2 Vehicles | 11 (23.9%) | 40 (27.4%) |
| 3 or more Vehicles | 28 (60.9%) | 6 (4.1%) |
| Total | 46 (100.0%) | 146 (100.0%) |
Real Estate & Mortgages in Young Harris
Real Estate and Mortgage Overview in Young Harris
| Characteristic | Without Mortgage | With Mortgage |
| Housing Units | 36 | 10 |
| Median Property Value | $266,700 | $195,800 |
| Median Household Income | $75,833 | $0 |
| Monthly Housing Costs | $608 | $0 |
| Real Estate Taxes | - | - |
Property Value by Mortgage Status in Young Harris
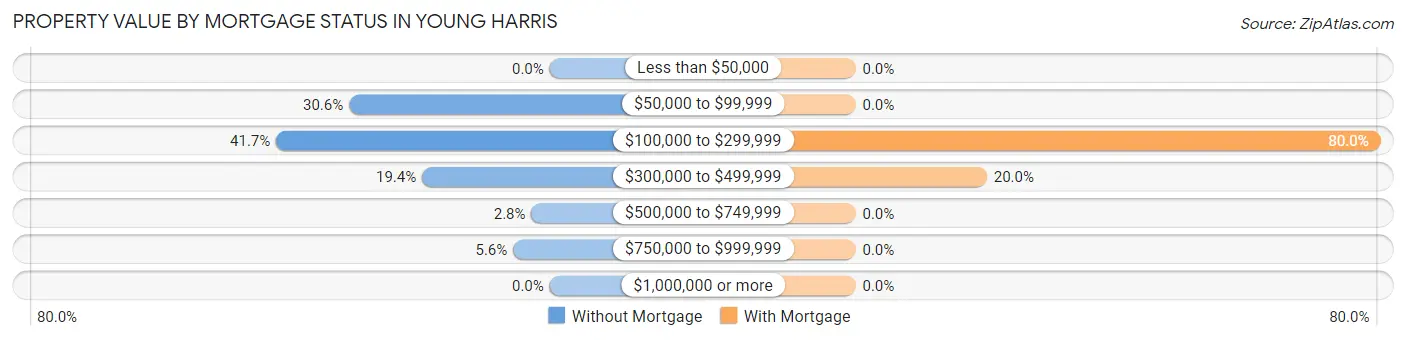
| Property Value | Without Mortgage | With Mortgage |
| Less than $50,000 | 0 (0.0%) | 0 (0.0%) |
| $50,000 to $99,999 | 11 (30.6%) | 0 (0.0%) |
| $100,000 to $299,999 | 15 (41.7%) | 8 (80.0%) |
| $300,000 to $499,999 | 7 (19.4%) | 2 (20.0%) |
| $500,000 to $749,999 | 1 (2.8%) | 0 (0.0%) |
| $750,000 to $999,999 | 2 (5.6%) | 0 (0.0%) |
| $1,000,000 or more | 0 (0.0%) | 0 (0.0%) |
| Total | 36 (100.0%) | 10 (100.0%) |
Household Income by Mortgage Status in Young Harris
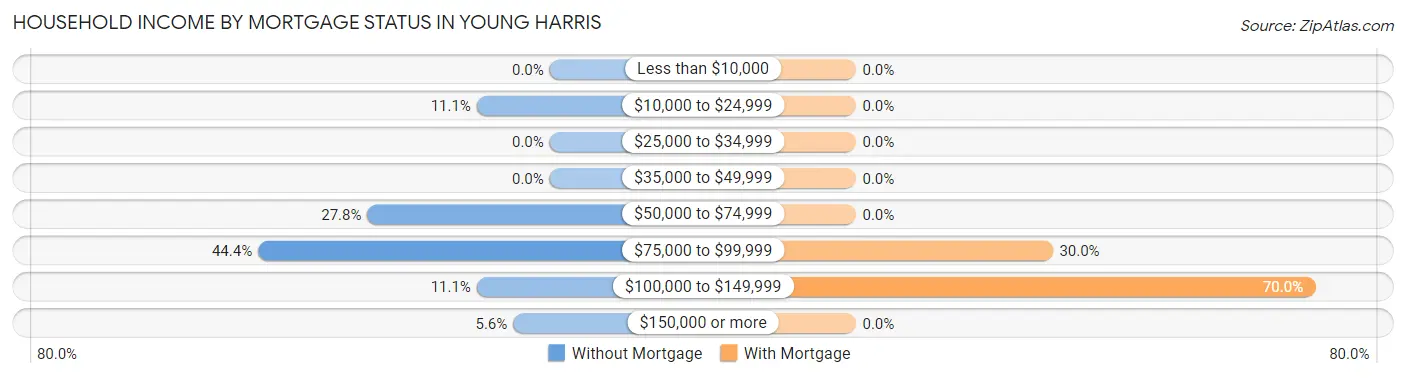
| Household Income | Without Mortgage | With Mortgage |
| Less than $10,000 | 0 (0.0%) | 0 (0.0%) |
| $10,000 to $24,999 | 4 (11.1%) | 0 (0.0%) |
| $25,000 to $34,999 | 0 (0.0%) | 0 (0.0%) |
| $35,000 to $49,999 | 0 (0.0%) | 0 (0.0%) |
| $50,000 to $74,999 | 10 (27.8%) | 0 (0.0%) |
| $75,000 to $99,999 | 16 (44.4%) | 3 (30.0%) |
| $100,000 to $149,999 | 4 (11.1%) | 7 (70.0%) |
| $150,000 or more | 2 (5.6%) | 0 (0.0%) |
| Total | 36 (100.0%) | 10 (100.0%) |
Property Value to Household Income Ratio in Young Harris
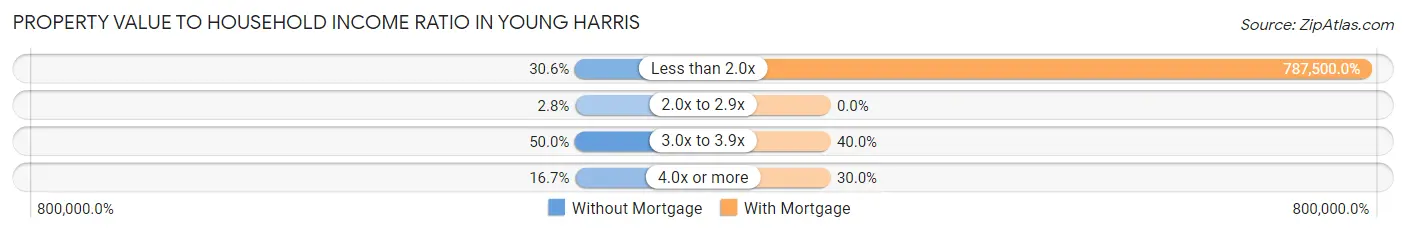
| Value-to-Income Ratio | Without Mortgage | With Mortgage |
| Less than 2.0x | 11 (30.6%) | 78,750 (787,500.0%) |
| 2.0x to 2.9x | 1 (2.8%) | 0 (0.0%) |
| 3.0x to 3.9x | 18 (50.0%) | 4 (40.0%) |
| 4.0x or more | 6 (16.7%) | 3 (30.0%) |
| Total | 36 (100.0%) | 10 (100.0%) |
Real Estate Taxes by Mortgage Status in Young Harris
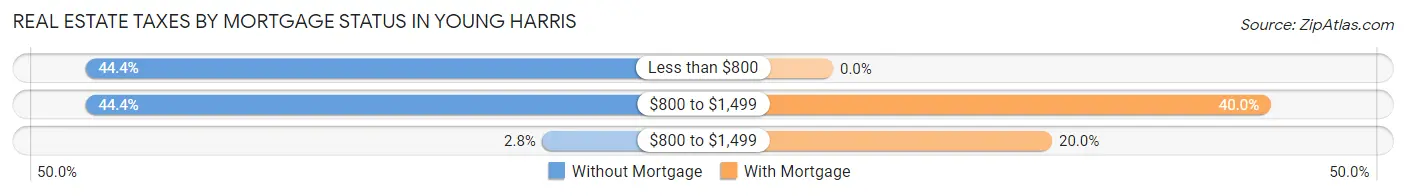
| Property Taxes | Without Mortgage | With Mortgage |
| Less than $800 | 16 (44.4%) | 0 (0.0%) |
| $800 to $1,499 | 16 (44.4%) | 4 (40.0%) |
| $800 to $1,499 | 1 (2.8%) | 2 (20.0%) |
| Total | 36 (100.0%) | 10 (100.0%) |
Health & Disability in Young Harris
Health Insurance Coverage by Age in Young Harris
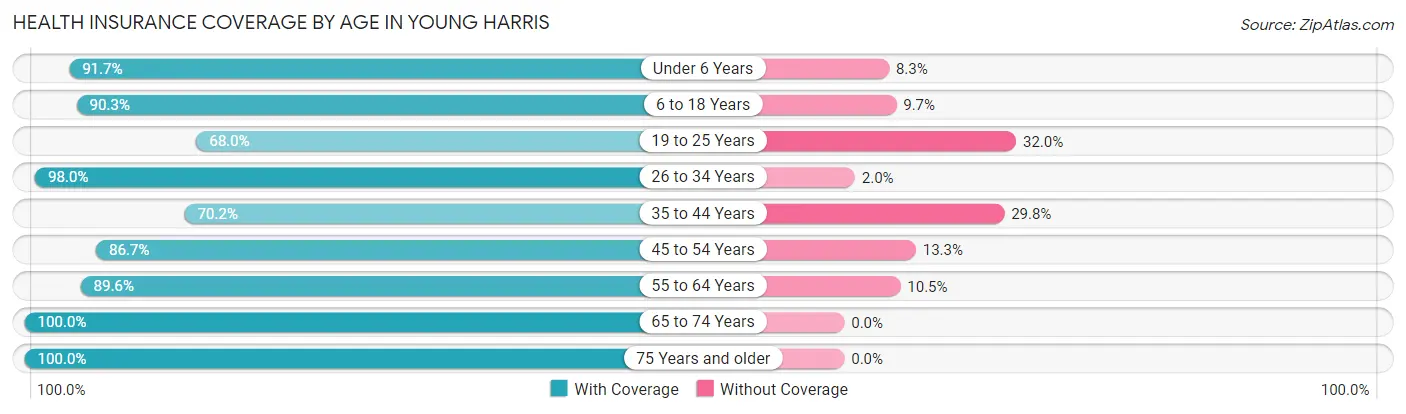
| Age Bracket | With Coverage | Without Coverage |
| Under 6 Years | 22 (91.7%) | 2 (8.3%) |
| 6 to 18 Years | 233 (90.3%) | 25 (9.7%) |
| 19 to 25 Years | 348 (68.0%) | 164 (32.0%) |
| 26 to 34 Years | 50 (98.0%) | 1 (2.0%) |
| 35 to 44 Years | 40 (70.2%) | 17 (29.8%) |
| 45 to 54 Years | 13 (86.7%) | 2 (13.3%) |
| 55 to 64 Years | 60 (89.5%) | 7 (10.4%) |
| 65 to 74 Years | 57 (100.0%) | 0 (0.0%) |
| 75 Years and older | 25 (100.0%) | 0 (0.0%) |
| Total | 848 (79.5%) | 218 (20.4%) |
Health Insurance Coverage by Citizenship Status in Young Harris
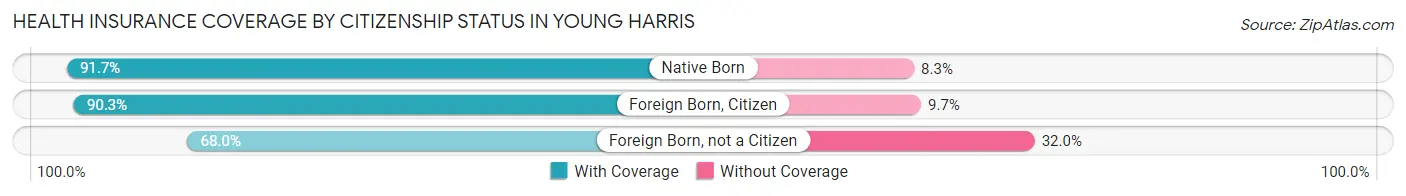
| Citizenship Status | With Coverage | Without Coverage |
| Native Born | 22 (91.7%) | 2 (8.3%) |
| Foreign Born, Citizen | 233 (90.3%) | 25 (9.7%) |
| Foreign Born, not a Citizen | 348 (68.0%) | 164 (32.0%) |
Health Insurance Coverage by Household Income in Young Harris
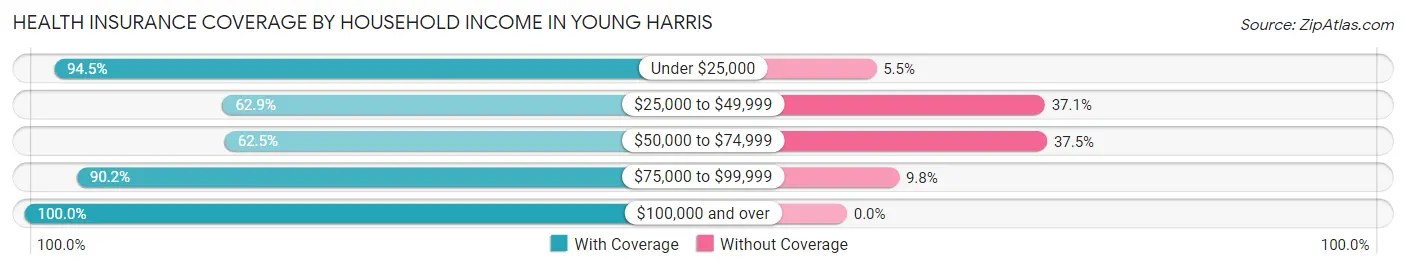
| Household Income | With Coverage | Without Coverage |
| Under $25,000 | 120 (94.5%) | 7 (5.5%) |
| $25,000 to $49,999 | 56 (62.9%) | 33 (37.1%) |
| $50,000 to $74,999 | 25 (62.5%) | 15 (37.5%) |
| $75,000 to $99,999 | 83 (90.2%) | 9 (9.8%) |
| $100,000 and over | 51 (100.0%) | 0 (0.0%) |
Public vs Private Health Insurance Coverage by Age in Young Harris
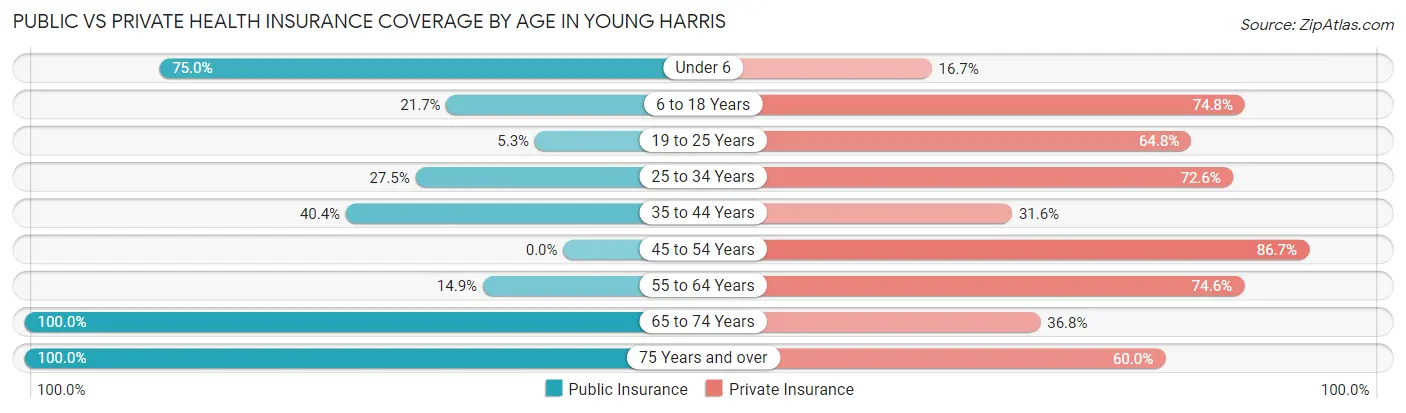
| Age Bracket | Public Insurance | Private Insurance |
| Under 6 | 18 (75.0%) | 4 (16.7%) |
| 6 to 18 Years | 56 (21.7%) | 193 (74.8%) |
| 19 to 25 Years | 27 (5.3%) | 332 (64.8%) |
| 25 to 34 Years | 14 (27.5%) | 37 (72.6%) |
| 35 to 44 Years | 23 (40.4%) | 18 (31.6%) |
| 45 to 54 Years | 0 (0.0%) | 13 (86.7%) |
| 55 to 64 Years | 10 (14.9%) | 50 (74.6%) |
| 65 to 74 Years | 57 (100.0%) | 21 (36.8%) |
| 75 Years and over | 25 (100.0%) | 15 (60.0%) |
| Total | 230 (21.6%) | 683 (64.1%) |
Disability Status by Sex by Age in Young Harris
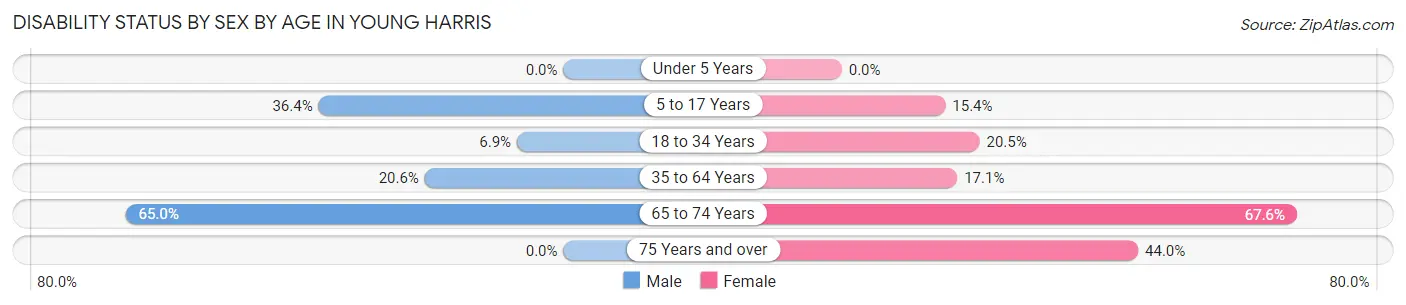
| Age Bracket | Male | Female |
| Under 5 Years | 0 (0.0%) | 0 (0.0%) |
| 5 to 17 Years | 12 (36.4%) | 2 (15.4%) |
| 18 to 34 Years | 29 (6.9%) | 73 (20.4%) |
| 35 to 64 Years | 7 (20.6%) | 18 (17.1%) |
| 65 to 74 Years | 13 (65.0%) | 25 (67.6%) |
| 75 Years and over | 0 (0.0%) | 11 (44.0%) |
Disability Class by Sex by Age in Young Harris
Disability Class: Hearing Difficulty
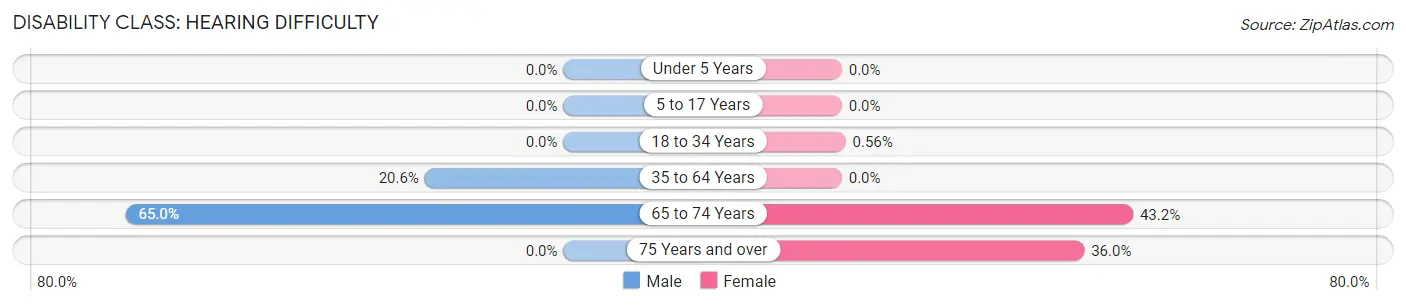
| Age Bracket | Male | Female |
| Under 5 Years | 0 (0.0%) | 0 (0.0%) |
| 5 to 17 Years | 0 (0.0%) | 0 (0.0%) |
| 18 to 34 Years | 0 (0.0%) | 2 (0.6%) |
| 35 to 64 Years | 7 (20.6%) | 0 (0.0%) |
| 65 to 74 Years | 13 (65.0%) | 16 (43.2%) |
| 75 Years and over | 0 (0.0%) | 9 (36.0%) |
Disability Class: Vision Difficulty
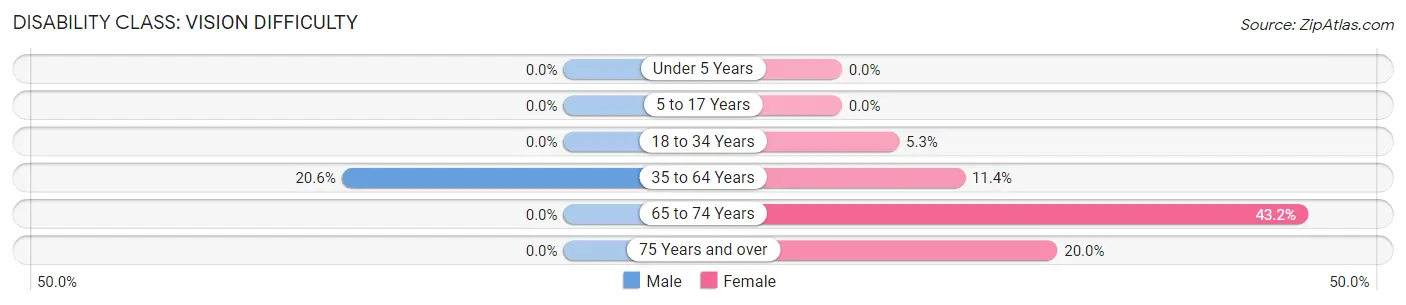
| Age Bracket | Male | Female |
| Under 5 Years | 0 (0.0%) | 0 (0.0%) |
| 5 to 17 Years | 0 (0.0%) | 0 (0.0%) |
| 18 to 34 Years | 0 (0.0%) | 19 (5.3%) |
| 35 to 64 Years | 7 (20.6%) | 12 (11.4%) |
| 65 to 74 Years | 0 (0.0%) | 16 (43.2%) |
| 75 Years and over | 0 (0.0%) | 5 (20.0%) |
Disability Class: Cognitive Difficulty
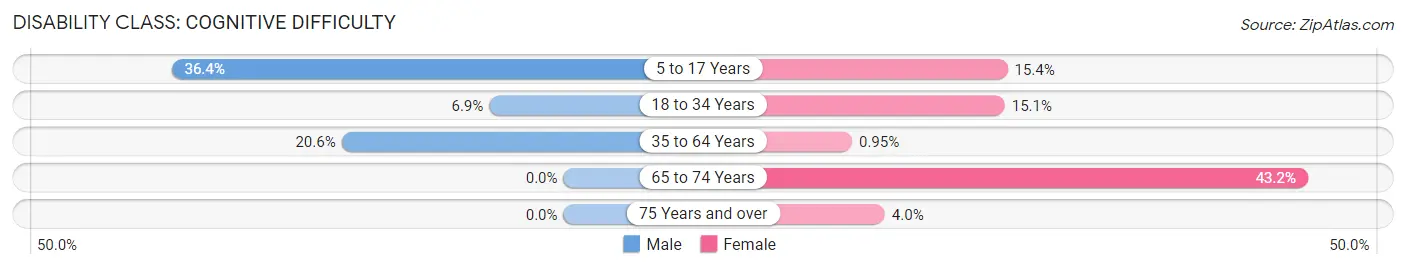
| Age Bracket | Male | Female |
| 5 to 17 Years | 12 (36.4%) | 2 (15.4%) |
| 18 to 34 Years | 29 (6.9%) | 54 (15.1%) |
| 35 to 64 Years | 7 (20.6%) | 1 (0.9%) |
| 65 to 74 Years | 0 (0.0%) | 16 (43.2%) |
| 75 Years and over | 0 (0.0%) | 1 (4.0%) |
Disability Class: Ambulatory Difficulty
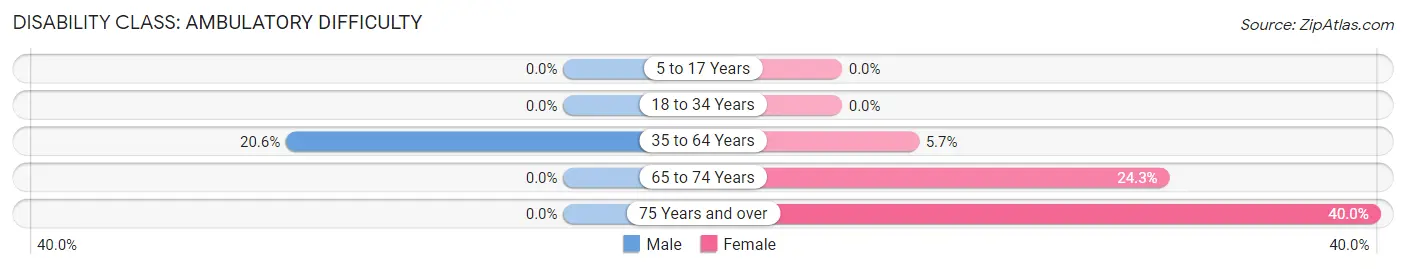
| Age Bracket | Male | Female |
| 5 to 17 Years | 0 (0.0%) | 0 (0.0%) |
| 18 to 34 Years | 0 (0.0%) | 0 (0.0%) |
| 35 to 64 Years | 7 (20.6%) | 6 (5.7%) |
| 65 to 74 Years | 0 (0.0%) | 9 (24.3%) |
| 75 Years and over | 0 (0.0%) | 10 (40.0%) |
Disability Class: Self-Care Difficulty
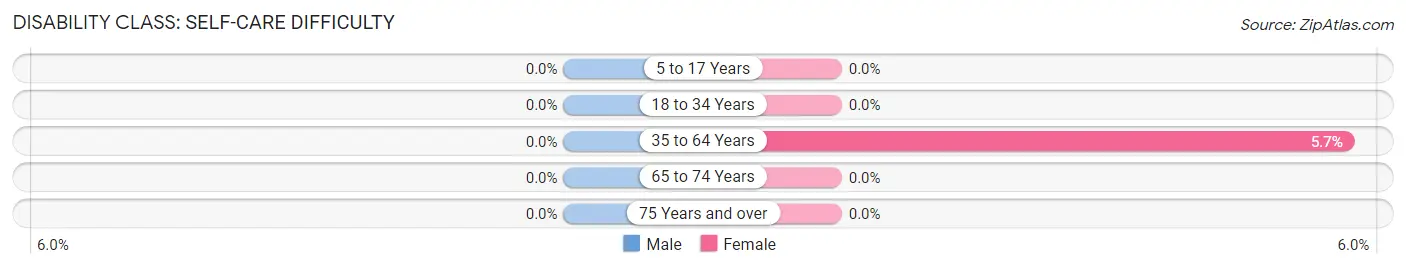
| Age Bracket | Male | Female |
| 5 to 17 Years | 0 (0.0%) | 0 (0.0%) |
| 18 to 34 Years | 0 (0.0%) | 0 (0.0%) |
| 35 to 64 Years | 0 (0.0%) | 6 (5.7%) |
| 65 to 74 Years | 0 (0.0%) | 0 (0.0%) |
| 75 Years and over | 0 (0.0%) | 0 (0.0%) |
Technology Access in Young Harris
Computing Device Access in Young Harris
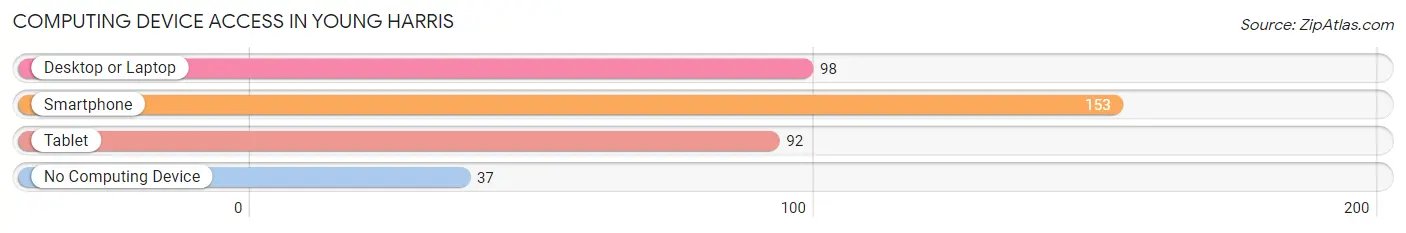
| Device Type | # Households | % Households |
| Desktop or Laptop | 98 | 51.0% |
| Smartphone | 153 | 79.7% |
| Tablet | 92 | 47.9% |
| No Computing Device | 37 | 19.3% |
| Total | 192 | 100.0% |
Internet Access in Young Harris
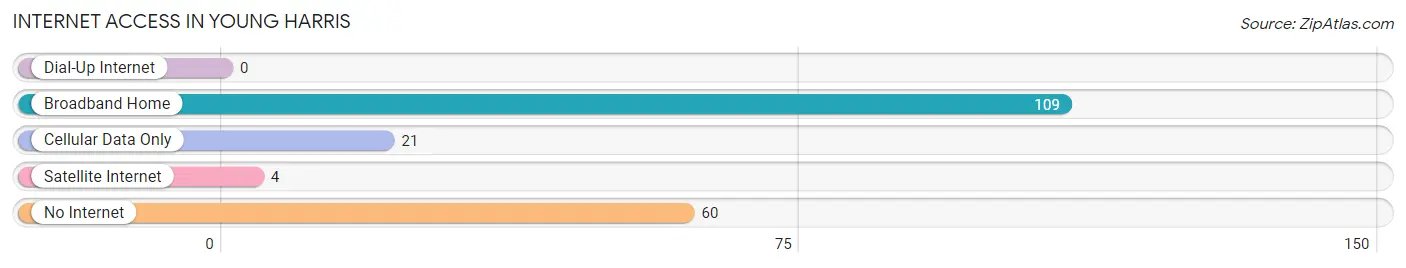
| Internet Type | # Households | % Households |
| Dial-Up Internet | 0 | 0.0% |
| Broadband Home | 109 | 56.8% |
| Cellular Data Only | 21 | 10.9% |
| Satellite Internet | 4 | 2.1% |
| No Internet | 60 | 31.2% |
| Total | 192 | 100.0% |
Young Harris Summary
History
The area now known as Young Harris, Georgia was first settled in the early 1800s by the Cherokee Indians. The town was named after Colonel William Harris, who was a prominent figure in the area during the early 19th century. He was a leader in the Cherokee Nation and was instrumental in the development of the area.
The town of Young Harris was officially incorporated in 1875. During this time, the town was a small farming community with a population of only a few hundred people. The town was primarily supported by the local farming industry, which included cotton, corn, and tobacco.
In the early 1900s, the town began to grow and develop. The town was connected to the rest of the state by the railroad, which allowed for the transportation of goods and people. This allowed for the growth of the local economy and the population of the town began to increase.
In the 1920s, the town began to experience a period of growth and prosperity. The town was home to several businesses, including a bank, a hotel, and a movie theater. The town also had a thriving educational system, with several schools and a college.
In the 1950s, the town began to experience a decline in population and economic activity. This was due to the decline of the local farming industry and the rise of the automobile industry. The town was no longer able to support itself and many of the businesses and schools closed.
In the late 1970s, the town began to experience a resurgence in population and economic activity. This was due to the development of the nearby Lake Chatuge, which provided recreational opportunities for the town. The town also began to attract tourists, which helped to boost the local economy.
Today, Young Harris is a small town with a population of just over 1,000 people. The town is still supported by the local farming industry, but it has also become a popular tourist destination. The town is home to several restaurants, shops, and other businesses.
Geography
Young Harris is located in the northeast corner of Georgia, in the Appalachian Mountains. The town is situated in Towns County, which is bordered by the states of North Carolina and Tennessee. The town is located at an elevation of 1,890 feet above sea level.
The town is located in a mountainous region, with the nearby Blue Ridge Mountains providing a picturesque backdrop. The town is also located near several lakes, including Lake Chatuge and Lake Nottely. The town is also located near the Chattahoochee National Forest, which provides a variety of outdoor recreational opportunities.
Economy
The economy of Young Harris is primarily supported by the local farming industry. The town is home to several farms, which produce a variety of crops, including corn, cotton, and tobacco. The town is also home to several businesses, including restaurants, shops, and other services.
The town is also home to several tourist attractions, including the nearby Lake Chatuge and the Chattahoochee National Forest. These attractions bring in a large number of tourists each year, which helps to boost the local economy.
Demographics
As of the 2010 census, the population of Young Harris was 1,068. The town has a population density of 39.3 people per square mile. The median age of the population is 44.7 years, with a gender ratio of 49.7% male and 50.3% female.
The racial makeup of the town is 97.2% White, 0.9% African American, 0.3% Native American, 0.3% Asian, 0.1% Pacific Islander, 0.3% from other races, and 0.9% from two or more races. The median household income is $31,250, and the median family income is $37,500.
Conclusion
Young Harris, Georgia is a small town located in the Appalachian Mountains. The town has a population of just over 1,000 people and is supported by the local farming industry. The town is also home to several tourist attractions, which help to boost the local economy. The town has a diverse population, with a median age of 44.7 years and a median household income of $31,250.
Common Questions
What is Per Capita Income in Young Harris?
Per Capita income in Young Harris is $13,666.
What is the Median Family Income in Young Harris?
Median Family Income in Young Harris is $59,286.
What is the Median Household income in Young Harris?
Median Household Income in Young Harris is $27,500.
What is Income or Wage Gap in Young Harris?
Income or Wage Gap in Young Harris is 33.8%.
Women in Young Harris earn 66.2 cents for every dollar earned by a man.
What is Inequality or Gini Index in Young Harris?
Inequality or Gini Index in Young Harris is 0.58.
What is the Total Population of Young Harris?
Total Population of Young Harris is 1,066.
What is the Total Male Population of Young Harris?
Total Male Population of Young Harris is 523.
What is the Total Female Population of Young Harris?
Total Female Population of Young Harris is 543.
What is the Ratio of Males per 100 Females in Young Harris?
There are 96.32 Males per 100 Females in Young Harris.
What is the Ratio of Females per 100 Males in Young Harris?
There are 103.82 Females per 100 Males in Young Harris.
What is the Median Population Age in Young Harris?
Median Population Age in Young Harris is 20.4 Years.
What is the Average Family Size in Young Harris
Average Family Size in Young Harris is 2.8 People.
What is the Average Household Size in Young Harris
Average Household Size in Young Harris is 2.1 People.
How Large is the Labor Force in Young Harris?
There are 576 People in the Labor Forcein in Young Harris.
What is the Percentage of People in the Labor Force in Young Harris?
57.1% of People are in the Labor Force in Young Harris.
What is the Unemployment Rate in Young Harris?
Unemployment Rate in Young Harris is 8.2%.